Embed Size (px)
Citation preview

You wrote linear equations given a point and the slope. (Lesson 4–3)
• Investigate relationships between quantities by using points on scatter plots.
• Use lines of fit to make and evaluate predictions.

• bivariate data
• scatter plot
• line of fit
• linear interpolation

Evaluate a Correlation
TECHNOLOGY The graph shows the average number of students per computer in Maria’s school. Determine whether the graph shows a positive correlation, a negative correlation, or no correlation. If there is a positive or negative correlation, describe its meaning in the situation.

A. A
B. B
C. C
D. D A B C D
0% 0%0%0%
The graph shows the number of mail-order prescriptions. Determine whether the graph shows a positive correlation, a negative correlation, or no correlation. If there is a positive or negative correlation, describe it.
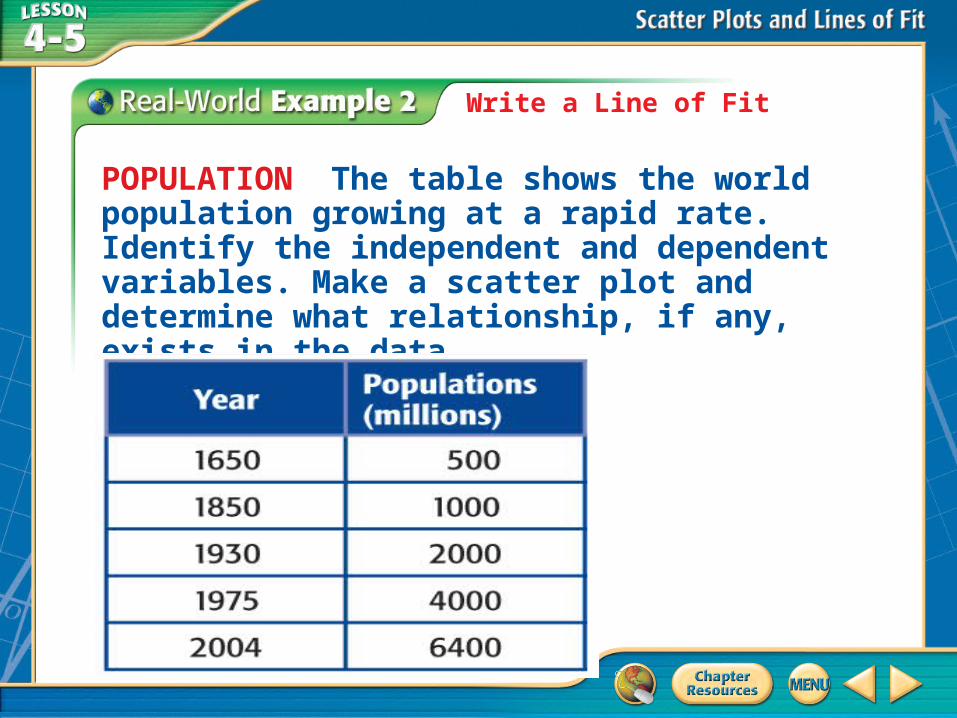
Write a Line of Fit
POPULATION The table shows the world population growing at a rapid rate. Identify the independent and dependent variables. Make a scatter plot and determine what relationship, if any, exists in the data.
Write a Line of Fit
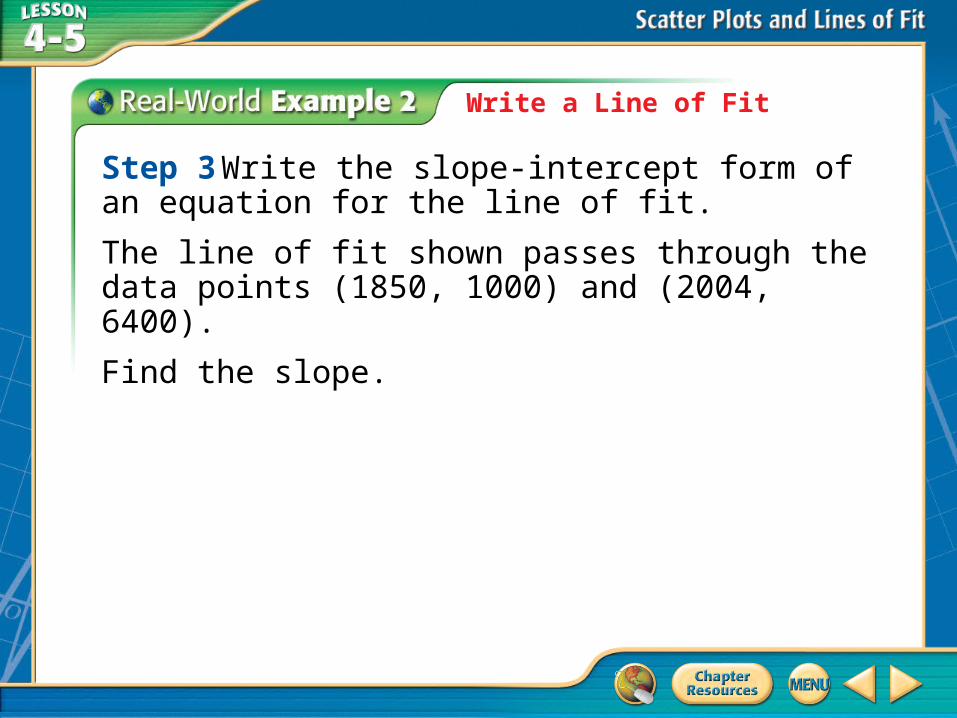
Step 3 Write the slope-intercept form of an equation for the line of fit.
The line of fit shown passes through the data points (1850, 1000) and (2004, 6400).
Find the slope.

A. A
B. B
C. C
D. D A B C D
0% 0%0%0%
The table shows the number of bachelor’s degrees received since 1988. Draw a scatter plot and determine what relationship exists, if any, in the data.

A. A
B. B
C. C
D. D A B C D
0% 0%0%0%
Write the slope-intercept form of an equation for the line of fit.

Use Interpolation or Extrapolation
The table and graph show the world population growing at a rapid rate. Use the equation y = 35.1x – 63,935 to predict the world’s population in 2025.

Use Interpolation or Extrapolation
Evaluate the function for x = 2025.

The table and graph show the number of bachelor’s degrees received since 1988.
A. A
B. B
C. C
D. D A B C D
0% 0%0%0%
Use the equation y = 8x + 1104, where x is the years since 1998 and y is the number of bachelor’s degrees (in thousands), to predict the number of bachelor’s degrees that will be received in 2015.