Embed Size (px)
Citation preview

SCATTER PLOTS
8.SP.1
Essential Question?How can you construct and interpret scatter plots?
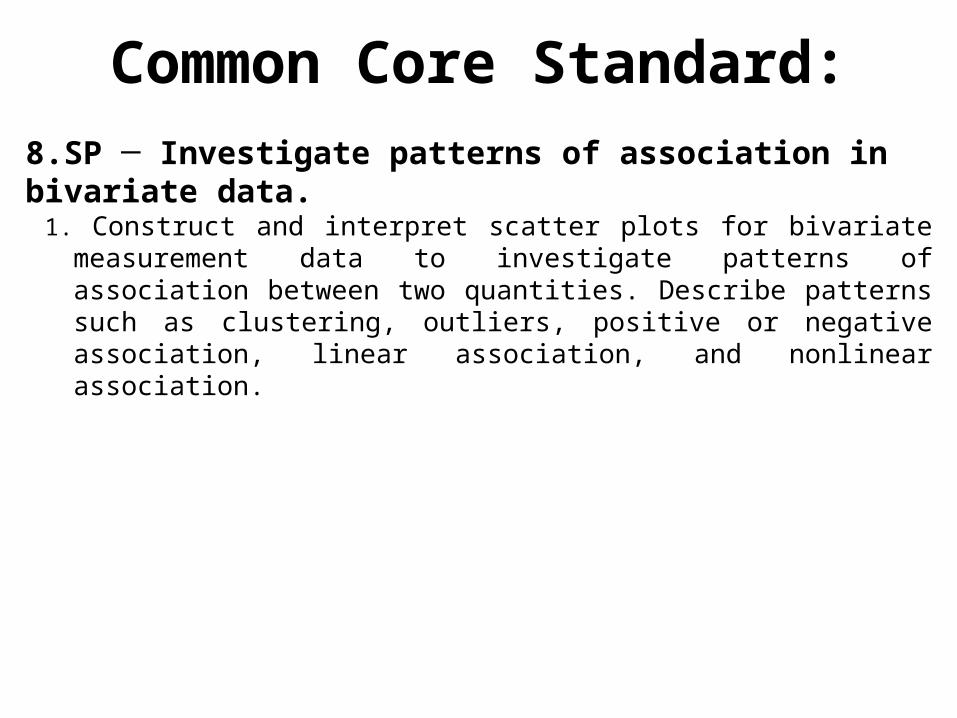
Common Core Standard:8.SP ─ Investigate patterns of association in bivariate data.
1. Construct and interpret scatter plots for bivariate measurement data to investigate patterns of association between two quantities. Describe patterns such as clustering, outliers, positive or negative association, linear association, and nonlinear association.

Objectives:
• To construct and interpret scatter plots.

Curriculum Vocabulary
Bivariate Data (datos bivariados):A set of data that is made of two paired variables.
Data (datos):A set of values of qualitative or quantitative variables.
Linear Equation (ecuacíon lineal):An equation whose solutions form a straight line on a coordinate plane.
Slope (pendiente):The measure of the steepness of a line on a graph; the rise divided by the run.

Curriculum Vocabulary
y-coordinate (coordenada y):The second number in an ordered pair; it tells the distance to move up or down from the origin (0, 0).
Cluster (agrupación):A set of closely grouped data
x-coordinate (coordenada x):The first number in an ordered pair; it tells the distance to move right or left from the origin (0, 0).
Slope-intercept Form of an Equation(forma pendiente-intersección):A linear equation written in the form where m represents slope and b represents the y-intercept.

Curriculum Vocabulary
Trend Line (linea de tendencia):A line on a scatter plot that helps show the correlation between data sets more clearly.
Scatter Plot (diagrama de dispersión):A graph with points plotted to show a possible relationship between two sets of data.
Outlier (valor extremo):A value much greater or much less than the others in a data set.

SCATTER PLOTS & ASSOCIATION
A set of BIVARIATE DATA involves two variables.
Since these are represented as ORDERED PAIRS,you can graph bivariate data on a SCATTER PLOT.
A SCATTER PLOT is a graph with points plotted to show the relationship between two sets of data.

Constructing a scatter plot is simple.
Step 1: LABEL the axes !!! This will determine your x & y coordinates.
Step 2: Turn the data into ordered pairs and plot each ordered pair on the graph.
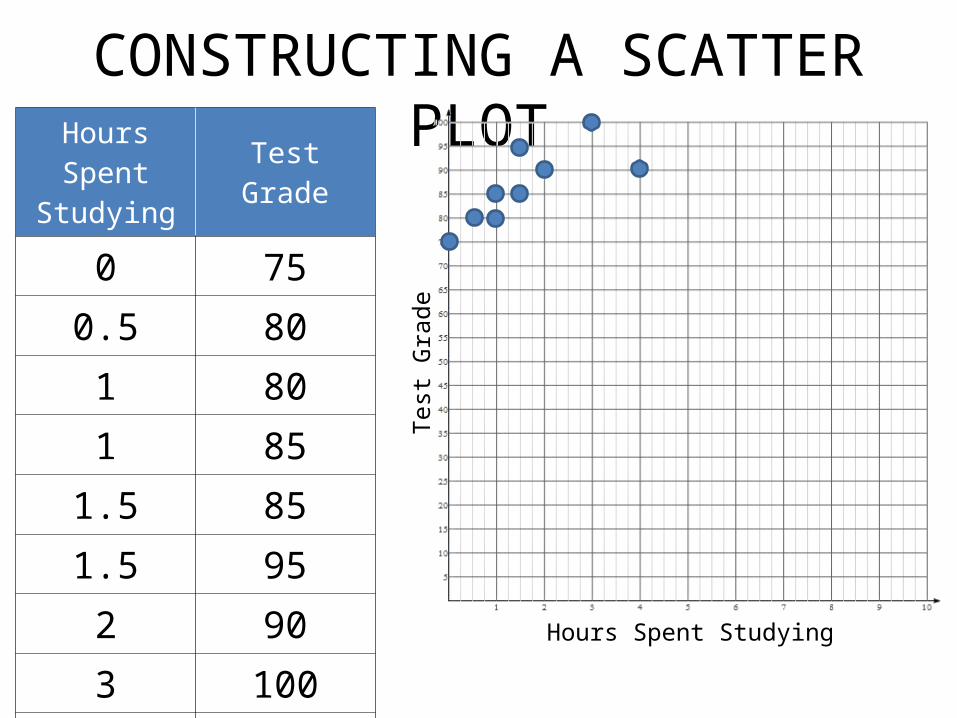
Create a scatter plot for the data collected by Mr. Amplo from some of the students in last year’s 3rd period class.
Hours Spent
StudyingTest Grade
0 75
0.5 80
1 80
1 85
1.5 85
1.5 95
2 90
3 100
4 90
CONSTRUCTING A SCATTER PLOT
Hours Spent
StudyingTest Grade
0 750.5 801 801 851.5 851.5 952 903 1004 90
CONSTRUCTING A SCATTER PLOT
Hours Spent Studying
Test
Gra
de

INTERPRETING CLUSTERS & OUTLIERS
A CLUSTER is a set of closely grouped
data.
Data may cluster around a POINT or along a LINE.

INTERPRETING CLUSTERS & OUTLIERSAn OUTLIER is a data
point that is very different from the rest of the data in the set.

INTERPRETING CLUSTERS & OUTLIERSA scientist gathers information about the eruptions of Old Faithful, a geyser in Yellowstone National Park. She uses the data to create a scatter plot. The data show the length of time between eruptions (interval) and how long the eruption lasts (duration).
Describe any clusters you see.
What do the clusters tell you about eruptions of Old Faithful?
Describe any outliers you see.
Suppose the geyser erupts for 2.2 minutes after a 75-minute interval. Would this point lie in one of the clusters? Would it be an outlier? Explain your answer.
Suppose the geyser erupts after an 80-minute interval. Give a range of possible duration times for which the point on the scatter plot would not be considered an outlier. Explain your reasoning.

DETERMINING ASSOCIATION (CORRELATION)
ASSOCIATION (CORRELATION)
describes how sets of data are related.
When both sets of data INCREASE together, it meansPOSITIVE ASSOCIATION (CORRELATION)
When one set of data INCREASES while the other DECREASES ,it means
NEGATIVE ASSOCIATION (CORRELATION)
When there is NO RELATIONSHIP between the two data sets, it means NO ASSOCIATION (CORRELATION)
POSITIVE ASSOCIATION
NEGATIVEASSOCIATION
NOASSOCIATION

INTERPRETING ASSOCIATION (CORRELATION)Susan asked 20 people if they would buy a new product she developed at each of several prices. The scatter plot shows how many of the 20 said “yes” at a given price. Describe the association between price and the number of buyers.
What kind of association is shown?
What does this mean?
Based on the association shown in the scatter plot, what might happen if Susan increased the price to $14?
INTERPRETING ASSOCIATION (CORRELATION)
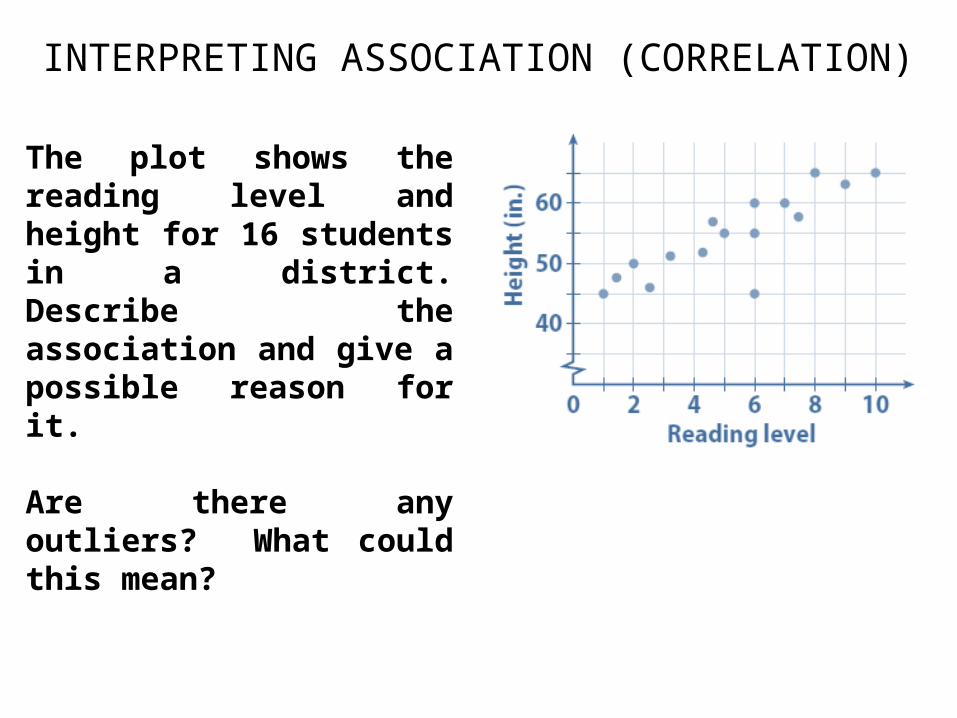
The plot shows the reading level and height for 16 students in a district. Describe the association and give a possible reason for it.
Are there any outliers? What could this mean?