Embed Size (px)
Citation preview
'AFAPL-TR-71-35
THE VISCOSITY OF' SYNTHETIC TURBINE ENGINE LUBRICANTS
OFROM 1000 TO 7009F
Ronald D. ButlerMidwest Research Institute
TECHNICAL REPORT AFAPL-TR-71-35
June 1971
Approved for public release; distribution unlimited
Air Force Aero Propulsion LaboratoryAir Force Systems Command
Wright-Patterson Air Force Base, OhioReptoduced by
NATIONAL TECHNICALD D CINFORMATION SERVICEDCSptlngfild. Va. 22151Fn F IF _), i i ~~
UL 27 191 fl
NOTICE
When Government drawings, specifications, or other data are used for any purposeother than in connection with a definitely related Government procurement operation,the United States Government thereby incurs no responsibility nor any obligationwhatsoever; anti the fact that the government may have formulated, furnished, or inany way supplied the said drawings, specifications, or other data, is not to be regardedby implication or otherwise as in any manner licensing the holder or any other personor corporation, or conveying any rights or permission to manufacture, use, or sell anypatented invention that may in any way be related thereto.
" "W
'UM. AVAL &War
Copies of this report should not be returned unless return is required by securityconsiderations, contractual obligations, or notice on a specific document.
UNCLASS IFIED
weiiltVDOCUMENT CONTROL DATA.- R & D
4Cveslpty elms 1ljcatiot of 11910. body at abstract an.d udduing auinotatinn mist be vistered wiwn flt odetoij repotis l, o''illidjI OF4IGINATING ACTIVITV (C01patate 41111110) 2&. REPORT SECURITY CLASSIFICATION
Midwest Research Institute Ucasfe425 Volker Boulevard2bGRUKansas City Missouri 64110
The Viscosity of Synthetic Turbine Engine Lubricants from 1000 to 700*F
4 UCSCAIPTIyc NOTES (Type of leport and Iiacluajre dale*)
Technical Report, July 1969 - January 19715 Ato THORISI (First nlame. middle Initial, laat namne)
Ronald D. Butler
Jun 1971TAT 7a. TOTAL NO. OF PAG ES 7b. No OF REFSJune 171 7122
an,. CONTRACT OR GRANT NO. 98. ORIGINATOR'S REPORT NUMBERIS
AF33615-69-C-1265b. PROJECT No 3048
~Task No. 304806 9b. OTHER REPORT NOMS (Any other numbers thut nway L- it ylant
Wereport)
d. AFAPL- TR- 71-35
10 DISTRIBUTION STATEMENT
Approved for public release; distribution unlimited
I1 SUPPLEMENTARY NOTES 12 SPONSORING MILIlAHY AC 14VITY
Air Force Aero Propulsion Laboratory
Air Force Systems Command
13 Wright-Patterson AFB. Ohio 45433
.u~ report describes a technique for'the experimental determination of fluidviscosity over the temperature range 10O'-70O0'F. The method incorporates standardprocedures, and meets accepted specifications for data precision and for temperaturecontrol and measurement over the entire temperature range. Reliable data of highprecision can be obtained for subsequent analysis and prediction of lubricant per-formance in operating turbine aircraft engines.
Complete viscosity data are presented for 30 synthetic lubricants. The follow-ing fluid types were included in this study: MIL-L-7808, MIL-L-23699, MIL-L-27502,poly(phenyl etl~er), and silicone formulations. Statistical analysis of the data in-dicates that the relationship
log, v =A + B loge t + C/t
accurately describes the variation of kinematic viscosity with temperature over theentire temperature range. Th4 s equation can be used to calculate fluid viscosity atany desired temperature up to 500"F (or 700?F for thermally stable lubricants) withan average error less than 2%.
FORMDDU 14736IQ UNCLASS IFIEDStea 1ltI CJI...I I~ii dIn
UNCLASSIFIEDStcurity Classification
LINK A LINK a LINKCKEY woltot
Synthetic Lubricants RL - OI T 1OC W
ViscosityLubricationViscometer
UNCLASSIFIEDsecurity Classification

THE VISCOSITY OF SYNTHETIC TURBINE ENGINE LUBRICANTSFROM 1000 TO 700°F
Ronald D. Butler
3
-|

FOREWORD
This report presents results of a viscosity investigation on synthetic
turbine engine lubricants. The work was performed by Midwest Research In-stitute, 425 Volker Boulevard, Kansas City, Missouri 64110, under Contract
No. AF33615-69-C-1265, "Research for Lubricant Evaluation Techniques, Lubri-
cant-Bearing Evaluation." The contract was initiated under Project No. 3048,"Fuels, Lubrication, and Hazards," Task No. 304806, "Aerospace Lubricants."
The work was administered by the Fuels and Lubrication Division, Air Force
Aero Propulsion Laboratory, Air Force Systems Command, Wright-Patterson
Air Force Base, Ohio. The project engineers were Messrs. L. J. DeBrohun
and H. A. Smith (AFAPL/SFL). This report was submitted by the author in
April 1971.
The work described in this report, covering one phase of the subject
contract, was performed by Messrs. S. Davis, L. Hall, G. Hampton, D. Jehn,J. Klingensmith, G. Pelcher, and T. Stein, under the supervision of
Dr. Ronald D. Butler. The on-site project manager is Webster D. Wood and
the principal investigator for the program is Vern Hopkins.
Grateful acknowledgment is given to Dr. R. F. Manning, Cannon Instru-ment Company, for numerous helpful suggestions regarding the experimental
technique described in this report. Valuable technical advice and assistance
was also provided by Messrs. G. A. Beane and J. B. Schrand, U. S. Air Force
Aero Propulsion Laboratory.
This technical report has been reviewed and is approved.
H. F. JONES
Chief, Lubrication Branch
Fuels and Lubrication Division
ii
ABSTRACT
This report describes a technique for the experimental determinationof fluid viscosity over the temperature range 100*-700*F. The method in-corporates standard procedures, and meets accepted specifications for data
precision and for temperature control and measurement over the entire tem-perature range. Reliable data of high precision can be obtained for sub-sequent analysis and prediction of lubricant performance in operating tur-bine aircraft engines.
Complete viscosity data are presented for 30 synthetic lubricants.The following fluid types were in 'ided in this study: MIL-L-7808, MIL-L-23699, MIL-L-27502, poly(phenyl eth,.), and silicone formulations. Sta-tistical analysis of the data indicates that the relationship
loge v = A + B loge t + C/t
accurately describes the variation of kinematic viscosity with temperature
over the entire temperature range. This equation can be used to calculatefluid viscosity at any desired temperature up to 500*F (or 700*F forthermally stable lubricants) with an average error less than 2%.
~iii

CONTENTS
PAGE
I. INTRODUCTION .. .. .........................
II. EXPERIMENTAL METHODS: TEST REQUIREMENTS AND PROCEDURES . . . 3
A. TEMPERATURE MEASUREMENT .. .. ............... 3B. VISCOSITY DETERMINATIONS. .. ............... 4
C. APPARATUS: MEASUREMENTS BELOW 300F . .. ......... 5
III. VISCOSITY DETERMINATIONS FROM 3000 To 700F . .. ......... 6
A. VISCOMETER ASSEMBLY .. .. ................. 9B. HEAT SOURCE .. .. ..................... 9
C. VACUUM SYSTEM. .. ..................... 11D. PRESSURE CONTROL .. .................... 11E. TEMPERATURE MEASUREMENT. .. ................ 15F. VAPOR BATH MEDIUM. .. ................... 15G. SUPPORT FACILITIES .. ................... 16
H. OPERATING PROCEDURE. .. .................. 19
IV. FLUID VISCOSITY DATA, 1000 TO 700-F .. .............. 21
A. MATERIALS STUDIED. .. ................... 21
*B. COMPARISONS WITH PUBLISHED DATA. .. ............ 21
C. VISCOSITY DATA FOR SYNTHETIC LUBRICANTS. .. ........ 23
D. VARIATION OF VISCOSITY WITH TEMPERATURE. .. ........30
E. ANALYSIS OF EXPERIMENTAL PRECISION .. ........... 30
V. SIGNIFICANCE OF RESULTS .. .................... 34
A. EVALUATION OF TEST CONDITIONS AND APPARATUS. .. ...... 34
B, PRECISION OF EXPERIMENTAL RESULTS. .. ........... 34C. VISCOSITY-TEMPERATURE RELATIONSHIP .. ........... 35
VI. CONCLUSIONS AND RECOMMENDATIONS .. ................ 40
$APPENDIX A - VISCOSITIES OF SYNTHETIC LUBRICANTS . . . . . . . . . . 43
APPENDIX B - ASR4 VISCOS ITY- TEMPERATURE PLOTS FOR SYNTHETIC TURBINEENGINE LUBRICANTS (FIGURES 10 THROUGH 39) .. ....... 47
REFERENCES .. .............................. 63
B IBLIOGRAPHY . . . . . . . .. .............. .. .. ...... 65
CONTENTS (Con'tinued)
ILLUSTRATIONS
NO. TITLE PAGE
1 HIGH-TEMPERATURE VISCOMETRY FACILITY ........... 7
2 SCHEMATIC OF HIGH-TEMPERATURE VISCOMETER CONTROL CONSOLE . 8
3 VAPOR-BATH VISCOMETER ASSEMBLY . . . . ........... 10
4 SCHEMATIC OF VACUUM SYSTEM FOR HIGH-TEMPERATURE VIS-COMETER FACILITY ........ ................ 12
5 SCHEMATIC OF PRESSURE CONTROL SYSTEM FOR HIGH-TEMPLRATURE
VISCOMETER FACILITY. . . . ............... 13
6 CIRCUIT DIAGRAM FOR PRESSURE CONTROL RELAY ........ 14
7 PRACTICAL TEMPERATURE RANGES OF FLUIDS USED FOR TEMPERA-TURE CONTROL IN HIGH-TEMPERATURE VISCOMETER .......... 17
8 ELECTRICAL WIRING DIAGRAM FOR HIGH-TEMPERATURE VISCOMETER
FACILITY . .............................. ... 18
9 VISCOSITY TEMPERATURE PLOTS FOR (A) n-DODECANE AND(B) n-HEXADECANE . . . . . . . . . . . . . . . . . . . . 25
TABLES
NO. TITLE PAGE
1 DESCRIPTION OF FLUIDS STUDIED. . . . . ........... 22
II COMPARISON OF EXPERIMENTAL VISCOSITY DATA WITHPUBLISHED VALUES ........ .. .................... 24
III COMPARISON OF LUBRICANT VISCOSITY DATA FROM TWO
LABORATORIES .. ..................... . 26
IV CONDENSED SUMM4ARY OF EXPERIMENTAL VISCOSITY DATA ...... ... 28
V COMPARISON OF EXPERIMENTAL AND EXTRAPOLATED VISCOSITY DATA 29
vi
CONTENTS (Concluded)
TABLES (Concluded)
NO. TITLE PAGE
VI HISTORY OF VISCOSITY DATA FOR LUBRICANT 0-64-2 . . . . . . 31
VII STATISTICAL DATA FOR LUBRICANT VISCOSITY DETERMINATIONS. . 32
vii
II
INTRODUCTION
The viscosity of a fluid lubricant has long been recognized as itssingle most important mechanical property from the standpoint of its per-
formance in an engine. Viscosity is of particular interest because itdetermines oil flow rates through a lubrication system and over moving
parts. Viscosity is also an important factor in the load-carrying capa-
bility of lubricants. An engine lubrication system must be designed todeliver lubricant at each point in the engine requiring lubrication and
frequently cooling at a specified flow rate. Consequently, viscosity mustalways be considered in the selection of a lubricant for use in an exist-
ing propulsion system, in order that the proper delivery rate can be ob-
tained.
Techniques for determining fluid viscosity experimentally are wellestablished, and it is possible to obtain very precise and reproducible
U. data under closely controlled conditions. Viscosity values are usually
reported at certain conventional temperatures, such as 20'C, 25°C, 1000F,
130°F, 210'F, and 1000C. These particular temperatures have become accepted
as standard over a period of years, mainly because of tradition but also
as a matter of convenience. It is not common practice to measure and re-
port viscosity data above 210°F, although there does exist a genuine needfor good viscosity data for fluid lubricants at elevated temperatures.
Current turbine engines typically operate with the bulk oil temperaturereaching 300-400°F, and the oil is exposed to much higher temperatures in
the pumps, seals and bearings of the turbine section of the engine. Inadvanced propulsion systems--those capable of producing speeds in excess
of Mach 3--these temperatures are expected to be as high as 700-800'F.
Analysis of the operating characteristics of the engine requires a good
estimate of lubricant flow properties under the conditions actually en-countered in the engine. It is therefore highly desirable to have avail-
able a technique for determining fluid viscosities at temperatures up to
7000F.
Usually, data up to 210*F are plotted on viscosity-temperature chartssuch as those published by the American Society for Testing and Materials,
and estimates of viscosity at higher temperatures are obtained by linearextrapolation. The scales on these charts are generated from complex func-
tions based upon empirical relationships, and do give linear plots for
certain classes of fluids. However, it is widely known that the linearportions of these plots cannot be extrapolated with confidence to give
viscosity values at higher temperatures; as a rule, the experimental data
begin to deviate from the extrapolated values above about 300 0F, and the
1
deviations increase with increasing temperature. For this reason, atpresent the only reliable means for obtaining valid viscosity data above
300'F is to make the determinations experimentally.
This report describes a technique that has been developed on behalfof the U. S. Air Force Aero Propulsion Laboratory for determining lubri-
cant viscosity values at high temperatures. Measurements have been made
on a number of fluids up to 500*F, at which temperature most conventionallubricants undergo extensive thermal degradation and the experimental databegin to lose their significance. Several experimental fluids having
greater thermal stability have, however, been studied up to 7001F. The
experimental apparatus and the results are described herein.
I 12
II.
EXPERIMENTAL METHODS: TEST REQUIREMENTS AND PROCEDURES
All procedures and measurements made in this work conform to thespecifications established by the American Society for Testing and Materials,as described in ASTM Method D445, "Test for Kinematic Viscosity" (Ref. 1).At 100*F and 210*F, this standard specifies that the difference betweenduplicate viscosity determinations made by the same operator should be lessthan 0.35% of their mean value; results reported by two different labora-tories, assuming sound technique on the part of both, should not differ bymore than 0.70% of their mean value.
Temperature is the most important experimental parameter in viscositymeasurements, and requires very precise control. For many fluid lubricants,the variation of viscosity with temperature may be a great as 3% per 0Fnear 100*F. This means that at 100*F, the temperature must be controlledat least to within ± 0.10 in order to ensure that the results will be withinthe 0.35% repeatability limit. Since other factors also influence repeat-ability, temperature control must be much better than ± 0.10; it is gen-erally agreed that control to within ± 0.03*F is reasonable for viscometrywork, and this tolerance has been adopted for all of the determinationsdescribed in this report.
A. Temperature Measurement
Not only must temperature be controlled to conform to close tolerances,it is also necessary to obtain precise measurements of the actual workingtemperatures. Therefore, all thermometers used must be calibrated so thatthe temperature can be measured to an accuracy of ± 0.03°F or better.
For most of the work reported here, temperatures were measured usingcarefully calibrated platinum resistance thermometers. Two such thermometers(Leeds & Northrup Models 8160-B and 8163-C) were calibrated by the Air ForceMeasurement Standards Laboratory and certified to be accurate to within± 0.010C (± 0.0180 F). The calibrations are based upon the International
Practical Temperature Scale of 1948 (IPTS-48), and for the resistance ther-mometers used here are valid to 750°F. Resistance measurements were madewith a calibrated Leeds & Northrup Type G-2 Mueller Bridge having a pre-cision of ± 0.0001 ohm. Temperatures were computed from resistance mea-surements by means of an interpolation program provided with the thermometercalibrations and based upon the modified Callendar-Van Dusen equation fortemperatures above 0C,
3

Rt/RO = I + at + U6(t x 10 - 2) - 6(t2 x 10- 4)
where Rt is the resistance of the thermometer element at temperature tRO is the resistance at OC, and a and 6 are constants characteristicof the individual thermometer. The precision of this method is such thattemperatures computed using the reported calibrations are accurate to within± O.020F.
Periodic checks were made on the resistance thermometers by measuringtheir resistance values at the triple point of water. This temperature,which has been defined as 0.010C precisely, was achieved by means of atriple-point-of water cell manufactured by Trans-Sonics, Inc., Burlington,Massachusetts. The reference resistance at OC was computed by dividingthe value measured at the triple point by the known factor of 1.0000398for platinum. These periodic checks revealed that 1O , the resistance ofthe thermometer element at OC, varies less than 0.001% over a 6-monthperiod. This drift is well within the certified accuracy of the thermom-
eter and was considered negligible.
Ordinary mercury-in-glass thermometers were also used for monitoringthe working temperatures when determinations were made in conventional
fluid constant-temperature baths. These thermometers are designed forviscosity work (ASTM Type 28F, range 97.5-102.50 F; and Type 30F, range207.5-212.50 F), and are graduated in O.IF divisions. Although the ther-mometers were certified by the manufacturers to meet ASTM specifications,they were checked against the platinum resistance thermometer readings andin most cases were found to require corrections greater than 0.03'F. Atleast two mercury-in-glass thermometers were used together for monitoringfluid bath temperatures. This precaution also provided assurance that thetemperature of the stirred bath was uniform throughout; in no case was ameasurable temperature gradient detected in the fluid baths.
B. Viscosity Determinations
All v'scosity measurements were made by the standard technique oftiming the fluid flow past two points in a capillary viscometer. The vis-cometers used here were of the Cannon-Fenske and Cannon-Ubbelohde typesmanufactured by Cannon Instrument Company, State College, Pennsylvania.These viscometers were supplied with certificates of calibration, and con-form to specifications of the National Bureau of Standards. In order to
ensure that the calibrations were valid over long periods of use, theywere checked periodically against standard viscosity fluids also availablethrough Cannon Instrument Company and certified under the ASTML CooperativeViscosity Program. Only slight changes, indicating a need for more thoroughcleaning from time to time, were observed,
4
Cannon-Ubbelohde viscometers were selected as the preferred instru-
ments for most of this work. These viscometers have two important advan-
tages over other types, which more than compensate for their slightly
higher cost. -First, their design provides a constant fluid driving head,
so that the efflux time is not sensitive to the sample size taken, unlike
the Cannon-Fenske design, in which the sample volume is critical. Second,
the calibration of the Cannon-Ubbelohde viscometer is independent of tem-perature, again in contrast to other types, so that no corrections or con-
versions are required when working at temperatures other than those at
which the viscometer was calibrated.
Kinematic viscosity values were determined by carefully timing the
flow of the fluid sample past two marks on the viscometer and multiplying
the measured times by the certified viscometer constant:
v =kr
where v is the kinematic viscosity in centistokes, k is the viscometer
constant, and T is the measured time in seconds.
Mechanical stopwatches were used for timing purposes. All of the
timers were calibrated against the time signals broadcast by the National
Bureau of Standards over Station WWV, Fort Collins, Colorado. In every
case, the watches were found to be accurate to well within ± 0.01%.
C. Apparatus: Measurements Below 300*F
For most work below 300*F, commercially available viscometry equip-
ment was found to be satisfactory. Constant-temperature viscosity baths
manufactured by Cannon Instrument Company (Model H-l) were used for con-
trolling temperature up to 3000F. These units have exhibited excellent
control, uniformity, and stability; at any preset temperature within the
range 100-300*F, the maximum variation was less than ± 0.02*F, which is
well within the control tolerances described above. As noted above, we were
unable to detect any temperature gradients within these baths. Water was
the most suitable bath medium up to about 1400 F; stabilized bath oils,
such as that available through Fisher Scientific Company, can be used above
this temperature, and are suitable for intermittent use between 2500 and300 0F.
5

III.
VISCOSITY DETERMINATIONS FROM 3000 TO 700°F
In the foregoing discussion it was pointed out that fluid viscositydeterminations can be made more or less routinely up to 300*F utilizingcommercially available equipment. Above 3000F, however, difficultiesarise that make the use of fluid baths impractical. Obviously, heat losses
at higher operating temperatures can be severe enough to result in poortemperature control. A more serious problem associated with fluid baths
is the lack of fluids that are suitable for use at high temperatures.
The familiar mineral oil formulations, even those containing oxida-tion inhibitors, tend to darken and smoke excessively above 250°F, so thattheir useful life can be quite short. It is true that some silicones are
serviceable to 500°F and higher, but they have serious disadvantages.
They are, for example, notorious for their tendency to contaminate glass-ware; they may contaminate the walls of a viscometer capillary, thereby
changing the viscometer constant, and they are extremely difficult to re-
move. Silicones should therefore be avoided in viscometry work (Ref. 2).
Other synthetic fluids, such as poly(phenyl ether) and fluorinated poly-mers, are impractical because of their high cost. Molten inorganic salt
mixtures have been used as bath media, but these mixtures usually contain
nitrates and can become explosive if not handled properly. It has beensuggested that air itself would make a satisfactory bath medium. However,
we were unable to locate a source of well-insulated ovens having both an
extended temperature range (to 700'F) and good temperature control capa-
bility (better than O.1°F).
The objective of this work has been the development of a techniquethat would circumvent these difficulties and still provide adequate tem-perature control for viscosity measurements up to 700°F. One such methodhas been reported by Awwad in collaboration with Cannon Instrument Company
(Ref. 3). This procedure takes advantage of the fact that the vapors abovea boiling liquid can serve as an efficient constant-temperature medium pro-
vided the pressure of the system is held constant and the refluxing liquid
does not decompose.
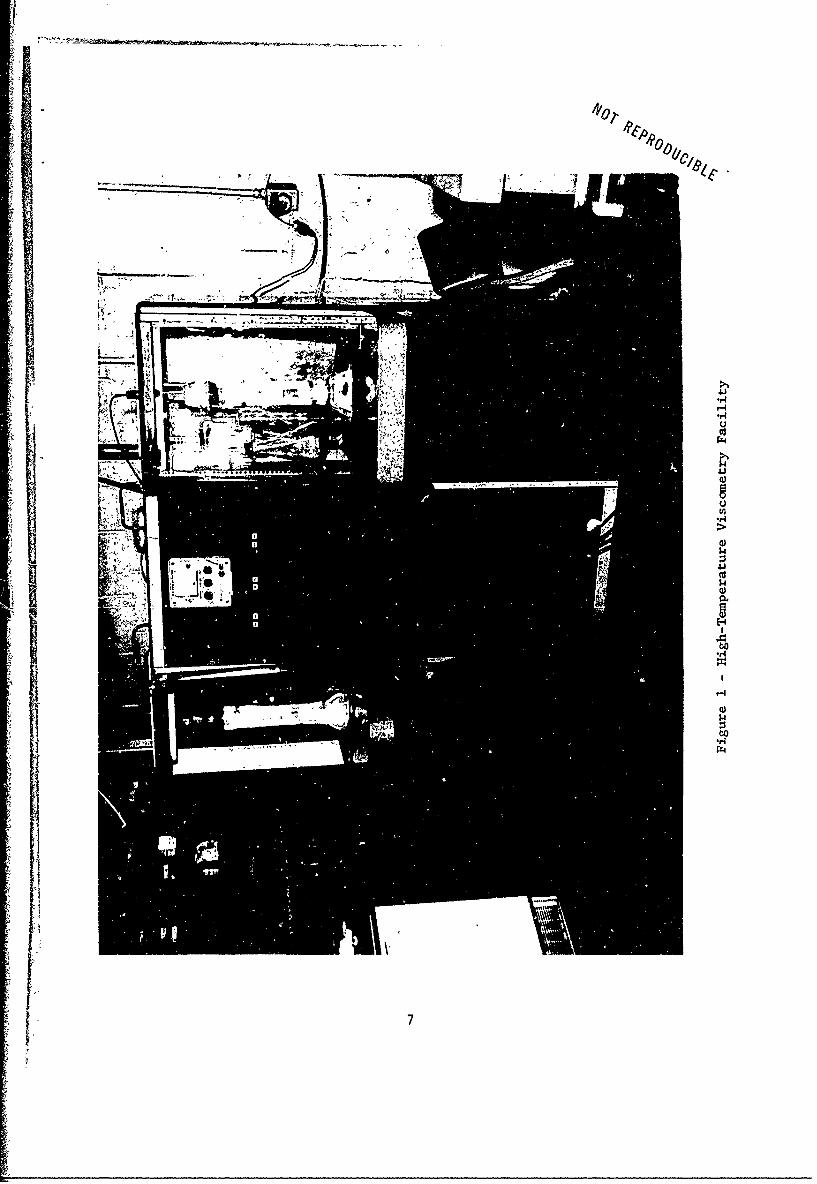
An apparatus has been constructed on this principle for determiningfluid viscosities over an extended temperature range. This equipment ispatterned after the prototype used by Awwad. The overall facility isshown in Figures 1 and 2. It consists essentially of a modified capillary
viscometer, a heat source, a vacuum system, a pressure control system, a
temperature-measuring system, the refluxing liquid, and support facilities.
6
'Pe
Alol
4
14
.r4
r-40
'.4
AI.-L z0u4Z
0 0U)
0
4
0
o a)
000 u0
00
44
b)
.00
>0 0
0. U C.
U 0 U
.4 -2 a 0 .
04 M It- 0 000
u o 4 ~ ~y~n;8
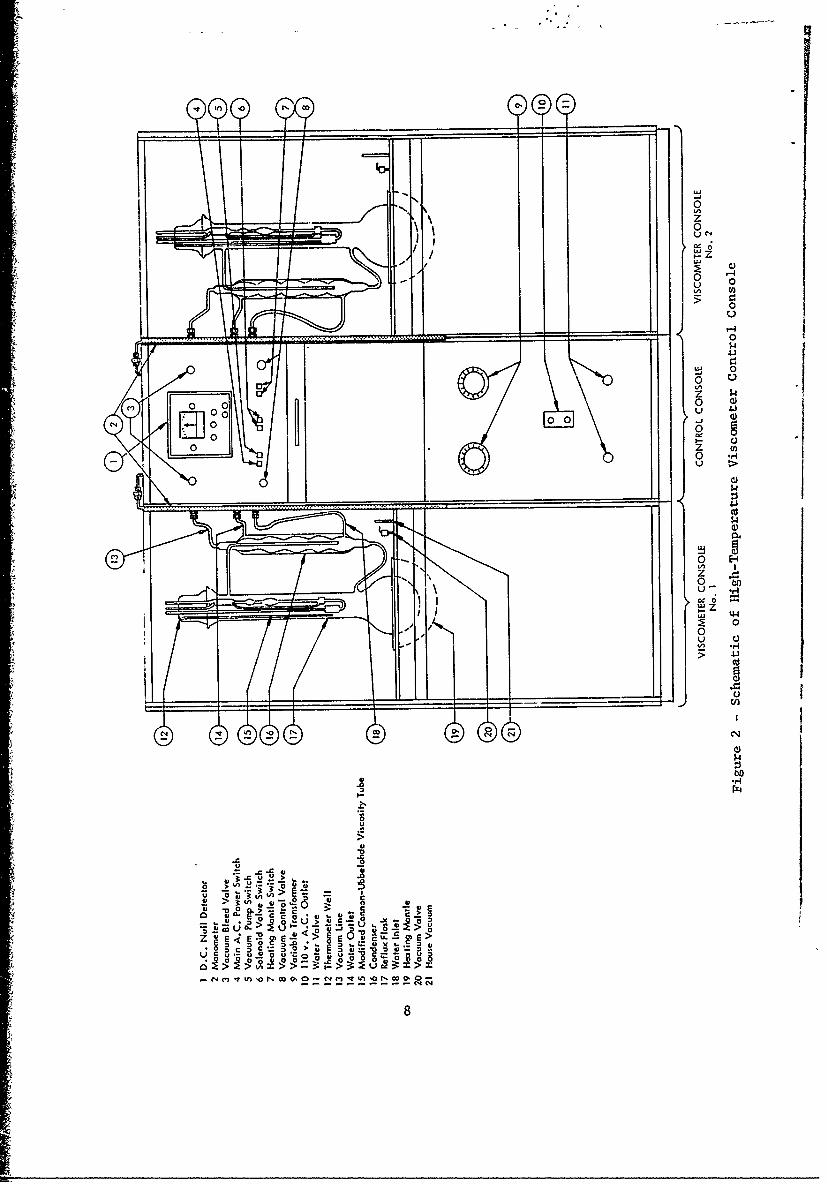
The viscometry facility, as shown in Figure 1, incorporates two
separate viscometer assemblies, which share a common control console. This
design was followed because of the minor additional cost of constructing
a double, rather than just a single, unit. Furthermore, each unit may be
used to cover a different temperature range, thus eliminating the need for
changing over a single unit when conducting tests over different tempera-
ture ranges. In the following description, the details refer to the de-
sign and operation of a single unit; since both units are identical, it
may be inferred that the principles outlined here apply to both units.
A. Viscometer Assembly
The viscosity-measurement apparatus itself consists of the modifiedCannon-Ubbelohde capillary viscometer shown in Figure 3. The modification
provides a means of suspending the viscometer in the vapor bath using a
standard 75/50 ball-and-socket joint. This joint is sealed with Apiezon
Type H vacuum grease, which is the only material found that is capable of
maintaining a tight seal, over the full range of operating temperatures.
The boiler chamber is fabricated from a section of a I-liter round-bottom flask sealed onto 50-m. Pyrex tubing; this section of the viscom-
eter assembly contains the refluxing fluid for controlling temperature,
and fits into a standard electric heating mantle. The condenser section
shown in Figure 3 serves to liquefy and return the vapors to the boilerIf section, so that nearly total reflux is achieved. The side arm at the topof the condenser section leads to the vacuum and pressure-regulation sys-
tem. In use, the entire viscometer assembly is encased in preformed heat-
curing ceramic insulation supplied by Refractory Products Company, Evanston,
Illinois.
B. Heat Source
A steady source of heat for the boiler is provided by a high-temperatureheating mantle, as indicated in Figure 2. The mantle used here, Glas-Col
Apparatus Company Model 146175, is rated at 600 W, has quartz insulation,
and has a nominal maximum operating temperature of 6500C (1200*F). Themantle is recessed into a hole cut into the supporting shelf, and is at-
tached by means of mounting screws in the metal rim of the mantle. Power
input to the mantle is controlled manually by means of the variable trans-former (Statco Type 751, 0-140 V) located on the central console panel.
9

mfWOW1IR~ Will.P-
F18
76I
406
so
I ti118 FtASIC
MOO'FNlD CANNON.W&IOHDI
VISCOMIIt
MOTI,
All 4-.i-. 1.
UM~lPy.. 9.. *q*~
CONDINSII ASSIMILY
*lILLP FWKS
Figure 3 -Vapor-Bath Viscometer Assembly
10
C. Vacuum System
The boiling temperature of the refluxing liquid is determined bythe pressure in the system. Within limits, a particular steady temperaturebelow the normal boiling point of the liquid can be attained merely bymaintaining a constant reduced pressure. The vacuum system shown sche-matically in Figure 4 makes provision for pressure variation, and therebytemperature selection. Reduced pressure is provided by a Duo-Seal vacuum
pump (W. M. Welch Manufacturing Company). All vacuum lines were con-structed of 1/4-in, copper or heavy wall Tygon tubing. The various valves
tindicated in Figure 4 are stainless steel needle valves (Hoke, Inc.).
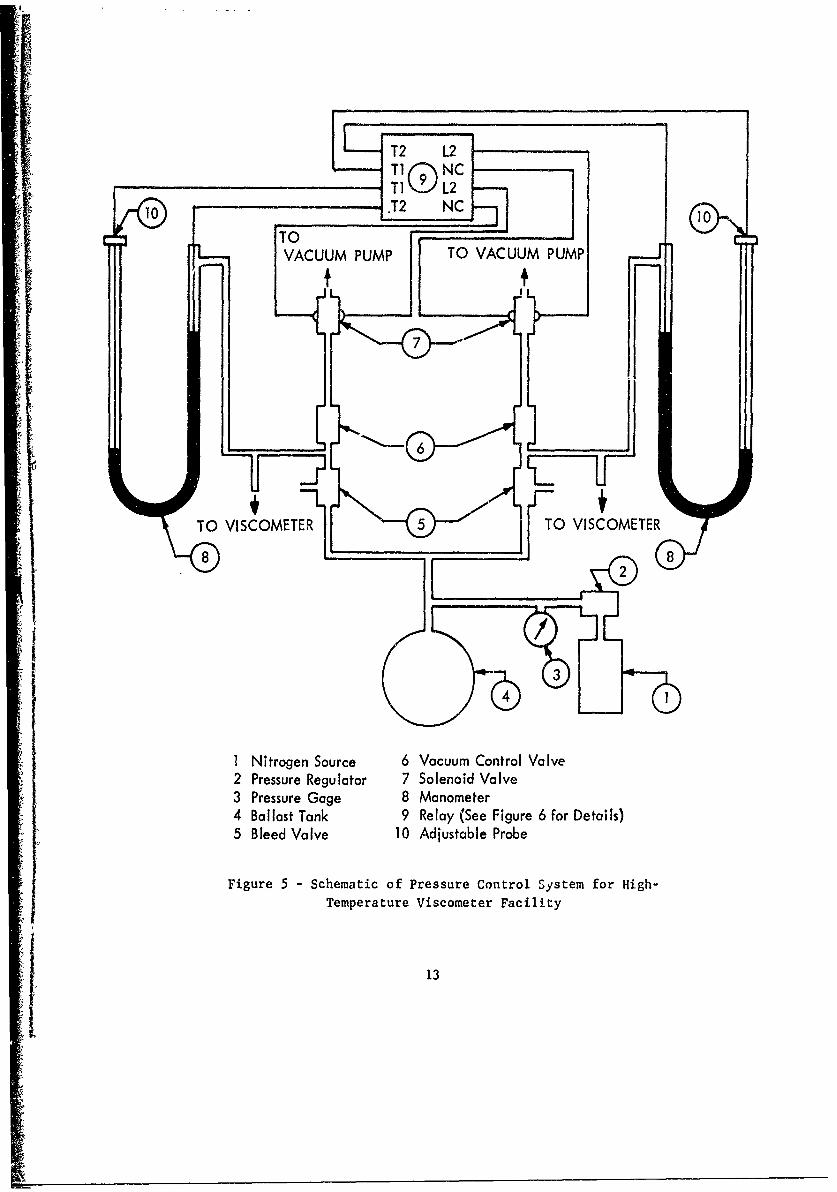
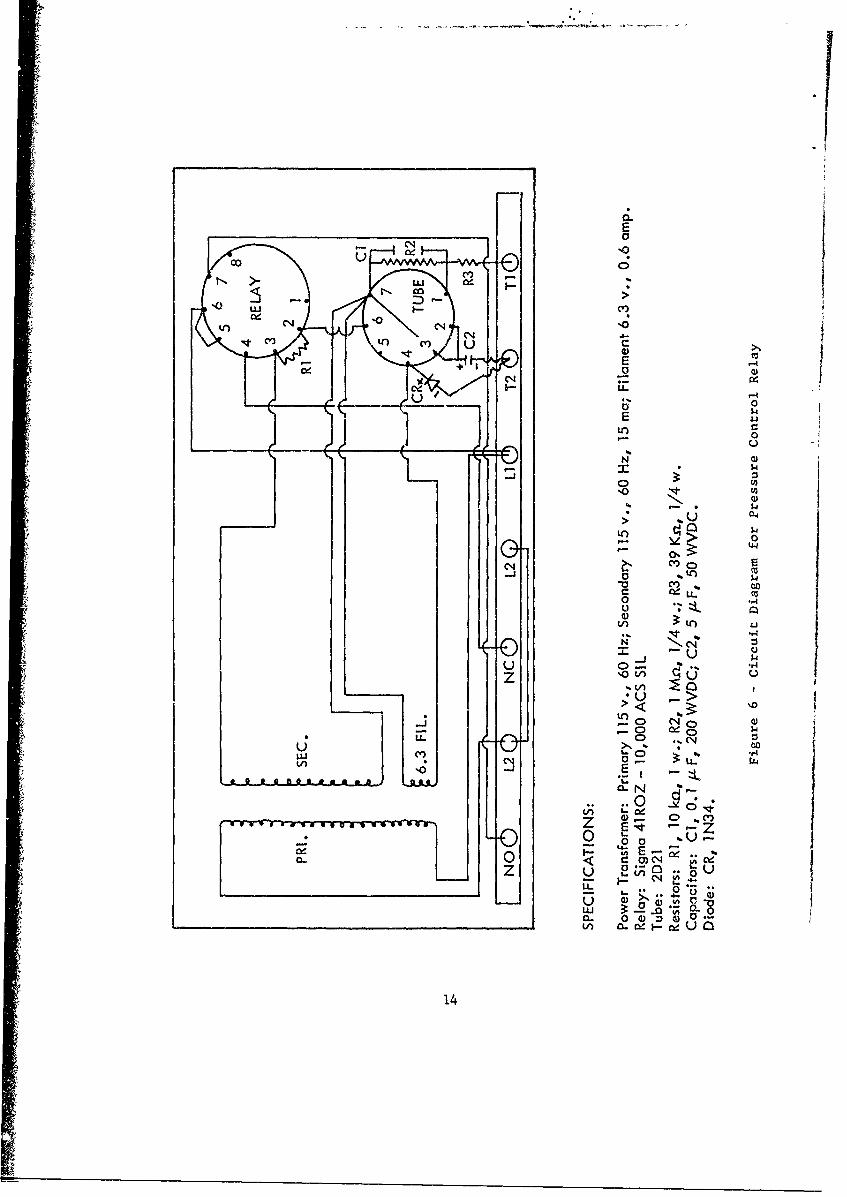
D. Pressure Control
Pressure in the system is coritinuously variable from 50 to 760 mm. Hg,and can be automatically controlled at any point within this range. Theprinciple employed here is identical to that used in the familiar mercury-contact thermoregulator. The system is shown schematically in Figure 5.
Mercury in the closed side of a U-tube manometer makes continuous electricalcontact with a relay by means of a fixed copper lead. The manometer usedhere is constructed so that the mercury is in direct contact with the bottomof the metal case; therefore, it is convenient to connect the relay leaddirectly to a metal fitting on the manometer case.
A metal probe made of 1/16-in. stainless steel rod extends into the
open arm of the manometer and is electrically insulated from the case by
means of a Nylon lock nut. The probe is manually adjusted up or down toextend any desired distance into the open side of the manometer, correspond-
i1 ing to the required difference in height of the mercury levels in the twoarms. A second electrical lead connects the probe to the relay. Thus, aa complete circuit is made when the tip of the probe contacts the mercury inthe open arm of the manometer. Connections to the relay are shown in therelay circuit diagram in Figure 6. If the pressure in the system is higherthan required, the probe extends into the mercury column. This completesthe circuit, and the relay signals the solenoid valve to open the system
to the vacuum pump. As soon as the pressure is reduced to the controlpoint, the probe breaks contact with the mercury and the solenoid valve
closes.
The remaining components shown in Figure 5 are provided for fine con-trol. The ballast tank is a 1.2 cu. ft. aviation oxygen tank, which servesto prevent sudden pressure fluctuations when the solenoid valve opens thesystem to the action of the vacuum pump. A manually adjusted needle valvein the vacuum line also controls the rate at which pressure is reduced inthe system.
11'i

4I
2 2
33
....... ... . .... .. .. ... .. .. .
TO VISCOMETER TO VISCOMETER
7
1 Vacuum Pump2 Solenoid Valve3 Ballast Tank4 Crossover Valve5 Vacuum Control Valve6 Bleed Valve7 Manometer
Figure 4 - Schematic of Vacuum System for High-Temperature Viscometer Facility
12
T2 L2
10 T2 NC 10
VACUUM PUMP TO VACUUM PUMP
F itrgen Sceai 6f Vacsuum Control Valvem o ih
Temperature Viscometer Facility
S13
cmv
LO CN 10 -
CNC
U- -u 0
00
N
o U)
10.
C14 cvo
W LL0u1/)
0 I>
10 LA u
o~ >-*
O 0 C40.. CD CV(
X t
.. 0L. W*
________________________________________________________________L 0. O a0
Cd ILA4
A second needle valve is used for admitting either air or nitrogen tothe system at a slow, controlled rate; this feature serves further to
smooth out pressure fluctuations, and also prevents excessive carryover
of vapors of the refluxing liquid into the vacuum lines.
This pressure-control system has proven to be quite successful. Withproper manual adjustment of the vacuum and air valves, it is possible to
maintain a pressure that is constant to within ± 1 mm. Hg. For the fluidsthat have been used for controlling temperature, this pressure variationcorresponds to a maximum temperature fluctuation of ± 0.03'F at most
temperatures.
E. Temperature Measurement
A thermometer well is incorporated into the design of the modifiedviscometer (see Figure 3) to accommodate a platinum resistance thermometer.
A small amount of thermally stable fluid, such as a silicone or poly(phenylether), is placed in the thermometer well to cover the platinum sensingelement. Gocd zemperature measurement is achieved by this placement of thesensing elemet.t near the test fluid in the viscometer.
F. Vapor Bath Medium
As stated above, the boiling temperature of a fluid can be depressed
below its normal boiling point by reducing the pressure of the atmosphere
above the liquid. Fo'" most organic liquids, the boiling point can typicallybe lowered some 140-1602F by operating at a pressure of 50 mm. Hg, thelowest practicable working pressure in our system. Thus, by varying the
pressure in the system it is possible to control the boiling point, andthereby the test temperature, at any temperature over a range of about
150*F with a single refluxing fluid.
This interval for a single refluxing liquid is not sufficient to coverthe entire range of interest (300-700°F). It is therefore necessary to
use a series of different liquids, preferably having overlapping tempera-ture ranges, to achieve all of the desired operating temperatures. The
choice of organic materials for this purpose would seem to be almost un-
limited, but such is not the case. Safety considerations require that thematerials be as nearly innocuous as possible, since some fumes do invariablyescape through the vacuum pump and may be vented to the laboratory. Like-
wise, the substances must not be corrosive or otherwise deleterious to thevacuum lines and valves. Finally, the materials must be stable and pure4, enough to allow a constant boiling temperature.
15
.. . . . . .. . . . . . .
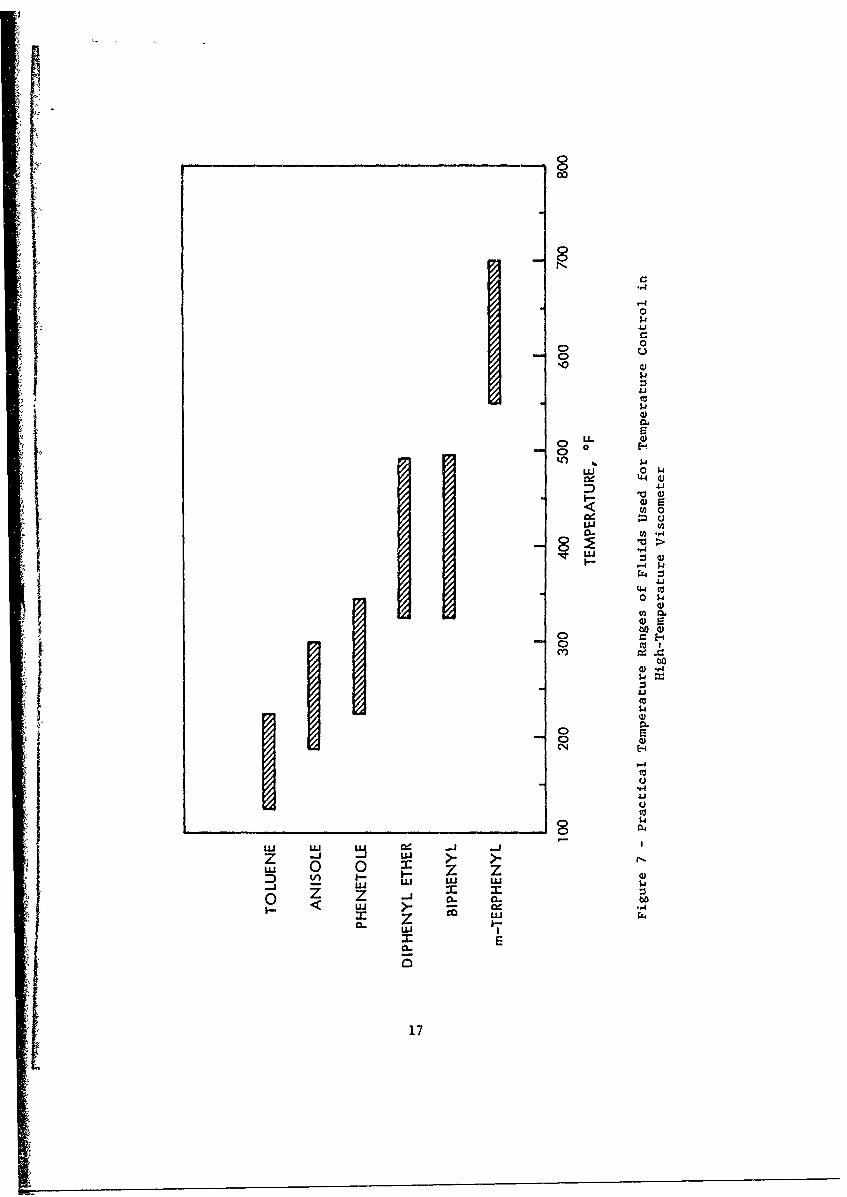
Shown in Figure 7 are the useful boiling-temperature ranges for
several organic materials that have been found to meet these criteria.
Depending upon the temperature desired, there is some flexibility in the
choice of reflux fluids, particularly between 2000 and 3500F. At the
highest temperatures, the choice is severely limited; only m-terphenyl, of
seven suggested materials evaluated, was found to have the desired quali-
ties of thermal stability, constant boiling temperature, and upper tem-
perature capability of 700'F.
The compounds found to be most useful and successful for temperature
control above 300*F are diphenyl ether (range 320-495*F) and m-terphenyl
(550-700'F). These two materials provide a capability for maintaining
and controlling nearly any temperature between 3200 and 700*F.
G. Support Facilities
All of the components discussed above were assembled and installed
in standard enclosures. Placement of the various components was a matterof operator convenience, and no specific recommendations are made with
regard to the construction of similar units.
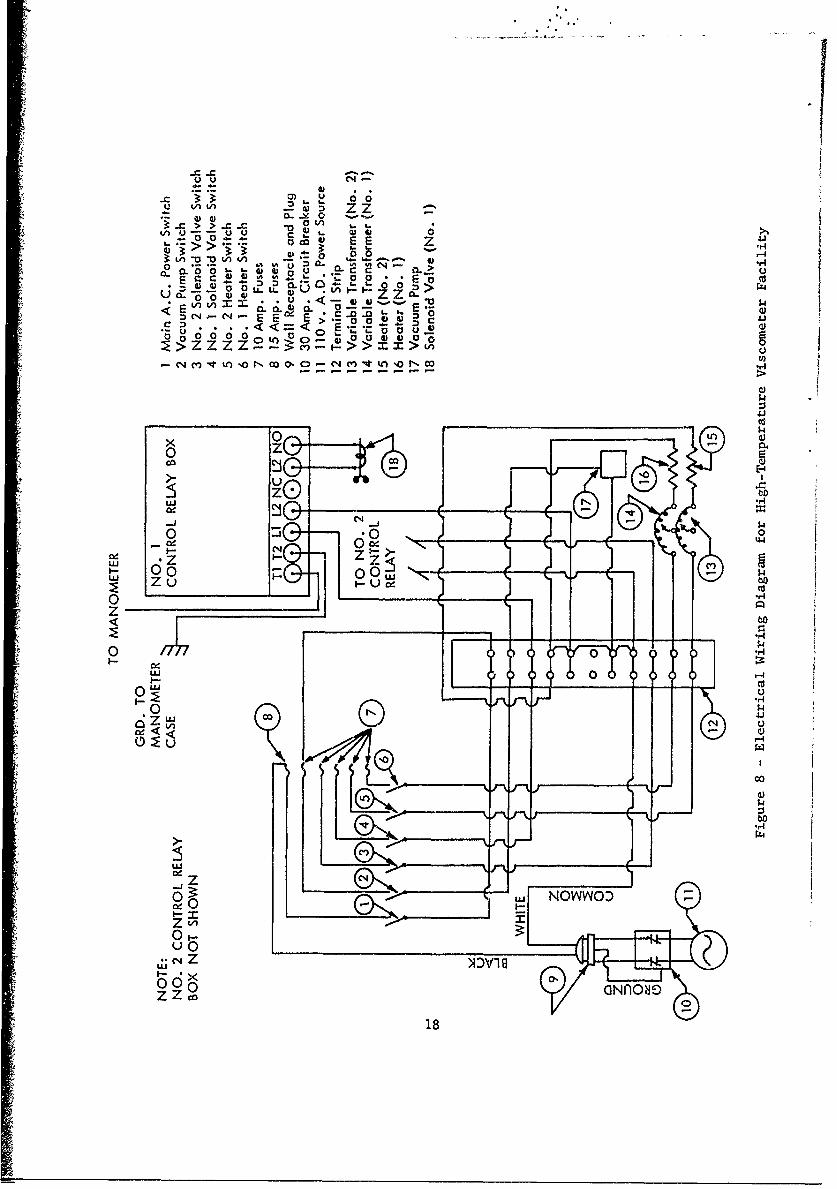
Shown in Figure 8 is an electrical wiring diagram for the viscometer
facility. The electrical service is 100 V AC with a current rating of30 amps. Fuses are located inside the console for the protection of the
various components; the ratings of these fuses are indicated in Figure 8.
The main console power switch and individual power switches to the com-
ponents are located on the front control panel, as shown in Figure 2. For
convenience, a double receptacle is placed on the front of the console to
provide auxiliary power for appliances such as lights and timers.
Cooling water for the condenser is supplied from a line entering
through the rear of the center console and extending to the shelf support-
ing the glass viscometer assembly. Valves mounted on the front control
panel (see Figure 2) control the water flow rate. A return line from the
condenser provides discharge into a waste water drain.
An auxiliary valve mounted conveniently on the support shelf in the
end cabinet unit provide-z house vacuum service. This vacuum line aids in
drawing test fluid up into the viscometer and in cleaning the viscometer
assembly after a test. Not indicated in the accompanying figures is a
waste trap, which consists of a 5-gal. carboy in the house vacuum line for
collecting waste fluids.
16
OD
00
00IU4J
LL 40
C4)to lb $4
D4E!
0
22 a
w0 $4
C))
94
$4.1 t~C00
0
4
$-44,
LU LUU.1 0 0 z
D Li) I-- 1-- z 4)ui $4U3 LA
<~ ~ ~ £1.- z w r3= z 1 44
17
u- z z> > -IC 0 L
oc ) E E Z r
0 .00'- 04u 0 lC4-C0002
U 0- - 0 0 u 0 0E L. t.~
E o~ o o ooa
0 zJ
U.'i
C144
cd
co
'-4
LU ~r 4
0 18
'C44
H. Operating Procedure
Approximately 200 gm. of the vapor bath material (phenyl ether, m-terphenyl, etc,) is charged into the boiler flask and the flask is placed
in the heating mantle and connected to the vacuum line. The ball joint isthoroughly -oated with Apiezon vacuum grease, and the modified viscometer
is fitted in place. The joint is rotated and rocked with slight pressureto ensure a uniform seal. If desired, the viscometer can be clamped in a
true vertical position by hanging a plumb weight inside the filling tube,
as described in ASTM Method D445. The plumb line is removed and test oilis introduced through the filling tube until the level reaches the fillmark on the viscometer reservoir. The viscometer assembly is encased inpreformed insulation and clamped into position. The thermometer well is
filled about one-third with a high-temperature fluid, and the resistancethermometer is inserted and connected to the Mueller resistance bridge.
Connections are made from the bridge to the null detector and the null de-tector is turned on.
The air and vacuum valves on the front console are shut off and thepower switches are turned on to activate the vacuum pump, heating mantle,and relay-solenoid control. The manometer probe is inserted into the mer-cury column to a depth corresponding to a difference of about 28 in. (712
mm. Hg) in the heights of the two mercury columns. This setting provides
an initial system operating pressure of approximately 50 mm.Hg. The vacuumvalve is opened gradually to permit evacuation of the viscometer jacket.As soon as the pressure is reduced to the control point, the air bleedvalve is opened gradually to admit a slow stream of air and thereby pre-vent pumping past the control point. The rate of evacuation and intro-duction of air are adjusted manually by means of the vacuum and air valvesuntil stable control is reached; at this point the relay cycles every fewseconds, and with the valves properly adjusted the mercury level in themanometer remains nearly constant without bumping appreciably when thesolenoid valve opens and closes.
Power input to the heating mantle is controlled by manual adjustmentof the variable transformer until stable boiling is reached with a steadycarryover of vapors into the condenser section. A slow stream of water isrun through the condenser to provide nearly complete condensation and re-turn of the vapors to the boiler section. (Caution: Cooling water is
not advised when operating with a high-melting material such as m-terphenyl,as this results in solidification and blockage inside the vapor-return tube.With such materials, it is preferable to maintain the condenser at a tem-perature of about 200°F by wrapping the condenser with heating tape or bypassing steam through the condenser jacket.)
19
The temperature of the viscometer chamber is monitored by means of
the resistance thermometer until it is constant to within about 0.01C(for most platinum sensing elements, this corresponds to a resistance vari-
ation of about ± 0.0010 0). The test fluid is drawn up into the upper
reservoir of the viscometer and allowed to run through once in order toensure that it has reached a uniform temperature. The viscosity measure-
ment is then made in the customary manner, by timing the fluid flow pastthe two marks on the viscometer. At least three measurements are made,
and their mean value is acceptable if the temperature remains constant to
within ± 0.03'F during the test and the spread of the individual resultsis less than 0.35% of the mean value.
The temperature is then increased for the next set of measurements byraising the metal manometer probe and allowing the pressure in the systemto rise to the new control point. The vacuum and air valves are again
adjusted manually to give a stable pressure, and if necessary the power
input to the heating mantle is increased to maintain steady boiling. Anew set of viscosity measurements is made after a constant temperature hasbeen established, and the procedure is repeated until the temperature range
of interest has been covered.
Depending upon the temperature capability and volatility of the fluidbeing tested, a number of viscosity determinations can be made at several
temperatures without changing the sample. Some degradation is often evi-denced by darkening of the sample, but the change does not seem to be
great enough to affect the viscosity values. When substantial degradation
does occur, the viscosity measurements become erratic and the test is
terminated. If desired, the apparatus can be cooled to room temperature,cleaned, and charged with fresh sample in order to perform immediate measure-
ments at the higher temperatures where breakdown has been suspected.
The viscometer assembly is designed so that it can be cleaned in placewithout disassembly. After cooling to room temperature, the test fluid is
drawn out into a waste chamber in the house vacuum system, and the glass-
ware is cleaned by thoroughly purging several times with Freon-113, acetone,and reagent grade methanol or 2-propanol. Residual stains can usually be
removed by allowing a mixture of 50% 2-propanol, 45% toluene, and 5% water
to stand in the assembly overnight. For intransigent residues, the modi-fied viscometer section is removed and cleaned with chromic acid or hot
nitric acid. (WARNING: These cleaning agents are powerful oxidants and
must be used with extreme caution; all traces of organic solvents must be
removed before they are used, and the glassware should be flushed with
copious quantities of hot distilled water after cleaning.)
20
IV.
FLUID VISCOSITY DATA, 1000 TO 700-F
A. Materials Studied
Two reference fluids and 30 synthetic turbine engine lubricants have
been tested in this program. A description of these fluids is given in
Table I, together with the highest temperatures at which they were studied
and their kinematic viscosities at 100*F.
The test fluids cover a variety of lubricants, and include most ofthe formulations either proposed or currently in use by the U. S. Air
Force: MIL-L-7808, MIL-L-27502, MIL-L-23699, experimental ethers, andone silicone. In one case, a single fluid was tested under two different
code numbers; and several samples represent different batches of the same
formulation. These duplications were made in order to establish the ability
of the supplier to reproduce individual formulations and the ability of
laboratory personnel to repeat measurements made at different times.
I B. Comparisons with Published Data
In order to establish the reliability of the technique described here,
it is necessary to compare results obtained in this laboratory with pub-lished standard reference data. A convenient source of data for this pur-pose is the critically evaluated compilation of physical properties ofhydrocarbons published by the American Petroleum Institute (Ref. 4).
n-Dodecane and n-hexadecane were selected as the reference materials
for this comparison. The API tables give kinematic viscosity data forthese fluids at 680, 1000, 1400, 2100, 3000, and 400°F. Values at inter-
Imediate temperatures were calculated by fitting the reference data to the
general formula
loge V100 = a(t-100) + b(t-100)
2
- t c + t
where v1oo is the kinematic viscosity at 1000 F, vt is the viscosity at
temperature t ,and a , b , and c are parameters to be determined foreach fluid. The following parameters were found to describe the viscosity-
temperature relationships of n-dodecane and n-hexadecane:
21
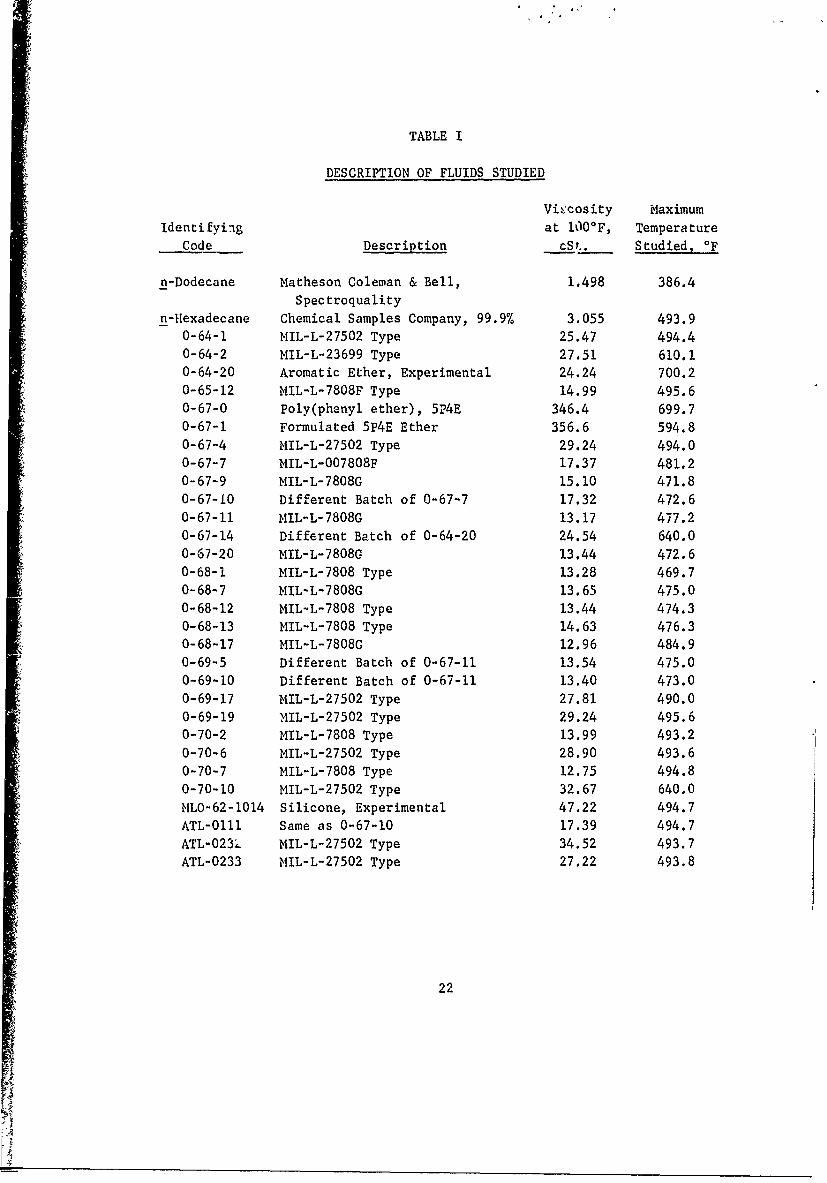
TABLE I
DESCRIPTION OF FLUIDS STUDIED
Viscosity Maximum
Identifying at 1000F, TemperatureCode Description cSt.. Studied, 'F
n-Dodecane Matheson Coleman & Bell, 1.498 386.4Spectroquality
n-Hexadecane Chemical Samples Company, 99.9% 3.055 493.90-64-1 MIL-L-27502 Type 25.47 494.4
0-64-2 MIL-L-23699 Type 27.51 610.10-64-20 Aromatic Ether, Experimental 24.24 700.2
0-65-12 MIL-L-7808F Type 14.99 495.60-67-0 Poly(phenyl ether), 5P4E 346.4 699.7
0-67-1 Formulated 5P4E Ether 356.6 594.80-67-4 MIL-L-27502 Type 29.24 494.00-67-7 MIL-L-007808F 17.37 481.2
0-67-9 MIL-L-7808G 15.10 471.80-67-10 Different Batch of 0-67-7 17.32 472.60-67-11 MIL-L-7808G 13.17 477.20-67-14 Different Batch of 0-64-20 24.54 640.0
0-67-20 MIL-L-7808G 13.44 472.6
0-68-1 MIL-L-7808 Type 13.28 469.70-68-7 MIL-L-7808G 13.65 475.0
0-68-12 MIL-L-7808 Type 13.44 474.3
0-68-13 MIL-L-7808 Type 14.63 476.30-68-17 MIL-L-7808G 12.96 484.90-69-5 Different Batch of 0-67-11 13.54 475.00-69-10 Different Batch of 0-67-11 13.40 473.00-69-17 MIL-L-27502 Type 27.81 490.0
0-69-19 MIL-L-27502 Type 29.24 495.60-70-2 MIL-L-7808 Type 13.99 493.2
0-70-6 MIL-L-27502 Type 28.90 493.60-70-7 MIL-L-7808 Type 12.75 494.80-70-10 MIL-L-27502 Type 32.67 640.0
MLO-62-1014 Silicone, Experimental 47.22 494.7ATL-0111 Same as 0-67-10 17.39 494.7
ATL-023. MIL-L-27502 Type 34.52 493.7ATL-0233 MIL-L-27502 Type 27.22 493.8
22
A4
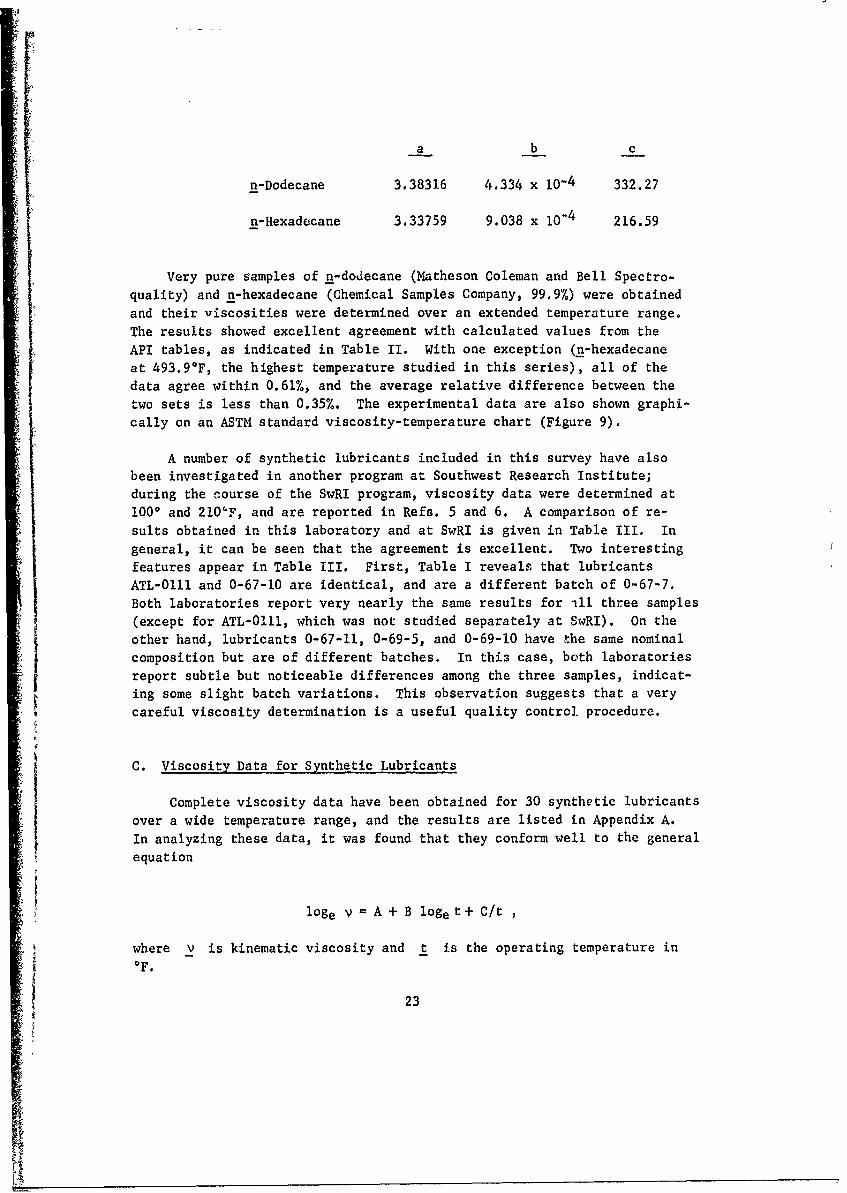
a b c
n-Dodecane 3.38316 4.334 x 10⁻⁴ 332.27
n-Hexadecane 3.33759 9.038 x 10⁻⁴ 216.59
Very pure samples of n-dodecane (Matheson Coleman and Bell Spectro-quality) and n-hexadecane (Chemical Samples Company, 99.9%) were obtained
and their viscosities were determined over an extended temperature range.The results showed excellent agreement with calculated values from theAPI tables, as indicated in Table II. With one exception (n-hexadecaneat 493.90F, the highest temperature studied in this series), all of thedata agree within 0.61%, and the average relative difference between the
two sets is less than 0.35%. The experimental data are also shown graphi-cally on an ASTM standard viscosity-temperature chart (Figure 9).
A number of synthetic lubricants included in this survey have alsobeen investigated in another program at Southwest Research Institute;during the course of the SwRI program, viscosity data were determined at
1000 and 210'F, and are reported in Refs. 5 and 6. A comparison of re-sults obtained in this laboratory and at SwRI is given in Table III. Ingeneral, it can be seen that the agreement is excellent. Two interesting
features appear in Table III. First, Table I reveals that lubricantsATL-0111 and 0-67-10 are identical, and are a different batch of 0-67-7.Both laboratories report very nearly the same results for ill three samples(except for ATL-01I, which was not studied separately at SwRI). On theother hand, lubricants 0-67-11, 0-69-5, and 0-69-10 have the same nominalcomposition but are of different batches. In this case, both laboratories
report subtle but noticeable differences among the three samples, indicat-ing some slight batch variations. This observation suggests that a verycareful viscosity determination is a useful quality control, procedure.
C. Viscosity Data for Synthetic Lubricants
Complete viscosity data have been obtained for 30 synthetic lubricantsover a wide temperature range, and the results are listed in Appendix A.
In analyzing these data, it was found that they conform well to the generalequation
loge v = A + B loge t+ C/t
where V is kinematic viscosity and t is the operating temperature inOF.
I 23
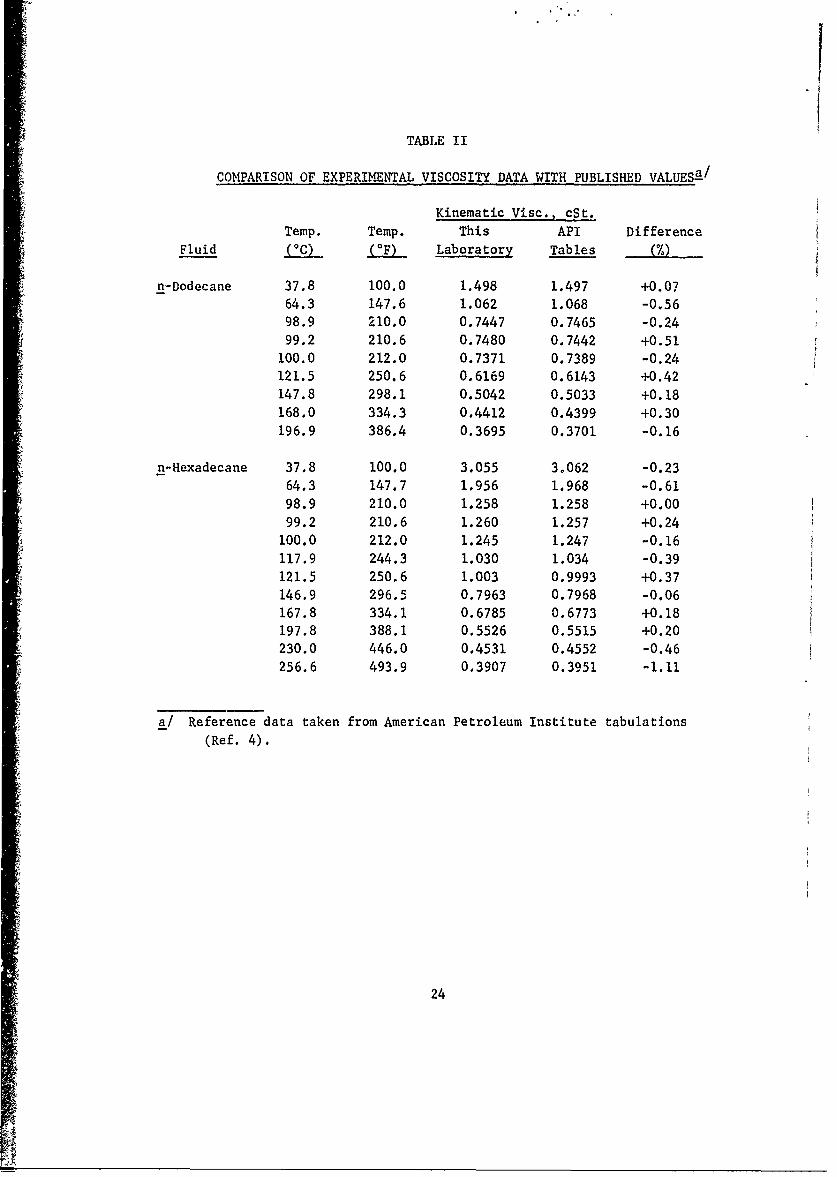
ITABLE II
COMPARISON OF EXPERIMENTAL VISCOSITY DATA WITH PUBLISHED VALUESa/
Kinematic Visc., cSt.
Temp. Temp. This API Difference
Fluid f (_F) Laboratory Tables M
n-Dodecane 37.8 100.0 1.498 1.497 +0.07
64.3 147.6 1.062 1.068 -0.56
98.9 210.0 0.7447 0.7465 -0.2499.2 210.6 0.7480 0.7442 +0.51
100.0 212.0 0.7371 0.7389 -0.24121.5 250.6 0.6169 0.6143 +0.42147.8 298.1 0.5042 0.5033 +0.18
168.0 334.3 0.4412 0.4399 +0.30196.9 386.4 0.3695 0.3701 -0.16
n-Hexadecane 37.8 100.0 3.055 3.062 -0.2364.3 147.7 1.956 1.968 -0.6198.9 210.0 1.258 1.258 +0,0099.2 210.6 1.260 1.257 +0.24100.0 212.0 1.245 1.247 -0.16117.9 244.3 1.030 1.034 -0.39121.5 250.6 1.003 0.9993 +0.37146.9 296.5 0.7963 0.7968 -0.06167.8 334.1 0.6785 0.6773 +0.18197.8 388.1 0.5526 0.5515 +0.20230.0 446.0 0.4531 0.4552 -0.46256.6 493.9 0.3907 0.3951 -1.11
a/ Reference data taken from American Petroleum Institute tabulations(Ref. 4).
24
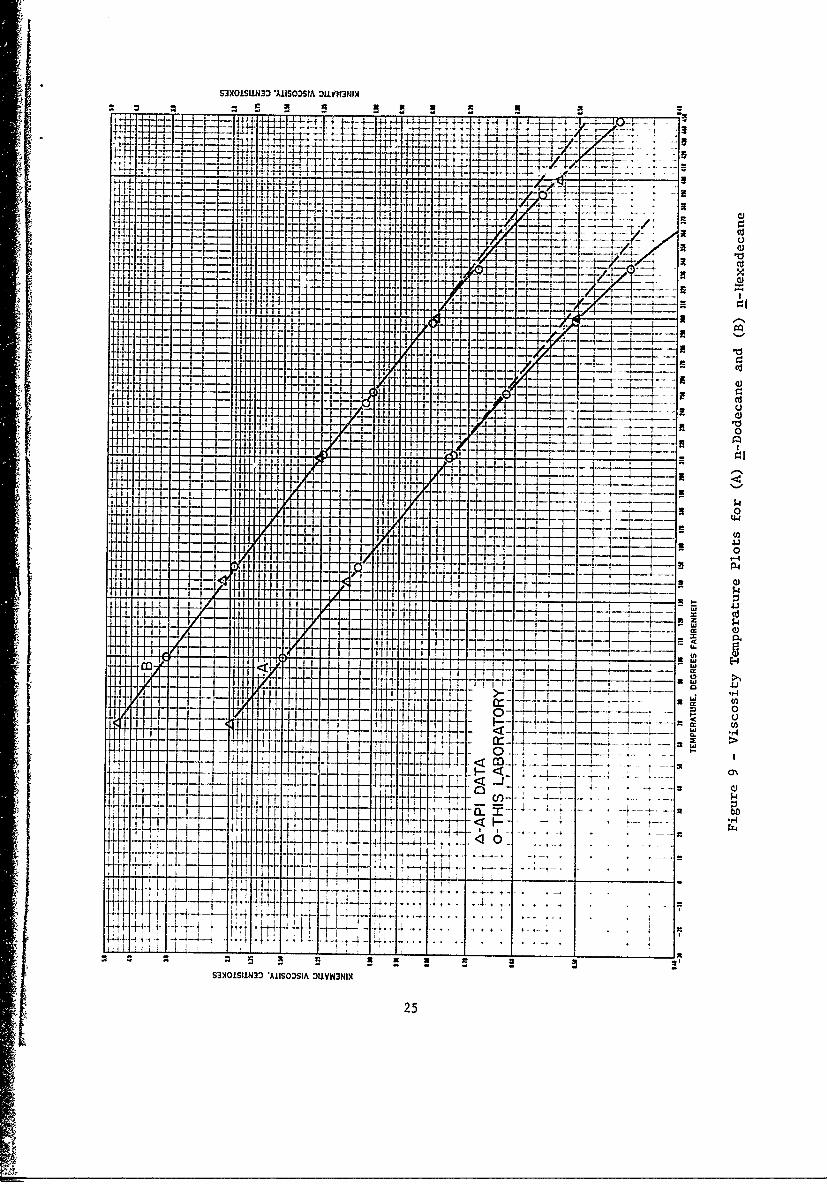
S3XO1SfLfLN A1tiSOOSIA :I±VY13NIN
* 4-4zL4L
-F- fz-4+ +
xd-1 -T -j
U-1
ao
'4j
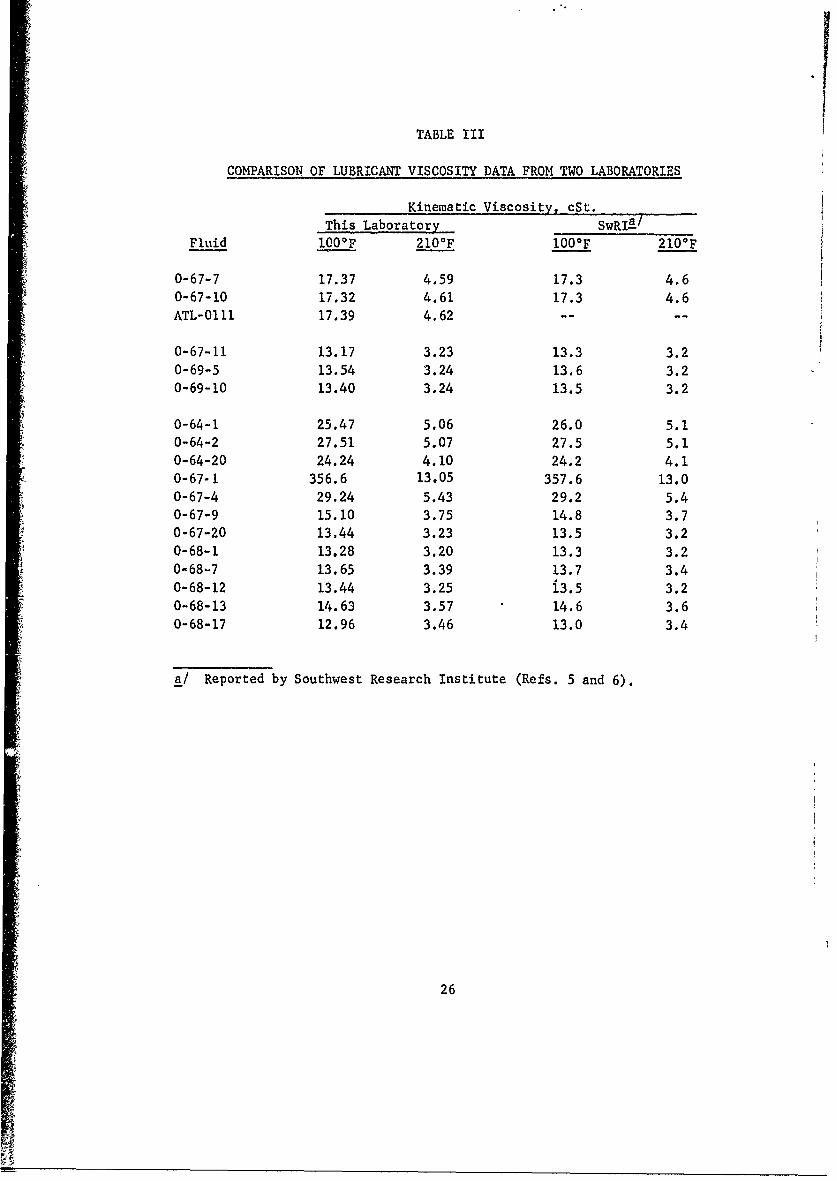
TABLE III
COMPARISON OF LUBRICANT VISCOSITY DATA FROM TWO LABORATORIES
Kinematic Viscosity, cSt.
This Laboratory SwRIR/Fluid WOO0F 210OF 100OF 210OF
0-67-7 17.37 4.59 17.3 4.60-67-10 17.32 4.61 17.3 4.6ATL-0111 17.39 4.62 --
0-67-11 13.17 3.23 13.3 3.20-69-5 13.54 3.24 13.6 3.20-69-10 13.40 3.24 13.5 3.2
0-64-1 25.47 5.06 26.0 5.10-64-2 27.51 5.07 27.5 5.10-64-20 24.24 4.10 24.2 4.10-67-1 356.6 13.05 357.6 13.00-67-4 29.24 5.43 29.2 5.40-67-9 15.10 3.75 14.8 3.70-67-20 13.44 3.23 13.5 3.20-68-1 13.28 3.20 13.3 3.20-68-7 13.65 3.39 13.7 3.40-68-12 13.44 3.25 i3.5 3.20-68-13 14.63 3.57 14.6 3.60-68-17 12.96 3.46 13.0 3.4
A/ Reported by Southwest Research Institute (Refs. 5 and 6).
26
The parameters A , B , and C were found by least-squares analysis of
the experimental data and are characteristic of each fluid. This empirical
relationship will be discussed at length in a subsequent section. At
present, however, it may be pointed out that the formula provides a veryconvenient method for tabulating viscosity data: the viscosity of each
fluid can be accurately described over the entire temperature range of in-
terest simply by tabulating the three empirical parameters.
A summary of all the viscosity data for 30 fluids is presented in thismanner in Table IV. The three parameters A , B , and C were computed by
least-squares treatment to give the best fit of the empirical formula to
the available data. The parameters were then used to check the agreement
of the formula with the experimental results obtained at each temperature.
This agreement is indicated by the tabulated average error, which representsthe average difference between the calculated and observed viscosity values
over the entire temperature range covered.
The lowest temperature at which each lubricant was studied was 100*F,
and the highest temperature is governed by the range of interest or bythe thermal stability limits of the fluids under test. Each lubricant was
tested to at least 470°F, and for two fluids (the aromatic ether formula-
tions 0-64-20 and 0-67-0) it was possible to obtain data at 700*F. Appar-ently, some batch variations have an appreciable effect upon thermal sta-
bility, since we were unable to study lubricant 0-67-14, a different batch
of 0-64-20, above 640F because of thermal degradation. Once again, the
highest temperature at which a repeatable viscosity measurement can be made
is a potentially useful indicator of the thermal stability of a lubricant,and may prove valuable as a quality control procedure.
The viscosity data for the 30 lubricants are also shown graphically
on ASTM standard viscosity-temperature charts (Appendix B, Figures 10-39).It will be noted that for n-dodecane and n-hexadecane (Figure 9), and allexcept two of the synthetic lubricants, these plots exhibit an appreciable
deviation from linearity above about 3000 F. Lubricant 0-70-10 yields a
plot that does remain linear nearly to 400*F, and the plot for 0-67-0 is
linear up to about 550°F. For the remaining fluids, the departure fromlinearity is quite apparent. This observation has been well documentedfor numerous fluids (Refs. 3, 7-10) and will be discussed in a later section.
The ASTM plots do serve to demonstrate that serious errors can be intro-duced if one attempts to obtain high-temperature viscosity data by linear
extrapolation from the low-temperature region. The magnitude of these
errors can be seen from the data in Table V. Here, data are taken from the
experimentally determined curves at 400, 450', and 500*F and compared with
values found by extrapolation from the low temperature range. The extrapolatedvalues are consistently high, and are typicall in error by 5-7% at 400°F;
the error is much greater (13.3%) for the silicone formulation, MLO-62-1014.
27

TABLE IV
CONDENSED SUMMARY OF EXPERIMENTAL VISCOSITY DATAR/
Lubricant Temp. Avg. /
Designation Range, 0F A B C Error, %
MIL-L-23699 Type
0-64-2 300-610 11.534353 -1.907612 58.776659 1.10
MIL-L-27502 Type
0-64-1 100-495 11.366448 -1.864857 47.332990 1.15
0-67-4 100-494 12.253875 -2.009232 38.905601 1.15
0-69-17 100-490 11.443835 -1.884784 58.007137 1.02
0-69-19 100-496 12.042183 -1.979777 46.261125 1.16
0-70-6 100-494 11.856084 -1.950287 50.410987 1.13
0-70-10 100-640 11.531669 -1.866362 64.721497 0.75
ATL-0232 100-494 12,166680 -1.987385 54.314271 1.32
ATL-0233 100-494 11.765916 -1.936922 47.281775 1.12
MIL-L-7808 Type
0-65-12 100-496 10.820990 -1.787246 12.312006 0.52
0-67-7 100-481 11.31055 -1.823988 -6.199840 0.79
0-67-9 100-472 10.709504 -1.770271 15.762447 0.38
0-67-10 100-473 11.678310 -1.883163 -15.511216 0.440-67-11 100-477 10.469727 -1.757046 20.548692 0.59
0-67-20 100-473 10.447095 -1.754768 23.950040 0.96
0-68-1 100-470 10.862931 -1.821366 11.676358 0.92
0-68-7 100-475 10.272879 -1.717429 26.110381 0.77
0-68-12 100-474 10.457889 -1.756447 23.768388 0.85
0-68-13 100-476 10.759987 -1.788088 16.412220 0.62
0-68-17 100-485 10.663416 -1.765661 3.404563 0.49
0-69-5 100-475 10.293345 -1.729305 27.874613 0.61
0-69-10 100-473 10.344491 -1.738687 25.850662 0.36
0-70-2 100-493 10.926274 -1.799790 0.212420 0.39
0-70-7 100-495 10.612980 -1.756291 2.325958 0.35
ATL-0111 100-495 12.208953 -1.970166 -28.532332 0.93
Ether Type
0-64-20 100-700 9.321819 -1.574463 106.475068 2.690-67-0 100-700 6.988602 -1.233027 455.059917 0.53
0-67-1 100-595 6.978324 -1.232910 459.190319 0.53
0-67-14 100-640 8.746667 -1.491882 134.143#90 0.99
Silicone Type
MLO-62-1014 100-495 16.199727 -2.400695 -129.898433 0.91
a/ Fitting by least squares analysis of experimental data to the formC
loge v = A + B loge t + C *b/ Average difference between actual experimental data and values from
least-squares parametric equation.
28

It~
410
. w
0 %.D 0 %0 t I m r44w
0. . IniS...C C ; r4C P-4
:j004 CL0
E-4 0 4
1-44 4-,) 0
0, co 00 00 r - .0 3 C )4
$4 + +I + + 4 + + +v+ ++ -
0
4.1
-'4 M
0 CJ0(I 0In 0 4- m - - m % .
<T ow m In0 r w0 4I mI
.) >0 0C; ~ ~ ~ ~ ~ -14C C ; ;C.C 4
4J. 10
-4 ~ ~ ~ ~ ~ - 00 - r r 0 r y
X -4i
a0
04 <- pl r-4 It 00 %D tD %D -.T 0 ~ I,C4 0. 4J In .0 N '0 C: '0 -4 '0) '0 0. ro 0
a to P Qa a I I a a0 W I Co oo oio o4
0 29

IAt higher temperatures, of course, the error is increased, and the extrapo-lated values at 500'F are typically 10-15% too high. Again, the error for
MLO-62-1014 at 500*F is quite large (29.6%).
D. Variation of Viscosity with Temperature
The data in Appendix A have been fitted to a modification of a formula
first proposed by Hovorka, Lankelma, and Stanford (Ref. 11). The formulaused in treating the present set of viscosity results is a three-term para-
metric equation:
loge v = A + B loge t + C/t
where v is the kinematic viscosity at O0F , and A , B , and C are
parameters characteristic of each fluid.
A least-squares technique was used to fit the experimental results.The summary in Table IV presents the best values for the parameters A ,
B , C for each fluid over the entire temperature range covered, along
with the average difference between the actual experimental values and
those computed using the least-squares parameters. These results indicatethat it is possible, on the average, to calculate fluid viscosities from
three experimentally determined parameters to well within 2% of the mea-
sured viscosities. In only one case (lubricant 0-64-20) was the fit poor
enough to yield an expected error greater than 2%. The use of a parametricequation, such as that used here for reporting viscosity data, will bediscussed at length in a subsequent section.
E. Analysis of Experimental Precision
The standard ASTM D445 test method for kinematic viscosity specifies
that different results obtained by the same operator are acceptable if
their spread is less than 0.35% of their mean value. Data reported by twodifferent laboratories should not differ by more than 0.70% of their mean
value. All of the determinations made in this laboratory are well within
the 0.35% repeatability limit, and the results listed in Table III revealthat data from two independent laboratories agree consistently within the
0.70% reproducibility limit as well.
However, in order to evaluate the immediate and long-term reliabilityof the viscosity determinations reported here, it is necessary to perform
a statistical analysis of the data. A parallel program was therefore carried
30
out in which several operators made viscosity measurements on threesynthetic lubricants at random intervals over a period of 11 months. The
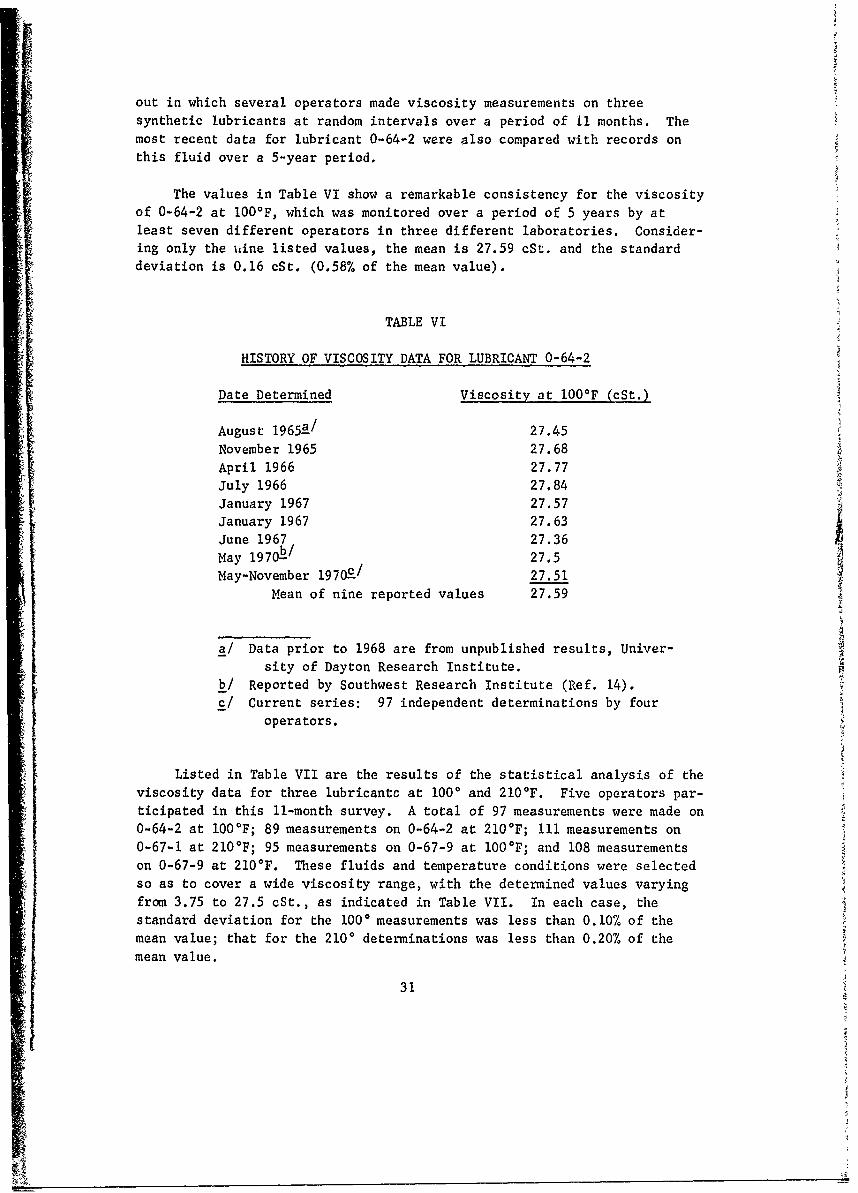
most recent data for lubricant 0-64-2 were also compared with records onthis fluid over a 5-year period.
The values in Table VI show a remarkable consistency for the viscosityof 0-64-2 at 1000 F, which was monitored over a period of 5 years by at
least seven different operators in three different laboratories. Consider-ing only the uine listed values, the mean is 27.59 cSt. and the standarddeviation is 0.16 cSt. (0.58% of the mean value).
TABLE VI
HISTORY OF VISCOSITY DATA FOR LUBRICANT 0-64-2
Date Determined Viscosity at 100OF (cSt.)
August 1965a / 27.45
November 1965 27.68
April 1966 27.77July 1966 27.84January 1967 27.57January 1967 27.63
June 1967 27.36
May 1970 b / 27.5May-November 197CO1 27.51
Mean of nine reported values 27.59
a/ Data prior to 1968 are from unpublished results, Univer-sity of Dayton Research Institute.
b/ Reported by Southwest Research Institute (Ref. 14).
c/ Current series: 97 independent determinations by fouroperators.
Listed in Table VII are the results of the statistical analysis of the
viscosity data for three lubricantc at 1000 and 210*F. Five operators par-ticipated in this 11-month survey. A total of 97 measurements were made on
0-64-2 at 100*F; 89 measurements on 0-64-2 at 2100 F; Ill measurements on0-67-1 at 2100 F; 95 measurements on 0-67-9 at 100*F; and 108 measurements
on 0-67-9 at 210*F. These fluids and temperature conditions were selected
so as to cover a wide viscosity range, with the determined values varying
from 3.75 to 27.5 cSt., as indicated in Table VII. In each case, the
standard deviation for the 1000 measurements was less than 0.10% of themean value; that for the 2100 determinations was less than 0.20% of the
mean value.
31
--

InI44 0 0 0 00 0
c;~ 0 ; 0 0 0
-4
1r< 00 O L
o b 0t0 0o 4)
z l 4 4 C) C4 -- r
o- cn a
H '-1
E-4 1 N
cO LA r4 L
Z4 4),4 N 0- N ,:
M -4
a)4)
E-4 PQ 0
0 - 44 4)
1:4 cl4 LA 0 v4
H > a%- N L LA CA C1
E- N a)'-ZC
E-4 44 (0
CL)4
C..I
E- 1-4 C4 *
ca
N Cl a 4 V
44 -4 '- 01
4)~I '4 N 32
These results can be summarized as follows:
* At 1000 F, we are 95% confident that a viscosity value reportedby any of the five operators will be within 0.20% of the value that would
be reported by the entire group.
* At 210*F, we are 95% confident that a viscosity value reported by
any of the five operators will agree to within 0.40% of the value that
would be reported by the entire group.
These studies were performed to confirm the reliability of the vis-
cometry technique at 1000 and 210*F. Although we r~a not have sufficient
data to carry out an equivalent evaluation at higher temperatures, we feel
that the technique and procedure described hare are capable of yielding
4 data of comparable validity over the entire range 100-7000 F. This belief
is based upon the following considerations: (1) temperature measurement
and control are uniform throughout the entire range; (2) the viscosity
measurement technique is the same over the entire range; (3) in practice,
the repeatibility of individual measurements is found to be comparable at
all temperatures; and (4) there has been no indication that any change in
the operation or performance of the apparatus occurs with changes in
temperature.
It should be noted that these results do not make reference to the
absolute accuracy of the data, since absolute values are not known for the
materials tested. Although the various thermometer and viscometer cali-
brations are traceable to the National Bureau of Standards, it is not pos-
sible to assign true values to the materials for comparison. Where we
have accepted the API reference data for n-dodecane and n-hexadecane as
absolute, the agreement has been excellent, and this comparison shows that
our efforts to eliminate or minimize sources of experimental error have been
satisfactory.
33
V.
SIGNIFICANCE OF RESULTS
A. Evaluation of Test Conditions and Apparatus
It has been demonstrated thaL unusually close temperature control isnecessary for precise viscosity measurements. The data in Table IV reveal
that the variation of viscosity with temperature for the synthetic lubri-
cants examined is typically on the order of 2.5% per degree at 100'F; 1.0%
per degree at 200'F; and 0.5% per degree at 400*F. At the higher tem-
peratures (above 300°F), less stringent controls can be employed, since atemperature fluctuation of O.1F results in a variation in viscosity of
less than 0.1%. However, at lower temperatures, close temperature control
becomes a critical factor. Since the apparatus described in Section IIIwas designed with the capability of minimizing experimental errors due to
temperature uncertainties, it is reasonable to apply it to yield the best
control possible.
Experience with the high-temperature viscometer facility describedin Section III has shown "t to be eminently suitable to the requirementsestablished for experimental precision. We are confident that errors due
to temperature fluctuations are minimal, since our measurements show a
tv ical temperature variation of less than + 0.030F over the entire cange300-7000 F.
The high-temperature capability of the apparatus has also met the700°F objective set forth at the beginning of this work. Thus, the limit-
ing factor in determining precise fluid viscosity data at high tempeiature
is the thermal stability of the fluid being studied.
B. Precision of Experimental Results
The statistical analysis of the viscosity data presented in Tables VIand VII and discussed in Section IV-E indicates that the experimental re-
sults are well within the conventional ± 0.35% repeatability limits. Good
repeatability, as well as reproducibility, is supported by the results
listed in Table III for measurements on replicate lubricant samples by
different laboratories.
As stated previously, the viscosity data for synthetic lubricants
cannoL be evaluated in terms of their absolute accuracy, inasmuch as "true"values are not available for comparison. However, every aspect of the ex-perimental procedure was tested in the measurement of the viscosities of
34
0
n-dodecane and n-hexadecane. Generally, excellent agreement was obtained
when the results were compared with the best available reference data, as
shown in Table II. If we accept the API reference data as absolute, then
the agreement shown in Table II indicates that this laboratory is capable
of producing data that are accurate to within ± 0.40%.
C. The Viscosity-Temperature Relationship
When physical property data are reported over a range of temperatures,
it is customary to express the property-temperature relationship in a
condensed analytical form. Density, for example, is commonly reported in
the form
p a + (t - to) + y(t - to)
where a is the density at some reference temperature to , and * and
y are parameters characteristic of the material. If the data are very
precise, or ii they cover a wide temperature range, it may be necessaryt3
to add higher terms, such as 6(t - t), to describe the data adequately.
The density-temperature function is relatively simple, and one that
the experimenter can deduce easily from his data. Other properties may4 vary with temperature in more complex ways, but usually the proper relation-ship is not too difficult to deduce. One may find, for example, that his
property changes according to a Boltzmann-type function: log Q = k/T + C,where _ is the measured property (vapor pressure, chemical reaction rate,
etc.), T is the absolute temperature, and k is a proportionality con-
stant giving additional information about the system (heat of vaporization,
activation energy etc.).
Analytical descriptions of experimental data have great utility, sincethey enable one to calculate a desired property at any reasonable tempera-
ture without recourse to graphical interpolation or extrapolation. Their
success depends, however, upon the ability of the experimenter to fit his
data to an equation from which values can be computed with a precision ap-
proximating that of his experimental method. (Often, in fact, it happens
that statistical analysis, such as a least-squares treatment of the data,
leads to higher precision than the experimental technique because it tends
to smooth out the effects of random errors in individual data points.)
35
$
Many workers have attempted, unsuccessfully, for many years to developmathematical expressions that are generally applicable for describing the
manner in which the viscosities of real fluids vary with temperature. In
principle, one can use the methods of fluid mechanics, statistical mechanics,
or even quantum mechanics to calculate any desired fluid property and todefine its variation with temperature. These methods involve the solution
of certain equations containing various intermolecular energy terms. A
strictly rigorous approach takes into account all known intermolecular
forces (dipole-dipole interactions, ionic forces, hydrogen 'onding, London
dispersion forces, T, bonding, van der Waals interactions, etc.), and makes
no prior assumptions about what the actual structure of the liquid might
be (Refs. 12, 13). Unfortunately, under these conditions the equations
cannot be solved for real systems except by approximate methods.
A semi-empirical approach has the advantage that certain simplifying
approximations are made at the outset about the structure and nature of
the liquid, so that a complete mathematical solution becomes possible,
and approximations can then be made of the physical properties of interest.
This technique has been widely developed by Eyring in his significant struc-
ture theory of liquids (Refs. 14-16). Eyring has been able to make some
remarkably accurate predictions of certain thermodynamic properties (heat
capacity, molar volume, entropy of fusion, critical temperature, vapor pres-
sure, etc.). However, this success has been limited to relatively simple
systems, such as condensed noble gases, halogens, o- and i-hydrogen, and
methane. Because of the simplifying assumptions, the theory lacks the
refinement needed for dealing accurately with the viscosities of more com-
plex materials, and particularly complex mixtures.
Thus, the rigorous mathematical approach has the intellectual appeal
of mathematical elegance, but is not amenable to unique solutions describ-
ing the nature of real fluids. Conversely, the semi-empirical model
method is conceptually simple and straightforward, but the built-in assump-
tions and approximations lead to a sacrifice in both the accuracy and pre-
cision needed for predicting viscosity values.
For further details on the theoretical and semi-empirical treatments
of fluid viscosity, the reader is particularly referred to the excellent
and highly entertaining review by Brush (Ref. 13). In addition to a candid
summary of the advantages and disadvantages of the two approaches, Brush
presents a discussion of the totally empirical method, in which the mathe-
matical analysis of viscosity data need have no basis in theory at all.
The purpose here is simply to fit observed data to workable formulas,
Numerous functions are tabulated, which various authors have proposed for
fitting their viscosity-temperature data. Siilar series of such formulas
have been tabulated by Partington (Ref. 17) and by Doolittle (Ref. 18).
Although Brush warns against attaching any theoretical significance to these
. i36
"monstrous" functions, still they do have great practical usefulness if
they fit the experimental data accurately enough and are convenient to
handle.
Many of the formulas cited by Brush, Partington, and Doolittle involvelogarithmic and/or power-series expansions in temperature, and many are
merely variations on Andrade's (Ref. 19) strictly Boltzmann-type viscosity-
temperature relationship. It is true that, over limited temperature ranges,
relationships such as Andrade's (log V = K/T + C) may be valid. However,
very few of the proposed relationships appear to have universal applicabil-
ity, i.e., the ability to fit the available data with good precision oversubstantial regions of the liquid ranges of different classes of fluids.
Noteworthy by its absence from the literature tabulations is the
formula mentioned previously for fitting the data for n-dodecane and n-hexadecane:
loge ..OO a(t -100) + b(t - 100)2
Vt c + t
where vo0 0 is the (kinematic) viscosity at 1000 F, yt is the viscosityat temperature t (*F), and a , b , and c are characteristic parameters.
This general form fits the available data for paraffins very well, but its
precision decreases somewhat as the temperature range is extended. It hasbeen used by Cannon Instrument Company for defining the viscosity behavior
of the ASTM calibrating fluids over the temperature range 68 - 150'F with
a maximum error 0.16% (Ref. 2). Surprisingly, this same formula is appliedby the National Bureau of Standards to the standard reference data for
water--a most dissimilar fluid indeed--with a maximum error of 0.1% over
the range 20-75*C, and a maximum error of 0.16% up to 1500 C (Refs. 20-22).
We have found that a formula first proposed by Hovorka, Lankelma, andStanford (Ref. ii) does adequately describe the viscosity-temperature re-
lationship of the synthetic lubricants studied here. Entirely empirical,it follows closely the observed variation of viscosity with temperature
c ,er the entire temperature range studied. The formula is a three-term
parametric equation,
loge v = A + B loge t + C/t
where in our analysis v is kinematic viscosity, t is the test tempera-
ture in °F, and A B and C are constants to be evaluated for each
fluid.
37

The complete set of experimental data given in Appendix A was pro-cessed by a least-squares analysis to give the best values of A , B , and
C listed in Table IV. These values for each fluid were then used to cal-culate corresponding viscosity values at each temperature studied. Thisprocedure provides an estimate of the agreement of the formula with the
experimental data; the average difference for each set of data, also shown
in Table IV, is consistent over the entire temperature range in all cases,indicating that the three-parameter equation faithfully describes theshape of the viscosity-temperature curve.
The results given in Table IV reveal that the curve-fitting process
is more successful for certain classes of fluids than for others. Forexample, use of the known parameters for a MIL-L-7808 fluid can be ex-pected to yield a calculated viscosity value that is within 1% of theexperimentally determined value at any temperature between 1000 and 500'F.
The agreement is only slightly poorer for the MIL-L-23699, MIL-L-27502,ether, and silicone formulations: only with lubricant 0-64-20 is the
average difference between the calculated and observed values greaterthan 2%.
It is felt that this precision is adequate for most practical appli-cations, and certainly the format for reporting viscosity data by meansof three characteristic parameters offers great convenience. For example,one can readily compute a desired viscosity at any temperature within the
reported range by performing the algebraic operations required by the modi-
fied Hovorka-Lankelma-Stanford formula. This task is particularly easyif one has access to a desk calculator having single-stroke logex and ex
functions. The calculated values are, furthermore, more precise than thoseAthat might be obtained by extrapolation or interpolation from tabular or
graphical presentations of the data.
An added advantage of this viscosity-temperature formula, which becameapparent upon examination of the standard ASTM viscosity-temperature plotsfor the 30 lubricants studied, is that it predicts deviations of theseplots from linearity below 100°F as well as above 300'F. Examination of
the ASTM plots (Figures 10-39) reveals that in nearly every case the be-havior is far from linear. If one estimates a lubricant viscosity at 5000 F,
for example, by linear extrapolation from the data points at 100°F and
210'F on an ASTM chart, the estimate is likely to be at least 10% too high
(see Table V), whereas calculated values using the parametric equation arelikely to be well within 2% of the experimentally determined values.
Similarly, close examination shows that viscosity data plotted on the
ASTN chart tend to deviate upwar at temperatures below 100°F. This trend
is also predicted by the parametric equation.
38
A single, and valid, objection to the use of a parametric equationof the form used here is that it does not yield a defined value at 00F,
i.e., a viscosity value cannot be calculated at 00F because the mathemati-cal functions are undefined at that temperature. Furthermore, the formulapredicts that the viscosity of the fluid should pass through a maximum at
t = C/B , an effect that is not observed with real fluids. However, formost of the fluids studied here the ratio C/B is negative, and the functiondoes not have algebraically real values for negative values of t . In
any event, for the four cases where C/B is positive, the quotient is small(less than 150), and the falsely predicted viscosity maxima are far enough
removed from the temperature region of interest that the agreement betweenthe calculated data and the values obtained in practice is not affected.
In summary, we find numerous advantages in terms of convenience andprecision in the use of the three-parameter viscosity-temperature function
for describing the observed variation of lubricant viscosity with tem-peratures above 100*F. There are valid objections to its use on purelymathematical grounds, but it is not intended to be used under conditionswhere the stated mathematical and physical difficulties would occur.
39
'1 t
j.1
VI.
CONCLUSIONS AND RECOMMENDATIONS
The procedure described in this report has been shown to be successfulfor determining fluid viscosity data with excellent precision within theentire temperature range 100*-700'F. Temperature control and measurementcapabilities are uniform throughout this entire temperature range, andmeet accepted standards for viscosity Measurement. From the results listedin Table VII, we calculate that the repeatability of our technique is onthe order of ± 0.30%.
Conventional methods for reporting and analyzing viscosity data below300'F are inadequate to predict viscosity values accurately at highertemperatures. It has been shown that linear extrapolation of data plottedon standard viscosity-temperature charts may introduce errors as greatas 12-15% for two classes of synthetic lubricants at 500*F. A formula hasbeen examined, however, and has been found successful in expressing theviscosity-temperature relationship faithfully at temperatures above 100'F.By summarizirg a complete set of viscosity data for a fluid lubricant bymeans of three experimentally determined parameters, it is possible tocompute viscosity values that are well within 2% of the expe':imental valuesthroughout the entire temperature range of interest.
This capability for reporting and computing reliable viscosity valuesat high temperatures requires that the characteristic parameters in theviscosity-temperature formula be determined by a series of careful experi-mental measurements over a wide temperature range. The high-temperatureviscometry facility described in this report provides a means for obtainingthe necessary data.
Knowledge of lubricant viscosity in a high-temperature environmentis essential for a viable analysis of the effect of lubricant behavior uponthe performance of mechanical parts and assemblies. It is therefore recom-mended that this direct experimental determination of fluid lubricant vis-cosity above 3000F be adopted as an integral part of a complete lubricantevaluation program.
The experimental facility developed for this work admittedly incor-porates stringent controls and requirements that were considered necessaryfor proving the feasibility of, and indeed the need for, the experimentaltechnique, but which may yield more highly refined and precise data thanare required in engineering practice. It is therefore further recommendedthat a review of the viscometry facility be undertaken in an effort toeliminate unnecessary refinements. For example, in practice it is found
40
.1i
4 that temperature control and measurement to within ± 0.10 may be adequate
for viscosity determinations above about 250*F. This precision is withinthe capability of some thermistor and thermocouple systems, which are far
less costly than the high-precision platinum resistance thermometric tech-
nique used here. By providing adequate precision under more economically
favorable terms, it may be possible to bring the high-temperature lubricantviscometry within the scope of any testing laboratory.
A
S41
4
F$
APPENDIX A
VISCOSITIES OF SYNTHETIC LUBRICANTS
))
Preceding page blank
43
Temperature viscosity Temperature Viscosity __2perature Vitcosity
MluIA T. *C T. (cst.) LUd T. OC T. F (cst.) Fluid T. eC . e icst.
0-64-1 37.8 100.0 25.47 0-.65-12 197.7 387.8 1.223 0-67-7 120.0 245.0 3.430
60.3 140.5 12.33 (Conc.) 230.1 446.3 0.949 (Conc.) 120.7 249.1 3.360
98.9 210.0 5.057 257.6 495.6 0.783 134.3 273.8 2.876
127.6 261.7 3.164 141.4 284.5 2.640
143.3 289.9 2.580 0-67-0 37.8 100.0 346.4 157.5 315.4 2.262
176.8 350.3 1.762 60.3 140.5 63.55 169.3 33,.I 1.971
196.6 358.5 1.454 81.9 179.4 23.02 173.0 343.3 1.907
229.1 444.3 1.112 98.9 210.0 12.93 180.3 356.5 1.776
256.9 494.4 0.911 115.5 239.9 8.430 187.8 370.0 1.691120.0 248.1 7.554 210.0 410.0 1.408
0-64-2 37.8 100.0 27.51 120.9 249.7 7.415 218.2 424.7 1.308
60.3 140.5 12.83 130.1 266.2 6.093 249.6 481.2 1.008
81.9 179.4 7.299 147.7 297.8 4.406
98.9 210.0 5.066 163.4 326.2 3.463 0-67-9 37.8 100.0 15.10
114.9 238.7 3.792 176.9 350.5 2.898 98.9 210.0 3.749
115.6 240.1 3.774 195.8 384.5 2.291 134.6 274.3 2.274
125.8 238.4 3.170 229.2 444.6 1.638 144.4 292.0 2.029
130.1 266.2 2.994 232.2 449.9 1.594 153.2 307.8 1.864
146.6 296.0 2.368 256.5 493.7 1.298 164.9 328.9 1.649
157.0 314.7 2.074 287.9 550.3 1.037 168.9 336.1 1.588
160.2 320.4 1.998 304.5 580.1 0.927 182.2 360.0 1.393
200.0 392.0 1.339 320.8 609.5 0.839 211.1 412.0 1.097
227.4 441.4 1.056 338.0 640.4 0.766 235.7 456.3 0.911
241.8 467.3 0.935 354.5 670.0 0.699 244.4 471.8 0.851
251.9 485.5 0.871 370.9 699.7 0.645
257.0 494.6 0.846 0-67-10 37.8 100.0 17.32
287.8 550.0 0.674 0-67-1 37.8 100.0 356.6 98.9 210.0 4.611
304.5 580.0 0.608 60.3 140.5 64.63 134.6 274.4 2.852
321.1 610.1 0.549 81.9 179.4 23.15 153.6 308.5 2.320
98.9 210.0 13.05 165.6 330.0 2.039
0-64-20 37.8 100.0 24.24 115.5 239.9 8.450 227.0 440.1 1.204
65.6 150,1 8.843 123.3 253.9 7.144 244.8 472.6 1.041
81.9 179.4 5.833 130.1 266.2 6.172
98.9 210.0 4.099 137.5 279.5 5.370 0-67-11 37.8 100.0 13.17115.5 239.9 3.080 160.4 320.7 3.656 66.0 150.8 6.103
120.0 248.0 2.859 168.7 335.7 3.245 98.9 210.0 3.232
130.1 266.2 2.476 173.4 344.2 3.040 '35.0 275.0 1.94-
147.6 297.6 1.990 198.6 389.4 2.237 163.4 326.3 1.433
165.6 330.0 1.612 213.5 416.3 1.914 211.8 413.2 0.937
175.5 349.6 1.457 239.5 463.0 1.499 247.3 477.2 0.728
177.0 350.6 1.454 287.5 549.6 1.028205.0 401.0 1.135 304.5 580.0 0.921 0-67-14 37.8 100.0 24.54210.0 410.0 1.083 312.7 594.8 0.874 65.6 150.2 8.926
229.6 445.3 0.939 81.9 179.4 5.863
232.1 449.8 0.930 0-67-4 37.8 100.0 29.24 98.9 210.0 4.118256.9 494.0 0.784 60.0 140.0 13.86 115.8 240.4 3.101
287.6 549.8 0.647 80.0 176.0 8.145 120.0 248.1 2.880
304.4 580.0 0.593 98.9 210.0 5.428 130.1 266.2 2.498
320.7 609.3 0.564 120.0 248.0 3.756 147.6 297.8 2.001
337.9 640.2 0.523 147.7 297.8 2.526 163.6 326.5 1.656354.1 669.4 0.490 176.9 350.5 1.789 166.5 331.8 1.616
371.2 700.2 0.464 196.7 386.1 1.461 176.6 349.8 1.462
229.7 445.5 1.098 201.2 394.1 1.171
0-65-12 37.8 100.0 14.99 256.7 494.0 0.891 229.1 444.3 0.953
60.2 140.4 8.061 232.2 450.0 0.936
98.9 210.0 3.728 0-67-7 37.8 100.0 17.37 246.1 475.0 0.851
120.0 248.1 2.752 98.9 210.0 4.585 256.5 493.7 0.797
166.4 331.6 1.618 114.3 237.8 3.692 287.7 549.9 0.650
44
i4
Temoerature Viscosity Temperature Viscosity Temperature V1s*coityTlui -C T. -F (cSt.) ZLUid T, OC '. OF -(Cstx) FitId T, *C *F 'S.
0-67-14(Cone.) 304.6 580.3 0.594 0-68-17 98.9 210.0 3.462 3-69-19 230.1 446.2 1.0)85
320,1 609.9 0.552 (Conc.) 116.2 241.2 2.698 (Conc.) 257.5 495.6 0.887337.8 640.0 0.515 125.3 257.6 2.385
_7 130.9 267.6 2.232 0-70-2 37.8 100.0 13.990-67-20 37.8 100.0 13.44 137.1 278.0 2.074 65.6 150.0 6.773
66.0 150.8 6.197 142.1 287.7 1.966 82.2 180.0 4.88898.9 210.0 3.230 147.4 297.4 1.851 98.9 210.0 3.669
121.0 249.8 2.377 149.5 301.1 1.811 115.6 240.0 2.896134.6 274.2 1.948 150.8 303.5 1.789 132.2 270.0 2.327160.5 320.9 1.471 155.3 315.1 1.673 148.9 300.0 1.928175.1 347.1 1.280 161.7 323.0 1.613 162.8 325.0 1.677219.7 427.5 0.885 166.3 331.3 1.535 176.7 350.0 1.466244.8 472.6 0.740 168.9 336.0 1.490 193.3 380.0 1.271
188.5 371.3 1.260 210.0 410.0 1.110-68-1 37.8 100.0 13.28 207.8 406.1 1.077 276.7 440.1 0.979
60.0 140.0 7.069 217.0 422.6 0.999 243.3 470.0 0.86465.0 149.0 6.261 232.3 450.2 0.898 256.2 493.2 0.78598.9 210.0 3.202 251.6 484.9 0.772~~~~135.0 275.0 1.9840-06 7, I0. 2,9156.3 313.4 1.523 0-69-5 37.8 100.0 13.54 0-70-6 37.8 100.0 28.90156.3 33.4 1.83 80.0 176.0 4.588 65.6 150.0 11.55226.5 439.8 0.830 82.2 180.0 7.586243.2 469.7 0.725 98.9 210.0 3.243 98.9 210.0 b,321
120.0 248.0 2.378 11.6 240.0 321
0-68-7 37.8 100.0 1.65 168.2 334.8 1.367 13.2 20.0 3.40
60.3 140.5 7.300 227.2 441.0 0.847 148.9 300.0 2.42399.1 210.3 3.387 246.1 475.0 0.7372.047
128.3 262.9 2.221 0-69-10 37.8 100.0 13.40 176.7 350.1 1.760129.0 264.2 2.199 98.9 210.0 3.240 193.3 380.0 1.489134.6 274.3 2.059 135.0 275.0 1.950 210.0 410.0 1.277136.8 278.1 2.006 160.0 320.3 1.475 226.7 440.0 1.110164.0 327.2 1.494 226.9 440.4 0.839 243.3 470.0 0.974167.6 333.6 1.442 245.0 473.0 0.733 256.4 493.6 0.886167.9 334.2 1.439185.9 366.7 1.230 0-69-17 37.8 100.0 27.81 0-70-7 37.8 100.0 12.75218.0 424.4 0.950 60.0 140.0 13.17 65.6 150.0 6.266246.1 475.0 0.781 98.9 210.0 5.246 82.2 180.0 4.519
111.2 232.1 4.188 98.9 210.0 3.4280-68-12 37.8 100.0 13.44 120.0 248.0 3.616 115.6 240.0 2.704
60.0 140.1 7.132 134.0 273.2 2.920 132.2 270.0 2.18898.9 210.0 3.253 151.4 304.5 2.348 148.9 300.0 1.822
135.0 275.0 1.958 155.7 312.2 2.219 162.8 325.0 1.583158.2 316.8 1.501 159.3 318.8 2.122 176.7 350.0 1.393227.0 440.5 0.833 161.2 322.1 2.064 193.3 380.0 1.208245.7 474.3 0.738 165.8 330.4 1.965 210.0 410.0 1.060
186.9 368.4 1.588 226.7 440.0 0.9360-68-13 37.8 100.0 14.63 206.5 403.7 1.320 243.3 470.0 0.829
60.0 140.1 7.773 223.6 434.5 1.136 257.1 494.8 0.75280.0 176.0 5.040 241.7 467.1 0.98998.9 210.0 3.573 243.1 469.6 0.984 0-70-10 37.8 100.0 32.67120.0 148.0 2.622 254.4 490.0 0.908 98.9 210.0 5.936135.0 275.0 2.146 121.0 249.8 3.986175.4 347.6 1.410 0-69-19 37.8 100.0 29.24 132.2 270.0 3.361226.6 439.9 0.922 60.0 140.0 13.67 148.9 300.0 2.667246.8 476.3 0.796 98.9 210.0 5.374 162.7 324.9 2.247
120.0 248.0 3.654 176.6 350.0 1.9160-68-17 37.8 100.0 12.96 147.6 297.6 2.488 193 3 380.0 1.635
66.0 150.8 6.268 172.1 341.8 1.859 210.0 410.0 1.39577.0 170.5 5.029 197.4 387.4 1.440 226.4 43q.5 1.217
45
KO
'Tjvperature 'Viscosity Viscosity T ritre Visco ,ty
FlUd' T. Ar -(Cstid L.' .-T. C. - *z uldl C . .st_-
0-70-10 243;3 470.0 1.071 'LO-62-10i4 2S3.0 - 451.4 3;360' ATL-0232 176.7 -350.0 1.954
'(cont.)' 256.5 493.7; 0.968 (Conc.) -244;9. 472.8 3425li (Coiw. 193.3 3i-0 1.69
287.8 550-0 0.773 257.1 -494.7' 2.808' 210.0 410.0 1.405
-304.4 580.0 0.699 226.5 p439.6 1.223
321.1 610.0 0.633 ATL-0111 37.8 100. 17.39 243.3 4700 11072
337;8 640.0- 0.580 60.0 146.0 9.600 2 56s '493;7, 0.968
98.9 210.0 4.621
WL-62-1014 37.8, 100.0- 47.22 120.0 248'. 3.419 ATL-0233 37.8 100.0 27.22
65;6 150.1 26 87 147.6 297 6 2.448 65-6 150.0 11.06
81.9 179.4, 20.18 177.2 351.0 1.822 82.2 180.0 7;268
98.9 210.0 15.33" 230.2 446.4 1i43. 8.9. 2p.0 '5.161
.115.5 239.9' 12.29 257.1 494.7 6.9i3 115.6, -240.0, 3.842
129.4 265.0 10.17 132.2 270.0 2.95!.
130.1 266.2 10.09 ATl-0232' 37.8 -100.0' 34.52' 148.9. 300.0 2.363
156.0 302.O 7.95 65.6 150.0. 13.43 162.8 325.0 ,2.000
163.8 326.9 6.824 92.2 180.0 8.724 176.7 3500 1.723
174.1 345.3 6.056 98.9 210.0 6.10i 193.3 380t0 1 461
190.2 374.3 5.145 115.6 240.0 4.469 210.0 410.0 '1.256
195;3 383.6 4.866 132.2 270.0 3.409 227.0 440.6 1.088
213.4 416.1 4.099' 148.9 300.0' 2.703 243 3 470.0 0.660
217.4 423.4 3.973 160.0 320;1 2.353 250.6 493;8 0875
230.'4 446.7 3;533
46
APPENIX~ B
A$TH. VISCOSITY-TEHPERATURE PLOTS FORSYNTHETIC TURBINE, ENGINE 'LUBRICANTS*
,(Figure& 10 through 39)
47
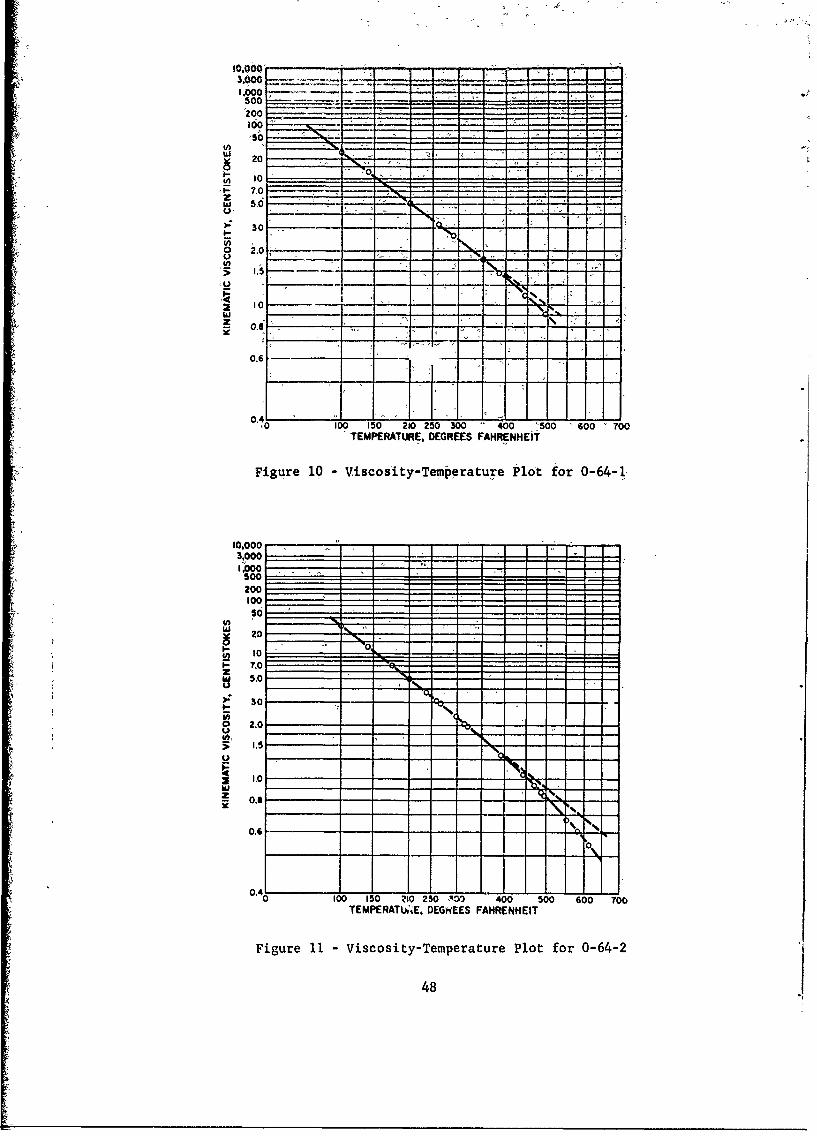
-00 7 --___z 0 _ _ - -
2 50
30
t
2 10w
;i0, -15 210 250 300 400 '500 600 'tOOTEMPERATURE, DEGREES FAHRENHEIT
Figure 10 -Viscosity-Ternoerature Plot for 0-64-1,
3!'00
200
S20
F 7.0z
o 2.0
0.-
0I%
0.0
0 100 150 ZI0 250 -'4a 400 500 600 TooTEMPERATb,;4E, DEGNEES FAHRENHEIT
Figure 11 - Viscosity-Temperature Plot for 0-64-2
48
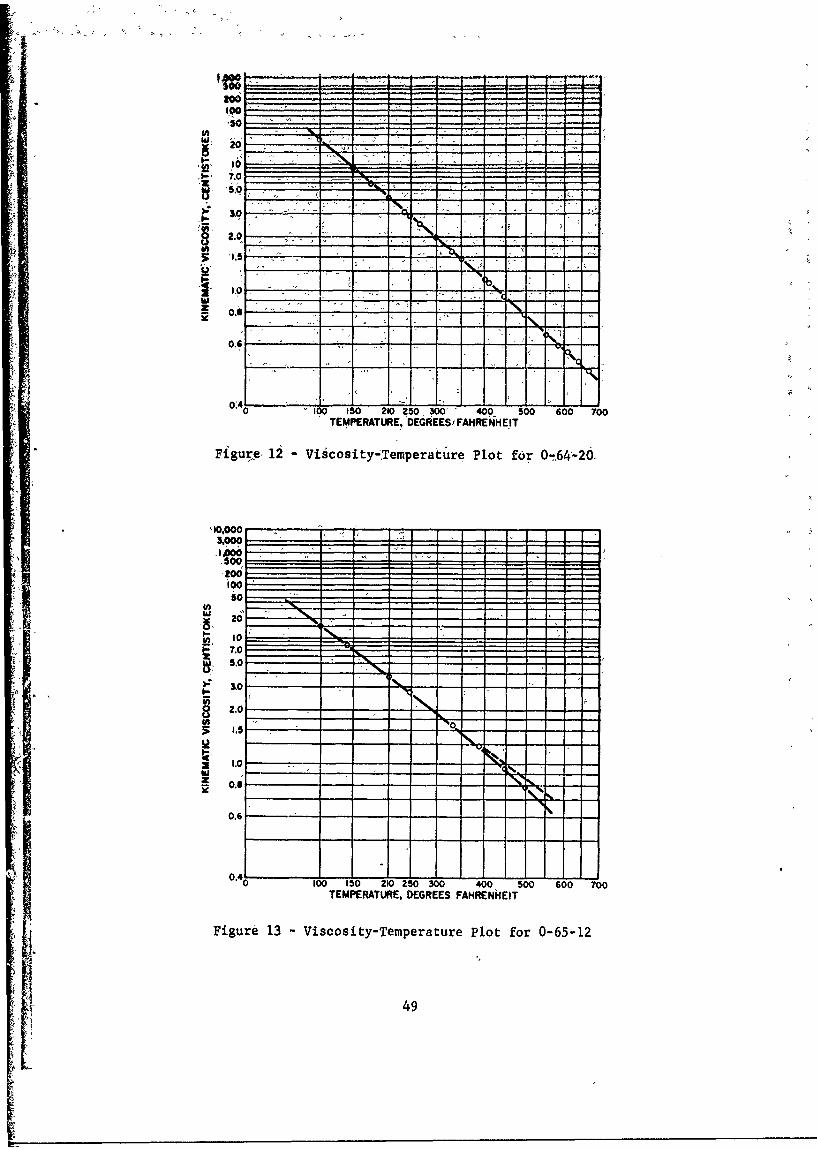
P-i
U,1
w
20
7.0
0.0
I-I
* 0 100 150 210 250300' 400 500 600 700TEMERAUR.'D~kESFAHRENH EIT
'1Figure,13 Viscosity-Temperature Plot for 0-!65'-120
'10,00493.0
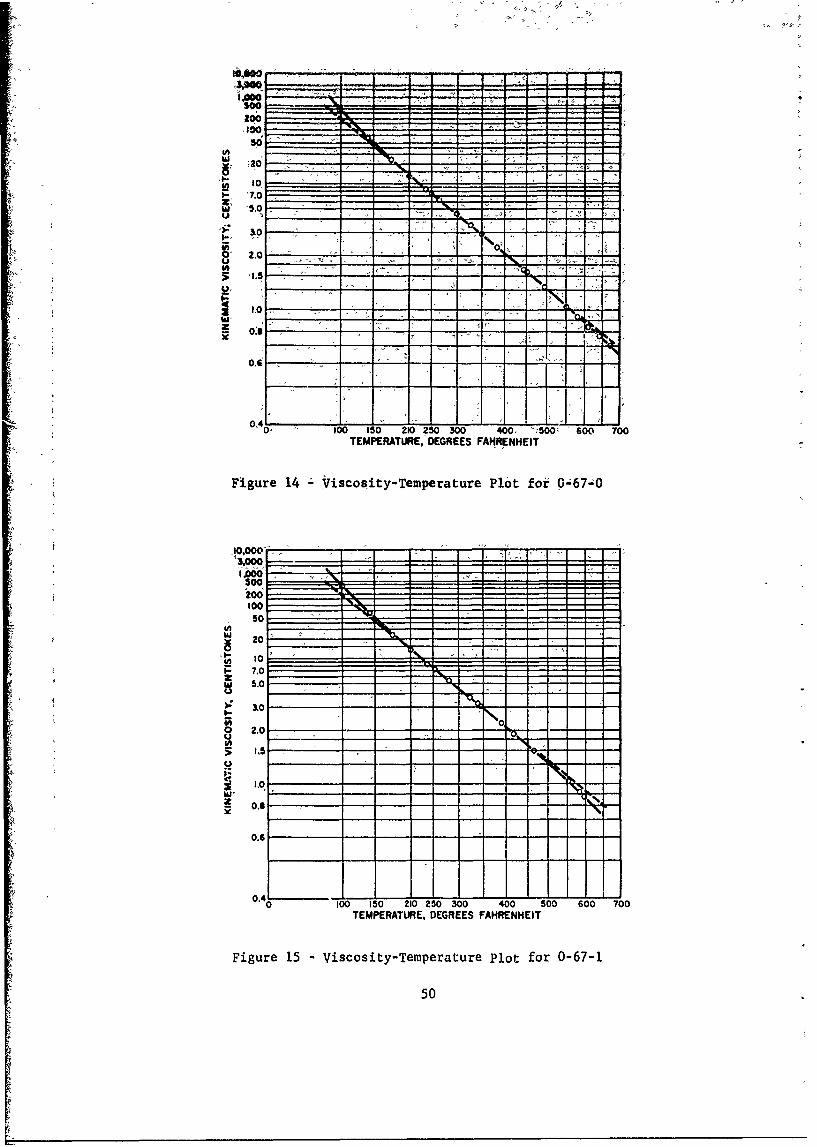
ha 5.cK7U _0 __
'100
1.0Z' I~
U4LFv
0.6
0! 0 100 150 210 250 300 400 -50c60 0
TEMPERATURE, DEGREES FAHRENHEIT
Figure 14 ;,Viscosity-Temperature Plot for 0-67-.0
10.000- - - - - - - - - - -
3,00011A
20
S10
w 2
Z 5.0
&00
0 2.0
OA
0.4 - jz
0 100 15 210 25 730 400 500 600 700
TEMPERATURE. DEGREES FAHRENHEIT
Figure 15 - Viscosity-Temperature plot for 0-67-1
50
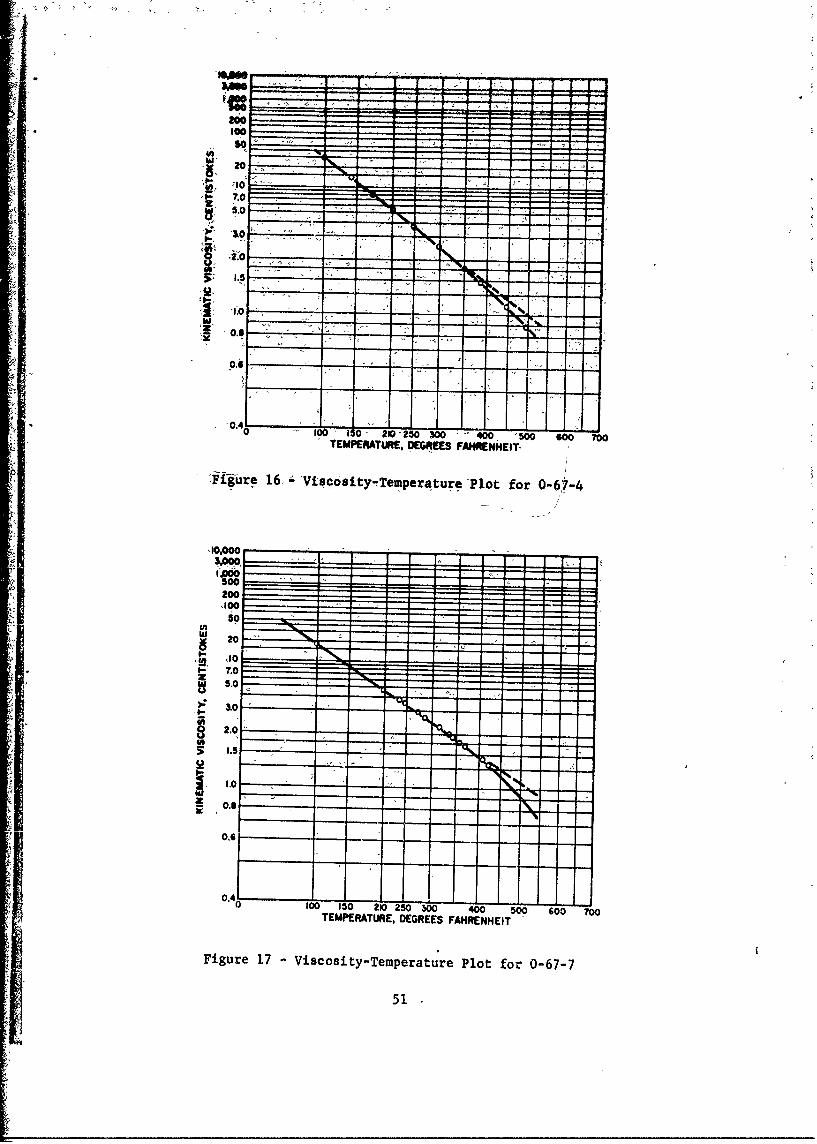
20
L 10 10 30 2 2 0 0
3- O
10
0.6
0.40 100 1 0 210'250 300 40 50 60 0TEMERTUR, EGEES FAHRENHEIT-
Figre 1, -Viscosity-Temperature -Plot for 0-67-
1151

100
io~
S 7.0
5.0
U _____
0-J0
100
500
200
100
2010
2 10lo
z _____
5.02
;z0
1.0
0
~~1.60:53
).

Sooi .... 200:_• I~00 ""
50 . ."
0) 10- 7.0
0- 2.00. 2.s - -_- -.- ."
IO -_ _I_
: ~o " 1,00 150 210 250 ; 300 -400 500 600 700
l, TEMPERATURE, DEGREES FAHRENHEIT"
Figure 22 - ViScosity-Temperature Plot for 0-67-20
LA
S10
z 0.0
0.003,000
5- .0 -
'j 20__7 1 71- .7..
5.0
30
0 2.0
10
0100) 150 210 250 300 400 500 '600 700
TEMPERATURE, DEGREES FAHRENHEIT
Figure 23 -Viscosity-Temperature Plot for 0-68-1 "
54

so
W 5.0'
1 .5- - - - - -
22
0.6j_ _ _
0.4 0'100 150 210 250 300 '400 500 600 '7001' TEMPERATURE. DEGREES FAHRENHEIT
Figure 24 -Viscosity-Temperature Plot for 0-68-7
10,0003,000
too
w 20 -
* 10
w 5.0
30- -0
U)
0.46oos
15 210 250 300 400 500 600 700TEMPERATURE, DEGREES FAHRENHEIT
Figure 25 -Viscosity-Temperature Plot for 0-68-12
55
10.000
3,
20q
S 100
w
; 0 0 520200 40 50 60 70
,00
500
04
01.0500 __ _- - -
200 _ __
5 1.0- -
556
w50
o 20 -
300
0 2- ---------
4 . _____I-0
0.6
0.4'~iL9100 150- 210 250 300 400 500 600 700
TEMPERATURE, DEGREES FAHRENHEIT
F~.gure .28-- Viscosity-Temperature Plot for 0-69-5
w 50200 _ _
o 2.0- - - -0 - - - -
0 .0 - 0
1 . IS
0.I-
0100 150 210 250 300 400 500 600 T00TEMPERATURE, DEGREES FAHRENHEIT
Figure 29 -Viscosity-Temperature Plot for 0-69-10
57
10.000
200 ___
200
w 2
w 5.
2
C0.
0t 0150 210 250 30 400 '500 600 TOOTEMPERATURE, DEGREES FAH1RENHEIT
Figure 30 -Viscosity-Temperature Plot for 0-69-17
10,0003,0001,000
So
200
w 5,0
U
>: 30
> U,
1,0
w
0.6
04'0 100 150 210250 300 400 500 600 700
TEMPERATURE, DEGREES FAHRENHEIT
Figure 31 -Viscosity-Temperature Plot for 0-69-19
58

Ila
104
30 IO 7 - 1 5 0 0 0 0 0
.0
0
0
0 .4______
o1.0
0
2 0 - _ _ _
100- . - -
30
w 5.9
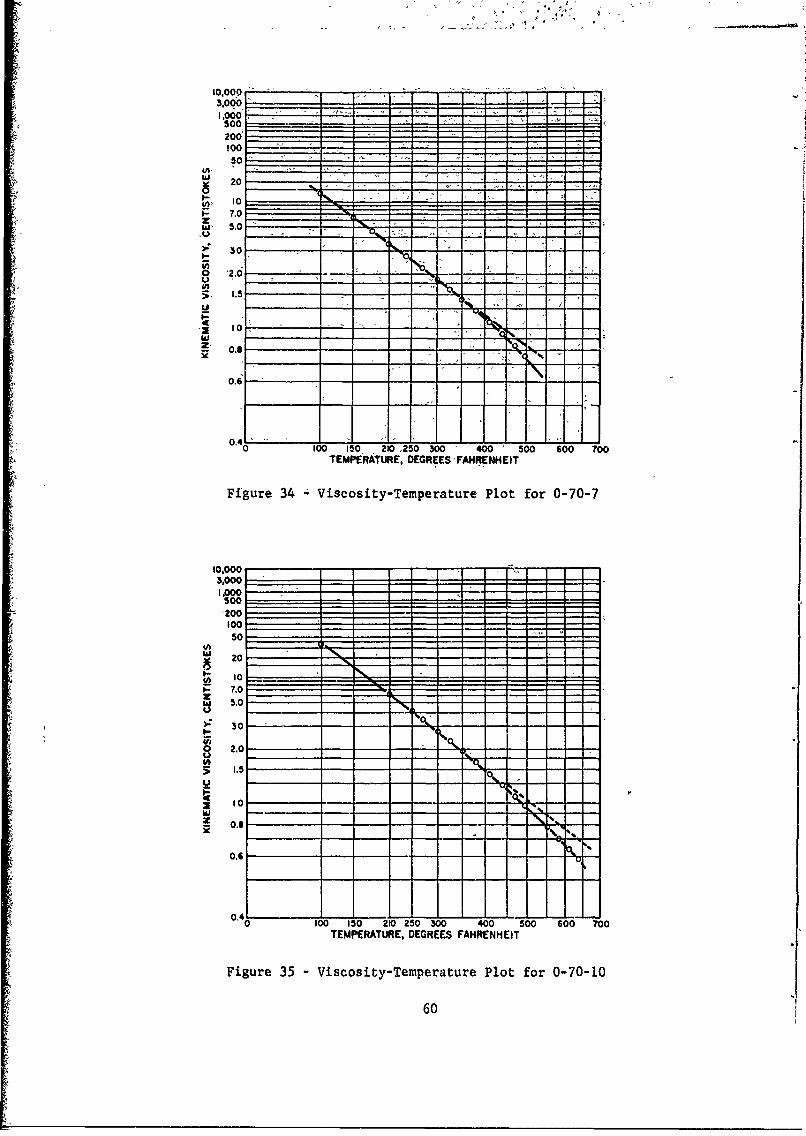
ICL
20
0 0.
30 -k~ '14 -~
10 N
0.4
0 100 150, 210 250 300 400 500 600 700TEMPERATURE, DEGREES FAHRENHEIT
Figure 34 Viscosity-Temperature Plot for 0-70-7
3 .0
20A hi 50
soW
10_
100 30 1 5 0 400 0 0
160
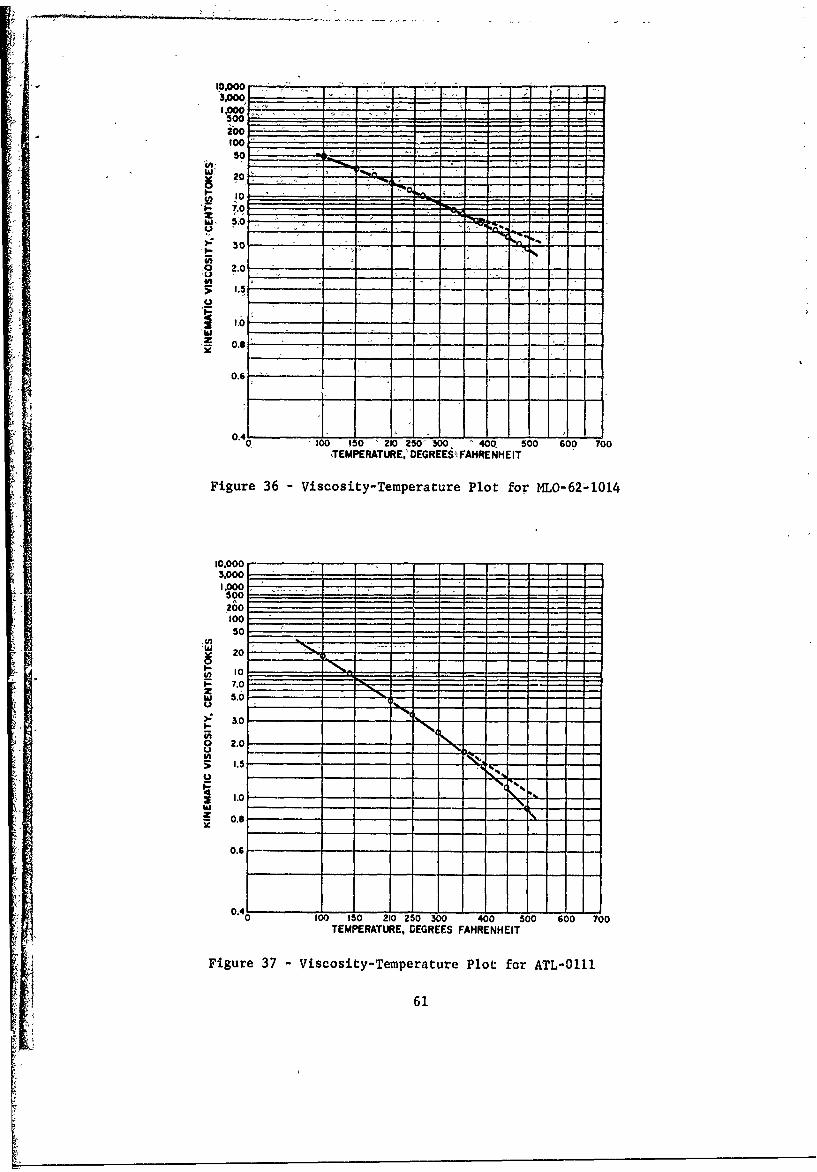
110.0003AOO
_71i0o10050
?00,
e 07.0
W, 5.'0
50
z 0.0
0.6
0.4100 150 210 250' 3W 'WQ 500 600 700
TEMPERATURE.'DEGREES FAHRENHEIT
Figure 36 Viscosity-Temperature Plot for MLO-62 4014
10,00031000
20010050
w 20
10LO1.- 7.0zw 5.6
>: &0 k
V)0 2.0- Nil-
1.0wz 0.8
0.6
0.40 100 150 210 250 300 400 500 600 700
TEMPERATURE, DEGREES FAHRENHEIT
Figure 37 Viscosity-Temperature Plot for ATL-0111
61
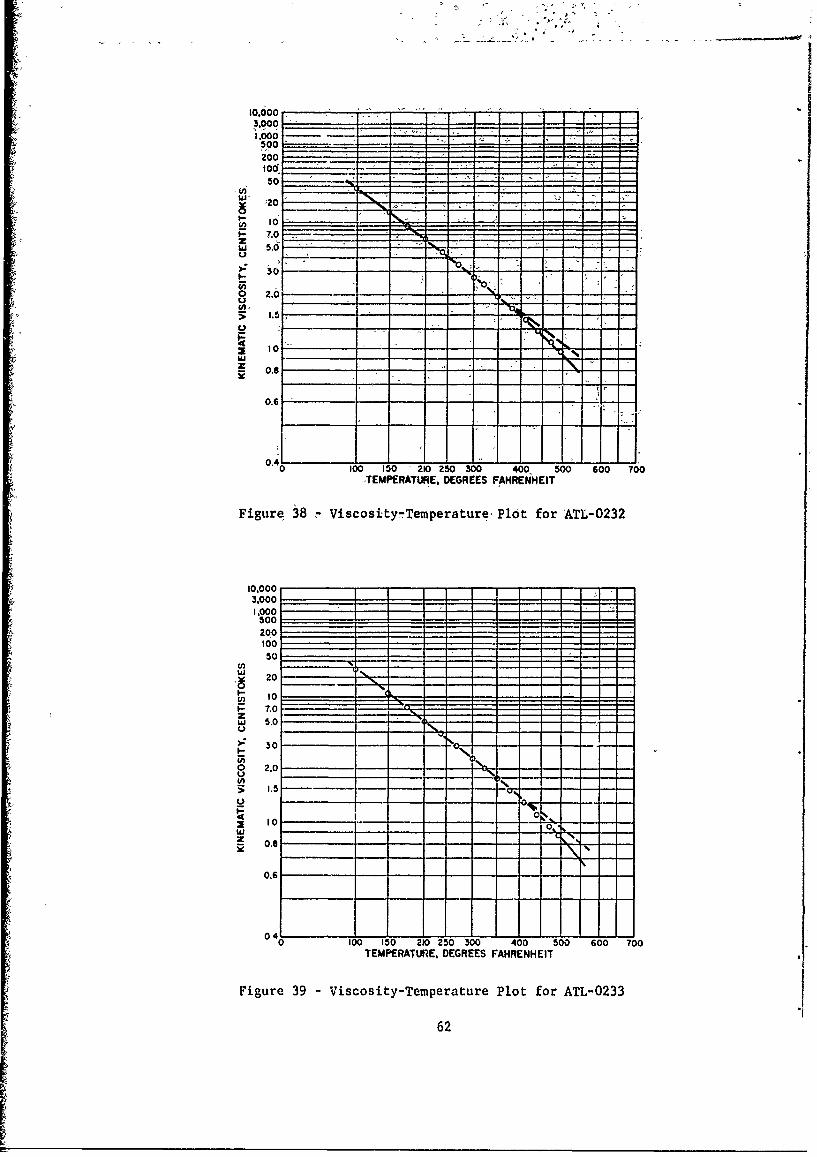
10.000,
5 01- 7.
1 50
I-7
0 2.0
4 IN
S10 -
z __0.6
0.6
00 100 150 210 250 300 400, 500 600 700
,TEMPERATURE, DGESFAHRENHEIT
Figure 318 Viscosity7TemperaturePlot for ATL-0232
10,000-- - ' - - - - - -
3,000
500
20 0
P- 7.0z0 .
> 3C -
I-0
0 1
0,6
04 j0i -0 15 21 25 -0 400 50 60 700-
___ ERM DERE FARNHI
Fiur 39 Viscoity-empeatur PltfrAL03
ui - - - - -- 62
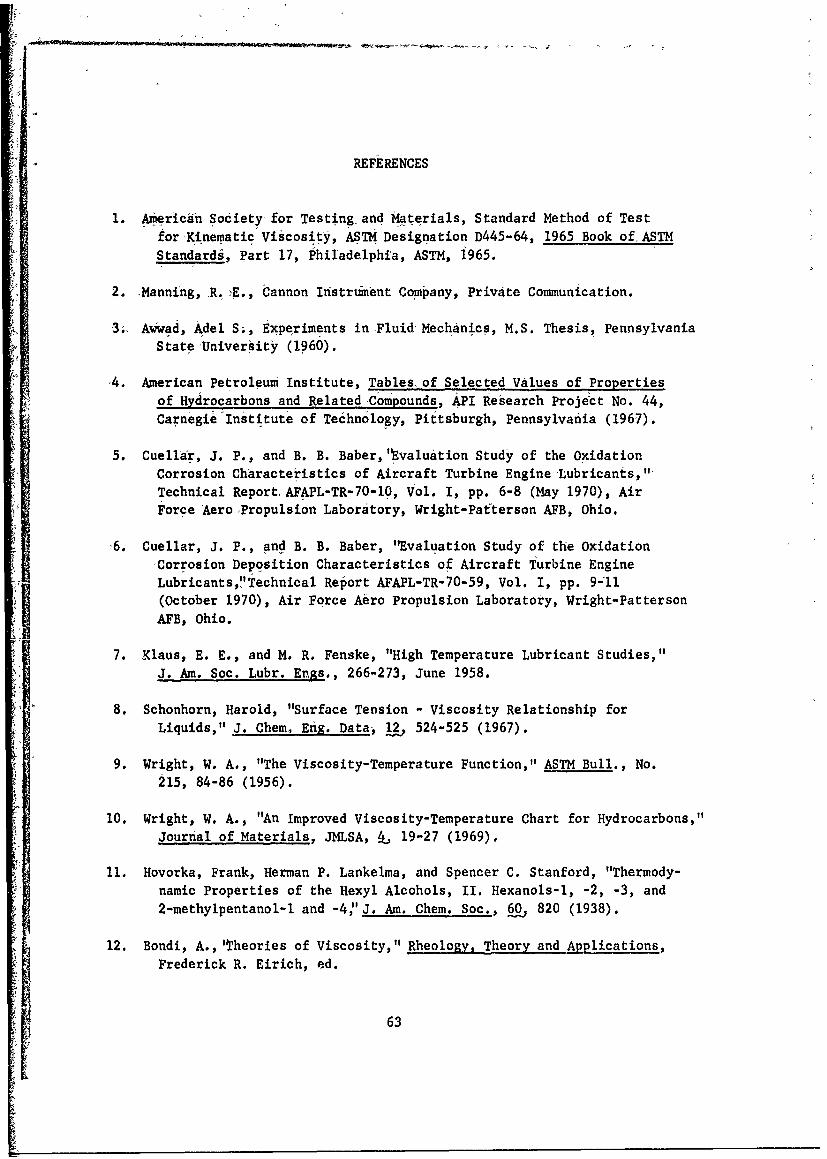
REFERENCES
1. American Society for Testing and Materials, Standard Method of Testfor Kinematic Viscosity, ASTM Designation D445-64, 1965 Book of, ASTMStandards, Part 17, Philadelphia, ASTM, 1965.
2. Mannfng, R.. E., Cannon Instrument Company, Private Communication.
3;, Awad, Adel S;, Experiments in Fluid Mechanics, M.S. Thesis, PennsylvaniaState University (1960).
4. American Petroleum Institute, Tables of Selected Values of Propertiesof Hydrocarbons and Related Compounds, API Research Project No. 44,Carnegie Institute of Techn6logy, Pittsburgh, Pennsylvania (1967).
5. Cuellar, J. P., and B. B. Baber,'Evaluation Study of the Oxidation
Corrosion Characteristics of Aircraft Turbine EngineLubricants,"Technical Report AFAPL-TR-70-10, Vol. I, pp. 6-8 (May 1970), AirForce 'Aero ,Propulsion Laboratory, Wright-Patterson AFB, Ohio.
6. Cuellar, J. P., and B. B. Baber, "Evaluation Study of the Oxidation-Corrosion Deposition Characteristics of Aircraft Turbine Engine
Lubricants,''Technical Report AFAPL-TR-70-59, Vol. I, pp. 9-11(October 1970), Air Force Aero Propulsion Laboratory, Wright-PattersonAFB, Ohio.
7. Klaus, E. E., and M. R. Fenske, "High Temperature Lubricant Studies,"
J. Am. Soc. Lubr. Engs., 266-273, June 1958.
8. Schonhorn, Harold, "Surface Tension - Viscosity Relationship forLiquids," J. Chem. Eng. Data, 12, 524-525 (1967).
9. Wright, W. A., "The Viscosity-Temperature Function," ASTM Bull., No.215, 84-86 (1956).
10. Wright, W. A., "An Improved Viscosity-Temperature Chart for Hydrocarbons,"Journal of Materials, JMLSA, 4, 19-27 (1969).
11. Hovorka, Frank, Herman P. Lankelma, and Spencer C. Stanford, "Thermody-namic Properties of the Hexyl Alcohols, II. Hexanols-l, -2, -3, and2-methylpentanol-l and -4,"J. Am. Chem. Soc., 60, 820 (1938).
12. Bondi, A.,'Theories of Viscosity," Rheology, Theory and Applications,
Frederick R. Eirich, ed.
63
13. Brush, Stephen Gi, "Theories of Liquid Viscosity," Chem. -Revs., 62,
513-548 (1962).
14. Burns, W. G., B. Morris, and R. W. Wilkinson, "An Apparatus for theViscometry, of Organic Liquids at -High Temperature," J. *Sci. _Instr..35, 291-293 (1958).
15. Powell, R. E., W. E. Roseveare, and Henry Eyring, "Diffusion, Thermal
Conductivity, and Viscous Flow of Liquids," Ind. Eng. Chem.,3,430-435 (1941).
16. Ree, T., and-H. Eyring, "GeneralizedTheory of Viscosity and Diffusion,"Proc. Intern. Wool Textile Res. Conf., Melbourne 955 D, 162181.
i7. Partington, J. R., "The Properties of Liquids," An-Advanced Treatise onPhysical Chemistry, Vol. II, New York, Longmans, Green and Co., (1951).
18. Doolittle, Arthur K., "Newtonian Flow in "'olymer Chemistry," ColloidChemistry, Vol. 7, Ch. 8, J. Alexander, ed., New York, ReinholdPublishing Corporation (1950).
19. Andrade, E. N. da C., "A Theory of the Viscosity of Liquids," Phil.Mag., 17 -511 (1934).
20. Lide,DavidR., Jr., Office of Standard Reference Data, National Bureauof Standards, Private Communication.
21. Marvin, Robert S., "The Calibration of Viscometers," National Bureau ofStandards Special Publication 300, Precision Measurement and Calibra-tion, Vol. 7, Mechanics (preprint).
22. Marvin, Robert S., and David L. Hogenboom, "Viscosity of Liquids,"Preprint, Courtesy National Bureau of Standards.
64
BIBLIOGRAPHY
.Afmbrustei, Jean-Claude, Pierre, Azou, and Paul Bastien, "Sur une methodeviscosim'trique 'absolue,".Compt.,Rend., 250 2816-2818 (1960)
Balazs, F., "Theory of Viscosity," Nature, 164., 191;-192 (1949).
Baum, E.,'"ber den Temperaturkoeffizienten der Viskositat von Flcssigkeiten,"Kolloid-Z, 135_ 176 (1954).
'Bradbury, Donald, MelvinMark, and R. V. Kleinschmidt, "Viscosity andDensity of Lubricating Oils from 0 to 150,000 psig and 32 to 425 0F,"Trans. ASHE, 73, 6 -676 (1951).
Brancker, A. V., "The Viscosity-Temperature Function," Ind. Chemist, 3_112 (1954).
Cannon, M. R., R. E. Manning, and J. D. Bell, Viscosity Measurement, "TheKinetic Energy Correction and a New Viscometer," Anal. Chem., 3 355-358(1960).
Cornelissen, J., and H. I. Waterman, "The Viscosity Temperature Relation-ship of Liquids," Chem. Eng.Sci., 4, 238-246 (1955).
Crouch, R. F., and A. Cameron, "Viscosity-Temperature Equations for Lubri-cants," J. Inst. Petr., 47, 307-313 (1961).
Doolittle, Arthur K., "Studies in Newtonian Flow, I. The Dependence ofthe Viscosity of Liquids on Temperature," J. AppI. Phys., 2, 1031-1035
Doolittle, Arthur K., and Roland H. Peterson, "Preparation and Physical
Properties of a Series of n-alkanes," J. Am. Chem. Soc., 7 2145-2151(1951).
Eyring, H., and R. P. Marchi, "Significant Structure Theory of Liquids,"J. Chem. Educ., 40 562-572 (1963).
Girifalco, L. A., "Temperature Dependence of Viscosity and Its Relationto Vapor Pressure for Associated Liquids," J. Chem. Phys., 23 2446 (1955).
Hardy, Robert C., "Viscosity of n-hexadecane," J. Res. Natl. Bur. Stds.,kJ, 433-436 (1958).
Hedley, W. H., M. V. Milnes, and W. H. Yanko, "Thermal Conductivity and
* Viscosity of Biphenyl and the Terphenyls," J. Chem. Eng. Data, 15 122-127
(1970).
65
Kreps, S. I., and' N. L. -Druini edcto of Viscosity of Liquid Hydro-carbons," Ind. trig-.. Ohem. (Fundamentals), 9, 75-831(l970).
Larson, C. M., "isicosity: Most ImpoirtantProperty of LubricatingOil,"Power, ~%No. 8', 68!-70 (1946).
Litovitz, Theodore A., "'Temperature Dependence of the Viscosity of Associ-ated Liquids,".J. Chem. Phys ., '20 1088 (1952).
4Mitra, S. S., "Teffpefature-Depenidence of Viscosity," Cufrrent Scienice(India), 24, 44 (1955).
Prasad, Balbhadrat "A Theory of Viscosity and Thermal Conductance ofLiquids and Highly Compressed Oases,.1' Phil. Nag., ,9 884-889 (1948).
Reid, R. C., and T. K. Sherwoodi The, Properties of Cases and Liquids:Their Estimation and Correlation, New York, McGraw-Hill (1958).
Sloane, R. G., and CariWinning, "Viscosity-Temperature Relationship ofLubricating Oils," Ind. Eng. Chem., ~,673. (1931).
Um *htatter, H., "Viscosity as a Material Constant," K6lloid-Z, 126,
pp., 108-120 (1952).
Zaretsky, Erwin V., and William J. Anderson, "Preliminary Determinationsof Temperature Limitations of Ester, Ether, and-Hydrocarbon Base Lubri-cants in 25-mm Bore Ball Bearings," NASA Technin)II Note D-4146 (1967).
66 '