Embed Size (px)
Citation preview
Welcome to your water education and water quality
monitoring program!
You can find updated versions of this manual in pdf format and other water quality monitoring information on USU Extension’s Water Quality Website – http://extension.usu.edu/waterquality

Utah State University Extension, in cooperation with Utah State’s College of Natural Resources, has developed the Utah Stream Team Water Education and Water Quality Monitoring Program. Utah Stream Team is designed for use by schools and other educational and service organizations in Utah and beyond.
The mission of Utah Stream Team is:
To help students, teachers, and volunteer groups become
informed and active stewards of Utah’s water resources.


Acknowledgments
Thank you to the authors, contributors and illustrators listed to the right. The successful development of this manual owes to their vision and hard work. They represent the following organizations: ¹ Utah State University (USU), Department of Rangeland
Resources ² USU, Cooperative Extension Service and Department of Geography and Earth Resources
³ Spring Creek Middle School, Logan, UT 4 Logan Senior High School, Logan, UT 5 Cache Valley Learning Center, Logan, UT 6 USU, Department of Elementary Education 7 Mt. Logan Middle School, Logan, UT 8 Utah Division of Water Quality
Additional insights were offered from teachers and natural resource management specialists from throughout northern Utah. Although their names are too numerous to list, we thank them for their essential contributions.
A special THANK YOU to the many students of Spring Creek Middle School and Mt. Logan Middle School for their input and inspiration.
This publication received funding from the U.S. Department of Agriculture and the U.S. Environmental Protection Agency.
Authors John Geiger¹ Nancy Mesner²
Contributors Mike Allred8
Chris Call¹ Randy Christensen3
Jim Dobrowolski¹ Jack Greene4
Dennis Hinkamp²
Bill Masslich5
Barbara Middleton¹ Rebecca Monhardt6
Robes Parrish¹ Bryce Passey7
Carol White3
Amber Williams3
Illustrators Holly Broome-Hyer² John Geiger Various illustrators as
noted
Utah State University is committed to providing an environment free from harassment and other forms of illegal discrimination based on race, color, religion, sex, national origin, age (40 and older), disability, and veteran’s status. USU’s policy also prohibits discrimination on the basis of sexual orientation in employment and academic related practices and decisions. Utah State University employees and students cannot, because of race, color, religion, sex, national origin, age, disability, or veteran’s status, refuse to hire; discharge; promote; demote; terminate; discriminate in compensation; or discriminate regarding terms, privileges, or conditions of employment, against any person otherwise qualified. Employees and students also cannot discriminate in the classroom, residence halls, or in on/off campus, USU-sponsored events and activities. This publication is issued in furtherance of Cooperative Extension work, acts of May 8 and June 30, 1914, in cooperation with the U.S. Department of Agriculture, Noelle Cockett, Vice President for Extension and Agriculture, Utah State University. NR-WQ-03
Order Information You can obtain copies of the Utah Stream Team from Nancy Mesner, Department of Aquatics, Watershed and Earth Resources, 5210 Old Main Hill, Utah State University, Logan, UT 84322- 5210; phone: (435) 797-7541; fax: (435) 797-1871; email: [email protected]. You can find updated versions of this manual and other water quality monitoring information on USU Extension’s Water Quality Website – http://extension.usu.edu/waterquality.


Table of Contents
Unit I. Introduction ………………………………………………………………………….. 11
1. Introduction to the Utah Stream Team …………………………………………………… 13
2. What’s in the Manual ……………………………………………………………………….….. 17
Unit II. Designing Your Program …………………………………………………… 21
1. Utah Science Core Curriculum Connections …………………………………………..… 23
2. Suggested Instructional Strategies …………………………………………………………. 27
3. Interdisciplinary Study ………………………………………………………………………….. 31
Unit III. Field Prep ……………………………………………………………………………. 35
1. In the Field …………………………………………………………………………..……………… 37
A. Where to Sample …………………………………………………………………………..… 38
B. What to Sample ………………………………………………………………………………. 39
C. How to Sample ……………………………………………………………………………….. 40
D. When to Sample …..…………………………………………………………………………. 41
2. Organizing Your Group ………………………………………………………………………….. 43
3. Field Behavior ………………………………………………………………………………………. 45
4. Sampling Safely ……………………………………………………….…………………………… 47
5. Before You Go …………………………………………………………………………………….. 49
6. The Utah Stream Team Monitoring Kit …………………………………………………… 51
Unit IV. Field Investigation …………………………………………………………….. 53
1. General Stream Survey .…...…………………………………………………………………… 55
General Stream Survey Field Data Sheet ………………………………………………….. 59
2. Physical Properties Introduction …………………………………………………………….. 61
a. Stream Flow …………………………………………………………………………………….. 63
b. Stream Shape ……..………………..………………………………………………………….. 71
Physical Properties Field Data Sheet ….……………………………………………………… 81

3. Chemical Properties Introduction …………………………………………………………….. 83
a. pH …………………………………………………………………………………………………… 85
b. Dissolved Oxygen …………………………………………………………………………….. 91
c. Nutrients ..……………………………………………………………………………………….. 99
Nitrogen (Nitrate, Ammonia) ……………………………………………………………… 101
Phosphorus ..……………………………………………………………………………………. 113
d. Turbidity ..………………………………………………………………………………………… 119
e. Temperature …………………………………………………………………………………….. 125
Chemical Properties Field Data Sheet ………………………………………………………. 133
4. Biological Properties Introduction ………………………………………………………………. 135
a. Macroinvertebrates ……………………………………………………………………………. 137
Macroinvertebrate Field Data Sheet …………………………………………………………… 151
b. The Riparian Zone ..…………………………………………………………………………… 153
Riparian Zone Field Data Sheet ………….………………………………………………. 163
Unit V. Post-Field Activities ……………………………………………………………….. 167
1. Illustrating Your Data ………………………………………………………………………………. 169
2. Reflecting On Your Data .…………………………………………………………………………. 175
3. Stewardship …………………………………………………………………………………………… 181 Unit VI. Utah Water Information ………………………………………………………… 187
1. The Water Cycle ……………………………………………………………………………………….. 189
2. Watersheds ………………………………………………………………………………………………. 195
3. Water Pollution …………………………………………………………………………………………. 209
4. Water Regulations .….………………………………………………………………………………… 215
Unit VII. Appendices ……………………………………………………………………….. 221
1. Feedback …………………………………………………………………………………………………. 223
2. Contacts and Resources ……………………………………………………………………………. 227
3. Utah Science Core Curriculum Matrix …………………………………………………………. 241
4. A Note to Volunteers ………………………………………………………………………………… 247

5. Sampling Directions and Data Sheets ………………………………………………………… 251
6. Overhead Masters …………………………………………………………………………………… 285
7. Funding Your Monitoring Program …………………………………………………………….. 305
8. Purchasing Supplies ………………………………………………………………………………… 313
9. Making Your Own Monitoring Equipment …………………………………………………… 317
10. Monitoring in the Classroom …………………………………………………………………… 325
11. Conversion Charts …………………………………………………………………………………. 333
12. Glossary ……………………………………………………………………………………………….. 337
13. Index …………………………………………………………………………………………………… 349


Unit I. Introduction
This section provides an overview of the Utah Stream Team program. You’ll also find information on how to use the manual and a short description of each of the units and sections within.
Sections 1. Introduction to the Utah Stream Team
2. What’s in the Manual
11 Utah Stream Team Unit I. Introduction

Utah Stream Team Unit I. Introduction
12
Utah Stream Team Unit I. Introduction
I-1. Introduction to the Utah Stream Team
Why do we care about water quality monitoring? WATER is one of the most abundant and important substances on Earth. Water comprises over 70% of the Earth’s surface and 50 to 80% of every living organism’s weight – it truly connects all living things. Each of us – student, bird, farmer, plant – depends on the same global water-centered system. Within this system our lives depend on the small volume of fresh water.
Fresh, clean, drinkable water constitutes only one half of one percent of all the Earth’s water (if you filled a bucket with 100 liters of water, 98 liters would be saltwater, 2 liters would be fresh, and only 60 milliliters of that fresh supply would be drinkable). We depend on our streams and rivers to deliver much of this drinking water, as well as provide for irrigation for agriculture, recreation and other uses. Many animals and plants could not live without clean river water.
Humans are the only species with the ability to manage water resources. With this
ability comes an important responsibility to understand and protect streams and rivers. A vital tool for such action is WATER QUALITY MONITORING.
In Utah there are more than 16,450 miles of streams and rivers. As of 1996 only 40% of those miles had been monitored. The water quality monitoring effort needs our help.
What is water quality monitoring? Did you ever wonder how we get information on the conditions of our streams? How do we determine if a water body is healthy enough to provide drinking water, recreation, irrigation and still support fish and other wildlife? Water quality monitoring provides the answers in the form of scientific data. We collect the scientific data from several sources. The Utah Stream Team manual will help you sample the
following water quality properties. You may choose to incorporate all of them into your program or just one or two.
Physical properties affect the environments that aquatic plants and animals live in. They include: turbidity – sediment and other material carried in the water temperature – the heat energy of the water stream flow – the amount and speed of the water stream shape – the structure of the channel banks and bottom
Chemical properties influence how healthy the water is for aquatic plants and animals and for humans. They include: pH - the acidity or alkalinity of the water dissolved oxygen – oxygen in the water that supports aquatic life nutrients (phosphorus, nitrogen) – food for aquatic plants
13

Utah Stream Team Unit I. Introduction
Biological properties determine the types and amounts of life in and around the stream. They include: the riparian zone – the vegetated area alongside the stream provides food and shelter for life
in the stream and on land macroinvertebrates – aquatic bugs are an important link in the food chain
The information that we collect helps us: determine the overall health of our stream, understand our streams and their role in the watershed, identify specific water quality problems, and, most importantly, take wise action to improve or protect the water quality of our stream. Why are students and teachers getting involved in the monitoring effort? Through the hands-on experience of water quality monitoring, students further their understanding of water resources in the State. Just as important, they grow and learn from the experience. Water quality monitoring is also a powerful educational tool. Use this program to meet Utah State Core Curriculum Objectives, teach in an interdisciplinary manner, provide meaningful content and activities, expose students to new learning environments and much more. The learning outcomes are even more exciting.
Through the Utah Stream Team program students will: understand the relevancy of their studies, gain confidence in their ability to positively influence their local environment, learn the importance and rewards of serving their community, develop skills to become better decision makers, realize that learning is FUN!
“The educational benefits of monitoring spread out in circles to a wider and wider community, beginning with the student volunteers and then extending to friends, neighbors, businesses, elected officials…”
- Volunteer Monitor, 1994
14

Utah Stream Team Unit I. Introduction
How do we monitor water quality? We investigate in the classroom. Students need to understand “why” they are monitoring. We can help them see the relevancy of their investigations by presenting “big picture” concepts, such as The Water Cycle and Watersheds. Within these large concepts students can then identify areas of interest, such as Aquatic Life, to pursue. They can even design their own monitoring program to address their interests.
The classroom also provides a great place to prepare for field exercises. Practicing data collection procedures (e.g., sampling the acidity of household substances) and reviewing safe and ethical monitoring techniques are important for success in the field.
After we return from the field we reflect on our findings as well as our collection techniques. Classes are encouraged to present and share their data via the internet.
We study water across the curriculum. The Utah Stream Team facilitates the study of water in all major discipline areas. Computer graphing, creative writing and public decision-making are just a few of the areas students can explore through the program.
We get wet! At the stream site, students collect scientific data. They may conduct a variety of chemical tests, collect and identify aquatic bugs, measure the stream shape and flow and much more.
The structure of the monitoring exercises depends on the individual goals and resources of the group. Some groups may opt to take only a few measurements; some may run every test. Some groups may visit their site only once during the year while others may visit once a month. We develop community projects. Many groups choose to take action based on what they’ve learned. For example, if a group discovers significant bank erosion, they may return to the site to work with a specialist to revegetate and stabilize the banks. Some groups take the opportunity to educate others in their community about water quality. They may present their findings to the city council or start a community water education program. Utah Stream Team emphasizes action based on unbiased scientific information.
Thanks for being involved! The Utah Stream Team is glad you’ve decided to join the water quality monitoring effort. Before you is an exciting opportunity to make a difference – for your streams, your students and your community.
15

Utah Stream Team Unit I. Introduction
16

Utah Stream Team Unit I. Introduction
I-2. What’s in the Manual
The Utah Stream Team (UST) is a flexible educational tool able to meet a wide range of instructional goals and settings. An earth science class may spend 2 weeks investigating water quality and work through the manual from start to finish. A social studies class may simply want to look at Water Laws for a day and use only that section.
This manual also accommodates educators with a wide range of experience and knowledge levels. Those familiar with water quality monitoring may wish to skip over some sections. Less experienced teachers may actually desire more information (if so, consult the “resources for further investigation”). To decide which units will be most helpful for you take a few minutes to familiarize yourself with the manual.
Unit I: Introduction Section 1. Introduction - an overview of Water Quality Monitoring and the UST program. Section 2. What’s in the Manual
Unit II: Designing Your Program Every class and teacher operates in a unique environment. Read through the sections of this unit in sequence to design a water education and monitoring program that meets your individual needs.
Section 1. Utah Science Core Curriculum Connections – correlations between UST activities and the Utah 5th - 8th Grade Core Curriculum for Science are identified (UST content is adaptable for grades 5 through 12).
Section 2. Suggested Instructional Strategies – teaching philosophy and strategies.
Section 3. Interdisciplinary Study – cross- curricular connections.
Unit III: Field Prep This unit will help you to plan and organize field activities. Be sure to consult this section well in advance of your field day.
Section 1. In the Field – answer your questions about where, what, when and how to sample.
Check it out … Let these icons be your guide.
Here’s an exciting monitoring idea.
Find out how things work here in Utah.
Don’t forget about this.
Here’s a fun way you can help protect your local stream.
Whoa. Don’t miss this important information.
Section 2. Organizing Your Group – facilitate efficient field exercises.
Section 3. Field Behavior – learn to sample in an ethical manner.
17

Utah Stream Team Unit I. Introduction
Section 4. Sampling Safely – reduce unnecessary risk for students and volunteers.
Section 5. Before You Go – obtain permission, connect with other monitoring groups and natural resource specialists, and develop community support.
Section 6. The Utah Stream Team Monitoring Kit – lists equipment, materials and information on borrowing a free kit.
Unit IV: Field Investigation This unit guides you through a water quality monitoring investigation of your local stream.
Section 1. General Stream Survey Weather Surrounding land use Water appearance and smell
Section 2. Physical Properties Stream flow Stream shape
Section 3. Chemical Properties pH Dissolved oxygen Nutrients (nitrate, ammonia, phosphorus)
Section 4. Biological Properties Macroinvertebrates The Riparian Zone
Each of the physical, chemical and biological properties sections contains: key terms – these bolded, underlined
terms are defined in the Glossary background information overhead masters information to help interpret your
findings resources for further investigation directions and data sheets for field
monitoring [section VII-8 compiles them into one area for easy access]
Unit V: Post-Field Activities Section 1. Illustrating Your Data – chart and graph your data.
Section 2. Reflecting on Your Data – interpret your data and data collection techniques.
Section 3. Stewardship – act on your findings and making a difference.
Unit VI: Utah Water Information These sections provide the “big picture” that will help students understand why they are monitoring.
Section 1. Water Cycle – describes universal processes.
Section 2. Watersheds – describes regional processes.
Section 3. Water Pollution–examines the types, sources and effects of water pollution.
18

Utah Stream Team Unit I. Introduction
Section 4. Water Laws–discusses legal aspects concerning water quality.
Unit VII: Appendices Section 1. Feedback – help improve the UST program for students and teachers.
Section 2. Contacts and Resources – investigate further and find monitoring assistance.
Section 3. Utah Science Core Curriculum Matrix – identify which sections of the manual will help you address a specific Standard or Objective.
Section 4. A Note to Volunteers – one-page overview of the UST program for volunteers, media and other interested parties.
Section 5. Sampling Directions and Data Sheets – a compilation of field sheets.
Section 6. Overhead Masters – instructional aids (remember, figures with an arrow can be found in this appendix).
Section 7. Funding Your Monitoring Program – find additional support for your program.
Section 8. Purchasing Supplies – prices and ordering information for monitoring equipment and supplies.
Section 9. Making Your Own Monitoring Equipment – easy-to-follow instructions for useful instruments.
Section 10. Monitoring in the Classroom–options for groups without access to a waterbody and groups looking to extend their field monitoring program.
Section 11. Conversion Chart – convert monitoring units.
Section 12. Glossary – all key terms (bolded) are defined here.
Section 13. Index
19

Utah Stream Team Unit I. Introduction
20

Utah Stream Team Unit II. Designing Your Program
Unit II. Designing Your Program Every class and teacher operates in a unique environment. This unit is designed to meet you individual needs for a water quality education program.
Sections 1. Utah State Core Curriculum Connections
2. Classroom Instruction Guide
3. Interdisciplinary Study
21

Utah Stream Team Unit II. Designing Your Program
22

Utah Stream Team Unit II. Designing Your Program
II-1. Utah State Core Curriculum Connections
The Utah Stream Team (UST) manual addresses the Utah State 5th - 12th Grade Science Core Curriculum Standards, Objectives and Indicators listed below (only those addressed are listed).
Science
5th Grade
STANDARD 1: Students will understand that chemical and physical changes occur in matter.
OBJECTIVES:
(1)Describe that matter is neither created nor destroyed even though it may undergo change.
STANDARD 2: Students will understand that volcanoes, earthquakes, uplift, weathering, and erosion reshape Earth's surface.
OBJECTIVES:
(1)Describe how weathering and erosion change Earth’s surface.
(3)Relate the building up and breaking down of Earth’s surface over time to the various physical land features.
STANDARD 5: Students will understand that traits are passed from the parent organisms to their offspring, and that sometimes the offspring may possess variations of these traits that may help or hinder survival in a given environment.
OBJECTIVES:
(1)Using supporting evidence, show that traits are transferred from one parent organism to
its offspring.
(2)Describe how some characteristics could give a species a survival advantage in a particular environment.
7th Grade
STANDARD 1: Students will understand the structure of matter.
OBJECTIVES:
(2)Accurately measure the characteristics of matter in different states.
23

Utah Stream Team Unit II. Designing Your Program
STANDARD 4: Students will understand that offspring inherit traits that make them more or less suitable to survive in the environment.
OBJECTIVES:
(2)Relate the adaptability of organisms in an environment to their inherited traits and structures.
STANDARD 5: Students will understand that structure is used to develop classification systems.
OBJECTIVES:
(1)Classify based on observable properties. (2)Use and develop a simple classification system.
8th Grade
STANDARD 1: Students will understand the nature of changes in matter.
OBJECTIVES: (1)Describe the chemical and physical properties of various substances. (2)Observe and evaluate evidence of chemical and physical change.
STANDARD 2: Students will understand that energy from sunlight is changed to chemical energy in plants, transfers between living organisms, and that changing the environment may alter the amount of energy provided to living organisms.
OBJECTIVES:
(1)Compare ways that plants and animals obtain and use energy.
(3)Analyze human influence on the capacity of an environment to sustain living things.
STANDARD 3: Students will understand the processes of rock and fossil formation.
OBJECTIVES: (2)Describe the nature of the changes that rocks undergo over long periods of time.
(4)Compare rapid and gradual changes to Earth’s surface.
STANDARD 4: Students will understand the relationships among energy, force, and motion.
OBJECTIVES: (2)Examine the force exerted on objects by gravity. (3)Investigate the application of forces that act on objects, and the resulting motion.
9-12 Earth Systems
24

Utah Stream Team Unit II. Designing Your Program
STANDARD 2: Students will understand that the features of Earth’s evolving environment affect living systems, and that life on Earth is unique in the solar system.
OBJECTIVES: (2)Analyze how ecosystems differ from each other due to abiotic and biotic factors.
STANDARD 4: Students will understand that water cycles through and between reservoirs in the hydrosphere and affects the other spheres of the Earth system.
OBJECTIVES:
(1)Explain the water cycle in terms of its reservoirs, the movement between reservoirs, and
the energy to move water. Evaluate the importance of freshwater to the biosphere.
STANDARD 5: Students will understand that Earth's atmosphere interacts with and is altered by the lithosphere, hydrosphere, and biosphere.
OBJECTIVES:
(1)Describe how matter in the atmosphere cycles through other Earth systems.
9-12 Chemistry
STANDARD 6: Students will understand the properties that describe solutions in terms of concentration, solutes, solvents, and the behavior of acids and bases.
OBJECTIVES:
(3)Differentiate between acids and bases in terms of hydrogen ion concentration.
9-12 Biological
STANDARD 1: Students will understand that living organisms interact with one another and their environment.
OBJECTIVES:
(2)Explain relationships between matter cycles and organisms. (3)Describe how interactions among organisms and their environment help shape
ecosystems. STANDARD 5: Students will understand that biological diversity is a result of evolutionary processes.
OBJECTIVES:
(1)Relate principles of evolution to biological diversity. (3)Classify organisms into a hierarchy of groups based on similarities that reflect their
evolutionary relationships.
25

Utah Stream Team Unit II. Designing Your Program
Social Studies
Utah Studies
STANDARD 1: Students will understand the interaction between Utah’s geography and its inhabitants.
OBJECTIVES:
(1)Investigate the relationship between physical geography and Utah’s settlement, land use, and economy.
(2)Examine the interrelationship between Utah’s climate, location, landforms, and life. (3)Assess how natural resources sustain and enhance people’s lives. (4)Examine how people affect the geography of Utah.
Geography for Life
STANDARD 2: Students will understand the human and physical characteristics of places and regions.
OBJECTIVES:
(1)Interpret place by its human and physical characteristics.
STANDARD 3: Students will understand how physical processes shape the earth's surface.
OBJECTIVES:
(1) Examine the physical processes that shape the earth’s surface.
STANDARD 5: Students will understand the interaction of physical and human systems.
OBJECTIVES:
(1)Explore how humans change the environment and how the environment changes humans. (2)Assess the importance of natural and human resources.
26
Utah Stream Team Unit II. Designing Your Program
II-2. Suggested Instructional Strategies
Defining Your Goals and Objectives What do you want to accomplish? The nature of your water quality monitoring program depends on which learning objectives you identify for your program and the plan that supports those objectives. Begin this process by asking yourself and your students, “What do we want to accomplish through water education and water quality monitoring?” To increase their motivation and sense of ownership for the program, include students in the planning process.
Important considerations The following considerations will help you further define your program plan. Developmental level – Students of every developmental level can appreciate their surroundings, increase their understanding of science and take action. Developmental level will only influence how you facilitate these processes. Time – Consider the number of field trips you can take over the course of the school year and the time allotted per trip. These will be important factors when you select a stream site. Remember to account of pre-field preparation and post-field processing. Influences within your watershed – Familiarize yourself with the land use, soils and vegetation of your watershed. You may want to use monitoring to form an understanding of these processes and how they affect your stream. Interdisciplinary curriculum connections – Consult the “Interdisciplinary Study” section for help connecting the Utah Stream Team program with other teachers and disciplines. Core Standards and Objectives – Consult the “Utah State Core Curriculum Connections” to identify Core requirements you will meet through your monitoring program.
Learning Principles The Utah Stream Team follows Constructivist learning principles. Included among these principles are Learner-Centered Instruction, Cooperative Learning, and Holistic Learning.
Constructivism Constructivist learning theory recognizes that each of us constructs our own, unique understandings of the world by synthesizing new information with previous understandings. Real learning (internalizing and applying new information) will occur only when the student finds meaning and relevance for the new information. Old methods of lecture and recitation can help students pass tests by memory, but they often fail to support long-term learning. Several techniques for promoting constructivism (learner-centered instruction, cooperative learning, and holistic learning) follow.
Interdisciplinary Instruction and Service Learning (Stewardship) represent additional Constructivist Learning Principles. These are discussed in chapters II-3 and V-3, respectively.
27
Utah Stream Team Unit II. Designing Your Program
Learner-centered instruction Learning improves when the students: Take responsibility for learning. Examine new material in ways that interest and inspire them. Express their points of view while valuing those of others. Develop autonomy.
These learner-centered techniques help students build the attitude, confidence and skills necessary for life-long learning.
The Utah Stream Team offers many opportunities to apply learner-centered instruction, such as: Allow students to identify water quality issues in their community that are of concern or interest. Help students to determine what courses of action should to take on an issue. Guide students through a research design process based on the identified issue(s). Work with students to develop a stewardship project based on their findings.
The National Science Teachers Association has called for reform in schools that includes “hands-on” experimentation and learner-generated questions, investigations, hypotheses and models.
Cooperative learning Through cooperative learning experiences, students appreciate diversity in knowledge and opinions. Cooperative learning also increases achievement, provides peer support while reducing social and academic anxiety, and fosters the skills and attitudes required for collaborative work in all disciplines. The Utah Stream Team provides an excellent format for cooperative learning. Classes can work as a single group to identify topics of interest, plan a stewardship project and assess their program. Small groups are well suited for monitoring individual stream sections and sharing findings with peers. “Organizing Your Group,” section III-2, will help you plan a cooperative learning experience in the field.
Holistic learning Presenting discrete bits of information without context does little to foster critical thinking skills and conceptual understanding. Use the Utah Stream Team materials to help your students gain a holistic understanding of water quality by presenting information und the umbrella of larger, unifying concepts. Students should see the common threads that connect water and water quality concepts with all aspects of the natural world and our everyday lives.
Action-orientation Helping students to positively affect their surroundings increases their motivation for learning, sense of personal responsibility, likelihood of participating in future environmentally responsible behavior. Read more about taking action in the Stewardship section, V-3.
Interdisciplinary learning When students integrate disciplines in the study of water quality, they see that water quality and science in general is relevant to all aspects of their lives. This helps decrease much of the abstractness that science holds for many students. Read more about Interdisciplinary Learning in Section II-3.
28
Utah Stream Team Unit II. Designing Your Program
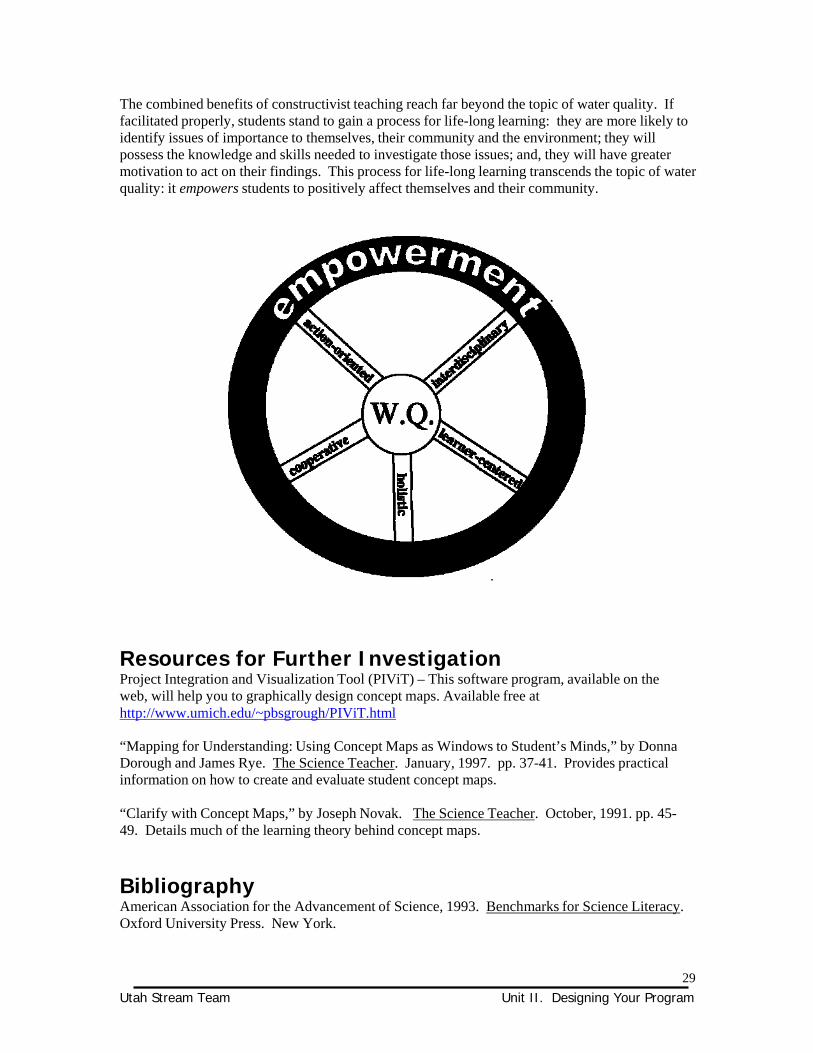
The combined benefits of constructivist teaching reach far beyond the topic of water quality. If facilitated properly, students stand to gain a process for life-long learning: they are more likely to identify issues of importance to themselves, their community and the environment; they will possess the knowledge and skills needed to investigate those issues; and, they will have greater motivation to act on their findings. This process for life-long learning transcends the topic of water quality: it empowers students to positively affect themselves and their community.
Resources for Further Investigation Project Integration and Visualization Tool (PIViT) – This software program, available on the web, will help you to graphically design concept maps. Available free at http://www.umich.edu/~pbsgrough/PIViT.html
“Mapping for Understanding: Using Concept Maps as Windows to Student’s Minds,” by Donna Dorough and James Rye. The Science Teacher. January, 1997. pp. 37-41. Provides practical information on how to create and evaluate student concept maps.
“Clarify with Concept Maps,” by Joseph Novak. The Science Teacher. October, 1991. pp. 45- 49. Details much of the learning theory behind concept maps.
Bibliography American Association for the Advancement of Science, 1993. Benchmarks for Science Literacy. Oxford University Press. New York.
29
Utah Stream Team Unit II. Designing Your Program
Brown, Robert G., 1999. Middle School Social Studies and the Cognitive Revolution. The Clearing House. 72(6):327-330.
Committee on Development of an Addendum to the National Science Education Standards on Scientific Inquiry, 2000. Inquiry and the National Science Education Standards: A Guide for Teaching and Learning. National Academy Press, Washington, D.C..
Dorough, Donna K., and James A. Rye, 1997. Mapping for Understanding. The Science Teacher. 63(1):37-41.
Elhelou, Mohamed-Wafaie, 1997. The Use of Concept Mapping in Learning Science Subjects by Arab Students. Journal of Curriculum Studies. 39(3):311-317.
Kinchin, Ian M., and David B. Hay, 2000. How a Qualitative Approach to Concept Map Analysis Can Be Used to Aid Learning by Illustrating Patterns of Conceptual Development. Educational Research. 42(1):43-57.
Lord, Thomas R., 1999. A Comparison Between Traditional and Constructivist Teaching in Environmental Science. Journal of Environmental Education. 30(3):22-28.
Novak, Joseph, 1991. Clarify with Concept Maps. The Science Teacher. 58(10):45-49
30

Utah Stream Team Unit II. Designing Your Program
II-3. Interdisciplinary Study
Through interdisciplinary study, the Utah Stream Team program can help students understand the significance of water in all aspects of life and the many ways to investigate it. Interdisciplinary study carries many added rewards. Students: understand the relevance of subjects that often seem
abstract; see how different subject areas fit together; gain enthusiasm for school-related work; and increase their level of achievement.
This section facilitates an interdisciplinary study of water quality. The chart below shows how various exercises can integrate the topic. Next, you will find two strategies for organizing an interdisciplinary field program. Consult the “Resources for Further Investigation” to find more information on interdisciplinary study.
“The concept of water may be one of the most integral of all concepts related to life and the earth and thus is critical to achieving an understanding of the complexity and interrelatedness of earth systems. Without water, life as we know it would not exist. If education is to move into an integrated and holistic mode, we must seek clear examples of concepts that can be used to bridge the so-called traditional disciplines such as biology, chemistry, social studies, mathematics and art. Water provides such an example.” - M. Brody, “Development of a Framework for Water Education,” 1995.
Science scientific process water dynamics riparian ecology connecting different
science disciplines
Making the Connections
Social Studies/ Geography
history and geography of the watershed
water law mapping watershed delineation
Math data graphing streamflow
calculations unit conversions
Water Quality
Visual Arts stream mapping watershed model-
making stream picture
collage field
journals/sketching
Language Arts water news articles letters to decision-
makers water literature
Adapted from: M.T. Denecour, Interactive Lake Ecology
31

Utah Stream Team Unit II. Designing Your Program
How can I interconnect disciplines in the field? 1) Split Science – form a cooperative learning environment between different science disciplines. With this approach each science discipline in your school, such as biology, chemistry, earth science, and physics, focuses on water quality as it relates to their discipline. For example, biology students investigate macroinvertebrates and chemistry students sample nutrients. The classes take turns teaching each other and emphasize the role each science discipline plays in forming a complete water quality picture.
2) Rotation Station – multiple classes visit the field together and rotate through stations. Classes separate along a stream stretch and teachers rotate between classes and conduct lessons from their own disciplines. For example a math teacher may work with groups to calculate stream flow while a fine arts teacher may lead a mapping exercise.
Read all about it! Produce a newspaper about your local stream
and its water quality - the “Willow Creek Times” - as a way to bring together separate investigations. The exercise will strengthen writing and graphic arts skills and provide an excellent cooperative learning experience.
Resources for Further Investigation Project WET - This curriculum and activity guide is an education program for educators and young people, grades K-12. It facilitates and promotes awareness, appreciation, knowledge and stewardship of water resources through lessons that incorporate a variety of disciplines and environments, whole-body activities, laboratory investigations, discussion of local and global topics, and involvement in community service projects. The guide is available to formal and informal educators through workshops. Contact: Project WET, 201 Culbertson Hall, Montana State University, Bozeman, MT 59717-0570, (406) 994- 5392, fax: (406) 994-1919,
Sourcebook for Watershed Education – The GREEN watershed education program is unique from other water quality monitoring programs because it emphasizes action-oriented and problem-solving approaches based on an interdisciplinary education. The Sourcebook provides practical techniques and tools for planning, implementing, and assessing a program. You’ll also find dozens of lesson plans and a great reference list divided by discipline. Contact: Cole-Misch, Sally, Larry Price, and David Schmidt. Sourcebook for Watershed Education. Global Rivers Environmental Education Network. Ann Arbor, MI. 1996.
Bibliography Cole-Misch, Sally, Larry Price, and David Schmidt. Sourcebook for Watershed Education. Global Rivers Environmental Education Network. Ann Arbor, MI. 1996.
Committee on Development of an Addendum to the National Science Education Standards on Scientific Inquiry. Inquiry and the National Science Education Standards: A Guide for Teaching and Learning. National Academy Press, Washington, D.C., c2000.
Denecour, M.T. (no date). Interactive Lake Ecology. In: Simmons, D., Archie, M., Bedell, T., Braus, J., Holmes, G., Paden, M., Raze, R., Smith, A., Spence, T., Walker, G., & Weiser, B. (1996). Environmental education materials: guidelines for excellence. Troy, OH: North American Association for Environmental Education.
32

Utah Stream Team Unit II. Designing Your Program
Grennon-Brooks, Jaqueline and Martin Brooks. The Case for Constructivist Classrooms. Association for Supervision and Curriculum Development. Alexandria, VA. 1993.
Joyce, Bruce, and Marsha Weil. Models of Teaching. Allyn and Bacon. Neidham Heights, Mass. 1996.
Trautman, Nancy. “Interdisciplinary School-Based Water Monitoring Programs,” The Volunteer Monitor. 5(1), Spring 1993. Western Regional Environmental Education Council (WREEC). Aquatic Project WILD. WREEC. Project WILD. Boulder, CO. 1987
33

34
Utah Stream Team Unit II. Designing Your Program

Utah Stream Team Unit III. Field Prep
Unit III. Field Preparation
Sections 1. In the Field
a. Where to Sample b. What to Sample c. How to Sample d. When to Sample
2. Organizing Your Group
3. Field Behavior
4. Sampling Safety
5. Before You Go
6. The Utah Stream Team Monitoring Kit
35

Utah Stream Team Unit III. Field Prep
36
Utah Stream Team Unit III. Field Prep
III-1. In the Field
Planning is essential to successful field monitoring. Before launching into the “nuts and bolts” of data collection be sure you have clearly identified goals. Knowing why you want to monitor will largely determine where, what, how and when you monitor.
This unit will help you to consider the science and logistics of your study and to avoid common mistakes.
The “In the Field” guidelines that follow offer general help for organizing your field
monitoring. They compliment the specific “Sampling Directions” found in Section IV – Field Investigation. Be sure to consult both sets of guidelines before conducting your tests.
37
Utah Stream Team Unit III. Field Prep
Where to Sample
1. Select a stream Involve your students in selecting a stream. This will help foster a sense of ownership for the stream and the program.
The Utah Stream Team is specially designed to monitor flowing water - creeks and streams. Ponds and wetlands offer rewarding monitoring experiences, too, but may require a few modifications in your approach. Refer to “Monitoring a Pond or Wetland” for help monitoring one of these water bodies.
Visit your field site before you begin
monitoring with students. This will help ensure a more successful experience.
If possible, locate a stream close to your school – walking distance is ideal. Close proximity allows for greater frequency and flexibility in monitoring, and less expense if you have to bus or carpool.
Local resource management agencies can direct you to interesting sites.
2. Select a sampling site Here is an opportunity to revisit your monitoring goals.
If you want to represent the water quality of the entire stream, sample a “representative section.” This section will have the common forms of vegetation, bank structure and stream shape for that stream. If you want to investigate human impacts, such as heavy development, choose a site where you can compare an impacted area with an unaffected area. For example, to isolate the affect of a potential impact, sample upstream of the activity (which will serve as a control site) and just
If you suspect a point- source of pollution or
contaminants in your area, contact the Division of Water Quality, but avoid sampling near the sources of potential pollution. [Refer to the “Resource” appendix for contact information].
downstream of the impact. You may also want to sample a third site, farther downstream, to determine the range of the impact. A nearby tributary can also serve as a control site.
Regardless of your goal, your sampling site should be accessible to everyone in your class and safe.
3. Document your site If you are going to sample your site again, or report your findings, be sure to document your location. Obtain a topographic map of your area. Detailed 7.5 minute (1:24,000) “quad” maps are recommended. To obtain one, check with a local resource management agency (UT Dept of Natural Resources) or camping supply store. You can also print quad maps through the US Geological Survey’s web site - http://www.water.usgs.gov/. Locate and clearly mark your site on the map. Keep the map with your Utah Stream Team manual. It will serve as a valuable teaching tool and also help future groups locate the site.
38

Utah Stream Team Unit III. Field Prep
What to Sample
Utah Steam Team provides the means for sampling seven different measurements of the water itself and an array of physical and biological components of the stream and riparian area. There are many possibilities for investigating even further. Based on your goals, you may want to include all or just some of these measurements. The questions below will help you decide what to sample.
How much time do you have? If your field time is short you can limit the scope of your sampling to only a few parameters, such as nutrients. Your areas of interest or concern will largely determine which parameters to include.
Do you want to explore aquatic life? Exploring the macroinvertebrates in the stream is exciting for students of all ages, and is an excellent activity for younger students. Macroinvertebrates are an interesting way to introduce the concept of “food chains” and offer great opportunities to study animal behavior.
Do you want to investigate human influences? You may choose to monitor the effects of a particular land use in your watershed. Consult the “Watersheds – Land Use” section for help identifying and sampling land use impacts.
Do you want to investigate natural influences? Research the geology and vegetation around your stream and watershed. Your region may have naturally high levels of certain minerals which affect water quality. Soil types and vegetation affect the physical nature of your stream. Your students can look at the variability in water quality that exists within a single site. Compare samples from riffles, eddies, backwaters, shaded areas or exposed areas. You may also find interesting differences above and below a beaver dam.
Much of the soil in Southern and Western Utah is
highly alkaline. These soils can cause higher pH in water. Streams that run through these regions may also experience natural bank erosion because of the loose soil and sparse vegetation. How do you think this affects bank structure and turbidity levels?
Do you want to investigate the relationship between different water quality parameters? Sample several different parameters and determine if or how they relate to each other. For example, turbidity often increases with stream flow while phosphate concentrations may decrease. Sample flow, turbidity and phosphate several times over an extended time period and graph the data together to help illustrate relationships.
39

Utah Stream Team Unit III. Field Prep
How to Sample Answer the questions below to determine “how” you will collect your samples.
Are you collecting chemical samples? Collect your sample from an area where water is moving at a moderate pace. Avoid backwaters (unless you want to compare flowing and still water). Collect your sample from just below the water’s surface to avoid floating oils, scums and other materials that may alter your results. Test water samples immediately after collecting or your results may change.
Are you collecting physical or biological samples?
Most chemical tests must be run within
30 minutes of collection. Nitrate and phosphate samples may be brought back to the classroom for testing if analyzed within 24 hours. (Keep samples cool and in a dark place.)
For more diverse biological samples, sample from different parts of a stream, such as slow, pooled areas as well as fast running riffles. For the most representative flows, sample a straight stretch of stream with fairly even flow. Avoid pools, stagnant areas or stretches where the stream flow has backed up.
Do you want to increase your accuracy and precision? Accurate data are representative of the true value. Keep in mind that the tests and measurements used in this program are simplified field methods which will never be as accurate as monitoring with professional equipment and methods. You can increase the confidence in your results, however, by taking several measurements and averaging these. The precision of the data represents how well you can repeat the same measurement. Your precision increases when multiple measurements become more consistent and close to each other. To increase precision, have students practice the tests ahead of time, and take care to follow directions carefully and consistently. Be as consistent as possible in how, when, and where you sample to accurately assess trends in water quality. If you stray considerably in these areas, make a note of it on your data collection sheet.
Source: Hall in Cummins and Wilzbach
40

Utah Stream Team Unit III. Field Prep
When to Sample The only rule for when to sample is: whenever you can. Sample as often as you can or when your schedule allows for it. Sampling once a year is far better than not at all. To help you determine when to sample consider how water quality changes in the following ways.
Daily changes Samples taken at different times of the day may yield different results. Changes in stream flow, air temperature, shading and the photosynthetic activity of aquatic plants affect chemical properties of water.
Seasonal changes Nutrient levels may vary seasonally with changes in the abundance of aquatic plants (plants use up nutrients in the water).
Compare early morning samples
to late afternoon samples to find differences in pH, temperature and dissolved oxygen values. Consult the background information for each parameter in Unit IV to find out why.
Spring runoff may increase nitrate levels, stream flow, and turbidity.
Macroinvertebrate populations also vary in abundance and types across seasons. You’ll find the greatest diversity in the spring and fall, and easier collecting in the fall (when water levels are low).
Sample once each season to see how water quality changes over the course of the year.
Special events High runoff events, such as spring snowmelt, may offer different results than other times of the year. Look for lower pH levels and higher turbidity.
If you wish to monitor the effects of human actions on water quality, monitor before, during and after the action. For example, if your class is interested in the effects of a
Be aware of the added safety issues that
accompany high spring streamflows. If high flows are a concern, sample in the late summer and fall when flows are lower.
construction project on turbidity in a nearby stream, measure turbidity in the stream before, during, and after the project.
Long-term trends Long-term trends will provide better insight into the health or functioning of your stream than one-time readings. Choose time(s) of year that is easiest for your group to get to the field. Try to return each consecutive year at that time.
41

Utah Stream Team Unit III. Field Prep
42
Utah Stream Team Unit III. Field Prep
III-2. Organizing Your Group
What factors will influence how you organize your group? What you would like your students to gain from sampling? In some programs each student
samples many different parameters. In other programs students specialize in one or two parameters and then share their findings with the rest of the class.
How much stream do you want to study? If you wish to monitor as much of a stream as possible (and you have enough adult supervisors) spread separate monitoring groups over a longer distance.
How much equipment do you have? More equipment allows you more flexibility. For example, you may choose to create specialized sampling teams, such as a “nutrients team,” in which several students, with several test kits, take multiple samples of the same parameter.
How prepared is your group? Proper classroom preparation allows groups more flexibility in the field; students can operate in autonomous groups (with an adult along for safety) and can run more tests in the same amount of time.
How large is your group? If you have few students (about 10 or less) then you may want to work together in a single group. Larger groups will find it more effective to split-up to avoid distractions.
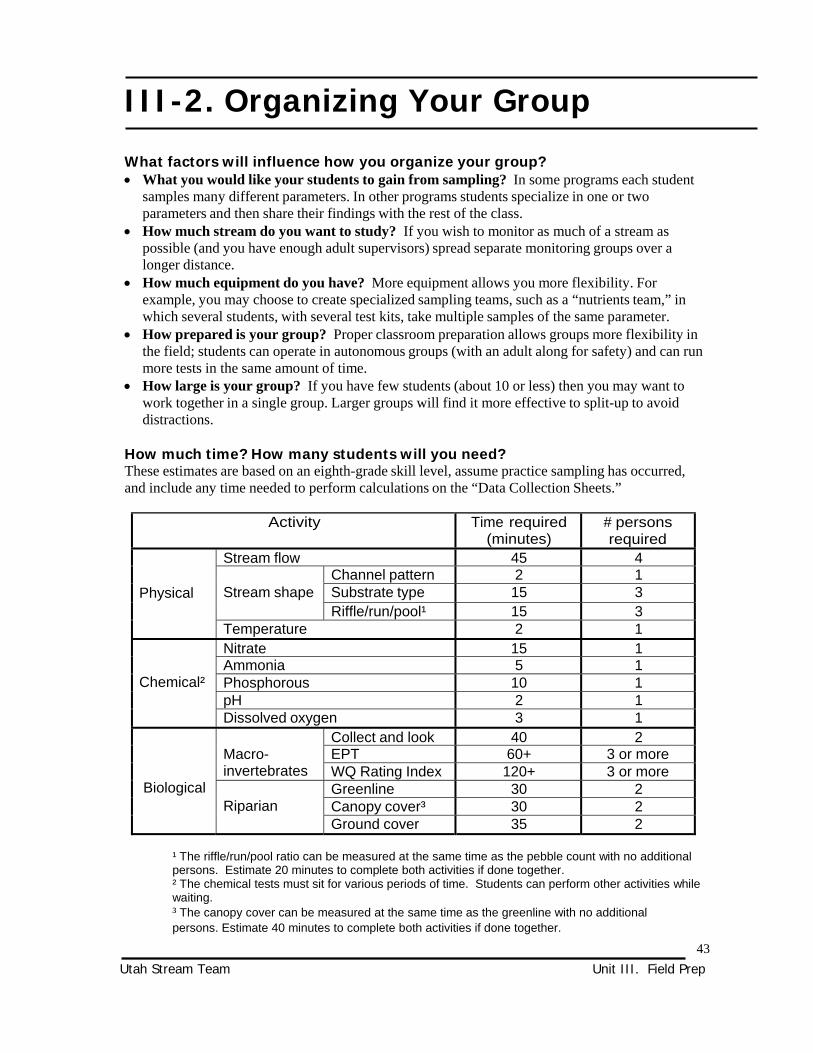
How much time? How many students will you need? These estimates are based on an eighth-grade skill level, assume practice sampling has occurred, and include any time needed to perform calculations on the “Data Collection Sheets.”
Activity Time required
(minutes) # persons required
Physical
Stream flow 45 4 Stream shape
Channel pattern 2 1 Substrate type 15 3 Riffle/run/pool¹ 15 3
Temperature 2 1
Chemical²
Nitrate 15 1 Ammonia 5 1 Phosphorous 10 1 pH 2 1 Dissolved oxygen 3 1
Biological
Macro- invertebrates
Collect and look 40 2 EPT 60+ 3 or more WQ Rating Index 120+ 3 or more
Riparian
Greenline 30 2 Canopy cover³ 30 2 Ground cover 35 2
¹ The riffle/run/pool ratio can be measured at the same time as the pebble count with no additional persons. Estimate 20 minutes to complete both activities if done together. ² The chemical tests must sit for various periods of time. Students can perform other activities while waiting. ³ The canopy cover can be measured at the same time as the greenline with no additional persons. Estimate 40 minutes to complete both activities if done together.
43

Utah Stream Team Unit III. Field Prep
What roles will your students assume? Below is one example of an organizational plan. This plan divides groups into six-person teams. Each person on the team has a unique role. In this plan, all the Utah Stream Team water chemistry parameters are sampled, as well as stream flow and macroinvertebrates.
Consider the following points, whether you follow this plan or create your own. Students should clearly understand their role before reaching the field. Students should be held accountable for completing their tasks. Give students a choice in the role they assume. This is a great planning exercise and further
increases motivation for the program. Have students switch roles on each subsequent visit.
Team leader - Makes sure team members know and accomplish their tasks. - Makes sure the group stays focused and on schedule. - Reads sampling directions aloud and makes sure they are followed. - Conducts a nutrient test.
Assistant team leader - Assists in measuring the length intervals. - Assists in measuring width of the stream. - Double-checks all measurements. - Helps with stream velocity test.
Recorder
The 6 plan will take 2 to 3 hours to complete, depending upon your groups’ abilities and preparation.
- Holds the notebook and records all information on “Data Collection Sheets.” - Makes sure group agrees on all results. - Conducts temperature tests. - Helps identify macroinvertebrates.
Wader - Measures depth of stream to determine cross-sectional area. - Assists with velocity test. - Collects Dissolved Oxygen sample. - Assists with macroinvertebrate sampling and identification. - Conducts turbidity test.
Timer/measurer - Carries stopwatch and times velocity test. - Carries tape measure and measures distances (places flags at designated intervals) - Assists with measuring width of stream - Conducts pH test
Equipment keeper - Helps carry tub with all equipment in it. - Distributes equipment. - Returns supplies and equipment to the tub; ensures all equipment is accounted for. - Conducts two nutrient tests.
44
III-3. Field Behavior
Volunteer water quality monitoring is a great tool for building appreciation and respect for our natural resources. Consider whether the actions of the entire group – teachers, students, volunteers – work towards this goal. Give careful thought to the following:
How can we help the wildlife and resources of our site? Groups of people, both small and large, have the potential to impact the aquatic and terrestrial environment in a short amount of time. Follow these guidelines to lessen your impact. Choose a site with well-vegetated banks. Avoid bare or unstable banks to minimize erosion. Avoid monitoring during particularly wet weather. Wet soils and plants are easily disturbed. In the summer, if the water is low, the stream bed may be the best route for walking. The
vegetation on the banks will thank you for it! Replace rocks and logs that have been overturned – these are homes for many critters. Handle organisms gently. They’ll appreciate being returned quickly to their homes. Place aquatic organisms directly into water-filled containers for study. Keep the containers shaded
so the sun doesn’t heat the water to harmful levels. Look for fish spawning areas – redds. Redds are round or elliptical areas of clean gravel about 1-3
feet long. They provide great opportunities for discussion but avoid walking near them.
What should we know about collecting live samples? Consider the impact of collecting (permanently removing) macroinvertebrates or other animals and plants from the site. Removal of a few items may have a minimal effect on the environment. However, students learn from the respect leaders show for each individual creature. Discuss the following aspects of collecting with students. Disturb animals as little as possible. The best place to learn about them is in their natural
environments. Encourage your students to investigate freely but collect only with a purpose. Collecting should
support instruction or other meaningful activities. Ask students to help decide whether and what to collect. Collect only specimens that are abundant. Talk with your local Utah Division of Wildlife Resources
office (contact information in “Resources” Appendix) to find out if there are any rare or endangered species in or near your stream.
45
Utah Stream Team Unit III. Field Prep

Utah Stream Team Unit III. Field Prep
46

Utah Stream Team Unit III. Field Prep
III-4. Sampling Safety
Kids and water are a natural combination. To ensure the two mix well, consider the following guidelines before going to the stream site.
How do I manage my group in the field? Have an adult supervisor accompany each separate group, with six students or less per adult. Keep a good line of communication between groups at all times (e.g., stay within hearing distance). Be aware of medical considerations. Make sure each group has ready access to first aid. Know which students are allergic to bee stings and how to handle a reaction. Know the causes and early warning signs of hypothermia and heat exhaustion. What are potentially hazardous conditions? Be aware of steep, slippery banks. Holes, vertical banks and other hazards can be especially
difficult to see when the banks are very heavily vegetated. Scout the area for dangerous trash such as broken glass, rusted wire or metal scraps. Flag areas to
avoid, if necessary. Scout the area for poison ivy, poison oak and stinging nettles. Make sure everyone in the group can
identify these plants. When is it unsafe to enter the stream? Moving water is deceptively dangerous. Don’t let students enter water over their knees or water that
is moving very fast (more than 1 foot per second). If you suspect your stream is seriously polluted, contact your local County Health Department or
local Division of Water Quality office to determine if your stream is safe for student monitoring. Never sample during a lightning storm and beware of sudden storms higher in the watershed which
could produce flash floods. Students should not enter the stream without proper clothing (waders, or good wading shoes and a
change of clothing). Never let students enter water if enough adult supervisors are not present. What are the chemical safety guidelines? Avoid contact between chemicals and eyes, nose and mouth. When opening the chemical packets,
always use the scissors provided or tear the packets. NEVER open the packets with teeth. You may wish to wear latex gloves and goggles when conducting chemical tests. Gloves and
goggles are included in your supply tub. Cover test tubes with stoppers, not fingers, when mixing. After handling chemicals, wash hands thoroughly. Use lots of water, and avoid no-water cleaners. Deposit all sample solutions in designated plastic, screw-top waste bottles (you will find these in your
monitoring kit). Flush this waste down the school sink or any sink that drains to a municipal waste water treatment facility. NOTE: The solutions remaining from the tests can be mixed together without the risk of explosion or the forming of toxic gases.
47

Utah Stream Team Unit III. Field Prep
48

Utah Stream Team Unit III. Field Prep
III-5. Before You Go… Connecting with other groups Consider the advantages of working with groups involved in water quality management, wildlife (especially fish), agriculture or other natural resource issues in your area. If these groups are conducting their own monitoring, you may be able to join in their efforts and increase the information for that stream. The data collected by these groups provide a means for checking the accuracy of your own data. Even if none of these groups monitors your stream they may still be able to provide you with valuable information on the stream or watershed, such as potential threats to the stream. Water Quality Specialists can work with your students to design appropriate ways to monitor these threats. The internet is a great place to learn about other monitoring efforts. Groups to contact include:
Federal Resource Management Agencies (Environmental Protection Agency, U.S. Forest Service) State Resource Management Agencies (Utah Division Water Quality, Utah Dept. of Water Resources) Non-government organizations (Audubon Society, Trout Unlimited)
If your sampling site is located on public land (e.g., U.S. Forest Service, Bureau of Land Management) notify the appropriate management agency. Agencies can provide you with important information, such as the latest conditions of your site or other interesting sites to monitor. They many also be able to send a ranger or biologist to speak with your group.
Your local university or Utah State University Cooperative Extension agent. Many of these groups look for opportunities to send speakers out into the community. Ask if a specialist can come talk with your class. A list of Utah groups, with their contact information, can be found in the “Resources” Appendix.
If monitoring on private property, Always obtain permission from the landowner ahead of time. Let the owner know when you will be on their land and what your group will be doing. The owner
may be interested in joining your activities. After monitoring, follow up with a thank you phone call or note from the class. The landowner may
be interested in receiving a copy of the data your class collected. Developing community support for your program Community exposure can be an important part of your program. It increases awareness of the need to protect our water resources. It may help to strengthen administrative support for your program. It may assist you in locating and obtaining funding for your monitoring program.
Contact your local newspaper and radio station a week before you head for the field. You may also want to create interest in your program through newsletters, a web site, or by posting announcements at the library or other public meeting places.
49

Utah Stream Team Unit III. Field Prep
50

Utah Stream Team Unit III. Field Prep
III-6. Utah Stream Team Monitoring Kit
Obtaining Your Kit The Utah Stream Team monitoring kits contain the supplies required to conduct all the tests and measurements covered in this manual. You can borrow a Utah Stream Team monitoring kit from Utah State University Cooperative Extension. Some schools and organizations in your area may already have kits and be willing to share. Check with your local school district office and the monitoring organizations listed in the “Resources” Appendix. Many of these materials are inexpensive and easily obtained. You may wish to purchase some of these supplies to allow greater flexibility in your monitoring program. Refer to the “Purchasing Supplies” Appendix for approximate prices and purchasing information. . Materials required for any monitoring: 1 Utah Stream Team notebook 1 calculator 1 stopwatch (or watch with second hand) 1 pair of chest waders (optional) 2 garbage bags
Additional materials required for physical stream monitoring: 1 tape measure 2 ping pong balls 4 survey flags
Additional materials required for water chemistry monitoring: water collection bottles chemical waste bottles latex gloves safety glasses field thermometer pH strips 1 pair small scissors (Phosphate, Nitrate, Ammonia only) turbidity tube Dissolved Oxygen Test Kit Phosphate Test Kit Nitrate Test Kit Ammonia Test Kit
Be sure to check the contents of your kit
Biological (Macroinvertebrate) Monitoring: 1 kick net 1 plastic pan 4 transfer pipettes 4 magnifying glasses 4 plastic petri dishes
before heading to the field and after you return. Note missing items here. Please report them when you return the kit.
51

Utah Stream Team Unit III. Field Prep
Monitoring Kit Check List:
Before After Before After
General Kit Supplies: 1 Utah Stream Team notebook Biological Monitoring Supplies: 1 pair chest waders 1 kick net 1 calculator 1 plastic pan 2 garbage bags 4 magnifying glasses 4 transfer pipettes Physical Monitoring Supplies: 4 plastic petri dishes 1 tape measure 2 ping pong balls 4 survey flags Water Chemistry Supplies: 1 turbidity tube 4 latex gloves 1 box pH strips 1 pair safety glasses 1 field thermometer 2 collection bottles 1 pair small scissors 2 waste bottles (solid and liquid) 1 Dissolved Oxygen Kit, containing:
1 Nitrate-nitrogen Kit, containing:
Box of ampoules Color comparator (black box) Sample cup Pink color disk Color standards (for comparison) Two viewing tubes
Two plastic stoppers 1 Phosphate Kit, containing: NitraVer6 reagent packets (step 1)
Color comparator (black box) NitraVer3 reagent packets (step 2) Blue color disk Long path viewing adaptor 1 Ammonia Kit, containing: Two viewing tubes (test tubes) 1 color comparator (black box) 1 Square mixing bottle 1 yellow color disk 1 Blue stoppers Two viewing tubes PhosVer3 Reagent packets Two plastic stoppers
1 bottle Nessler Reagent 1 eye dropper
52

Utah Stream Team Unit IV. Field Investigation
Unit IV. Field Investigation
This unit guides you through a water quality monitoring investigation of your local stream. You may choose to investigate one or all of the parameters in the following sections.
The sections for each parameter contain background information to help you understand and interpret your results. Specific field directions and data sheets are printed on separate pages to let you copy these easily to take with you when you sample.
Sections 1. General Stream Survey The general stream survey helps you identify basic information about the site location, the sampling date and conditions, and any insights into activities in the area that might affect water quality.
2. Physical Properties Physical measurements help you understand the movement of water through the stream and how the stream’s watershed influences the flow and general functioning of the stream. These physical properties are especially important in evaluating the quality of fish habitat.
a. Stream Flow b. Stream Shape c. Physical Data Collection Sheet
3. Chemical Properties Chemical measurements help us understand whether or not a stream’s water is polluted. The sections also explain how the different pollutants affect our uses of the streams.
a. pH b. Dissolved Oxygen c. Nutrients
Nitrogen (Nitrate and Ammonia) Phosphorus
d. Turbidity e. Temperature
4. Biological Properties The plants and animals found near and in a stream
Each monitoring section contains the following information: Background information, including
definitions, why we care about that measurement, and what might make it change over time.
A simple overview of the monitoring method
Masters for overheads Information to help you interpret
your results Resources fur further investigation Directions for sampling in the field Data collection sheets
help us understand whether or not the stream is polluted, how changes in the watershed may be influencing the stream, and how the stream and its community is changing over time.
a. Macroinvertebrates b. Riparian Vegetation
53

Utah Stream Team Unit IV. Field Investigation
54

Utah Stream Team Unit IV. Field Investigation
IV-1. General Stream Survey
A general stream survey is a good place to start you field investigation. It will provide some basic information on your stream, such as appearance and smell, that suggest a potential problem. Information on the stream’s surroundings (land use) may provide clues to the source of a water quality problem. Other observations, such as weather and time, will help you interpret your water quality data when you return to the classroom and help you compare data collected on different dates.
Filling out the “General Stream Survey Data Sheet” The following information and directions will help you understand the information requested in the General Stream Survey. NOTE: If you take separate sets of data (e.g., sample once in the morning and once in the afternoon) fill out a different data sheet for each set.
Site and Sampling Date Information Stream – Name of stream. Date – Include day, month and year.
Time of day – List the beginning and ending times (e.g., 10:30 am – 1:00 pm).
Watershed – The name of the major watershed in which your stream section is located (e.g. Spring Creek is in the Bear River Watershed).
School/group name – Self explanatory.
Teacher/leader – Self explanatory.
Group members – The name of group members with their monitoring roles in parentheses.
Location of stream section – The “stream section” runs from the furthest upstream sampling station to the furthest downstream sampling station. Be detailed in your description. Document the location as if you were describing it to someone who had never been there before. The following steps will help you determine and document a precise location. 1. Locate and mark your stream section on a 7.5' (1:24,000 scale ) topographic map (available at
sporting goods stores or from the U.S. Geological Survey on-line at http://www.water.usgs.gov/). You may want to include the latitude and longitude or UTM for your location.
2. Write directions to your stream section from a main access point or road. Include the county in which the stream is located.
3. Describe the stream section. Include the furthest upstream and downstream locations. For example, “The stream section begins at the downstream side of the bridge and runs 150 yards downstream to the cottonwood stand.”
4. Include any other significant identifying landmarks or features.
Weather in past 24 hours – Choose all categories that apply to the weather over the past 24 hours. Past weather will affect volume of flow, turbidity, temperature, and other factors in your stream. If a weather event was an unusual one, your results may be unusual, too.
55

Utah Stream Team Unit IV. Field Investigation
Weather now – Choose the one category that best represents the weather while you sampled. Air temperature – Use the field thermometer to record the air temperature. Take the temperature in the shade.
Water and Watershed Information Water appearance Water appearance is often the most obvious water quality indicator that people notice. However, it is not a precise indicator of stream health and is best considered in combination with other data you will collect. Healthy streams may range from clear to brown. Unhealthy streams are often crystal clear. The following are common stream colors and possible causes. Brown – Often results from decaying organic matter in the stream. Streams that drain wetlands may be stained a very dark brown.
Clear – Usually associated with healthy waters. However, clear waters may be polluted with colorless substances. Very clear water without any living organisms may indicate a severe pollution problem.
Multi-colored sheen – A heavy sheen may indicate floating oil from dumping or run-off from sewers, roads and parking areas. A light sheen may result from the natural breakdown of vegetation.
Foamy – If foam is fairly thin – less than 6 inches high – and grayish it may be the result of natural oils, soil particles and pollen. Heavy foam (more than 6 inches off the surface of the water) may be the result of detergents or animal waste runoff. Milky – This color may indicate pulp or paper manufacturing discharge, a dairy operation or natural sediments.
Scummy – May result from floating algae or decaying plant material. Muddy / Cloudy – May result from high amounts of sediment and indicate erosion upstream. Consider stream type and location, amount of sediment, recent storms, or seasonal events such as snowmelt. Orange / Red – May indicate runoff from mines or oil wells; may result naturally from drainage through soils rich in iron or tannins.
Green – Slightly greenish water results from the presence of microscopic plants or algae and usually indicates healthy conditions. Deep green, or pea soup color, often results from an overabundance of algae (phytoplankton). Heavy nutrient loads from fertilizers (agriculture, golf courses, lawns), animal waste (feeding operations) and poor sewage treatment often promote heavy amounts of algae. Other – What other colors do you see? Be specific.
56

Utah Stream Team Unit IV. Field Investigation
Smell Smell is another useful, but limited, tool that should be considered in combination with other indicators. Below are some common smells that result from both healthy and unhealthy waters.
Rotten egg – A sulphurous smell which often indicates sewage or animal waste pollution. Anaerobic (without oxygen) decomposition processes and minerals delivered from sulphur springs also give off this smell.
Musky – May indicate raw sewage, animal waste or heavy algal accumulation and decomposition.
Chlorine – May result from heavy chlorination of treated sewage.
Other – Smell another odor? Make a note. Land Use Around the Sampling Site Land uses around your stream and throughout your watershed can have both positive and negative effects on your water quality. Factories – Industrial facilities and others may represent a direct, or point-source of pollution. Point source pollution can be sewage, chemicals or heated water.
Pavement – Paved surfaces and roof tops (malls, stores, parking lots) don’t allow water to infiltrate into the soils. Pollutants on these surfaces (oil, antifreeze, sediment) often wash directly into streams.
Agriculture – Farm lands have the potential to deliver sediment, nutrients and pesticides to streams. Some irrigation practices in areas such as the Colorado River Basin wash salts from the soil and increase salinity levels in rivers and streams. Logging – Silvicultural activity (logging) often increases runoff and sediment and nutrient supply to the stream.
Grazing – Overgrazing can potentially deliver organic matter and nitrates to the stream. Excessive grazing of the riparian zone may damage vegetation, causing increased erosion and loss of shading by woody plants.
Homes – Fertilizers and pesticides applied to lawns often find their way into local streams during rain storms. Faulty septic tanks may increase bacteria levels and nutrients in streams. Oil and household chemicals are other common impacts. Mining – Various forms of mining may lower pH, increase heavy metal concentrations and sediment loads, and decrease streamflows. Wildlands – Healthy, well-vegetated woodlands and fields stem the flow of nutrients and organic matter to streams. Waste treatment plants – Plants that treat sewage and other polluted water often release water containing high concentrations of nutrients.
57

Utah Stream Team Unit IV. Field Investigation
Unpaved roads and trails – Unpaved roads and associated road cuts and trails created by off-road vehicles can be significant sources of sediment to streams. Stream modifications – This category includes dredging, damming, filling or channelizing through culverts.
58

General Stream Survey
Site and Sampling Date Information
Stream name Date
Time of Day Watershed name
School/group name Teacher/leader
Group members
Location of stream section Weather in past 24 hours:
storm (heavy rain) rain (steady rain)
Weather now:
storm (heavy rain) rain (steady rain)
Air Temperature
showers (intermittent rain) overcast
showers (intermittent rain)overcast degrees F
clear/sunny clear/sunny degrees C
Water and Watershed Information
Water appearance: Smell: Land use around site: clear rotten egg (sulphurous) factories brown musky pavement multi-colored sheen chlorine agriculture foamy other logging milky grazing scummy homes muddy/cloudy mining orange/red wildlands green water treatment plant other stream modifications
unpaved roads/trails other
NOTES
59

60 Utah Stream Team Unit IV. Field Investigation

Utah Stream Team Unit IV. Field Investigations
IV-2. Introduction to Physical Monitoring
Over the course of a year, the flow of a stream may vary from almost a trickle to a raging flood. These varying flows help to shape the stream’s channel. Changes in physical characteristics can also occur over the length of your stream. Investigate the many natural influences that account for changes in the physical characteristics of your stream. Then determine how these changes influence your stream’s water chemistry and the plants and animals that live in and around your stream. You can also combine your physical monitoring findings with what you have learned about watersheds and the water cycle to determine what influences humans are having on your stream. This chapter helps you investigate the physical characteristics of your stream by providing background information and sampling directions for the following:
Sections
a. Stream Flow
b. Stream Structure
61

Utah Stream Team Unit IV. Field Investigations
62

Utah Stream Team Unit IV. Field Investigations
IV-2a. Stream flow
Key Terms
base flow flood plain storm runoff channelized intermittent stream flow climate meandering stream order discharge peak flow volume ephemeral perennial
What is stream flow? Stream flow, or discharge, is the amount of water that flows past a specific point in a stream over a specific period of time. The two components of stream flow– velocity (how fast the water is moving) and volume (the amount of water in the stream) combine to determine the energy of the water. A water’s energy greatly affects the shape of the stream as well as its biological and chemical characteristics.
What natural influences affect stream flow? Climate Weather patterns have the greatest influence on stream flow. Areas with higher precipitation produce streams with greater average volume. The Wasatch Range
Stream flow types Streams which flow throughout the year are called perennial streams. Small streams, often those in the upper portions of a watershed, may be intermittent - they do not flow constantly throughout the year (usually only during the rainy season or spring runoff). In some areas of Utah, especially the drier regions, ephemeral streams are dry most of the year, flowing only for brief periods after extreme precipitation events.
receives more precipitation than the desert areas of Utah and so its streams are more numerous and, on average, have higher flows.
Season Stream flow varies throughout the year. Many rivers in Utah are fed by snow melt, and have their highest flows in the spring and early summer. Streams in southern Utah may also have very high flows in the fall due to “fall monsoons” in that region. A lower and more constant “base flow” occurs year round, fed primarily by water slowly draining into streams from the soils of the riparian areas and upper watershed. Watershed If all other factors, such as precipitation, are the same, stream volume will increase as the size of the watershed increases. This is why higher stream orders, which have larger watersheds, carry greater volumes of water. Sinuosity Most stream channels curve naturally, although some curve more than others. This curving pattern, called meandering , slows the water down and reduces its energy. Channelized, or straightened, streams have higher velocities and greater erosive power. Refer to section Stream Shape, section IV-2b, for more information.
63

Utah Stream Team Unit IV. Field Investigations
?
Friction Material in the stream – substrate, vegetation, and downed wood – create friction which decreases velocity. Larger substrate, such as cobbles and boulders, create more friction than fine- grained sediment such as mud and silt. Riparian vegetation decreases the velocity of flood waters.
How do sinuosity, obstructions and friction combine to affect the velocity of a high mountain stream? Small, high mountain streams are often filled with obstructions,
such as boulders and trees, and have large rocky stream beds. These two factors combine to slow the water. However, these streams are usually steep and fairly straight, which produces high velocity. Since slope (or gravity) has the greatest influence on velocity, we find relatively fast water in high mountain streams.
Groundwater Groundwater will contribute to stream flow if the stream channel is lower than the water table (the top of the groundwater). See Figure 4, “Gaining Stream.” During winter months, when precipitation is frozen, groundwater may be the only source of a stream’s water. If the stream channel site is above the water table, water will exit the channel and reduce stream flow as shown in Figure IV-1, “Losing Stream.” Vegetation The roots and litter of riparian and upland vegetation intercept and slow surface runoff. This helps to regulate (spread out over time) the delivery of water to the stream. Without this regulating effect, stream flow will reach higher-than-normal levels during storms and increase erosion and threaten property. Upland vegetation also regulates water delivery to a stream.
What human influences affect stream flow? Dams In order to store water and produce hydroelectric power, dams often change the natural timing and patterns of downstream river flows. Dams release water gradually over time, which eliminates natural flood cycles. The loss of flood cycles has many impacts on the floodplain below. Floods deposit sediments and nutrients back onto the floodplains and therefore help maintain healthy riparian areas. Floods create backwaters which are important habitat for young fish. Some trees require flooding before their seeds can begin to grow. Cottonwoods have become scarce in many riparian areas because flooding no longer occurs. Channelization The natural bends in a stream help to slow water down. When we channelize, or straighten, a stream we increase velocity and erosion of the stream banks. Channelization also reduces the diversity of habitats such as pools in a stream, necessary for fish and other aquatic life.
64

Utah Stream Team Unit IV. Field Investigations
Land Use Land use throughout the watershed can affect stream flow. Construction, logging, grazing, draining of wetlands and farming may alter water delivery to a stream. Urban development can have major impacts on stream flows. Impermeable surfaces, such as roads, parking lots and buildings, reduce the ability of water to soak back into the ground. Instead, the water runs off the land, causing increased flooding immediately after a storm or after snow melts. Summer flows, however, are often reduced because less water has soaked into the ground. Runoff over these “hard” surfaces also introduces more pollutants directly into the streams.
Why do we care about stream flow? Water quality Stream velocity and flow affects turbidity and dissolved oxygen (D.O.) concentrations. High-velocity streams are more erosive and suspend sediments for a longer time, leading to
greater turbidity. Turbulent, fast-moving streams are better aerated and therefore have higher concentrations
of dissolved oxygen. Greater volume maintains cooler temperatures.
Aquatic life Different stream flows create different habitats for aquatic organisms. Some organisms, such as the mayfly nymph, need highly oxygenated, swift flowing waters. Others, such as mosquito larvae, require still water. To protect the native species of a stream or river it is important to maintain natural stream flow levels.
The riparian zone Overbank flow of water is essential for the health of the riparian zone. Without these flows riparian vegetation loses important supplies of water, nutrients and sediment.
Humans Control flooding Although regular flooding occurs in natural streams, they can be costly and dangerous events for humans. Each year in the United States, about 100 people lose their lives to floods.
Many fish require both high- and low-flow stages. The Colorado pike minnow, a giant (up to 5 ft.) minnow, native to the Colorado River system, requires floods to fill backwaters for spawning and low flows for other life processes. Dams, which smooth-out the variance of flow, have helped to place this fish on the Endangered Species list.
Hydrologists can predict the stream flow that will result from a storm of a specific size. They can then recommend if evacuation is necessary during a flood event and can recommend how far back from the river to build in the first place. Land use changes in the watershed change historic patterns of water flow and challenge our ability to predict the size and extent of major floods.
Water Storage Most dams and reservoirs store water for industry, agriculture and cities. The amount and timing of stream flow determines how much water should be stored in the reservoirs. In Utah, peak stream flows occur in May and June while the highest demands for water occur in July and August. Spring runoff is stored and then released to meet water demands throughout the year.
65

Utah Stream Team Unit IV. Field Investigations
Hydrologists predict annual stream flows which determine the amount of water reservoirs need to store. When the states of Utah, Wyoming, Nevada, Colorado, New Mexico, Arizona, and California divided up the water of the Colorado River in 1922 – The Colorado River Compact – hydrologists overestimated the annual flow of the river. Instead of the correct average annual flow of 13 to 15 million acre-feet, they estimated a flow of 17 million acre-feet; and, thereby allocated too much water to each state. Problems result when each state wants to use its entire allotment of water.
What’s an acre-foot? We measure large volumes of water, such as a stream’s annual flow, in acre-feet. Water piled 1 foot high across a football field equals 1 acre- foot or 326,000 gallons. This is enough water to supply a family of five for one year!
How do we measure stream flow? This section provides background information that will help you measure stream flow. It accompanies the “Stream flow Sampling Directions” (found at the end of this section), which provide step-by-step directions and a list of the time, persons and materials needed.
Preparation 1. Before sending students out, determine whether water depth is low enough for them to wade safely across the stream (water should not reach above the students’ knees if it is flowing more than 1 foot per second). If it is not safe you have these options: a. Choose another site. b. Delay measuring until water levels drop. c. Obtain flows from another source. Accurate, up-to-the-hour information on stream
flow for many larger streams is available from the U.S. Geological Survey – www.ga.water.usgs.gov
2. If you will be taking in-stream measurements in cold water or cool weather, be sure students have waders. Regardless of temperature be sure students have a change of clothing and are wearing close-toed shoes when wading. 3. Make sure your students practice and know the sampling procedures before entering the field. This will ensure a successful field experience. Use flags or markers to create a model stream in your schoolyard.
Measuring stream flow To calculate stream flow you will need to determine average velocity (measured in feet per second – ft/s) and the average area of the cross-section of the stream (measured in square feet – ft2). Multiply velocity and area to find stream flow. Stream flow is measured in cubic feet per second (cfs).
Stream flow = velocity (ft/sec) X area (ft2)
= ft³/sec (cfs)
Velocity Velocity is determined by timing how long it takes an object (in our case a ping pong ball) to travel 50 feet along your stream section.
Measure Flood Height See “Make Your Own
Monitoring Equipment” for directions on how to make and operate a crest gauge – a tool for measuring the highest point to which flood waters rise.
66

Utah Stream Team Unit IV. Field Investigations
Colorado 16,200 105,600 2400Dolores 790 17,400 3Duchesne 520 11,500 2Fremont 90 1360 18Green 6220 68,100 255Jordan 140 450 - Little Bear 100 1030 4Logan 190 1740 5Ogden 100 1390 4
Provo 280 6100 11San Ju 2310 70,000 -Virgin 200 22,800 22Weber 500 1010 -
Area Volume is determined by measuring the cross-sectional area of the stream (width multiplied by average depth). Accuracy To increase accuracy take more measurements and average them. If you want to ensure the accuracy of your measurements or compare your sampling techniques to those of a professional, contact the U.S. Geological Survey (USGS) or the Utah Division of Water Quality (UDWQ). They can provide you with their data, explain differences in technology and methods, and may even join you in the field! Contact information is provided in the “Resources” Appendix.
How do we interpret our results? Comparisons Stream flow data allow you to compare your stream’s discharge with other streams, with other seasons and with previous years. Table IV-1 provides historic stream flow data on some notable Utah rivers. Notice the tremendous variation in flow levels over time (e.g., the Colorado River has an average flow of ~16,000 cfs but has reached flows of as much as 105,000 cfs and as low as 2400 cfs). Also, notice that the Jordan River, which runs through Salt Lake City and is the most highly regulated river on the list, has the least amount of variation in annual flow. How does your stream compare.
Table IV-1. Historic stream flows in Utah rivers [cubic feet per second]
annual mean¹ maximum² minimum³
Bear 1790 14,770 47
How much water is in a cubic foot (cf)? To picture 1 cf think of a milk crate (1’ x 1’ x 1’). Now, imagine that milk crate taking 1 second to flow by you – 1 cubic foot per second (cfs). The Colorado River, on a very high flow day, may send 70,000 or more of these milk crates by you every second!
Regulations
¹ derived from individual daily means ² highest recorded daily discharge ³ lowest recorded daily discharge [source: U.S. Geological Survey] Table IV - 1
Minimum instream flow requirements are set by water management agencies to maintain enough water in a stream for fish or other aquatic wildlife populations. These requirements are usually set in areas where water withdrawals for irrigation, power, and municipal uses such as drinking water affect stream flow levels. Check with the Utah Division of Water Rights to see if any minimum flows have been established for your stream.
Water Quality Stream flow data can help you interpret your chemical monitoring data. Graph your nutrient concentrations alongside your stream flow data. You may see higher concentrations during low flows because high flows may dilute chemical concentrations. However, during high flows the total amount of a chemical may actually increase (even though the concentration is lower). To check for this, multiply the chemical concentration by the regular flow and then by the high flow. Which total amount of nutrients is greater?
67

Utah Stream Team Unit IV. Field Investigations
Also, check for relationships between stream flow and dissolved oxygen (DO). Low DO may coincide with low flows that leave the water stagnant. DO concentrations during turbulent high flows will probably elevate.
Hydrographs If you have collected stream flow data on a regular basis (every hour, day, week), graph the data as a hydrograph. This will help you to see seasonal changes in your stream. Review the information on hydrographs from above for assistance.
Resources for further investigation Colorado Basin River Forecast Center – Use an interactive mapping tool to find information on medium- and large-sized rivers across Utah and the nation. The site provides river conditions, including historical and real-time data on flow, weather conditions and forecasts, links to other hydrology sites and the opportunity to ask questions of experts. - www.cbrfc.gov
U.S. Geological Survey – Water Science for Schools – The USGS web site offers information on many aspects of water, along with pictures, data, maps, and an interactive center where you can give opinions and test your water knowledge. You can also link to USGS real-time flow data for rivers and streams in Utah. www.ga.water.usgs.gov/edu/
Utah Division of Water Resources (UDWR) – The UDWR implements water education and water conservation programs. They also maintain accurate and current water supply and land use data for each watershed in the state. Check out their Water Conservation Web Site to learn about water use in Utah, and how we can protect and conserve our clean water supplies. You can also request UDWR publications (e.g., Utah Water Facts Brochure). Contact:http://www.nr.state.ut.us/WTRRESC/water/Cons/cons.htm
Bibliography Edelstein, Karen, Nancy Trautman, and Marianne Krasny. Watershed Science for Educators. Cornell University. New York. No date.
Environmental Protection Agency. Volunteer Stream Monitoring: A Methods Manual. Office of Water. EPA 841-B-97-003. 1997.
Mitchell, Mark and William Stapp. Field Manual for Water Quality Monitoring. Thompson- Shore Printers. Dexter, MI. 1994.
Oregon Department of Fish and Wildlife. The Stream Scene: Watersheds, Wildlife and People. Aquatic Education Program. Portland, OR. 1999.
Stolzenburg, William. “How Much Water Does a River Need?” Nature Conservancy. March/April, 1999. Pp. 8-9.
U.S. Geological Survey. 2000. Water Resources of the US. http://water.usgs.gov/nwisw/us/
68
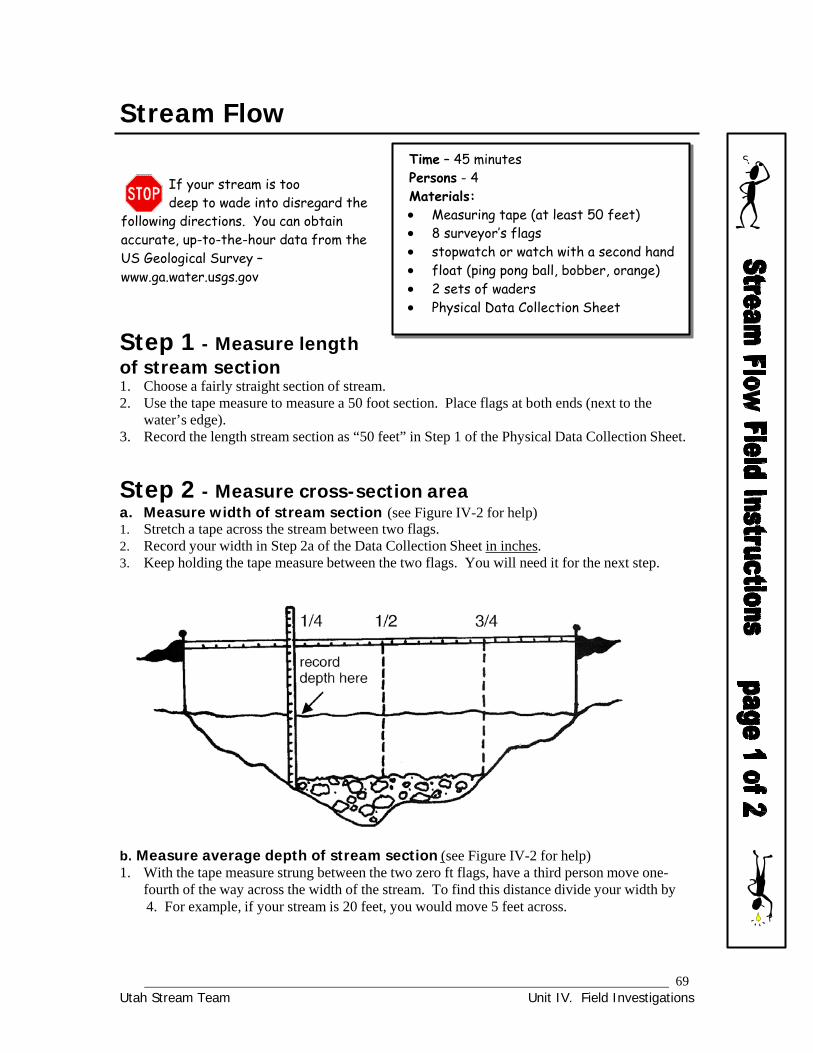
Utah Stream Team Unit IV. Field Investigations
Stream Flow
If your stream is too deep to wade into disregard the
following directions. You can obtain accurate, up-to-the-hour data from the US Geological Survey – www.ga.water.usgs.gov
Step 1 - Measure length of stream section 1. Choose a fairly straight section of stream.
Time – 45 minutes Persons - 4 Materials: Measuring tape (at least 50 feet) 8 surveyor’s flags stopwatch or watch with a second hand float (ping pong ball, bobber, orange) 2 sets of waders Physical Data Collection Sheet
2. Use the tape measure to measure a 50 foot section. Place flags at both ends (next to the water’s edge).
3. Record the length stream section as “50 feet” in Step 1 of the Physical Data Collection Sheet.
Step 2 - Measure cross-section area a. Measure width of stream section (see Figure IV-2 for help) 1. Stretch a tape across the stream between two flags. 2. Record your width in Step 2a of the Data Collection Sheet in inches. 3. Keep holding the tape measure between the two flags. You will need it for the next step.
b. Measure average depth of stream section (see Figure IV-2 for help) 1. With the tape measure strung between the two zero ft flags, have a third person move one-
fourth of the way across the width of the stream. To find this distance divide your width by 4. For example, if your stream is 20 feet, you would move 5 feet across.
69

Utah Stream Team Unit IV. Field Investigations
2. At this one-quarter mark, rest your yard stick on the stream bottom (do not dig) and record the depth in Step 2b of the Physical Data Collection Sheet. Record depth in inches.
3. Move the same distance out along your tape measure (you will now be one-half way across
the stream). Record the second depth measurement in Step 2b.
4. Record the depth at three-fourths of the way across the stream.
5. Add the three depths and divide by three to get an average depth for your stream section. c. Calculate cross-section area Fill-in the boxes in Step 2c – “Cross-section Area” – on the Physical Data Collection Sheet. Multiply the width times the depth. You now have cross sectional area in square inches. Divide that value by 144 for cross sectional area in square feet.
Step 3 – Measure velocity [ see Figure IV-3 for help] a. Calculate average travel time – the time it takes an object to travel your 50 foot section
1. Drop a floating object (ping pong ball) in the main channel upstream of your zero flag. Start the stopwatch when the object passes the zero flag (the “starting line”).
2. Yell to stop the clock when the object passes the 50 ft flag (the “finish line”).
3. Collect the object and record the time on the data sheet.
4. Repeat steps 1-3 two more times. Throw out any tests where the float gets stuck in rocks or debris.
5. Add all three travel times and divide by 3 to get an average. Record on data sheet.
Calculate velocity Divide stream section length by average travel time.
This will give you velocity in feet per second (feet/sec).
Step 4 – Calculate stream flow
Illustration: Holly Broome-Hyer
Figure IV-3
Multiply the average cross-section area times the average velocity to determine stream flow for your section. Your flow will be in cubic feet per second.
70

Utah Stream Team Unit IV. Field Investigations
IV-2b. Stream Shape
Key Terms erosion friction glide
pool riffle run
sedimentsinuosity substrate
thalweg
What is stream shape? Have you ever wondered why your stream’s channel (its physical structure) is shaped the way it is? Did you know that its shape continually changes? How do you think the stream channel affects water quality? If you understand general patterns of streams, their physical characteristics, and the natural and human influences that affect them, you will be able to answer these questions, and more!
Stream channel patterns Channels follow one of three basic patterns based upon the stream’s surrounding terrain. These patterns are described below and shown in Figure IV-2.
Meandering –A stream that meanders a lot (has a high degree of sinuosity) makes many, tight “S-turns.” We often find meandering streams in valley bottoms with little slope. The Bear and Malad Rivers of northern Utah are meandering rivers.
Straight –Streams that run down steeper slopes may not meander much at all. Their fast waters erode downward until they are often confined by a deep, narrow channel of bedrock. Look for streams like this in Utah’s Mountains.
Braided – Braided stream
71

Utah Stream Team Unit IV. Field Investigations
channels continually split and re-join. Loose bed material and sparse vegetation allow these channels to move great distances across flat, broad valley floors. Streams in glacier-carved valleys of the Uinta Mountain Range are home to many braided streams.
Figure IV-2. Different Stream Channel Shapes.
(Plan view is a view from above).
Erosion and Deposition The processes of erosion and deposition cause stream channels to constantly change.
Erosion Flowing water wears down or washes away soil and rock. We call this process erosion. Higher velocity waters are more erosive – they have more energy to pick up and move materials in the stream channel. Figure IV-3 shows us that most erosion in streams occurs on the outside of bends where velocity is fastest.
Deposition When sediment is eroded from one area of a stream it must be deposited in another. Figure IV-3 shows that deposition occurs where water moves slowly, such as the inside of a bend.
Physical characteristics of a stream channel A stream contains riffles, runs and pools,
I. Thalweg Illustration: Holly Broome-Hyer
Water, like all moving objects, wants to go in a straight line. Why then does it bounce across the channel as shown in this diagram? Well, water actually does move in straight line - it’s the channel that bends. If we follow the thalweg - water’s path of greatest velocity - we see that it travels in a straight line until it meets a bend. The thalweg then bounces off and heads straight for the next bank. This bouncing pattern slows the water down which decreases erosion.
illustrated in Figure IV-4. These different areas provide diverse habitats for fish and other aquatic life. The relative proportions of these different habitats in a stream are one way to determine how healthy the stream is.
Figure IV-3. Thalweg of stream as seen from above, and resulting erosion and disposition patterns of stream sediments.
Riffles –Water that moves over a shallow area of cobbles and gravel creates a riffle. These well-oxygenated, fast moving waters provide habitat for macroinvertebrates and spawning fish. Runs – A run, or glide, is a length of a stream with smooth water and slow to medium velocity. Runs are good areas for fish to feed and travel.
Pools – A pool is a deep area of fairly still water which creates refuges for fish to hide in and to rest from the current. Pools provide unfrozen habitat for aquatic life during the winter and also act as natural pollution filters. Some pollutants, such as suspended solids, settle out of the water and
72

Utah Stream Team Unit IV. Field Investigations
down to the bottom of pools. Obstructions –Objects in the channel, such as rocks and large woody material – fallen trees and limbs – create pools downstream. The turbulence they create mixes oxygen into the stream and the intricate spaces between tree trunks, limbs, and roots provide protection for fish.
Islands – Islands form as rocks in the channel snag sticks and leaves which then trap sediment. The trapped sediment supports hydrophilic, or water-loving, vegetation. An island soon develops and reduces turbidity. Islands also provide important habitat for fish, waterfowl and water dependent mammals, such as otters.
Side Channels – Every stream and river has a main stem – the primary path for water flow. Many streams also have side channels that enter and leave the main stem. These side channels are usually created by floods which scour paths outside the main stem. The steady water flows, rich riparian zones, and protective nature of side channels make great waterfowl nesting areas and fish nurseries.
Figure IV-4
Source: Environmental Protection Agency: Volunteer Water Quality Monitoring: A Methods Manual
73

Utah Stream Team Unit IV. Field Investigations
What natural influences affect stream shape? The natural influences described below determine the shape of a stream and how often it changes. Velocity is a shaping force – it determines the power of water to erode areas of the stream channel. Friction, which is created by substrate (the material that makes up a stream channel) and riparian vegetation resist the erosional power of water.
Velocity Faster water has more energy and is able to move more sediment of larger sizes. Once the sediment is suspended in water it acts like a sandblaster, further increasing the water’s erosional power.
Friction Water does not move smoothly down its channel. Anything that contacts water – the streambed, logs and sticks, and even wind – causes friction and slows the water down.
Substrate Faster water moves larger substrate – the material that makes up a stream’s channel. This is why we find boulders and cobbles in steep, high-velocity mountain streams; smaller particles, such as sand and silt, are carried away and deposited in low-gradient, slow-moving sections (Table IV-2). Why might you find boulders in a valley bottom stream? Think about changes in velocity that come with floods.
A stream’s velocity also varies across the channel. As the fast, outside bend erodes the bank the inside bend builds up. This is why channels with small, easily-eroded substrate will move back and forth across their floodplains, like “a snake in a bed.”
Table IV-2. Scientists divide stream substrate into different size categories shown below. Hydrologists, scientists who study water and stream channels, divide substrate into six categories based on size. Bedrock (solid rock) Boulder >12” (anything larger than a volleyball) Cobble 3–12” (golf ball to volleyball size)
Gravel 1/4–3” (pea size to golf ball size)
Sand <1/4” (smaller than a pea but large
Riparian vegetation The tough, tangled roots of rushes, sedges, shrubs and trees provide structure to streambanks. This reduces soil loss to the stream. Sticks and logs that fall in the water make the channel more complex. Vegetation also creates friction and decreases stream velocity.
The ability of water to suspend sediment depends on its velocity. To demonstrate this concept, place sediments of various sizes in a see-through container with a lid (clear 2-
liter plastic bottles work well). Add water and swirl. All the particles will be suspended at first. But, as the velocity slows, the particles will begin to fall to the bottom in sequence (largest first). When you are finished you will have a visual example of the relationship between water’s velocity and its ability to suspend and carry sediment.
74

Utah Stream Team Unit IV. Field Investigations
What human influences affect stream shape? Human activities can influence the bank structure of the stream, the amount of material that enters a stream, or the amount of water in a stream. Our actions can take affect anywhere in the watershed.
Upland impacts Activities that affect the delivery of water and sediment to a stream affect stream shape. Development, logging, mining, grazing and even hiking or biking can destroy upland vegetation which in turn causes more water and sediment to drain directly into a stream, rather than soaking into the groundwater. Short bursts of high-volume water increase erosion and form deep, narrow channels. The increased sediment delivered to a stream may cover normally rocky channels with fine sediment and organic matter.
Riparian impacts The roots of rushes, sedges, shrubs and trees provide structure to stream banks and reduce erosion. These well-vegetated banks are often steep or overhanging (many sandy riparian areas are exceptions). See picture a in Figure IV-5. Without the anchoring of riparian vegetation, the stream banks may erode and the channel may widen and become shallower, as shown in pictures b and c. The resulting channel shape increases water temperature which can decrease dissolved oxygen concentrations (see Section IV-3b on dissolved oxygen).
Figure IV-5. Changing channel shape resulting from
loss of riparian vegetation
a
Channel alterations Many streams in urban and agricultural areas have been straightened, deepened or diverted into concrete channels, often for flood control purposes or to deliver water to other areas. These alterations: simplify the physical characteristics of the channel, b reduce habitat for aquatic life increase water velocity and erosion. concrete channel beds increase water temperature which decreases dissolved oxygen concentrations.
Water table
Dams Dams, by design, reduce downstream flooding. Without the high flows and increased sediment carried by a flooding river, backwaters and side channels can’t form, beaches and riparian zones fail to receive essential supplies of sediment, and aquatic life suffers because nutrient-rich sediments remain trapped in the upstream reservoir.
c Illustration: Holly Broome-Hyer
75

Utah Stream Team Unit IV. Field Investigations
Tamarisk The banks of most streams and rivers in the Colorado River Watershed erode naturally. However, tamarisk – a widespread, non-native riparian plant – is changing this. Tamarisk’s tough, tangled roots do a great job of anchoring the streambanks. This causes the water to erode the bottom of the channel (downcutting) instead of the sides. The resulting deep, narrow channels increase water velocity, decrease important overbank flooding and inhibit formation of side channels and backwaters. It also lowers the water table (see figure 5 above). Riparian and aquatic life suffers. Many scientists are now studying ways to remove this invasive species from our river banks.
Why do we care about stream shape? Stream shape has a significant effect on water quality. Straightening of streams causes higher rates of erosion which in turn can have many impacts: Stream banks may slump, causing the loss of someone’s property. Excess, unwanted sediments may be deposited downstream, on fish spawning beds and in
macroinvertebrate habitat. Flood intensity downstream may increase. Turbidity (cloudiness of water) may also increase.
Stream shape affects water temperature, because deep, narrow channels aren’t warmed as quickly by the sun. Aquatic habitat is also affected by stream shape, because streams with many different physical characteristics provide more habitat for aquatic communities.
Each stream has unique physical properties due to its location and the nature of the surrounding watershed. Some streams may be naturally sinuous and turbid; others may be straight and clear. However, if natural or human influences cause a stream’s shape to change, water quality will likely change as well. When this happens, the aquatic life that has adapted to the old conditions may not be able to adjust to new ones. For example, some macroinvertebrates, such as caddisfly larvae, require small stones to build their protective cases. If silt and fine sediments, such as silt, cover the bottom, no building material is available for the caddisfly larva. The entire aquatic food chain may, in turn, be disrupted.
How do we monitor stream shape? There are many aspects to stream shape and therefore, many ways to measure shape and changes in shape. The directions, provided at the end of this section, will help you to determine your stream’s channel pattern, substrate and riffle/run/pool ratio. Channel pattern describes the general path the stream takes as it moves across the land (see Figure IV- 2). Substrate tells us what types of material make up the channel (see Figure IV-6). Riffle/run/pool ratio tells us what types of habitats are present in the stream, and which are the dominant habitats. (see Figure IV-4).
The Field Directions sheet, found at the end of this chapter, is designed to be laminated and carried in the field for use.
76

Utah Stream Team Unit IV. Field Investigations
How do we interpret our results? Just as we look at the chemistry and biology of a stream, we can also assess trends in channel pattern, substrate and riffle/run/pool ratios. These changes will tell us a lot about the current and future health of our stream.
We cannot say that a certain stream shape is necessarily “good” or “bad.” Each stream has its own assemblage of physical characteristics. However, aquatic life that has adapted to the physical nature of a stream and the accompanying water quality may suffer if changes occur. This is why we monitor to establish long term trends in stream shape. Read below to find out how.
Channel Patterns Straightening (channelizing) is a common change we see in channel pattern. The causes and effects are described earlier in this section. If you suspect your stream has been straightened, examine historic flow data (consult with the Utah Division of Water Resources or US Geological Survey) to see if abnormally high flows are resulting.
Channel Shape Downcutting – heavy stream bottom erosion – is another common change we see in stream shape. Downcutting results from abnormally high flows that scour the channel away. It may also result from changes in the riparian zone such as tamarisk invasion, as previously discussed. Downcutting lowers the water table, leaving riparian communities “high and dry.” High, steep banks and dead or dying riparian vegetation may be a clue that your stream is downcutting.
Substrate The dominant substrate in your stream may change naturally from larger to smaller particles (e.g. from gravel to silt) as the steepness of the stream (and therefore it’s ability to carry large substrate) changes. Erosion in your watershed may also be sending too much sediment to your stream – refer to Figure IV-6. This may result from development of the watershed (logging, grazing or other activities). Consult your local Soil Conservation District office for information. Bank erosion from a lack of riparian vegetation can also fill a channel with fine sediment.
NOTE: A stream with one uniform substrate type will support fewer types of organisms than a stream with a wide variety of substrate types.
Riffle/run/pool ratio If the ratio of riffles to runs to pools is fairly even, then the diversity of aquatic habitat is high and aquatic life will benefit. Abnormally
Figure IV-6. A rocky channel filling with silt
Source: Environmental Protection Agency: Volunteer Water Quality Monitoring: A Methods
high peak flows, often due to watershed impacts, will increase the number of runs and decrease overall structural diversity.
77

Utah Stream Team Unit IV. Field Investigations
Resources for further investigation Stream Channel Reference Sites: An Illustrated Guide to Field Techniques by the U.S. Forest Service. This manual provides an excellent introduction to basic physical sampling techniques, including cross-sections, longitudinal profiles, and pebble counts. Free copies are available from: Publications, USDA Forest Service, Rocky Mountain Station, 3825 E. Mulberry, Ft Collins, CO 80524, (970) 498-1719.
A View of the River by Luna Leopold. This classic book by America’s most renowned hydrologist draws together all the pieces of river behavior. Although there are lots of charts and graphs, the material is presented in a very understandable fashion. Harvard University Press.
Water Science for Schools – This U.S. Geological Survey (USGS) web site offers information on many aspects of water, along with pictures, data, maps and an interactive center where you can give opinions and test your water knowledge. The site also offers real-time hydrologic data (e.g., stream flows). http://ga.water.usgs.gov/edu/
Bibliography Collier, Michael, Robert H. Webb and John Schmidt. Dams and Rivers: Primer on the Downstream Effects of Dams. US Geological Survey. Tucson, AZ, 1996.
Edelstein, Karen, Nancy Trautman, and Marianne Krasny Watershed Science for Educators. Cornell University. New York. No date.
Environmental Protection Agency. Volunteer Stream Monitoring: A Methods Manual. Office of Water. EPA 841-B-97-003. 1997.
Mitchell, Mark and William Stapp. Field Manual for Water Quality Monitoring. Thompson- Shore Printers. Dexter, MI. 1994.
Oregon Department of Fish and Wildlife. The Stream Scene: Watersheds, Wildlife and People. Aquatic Education Program. Portland, OR. 1999.
Stolzenburg, William. “How Much Water Does a River Need?” Nature Conservancy. March/April, 1999. Pp. 8-9.
Summer Technology Institute. The River Continuum: Physical. Portland State University. www.oaa.pdx.edu/cae/programs/sti/pratt/hydrology.html
United States Department of Agriculture – United States Forest Service. “Large Woody Material.” US Government Printing Office. 1993.
United States Geological Survey. “Earth’s Water: Rivers and Sediment.” Water Science for Schools. http://ga.water.usgs.gov/edu/earthriversed.html.
78

Utah Stream Team Unit IV. Field Investigations
Stream Shape
Stream channel pattern Determine your stream’s channel pattern with the help of the Physical Data Collection Sheet.
Check the box next to the pattern that best describes the overall channel shape of your stream section.
Time – 2 minutes Persons - 1 Materials – Physical Data Collection Sheet
The fourth selection is an “unnatural” channel shape – it has been altered by humans. Include any altered channels, regardless of shape, in this category.
Substrate types Determine the percentage of each type of substrate in your stream by doing a “pebble count.” Follow the procedure below to perform a pebble count.
Time – 15 minutes Persons – 3 (or more) Materials – Physical Data Collection Sheet rulers
To simplify calculating percentages, take exactly 50 samples. Two students can count pebbles (each one counts 25) while one student records data on shore. Record your totals on the Physical Data Collection Sheet.
Procedure 1. When instructed by the Recorder, have the Pebble Counters take one step into the stream towards the opposite bank. 2. After that step, reach down and touch the sediment at the tip of your toe. Important: do not look at the stream bottom while doing this, as this may bias your choice. 3. Pick up the sediment and measure the longest side with a ruler (in inches). 4. Tell the length to the Recorder. Make a mark next to the correct substrate size in column A of the Physical Data Collection Sheet. Refer to the “Substrate Sizes” table for help. 5. Repeat this until you reach the other shore. Then take 30 steps upstream and return back across the stream. Continue until 50 samples are recorded. 6. Calculate the percentage of each substrate type.
1) Add up the marks for each row in column A. Write these totals in column B.
Substrate sizes Bedrock (solid rock) Boulder >12” (anything larger than a volleyball)
Cobble 3–12” (golf ball to volleyball size)
Gravel 1/4–3” (pea size to golf ball size) *Sand <1/4” (smaller than a pea but large enough to be seen with the naked eye) *Silt/clay (individual particles very hard to see with the naked eye) * If having trouble determining the difference between silt and sand, pick up a handful of sediment. Silt will feel smooth, like mud. Sand will feel rough.
2) Multiply the number in column B by “2” and record in column C. This will give you the
79

Utah Stream Team Unit IV. Field Investigations
percent of each substrate type. For example, if you recorded 31 cobbles then, (31 X 2) = 62. This means that 62% of the substrate in your stream section are cobbles.
Riffle/run/pool ratio The riffle/run/pool ratio is a measure of the kinds of habitat in your stream for fish, macroinvertebrates and other aquatic life.
Time – 15 minutes Persons – 3 Materials – Physical Data Collection Sheet
Notes Use Figure 6 below to help you correctly identify pools, riffles and runs. Practice identifying in the field before sampling.
The “Riffle/Run/Pool Procedure” can be done at the same time as the “Substrate Sampling Procedure.” Record both measurements each time you take a step across the stream.
Procedure 1. Walk along the edge of your stream, using even paces. Stop after each step and look across the stream. Determine whether the stream is a riffle, pool or run at this point in the river. Note: If there are several habitat types, choose the most common type. 2. Mark the correct habitat type in column A on the Pool/Run/Riffle chart on the Physical Data Collection Sheet. 3. Continue for exactly 50 paces (this simplifies calculating the percentage). 4. Add your marks for each row in column B. 5. Multiply the number in Column B by 2 to find the percentage of pools, runs and riffles in the stream. For example, if you sampled 31 riffles then 31 X 2 = 62. This tells you that 62% of your stream section consists of riffles.
Riffles, runs and pools
80

Utah Stream Team Unit IV. Field Investigations
Step 3 – velocity
I. a) travel times
Date:
Streamflow Recorder:
Step 1 - length of stream section feet
Step 2 - cross-section area (width x depth)
a) width
(inches) C) cross section area
b) depth 1. (inches)
2. (inches)
+ 3. (inches)
width (inches)
x depth (inches)
= (square inches) ÷ 144
=
÷ 3 =
1. (sec)
2. (sec)
(inches)
(inches)
= cross section area (square feet)
b) velocity
length (feet)
÷ average travel time (sec)
+ 3.
=
(sec)
(sec)
= velocity
(feet/sec)
÷ 3 =
average travel time (sec)
Step 4 – stream flow cross section area (square feet)
X velocity (feet/sec)
= stream flow (feet³/sec)
81

Utah Stream Team Unit IV. Field Investigations
Stream Shape
Channel Pattern
Substrate Type
Substrate type A. Record each observation
B. Total number of observations
C. Percent substrate type (column B x 2)
Silt (individual particles very hard to see with the naked eye)
Sand 1/4” (smaller than a pea but large enough to be seen with the naked eye)
Gravel ¼” – 3” (pea size to golf ball size)
Cobble 3” – 12” (golf ball to volleyball size)
Boulder >12” (anything larger than a volleyball)
Bedrock (solid rock)
Riffle/Run/Pool Ratio Feature A. Number of
observations B. Total number of observations
C. Percent feature type(column B x 2)
Riffle
Run
Pool
82
Utah Stream Team Unit IV. Field Investigation
IV-3. Introduction to Chemical Monitoring
Most substances in nature are “soluble” in water – water dissolves them. Consequently, streams with “pure” water (free of impurities) do not occur in nature. The amounts and types of impurities in the stream, whether they are natural or human-introduced, determine its chemical composition.
By monitoring the chemical composition we can show, quantitatively, changes in water quality. These changes may indicate disturbances in the watershed affecting the stream community.
This unit explains: the meaning of different types of chemical tests; how to perform the chemical tests; and how to interpret the results of those tests.
In this section, you will find information and sampling instructions for the following: a. pH b. Dissolved oxygen c. Nutrients
Nitrogen (nitrate and ammonia) Phosphorus
d. Turbidity e. Temperature
A note on “detection limits” Tests for chemicals in water have limitations. Below a certain concentration, a test cannot give you an accurate measurement of a chemical. We call this threshold the detection limit. A detection limit is listed for each chemical test method in the Utah Stream Team manual. For example, the detection limit for phosphate is .02 mg/L.
The values of most water quality tests (excluding temperature and turbidity) are determined by color change. If you cannot detect a color change in a test, report your result as “less than the detection limit,” not “0.” For example, if you get no color change when you do a phosphate test, report the results as “<0.02 mg/L.”
NOTE: Your actual detection limit may vary from the one listed in the directions depending upon how careful you were in performing the test and how well you can distinguish different colors.
PPM’s and PPB’s ? In the Chemical Properties Unit you will sometimes see chemical concentrations described as ppm (parts per million) and ppb (parts per billion). These terms indicate the amount of chemical relative to the amount of material in which the chemical is contained (usually, water). A part per million equals one milligram per liter (mg/L). A part per billion equals one milligram per 1000 liters. Visit “A Drop in the Bucket,” in the Water Pollution section, for more information on these units.
83

Utah Stream Team Unit IV. Field Investigation
84
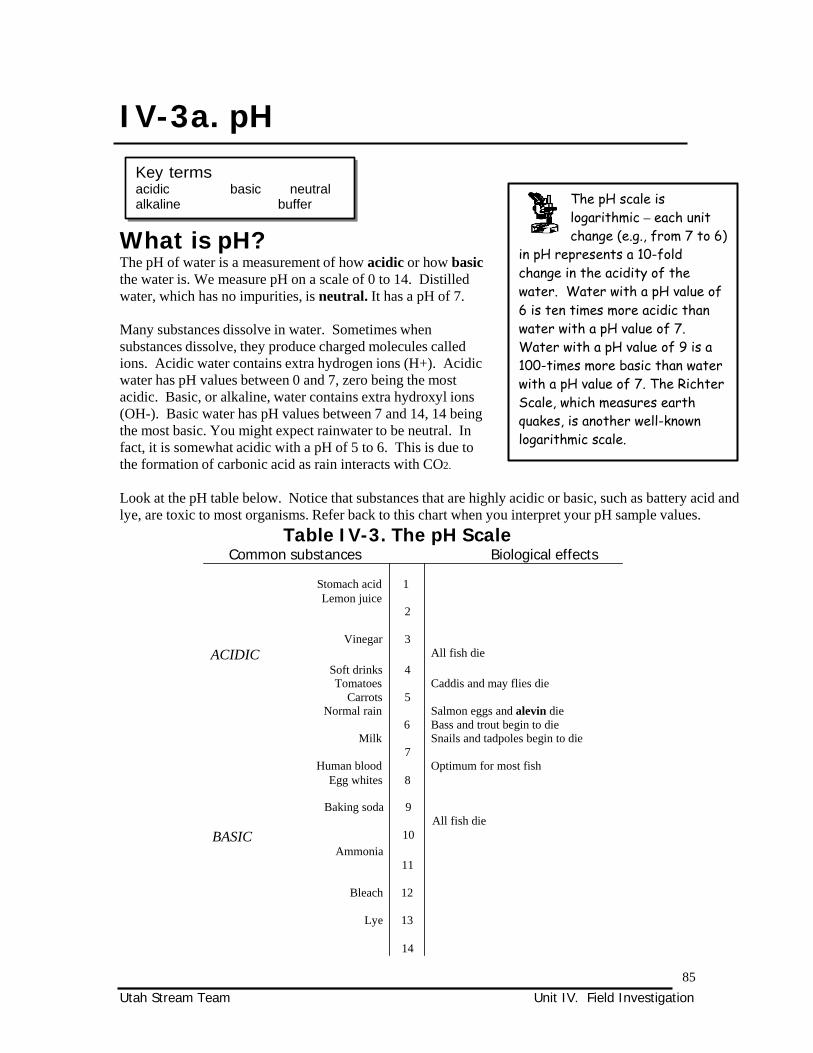
Utah Stream Team Unit IV. Field Investigation
IV-3a. pH
Key terms acidic basic neutral alkaline buffer
What is pH? The pH of water is a measurement of how acidic or how basic the water is. We measure pH on a scale of 0 to 14. Distilled water, which has no impurities, is neutral. It has a pH of 7.
Many substances dissolve in water. Sometimes when substances dissolve, they produce charged molecules called ions. Acidic water contains extra hydrogen ions (H+). Acidic water has pH values between 0 and 7, zero being the most acidic. Basic, or alkaline, water contains extra hydroxyl ions (OH-). Basic water has pH values between 7 and 14, 14 being the most basic. You might expect rainwater to be neutral. In fact, it is somewhat acidic with a pH of 5 to 6. This is due to the formation of carbonic acid as rain interacts with CO2.
The pH scale is logarithmic – each unit change (e.g., from 7 to 6)
in pH represents a 10-fold change in the acidity of the water. Water with a pH value of 6 is ten times more acidic than water with a pH value of 7. Water with a pH value of 9 is a 100-times more basic than water with a pH value of 7. The Richter Scale, which measures earth quakes, is another well-known logarithmic scale.
Look at the pH table below. Notice that substances that are highly acidic or basic, such as battery acid and lye, are toxic to most organisms. Refer back to this chart when you interpret your pH sample values.
Table IV-3. The pH Scale Common substances Biological effects
Stomach acid 1 Lemon juice
2
Vinegar 3 ACIDIC All fish die
Soft drinks 4 Tomatoes Caddis and may flies die
Carrots 5 Normal rain Salmon eggs and alevin die
6 Bass and trout begin to die Milk Snails and tadpoles begin to die
7 Human blood Optimum for most fish
Egg whites 8
Baking soda 9
BASIC 10 Ammonia
All fish die
11
Bleach 12
Lye 13
14
85

Utah Stream Team Unit IV. Field Investigation
What natural influences cause the pH of our streams to change? Watershed Effects Certain dissolved minerals, such as calcium carbonate, can combine with the extra hydrogen or hydroxyl ions that alter water’s pH. When these minerals are present, the pH of the water doesn’t change as much when acids or bases are added to the water. We call this buffered water. Many soils in our part of the west contain these minerals. When precipitation percolates these soils the minerals dissolve and the buffering quality is passed along to the water. Some watersheds contain primarily rocks with few of these buffering minerals. These watersheds, therefore, will produce poorly buffered water and any additional acid will change the pH of these waters. If you have pine or fir forests in your watershed, you may see a lower pH value for your stream. The decomposing needles of these
Limestone rock contains minerals
which buffer streams. This type of rock is found throughout central and northern Utah. How do you think this might affect the pH values of our streams? If you found low pH values (high acidity) would you want to investigate further?
trees add to the acidity of soils and also influence the acidity of nearby streams. Water that enters your stream from the water table has had a chance to percolate through soil. If the soil is buffered, and if ground water is your stream’s main source, then pH may be somewhat higher (7-8).
Seasonal effects When precipitation falls through the air, it dissolves gases such as carbon dioxide, and forms a weak acid. Natural, unpolluted rain and snow is slightly acidic – it has a pH between five and six. When snow melts rapidly it may not percolate through the soil before reaching the stream: soil minerals can’t buffer it. At these times, the stream water may also be slightly acidic.
During autumn, decomposing leaves and needles in the stream may increase the acidity of the water.
Daily effects When aquatic plants convert sunlight to energy during photosynthesis, they remove carbon dioxide from the water. This can raise the pH of your stream. Since photosynthetic activity occurs in sunlight expect the highest pH in your stream to occur in the early afternoon. Lowest pH levels will occur just before sunrise.
What human influences cause the pH of our streams to change? Polluted precipitation, also known as “acid rain,” increases the acidity of waters near many industrial or large urban areas. The main contributors to acid rain are sulfuric acid (produced by coal burning industries) and nitric acid (produced by automobile engines). In Utah our buffering soils help to decrease the effects of acid rain. Dumping industrial pollutants directly into waters – also known as point source pollution – can have intense and immediate effects. Mining may expose rocks to rain water and produce acidic runoff. Mining drainage can therefore introduce acids into streams, and if the stream is poorly buffered the pH may quickly reach toxic levels.
86

Utah Stream Team Unit IV. Field Investigation
Why do we care about the pH of our streams? Animals and plants Most aquatic animals and plants have adapted to life in water with a specific pH and may suffer from even a slight change.
Even moderately acidic waters (low pH) may reduce the hatching success of fish eggs, irritate fish and aquatic insect gills and damage membranes. Water with extremely high or low pH is deadly. A pH below 4 will kill most fish and very few animals can tolerate waters with a pH below 3. Amphibians are particularly vulnerable, probably because their skin is so sensitive to pollutants. Some scientists believe the recent drop in amphibian numbers around the world is due to low pH levels caused by acid rain.
Other chemicals in the water A change in the pH of water can alter the behavior of other chemicals in the water. The altered water chemistry may affect aquatic plants and animals. For example, ammonia is harmless to fish in water that is acidic. But, as pH increases ammonia becomes toxic. A lower pH will cause heavy metals such as cadmium, lead and chromium to dissolve more easily. Many heavy metals become toxic when dissolved in water.
How do we sample pH? We measure pH using colored indicator strips which are dipped in the water. The colors on the strips react with the water and change. The color change is compared to a chart to determine the water’s pH. The test requires one student and takes 5 to 10 minutes. If the strip cannot be dipped into the water safely, collect water with a bucket hung from a bridge or deck and then sample. The pH of the collected water may change, so sample immediately.
How do we interpret our results? Natural pH levels vary between 6.5 and 8.5, depending on the surrounding soil and vegetation. If your pH value falls out of this range ask your group these questions.
Did we perform the test correctly? Re-read the pH directions to ensure you sampled properly. Is it summer time? Water containing many aquatic plants may have raised pH values on summer afternoons because of the plant photosynthesis. Does our watershed contain a lot of granite-like rock, dense conifer forests or acidic soil? If so, you are likely to have relatively acidic waters. Does our stream have a lot of snow melt in it? Remember, snow melt will lower pH values.
If you answered “no” to these questions then take a look at your watershed. Are there land use practices that might be affecting the pH of your stream? Refer to the “Human Influences” section for possible sources of abnormal pH.
The allowable range of pH is 6.5 to 9.0 in the State of Utah.
87

Utah Stream Team Unit IV. Field Investigation
Resources for further investigation ChemTeam – This web site provides information in all standard topics for students in high school chemistry. You’ll find a special section on acids, bases and pH. Contact: www.dbhs.wvusd.k12.ca.us/ChemTeamIndex.html
Miami Museum of Science – The pH Factor – This web site introduces pH at the grade- and middle-school level, with fun lesson plans for teachers. Contact: www.miamisci.org/ph/
Project Aquatic Wild Education Activity Guide - Project Aquatic Wild is an interdisciplinary conservation and environmental education program emphasizing aquatic wildlife and the natural and human forces that affect them. You will find several hands-on classroom and field activities that focus on pH. Contact: Project Wild, 707 Conservation Lane, Suite 305, Gaithersburg, MD 20878, (301) 527-8900 (p), (301) 527-8912 (f), email: [email protected], web: www.projectwild.org
Bibliography Daugs, Don. The Comprehensive Water Education Book. International Office for Water Education. Logan, UT. 1994
Edelstein, Karen, Nancy Trautman, and Marianne Krasny. Watershed Science for Educators. Cornell University. New York. No date.
Environmental Protection Agency. Volunteer Stream Monitoring: A Methods Manual (EPA 841- B-97-003). Office of Water. Washington, DC. 1997.
Federal Water Pollution Control Administration. Water Quality Criteria. US Government Printing Office. Washington, DC. 1968.
Mitchell, Mark, and William Stapp. Field Manual for Water Quality Monitoring. Thompson- Shore Printers. Dexter, MI. 1994.
Morton, Stephen D. Water Pollution: Causes and Cures. Mimir Publishers, Inc. Madison, WI. 1976.
National Oceanographic and Atmospheric Administration. “Teacher’s Guide,” The Globe Project. www.globe.ngdc.noaa.gov/
United States Geological Survey. Water Science for Schools. http://ga.water.usgs.gov/edu/earthriversed.html. no date.
88

Utah Stream Team Unit IV. Field Investigation
pH
Time – 2 minutes Persons – 1
Materials pH strips
Step 1 Dip one strip of indicator paper in to the stream for 30 seconds then pull out.
Step 2 Wait 2 minutes.
Step 3 Compare the color of the litmus paper to the pH color key on the pH box.
Step 4 Record the number associated with the correct color match on the Chemical Properties Field Data Sheet.
Remember: Take pH readings directly in the stream. If this cannot be done safely, collect water in a bucket and take the pH reading of this water immediately.
The allowable range of pH is 6.5 to 9.0 in the State of Utah.
89

Utah Stream Team Unit IV. Field Investigation
90

Utah Stream Team Unit IV. Field Investigation
IV-3b. Dissolved oxygen
Key Terms dissolved oxygen percent saturation respiration eutrophication photosynthesis
What is dissolved oxygen? Did you ever wonder how the bugs and fish in the water breath? We may look at the bubbles of oxygen in the water and think we have our answer. But the oxygen that makes aquatic life possible does not form bubbles, nor is it the oxygen that is part of the H2O water molecule. It is a separate O2
molecule that is dissolved in the water and invisible to our eyes.
How does it get in the water? Oxygen dissolves in water in two ways. 1) Atmospheric oxygen mixes into the stream in areas of
turbulence, such as riffles.
The oxygen concentration of
most healthy streams is between 6 and 12 oxygen molecules per one million water molecules. By comparison, the atmosphere maintains a ratio of about one oxygen molecule out of five!
2) Aquatic plants release oxygen into the water during photosynthesis.
What natural influences cause dissolved oxygen concentrations to change? Elevation The amount of oxygen in the atmosphere drops as elevation increases. Since streams get much of their oxygen from the atmosphere, they too, will have less oxygen at higher elevations. Temperature The maximum amount of oxygen that can be dissolved in water is called its saturation concentration. The saturation concentration decreases as water temperature increases. The following chart (Figure IV-7) shows the relationship between water temperature and dissolved oxygen concentrations at sea level. At higher elevations, the entire line would be shifted down (less oxygen can dissolve at higher elevations). The dissolved oxygen concentration for your stream will vary throughout the year as temperatures rise and fall. As ponds and standing water heat up and cool down on a daily basis,
Open a can of warm soda - what
happens? You probably end up with a face full of foam, and the soda tastes flat. What happens when you open a cold soda? Your face stays dry and the soda tastes carbonated. The carbonation, or bubbles, in the soda comes from gas dissolved in the liquid. Cold soda holds more gas than warm soda – just like your stream.
dissolved oxygen concentrations may also change throughout the day.
91

Utah Stream Team Unit IV. Field Investigation
Dis
so
lve
d O
xyg
en
C
on
ce
ntr
atio
n
(mg
/liter)
1
5
9
13
17
21
25
29
33
37
41
45
Effect of temperature on dissolve d oxygen
16
14
12
10
8
6
4
Wate r te m per atur e (degr ees Ce ntigr ade )
Figure IV-7. The effect of temperature on dissolved oxygen – note that warmer water can hold less oxygen
Saltiness Salty water holds less oxygen than fresh water. However, the water must be very salty – as salty as ocean water – for the oxygen level to be affected. Do you think the Great Salt Lake can hold as much dissolved oxygen as a clear mountain stream? Turbulence We already know that one way for oxygen to enter a stream is through the mixing of air and water in turbulent areas. If your stream has rapids or riffles, how do you think the dissolved oxygen concentration will be affected? If you said that it increases it, you’re right. More mixing creates more opportunity for oxygen to enter the stream. In fact, if your stream is very turbulent, it may become supersaturated – the dissolved oxygen concentration rises above the saturation level. In contrast, the deep portion of lakes or reservoirs may be so isolated from the atmosphere that the oxygen concentration drops to zero. Lakes that freeze over in the winter are also isolated from the atmosphere and may lose all their oxygen. Do you think aquatic life must adapt differently to a turbulent stream than a deep lake bottom? Aquatic Life Animals living in water use oxygen just as you and I do. Bacteria also use oxygen when they decompose material. This is why we see dissolved oxygen levels drop in a water body that contains a lot of dead, decomposing material. Vegetation Aquatic plants release oxygen as part of the photosynthetic process. As photosynthesis speeds up and slows down with daily changes in sunlight, the amount of oxygen in the water changes, too. Plants also use oxygen during respiration. Streams with a lot of aquatic vegetation see wide daily fluctuations in dissolved oxygen levels. Riparian vegetation along the banks of a stream affects dissolved oxygen concentrations indirectly. By shading the stream, vegetation maintains lower temperatures, allowing the water to hold more oxygen.
92

Utah Stream Team Unit IV. Field Investigation
What time of day would you expect to find low DO levels in your stream? Photosynthesis cannot occur without sunlight. When the sun goes down, and photosynthesis stops, plants quit producing oxygen. The plants and animals in the
water, however, continue to use oxygen all night long. Because of this, oxygen levels in your stream drop through the night and reach their lowest point just before the sun rises.
What human influences cause dissolved oxygen concentrations to change? Introduction of organic waste Microorganisms, such as bacteria, decompose organic waste. Organic waste is anything that was once part of a plant or animal, such as leaves and manure. Microorganisms use up oxygen in the decomposition process. If there is a lot of organic waste in the stream, then the microorganisms multiply and use more oxygen than can be replaced in the stream. Organic wastes may come from a variety of sources: untreated sewage runoff from dairies, feedlots and other agricultural operations lawn clippings, top soil and other materials from around our homes
Land uses Land uses throughout the watershed can increase the temperature of streams and introduce excess organic material. Both impacts result in lower-than-normal DO concentrations.
Land use impacts include: Destruction of riparian areas from development or overgrazing. Loss of riparian vegetation
decreases shading and increases water temperature. Land clearing activities such as construction or logging may send excess amounts of organic
material into streams.
Why do we care about dissolved oxygen? Animals All aquatic (and terrestrial) animals need oxygen. A change in oxygen concentration may
affect the composition of aquatic communities. Many macroinvertebrate species depend on oxygen-rich water. Without sufficient oxygen they may disappear, disrupting the food chain.
Many fish require a specific range of oxygen concentrations. “Warmwater” fish, such as carp and bass, can usually live with lower oxygen concentrations than “coldwater” fish, such as trout. See Table IV-4.
How do some aquatic animals survive without much oxygen? Some of them use hemoglobin. The job of hemoglobin, besides turning your blood red, is to carry oxygen. Animals with a lot of hemoglobin can use more of the oxygen that is in the water around them – a handy trick if you’re living at the bottom of a lake. You might find some of these critters in your sample. Look for red-colored macroinvertebrates, such as fly larvae and Daphnia (water fleas).
93

Utah Stream Team Unit IV. Field Investigation
Minimum Oxygen Concentrations Required for Common Fish Minimum Summer
Concentration (mg/liter)
Minimum Winter Concentration (mg/liter)
Pike 6.0 3.1 Black Bass 5.5 4.7 Black Crappie 5.5 1.5 Yellow Perch 4.2 4.7 Sunfish 4.2 1.4 Black Bullhead 3.3 1.1 Table IV-4. Minimum oxygen requirements for common fish
Chemicals Oxygen concentration affects the behavior of other chemicals in the water. In the presence of oxygen some metals such such as cadmium solidify and sink out of the
water. Without oxygen, these solids may dissolve again into the water. The dissolved forms of many of these metals are poisonous to animals.
Nutrients change with oxygen as well. Nitrogen forms shift, and phosphorus will solidify and sink in oxygen-rich waters. Without oxygen, the phosphorus dissolves back into the water, and may overfertilize the lake.
How do we sample DO? During this test stream water is mixed with chemicals in a small ampoule, which then change color depending on the amount of oxygen present in the water. The darker blue, the more oxygen in the sample. The entire test takes about 5 minutes.
The concentrations may change after the water sample is collected, so measure the dissolved oxygen immediately after the water sample is taken.
The dissolved oxygen concentration may not be the same in all parts of your stream. Deep, still waters often have more dissolved oxygen near
their surface than at the bottom. Note the location of your sample (e.g. riffle, top of pooled-up area) to help you interpret your results.
How do we interpret our results? Do you meet the Utah State criteria? The State of Utah has set minimum dissolved oxygen concentrations to protect fish and other aquatic animals. These minimum concentrations vary according to the natural temperature of the stream. Check with the Utah Division of Water Quality (contact information in the “Resources” Appendix) to determine if your stream is a “coldwater fishery” or “warmwater fishery.”
The minimum concentration for: Streams which Utah protects for coldwater fish: 6.5 mg/liter Streams which Utah protects for warmwater fish: 5.5 mg/liter
NOTE: Values are for a 30-day average, to account for daily and weekly fluctuations.
94

Utah Stream Team Unit IV. Field Investigation
Resources for further investigation Streamkeepers Field Guide: Watershed Inventory and Stream Monitoring Methods by Tom Murdoch, Martha Cheo, and Kate O’Laughlin (2nd Edition). Section on understanding watersheds, conducting field inventories, water quality monitoring programs, keys to plant and animal life, methods of analyzing and presenting your data and how to effect changes in attitude and policy. The manual is adaptable for use by students ages 12-adult. The companion video also available. Contact: The Adopt-A-Stream Foundation at the Northwest Stream Center, 600- 128th Street SE Everett, WA 98208-6353 (425)316-8592; Fax: 425-3381423; Email: [email protected]; www.streamkeepers.org
“The Volunteer Monitor: The National Newsletter of Volunteer Water Quality Monitoring.” This bi-annual EPA publication addresses all aspects of water quality monitoring, including those specific to school and youth groups. The Spring 1997 edition (vol. 9, no. 1) addresses DO and DO sampling. Back issues are available on the internet. Contact: www.epa.gov/volunteer/spring97
Bibliography California State Water Quality Control Board. Water Quality Criteria. State Water Quality Control Board, Sacramento, CA. 1963.
Edelstein, Karen, Nancy Trautman, and Marianne Krasny. Watershed Science for Educators. Cornell University. New York. No date.
Environmental Protection Agency. Volunteer Stream Monitoring: A Methods Manual. Office of Water. EPA 841-B-97-003. 1997.
Renfro, Stacy. “Dissolved Oxygen and Temperature: The Stories You Can Tell,” The Volunteer Monitor. Vol. 11, No. 2, Fall 1999.
Williams, Robert. Rivers Curriculum Guide: Biology. Dale Seymour Publications. White Plains, NY. 1998.
95

Utah Stream Team Unit IV. Field Investigation
96

Utah Stream Team Unit IV. Field Investigation
Dissolved Oxygen
This test detects dissolved oxygen
concentrations of 0 to 12 mg/L (ppm) Collecting and handling of the water
should be done with as little shaking as possible. Shaking may cause oxygen from the air to dissolve into the water sample and produce a inaccurate measurement.
Time – 3 minutes Persons - 1 Materials - CHEMets DO Sampling Kits
Sunlight can damage the ampoules in your DO kit. Keep them shaded at all times.
Step 1 1. Pre-rinse collection bottle with stream water. 2. Fill the sample cup to the 25 mL mark with your sample.
Step 2 1. Place the CHEMet ampoule in the sample cup. 2. Snap the tip by pressing the ampoule against the side of the cup. 3. The ampoule will fill, leaving a small bubble that will help you mix the
contents of the ampoule.
Step 3 1. Mix the contents of the ampoule by turning it up and down several
times, allowing the bubble to travel from end to end each time. 2. Wipe all liquid from the outside of the ampoule.
Step 4 1. Wait 2 minutes for color development.
Step 5 1. With the sun (or another light source) shining on the comporator –
rack of colored tubes – from directly above, place the dissolved oxygen ampoule between the color standards for viewing. It is important that the ampoule be compared by placing it on both sides of the color standard tube before deciding that it is darker, lighter or equal to the color standard.
2. Record the concentration of the best color match.
In Utah: The minimum concentration for coldwater fish is 6.5 mg/L The minimum concentration for warmwater fish is 5.5 mg/L.
97

Utah Stream Team Unit IV. Field Investigation
98

Utah Stream Team Unit IV. Field Investigation
IV-3c. Nutrients
This section describes how to measure the concentrations of several nutrients in your stream – nitrogen (nitrate and ammonia) and phosphorus (phosphate). Nutrients are chemicals that are essential for plant growth. We add nutrients when we fertilize our gardens and fields. In the same way, adding nutrients to water fertilizes water-dwelling plants.
Unlike some of the common chemicals in water, such as calcium or sodium, nutrients usually occur at very low concentrations relative to plant demands. Nutrient concentrations may change dramatically throughout the year as growing plants remove them from the water and dying plants release them back into the water.
Nutrient Limitation Typically, plants in water will continue to grow until something they need (sunlight, carbon dioxide or oxygen, nutrients) runs out. Adding more of this limiting factor to the water test tube will often stimulate more plant growth.
In most streams and lakes, phosphorus or nitrogen limits plant growth. Adding more of the limiting nutrient, in fact, can stimulate too much plant growth, which starts a chain of events that may eventually deplete oxygen from the water and kill fish and other aquatic animals. For this reason, nutrients are considered a leading cause of water quality impairment in Utah.
What is a plant?
What limits plantgrowth?
Collect some water from a local pond or lake. Pour the water into two clear jars and place in a lighted area (such as a window sill). Add a few grains of house plant fertilizer to one jar. After a week, compare the color of the two jars. Is the “fertilized” jar greener? Was your water body nutrient limited?
Not all plants in water are visible. Tiny microscopic plants, called algae, may float freely in lakes, reservoirs or big rivers. Although you cannot see these individual plants with you eyes, they can become so abundant that the water turns green. Other types of microscopic algae form slimy coverings on rocks in streams.
Larger plants also grow in water. These attach to the stream or lake bottom and look similar to plants on land, with a stem and leaves.
99

Utah Stream Team Unit IV. Field Investigation
100

Utah Stream Team Unit IV. Field Investigation
Nitrogen (nitrate, ammonia)
Key terms ammonia nitrite toxicity detritus nitrogen nitrate nitrogen fixation
What is nitrogen? Nitrogen is used in building proteins and is an essential nutrient for plant and animal growth. In fact, 5 percent of the dry weight of living cells is composed of nitrogen! Nitrogen is found in a variety of forms throughout our environment and changes forms readily. The nitrogen cycle on the next page demonstrates how many different paths nitrogen may follow around our earth.
To simplify things, we can combine all of these forms of nitrogen into two groups: organic and inorganic. Organic nitrogen Organic forms of nitrogen include all the nitrogen that is part of living plants or animals, animal waste, and the remains of living things, such as dead leaves. Nitrogen that is bound up in organic forms cannot be used by plants but must first be broken down to simpler, inorganic forms.
Inorganic nitrogen Inorganic forms of nitrogen can be taken up directly by plants and bacteria, or are easily changed to a form that is usable. We measure several forms of inorganic nitrogen when we test for water quality, because of the impacts resulting from the fertilization of water plants.
Nitrogen gas (N2) Most of the inorganic nitrogen on earth exists in the form of nitrogen gas (N2), which comprises 79 percent of our atmosphere. Some simple forms of one-celled plants can also use nitrogen gas for their needs in a process called nitrogen fixation.
Nitrate (NO3) Nitrate is the most common form of inorganic nitrogen in unpolluted waters. It can be used directly by aquatic plants, so nitrate concentrations in natural surface waters may change considerably throughout a year. Because nitrate is so soluble, it moves readily into groundwater, where concentrations can be much higher than in surface waters.
Ammonia (NH3) Ammonia is formed when organic nitrogen is broken down by bacteria. Plants prefer to use ammonia over nitrate, but it is typically less abundant in natural waters. It is found at high concentrations only when dissolved oxygen concentrations are very low or when the water is polluted. Nitrite (NO2) Bacteria turn ammonia into nitrite but usually transform it again to nitrate very rapidly. Because of this, nitrite is not usually found at measurable concentrations. If nitrite is present at concentrations above 0.02 mg/liter, it usually indicates polluted waters.
Blue-green algae can use nitrogen gas directly for their nitrogen needs.
We say they “fix” nitrogen and convert it to an organic form. While this is a handy trick if there’s no other nitrogen in the water, it requires a lot of energy that the algae could use in other ways.
101

Utah Stream Team Unit IV. Field Investigation
What is the Nitrogen Cycle? The nitrogen cycle (Figure IV-8) shows the many ways nitrogen moves around our earth. Bacteria play a big role in breaking down organic nitrogen into inorganic forms, and in transforming one type of inorganic nitrogen into another. Plants use the inorganic nitrogen in soil and water and transform it into organic forms. It is then passed on to animals when the plants are eaten. Detritus (dead and decaying plant and animal material) becomes part of soils or lake and ocean sediments. Nitrogen from the land returns to streams and lakes in surface runoff.
Nitrogen gas is the most abundant gas in our atmosphere. It can be used by some simple plants, but also may be changed to nitrate by lightening! Although ammonia is usually dissolved in water, it may also enter the atmosphere as a gas. Other types of nitrogen gases are created by automobile engines. These may dissolve in rainwater and produce acid rain.
Figure IV-8 The nitrogen cycle. Note how nitrogen changes form and moves from the atmosphere to water to living organisms.
102
Utah Stream Team Unit IV. Field Investigation
What natural influences cause nitrogen concentrations in your stream to change? Seasonal changes Concentrations of nitrogen change naturally in streams throughout the season. In Utah, concentrations are often highest during the spring when snow melts, because runoff from the land brings nutrients from lawns, farms, and other areas. In fall and winter, the main source of water in many streams in Utah is groundwater, which often has naturally high concentrations of nitrate. Plant uptake Concentrations of nitrate and ammonia may be very low during periods of rapid aquatic plant growth, because the plants are taking as much as is available. During fall and winter, when plants quit growing and die, much of this nitrogen is released back into the water and concentrations generally increase.
What human influences cause nitrogen concentrations in your stream to change? Land uses in your watershed Inorganic nitrogen is extremely soluble. This means that it is easily carried in surface water and also travels easily through soils and groundwater. This allows human introductions of nitrogen to have wide-ranging effects. Common human-influenced sources of inorganic nitrogen include: fertilizers, animal manure malfunctioning septic systems discharge from sewage facilities and acid
precipitation. Some of these sources also introduce organic nitrogen
We usually don’t think of acid rain as a source of
nitrogen to our watersheds. This can happen, however, when nitric acid is formed as a by-product of the combustion in cars and other engines. Nitric acid falls to the ground as rain and snow. In some areas this is becoming a significant source of nitrogen in streams.
to our waters, which are eventually transformed into ammonia and nitrate.
Why do we care about nitrogen? Excessive plant growth When we over-fertilize our waters with nitrogen, we can cause heavy plant growth. Sometimes these plants grow on stream and river bottoms. More often, the problem occurs in the lakes and reservoirs that the streams enter. Too much nitrogen can cause floating scum or “blooms” of microscopic algae in lakes and reservoirs. Over fertilization of water can cause various problems: Excessive plant growth can decrease the aesthetic value of water bodies by making the water
cloudy or causing unsightly and smelly mats of decaying plants on the shore. When plants die in the water, bacteria go to work decomposing the dead material. This
uses oxygen. If there is too much plant material in the water, the bacteria multiply and use up all the oxygen.
103

Utah Stream Team Unit IV. Field Investigation
In extremely high concentrations, some simple
bacteria called blue green algae form neurotoxins that can kill actually kill animals drinking from the water.
Health concerns Some forms of inorganic nitrogen are poisonous to humans or to aquatic organisms. Concentrations of nitrate in drinking water
greater than 10 mg/liter can be harmful to young babies.
Nitrite can be toxic to fish, such as rainbow trout, at concentrations of about 4 mg/liter.
Ammonia may be toxic to fish and aquatic invertebrates at very low concentrations. Ammonia can affect fish at very low concentrations, especially when the water is somewhat basic (high pH) and at temperatures above 20 degrees C.
What does toxic mean? Scientists need to identify the concentration of pollutants that will harm animals that live in our streams and lakes. Laboratory experiments called “toxicity tests” are often the way we determine these concentrations. These experiments expose fish to different concentrations of a pollutant and determine what effect the pollutants have. Pollutant concentrations that cause fish to die within a few hours are called “short term toxicity concentrations.” Sometimes, the fish survive but just don’t grow or reproduce. The concentrations that produce these results are called “long term toxicity concentrations.”
How do we sample nitrate and ammonia? Both nitrate and ammonia tests are color tests, where the amount of color change is proportional to the amount of pollutant being measured.
If you wish, you can collect water samples and save them for up to two days before actually conducting the tests. If you do this, keep the water in sealed plastic jars in a dark cool place (a cooler with ice or a refrigerator).
Step-by-step directions are found at the end of this section.
Both these tests use very small quantities of poisonous chemicals.
Be careful that students never use their mouths to open reagent packets, and that they use plastic gloves or wash their hands well after running the test.
104
Utah Stream Team Unit IV. Field Investigation
How do we interpret our results? Nitrate Usually nitrate concentrations in natural streams and rivers are less than 2 to 3 mg/liter. If the stream or river is used as a source of drinking water, Utah has set a standard of 10
mg/liter. For waters used for other purposes, such as fisheries, recreation, or irrigation, the state lists a
“pollution indicator” concentration. This is not an enforceable standard, but is a benchmark the state uses to indicate possible water quality problems. When these concentrations are found, the state conducts additional studies to find the source.
In Utah: The maximum concentration of nitrate allowed in drinking water is 10 mg/liter.
The State of Utah considers nitrate concentrations of 4 mg/liter to be an indicator of pollution problems.
Ammonia The toxicity of ammonia to fish and other aquatic life is affected by the pH of the water, by the temperature of the water, and by how long the fish are exposed to the ammonia in the water.
pH effects The common form of the ammonia molecule has one nitrogen and three hydrogen atoms (NH3). This form is toxic to fish at very low concentrations. In somewhat acidic water, however, a fourth hydrogen atom attaches to ammonia, creating the ammonium ion (NH4+). Ammonium is much less toxic to fish. Therefore, we need to know the pH of water to know how toxic the ammonia concentration really is.
Temperature effects At temperatures above room temperature (about 20 degrees C), both forms of ammonia become more toxic to fish.
Exposure times Most fish can handle higher concentrations of ammonia for short periods of time (hours or less) than over longer periods of days and weeks.
105

Utah Stream Team Unit IV. Field Investigation
Am
mo
nia
co
nce
ntr
atio
n
(mg
/lite
r)
Am
monia
co
ncen
tra
tion
(mg/liter)
Toxic concentrations of ammonia to fish
at different temperatures and pH
(short term exposure -- a few hours)
25
20
pH 7
15 pH 8
10 pH 9
5
0
0 10 20 30
Water temperature (degrees Centigrade)
Figure IV-9 Figure IV-9 The effect of temperature and pH on ammonia toxicity to fish (short term exposure, just a few hours). Notice how ammonia becomes much more toxic as the water’s pH increases from 7 to 9. For example, at water temperatures of 10 degrees C, the toxic concentration at pH 7 is 21 mg/liter, but at pH 9, the toxic concentration is 1 mg/liter. A change from pH 7 to pH 9 could occur within a single day in some streams.
Toxic concentrations of ammonia to fish
at different temperatures and pH (long
term exposure -- many days)
3
2.5
2
1.5
1
pH 7
pH 8
pH 9
0.5
0
0 10 20 30
Water temperature (degrees Centigrade)
Figure IV-10
Figure IV-10 The effect of temperature and pH on ammonia toxicity fish (long term exposure, many days). Compare this graph with the one above. Notice that at the same pH and temperature, much lower concentrations affect fish exposed for long periods of time. Notice how the toxic concentration of ammonia degrees as the temperature increases. For example, at a pH of 7, the toxic concentration is 2.5 mg/liter at 0 degrees C, but at 30 degrees C the toxic concentration is 1.2 mg/liter. Luckily, temperatures this high are not often found in natural streams.
106

Utah Stream Team Unit IV. Field Investigation
Resources for further investigation “The Volunteer Monitor: The National Newsletter of Volunteer Water Quality Monitoring.” This bi-annual EPA publication addresses all aspects of water quality monitoring, including those specific to school and youth groups. You’ll find plenty of useful information on nitrogen and nitrogen sampling. Back issues are available on the internet. www.epa.gov/volunteer/spring97
Water Pollution - This web site covers most major water pollution concepts in detail. You’ll find an entire section on nitrogen and how to measure it. Information is presented at a middle- to high school level. http://www.geocities.com/RainForest/5161/lab3.htm
Bibliography California State Water Quality Control Board. Water Quality Criteria. State Water Quality Control Board, Sacramento, CA. 1963.
Edelstein, Karen, Nancy Trautman, and Marianne Krasny. Watershed Science for Educators. Cornell University. New York. No date.
Environmental Protection Agency. Volunteer Stream Monitoring: A Methods Manual. Office of Water. EPA 841-B-97-003. 1997.
Mitchell, Mark and William Stapp. Field Manual for Water Quality Monitoring. Thompson- Shore Printers. Dexter, MI. 1994.
Morton, Stephen D. Water Pollution: Causes and Cures. Mimir Publishers, Inc. Madison, WI. 1976.
United States Geological Survey. Water Science for Schools. http://ga.water.usgs.gov/edu/earthriversed.html. no date.
107

Utah Stream Team Unit IV. Field Investigation
108

Utah Stream Team Unit IV. Field Investigation
Nitrate
This test detects Nitrate at
concentrations of 0.1 to 5 mg/L (ppm)
The range for this test is 0 to 5 mg/L (ppm)
Time – 15 minutes Persons - 1 Materials - CHEMets Nitrate Sampling Kits
Sunlight can damage the ampoules in your Nitrogen kit. Keep them shaded at all times.
Step 1 1. Pre-rinse collection bottle with stream water. 2. Fill the sample cup to the 15 mL mark with your sample.
Step 2 1. Empty the contents of one Cadmium Foil Packet into the sample cup. Use caution when handling the Cadmium Packet. Tear it carefully or open with scissors. Do NOT use teeth. 2. Cap the sample cup and shake it vigorously for exactly 3 minutes. 3. Allow the sample to sit undisturbed for 30 seconds. Step 3 1. Place the ampoule in the sample cup. 2. Snap the tip by pressing the ampoule against the side of the cup. The ampoule will fill leaving a small bubble to help mixing.
Step 4 1. Mix the contents of the ampoule by turning it up and down several times, allowing the bubble to travel from end to end each time. 2. Wipe all liquid from the outside of the ampoule. Step 5 1. Wait 10 minutes for color development. Step 6 1. Use the appropriate comparator to determine the level of nitrate- nitrogen in the sample. For low range, use the tube comparator. For high range use the rack comparator.
a. Tube Comparator – Place the ampoule, flat end down into the center tube of the low range comparator. Direct the top comparator
109

Utah Stream Team Unit IV. Field Investigation
up to the sun or another bright light source while viewing from the bottom. Rotate the comparator until the color standard below the ampoule shows the closest match.
b. Rack Comparator – Hold the rack horizontal while standing underneath a bright light source. Place the ampoule between the color standards moving it from right to left along the comparator rack until the best color match is found. Step 7 1. Record the number of the best match on the comparator on your Chemical Properties Field Data Sheet. This is your nitrate-nitrogen concentration in mg/liter (ppm).
In Utah:
The maximum concentration of nitrate allowed in drinking water is 10 mg/liter.
The State of Utah considers nitrate concentrations of 4 mg/liter to be an indicator of pollution problems.
110

Utah Stream Team Unit IV. Field Investigation
.
Ammonia
NOTE: These directions are for concentrations less than 3 mg/liter. More detailed instructions can be found in the kit Detection limit = 0.10 mg/liter
Time – 5 minutes Persons - 1 Materials Hach ammonia sampling kit
Step 2 – place blank in viewer
Step 1 - assemble color viewer
Add color wheel to color comparator.
1. Pre-rinse two tubes with sample water 2. Fill one tube to the 5 ml mark with sample water 3. Place the tube in the top, left opening of the viewer. This will be your blank to control for natural water color or turbidity.
Step 3 – prepare the sample
1. Add three drops of Nessler Reagent to one tube 2. Swirl to mix. NOTE: Wait at least 1 minute but not more than 5 minutes before proceeding to Step 4
Fill to this mark
111

Utah Stream Team Unit IV. Field Investigation
Plm
Step 4 - read concentration
1. Place the tube with the reagent in the top
right opening of the viewer.
2. Hold the viewer so that your light source (sun, lamp) is behind the viewing window.
3. Rotate the color disc until the color matches in the two openings. Read the number in the scale window.
Scale window
Step 5 – Record your results
The number in the scale window is the ammonia-nitrogen concentration (mg/liter NH3-N) of your sample. Record this on your Chemical Properties Field Data Sheet.
In Utah: The maximum allowable concentration of a ammonia depends on the pH and temperature of the water.
Please refer to the Utah Stream Team manual for more information.
112

Utah Stream Team Unit IV. Field Investigation
Phosphorus
Key Terms decomposition orthophosphate
particulate phosphorusphosphorus
total phosphorus
What is phosphorus? Phosphorus is an important plant nutrient. Phosphorus occurs in many different forms in the environment, much like nitrogen. Unlike nitrogen, however, phosphorus cycles through the environment more slowly. Most of the phosphorus is found in rocks and minerals. We can divide the phosphorus in the environment into two major groups: organic and inorganic particulate and dissolved
Organic phosphorus includes all the phosphorus found in living plants or animals, their dead remains and their waste. Dissolved (soluble) forms of organic phosphorus are often organic molecules released when plants and animals decay. These molecules must be broken down by microorganisms before they can be used again by plants.
Inorganic phosphorus includes several forms. Most of the phosphorus on Earth is found in minerals, rocks and soil. The soluble form of inorganic phosphorus, called orthophosphate (PO4
-3), is the form that we will sample. Plants can use this molecule easily, but it is often very scarce in waters. For this reason, phosphorus often limits plant growth in streams and lakes.
One reason orthophosphate is scarce is that it easily attaches to tiny sediment particles and then settles out of the water. This is why orthophosphate does not move quickly through soils and into groundwater (like nitrate).
Phosphorus is common in minerals found
throughout Utah and surrounding areas. In fact, deposits of phosphorus are mined in nearby Wyoming and Idaho. This mineral form of phosphorus enters streams mainly through erosion. Phosphorus contained in rocks and sediments cannot be immediately used by aquatic plants. It may take many years for the dissolved orthophosphate molecule (the form plants can use) to develop.
What natural influences cause phosphorus concentrations in your stream to change? Phosphorus concentrations can change dramatically throughout the year. When flows are high, such as during spring runoff or after a big summer storm, sediment concentrations can be quite high in the stream. Since phosphorus attaches to sediment it, too, may be quite concentrated in the water.
How much do plants use? Concentrations of orthophosphate are usually low throughout the year. During periods of rapid plant growth, plants remove all the orthophosphate they can find. During these times, the concentration might be so low it can’t be measured by chemical tests.
113

Utah Stream Team Unit IV. Field Investigation
During fall and winter, when plants quit growing and die, some of this orthophosphate is released back into the water. However, because orthophosphate tends to attach to little particles of plant and soil materials, the measurable amounts of orthophosphate may be low even during these seasons.
What human influences cause phosphorus concentrations in your stream to change? Land uses in the watershed Activities that cause erosion in the watershed may result in particulate organic and inorganic phosphorus entering the stream: logging or building activities overgrazing in riparian areas activities which remove the riparian plants and buffer strips around our streams reduce the
ability of these areas to filter out sediments and keep them from entering the streams.
Runoff from the land can also introduce orthophosphate into a stream: fertilizers may run off lawns and agricultural fields during snow melt, rainstorms or heavy
irrigating; poorly functioning septic tanks release phosphorus into groundwater; wastewater treatment facilities from our towns often introduce large amounts of dissolved
phosphorus into our streams and rivers.
Figure IV-11. The Phosphorus Cycle—note how phosphorus enters the water from land or atmosphere and the cycles between living organisms and decayed material.
Figure IV-11 The Phosphorus Cycle
114
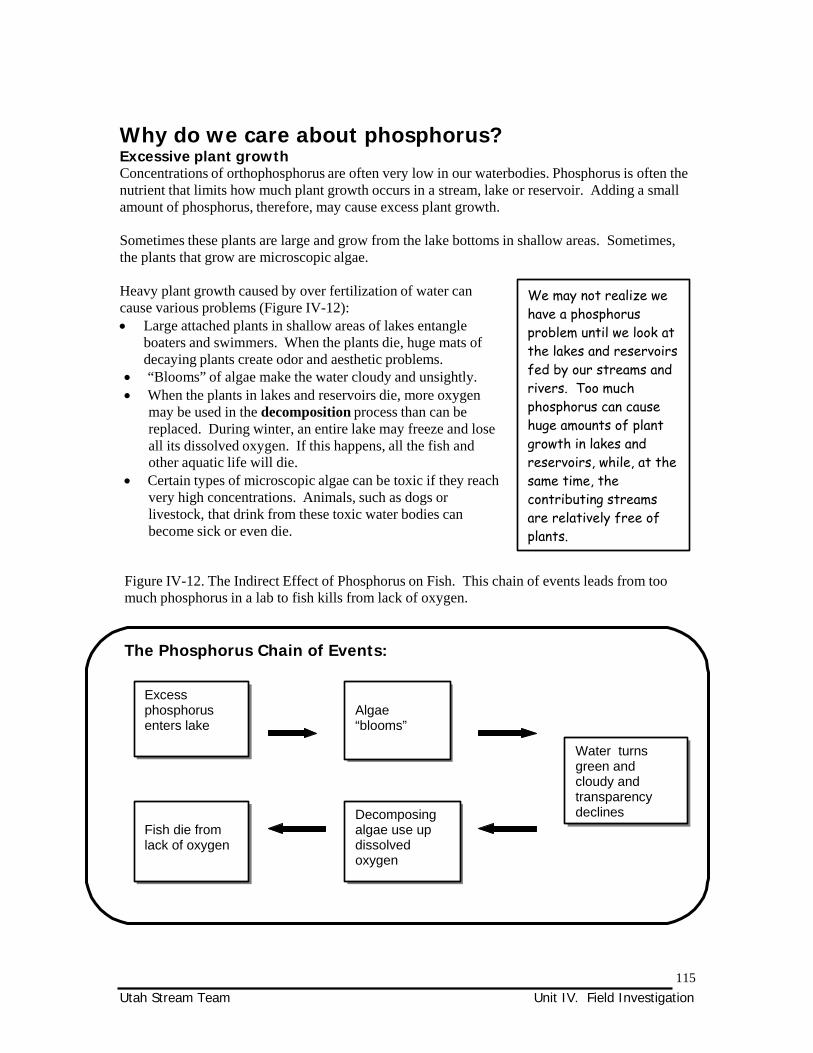
Utah Stream Team Unit IV. Field Investigation
Why do we care about phosphorus? Excessive plant growth Concentrations of orthophosphorus are often very low in our waterbodies. Phosphorus is often the nutrient that limits how much plant growth occurs in a stream, lake or reservoir. Adding a small amount of phosphorus, therefore, may cause excess plant growth.
Sometimes these plants are large and grow from the lake bottoms in shallow areas. Sometimes, the plants that grow are microscopic algae.
Heavy plant growth caused by over fertilization of water can cause various problems (Figure IV-12): Large attached plants in shallow areas of lakes entangle
boaters and swimmers. When the plants die, huge mats of decaying plants create odor and aesthetic problems.
“Blooms” of algae make the water cloudy and unsightly. When the plants in lakes and reservoirs die, more oxygen
may be used in the decomposition process than can be replaced. During winter, an entire lake may freeze and lose all its dissolved oxygen. If this happens, all the fish and other aquatic life will die.
Certain types of microscopic algae can be toxic if they reach very high concentrations. Animals, such as dogs or livestock, that drink from these toxic water bodies can become sick or even die.
We may not realize we have a phosphorus problem until we look at the lakes and reservoirs fed by our streams and rivers. Too much phosphorus can cause huge amounts of plant growth in lakes and reservoirs, while, at the same time, the contributing streams are relatively free of plants.
Figure IV-12. The Indirect Effect of Phosphorus on Fish. This chain of events leads from too much phosphorus in a lab to fish kills from lack of oxygen.
The Phosphorus Chain of Events:
Excess phosphorus enters lake
Fish die from lack of oxygen
Algae “blooms”
Decomposing algae use up dissolved oxygen
Water turns green and cloudy and transparency declines
115
Utah Stream Team Unit IV. Field Investigation
How do we sample phosphorus? [Step-by-step sampling directions can be found at the end of this section.] Utah Stream Team field tests measure the orthophosphate in water (the dissolved, inorganic form of phosphorus). This is a color test, where the amount of color change is proportional to the amount of pollutant being measured. The chemicals added to our sample cause the water to change blue if orthophosphate is present. The darker the blue, the more orthophosphate present. A color wheel is used to determine the concentration in the water.
If you wish, you can collect water samples and save them for up to two days before actually conducting the tests. If you do this, keep the water in sealed plastic jars in a dark cool place (a cooler with ice or a refrigerator).
How do we interpret our results? Phosphorus is considered a pollution indicator. It is not toxic, and its negative impacts come from the series of events that result from over-fertilizing a water body.
The State of Utah considers a total phosphorus concentration of 0.05 mg/liter in
a stream or river to be an indicator of pollution problems. A concentration of 0.025 mg/liter in lakes is considered a potential problem.
How much is 0.050 mg/liter? It is equivalent to 50 phosphorus atoms for every billion water molecules! Because orthophosphate is usually a very small percentage of the total phosphorus, the concentrations of actual plant fertilizer in water are even lower.
Resources for further investigation Environmental Protection Agency’s Volunteer Stream Monitoring: A Methods Manual - This 210-page manual takes the reader through an introduction to streams and watersheds then proceeds to offer in-depth, step-by-step approaches to monitoring a variety of water quality components. You will find helpful background information on stream temperature. For a free copy of the manual, contact Alice Mayio at USEPA (4503F), 401 M St. SW, Washington, DC 20460; 202/260-7018; [email protected]. Also available on the web: www.epa.gov/owow/monitoring/vol.html.
Kentucky Water Watch – This Kentucky Water Watch web site, administered by the State of Kentucky Natural Resource and Environmental Protection Cabinet, offers background information on all major water quality parameters, including phosphorus. You’ll also find lots of other useful information to support classroom and field monitoring. www.state.ky.us/nrepc/water/wwhomepg.htm
Water Conservation and Nonpoint Source Pollution – This activity book features hands-on, minds-on activities for younger ages. Several activities specifically address temperature concepts (in both indoor and outdoor settings). Contact: Your local County Cooperative Extension Service – or – Utah State University Extension, 1500 N 800 E, ASTE Dept, Utah State University, Logan, UT 84322-2300, (435) 797-3389. extension.usu.edu/natres/wq/
116

117Utah Stream Team Unit IV. Field Investigation
Phosphorus (phosphate)
NOTE: These directions are for concentrations less than 0.3 mg/liter PO4 - P. More detailed instructions can be found in the kit. Detection limit = 0.01 mg / liter
Time – 5 minutes Persons – 1 Materials Hach phosphorus sampling kit
Step 1 - assemble color viewer
1. Add Long Path Viewing Adaptor. 2. Add color wheel.
Step 2 - pour the blank
1. Pre-rinse 1 test tube with stream water and fill to top mark with sample water. 2. Place this tube in the left top opening of the viewer. This is your blank.
Fill to this mark
Step 3 – develop color
1. Fill square bottle to the 20 ml mark with stream water.
2. Add contents of Phosphorus Reagent packet into bottle.
3. Swirl until the powder is dissolved.

118 Utah Stream Team Unit IV. Field Investigation
NOTE: Wait at least 8 minutes but not more than 10 minutes before proceeding to Step 4.
Step 4 - read the color (concentration) 1. Fill 2nd tube to the top mark with prepared sample from Step 3.
3. Hold the viewer so that the top of the tube points toward a light source.
2. Place in top right opening of viewer.
4. Rotate the color disc until the color matches in the two openings. Read the # in the scale window.
scale window
Step 5 – Calculate and record your results
Divide the number in the scale window by 150.
This is the phosphate-phosphorus concentration (mg / liter of (PO43- -P) .
The State of Utah considers a total phosphorus concentration of 0.05 mg/liter in
a stream or river to be an indicator of pollution problems. A concentration of 0.025 mg/liter in lakes is considered a potential problem.

Utah Stream Team Unit IV. Field Investigation
IV-3d. Turbidity
Key terms nephelometric turbity units (NTUs) turbidity Secchi disk turbidity tube suspended solids
What is turbidity? If you’ve ever visited the Colorado River you were probably able to see only about 30 centimeters (~1 ft) beneath the water’s surface. On the other hand, if you visit some lakes in Alaska, you will see 30 meters (100 ft) below the surface! The amount of material suspended in the water – soil (sediment), microorganisms, pollution – affects how deeply light can penetrate. We call this material suspended solids. The Colorado River has more suspended solids in it than the Alaskan lakes and so light cannot penetrate as deeply. The degree to which light penetration is blocked by suspended solids is called turbidity. Turbidity tells us how much material is suspended in the water. Common types of suspended solids include small pieces of soil, plant material, industrial waste, and microorganisms. Any natural or artificial process that places suspended matter in water causes turbidity.
What natural influences cause the turbidity of our stream to change? The types of material that form the stream channel affect the turbidity of the water. For example, if
a stream channel runs through hard basalt bedrock, less erosion will occur than if the channel is composed mainly of loose soil.
Smaller streams carry sediments eroded from the surrounding area, and from their banks and streambeds. Larger rivers, which generally are wider, slower and more exposed to the sun, may contain many microscopic plants, which also increase turbidity.
Seasonal weather patterns will alter turbidity. Both spring
snow melt and rain increase runoff, which generally increases turbidity.
Plant root systems, both in the riparian zone and throughout the
watershed, help keep soil out of the stream which reduces turbidity. Dramatic natural events, such as forest fires, floods or wind storms, may destroy plants, resulting in erosion.
Many large rivers in Southern and
Western Utah are naturally very turbid. The loose, sandy soils add a lot of sediment to the stream. What other factors cause our large rivers, such as the Green and San Juan, to be so turbid? Look at the “Natural Influences” section for help with your answer.
119

Utah Stream Team Unit IV. Field Investigation
What human influences cause the turbidity of our stream to change? Bank stabilization helps reduce erosion and turbidity. We can improve bank stability by
maintaining healthy riparian vegetation or installing reinforcements such as wire wrap or boulders. In pools and slower moving, larger rivers, activities that introduce nutrients (plant food) to a stream
will increase microscopic algae production and increase turbidity. Any activity that increases erosion in a stream will increase turbidity (e.g. road building,
development and overgrazing in riparian zones and dredging or deepening channels).
Why do we care about turbidity? If a stream’s turbidity increases beyond natural levels, it loses its ability to support life that has adapted to those levels.
Suspended solids prevent sunlight from reaching aquatic plants that grow on the stream bottom. Without light, photosynthesis cannot take place, which may reduce the concentration of dissolved oxygen in the water. Dissolved oxygen is necessary for the survival of fish and other aquatic life.
Turbidity can raise the surface water temperatures of ponds and lakes because suspended sediment absorbs heat.
Turbidity makes it difficult for fish to see their prey. Heavy loads of suspended solids can also clog fish gills and filter-feeding devices of aquatic macroinvertebrates.
As solid matter settles, it may cover and harm bottom-dwelling plants and animals and spawning beds. Fish, such as trout, which lay eggs in redds are particularly vulnerable to sediments in the stream.
All streams have a natural level of turbidity. While some forms of aquatic life need clear water to survive, other aquatic species are adapted to and thrive in high turbidity. The Colorado River is very turbid, yet its waters hold abundant life.
How do we sample turbidity? We measure turbidity of streams with a turbidity tube. Fill the tube with stream water, then release the water until you can see the black and white disk at the bottom. The depth in the tube to this point is recorded. The test takes about 5 minutes.
For ponds, wetlands or lakes, a Secchi disk is usually used. This black and white disk is lowered into the water until it is no longer visible and that depth is recorded.
How do we interpret our results? To compare our results with state standards, we need to convert the distance measured with the turbidity tube to standard turbidity units. Because turbidity is usually measured with an instrument called a nephelometer, the turbidity unit is a NTUs (Nephelometric Turbidity Units). The higher the turbidity (NTUs) the greater the amount of scattered light, or the cloudier the appearance. Use the conversion chart on the back of the field directions.
120

Utah Stream Team Unit IV. Field Investigation
Standards for NTUs in Utah (Utah’s Standard is for an increase in turbidity over natural levels. This increase may apply to one site over time or from one site to another at the same time).
In Utah: An increase of more than 10 NTUs over natural levels is considered unacceptable for:
Aesthetics Warmwater fisheries Coldwater fisheries Drinking water Non-game aquatic life
An increase of more than 15 NTUs over natural levels is considered unacceptable for:
Water-oriented wildlife
Check with the Utah Division of Water Quality for an established natural level of turbidity for your water body. If no level has been established, you can create a benchmark and then monitor for increases or decreases over time. Be sure to note natural conditions or events that may affect your measurements at the time of sampling, such as spring melt or recent heavy precipitation.
Resources for further investigation “The Volunteer Monitor: The National Newsletter of Volunteer Water Quality Monitoring.” This bi-annual EPA publication addresses all aspects of water quality monitoring, including those specific to school and youth groups. You’ll find plenty of useful information on turbidity and turbidity sampling. Back issues are available on the internet. www.epa.gov/volunteer/spring97
Water Conservation and Nonpoint Source Pollution – This activity book features hands-on, minds- on activities for younger ages. Several activities specifically address temperature concepts (in both indoor and outdoor settings). Contact: Your local County Cooperative Extension Office – or – Utah State University Extension, 1500 N 800 E, ASTE Dept, Utah State University, Logan, UT 84322-2300, (435) 797-3389. extension.usu.edu/natres/wq/index/htm. Water Pollution - This web site covers most major water pollution concepts in detail. You’ll find an entire section on nitrogen and how to measure it. Information is presented at a middle- to high school level. http://www.geocities.com/RainForest/5161/lab3.htm
Bibliography Camp, Thomas R. Water and its Impurities. Reinhold Publishing Corporation. New York, 1963. Mitchell, Mark and William Stapp. Field Manual for Water Quality Monitoring. Thompson-Shore Printers. Dexter, MI. 1994. Morton, Stephen D. Water Pollution: Causes and Cures. Mimir Publishers, Inc. Madison, WI. 1976.
121

Utah Stream Team Unit IV. Field Investigation
122

123 Utah Stream Team Unit IV. Field Investigation
Turbidity
Detection limit = 6 NTU
Step 1 – collect your sample 1. Dip the tube into the water at your
sampling site and fill to the top. Be careful to sample flowing water and not the stream bottom.
Time – 2 minutes Persons - 1 Materials – Turbidity tube
Step 2 – Take your measurement (see figure below for help) 1. Take your filled turbidity tube to a shaded spot. If there is no shade around, use your
body to block the sun from shining on the tube. 2. With your hand over the opening, shake the tube vigorously. This will help to re-suspend
any sediment that has settled to the bottom. 3. Look down through the tube toward the target disk on the bottom of the tube.
If the disk is visible, record the water level in centimeters (cm). If the disk is not visible, slowly release water from the release valve, until the disk
becomes visible. Record the water level in centimeters (cm) on the Chemical Data Collection Sheet.
Step 3 – Convert from centimeters (cm) to turbidty units (NTU’s) 1. Match your turbidity measurement in centimeters to the corresponding NTUs using the conversion chart on the back of this page. Record on the Data Collection Sheet.
Look down into water from above

124 Utah Stream Team Unit IV. Field Investigation
Turbidity Conversion ChartDistance from bottom of tube
(cm)
NTU’s
< 6.25 > 2406.25 to 7 240 7 to 8 185 8 to 9.5 150 9.5 to 10.5 120 10.5 to 12 100 12 to 13.75 90 13.75 to 16.25 65 16.25 to 18.75 50 18.75 to 21.25 40 21.25 to 23.75 35 23.75 to 26.25 30 26.25 to 28.75 27 28.75 to 31.25 24 31.25 to 33.75 21 33.75 to 36.25 19 36.25 to 38.75 17 38.75 to 41.25 15 41.25 to 43.75 14 43.75 to 46.25 13 46.25 to 48.75 12 48.75 to 51.25 11 51.25 to 53.75 10 53.75 to 57.5 9 57.5 to 60 8 Over the top 6
Utah standards state that an increase of more than 10 NTUs is unacceptable for most waters.
This increase can be over natural levels or from one location to
another nearby downstream location.

Utah Stream Team Unit IV. Field Investigation
IV-3e. Temperature
Key terms
temperature Centigrade Fahrenheit Celsius warmwater fish coldwater fish
What is temperature? Have you ever put your hand in mountain stream in the spring? How about a big lake or reservoir in late summer? Why were the temperatures so different? Why does it matter to water quality? Read below and find out.
The temperature of water is a measure of how much heat energy the water contains. Temperature can be measured on many different scales. In the U.S. we usually use the Fahrenheit scale. On the Fahrenheit scale, water freezes at 32 degrees and boils at 212 degrees. Scientists usually use the Centigrade (or Celsius) scale. Water freezes at 0 degrees C and boils at 100 degrees C.
Table IV-5. Comparison of Celsius and Fahrenheit Temperature Scales.
Temperature Scales Celsius Fahrenheit
Boiling point of water at sea level
38C (98.6 F) – average human body temperature Average room temperature Melting (freezing) point of ice (water) at sea level
-50C (-59F) – 2nd lowest recorded temperature
in continental U.S. (near Logan, UT)
-67C (-89F) – lowest recorded temperature - Antarctica, July, 1983
100 90 80 70 60 50 40 30 20 10 0
-10 -20 -30 -40 -50 -60 -70 -80 -90 -100
212 194 176 158 140 122 104 86 68 50 32 14 -4 -22 -40 -58 -76 -94 -112
-130 -148
Converting Fahrenheit to Celsius Converting Celsius to Fahrenheit C = (5/9) x (F-32) F = [(9/5) x C] + 32
125

Utah Stream Team Unit IV. Field Investigation
What natural influences cause temperature to change? Your stream heats up from direct sunlight and from heat in the surrounding land and air. Water is different than almost any other substance on earth. It takes a lot more heat energy to increase the temperature of water than it does to increase the temperature of the surrounding land and air. Thus, water heats up and cools off more slowly than air or land. Water temperatures vary by:
Geographic area The temperature of streams reflects the surrounding climate. Streams in warm climates generally stay warm throughout the year while streams in colder climates tend to change more throughout the year.
Seasons Water temperature changes as the air temperature changes throughout the seasons. Your water body may freeze at the surface in the winter but be very warm during the summer.
Source of the water Streams fed by snow melt will be very cold in the early spring and summer. Streams fed by cold water springs may remain cool all year long. Hot water springs may keep sections of a stream warm throughout the year.
The water in a stream is constantly
mixing. Therefore, its temperature usually remains the same at all depths. However, if the water is moving very slowly, or pools-up in an area, you may find different temperatures at different depths. Lakes and reservoirs often change dramatically in temperature from the surface to the bottom.
Channel shape Because stream water heats up from the sun and from contact with the warmer earth, a narrow, deep stream will be cooler than a wide, shallow stream, if all other factors are equal.
Riparian shading A stream that receives a lot of shading from riparian vegetation will stay cooler than a stream that is more exposed to the sun.
What human influences cause temperature to change? When the shade provided by riparian vegetation is removed, streams heat up faster. If activities cause a stream channel to become shallower and wider, the stream will heat up
faster. Deep, narrow channels remain cooler. Removing riparian vegetation may also lead to a wider and shallower channel which leads to increased temperatures.
The material on the stream bottom and banks affects water temperature. A stream that travels through a concrete channel absorbs more heat than a stream travelling through a plant-filled meadow.
Industries (such as power plants) may discharge warm water into a stream.
126

Utah Stream Team Unit IV. Field Investigation
Because cold water is heavier than warm, it sinks below warm water in lakes. You may feel this when you swim in a lake and dive below the warm surface water into COLD deeper water.
A funny thing happens to very cold water, however. At about 4 degrees C (39 degrees F), fresh water becomes as heavy as it will get. As it continues to cool it starts to get lighter again. When water freezes, it is much lighter than liquid water (ice floats, right?). Therefore, in a frozen lake, the water is coldest at the top (0 degrees C), and warmest at the bottom (4 degrees C). In a summer lake, the water is warmest on the top and coldest at the bottom.
Why do we care about temperature? Water temperature greatly affects aquatic organisms. Most aquatic organisms –
macroinvertebrates, fish, amphibians – are “cold-blooded.” Their metabolism speeds up and slows down with the animal’s surrounding temperature. Each organism has adapted to survive best at a given range of temperatures. If the temperature changes too drastically, their metabolism will not function as well, decreasing their ability to survive and reproduce.
The optimal temperature is not the same for all aquatic organisms. For example, trout do best at temperatures below 22C while carp may do fine in temperatures as high as 28C. We divide fish into coldwater fish (fish who require fairly cool temperatures) and warmwater fish (fish who can survive warmer water temperatures).
Warmer water holds less dissolved oxygen than cold water. Aquatic organisms may have trouble getting enough oxygen at very warm temperatures. For example, 11 mg/liter of dissolved oxygen can dissolve in 10C water, while water at 30C can dissolve only 7.5 mg/liter.
How do we sample temperature? Detailed sampling directions are included at the end of this section. When measuring temperature with a field thermometer, we usually measure only the surface temperature of the water body. To measure the temperature of deep pools, attach your thermometer to a pole or stick, or attach a string and a weight to it.
If you cannot reach moving water safely from the shore, attach a string to the thermometer and lower it from the bank or a bridge into the water.
Be aware that the temperature below the surface may be different, especially if the water is still (turbulent water mixes and keeps temperature more uniform).
How do we interpret our results? Does it meet Utah State criteria? You can determine an appropriate stream temperature by looking at temperature criteria for fish. The State of Utah has established maximum water temperatures for both warm and cold water fisheries. Check with the Utah Division of Water Quality to determine the designation for your particular stream (in “Resources” Appendix).
The maximum temperature allowed for warm water fisheries and aquatic wildlife is 27 C (81 F).
The maximum temperature allowed for cold water
fisheries and aquatic wildlife is 20 C (68 F).
127

Utah Stream Team Unit IV. Field Investigation
Does it protect desirable fish species? For fish, there are two kinds of limiting temperatures – they can survive exposure to warmer temperatures for short periods (hours) but require cooler temperatures over longer periods of exposure. This may also vary according to the time of year and the life cycle stage of the fish species. Reproductive stages (egg incubation and embryo development) are the most sensitive stages. See Table IV-6 for the maximum temperatures for several common fish species.
Table IV-6
Maximum temperatures for typical coldwater and warmwater fish
Species
Maximum average temperature for young fish to grow (long term exposure)1
Maximum temperature for fish to survive
(short term exposure)2
Maximum average temperature for successful incubation and hatching of eggs (long term exposure)1
Brook Trout 19ºC (66ºF) 24ºC (75ºF) 9ºC (48ºF) Rainbow Trout 19ºC (66ºF) 24ºC (75ºF) 9ºC (48ºF) Smallmouth Bass 29ºC (84ºF) --- 17ºC (63ºF) Largemouth Bass 32ºC (90ºF) 34ºC (93ºF) 21ºC (70ºF) Bluegill 32ºC (90ºF) 35ºC (95ºF) 25ºC (77ºF) Channel Catfish 32ºC (90ºF) 35ºC (95ºF) 27ºC (81ºF) 1 This is based on maximum temperatures averaged over at least a week. ² 2This is based on maximum temperatures averaged over a few hours.
Source: Volunteer Stream Monitoring: A Methods Manual
Resources for further investigation Environmental Protection Agency’s Volunteer Stream Monitoring: A Methods Manual - This 210-page manual takes the reader through an introduction to streams and watersheds then proceeds to offer in-depth, step-by-step approaches to monitoring a variety of water quality components. You will find helpful background information on stream temperature. For a free copy of the manual, contact Alice Mayio at USEPA (4503F), 401 M St. SW, Washington, DC 20460; 202/260-7018; [email protected]. Also available on the web: www.epa.gov/owow/monitoring/vol.html.
Kentucky Water Watch – This Kentucky Water Watch web site, administered by the State of Kentucky Natural Resource and Environmental Protection Cabinet, offers background information on all major water quality parameters, including temperature. You’ll also find lots of other useful information to support classroom and field monitoring. www.state.ky.us/nrepc/water/wwhomepg.htm
Water Conservation and Nonpoint Source Pollution – This activity book features hands-on, minds-on activities for younger ages. Several activities specifically address temperature concepts (in both indoor and outdoor settings). Contact: Your local County Cooperative Extension Office – or – Utah State University Extension, 1500 N 800 E, ASTE Dept, Utah State University, Logan, UT 84322-2300, 435/797-3389. extension.usu.edu/natres/wq/
128

Utah Stream Team Unit IV. Field Investigation
Bibliography Environmental Protection Agency. Volunteer Stream Monitoring: A Methods Manual (EPA 841-B- 97-003). Office of Water. Washington, DC, 1997.
Moore, J.A., and J.R. Miner. “Stream Temperatures: Some Basic Considerations.” Oregon State University Extension Service, 1997.
Morton, Stephen D. Water Pollution: Causes and Cures. Mimir Publishers, Inc. Madison, WI, 1976.
129

Utah Stream Team Unit IV. Field Investigation
130

Utah Stream Team Unit IV. Field Investigation
Temperature
Time – 2 minutes Persons – 1 Materials – Thermometer
Step 1 1. Dip the thermometer into a moving part of the stream or river.
2. Wait for the temperature to stop changing (at least 1 minute).
Step 2 1. Read the temperature and record on the data sheet. Be sure to record
your temperature in degrees Celsius.
2. Use the equations below to convert between degrees Celsius to degrees Fahrenheit.
Converting Fahrenheit to Celsius: C = (5/9) x (F - 32)
Converting Celsius to Fahrenheit: F = [(9/5) x C] + 32
The maximum temperature allowed for warm water water fisheries and aquatic wildlife is 27 C (81 F).
The maximum temperature allowed for cold water fisheries and aquatic wildlife is 20 C (68 F).
131

Utah Stream Team Unit IV. Field Investigation
132
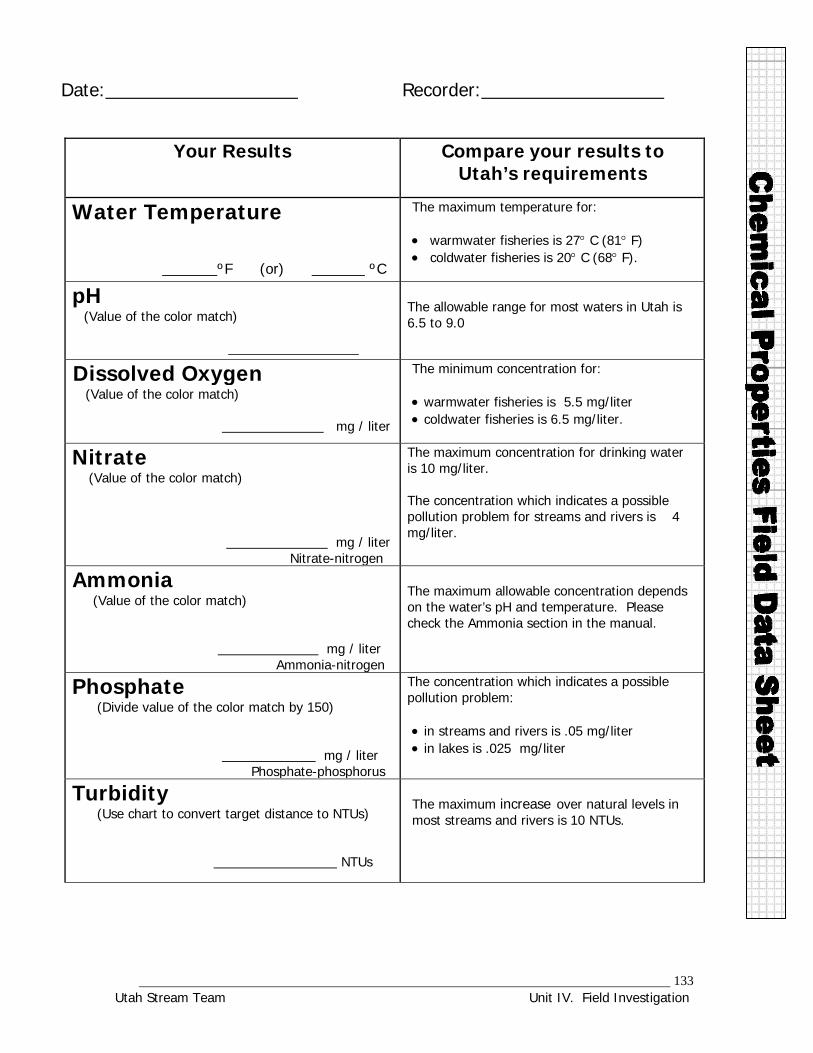
Utah Stream Team Unit IV. Field Investigation
Date: Recorder:
Your Results Compare your results toUtah’s requirements
Water Temperature
ºF (or) ºC
The maximum temperature for: warmwater fisheries is 27 C (81 F) coldwater fisheries is 20 C (68 F).
pH (Value of the color match)
The allowable range for most waters in Utah is 6.5 to 9.0
Dissolved Oxygen (Value of the color match)
mg / liter
The minimum concentration for: warmwater fisheries is 5.5 mg/liter coldwater fisheries is 6.5 mg/liter.
Nitrate (Value of the color match)
mg / liter Nitrate-nitrogen
The maximum concentration for drinking water is 10 mg/liter. The concentration which indicates a possible pollution problem for streams and rivers is 4 mg/liter.
Ammonia (Value of the color match)
mg / liter
Ammonia-nitrogen
The maximum allowable concentration depends on the water’s pH and temperature. Please check the Ammonia section in the manual.
Phosphate (Divide value of the color match by 150)
mg / liter
Phosphate-phosphorus
The concentration which indicates a possible pollution problem: in streams and rivers is .05 mg/liter in lakes is .025 mg/liter
Turbidity (Use chart to convert target distance to NTUs)
NTUs
The maximum increase over natural levels in most streams and rivers is 10 NTUs.
133

Utah Stream Team Unit IV. Field Investigation
134

Utah Stream Team Unit IV. Field Investigation
IV-4. Introduction to Biological Monitoring
How would you know if a barrel of chemicals spilled into your stream? If you hadn’t seen it spill you would have to sample the water for its effects. Chemical data would tell you a lot about the water at the particular time you sampled. But, if the barrel spilled a week ago, the chemicals might have flushed through without you knowing. Luckily, we can examine the biological components of a stream to gain information on the history of our stream’s water quality. Since the plants, insects and other critters of the stream live in that environment all the time, they can tell us a lot about what has happened to the water in days, weeks, or years past. If we don’t find the amounts or types of aquatic insects that are supposed to be there, then we know something is wrong and we can investigate further. It can be said that chemical monitoring provides a snap shot of water quality while biological monitoring provides a video. In this manner, the two complement each other well.
This chapter will help students examine biological components of a stream from both a classroom and field setting. A variety of sampling techniques are outlined for each biological parameter. Identification keys will help you collect your data and information provided at the end of each chapter will help you interpret your results.
Sections included:
a. Macroinvertebrates
b. Riparian Vegetation
Source: Tennessee Valley Authority 135

Utah Stream Team Unit IV. Field Investigation
136

137Utah Stream Team Unit IV. Field Investigation
V-4a. Macroinvertebrates
Key Terms Collectors dichotomous key engulfers EPT Value
functional feeding groupslarvae macroinvertebrates metamorphosis
nymphspiercers predators scrapers
shredderssubstrate Water Quality Rating Index species
What is a macroinvertebrate? The tiny animals that live in streams are called aquatic macroinvertebrates. These macroinvertebrates include many types of insects as well as other animals such as worms, molluscs and tiny crustaceans.
Where do we find them? Most of the macroinvertebrates you will sample make their home in the rocks, leaves and sediment of stream beds. These organisms have many special adaptations that allow them to live in demanding environments. When you sample from riffles and fast-moving areas, look closely for features that help the animals hold on in the current, such as hooked feet, suction cups, and flat bodies. Animals that live deep in the mud may have adaptations for a low oxygen environment. For example, some are red because of hemoglobin in their tissues.
Figure IV-13, “Macroinvertebrates In Your Stream,” illustrates some of the areas in a stream where macroinvertebrates live. Consider the unique environmental conditions of each area and how macroinvertebrates might deal with those conditions.
1
The name says it all. “Macro” means large (or large
enough to be seen with the naked eye). “Invertebrate” means lacking an inside skeleton, like we have. Instead, they have an exoskeleton – a protective, supportive case on the outside of the body.
Do they spend their whole life in water? Some macroinvertebrates complete their lives in a few weeks; others may live for several years. Usually, just the immature phases of insects’ lives (larvae and nymphs) are spent in the water but some insects, such as water boatmen and backswimmers, spend their whole lives in the water. Most non-insect macroinvertebrates, such as amphipods (scuds), gastropods (snails) and bivalves (clams and mussels) spend their entire life in the water. Some mussels have been found to live for 100 years!
Young their whole life Some mayflies live as nymphs for 2-3 years in water. But, when they hatch into adults, they have just 24 hours left. In that time they must find a partner, mate and lay their eggs before they die. They don’t even have time to eat.

Utah Stream Team Unit IV. Field Investigation
Figure IV-13 Common macroinvertebrates found in your stream
Springtail (jumper)
Water penny (clinger)
Damselfly (climber)
Mosquito (floater)
Stonefly (sprawler)
Water strider (skater)
Provonsha in McCafferty, Aquatic Entomology, 1998: Jones and Bartlett Publishers, Sudbury, MA. www.jg[ub.com. Reprinted with permission
138

Utah Stream Team Unit IV. Field Investigation
______________________________________________________________________
Do they change as they grow? All aquatic macroinvertebrates start life as eggs. Some animals, such as water beetles and leeches, don’t change much as they grow – they only get bigger, much as humans do. Some insects, however, may change (metamorphose) quite dramatically as they grow. After hatching, the insect may go through several stages before reaching adulthood. Depending upon the species, it may go through a larval stage, a nymph stage or both (see Figure IV-14).
Larvae do not show wing buds and Nymphs usually resemble adults, but are usually look quite different than adults. smaller and have no wings.
blackfly larva stonefly nymph
Source: Tennessee Valley Authority (TVA)
Figure IV-14 Examples of insect life
Provonsha in McCafferty, Aquatic Entomology, 1998: Jones and Bartlett Publishers, Sudbury, MA. www.jg[ub.com. Reprinted with permission
_
139

Utah Stream Team Unit IV. Field Investigation
What natural influences cause macroinvertebrate populations to change? Seasons Macroinvertebrate populations change through the year. You will find different types of macroinvertebrates during different seasons. The life histories of these invertebrates is tied to food availability. For example, scrapers (macroinvertebrates that eat microscopic plants called algae from the surfaces of rocks and leaves) are most abundant during the summer when algae production is highest. In general, the greatest diversity of organisms is found in autumn because there is a lot of organic matter such as fallen leaves in the stream. Dissolved Oxygen Aquatic macroinvertebrates breathe oxygen that is dissolved in the water. Immature stages of species such as stonefly nymphs, mayfly nymphs, and water pennies (beetle larvae) require high levels of dissolved oxygen. Look for the fluttering gills on the abdomen (sides) of mayfly nymphs. If dissolved oxygen is low, even for a short while, these insects may not survive. Substrate The substrate in your stream will greatly influence what macroinvertebrates are present. Expect to find the greatest variety and abundance of species in rocky or gravelly substrate. Because of the abundance of fine food particles, you can find many collectors (macroinvertebrates that eat tiny food particles from the water or stream bottom) in slow, murky waters with sandy or muddy bottoms.
What human influences cause macroinvertebrate populations to change? Nutrient enrichment Nutrient enrichment in a stream or lake may result from introductions of human sewage, manure or fertilizer. These substances can enter the water directly or be delivered by runoff from the surrounding watershed. Added nutrients may greatly accelerate the growth of algae and other plants. When these plants die, decomposition by microorganisms can use up much of the dissolved oxygen in the water, which is harmful to the macroinvertebrates.
pH Acid precipitation, runoff from mining activities and dumping of industrial pollutants can lower pH. Low pH can weaken shells and exoskeletons, disrupt egg laying and reduce food availability. A pH below 4.5 will kill many macroinvertebrates in a short time. Water boatmen are one of the most resistant, surviving at a pH as low as 4.0. Stream bank vegetation Removal of vegetation in the riparian area eliminates important insect breeding grounds. It also deprives many types of macroinvertebrates of an important food source. These shredders feed on fallen sticks and leaves.
140
141Utah Stream Team Unit IV. Field Investigation
?
Why do we care about macroinvertebrates? The types and abundance of macroinvertebrates in your stream are important to know for two reasons: 1) They are indicators of water quality.
Different macroinvertebrates tolerate different types of stream conditions. Depending on what we find, we can make predictions about water quality.
2) They are an important part of aquatic and terrestrial food chains. Each macroinvertebrate plays a role, or function, in a stream. These roles are combined into
“Functional Feeding Groups,” such as shredders, collectors, scrapers and predators.
Pollution tolerance levels Sometimes it’s easy to tell if a stream is in trouble. Strange colors and dead fish are indicators of poor water quality. But, biologists need to know about water quality problems long before they reach such a severe point. Some of their most effective partners in detecting declining trends in water quality are macroinvertebrates because they respond so rapidly to changes in water quality.
To evaluate the health and productivity of a stream,
Chemical samples provide a “snapshot” of the water quality at a particular
moment. Macroinvertebrates provide a “video.” Because they remain in the same area over a long period of time they enable biologists to assess both recent and more historic water quality.
biologists look at the types of species that live there. Different species have different tolerances to pollution. If many pollution-intolerant species, such as stonefly and caddisfly nymphs, are present then the water quality is probably quite good. Although the presence of certain species indicates good water quality, the absence of these species does not necessarily indicate bad water quality. Other factors besides pollution may account for their absence. For example, they may have metamorphosed (changed) into adults and flown away.
We can classify macroinvertebrates into three groups based on pollution tolerance.
Group 1 - Sensitive or Intolerant Species Organisms that are easily killed, impaired or driven off by bad water quality: these include stonefly, dobsonfly and mayfly nymphs, caddisfly larvae, water pennies and snails.
Group 2 - Somewhat Tolerant Species Organisms that have the ability to live under varying conditions. You may find them in good or poor quality water. These organisms include amphipods, scuds, beetle and cranefly larvae, crayfish and dragonfly nymphs.
Group 3 - Tolerant Species Organisms capable of withstanding poor water quality: these include leeches, snails, aquatic worms, midge larvae and sowbugs.
What would the following species distributions suggest to you? A community with many species from Group 1, some from Group 2 and a few
from Group 3. – Indicates good water quality. A community with no species from Group 1, a few from Group 2 and a lot from
Group 3. – May indicate poor water quality but we can’t be sure (better do some chemical and physical monitoring, too)
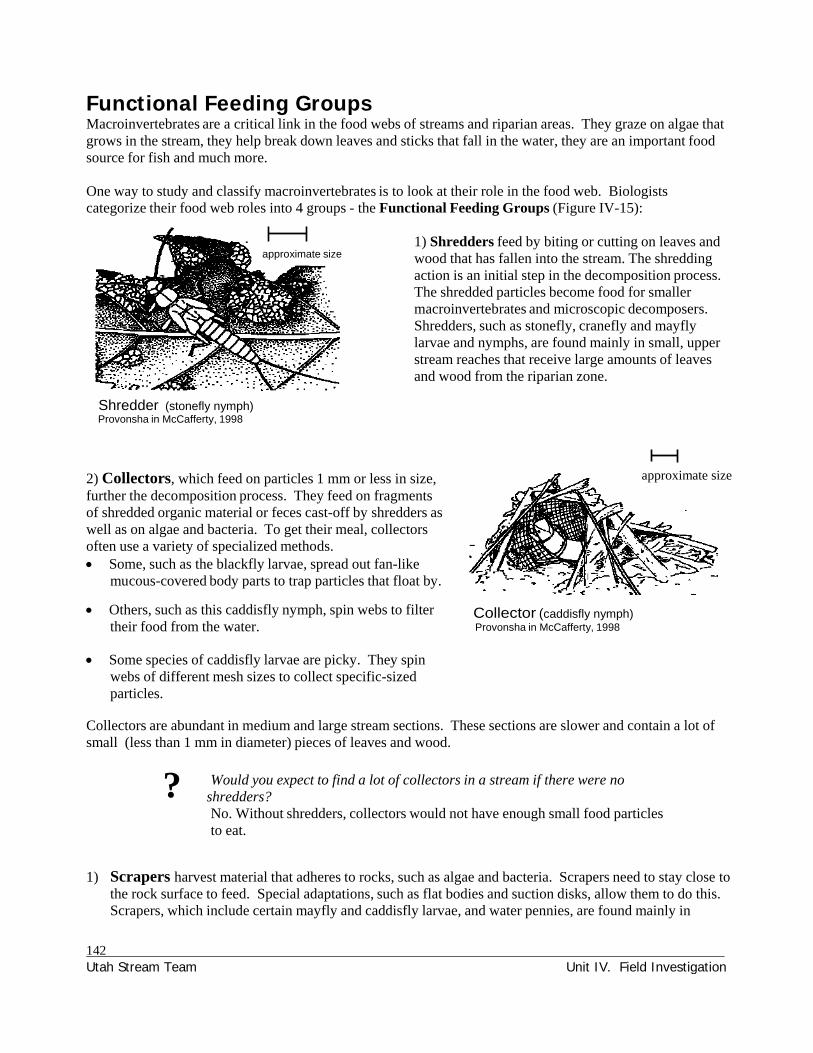
142 Utah Stream Team Unit IV. Field Investigation
?
Functional Feeding Groups Macroinvertebrates are a critical link in the food webs of streams and riparian areas. They graze on algae that grows in the stream, they help break down leaves and sticks that fall in the water, they are an important food source for fish and much more.
One way to study and classify macroinvertebrates is to look at their role in the food web. Biologists categorize their food web roles into 4 groups - the Functional Feeding Groups (Figure IV-15):
approximate size 1) Shredders feed by biting or cutting on leaves and wood that has fallen into the stream. The shredding action is an initial step in the decomposition process. The shredded particles become food for smaller macroinvertebrates and microscopic decomposers. Shredders, such as stonefly, cranefly and mayfly larvae and nymphs, are found mainly in small, upper stream reaches that receive large amounts of leaves and wood from the riparian zone.
Shredder (stonefly nymph) Provonsha in McCafferty, 1998
2) Collectors, which feed on particles 1 mm or less in size, further the decomposition process. They feed on fragments of shredded organic material or feces cast-off by shredders as well as on algae and bacteria. To get their meal, collectors often use a variety of specialized methods. Some, such as the blackfly larvae, spread out fan-like
mucous-covered body parts to trap particles that float by.
Others, such as this caddisfly nymph, spin webs to filter their food from the water.
Some species of caddisfly larvae are picky. They spin
webs of different mesh sizes to collect specific-sized particles.
Collector (caddisfly nymph) Provonsha in McCafferty, 1998
approximate size
Collectors are abundant in medium and large stream sections. These sections are slower and contain a lot of small (less than 1 mm in diameter) pieces of leaves and wood.
Would you expect to find a lot of collectors in a stream if there were no shredders? No. Without shredders, collectors would not have enough small food particles to eat.
1) Scrapers harvest material that adheres to rocks, such as algae and bacteria. Scrapers need to stay close to the rock surface to feed. Special adaptations, such as flat bodies and suction disks, allow them to do this. Scrapers, which include certain mayfly and caddisfly larvae, and water pennies, are found mainly in

143Utah Stream Team Unit IV. Field Investigation
?
?
?
middle-sized stream sections. These stream sections receive greater sunlight which increases the abundance of algae – a major food source for scrapers.
approximate size
What time of year would you expect to find a lot of scrapers and grazers in your stream?
Summer and fall, when the most sunlight reaches the stream and algae production highest.
Scraper (mayfly nymph) Provonsha in McCafferty, 1998
4) Fish, birds and reptiles all prey on macroinvertebrates, as do other macroinvertebrates. We call these predators. Just like shredders, collectors, and grazers, predators have unique mechanisms for obtaining a meal. Odonates (dragonflies and damselflies) often bury themselves in the sand with only their eyes protruding and wait to spring their retractable mouthparts at unsuspecting prey. Some predators, such as predacious stoneflies, are more active and pursue their prey.
We classify predators into two groups. Engulfers swallow their prey whole.
approximate size
Predator (water boatman) Provonsha in McCafferty, 1998
Piercers inject a mouth part into their prey and suck out the body fluids. This giant water bug is an example of a piercing predator.
Would you expect to find predators in areas without shredders,collectors and grazers? No. Predators depend upon them for food.
Look for different “Functional Feeding Groups” in Figure IV-17. Consider how the size and location of the stream section affects the type of food available and how the available food affects the location of the different functional feeding groups.
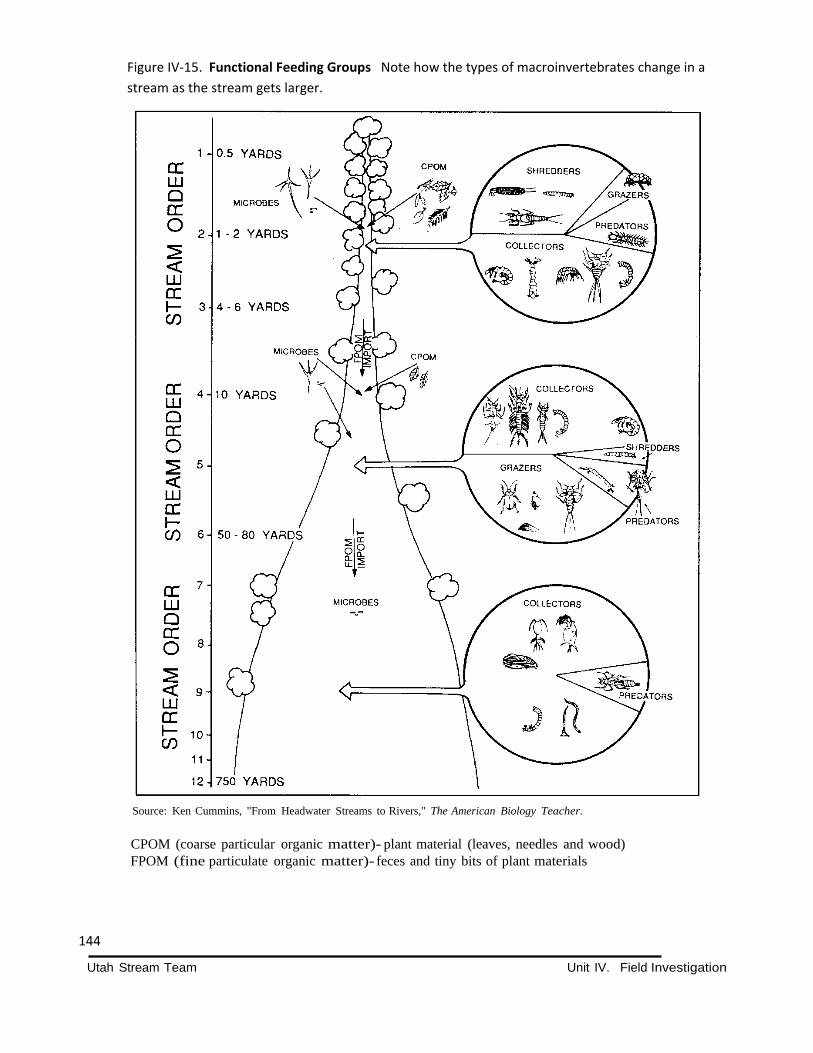
Utah Stream Team Unit IV. Field Investigation
Source: Ken Cummins, "From Headwater Streams to Rivers," The American Biology Teacher.
CPOM (coarse particular organic matter)- plant material (leaves, needles and wood) FPOM (fine particulate organic matter)- feces and tiny bits of plant materials
144
Figure IV‐15. Functional Feeding Groups Note how the types of macroinvertebrates change in a
stream as the stream gets larger.

145Utah Stream Team Unit IV. Field Investigation
How do we sample macroinvertebrates? The Utah Stream Team provides a standard method for collecting macroinvertebrates. This method is detailed in the Field Directions at the end of the chapter. Once you have collected your sample, you may want to simply observe the animals. If you want to use the sample to evaluate water quality, calculate one of the indexes described below. Making Observations: Many groups choose to simply collect and look at their macroinvertebrates without quantifying them. Encourage your students to use the hand lenses to look at the animals closely. This is easiest if they to transfer individual animals into the small petri dishes with a little water.
When do we sample? Anytime is a good time to look at bugs. Fall is an especially good time to sample since many macro-invertebrates will be large and more easily studied. Also, lower stream levels in the fall make sampling easier and safer.
Investigate the insect body parts. The head, abdomen and thorax are easy to see, and the students can count the legs on insects compared to other animals they find. Students can investigate the different types of mouth parts and the large eyes some of these insect have.
Consider how the animals breath. Mayflies have distinctive gills on their abdomen, stoneflies have gills under their legs, damselflies have gills on plates at the end of their thorax. Try to see what they do when they need more oxygen. For example, stoneflies do “push ups” to pass more water over their gills.
Watch for animal behavior. Look for differences in how they move and watch how they interact with other animals. Look for evidence of predation. Encourage your students to think about how these animals experience their world, how they see, or how they might detect chemical signals in the water.
Have students draw the animals. Some are beautiful while others resemble monsters.
Quantifying Samples Two methods are provided for quantifying (indexing) your sample: 1) the EPT Value and 2) the Water Quality Rating Index. If you wish to quantify and interpret your results using either of these two indexes, read the next section before you start to sample. A Data Collection Sheet is included for each of these indexes. EPT Value This biotic index is one way to interpret water quality in your stream using the types and amounts of macroinvertebrates you collect. The EPT value – Ephemeroptera (mayflies), Plecoptera (stoneflies) and Tricoptera (caddisflies) – is a sum of the total number of “species” of these three orders in the sample. These insect groups contain many species that cannot tolerate poor water quality. Generally, the more EPT species you find, the better your water quality. The EPT Value is simpler than the Water Quality Rating Index and will take the least amount of time to conduct (about 1 hour for a trained group of three students). Water Quality Rating Index The Water Quality Rating Index requires more extensive identification of different types and more time to conduct (about 2 – 3 hours). However, it will provide a more accurate assessment of your water quality. The Water Quality Rating Index operates in a similar manner as the EPT. Species are collected and identified – the more pollution-intolerant individuals collected, the higher the value and the better the water quality rating. With this index, however, all the different types of organisms in your sample must be identified and totaled. Note that this can be difficult for younger students, especially when very small organisms are present. Intolerant and Somewhat Tolerant species have higher values than Tolerant species.

146 Utah Stream Team Unit IV. Field Investigation
What is a “species”? Species is a term used by scientists to identify groups of animals that are uniquely different from
other groups. If animals can potentially reproduce with each other, they are in the same species. In this section we use this term somewhat loosely. In the Utah Stream Team, “species” refers to
animals that are related but have enough different physical characteristics that they can be easily divided into separate groups. For example, caddisflies have different body widths and shapes, different gill sizes and make different kinds of cases. For our purposes, we consider these different caddisflies to be different “species.”
How do we interpret our results? Pollution tolerance indexes provide a relatively quick means for assessing stream quality and help students to understand pollution tolerance ranges for organisms. However, they need to be considered along with physical and chemical data in order to provide a comprehensive picture of water quality. EPT Value Compare your calculated EPT Value with the water quality ratings below. If your stream does not score well, refer back to the “Natural and Human Influences” sections in this chapter as well as your physical and chemical data to help you determine why. You may want to share your rating with a local aquatic biologist (consult the UT Division of Wildlife Resources or UT Division of Water Quality) to help you interpret it.
EPT Value: [] >10 not affected (excellent water quality) [] 2 – 5 moderately affected (fair water quality) [] 6 – 10 slightly affected (good water quality) [] < 2 severely affected (poor water quality)
Water Quality Rating Index Compare your calculated Water Quality Rating Index with the water quality ratings listed below. If your stream does not score well, refer back to the “Natural and Human Influences” sections in this chapter as well as your physical and chemical data to help you determine why. You may want to share your rating with a local aquatic biologist (consult the UT Division of Wildlife Resources or UT Division of Water Quality) who can help you interpret it.
Water Quality Rating Index [] Excellent (> 79) [] Fair (40-59) [] Good (60-79) [] Poor (< 40)
Resources for Further Investigation Guide to Macroinvertebrate Sampling - The River Watch Network's guide offers a user-friendly picture key, methodology and various indices such as the Percent Composition of Major Groups, the Modified Family Biotic Index, and Organism Density per Sample (these indices are excellent opportunities to weave math into your monitoring program). The manual is available for $5 from RWN, 153 State St., Montpelier, VT 05602.
147Utah Stream Team Unit IV. Field Investigation
Monitor's Guide to Aquatic Macroinvertebrates by Kellogg, L.L. 1994. 60 pages. A pocket-sized guide including a key (with some important fly families), descriptions of major invertebrate groups, sampling protocols for both rocky bottoms and muddy bottoms, and sample data sheets with excellent illustrations. Contact: Save Our Streams, Izaak Walton League of America, 707 Conservation Lane, Gaithersburg, MD 20878; (800)BUG-IWLA. $5.
Bibliography Cummins, Kenneth. “From Headwater Streams to Rivers.” American Biology Teacher, 39 (5) May, 1977, pp. 305-315.
Cummins, Kenneth, and Margaret Wilzbach. Field Procedures for Analysis of Functional Feeding Groups of Stream Macroinvertebrates. University of Maryland, Frostburg, MD. 1985.
Edelstein, Karen, Nancy Trautman, and Marianne Krasny. Watershed Science for Educators. Cornell University. New York. No date.
Environmental Protection Agency. “Biological Indicators of Watershed Health.” 1999. www.epa.gov/ceisweb1/ceishome/atlas/bioindicators.
Environmental Protection Agency. Volunteer Stream Monitoring: A Methods Manual. Office of Water. EPA 841-B-97-003. 1997.
McCafferty, Patrick (illustrations by Arthur V. Provonsha). Aquatic Entomology. Arthur C. Bartlett. Sudbury, MA. 1981.
National Aquatic Monitoring Center. “Aquatic Invertebrate Monitoring – 101.” www.usu.edu/~buglab/bugs101/htm
Oregon Department of Fish and Wildlife. The Stream Scene: Watersheds, Wildlife and People. Aquatic Education Program. Portland, OR. 1999.

148 Utah Stream Team Unit IV. Field Investigation

Utah Stream Team Unit IV. Field Investigation
Macroinvertebrate Sampling
Step 1 - Choose your sample site Select sampling reaches that are safe and easily
accessed by everyone in your group. A riffle will offer the best variety of organisms.
You may also want to collect samples from other habitats such as pools, aquatic vegetation and stream margins. Compare the different results you obtain from these areas and discuss why (think about Functional Feeding Groups, different flows, or available oxygen).
Step 2 – Collect your sample.
Time – 40 minutes Persons – 2 Materials - 1 kick net 1 plastic pan transfer pipettes plastic4 petri dishes magnifying glasses dichtomous key OPTIONAL paint brushes (for transferring) 5 gal plastic bucket (for decanting) waders (for sampling in cold or deep
water)
Note: Follow these directions if you are sampling in flowing water. 1. Wade into the stream and place your net so the mouth of the net is perpendicular to and facing the flow
of water. 2. Stand upstream of the net and disturb the stream bottom with your feet and hands. 3. Carefully pick up and rub stones directly in front of the net to remove attached animals. The stream
bottom material and organisms will be carried by the current into the net. If the rocks are lodged in the stream bottom, rub them vigorously, concentrating your effort on any cracks or indentations.
4. After removing all large stones, disturb the sand and gravel to a depth of about 3 inches by raking and stirring with your hands.
5. Continue this process until you can see no additional animals or organic matter being washed into the net.
Note: Follow these directions if you are sampling in pools or highly-vegetated areas. 1. Scoop material from the stream bottom. 2. Push and pull the net through aquatic vegetation. 3. Hand pick organisms from sticks and other structures.
Step 3 – Empty your sample 1. Hold your sampling net over a plastic pan and use a bucket of stream water to wash the material into
the pan. 2. If your sample contains a lot of rocks or debris, stir the sample in the pan to suspend the animals, then
pour the suspended material back into your net. Rinse the debris from the pan, then wash the animals in the net back into the pan.
Step 4 – Sort out the bugs 1. Use plastic transfer pipettes, small paint brushes or your fingers to remove bugs from pans. For easier
observation, place the animals into smaller water-filled containers (plastic ice cube trays or petri dishes work well).
2. Use the keys provided in this section to identify the bugs.
149

Utah Stream Team Unit IV. Field Investigation
Macroinvertebrate Indices
Subsample to simplify EPT Value or Water Quality Rating Index
To calculate either index, you need to sort approximately 100 animals. It is very difficult to “randomly” select animals from a large sample, because we tend to choose the most obvious, largest or most active animals. This will bias the results. Subsampling gives you a representative selection from your larger sample.
1. Place entire macroinvertebrate sample into flat plastic pan. 2. Pour off most of the water from the pan, so material and
animals are no longer floating. Distribute material evenly on the bottom of the pan.
Time – 60+ minutes Persons – 3 or more Materials - Macroinvertebrate sample 1 plastic pan transfer pipettes plastic petri dishes or ice
cube trays magnifying glasses ruler for subsampling dichotomous key Macroinvertebrate Index
Data sheet
3. Distribute material evenly on bottom of pan. Take a ruler and divide the material in the pan in half. Remove one half of the material from the pan.
4. Redistribute the material again over the bottom of the pan and divide this material again with a ruler. 5. Continue this process until you have a sample with about 100 total organisms. 6. Add some stream water back into the pan for easier sorting.
EPT Value 1. Find all the mayflies, stoneflies and caddisflies in your subsample using
the identification key. 2. Separate these into as many distinct species by looking for differences
in body shape, color and markings. Place all members of each species into separate containers.
3. Count the total number of species of mayflies, stoneflies and caddisflies. This total is the EPT Value.
Water Quality Rating Index
Remember: A separate “species” in this case refers to animals that are related (e.g. all mayflies) but have enough different physical characteristics that they can be easily divided into separate groups.
1. Separate each different type of macroinvertebrate in your subsample into a different container. 2. Use the identification key to identify each different type. Look at the body shape, color and markings. 3. Separate these different types into pollution tolerance categories, using picture guides on data sheet. 4. Multiply the number in each category by the pollution sensitive weighting found on the data sheet. 5. Sum the number of animals in each category and the weighted values for each category. Add up the total
number of animals, and the total weighted values. 6. Divide the total weighted values by the total number of animals. This will give you the Water Quality
Rating Index.
150

151Utah Stream Team Unit IV. Field Investigation
EPT Value Water Quality Rating Index Time – 45 minutes 60 minutes Persons – 3+ 3+ Materials (needed for either sampling method) 1 plastic pan 4 plastic petri dishes 4 transfer pipettes 1 kick net
4 magnifying glasses dichotomous keys 1 pair waders
(for cold and/or deep water)
EPT VALUE
Aquatic invertebrate Group Number of different
“species” found
MAYFLIES
STONEFLIES
CADDISFLIES
TOTAL
Total “species” equals EPT Value
[ ] >10 not affected (excellent water quality)
[ ] 6 – 10 slightly affected (good water quality)
[ ] 2 – 5 moderately affected (fair water quality)
[ ] < 2 severely affected (poor water quality)

152 Utah Stream Team Unit IV. Field Investigation
Water Quality Rating Index (Circle each category found)
Group 1: Pollution Sensitive
Caddisfly larva Water penny
Dobsonfly larva adult Riffle Beetle
Mayfly nymph Gilled Snail
Group 3: Fairly Tolerant
Scud Clams, Mussels
Crayfish nymph Dragonfly Damselfly nymph Blackfly larva
Group 2: Slightly Tolerant
Beetle larva
Stonefly nymph
Cranefly larva
Group 4: Very Tolerant
Midge larva Pouch (left hand) Snail
Sowbug Leech
Total # categories of Pollution Sensitive Group 1 X 100 =
Total # categories of Slightly Tolerant Group 2 X 80 = Total # categories in Fairly Tolerant Group 3 X 60 = Total # categories in Very Tolerant Group 4 X 30 =
COLUMN TOTALS (a) (b)
Divide (b) by (a) / = Water Quality Rating Index
Water Quality Rating Value:
[ ] > 79 Excellent [ ] 60-79 Good [ ] 40-59 Fair [ ] < 40 Poor
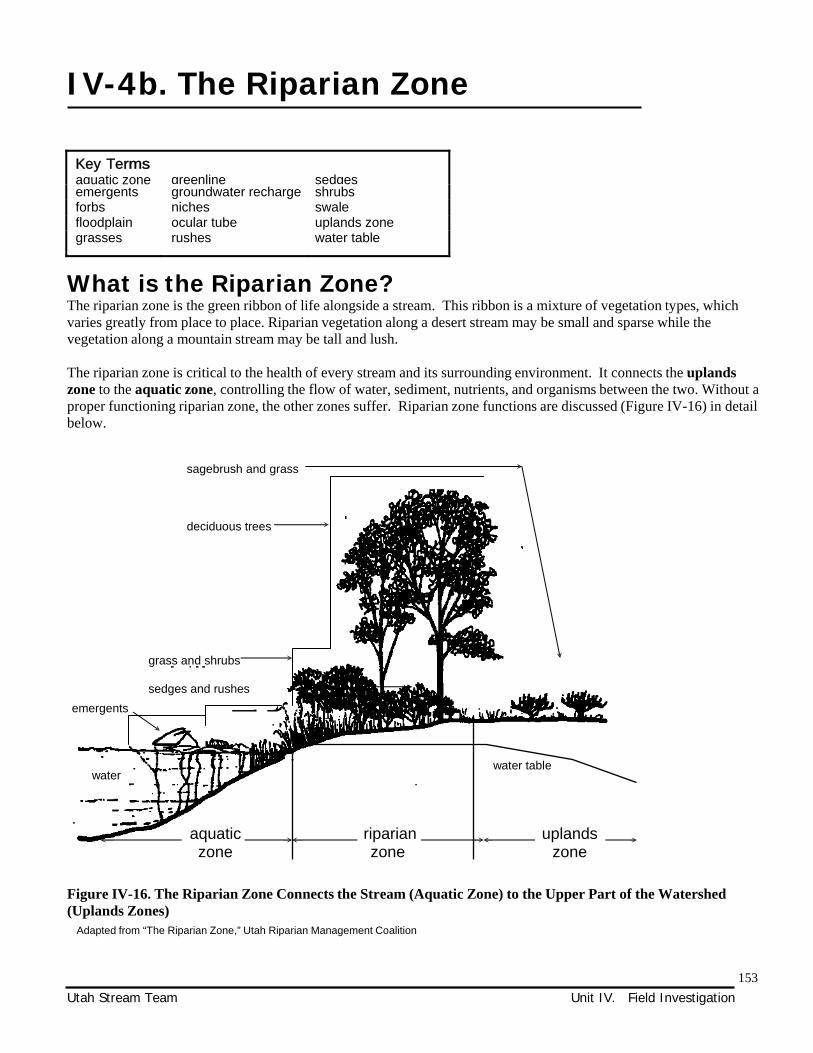
Utah Stream Team Unit IV. Field Investigation
IV-4b. The Riparian Zone
Key Terms aquatic zone
greenline
sedges
emergents groundwater recharge shrubsforbs niches swalefloodplain ocular tube uplands zonegrasses rushes water table
What is the Riparian Zone? The riparian zone is the green ribbon of life alongside a stream. This ribbon is a mixture of vegetation types, which varies greatly from place to place. Riparian vegetation along a desert stream may be small and sparse while the vegetation along a mountain stream may be tall and lush. The riparian zone is critical to the health of every stream and its surrounding environment. It connects the uplands zone to the aquatic zone, controlling the flow of water, sediment, nutrients, and organisms between the two. Without a proper functioning riparian zone, the other zones suffer. Riparian zone functions are discussed (Figure IV-16) in detail below.
sagebrush and grass
deciduous trees
grass and shrubs
emergents
sedges and rushes
water water table
aquatic zone
riparian zone
uplands zone
Figure IV-16. The Riparian Zone Connects the Stream (Aquatic Zone) to the Upper Part of the Watershed (Uplands Zones)
Adapted from “The Riparian Zone,” Utah Riparian Management Coalition
153

Utah Stream Team Unit IV. Field Investigation
1) Is the riparian zone wetter than the uplands zone? Yes, because it receives regular flooding and is closer to the water table. 2) How do riparian plants and trees affect the stream?
Riparian vegetation contributes shade, food and shelter for aquatic organisms. The riparian zone is also home to many animals that move between land and water, such as insects, amphibians and waterfowl. Riparian vegetation and litter reduces erosion and regulates the overland flow of water to the stream (uplands vegetation serves this function, too). The riparian zone acts as a natural sponge, soaking up water as it runs off the land, and slowly releasing that water back into the stream.
3) How does the variety of species differ between each zone?
The riparian zone generally has a greater variety of species than the other zones. It is also denser and more structurally complex (plants have a greater variety of shapes and heights). Some plants, such as sedges and rushes are not found in most areas of the upland zone because they require a lot of water. Other plants, such as sagebrush, are not found in the aquatic zone because they cannot tolerate a wet environment. Emergents which are found only in the aquatic zone grow up through the water and expose their leaves at the surface. Submerged and floating vegetation are also found in the aquatic zone.
Utah riparian areas Riparian zones constitute less than 3% of Utah’s land area.
Cattail
However, 75% of the 360 bird species found in Utah depend on riparian zones for some part of their life cycle. The cottonwood/willow forest is a type of riparian zone common in Utah. The cottonwoods form a tall canopy and the willows create a thick understory. A variety of birds and other animals fill the niches created by this complex structure. Many other riparian vegetation types can be found in the varied landscapes of Utah. Look for saltgrass and cattail in western salt marshes; alkali bullrush and coyote willow in the sagebrush country; and even subalpine fir and Engleman spruce in high mountain areas.
The western cottonwood willow
forest, an exclusively riparian forest type, is the most threatened of the 106 forest types found in North America.
What natural influences affect riparian zones? Water supply Water supply is the major factor that regulates the growth of riparian vegetation. Flood waters transport nutrients, sediment and new seeds from upstream. Floods also strip away larger, established vegetation and allow new seedlings to establish. Unlike floods, groundwater offers a steady source of water for the stream and riparian zone. In fact, it may be the only source of water for a stream in winter when precipitation is frozen (groundwater remains at a relatively constant 50 degrees). The closer you get to the stream, the closer the water table (the top of the groundwater) is to the surface of the soil. Groundwater comes to the surface at the edge of a stream.
154

Utah Stream Team Unit IV. Field Investigation
Soils The type of soil in the riparian zone influences the amount of water and nutrients available. Organic-rich soil holds water and provides abundant nutrients to plants, with out releasing these nutrients to the water. We can expect to find denser vegetation in these soils than in a gravely soil with little water-holding capacity and few nutrients.
Topography The shape of the land affects the location and abundance of plants in the riparian zone. See figure IV-17 to find out how.
Climate Riparian zones in different climates have different appearances. In the deserts of southern Utah riparian zones are “green oases” in sparse, dry surroundings. In the mountains, where precipitation is more abundant, the upland vegetation remains relatively lush. It is
ridge
swale
usually less structurally and visually different than the riparian vegetation.
What human influences affect riparian zones? Humans, just like animals, are attracted to riparian zones. Unfortunately, many of our activities can have a negative influence on the riparian zone and reduce its value both for the ecosystem and ourselves. Through respect and good planning we can help to avoid many of these problems. Road building Riparian zones, which tend to be flatter than the surrounding land, are attractive routes for road builders. Roads, however, may cause accelerated erosion, introduce oil and other pollutants to the stream, cut off subsurface water flow to the stream and threaten wildlife.
Figure IV-17. The shape of the land near a stream affects the plants which grow there. The gravelly composition of this ridge allows fine sediment and organic matter to filter through and collect in the swale. These materials, which have high water-holding capacities, keep the swale wetter than the ridge; even though it is further from the stream. Notice the thicker vegetation that results. Why else might we find thicker vegetation in the swale? Think about access to the water table.
Farming Farmers often clear riparian zones to increase the amount of available farmland. However, without the stabilizing effect of riparian vegetation, the banks of a field may erode during floods. Farmland is lost where the erosion occurs and sedimentation increases downstream. More and more farmers now maintain the health of their riparian areas to ensure long-term sustainability of their land. Grazing Just like other animals, cattle are attracted to cool, lush riparian zones. If managed correctly – herded or fenced out after a short time – cattle can be part of a healthy riparian zone. However, mismanagement, or overgrazing of the riparian zone can cause changes in the types of vegetation and the amount of cover and forage, increase erosion, and introduce increased amounts of nutrients and fecal coliform bacteria to the stream through manure.
Development The aesthetic value of riparian zones makes them prime targets for housing and commercial development. However, construction often removes vegetation and alters the stream banks and may even result in concrete lined banks. These changes can increase the intensity of floods, increase the direct input of pollutants to water, and decrease wildlife.
155

Utah Stream Team Unit IV. Field Investigation
Logging Logging operations today realize the importance of healthy riparian zones and rarely log them. However, logging roads continue to be built through these zones, creating the same problems that all roads do. When we strip away upland vegetation, we allow too much water to flow down into the stream at one time, which can lead to bank erosion, deep and narrow channels and shrunken riparian zones. Along with the increased water flow may come increased loads of sediment. Dams Dams reduce downstream flooding. While this serves the people who live downstream in the floodplain it degrades riparian zones. Natural flood cycles are critical to healthy riparian zones. Floods bring essential supplies of water, nutrients and sediment. They also help to create backwaters that serve as critical fish nurseries.
Why do we care about riparian zones? Well-functioning riparian zones are critical to a healthy watershed. Plants and animals depend on their unique, diverse and productive habitats. Humans, as well, depend on riparian zones; they provide the following services. Erosion control The tough, tangled roots of sedges, shrubs and trees provide structure to streambanks and reduce soil loss to the stream. Filters As surface runoff flows through the riparian zone to the stream, vegetation traps much of the sediment it carries which reduces turbidity levels in the stream. Riparian vegetation also pulls nutrients out of the soil before they can reach the stream. Groundwater recharge Riparian zones supply water to underground reservoirs. We call this process groundwater recharge. Well- vegetated areas trap the overland flow of water, allowing it to infiltrate the soil and percolate downward. Underground stores provide the primary and sometimes only source of water for streams during dry periods. Without this supply, the aquatic ecosystem would collapse. Recharge is equally crucial for humans who depend on groundwater for drinking and other purposes. Flood control Riparian zones serve as reservoirs for flood waters. The vegetation and soil absorb overbank flow then releases it over time. This decreases the amount and energy of water flowing through the stream at any one time. People who live in floodplains benefit from the regulating effect of healthy upstream riparian zones. Wildlife Riparian zones concentrate water and nutrients from the stream and the surrounding uplands. In response, the vegetation grows dense and structurally complex – it takes on a variety of shapes and sizes. This greater complexity translates into more niches for organisms to fill.
The diversity and production of riparian zones surpass all other terrestrial (land) ecosystem types. Riparian zones in the Southwestern United States have a higher breeding diversity of birds than all other western habitats combined. Aquatic organisms are just as dependent upon riparian zones for their survival. The leaves, sticks and bark that fall into the water may provide up to 99% of the energy for organisms in a small headwater stream (the other 1% comes from photosynthesis).
156

Utah Stream Team Unit IV. Field Investigation
Southwestern willow flycatcher
The southwestern willow flycatcher breeds throughout southern Utah (and elsewhere). It migrates up from Central America and Mexico in mid-May and nests mainly in the understory of cottonwood/willow riparian forests. As these types of riparian zones have been lost or
changed, the 6-inch, green and yellow insectivore has decreased in number. In fact, so many have disappeared that in 1995 it was placed on the endangered species list. The southwestern willow flycatcher had historically been found in Utah along Kanab Creek and the Virgin, Colorado and San Juan rivers. However, only three sightings have been confirmed in the last five years.
How can you help the southwestern willow flycatcher and other birds that
depend on riparian zones? Contact your local Fish and Wildlife Department to learn more about these birds. Ask if there are riparian zone restoration projects you and your class can participate in.
How do we sample the riparian zone? This section provides three ways to monitor the riparian zone:
1) Greenline Transects, 2) Ground Cover Transects and 3) Canopy Cover Transects.
Each activity measures a different characteristic of the riparian zone. NOTE: Step-by-step “Sampling Directions” can be found at the end of this section along with the “Riparian Zone Data Collection Sheet.” Greenline transects The greenline consists of the first plants you encounter as you move away from the water (see Figure IV-18). The greenline may at times closely parallel the stream and at other times it may head a considerable distance away from the stream.
The greenline gives us a measurement of bank stability, which is the ability of banks to withstand erosion. We determine stability by calculating the percent composition of five different vegetation types along the banks. These are: 1) grasses, 2) forbs, 3) sedges and rushes, 4) shrubs and trees, and 5) bare ground (see Figure IV-19) for help identifying different vegetation types). Each vegetation type has a different ability to stabilize the bank, due primarily to the depth and density of their roots or whether they are annuals (die back after one year) or perennials (survive through the winter). Stability ratings are found on the “Riparian Zone Data Collection Sheet.”
Before sampling work with your students to correctly identify the different vegetation types and to locate the greenline. This can easily be done in your schoolyard in an area where vegetation meets bare soil. The more practice students have before they visit the stream site the more successful they will be.
157

Utah Stream Team Unit IV. Field Investigation
The greenline will take two students 30
minutes to complete if they are familiar with the different vegetation types.
Figure IV-18. The Greenline transect (line of vegetation nearest the stream) as seen
from below
Canopy cover transects The canopy cover transect measures the
percentage of overhead area covered by leaves or branches. This tells us the amount of shading the stream receives.
The canopy cover transect runs along the greenline transect and can be measured at the same time. The canopy cover transect will take two students 15 minutes to complete.
Students can simply look up to determine whether the overhead space is covered or they can use an ocular tube for a more precise measurement. One student looks through the tube, pointing it straight up. A second student tells him/her when the tube is vertical, at which time, the observation is made (“covered” or “open”). To make an occular tube refer to the appendix “Make Your Own Monitoring Equipment.”
bare
ground
greenline transect
1st line of vegetation
Ground cover transects
Measuring ground cover tells us how well the riparian zone prevents erosion and filters runoff before it enters the stream.
Riparian ground cover transects are set up perpendicular to the greenline. They begin at the stream’s edge and extend approximately 30 feet away from the stream. Generally, five transects are run per stream stretch.
Students count paces to measure the ground cover transect. Along each transect students will record four possible categories: 1) live vegetation; 2) litter (dead plant or tree material); 3) rock; and 4) bare ground. These different cover types provide varying degrees of protection from erosion. The cover type found at each sampling point should be tallied on the data sheet.
One ground cover transect will take two students 10 minutes to complete (60 minutes to complete all five).
158

Utah Stream Team Unit IV. Field Investigation
Figure IV-19 Different types of vegetation. Note the differences in stems and leaves.
Grasses – These have hollow stems that are jointed and leaves with parallel veins. The leaves come off the stem in opposite directions. Grasslikes sedges – These resemble grasses but they have solid, triangular stems with no joints. The leaves have parallel veins but they come off the stem in three directions. This group also includes rushes which have round, hollow stems with very small or no leaves. Forbs – These generally have broad leaves with net-like veins. The stems are solid or spongy and they die back to the ground every year. Shrubs and trees – These have woody stems that remain alive all year. The leaves tend to have net-like veins. Rarely do shrubs grow taller than 13 feet. Trees are similar to shrubs in that they generally have a single woody stem but they grow taller than 13 feet.
[this page reprinted with permission from Utah State University Cooperative Extension Service] 159

Utah Stream Team Unit IV. Field Investigation
How do we interpret our results? When interpreting your transect data, remember that a considerable amount of natural variability exists within and between different riparian zones. Not all riparian zones have naturally abundant plant/tree growth. Simply because your study area does not have 100% canopy or ground cover does not necessarily mean that it is unhealthy or that it was impacted by humans.
To use your transect data to accurately assess riparian zone health you must establish long-term trends. Regular and continual sampling will show if changes are occurring over time. Consult with local land owners, local land management personnel or historic photos to determine past conditions.
Greenline The higher the greenline score, the better the riparian zone can control erosion and stabilize the bank. Canopy cover The greater the percentage of overhead cover, the more shading your stream receives. Shading helps lower water temperature. Overhead material also adds organic matter to the stream which is an important food source for aquatic macroinvertebrates. Ground cover The materials that comprise riparian zones naturally vary according to their individual watersheds. Riparian zones in the Uinta Mountains may be primarily rock, while lower lying areas may be completely vegetated. As a general rule, though, a healthy riparian zone will be covered by a mixture of litter, rock and vegetation (many desert streams, which have very sandy banks, are an exception). A mixture of cover types is ideal because each provides a different service. Vegetation functions well as a filter and also buffers against erosion. Rock does little to filter erosion but acts as an excellent buffer against erosion. Litter serves both functions.
Resources for further investigation River Corridors and Wetlands Restoration – Consult this web site if you want to involve your group in a riparian restoration project. It contains information on restoration projects, proposals, ideas, and contacts. www.epa.gov/owow/wetlands/restore
Enviroscape: Riparian Kit – This plastic waterflow model offers an accompanying activity guide that focuses on the Riparian Zone. Contact : Your local [county] Cooperative Extension Service – or – Utah State University Extension, 1500 N 800 E, ASTE Dept, Utah State University, Logan, UT 84322-2300, (435) 797-3389. www.ext.usu.edu/natres/wq/index.htm. See the “Resources” appendix for ordering information. Rocky Mountain Flower Finder : A Guide to Wildflowers Found Below Tree Line in the Rocky Mountains by Janet L. Wingate. Publishers - Berkeley : Nature Study Guild, ©1990. This field guide will help students identify common grasses, plants, shrubs and flowers in Utah. More importantly, it provides easy-to-understand techniques for identifying plant families. This is an excellent guide for student field trips. Rocky Mountain Tree Finder : A Pocket Manual for Identifying Rocky Mountain Trees by Tom Watts. Publishers – Berkeley: Nature Study Guild, ©1972. This made-for-students field guide makes an excellent compliment to the Rocky Mountain Flower Finder.
160

Utah Stream Team Unit IV. Field Investigation
Bibliography Bureau of Land Management. Riparian Area Management. US Government Printing Office (175-814), 1987. Oregon Department of Fish and Wildlife. “Riparian Areas,” The Stream Scene: Watersheds, Wildlife and People. Aquatic Education Program. Portland, OR, 1999. pp. 161-169. Oregon Watershed Improvement Coalition. “Riparian Areas: Their Benefits and Uses.” no date. Rasmussen, Allen, Michael O’Neill, Lisa Schmidt. Monitoring Rangelands: Interpreting What You See. Utah State University Cooperative Extension Service. Logan, UT, No date given. United States Department of Agriculture. “Healthy Riparian Areas,” US Forest Service (FS-445), 1990.
Utah Project Wild. “Riparian Areas: Ribbons of Life,” Growing Wild. Spring, 1997. p. 7.
Utah Riparian Management Coalition. “The Riparian Zone.” no date given.
161

Utah Stream Team Unit IV. Field Investigation
162

Utah Stream Team Unit IV. Field Investigation
Riparian Zone
Greenline
NOTE: The “greenline transect” can be done at the same time as the “canopy cover transect.” To save time have your directions and data sheets ready for both. 1. Measure a 100 ft stretch along your stream. Place a flag near the water at the beginning and end points. 2. Standing at the first flag, look toward the water. Note the vegetation type that is closest to the water and record it in row (1) of the data sheet. 3. Take one pace toward the other flag and stop. A pace is a normal stride you would take while walking. Look toward the water and record the vegetation type closest to the water. 4. Repeat these steps until you reach the other flag. 5. Add up the total number of steps you took and record in row (2). 6. Sum up all the observations and record in row (3) 7. For each vegetation category, divide the number in row (2) by the number in row (3), multiply by 100 and record in row (4). This will give you the percentage of the greenline that is made up of that vegetation category. For example, if you took 50 steps and found grass at 20 of them then 40% of your greenline consists of grasses.
Time – 30 minutes Persons – 2 Materials – Flagging Tape measure Riparian Zone Data Collection Sheet Plant guide (optional)
Figure 1
8. For each vegetation category, multiply the number in row (4) by the factor in row (5) and record in row (6). This will give you the “site score” for each vegetation category. Because sedges and rushes have the strongest roots and prevent erosion the best they receive the highest factor - “9.” Bare ground doesn’t prevent erosion so it receives the lowest factor – “1.” 9. Add the individual site scores in row (6) together to get the “total site score” for that stretch of stream.
163

164 Utah Stream Team Unit IV. Field Investigation
Canopy Cover Note: At each point where you record greenline data you will also record canopy cover data. 1. Point the ocular tube straight up in
Time – 30 minutes Persons – 2 Materials – ocular tube measuring tape Riparian Zone Data Collection Sheet
the air (90 degree angle) and look through it with one eye. Your partner who is recording data can help you adjust the tube until it is as straight as possible. 2. Tell the recorder whether the “X” at the end of the tube points at sky (a “miss”) or a part of a tree or bush (a “hit”). Record this on your “canopy cover data chart.” 3. Repeat these steps for the rest of the greenline. 4. Add up the total hits and misses and record in the second row. 5. Add the two scores recorded in row 2. This will tell you the “total number of steps” you took along the transect (the greenline). Record this total in row 3. 6. Divide the number of “hits” in row 2 by the total observations in row 3 and multiply by 100. This will give you the percent canopy cover for the transect.
Ground Cover Note: Riparian ground cover transects start at the stream edge and extend 15 paces away from the stream, into the riparian vegetation. A pace is a normal stride you would take while walking.
Time – 35 minutes Persons – 2 Materials – Measuring tape Riparian Zone Data Collection Sheet
1. You will collect data along five separate transects in your stream stretch, spaced out at approximately equal distances along your stream reach. If possible, you should run two transects on one side of the stream and three on the other to get a better picture of the total riparian zone. Refer to the figure on page 1 of these instructions for help locating these transects. 2. Starting at the stream’s edge take one pace away from the stream. Touch your finger to the ground at the tip of your front foot. 3. Note the ground cover type that your finger touches. The categories are: bare ground, live vegetation, litter (dead vegetation or sticks) or rock. Record the type with a slash in the appropriate box on the “ground cover data chart.” Note that each column on the data chart is for a separate transect. 4. Repeat steps 2 – 3 for 15 paces. Then move on to the second transect. Repeat. 5. When you’ve finished with all five transects, add the totals for each row or cover type. Record your totals for each ground cover category in the category total column. In the next column, divide the categoy total by 75 (your total number of steps) and multiply by 100. This will give you a percentage of ground cover for each type in the riparian zone. To check your math, add up your percentages for each ground cover type. They should total 100%. * The percentage of each ground cover type provides a measure of ground cover that can be compared to other sites or to compare changes over time (between different years or seasons). As a general rule, though, a healthy riparian zone will be covered by a mixture of litter, rock and vegetation. An important exception to this are desert streams, which have very sandy banks.

165 Utah Stream Team Unit IV. Field Investigation
Greenline
Vegetation CategoriesDeep Rooted Plants Shallow Rooted Plants
Bare Ground Sedges and
Rushes Shrubs and
Trees Grasses Forbes
Row 1: Record each observation as a slash mark in the appropriate box.
Row 2: Total # of observations for each category
Row 3: Total number of observations for the entire greenline (sum of all observations in Row 2):
Row 4: % of each category (divide row 2 values by total in row 3. Multiply by 100)
Row 5: Multiply each value in row 4 by this factor.
X 9
X 8 X 6 X 3
X 1
Row 6: Site score for each category
Total Site Score (add up all site scores in Row 6):
The higher your score the stronger your plant roots are and the more your stream banks will resist erosion.
Notes:

166 Utah Stream Team Unit IV. Field Investigation
Canopy cover
“Miss” (Open sky) “Hit” (Vegetation)
At each step along green line, record with a slash whether you see a “miss” (open sky) or a “hit” (vegetation) in your ocular tube.
Total # of slash marks for each category
Total number of observations
% Canopy cover: Divide total “hits” by total observations and multiply by 100
The more “covered” area you have the more shading your stream receives (this keeps the water cool and provides food for aquatic organisms).
Ground cover Transects Perpendicular to the Greenline
1
2
3 4 5 Category
Total
Percent of each category (divide category total by 75 and multiply by 100)
Live vegetation
Litter
Rocks
Bare ground

Utah Stream Team Unit V. Post-Field Activities
Unit V. Post-Field Activities
Many groups feel that stream monitoring is the climax of their water quality monitoring program. However, many more exciting and important opportunities lay ahead. Students will want to take a look at their data to find out how their stream is doing or to design further investigations. They will also want to share what they have learned with others (e.g. community members, fellow students) and to act on their findings to make a difference for their stream. This unit will help to make your monitoring program complete.
Sections
1. Illustrating Your Data
2. Reflecting On Your Data
3. Stewardship
southwestern willow
167

Utah Stream Team Unit V. Post-Field Activities
168

Utah Stream Team Unit V. Post-Field Activities
V-1. Illustrating Your Data
Key Terms bar graph mean dependent variable line graph independent variable spreadsheet
It can be challenging to interpret your data in raw form. The data will appear even more confusing to those who were not involved in its collection. Both your group and outside audiences will better understand the meaning of your data if it is presented in graphical form (it will be much more interesting to look at, too). This section will help you to chart and graph data. The next section, “Reflecting on Your Data,” will help you to interpret it.
To decide which form(s) of data illustration best suits your purpose asks yourself the following questions. Suggested chart and graph types are provided.
How do you summarize your data? The first step in illustrating data is to organize it. You may want to first enter data by hand onto a ledger or graph paper and then transfer the information to a computer spreadsheet program (Excel, Lotus 1-2-3, Quattro Pro). Computer spreadsheet programs will help you to summarize and analyze the data. They will also allow you to create charts and graphs directly from the spreadsheet.
Rocky Creek Water Quality Monitoring Data (1999-2000)
9/20/99 3/14/00 5/20/00 7/17/00Site 1 Site 2 Site 1 Site 2 Site 1 Site 2 Site 1 Site 2
Temperature (oC) 9.0 9.5 5.0 5.2 13.5 14.0 19.8 20.5Turbidity (NTU) 8 9 35 40 50 55 15 20DO (mg/liter) 9.0 9.0 10.0 10.5 8.5 8.0 7.0 6.5Nitrate (mg/liter) .100 .200 .150 .400 .200 .450 .150 .180Phos. (mg/liter) .030 .040 .200 .300 .150 .200 .050 .070pH 7.5 7.5 7.0 7.0 7.5 7.5 8.0 8.0EPT Value 15 8 9 6 10 6 14 9Flow (cfs) 25 30 50 60 75 85 30 35
Table V-1. Example of a spreadsheet with monitoring at 2 sites and 5 dates.
What’s the first step in presenting our data? After organizing your data, summarize it in table form. You might want to include the maximum and minimum values (which establish your range of values), and the mean – the average value. Make notations on your chart, if necessary, to help you to interpret your data later on. A table may be the final form for your data. It is also a useful step when creating a graph. Table V-2 below summarizes data for various water quality parameters.
169

Utah Stream Team Unit V. Post-Field Activities
Summary – Rocky Creek Water Quality Data parameter average minimum (date) maximum (date)
temperature (oC)
turbidity (NTU)
dissolved oxygen* (mg/liter) nitrate (mg/liter) phosphate (mg/liter) pH** EPT value Flow (cfs)
11.8
27
8.6
0.150
0.100
7.5
12
45
5.0 (3/14/00)
8 (9/20/99)
7.0 (7/17/00)
0.100 (9/20/99)
0.03 (9/20/99)
7.0 (3/14/00)
9 (3/14/00)
25 (9/20/99)
19.8 (7/17/00)
50 (5/20/00)
10.0 (3/14/00)
0.200 (5/20/00)
0.20 (3/14/00)
8.0 (7/17/00)
15 (9/20/99)
75 (5/20/00)
NOTES: * samples taken from riffle area ** tests conducted with pH strips
Table V-2. Summary table of data shown on table V-1.
How do you want to represent your data? There are many ways to present your data, but the two most common are pie charts and two-
dimensional graphs.
Do you want to look at percentages of a whole? A pie chart, such as Figure V-1, compares parts of a whole. The proportion of each part is represented by a “piece of the pie,” with the pie equaling 100% of the total values of the data set. Pie charts are widely used because they are simple and easily understood.
Land Use in Rocky Creek Watershed
16% 5% 3%
38%
38%
agriculture
commercial
industrial
other
residential
Figure V-1. Example of a pie chart to show percent of land use in an area.
170

Utah Stream Team Unit V. Post-Field Activities
2/ 3/ 4/ 5/ 6/ 7/ 8/ 9/ 10/ 11/ 12/ 15 15 15 15 15 15 15 15 15 15 15
Do you want to see how values change over time or distance? Two-dimensional graphs (line graphs and bar graphs) show how values change over time or from one site to another. These graphs have an x-axis and a y-axis. The x-axis represents the independent variable - a constant, such as time and date, that is not influenced by other factors. The y-axis, the dependent variable, changes in response to other factors. An example of a dependent variable is water temperature.
In Figure V-2 below, the line graph shows how the temperature of Porcupine River fluctuates over the course of a year. The bar graph in Figure V-3 compares pH levels from site to site. Continuity of data is an important difference between line and bar graphs. Line graphs assume data points are connected to each other – they show a continuous trend. Bar graphs are used when data points are not connected.
80
70
60
50
º F 40
30 1/
15
Water temperatures in Porcupine River
tem p
date
Figure V-2. Example of a line graph showing water temperatures over time.
pH Levels along Moose Creek
Figure V-3. Example if a bar graph showing pH levels over time at different sites.
14
12
10
mg/L 8
6
4
2
0
15-Sep 15-Oct 15-Nov 15-Dec
site 1
site 2
site 3
UT State Standard (6.5 – 9.0)
171

Utah Stream Team Unit V. Post-Field Activities
10-S
ep
15-D
ec
20-F
eb
25-A
pr
30-J
un
05-A
ug
NOTES: This is a good way to illustrate water quality upstream (site 1), downstream (site 2), and far
downstream (site 3) of a suspected pollution source. Include the Utah State Standard on your graph to help you interpret water quality. See
“Water Laws” for information on Utah’s Water Quality Standards.
Do you want to look at relationships between parameters? You can place the values for two or more parameters on the same graph to investigate a possible relationship. For example, the graph that follows, Figure V-4, contains values for both dissolved oxygen and temperature. We see that a rise in temperature coincides with a drop in dissolved oxygen concentration. Graphically illustrating these relationships will help you interpret your data later. Notice that this graph has two y-axes – one for temperature and one for dissolved oxygen. The x-axis – time – is the independent variable for both.
Clear Creek – Temperature and Dissolved Oxygen – 1999-2000
30 14
25 12
20 10
ºC 8
15 6
10 4
5 2
0 0
Temperature (C) Dissolved Oxygen (ppm)
Figure V-4. Example of a line graph showing 2 parameters.
More tips on graphing Make sure your graph has a title and legend and that all units are labeled. The data points should be proportional to the actual values so the meaning of the graph is not
distorted. Keep the graph simple. Limit the number of variables. Notations can help others better understand your graph.
172
mg/L

Utah Stream Team Unit V. Post-Field Activities
Resources for further investigation Streamkeepers Field Guide: Watershed Inventory and Stream Monitoring Methods. This manual addresses most major aspects of a classroom and field monitoring program including graphing and presenting data. Manual is adaptable for use by students ages 12-adult. Companion video also available. Contact: The Adopt-A-Stream Foundation at the Northwest Stream Center, 600-128th Street SE Everett, WA 98208-6353 (425)316-8592; Fax: 425-3381423; [email protected]; www.streamkeepers.org
The Volunteer Monitor – This bi-annual publication by the Environmental Protection Agency (EPA) offers information and ideas for volunteer water quality monitors of all backgrounds, including school groups. The Spring 1995 issue specifically addresses the topic of “Illustrating Your Data.” You will find articles such “Using Graphs to Tell Your Story,” “Beyond Reports: Packaging Data Creatively,” and “Using Data in the Classroom.” You can obtain this free publication by mail or via the EPA’s web site. Contact: Elanor Ely, Editor, 1318 Masonic Avenue, San Francisco, CA, 94117; (415) 255-8409. www.epa.gov/OWOW/volunteer/vm_index.html
Bibliography Kerr, Meg. “Using Graphs to Tell Your Story.” The Volunteer Monitor. Vol. 7, No. 1, Spring, 1995.
Murdoch, Tom, et al. Streamkeeper’s Field Guide. Adopt-A-Stream Foundation. Everett, WA, 1996.
National Oceanographic and Atmospheric Administration. “Teacher’s Guide.” The Globe Project. www.globe.ngdc.noaa.gov/, April, 1999.
173

Utah Stream Team Unit V. Post-Field Activities
174

Utah Stream Team Unit V. Post-Field Activities
V-2. Reflecting on Your Data
Key Terms accuracy comparability cause correlation
outlierprecision
representativeness
So, does your stream have good water quality? Why or why not? Can you make a judgment at this point? This chapter will help you to analyze your water quality data and answer these questions. First, take a look at how well your group collected data. Then, investigate a series of graphs that illustrate common water quality data sets. The insight provided will help you interpret your own data.
Reflecting on the data collection process Natural systems, such as streams, are inherently variable; their water quality changes due to climate, temperature, stream flow, and many other factors. Variability exists in our data collection procedures, as well. Each of us measures and interprets differently. Our differing ability to judge colors, distances and amounts affects the quality of data we collect. For example, we use a color comparator (color wheel) to determine the concentration of nitrogen in the water. One of us may judge the color differently than another and therefore determine a different nitrate concentration. Or, perhaps the equipment was faulty or used incorrectly. These differences can lead to variability in monitoring results.
Measures of precision, accuracy, representativeness and comparability help us evaluate sources of variability and error, and thereby increase
Remember, mistakes make excellent learning opportunities.
confidence in our data. No matter what standard of quality we set for our data, students should understand these measures. Their underlying principles apply to all scientific investigations and even everyday inquiries.
Precision Precision – the closeness of measurements to each other – tells us how consistent our sampling procedures are. If data points are spread across a graph in a shotgun pattern, we can consider our sampling procedures to have a low degree of precision.
Accuracy Accuracy tells us how much confidence we can have in our data. The smaller the difference between our measurement (e.g., nitrate concentration) and its “true” value the more accuracy we have. Data collected by the Division of Water Quality can serve as a comparison to help you determine accuracy.
Figure V-5 A comparison of precision and accuracy. Top left corner shows data with high precision and high accuracy, bottom right shows data with low precision and low accuracy.
175
Utah Stream Team Unit V. Post-Field Activities
Representativeness If you sampled only a small stretch of pristine headwaters in an otherwise highly polluted stream, then your measurements had a low degree of representativeness – how well measurements depict the true characteristics of the stream. Sampling at multiple sites or throughout the year are two ways to increase representativeness.
Comparability Our water quality data gain real value when we can establish long-term trends or are able to compare different sites (upstream to downstream) on a stream to another. The degree to which we can compare data between dates, sites and other studies is called comparability. Consistent sampling techniques are needed to reach a high degree of comparability.
Reflecting on your water quality data Here are some important points to remember about analyzing water quality monitoring data. 1. To interpret the value for a measurement, such as pH, we need to compare it to the Utah State Standard. The Utah Division of Water Quality determines a State Standard for many water quality parameters. State Standards can be found in the “Water Pollution” section and in the background information for each sampling parameter in Unit IV.
2. The “Background Information” supplied for each parameter in Section IV will also help
Cause vs. Correlation Students of all ages tend to mistake cause with correlation. For example, if students are told that no fish live in a local cold-water stream, they may be quick to infer that the cold temperatures are to blame, without knowing anything else about the stream. Further, students, especially those of middle school age, are very quick to prove cause from only one event. This owes mainly to students’ over-eagerness to fit information to their preconceived notions. This occurs even when there is insufficient information or when other, contradictory information exists. To counteract this, discuss the tendency, and the difference between the terms cause and correlation. Also, address misconceptions as they arise (e.g., all water quality problems are caused by man). Then, design ways for students to investigate for themselves those misconceptions (e.g., have them monitor changes in a pristine stream)
What’s the right answer? There are often several
you to investigate possible reasons (natural and human) for poor water quality.
3. If you find a potential water quality problem, re- sample to ensure that you properly collected the data. Then, consult with a local water quality expert (see the “Resources” appendix for contact information) to see if your data compares favorably with theirs. Always check your data against other sources before sharing your results.
Sample Data Graphs The following series of graphs represent common results from water quality monitoring. Share these graphs with students (you may want to make them into overheads).
different ways to make sense out of a set of data. However, studies show that few middle- school students seriously consider alternative explanations. To address this, have teams of students separately develop explanations for a water quality graph and then share. Challenge each team to develop multiple explanations for a graph. Students will increase their understanding of the complex nature of science.
176

Utah Stream Team Unit V. Post-Field Activities
Have students examine the data and propose hypotheses or ask questions about what they are observing. Compare their observations and questions with the conclusions listed below each graph. Note: Graph Sets 1 and 2 (Figures V-6 and V-7) are to be examined in pairs.
Figure V-6 Graph set 1. Example of flow and turbidity data.
CFS
700
600
500
400
300
200
100
0
1/1 2/1 3/1 4/1 5/1 6/1 7/1 8/1 9/1 10/1 11/1 12/1
Discharge
60
50
40
30
NTU 20
10
0
1/1 2/1 3/1 4/1 5/1 6/1 7/1 8/1 9/1 10/1 11/1 12/1
Turbidity
What makes sense? 1. Both the turbidity and discharge values follow a seasonal trend; they rise during the spring snow melt period and relax over time. Since the small spike in September occurred on both graphs it is probably due to a real event, such as a rainy period or dam release, not human error. 2. Turbidity increases with an increase in discharge and decreases with a decrease in discharge.
What requires further investigation?
1. Discharge increased almost 100% in April. At the same time, turbidity increased 400%. 2. During January and February, when discharge was low, turbidity was 10-12 NTU’s. Discharge returned to its low level in November and December. Turbidity did not (it measured 18-20 NTU’s). These two outcomes may be due to increased erosion in the stream channel or watershed over the course of the year. They could also be due to sampling error or unusually low turbidity levels at the beginning of the year. Continue to sample and establish a trend. Assess any changes in macroinvertebrate populations to see if possible turbidity increases are affecting aquatic life.
177

Utah Stream Team Unit V. Post-Field Activities
1/5
1/5
2/5
2/5
3/5
3/5
4/5
4/5
5/5
5/5
6/5
6/5
7/5
7/5
8/5
8/5
9/5
9/5
10/5
10/5
11/5
11/5
12/5
12/5
data. Figure V-7 Graph set 2. Example of pH and nitrate
10 pH
8
6
4
2
0
pH
1.2
1
0.8
0.6
mg/L0.4
0.2
0
nitrate
What makes sense? 1. With the exception of two points the pH data points are very precise. 2. pH drops during then spring snow melt period as expected. 3. The nitrate data points all fall within acceptable limits (more than “4 mg/L” is considered a pollution indicator).
What requires further investigation? 1. Nitrate data has a very low degree of precision – the data points are scattered all over the graph. Sampling error is the likely cause. 2. Two points on the pH graph are outliers – they do not fit within the range of the rest of the data. Sampling error is a possible cause. Since there is an abundance of precise data points for pH, we can confidently discard these two outliers. 3. pH drops steadily over the course of the year; from 8 to 6 (6 is below the Utah State Standard for most beneficial use designations). This is worthy of attention. The abundance and precise
178
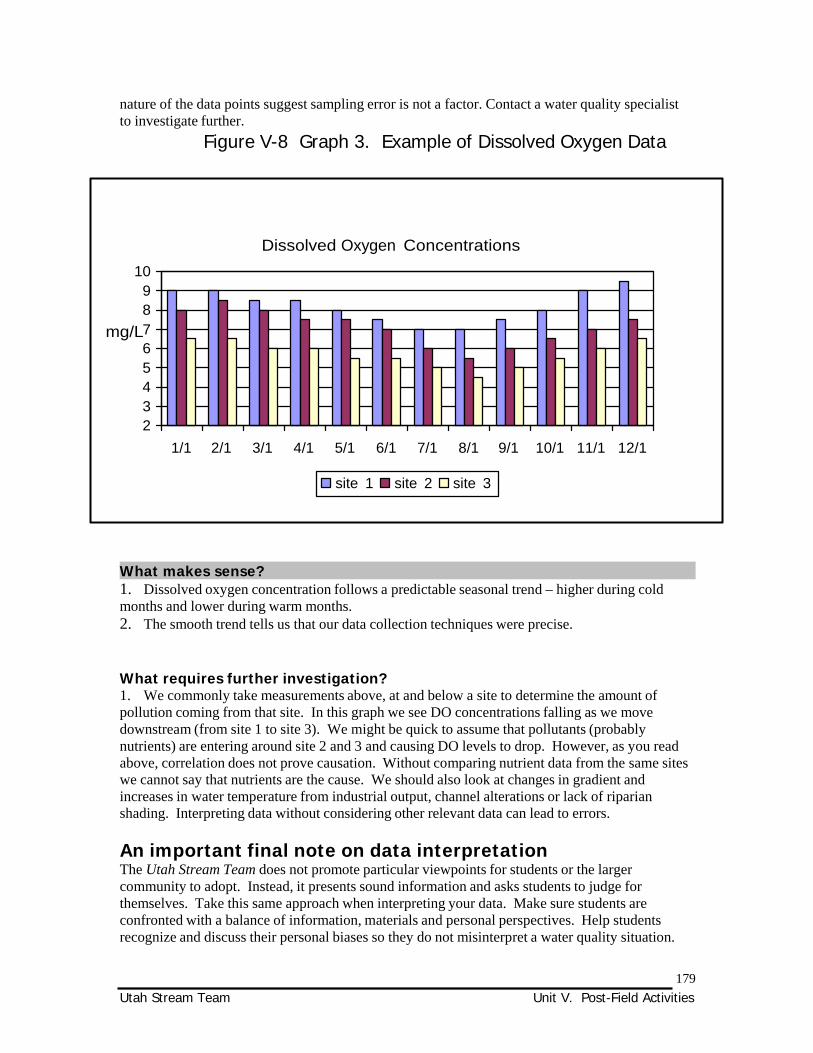
Utah Stream Team Unit V. Post-Field Activities
nature of the data points suggest sampling error is not a factor. Contact a water quality specialist to investigate further.
Figure V-8 Graph 3. Example of Dissolved Oxygen Data
10
9
8
mg/L7 6
5
4
3
2
Dissolved Oxygen Concentrations 1/1 2/1 3/1 4/1 5/1 6/1 7/1 8/1 9/1 10/1 11/1 12/1
site 1 site 2 site 3
What makes sense? 1. Dissolved oxygen concentration follows a predictable seasonal trend – higher during cold months and lower during warm months. 2. The smooth trend tells us that our data collection techniques were precise.
What requires further investigation? 1. We commonly take measurements above, at and below a site to determine the amount of pollution coming from that site. In this graph we see DO concentrations falling as we move downstream (from site 1 to site 3). We might be quick to assume that pollutants (probably nutrients) are entering around site 2 and 3 and causing DO levels to drop. However, as you read above, correlation does not prove causation. Without comparing nutrient data from the same sites we cannot say that nutrients are the cause. We should also look at changes in gradient and increases in water temperature from industrial output, channel alterations or lack of riparian shading. Interpreting data without considering other relevant data can lead to errors.
An important final note on data interpretation The Utah Stream Team does not promote particular viewpoints for students or the larger community to adopt. Instead, it presents sound information and asks students to judge for themselves. Take this same approach when interpreting your data. Make sure students are confronted with a balance of information, materials and personal perspectives. Help students recognize and discuss their personal biases so they do not misinterpret a water quality situation.
179

Utah Stream Team Unit V. Post-Field Activities
Resources for further investigation “The Volunteer Monitor: The National Newsletter of Volunteer Water Quality Monitoring.” Volume 7, No. 1, Spring 1995. This bi-annual EPA publication addresses almost every aspect of water quality monitoring, including those specific to school and youth groups. This volume, available on the internet, focuses on Managing and Interpreting Your Data. www.epa.gov/volunteer/spring95/index.html
Streamkeepers Field Guide: Watershed Inventory and Stream Monitoring Methods – This manual addresses most major aspects of a classroom and field monitoring program including data interpretation. The manual is adaptable for use by students ages 12-adult. A companion video is also available. Contact: Adopt-A-Stream Foundation, 600-128th St SE, Everett, WA 98208, (425)316-8592; www.streamkeepers.org
Volunteer Stream Monitoring: A Methods Manual – This free manual from the Environmental Protection Agency provides background information, sampling directions and data sheets for monitoring stream water quality. You will also find a handy section on Graphing and Interpreting Your Data. For a free copy of the manual, contact Alice Mayio at USEPA (4503F), 401 M St. SW, Washington, DC 20460; 202/260-7018; [email protected]. Also available on the web: www.epa.gov/owow/monitoring/vol.html.
Bibliography Dates, Tugel. “Interpreting your data.” The Volunteer Monitor. Vol. 7, No. 1, Spring, 1995.
Edelstein, Karen, Nancy Trautman, and Marianne Krasny. Watershed Science for Educators. Cornell University. New York. No date.
Environmental Protection Agency. Volunteer Stream Monitoring: A Methods Manual. Office of Water. EPA 841-B-97-003. 1997.
The Volunteer Monitor’s Guide to Quality Assurance Project Plans. Office of Wetlands, Oceans and Watersheds. EPA 841-B-96-003. 1996.
Mitchell, Mark, and William Stapp. Field Manual for Water Quality Monitoring. Thompson- Shore Printers. Dexter, MI. 1994.
180

Utah Stream Team Unit V. Post-Field Activities
V-3. Stewardship
“Never doubt that a small group of concerned citizens can make a difference. Indeed, it’s the only thing that ever has.”
- Margaret Mead
What is stewardship? Stewardship of our streams and water resources implies taking active care of them; being involved in the effort to improve or protect their health. Learning about, monitoring and reflecting on our stream’s water quality are important steps to take. However, if we fail to act on what we’ve found, then we have lost an opportunity to benefit the streams we care so much about. Stewardship is the final and perhaps most important component of the Utah Stream Team program.
Why is stewardship important? Students want to turn their monitoring efforts into action. They want to make a meaningful contribution and know that they are important members of their community. By doing so, they
The Utah Stream Team does not promote particular viewpoints for students or the larger community to adopt. Instead, it presents sound information and asks students to judge for themselves. When a class is determining whether action should be taken on an issue, the teacher should provide students with balanced information, materials and personal perspectives. Students should recognize and discuss their personal biases and make sure action taken does not reflect those biases.
grow personally, socially and intellectually. Studies show that providing students with opportunities to apply citizenship action skills affects their motivation, sense of personal responsibility and their likelihood of participating in future environmentally responsible behavior.
How do we create a plan for stewardship? The steps of a basic action plan are described below. Allow students to make important decisions at each stage. Work with a natural resource specialist to ensure that you are taking the proper course of action.
1. Evaluate a need for action Help students determine whether their active involvement is needed in a particular situation. List the social and ecological consequences of action or inaction. Then, list the advantages and disadvantages of involving students in the situation. Include an honest assessment of the group’s strengths, resources and commitment.
Stewardship projects provide students excellent opportunities to: practice interpersonal
and communication skills (both oral and written)
cooperate as a group develop leadership
abilities understand conflict
management
181
Utah Stream Team Unit V. Post-Field Activities
2. Choose a stewardship project Make a list of possibilities for a stewardship project. Your final choice should reflect student interests (and possibly the input of a specialist). The next section, “What types of action can we take?” provides specific ideas.
3. Research your project Help your students investigate their choice of action. What information should they know to make it successful? For example, if students choose to plant trees along the streambank, they should know what types of trees to plant, how to plant them, and what functions they will serve for the stream and riparian area. A natural resource specialist can be a valuable asset for this.
4. Create your plan The steps below will help you consider important logistical aspects of a stewardship project. 1. Define the problem. For example, a lack of riparian vegetation along our stream is contributing to degraded water quality. 2. Describe the goal of your project and your strategy to accomplish this goal. For instance: we will increase woody vegetation along our study area by planting willows. 3. List the specific objectives that support your overall goal. These should be realistic and measurable. For example: we will plant 100 willow saplings. 4. List the start and end dates of project.
Do we act on our monitoring data?
There are rewards and challenges to basing your stewardship project on your water quality monitoring results. Students will see a direct outcome of their efforts and better understand that science is a tool for affecting their world. However, most groups find it difficult to collect enough quality data to base action on. Regardless of the quality of your data you should consult a local water quality specialist before deciding on a course of action. This person can check your findings against agency-collected data and make sure your stewardship project is appropriate. Arrange to have the specialist come to your school and work out a plan with your students.
5. Describe the tasks that are necessary to meet each objective. You may want to do this on a timeline. List the names of students responsible for each task and supplies needed. The “Give Water a Hand – Youth Action Guide” provides a handy chart for organizing these duties (see “Resources for further investigation” at the end of this section). 6. List possible sources for supplies, information, money and other necessities. 7. Generate ideas for how to publicize your project.
5. Put your plan into action Follow the steps of your completed implementation plan. Keep careful records of each step along the way (who completed each task and when). Photographs and videotape will help document and publicize your efforts. Periodically review your goals, objectives and timeline to make sure you’re on track.
6. Reflect on your stewardship project After you’ve completed your stewardship project, celebrate the fact that you took action! Then, help your group reflect on individual and group efforts as well as the success of the project as a whole. Did you meet all of your goals and objectives? What did you do well as individuals and as a group?
182

Utah Stream Team Unit V. Post-Field Activities
Was your action effective? Why might it be difficult to determine the effectiveness of your action? Consider the scale
of the issue, the time needed to see improvement, and human and natural influences that will continue to affect the situation.
Use this opportunity to discuss concepts of empowerment and community service with your group. Through the Utah Stream Team, program students should have developed an understanding of the broad consequences of their actions and their responsibility for those consequences. This “Stewardship” component empowers students to act on that responsibility. Students should know they have the ability and knowledge to make a difference for their stream and community.
What types of action can we take? Water-focused stewardship projects can encompass all major disciplines, target a wide range of audiences, happen in many different places, and occur through many different mediums. The information that follows will help you choose from the many alternatives.
Education – These projects focus on teaching others about water quality or water-related issues. They provide great opportunities for working in other disciplines. You can write and perform a play, song or
Think about it. “Research on experiential education programs clearly shows that the key to helping youth learn from service projects is thoughtful reflection during and after the experience. Through structured reflection, youth make sense of what they have seen and done. Then, as they continue on the same or new service projects, they test their ideas about how to get things done. They learn how to learn." - North American Association for Experiential Education – Environmental Education: Guidelines for Excellence.
poem; design posters or works of art; create a water education pamphlet and hand it out to the community; or, put on a slide show. Here are some other ideas. Hold a workshop for family members or school staff on dangerous household cleaning chemicals and water-friendly alternatives, such as baking soda and vinegar. For information, contact: Water Environment Federation, 601 Wythe St, Alexandria, VA, 22314. Make posters informing the community of where they can recycle their used oil. For information, contact: Water Environment Federation, 601 Wythe St, Alexandria, VA, 22314.
Persuasion – These projects try to convince people to take positive action. You can create posters, brochures, or a video; organize a debate (invite land users, civil servants, water quality
Who is going to listen? Stewardship projects can target one or more of the following: your school a community organization your city or county commission private land owners store owners and shoppers fairs and festivals resource management agencies news media your home/family your neighborhood any individual or group that has a
stake in quality water – everyone!
experts, biologists and others); write letters to your local government or newspaper; or, give a presentation to your County Commission. Here are some other ideas. Stencil water-friendly messages on neighborhood storm drains. The Earthwater Stencils program provides 10 different stencils, each with a picture of an aquatic animal and messages
183

Utah Stream Team Unit V. Post-Field Activities
such as “Dump no waste, drains to river.” Their web page offers step-by-step instructions on how to conduct a storm drain stenciling project Contact: Earthwater Stencils, 4425 140th Ave SW, Rochester, WA 98579-9703; www.earthwater-stencils.com.
Economics – These projects encourage consumers to shop for products that have less impact on water quality. You can set up an informational display in front of a grocery store or hardware store or inform folks through newspaper or radio. Here are some other ideas. Sell environmentally-safe products, such as organically-grown vegetables from the school garden. Inform folks that all proceeds will go to support water quality programs. Contact: your local County Extension Agent for information on organic gardening.
Restoration – A restoration project aims to physically improve your stream. This may include picking up litter, reinforcing eroded stream banks, planting riparian vegetation and building bird houses. Restoration projects away from the steam, such as vegetating bare upland slopes and enriching upland soils, may also improve water quality. Always include restoration experts in your project. Here are some other ideas. Xeriscape (plant native, drought-tolerant vegetation) the grounds around your school or home. For information, contact the Natural Resource Conservation Service (NRCS), Utah State Office, 125 South State Street, Salt Lake City, Utah 84138, PO Box 11350, Salt Lake City, UT 84147-0350, (801) 524- 4550, fax: 801-524-4403, www.nrcs.usda.gov
How can we help? When we think of improving our stream’s water quality we often think of doing it directly through a stream-side restoration project. However, there are many influences far from the stream that can affect its water quality, such as household chemical use, personal water use, and littering. We can do a lot of good for our stream by addressing these community- wide issues as well.
Politics – Your group may want to change a regulation or take up some other form of political action. You can speak at a public hearing, present your issue to a government official, start a letter writing campaign, circulate petitions and fliers, and write letters to the newspaper. Here are some other ideas. Your group can campaign for a community- or state-wide water quality issue. For help organizing a campaign effort, refer to The Kid’s Guide to Social Action (see “Resources for further investigation” below).
What else should we know about stewardship? Students should know that their stewardship project, by itself, will probably not solve the water quality challenges of their stream. But, it will make a difference. Real change does not occur all at once, but instead through small, continual steps – each one an essential part of the larger effort.
Through the Stewardship portion of the Utah Stream Team program, students should learn about people of different ages, races, genders, cultures, education and income levels who have helped make their world a better place by taking action.
Consider partnering with a community organization for your stewardship program. Established organizations can provide funding, logistical support and human resources. These groups may also help assure that your stewardship project is carried on into the future, increasing
184

Utah Stream Team Unit V. Post-Field Activities
its effectiveness. Some groups you might consider working with: Utah Farm Bureau, Sierra Club, Trout Unlimited, Audubon Society, Utah Association of Conservation Districts, Izaak Walton League and many others. Your Chamber of Commerce has a directory of such organizations in your area.
Resources for further investigation 50 Simple Things Kids Can Do To Save The Earth – This book provides 50 practical, easy-to- accomplish activities kids, and kids of all ages, can do to protect and improve the environment. You’ll find lots of ideas specific to water quality. Contact: The Earth Works Group, Andrews & McMeel, Kansas City, MO, 1990.
Give Water a Hand – This youth action program promotes good water management practices at home and in the community. You’ll find a comprehensive plan for leading students through a water education and service program. Their “Action Guide” and “Leader Guidebook” can be downloaded from their web site for free. Contact: University of Wisconsin – Extension, College of Agriculture and Life Science, Madison, WI, 53706, (800) WATER20. http://www.uwex.edu/erc/down.htm
The Kid’s Guide to Social Action, by Barbara Lewis, 1991. This book will show you how to get your project noticed and to get results. It includes step-by-step guidance for writing letters and press releases, making speeches, campaigning, lobbying, and other kinds of community action for kids 10 and up. 185 pages. $17.95. Order from Free Spirit Publishing, 400 First Ave. North, Ste. 616, Minneapolis, MN 55401; (800) 735-7323.
The Volunteer Monitor – The Spring, 1999 issue of the EPA’s biannual national newsletter for volunteer water quality monitoring focuses on restoration. Find technical information, project ideas, contacts and more. This publication is designed for all areas of volunteer monitoring, including school groups. You can obtain this free publication by mail or via the EPA’s web site. Contact: Elanor Ely, Editor, 1318 Masonic Avenue, San Francisco, CA, 94117; (415) 255-8409. www.epa.gov/OWOW/volunteer/vm_index.html
Bibliography Project Aquatic Wild. Aquatic Project WILD Activity Guide. Western Regional Environmental Education Council (WREEC). Boulder, CO, 1987.
Project WET. Project WET Curriculum and Activity Guide. The Watercourse and Council for Environmental Education. Bozeman, MT, 1995.
Cooper, Terry. “Putting the Action Into Your Action Plans.” The Volunteer Monitor. Vol. 5, No. 1, Spring 1993.
University of Wisconsin – Environmental Resources Center. Give Water a Hand. College of Agriculture and Life Science. Madison, WI, 1997.
185

Utah Stream Team Unit V. Post-Field Activities
186

Utah Stream Team Unit VI. Utah Water Information
Unit VI. Utah Water Information
This unit provides the educator a foundation of watershed principles. Natural and human influences on water quality are highlighted.
Sections
1. The Water Cycle
2. Watersheds
3. Water Pollution
4. Water Laws
Each section contains: background information illustrations that can be copied for overheads and handouts resources for further investigation lesson plans
187

Utah Stream Team Unit VI. Utah Water Information
188

Utah Stream Team Unit VI. Utah Water Information
VI-1. The Water Cycle
Key terms aquifer
groundwater
surface runoff
capillary action percolation transpirationcondensation pore spaces watersheddischarge precipitation water tableevaporation sublimation
What is the water cycle? Did you know that the water we see all around us never gets destroyed and new water never gets created? Instead, it constantly recycles and moves around in a process called the water cycle. Water in every form, or state – gas, liquid or solid – is a part of the water cycle. The sun’s energy powers this cycle, causing water to evaporate and rise into the atmosphere in the form of water vapor. When the vapor condenses in the form of rain and snow, gravity pulls it back to earth. Once on earth, gravity continues to force water downhill as surface runoff or ground water until the sun’s energy can evaporate it and raise it back up. These are only a few of the paths through the water cycle. Explore others in Figure VI-1 below. Descriptions of the three water cycle zones and the processes that occur in each follow.
Figure VI-1. The water cycle – note how water moves between the atmosphere surface, water and groundwater.
189

Utah Stream Team Unit VI. Utah Water Information
Table VI-1 A drop in the bucket This table shows where water is located within the water cycle and how long it spends in each area. Notice the relatively tiny amount of drinkable water on Earth.
Water Source % of Total
Oceans Icecaps/glaciers Groundwater Freshwater lakes Inland seas Atmosphere All rivers
97.2 2.0 .62 .009 .008 .001 .0001
The water cycle zones The water cycle occurs every place that water is found. We can divide these places into three water cycle zones. Atmosphere – This includes all the water contained
in the thin envelope of gas that surrounds the earth (precipitation, condensed water in clouds and water vapor).
Surface Water – This includes all the water contained in water bodies (oceans, streams, rivers, lakes, and wetlands), organisms (plants, animals, you and me), surface layers of soil, and ice (glaciers and polar ice caps).
Underground – Everything below the surface layer of soil. The water found here, groundwater, can be found in the pore spaces in soil or in small cracks in rock (contrary to a common belief that groundwater sits in large, underground caves). The top of the groundwater is called the water table. The water table is the shallowest point where you can find a steady supply of water. Above the water table, the pore spaces are not completely filled with water. If the area of wet soil and rock is large we call it an aquifer.
Paths through the water cycle Evaporation: When water is heated by the sun, its surface molecules energize. This energy breaks the attractive force that binds the molecules together and allows them to rise as invisible vapor into the atmosphere.
Condensation: The sun’s energy causes water vapor in the atmosphere to rise. As it rises it cools and eventually condenses on tiny dust and ice particles. When vapor condenses it turns back to a liquid or solid. The tiny drops then collect and form clouds which are moved around by air currents.
Precipitation: Clouds that are filled with condensed water vapor drop their heavy load in the form of rain, snow, sleet or hail. Air temperature, which decreases as you go up, also affects precipitation. Cool air cannot hold as much water as warm air. Therefore, when air currents or mountains cause clouds to rise, the clouds are more likely to precipitate.
Surface runoff: Evaporation and discharge (see below) send water to the earth’s surface where it travels over the land. Runoff collects in streams and rivers, ponds and lakes and eventually flows to ocean (unless it evaporates or moves underground).
Percolation: Percolation describes the action of water as it moves through spaces in the soil and rock. Percolating water may stay near the surface, move downward through cracks, or move back up to the surface in discharge areas. Water that percolates upward is either pulled upward by capillary action or forced upward by solid layers of rock.
Discharge: Water moves to the surface from underground in discharge areas. These are areas on the landscape that sit lower than the water table. Discharge areas include springs as well as some streams, lakes and wetlands.
190

Utah Stream Team Unit VI. Utah Water Information
air
Transpiration
Transpiration: Water vapor enters the atmosphere from plant leaves in a process called transpiration. Transpiration occurs because water moves from areas of lesser concentration to areas of greater concentration. Since there is usually less moisture in the air than in the soil, water will be sucked through the plant and into the air – just like through a straw!
How does the water cycle affect water quality?
H2O
Figure VI-2. Transpiration occurs when water moves from a plant into the atmosphere
Water is sometimes called the “universal solvent,” meaning that more materials (gases, solids and liquids) dissolve in water than in any other substance on earth. Because of this, water is constantly picking up pollutants in various forms. Because water is constantly on the move through the water cycle, these pollutants can be carried by the water far beyond their initial source. For example, surface runoff polluted by motor oil or antifreeze may move through the soil and contaminate ground water. The pollution may then travel through the soil and re-appear at the surface in a spring far away. For another example, look to the skies. Water in the atmosphere may dissolve sulfur containing gases to form sulfuric acid, which falls to the earth as acid rain.
Just as water can transport pollutants, it can also clean itself of them. As water percolates through the ground, soil particles may
filter out some pollutants. Transpiration by plants moves nutrients and other
dissolved substances with the water, which are then incorporated into the plant tissues.
When water changes from liquid to gas (evaporation),
How can we help? Natural water purification processes, like distillation,
percolation or transpiration, clean much more water than humans can through water treatment facilities. However, natural purification is a slow process compared to the rate at which we “use” or pollute our clean water. We can help the process along in many ways. We can use less water (e.g., take shorter showers) and reduce pollution (e.g., use of home and garden chemicals).
individual water molecules break away, leaving pollutants behind. This action is called distillation. Note, however, that although water can clean itself through distillation, the pollutants are not removed from the environment. In fact, they may concentrate and become more dangerous.
What influences the water cycle? Many factors influence how water moves through the water cycle. These include the sun, gravity, geography and watershed factors such as topography, soil characteristics and the amounts and types of vegetation close to and away from the stream.
The Sun The energy of the sun powers the water cycle. Increases in energy lead to increases in evaporation rates, air temperature (warmer air holds more water), and transpiration rates.
Heat energy allows to hold more water.
This is one reason the tropics are humid. Since air cools as it rises what do you think will happen to water-filled clouds as they rise?
191

Utah Stream Team Unit VI. Utah Water Information
The amount of energy an area receives depends on: Location on the globe. The sun strikes the equator at a direct angle, sending it a maximum
amount of energy (higher latitudes receive the sun at an angle). Length of day. Long summer days receive more of the sun’s energy. Season. As the northern or southern hemisphere tilts away from the sun during their winter
months, they receive the sun’s rays at less direct angles.
Gravity Water in any state – solid, liquid or gas – has mass, just like you and me. Therefore, gravity affects it. For example, snow falls from the sky on to a mountaintop where it melts and descends to the lowest point in the watershed. Gravity may continue to pull it down through the soil and into an aquifer.
Geography As previously mentioned, your location on the globe strongly affects the behavior of the water cycle. Rainfall increases nearer the equator and in bands around the earth at about 60 degrees North
and South latitude. Dry regions on earth occur at about 30 degrees North and South latitude. Rainfall increases in regions near large bodies of water (which supply water that evaporates
and becomes precipitation). Without the Great Salt Lake, the Wasatch Front would be even drier.
Topography Topography is the shape of the land’s surface, but it affects the water cycle in all three zones. The “rain shadow” is an example of how topography can affect water in the atmosphere. Mountains also affect surface and underground processes. Water that runs swiftly down a steep mountain has much less chance to work its way into the soil than water that moves slowly across a flat plain. Low points on the surface allow water to pool and increase its chance of entering the underground zone.
Figure VI-3. Rain Shadows One reason Utah is the second driest
state in the nation is because we are in a “rain shadow.” Warm air currents pick up water from the Pacific Ocean and travel east, or inland. When this warm air climbs over the Sierra Nevada Mt.’s in California it cools and drops its moisture. The drier air continues on towards us.
Soil and rock The soil and underlying rock material in an area affect how water moves from the surface to underground. Course material, such as gravel and sand, consists of large particles with large pore spaces (open areas between the particles). Water passes through this material and into the underground zone.
Some soil types, such as clay, consist of tiny grains which pack together tightly and leave tiny pore spaces. If these soils are on the surface they can keep precipitation from percolating downward. If they are located underground, they can help trap layers of groundwater and form aquifers. Layers of solid rock, or bedrock, have the same effect.
192
Engineers often rely on natural clay and rock layers to contain landfills and underground stores of harmful material, such as toxic waste.
Utah Stream Team Unit VI. Utah Water Information
Vegetation Plants move a tremendous amount of water through transpiration. Every day an actively growing plant transpires five to ten times as much water as it can hold at one time. Transpiration is one way the water cycle helps to clean water: when plants transpire they take up nutrients and other minerals that are in the water. Also, plants and litter (dead plant material) help maintain moisture in the soil by catching and holding surface runoff and by lowering evaporation rates.
How do humans influence the water cycle? We rely on water for not only drinking and washing but for industry, recreation, food production and much, much more. When we use water we alter the “natural” water cycle in many ways. Some of our uses simply re-direct water or send it on a different path. Other uses may degrade the quality or future availability of water.
Atmospheric pollution Sometimes we pollute water before it ever reaches the ground. Automobile and industry emissions, such as sulfur and nitrogen oxide, mix with atmospheric water to form acids – “acid rain.” Luckily, Utah doesn’t experience many of the negative effects of acid rain because our basic soils help neutralize the acid levels. Across the nation tighter pollution controls have gone a long way toward reducing atmospheric pollution.
Riding a bike, walking, and taking public
transportation are great ways to help reduce atmospheric pollution. It’s something we can do right now to make a difference.
Development Water cannot percolate through hard surfaces such as roads, parking lots or roof tops. When we pave over large areas of a watershed, we increase the volume and intensity of surface runoff, and also increase the amount of pollutants washed directly into our streams. Aquifers, where we get much of our drinking water in Utah, can dry up when precipitation cannot percolate into the soils to re-supply the groundwater.
Agriculture Agriculture is the largest user of water in Utah. Water that may have originally flowed as surface runoff in rivers is diverted for irrigation. This water then transpires through crops, evaporates into the air, or percolates down through the soil. Wise watering practices, such as watering during cool times of the day, reduce the loss of water to evaporation and keep more water in the soil for plants to use. It is also important to water our lawns in this manner. Lawn watering is the largest use of water in Utah’s cities.
Water treatment
The widespread conversion of farm irrigation systems from ditch irrigation to more efficient sprinkler systems has saved a tremendous amount of water over time. This also protects our water quality, because there is less surface erosion and runoff of pollutants into our streams.
All drinking water must first pass through a water treatment facility before the public can use it for drinking water. We also clean up sewage and waste water before releasing it back into rivers and lakes. Water treatment is a very expensive process though. By not polluting we help reduce the cost of water treatment and ensure the safety of our water supplies.
193
Utah Stream Team Unit VI. Utah Water Information
Resources for further investigation Environment Canada – This extensive but easy-to-navigate web site is operated by Environment Canada (Canada’s equivalent to the U.S. Environmental Protection Agency). Find information and lesson plans to help your students further investigate the water cycle. Also, find information and resources on different water body types, water management, and water and culture. Classes looking to study the effects of cold climates and winter weather on water will find this site useful. Contact: http://www.ec.gc.ca/water/en/nature/prop/e_cycle.htm
Project WET (Curriculum and Activity Guide) – Project WET provides hands-on activities for students of all ages to investigate the many aspects of the water cycle. Project WET, 201 Culbertson Hall, Montana State University, Bozeman, MT 59717-0057; (406) 994-5392; email: [email protected]
Bibliography Edelstein, Karen, Nancy Trautman, and Marianne Krasny. Watershed Science for Educators. Cornell University. New York. No date.
Environment Canada. “Fresh Water: The Hydrologic Cycle,” The Nature of Water. www.ec.gc.ca/water/en/nature/prop/watercycle.htm. January, 1999.
Farthing, Patty, et. al. The Stream Scene: Watersheds, Wildlife and People. Oregon Department of Fish and Wildlife. Portland, OR. 1999.
Mitchell, Mark, and William Stapp. Field Manual for Water Quality Monitoring. Thompson- Shore Printers. Dexter, MI. 1994.
Project Learning Tree. Project Learning Tree Environmental Education Activity Guide. American Forest Foundation. Washington, DC. 1995.
Project WET. Project WET Curriculum and Activity Guide. The Watercourse and Council for Environmental Education. Bozeman, MT. 1995.
Spielmaker, Debra. Dirt: Secrets in the Soil! Utah Agriculture in the Classroom. Logan, UT. No date.
United States Geological Survey. “Earth’s Water: Rivers and Sediment.” Water Science for Schools. http://ga.water.usgs.gov/edu/earthriversed.html. No date.
194

Utah Stream Team Unit VI. Utah Water Information
divide
VI-2. Watersheds VI-2. Watersheds
Key Terms divide floodplain impoundment mainstream
outlet river system streamflow
stream ordersub-basin topography
tributaryturbidity watershed
What is a watershed? Have you ever looked at your local stream and wondered where it comes from, where it goes, and what influences its travels? The characteristics of your stream’s watershed determine these factors and more.
Figure VI-4. Example of a watershed and sub-basins within that watershed.
A watershed, also known as a “drainage” or “basin,” is a geographical area that collects water, stores it and releases it. The water, along with all the materials it carries – sediment, organic matter and dissolved materials – collects in a common water body, or outlet. If the outlet is a stream or river, we call it the mainstem of the watershed. The mainstem can be as small as a creek or as large as the Colorado River, depending on the size of the watershed. A divide is the boundary between two watersheds.
Watersheds are interconnected systems. Each watershed consists of smaller watersheds – sub- basins - and is also part of a larger watershed. Therefore, all watersheds – big and small –
195

Utah Stream Team Unit VI. Utah Water Information
throughout Utah, and even the world, form a single, connected system. You can see how smaller watersheds are nested inside larger ones in Figure VI-4.
Because all the water in a watershed collects in a single outlet, activities throughout the watershed can influence water downstream. Clear-cutting a mountainside (chopping down every tree) can increase erosion and increase stream temperatures, which damage fish populations downstream and diminish recreation opportunities. Cleaning up toxic chemicals from a mining site may improve macroinvertebrate populations in nearby streams, strengthening entire food chains. Since all watersheds are connected, these actions can have a ripple effect far beyond the local area.
The Great Salt Lake is an example of a watershed that does not connect through a flowing outlet. Water only leaves this watershed by draining underground and evaporating.
The Great Divide – The Rocky Mountains form the Continental Divide - the major watershed divide on the North American continent. Water that falls on the west heads toward the Pacific Ocean; water that falls on the east slope heads toward the Atlantic Ocean. Two rain drops that fall only inches apart may end up thousands of miles away from each other.
The River System Your stream probably has streams, or tributaries, that feed water into it. Your stream is also probably a tributary for a larger stream. We call this branching pattern a river system.
Smaller streams, often called headwater streams, usually start in the upper reaches of the watershed. These streams (denoted by a “1” or “2” in Figure VI-5 below): Are small, steeper and more erosive; do not grow much plant material in the stream, but rather receive this material from leaves
and sticks which fall into the channel; and are cooler because they are more shaded or closer to the water source (snow or recent rain).
Larger streams (denoted by a “3” or “4”): have more flow, are less steep and more
depositional (sediment drops out of the river); generate more of their plant material within the
channel through photosynthesis by algae or larger aquatic plants;
are warmer because they’ve had more time to absorb heat and often are less shaded;
are more turbid because they have more suspended silt, clay and algae; and
are wider relative to their depth.
Figure VI-5. River system showing how small streams combine to form larger ones.
196
A stream’s size affects the types of macroinvertebrates found in it. To see this relationship, refer to Figure IV-7, “Functional Feeding Groups,” in the Macroinvertebrates section (IV-4B).

Utah Stream Team Unit VI. Utah Water Information
What natural influences affect a watershed? Climate determines how much water (in the form of precipitation) enters the watershed. Soil, topography, and vegetation affect how water travels through the watershed. These watershed factors continually influence each other. Many of these interrelationships are discussed in this section. Look for others as you investigate natural influences in the watershed.
Climate The seasonal cycles of precipitation and temperature control water delivery and streamflows. In the Intermountain West we receive most of our precipitation in short bursts as snow and rainstorms. In the East precipitation is distributed more evenly throughout the year.
Often climate is affected by the watershed. The Great Salt Lake combines with the high, abrupt peaks of the Wasatch Range to alter climate. Cold air currents that move west to east pick up heat and moisture from the relatively warm lake. As the water-filled air runs into the Wasatch Range it is forced upward and becomes cooler. Since cool air cannot hold as much water as warm air, it releases it in the form of snow. The snow then melts in the spring and summer and returns to the lake to start the cycle again. We call this weather phenomenon the lake-effect.
Soil Soil is a mixture of minerals (rock, clay, sand, silt) organic matter (living and decomposing organisms); moisture; and air pockets.
Soil interrelates with other parts of the watershed: Climatic processes, such as freezing and thawing
and wind and water erosion, break down rocks to form the fine mineral ingredients of soil.
Plants and animals, when they die, decay and produce organic matter that forms mainly in the upper layer of soil – the topsoil. Plants thrive in nutrient-rich organic soils. Soil bacteria, worms, insects and burrowing animals also help break down and mix soil components.
Topography greatly affects the types and locations of soils present in the watershed. Steep slopes generate high-energy streams capable of eroding soil.
Topography
It’s all in the mix On average, half of a soil’s volume is solid material (minerals and organic matter). The other half is water and air. The exact mixture of these ingredients helps determine how well the soil can support plant life and withstand erosion. For example, loose soil - soil with a lot of pore spaces – erodes easily. Hard packed soil doesn’t contain much air or water, which is essential to plants.
Topography, the shape of the surface of the land, greatly affects how watersheds function.
Contour and Slope The contour and slope of a watershed affects the amount of precipitation that runs off the surface verses how much infiltrates into the soil. Steep, confined slopes are more likely to produce rapid runoff, little infiltration and heavy erosion. Plants have a hard time surviving in such areas. Streams below may experience higher flows and turbidity levels.
197
Utah Stream Team Unit VI. Utah Water Information
Orientation A watershed’s orientation to the sun alters how much water it will retain. Steep slopes that face the sun lose water more rapidly (they have higher rates of evaporation and transpiration). Both plants and streamflow levels are changed. Wind removes moisture as well. Slopes that face prevailing winds tend to be drier.
All controlling factors – climate, soils, topography, vegetation - in a watershed are interrelated. Look out at the slopes of a nearby hill or mountain. Do you notice
different types of vegetation on the south side verses the north side? Because north slopes receive less sun, they hold water longer (it takes longer to evaporate). Vegetation types that need more water will be found in greater abundance on those slopes verses the south-facing slopes. The vegetation, then, in turn, affects the soil. Plant roots hold the soil together, reducing erosion rates.
What differences do you notice in vegetation on steep verses shallow slopes?
Vegetation The types, number and locations of plants and trees in a watershed depends upon climate, soil and topography. Much of Utah, especially desert areas, has a dry climate and nutrient-poor soil. In these areas, we find sparse vegetation that consists of few trees and mostly grasses and shrubs. By comparison, western Oregon, with a very wet climate and nutrient-rich soils, has lush vegetation and dense stands of large trees.
Vegetation affects the watershed by: preventing erosion and helping water to
infiltrate into the soil providing nutrients and cooler temperatures
for the soil creating soil by chemically breaking down
rock and by physically breaking it down with root systems.
The deserts of Utah don’t have an abundance of vegetation to
stabilize the soil. They depend on cryptobiotic soil crust to perform many of these functions. Cryptobiotic soil crust consists of a mixture of mosses, algae, and lichen that weave a thin “mat” through the surface of the soil. The crust keeps wind and water from eroding the soil. It also provides a home for seeds to establish, traps water for plants to use and places nitrogen into the soil to help plants grow.
What combination of natural influences on a watershed would you expect to
? produce a very wet environment?
[a wet climate; organic-rich soils; shallow slopes; dense vegetation]
198

Utah Stream Team Unit VI. Utah Water Information
What human influences affect a watershed? Humans can influence how the watershed functions through different land uses. Land use can affect the soils, topography and vegetation which, in turn, affects the quantity, quality and timing of water moving through the watershed.
Development If you compare urban areas – places where humans live closely together and have developed, or changed the environment considerably – with natural areas you will see many differences. When we develop urban areas, especially near water, we not only change how the area looks but also the way watersheds function.
Covering vegetation and soils with impermeable surfaces such as roads, houses and parking lots prevents groundwater from being re-supplied, which reduces water storage. Erosion rates and flood severity also rise. Pollutants, such as motor oil, that collect on these surfaces may wash into nearby streams and move through the watershed.
Encasing stream channels in concrete such as pipes, diversion ditches, or storm drains increases water temperatures and the severity of floods.
Loss of riparian vegetation increases stream water temperatures and turbidity levels. Riparian vegetation also serves as an important pollution filter and helps to reduce the severity of floods.
Clearing land for residential, commercial and industrial purposes can increase erosion and increase the delivery of pollutants (fertilizers, pesticides, septic tank sewage) to streams.
Agricultural and grazing practices Farming and livestock grazing are common activities in watersheds throughout Utah. With proper management, these uses can benefit humans and the ecological health of the land as well. However, improper management can negatively influence the watershed.
Overgrazing and leaving cropland bare can increase erosion rates and turbidity levels in nearby streams.
Overgrazing riparian zones can increase water temperature, reduce wildlife habitat and increase stream bank erosion. A healthy riparian area is especially important in agricultural areas because the plants trap and filter pesticides and fertilizers before they reach the stream.
If a lot of manure and fertilizer reach the stream, eutrophication may result. Eutrophication – over fertilization – results when too many nutrients in the water cause excessive plant growth. When the plants
A remarkable comeback DDT was a commonly-used pesticide in the 50’s and 60’s. DDT took a long time to break down; it hung around long enough to be picked up by runoff and moved around the watershed. In the process, DDT was consumed by fish. The DDT passed on to fish-eating raptors, such as the bald eagle and osprey, and prevented them from reproducing. Today, DDT is outlawed, and these birds are making a remarkable comeback.
die, organisms decompose them and use up large amounts of oxygen in the process. This can lead to fish kills and other negative impacts.
Runoff that may carry pesticides to the stream can also reach streams via surface runoff and kill aquatic organisms as well as the nonaquatic organisms that feed on them.
199
Utah Stream Team Unit VI. Utah Water Information
Many farmers and ranchers use methods which help protect our streams, including biological methods for pest control, wind breaks and healthy riparian areas to help stem the flow of harmful material to streams.
Forestry Forestry management methods impact the watershed and the water quality of streams. Constructing roads near streams and clear
cutting on steep slopes can increase erosion and turbidity levels.
Removal of trees, and the shade they provide, can increase water temperature.
Fire suppression can create forests of mostly conifer trees, such as Douglas-fir, and few deciduous trees, such as aspen. Conifers use more water, leaving the forest and streams drier.
A valued resource Municipalities and government agencies place a very high value on their water supply. Little Cottonwood, Big Cottonwood and Parley Canyons (in the Wasatch Mountain Range east of Salt Lake City) provide water for more than 400,000 people. To protect this precious resource, the US Forest Service, which manages most of the land in the canyons, restricts the kinds of activities that can occur there. Grazing, logging and mining, which can degrade water resources, are not allowed. Even dogs and horses are prohibited since they can introduce diseases dangerous to humans.
Fortunately, forestry practices are becoming more conscious of environmental effects. Many logging operations now avoid riparian areas when they build their roads and log. To reduce erosion, they can remove trees without skidding across the ground or through streams and may also log in winter when the soil is frozen.
Mining Mining, extracting mineral resources from the earth, involves either stripping away soil or rock layers or tunneling into the ground. This can pose serious threats to water quality. Runoff may leach, or wash, acidic water
and heavy metals into streams. These chemicals and metals may occur naturally, but, when they are unearthed and exposed to air or water, they can become toxic. Many types of mining also introduce chemicals (such as cyanide for gold mining) that may escape into the environment.
Mining operations often leave behind large quantities of waste rock; extracted metals may constitute as little as 1% of the material that is excavated. Exposed waste rock may continue leaching for decades.
The Monitoring Acid Rain Youth Program (MARYP) is an
education program which monitors forest stations across North America to determine levels of rainfall acidity and potential impacts on forest ecosystems. Students collect rainwater at a study site twice a week for eight weeks and do simple pH testing in the classroom. Results are sent to a lab for complete analysis. Soil samples can also be collected and tested. It’s a valuable addition to any monitoring program. Contact MARYP at (705) 748 1647.
The mining industry is increasing its efforts to control waste materials and toxic chemicals to protect surrounding watersheds.
200
Utah Stream Team Unit VI. Utah Water Information
Industry Industrial emissions can alter watersheds and streams both near and far. Polluted precipitation, also known as “acid rain,” increases the acidity of water in many
industrial areas. The main contributors to acid rain are sulfuric acid (produced by coal burning industries) and nitric acid (produced by automobile engines). Luckily, here in Utah our buffering soils help to decrease the effects of acid rain.
Dumping of industrial pollutants directly in to bodies of water – also known as point-source pollution – can have intense and immediate effects. Refer to the “Water Pollution” section VI-3, for more information on point-source and nonpoint-source pollution.
Dams and reservoirs Here in Utah, the second driest state in the nation, dams and reservoirs provide important services. They help us to: store water for agriculture, industry and drinking control floods generate power provide recreational opportunities
However, dams and reservoirs dramatically alter the stream or river and its surrounding watershed. Dams turn free-flowing streams and rivers into lake-like
environments. Surface temperatures increase, bottom temperatures decrease and dissolved oxygen levels drop.
Sediment and organic matter is trapped upstream of the dam, producing clear water downstream. For naturally turbid rivers, such as the Colorado and San Juan Rivers, this clear water changes the physical structure of the channel. Instead of supplying sediment to the floodplains and channels, the stream scours it away. This results in a narrower, faster channel.
Dams block the travel of migrating
fish, such as the Colorado Pike Minnow, a Utah native. For this reason, the Minnow, which can grow to be 4 ft long, has trouble breeding successfully. It is now one of four endangered fish in Utah. Many dams are now installing fish ladders, devices that let fish swim around the dam, to help them out.
Dams, by design, reduce downstream flooding. Without flooding, backwaters and side channels, which are important fish nurseries, can’t form. Also, beaches and riparian zones fail to receive essential supplies of sediment.
Utah Watersheds Refer to Figure VI-6. You will see how Utah’s watersheds compare to other western watersheds. Figure VI-7 illustrates the major watersheds and mainstream rivers within Utah.
Where does our water come from? Utah depends primarily on precipitation for its water supply. Heavy snowfall in the mountains melts in late spring, filling streams and rivers which, in turn, fill reservoirs and aquifers.
Utah’s water supply also varies considerably from place to place. Some mountain areas may receive as much as 50 inches of precipitation in a year while the desert areas receive less than 10 inches. Desert soils, which lack organic matter and vegetative cover, have a difficult time trapping runoff. Much of the precipitation runs directly into an outlet without first infiltrating the soil for use by vegetation.
201

Utah Stream Team Unit VI. Utah Water Information
How do we use our water? In Utah, most of the water that we use is for agriculture (87%). Cities and towns use 9%. Industries use the rest (4%). Water held in reservoirs helps supply all of these uses. If we don’t receive enough precipitation to fill the reservoirs then crop production falls, aquifers shrink and some communities are forced to restrict their water use. To meet the demands of a growing population, Utah is turning to another form of stored water in the watershed – ground water.
What are Utah’s major watersheds? Two principal watersheds divide Utah: the Great Basin and the Colorado River Watersheds. The Colorado River watershed flows into the Sea of Cortez in Mexico. The Great Basin watershed has no
The divide between Utah’s two major watersheds generally
outlet – it terminates in inland bodies of water, such as the Great Salt Lake and Sevier Lake. The Great Basin is the only major watershed in the United States that does not empty into an ocean. A third major watershed, the Columbia River Basin, occupies a small portion of northwest Utah.
The Great Basin System
runs north-and-south. It cuts across the western end of the Uinta Mountains and through the High Plateaus. Once in the southwestern corner of the state, it heads westward towards Nevada. See Figure VI-6.
The Great Basin System collects water from a vast area of the West, including five Utah watersheds (three of which – the Bear, Jordan and Weber – flow into the Great Salt Lake).
Bear River Watershed – The Bear River Watershed is the largest of the watersheds that feed in to the Great Salt Lake. The Bear River begins in the northwest region of the Uinta Mountains in Utah. On its 500+ mile journey the river heads north into Wyoming and Idaho before turning south and reentering Utah. It enters the northeast portion of the Great Salt Lake about 90 miles from its point of origin!
Cedar/Beaver Watershed – The Cedar/Beaver Watershed drains the Beaver River and several other small streams. Although it encompasses a fairly large portion of southwest Utah, the watershed collects little water. Of its 2,000+ river miles, only 332 flow year round.
Jordan River Watershed – The Jordan River is only 40 miles long and also ends in the Great Salt Lake. It receives water from the Provo River, which drains part of the Uinta and Wasatch Mountains, and the Spanish Fork River, which drains portions of the southern Wasatch Mountains.
Water quality issues in Utah’s watersheds.
Bear River Watershed – nutrients, dissolved oxygen,
Cedar/Beaver – riparian habitat loss, temperature, phosphorus Jordan River Watershed – metals, riparian habitat loss, turbidity Sevier River Watershed – salinity, phosphorus, riparian habitat loss, salinity Weber River Watershed – turbidity, nutrients, and habitat loss Colorado River Watershed – salinity, metals, pH, temperature Source: Utah Division of Water Quality. “Utah’s 2000 303(d) List of Stream and Waterbodies Needing Total Maximum Daily Load Analyses”
Sevier River Watershed – The Sevier River is the only major river that feeds into Sevier
202

Utah Stream Team Unit VI. Utah Water Information
Lake, a large playa in west-central Utah. However, due to agricultural demand, water from the Sevier River rarely reaches Sevier Lake; this leaves Sevier Lake dry at times. The Sevier River Watershed drains the high plateaus of central and western Utah – the Paunsaugunt, Fish Lake and Wasatch Plateaus – as well as Sanpete Valley.
Weber River Watershed – The Weber River begins in the northwest corner of the Uinta Mountains and also ends in the Great Salt Lake. Its major tributary is the Ogden River. The watershed drains Ogden and eastern Weber County.
The Colorado River System The main stem of the Colorado River System is the Colorado River itself. The Colorado originates on the western slope of the Continental Divide in Rocky Mountain National Park and empties into the Sea of Cortez in Mexico. The major tributary of the Colorado, the Green River, originates in the Wind River Range in Wyoming. The Green has many large tributaries of its own – the Yampa, Duchesne, Uinta, White, San Rafael and Price Rivers.
The Colorado and Green Rivers meet in Canyonlands National Park, where they have carved deep canyons out of the soft sedimentary rock. Below the confluence with the Green, the Colorado is fed by the Dolores, Dirty Devil, Escalante and San Juan Rivers. Lake Powell, the reservoir created by Glen Canyon Dam, backs-up the last 150 miles of the Utah portion of the Colorado River.
The Most Regulated River in the World - The Colorado River is the largest water body in the Southwest - the driest region of the nation. Industry, agriculture and major cities (Los Angeles, Phoenix, Las Vegas) depend heavily on it. To supply water for all these different demands we have developed an extensive system of dams, aqueducts, pipes and reservoirs. In fact, this system of impoundments is so extensive that the Colorado is considered the most regulated river in the world. It is truly the life blood of the Southwest. Figure VI-8 illustrates the regulation of the Colorado River Watershed.
Figure VI-8 The Colorado River Watershed… and it’s Plumbing
203

Utah Stream Team Unit VI. Utah Water Information
Figure VI-6 Major Western Watersheds
Columbia River WS
Mississippi River WS
Basin and Range WS
Colorado River WS
Rio Grande WS
Watershed Boundary
Source: Walhquist, Wayne (ed.). Atlas of Utah. 1981
204

Utah Stream Team Unit VI. Utah Water Information
Figure Vl-7 Utah Watersheds
Great Salt Lake
Dirty Devil . River
Virgin River
205

Utah Stream Team Unit VI. Utah Water Information
Resources for further investigation “C.U.P. Water Facts.” – This Utah water information pamphlet lists: how much water it takes to produce various food items; how much water is used by different industries and people in Utah; how much water is used for various household activities and the capacity of Utah reservoirs. Contact: Central Utah Water Conservancy District, 355 W 1300 S, Orem, UT 84057
Science in Your Watershed – This site will help you find scientific information organized on a watershed basis. Real-time water flow data is provided for most river sections in UT. Watershed groups are provided access to experts to answer questions. Although this site contains extensive scientific data it is easy to navigate and presents useful information in an understandable style. Contact: www.water.usgs.gov
Surf Your Watershed – Point and click on the interactive mapping tool to find an environmental profile for every major watershed and river in Utah and the nation. You’ll get information on your watershed’s health, river corridor restoration efforts, water flow, pollutants, land use, groundwater profiles, monitoring groups and much more. Links to other watershed education sites. Contact: www.epa.gov/surf2/locate
Water Science for Schools – This is an exhaustive, but easy-to-use web site on water and water education. Find information on most watershed-related concepts. Contact: www.ga.water.usgs.gov/edu/
Bibliography Central Utah Water Conservancy District. “C.U.P. Water Facts.” Pamphlet. No date.
Edelstein, Karen, Nancy Trautman, and Marianne Krasny. Watershed Science for Educators. Cornell University. New York. No date.
Environment Canada. The Nature of Water. www.ec.gc.ca/waer/en/nature/prop/e_cycle.htm. January, 1999.
Environmental Protection Agency. Volunteer Stream Monitoring: A Methods Manual (EPA 841- B-97-003). Office of Water. Washington, DC. 1997.
Farthing, Patty, et al. The Stream Scene: Watersheds, Wildlife and People. Oregon Department of Fish and Wildlife. Portland, OR. 1999.
Mitchell, Mark, and William Stapp. Field Manual for Water Quality Monitoring. Thompson- Shore Printers. Dexter, MI. 1994.
Oregon Watershed Improvement Coalition. “Watersheds: Their Importance and Functions.” Pamphlet. No location. No date.
Project WET. Project WET Curriculum and Activity Guide. The Watercourse and Council for Environmental Education. Bozeman, MT. 1995.
US Geological Survey. Water Science for Schools. www.ga.water.usgs.gov/edu/. No date.
206

Utah Stream Team Unit VI. Utah Water Information
Utah Division of Water Quality. “Utah’s 2000 303(d) List of Stream and Waterbodies Needing Total Maximum Daily Load Analyses.” Utah Department of Environmental Quality. 2000
Walhquist, Wayne (ed.). Atlas of Utah. Brigham Young University Press. Provo, UT. 1981
207

Utah Stream Team Unit VI. Utah Water Information
208

Utah Stream Team Unit VI. Utah Water Information
in the
VI-3. Water Pollution
Key Terms
beneficial use nonpoint source pollution sediments distillation nutrients suspended solids metals point source pollution total dissolved solids
What is “polluted” water? There is no single definition of polluted water or clean water. Ask a roomful of people what polluted water is and you will get a roomful of answers. Clean water to a chemist might be distilled water (water with all the salts and minerals removed). But, humans get sick if they drink only distilled water. Clean water to you might be the water coming out of your kitchen faucet. But, for fish this water is highly polluted (too much chlorine and not enough oxygen). Whether we define water as polluted or clean depends upon how the water is being used, often call the water’s beneficial use.
What’s the big deal?
What use is it? The uses of a stream or water body are called its beneficial uses. Beneficial uses of water bodies include drinking water, agriculture, recreation, fish and wildlife, aesthetics, and mineral extraction. Within each state, all stream segments, lakes and reservoirs are assigned one or usually more beneficial use designations. The goal of water quality regulations is to protect the waters of the state so they can support these beneficial uses. To find out more about designated beneficial uses, refer to “Water Laws,” section VI-4.
Pollutants can prevent us from supporting the beneficial uses of a stream. Sometimes this occurs dramatically, through a single event (e.g., a large discharge of chemicals ruins a town’s water supply). Sometimes it is less noticeable and occurs over a longer period of time (e.g., a steady stream of lawn chemicals runs into a neighborhood stream and harms aquatic organisms). When we degrade a stream’s water quality the natural communities that are harmed may take many years to recover.
What types of pollutants are there? Water pollution can come from many different human (and natural) sources. We divide these sources into two main groups – point source pollution and nonpoint source pollution.
Point source pollution As the name suggests, the source for this type of pollution can be easily identified, or “pointed at.” A point source usually enters the stream
Point vs. Nonpoint Much progress has been made
US to prevent pollution from "point sources.” However, approximately 40 percent of our surveyed rivers, lakes, and estuaries still are not clean enough to meet basic uses such as fishing or swimming, according to the U.S. Environmental Protection Agency (USEPA). Nonpoint sources are contributing to much of this problem.
209

Utah Stream Team Unit VI. Utah Water Information
through a pipe from industrial facilities such as municipal wastewater treatment plants. Very large agricultural operations may also contribute point source pollution. Point source pollution can include sewage, chemicals, nutrients and heated water.
Nonpoint source pollution Nonpoint source pollution, unlike pollution from industrial and sewage treatment plants, comes from a wide area or multiple sources; you must “wave” at it instead of being able to “point” at it. It is, therefore, harder to identify and locate than point source pollution. Nonpoint source pollution results when surface runoff picks up pollutants and carries them into a water body or underground. It can also result from airborne pollution that deposits in water bodies.
Nonpoint source pollution includes: excess fertilizers, herbicides, and insecticides from
agricultural lands and housing areas oil, fuel, and toxic chemicals from households, urban
runoff and industry sediment from poorly-managed construction sites,
agriculture and timber operations, and from degraded streambanks
salt from irrigated farmland and acid drainage from abandoned mines
bacteria and nutrients from animal feeding operations, and faulty septic systems
atmospheric deposition from automobile and industrial output.
How do we sort out all the sources of pollutants in a watershed? Often, a specific pollutant, for example phosphorus, comes from many sources. Phosphorus enters water from point sources, such as municipal wastewater treatment plants. It also may enter water attached to soil particles when erosion occurs, from malfunctioning septic tanks, from animal feeding operations, or from runoff from over-fertilized yards or golf courses. Scientists try to determine the total amounts (called loads) that enter a stream from each of these sources. This helps them identify the largest sources and helps them prioritize clean up efforts.
What kinds of pollutants affect Utah’s streams? The five leading causes of impairments to Utah’s streams and rivers are nutrients, total dissolved solids (salts), sediments, habitat alterations and metals. Excessive nutrients, like nitrate and phosphorus, can remove oxygen from water by causing algal blooms. Salts can make water unsuitable for drinking water or irrigation. Sediment covers fish spawning areas and macroinvertebrate habitat. Metals can be toxic to aquatic life. Habitat alterations can harm aquatic wildlife populations and increase runoff into streams.
Here are pollutants of concern for some Utah watersheds. Bear River Watershed: Bear River and some tributaries in Cache and Box Elder Counties –
nutrients, sediments. Weber River Watershed: Chalk Creek – sediments, nutrients and habitat loss. East Canyon
Creek – nutrients, habitat loss. Upper Colorado River Watershed: Montezuma Creek and Fremont River – total dissolved
solids. Portions of San Juan River – metals. Lower Colorado River Watershed: Santa Clara River and portions of the Virgin River –
total dissolved solids. Utah Lake-Jordan River Basin: Little Cottonwood Creek – metals. Jordan River – total
dissolved solids. Diamond Fork and Sixth Water Creeks – nutrients and habitat loss.
210

Utah Stream Team Unit VI. Utah Water Information
How much pollution does it take to affect the water quality of a stream? Many factors determine the influence of a pollutant on a stream. Greater water volume may dilute pollutants (e.g., dissolved nutrients or solids). Dense riparian vegetation and healthy soil will filter pollutants before they reach the stream.
The nature of the pollutant also plays a major role in how it affects the stream. Some pollutants, like suspended solids – undissolved minerals – must reach relatively high concentrations (50 parts per million) before they are harmful. Other pollutants pose a significant threat at very small concentrations. Chemical fertilizers containing nitrate can be dangerous to infants in quantities as small as 10 parts per million. Trichloroethylene (TCE), a common industrial solvent, is more dangerous than nitrate at even smaller concentrations! TCE, is considered a pollutant in drinking water at 2.7 parts per billion and is harmful to fish at .81 parts per billion!
What do we mean when we describe pollution concentrations in “parts per million?” The box below will help you to understand these incredibly small concentrations.
Table VI-2. “A Drop in the Bucket” - Trace Concentrations It may take only a very small quantity of a pollutant to create a dangerous or life threatening situation. Such small relative amounts are known as “trace concentrations.” Environmental scientists express these trace concentrations as “parts per,…” indicating the amount of pollution relative to the total amount of the material in which the pollution is contained. The following table compares trace concentration levels to other common measurements.
a trace concentration of 1 part per million equals
a trace concentration of 1 part per billion equals
a trace concentration of1 part per trillion equals
length
1 inch in 16 miles 1 inch in 16,000 miles 1 inch in 16 million miles area 1 sq. ft. in 23 acres 1 sq. ft. in 36 sq. miles 1 sq. ft. in 250 sq. milesvolume 1 drop of lemon in 252
cups of tea 1 drop of lemon in 15,750
cups of tea 1 drop of lemon in
500,000 barrels of tea time 1 minute in 2 years 1 second in 32 years 1 second in 320 centuriesmoney 1 cent in $10,000,000 1 cent in $10 billion 1 cent in $10 trillion
adapted from: Lori LarMarche, Stayton High School in Streamkeepers
How does nature keep water clean? Processes such as erosion, algal blooms and mineral leaching can affect the water quality of a stream, often dramatically. A well-functioning natural system will usually adjust to these processes. Nature even cleans up some human messes. A well-functioning stream or lake cleans up pollutants by filtering, trapping sediment and other means. How much pollution it can handle is called its assimilation capacity, and this changes with the size of the waterbody, the surrounding geology and vegetation and the climate. The following components of the system help to clean up water pollution.
211

Utah Stream Team Unit VI. Utah Water Information
Riparian Vegetation As water flows through the riparian zone, vegetation traps sediment and pollutants before they can reach the stream. The plants in these areas also take up nutrients from runoff and shallow groundwater. Finally, riparian vegetation shades a stream, which keeps temperatures low. These are especially important functions for streams that run through areas of intense agriculture or development.
Soil Many dissolved pollutants attach to tiny soil particles or other dissolved minerals. When these particles sink to the bottom, the pollutants are removed from the water. However, these pollutants still represent a problem to organisms living in the stream bottoms. Also, if the water chemistry changes or streamflow increases, these particles may be suspended back into the water column. For example, phosphorus attaches to aluminum and calcium in soils and sinks to the bottom as a solid. But, if oxygen concentrations or pH get too low, the phosphorus re-dissolves into the water.
Biological Uptake The living organisms in a waterbody (fish, macroinvertebrates, plants, bacteria, etc.) remove materials from the water and excrete other materials back into the water. This changes the water’s composition. For example, plants remove nitrate and dissolved phosphorus as well as other nutrients and minerals. When the plant dies, these nutrients may be released back into the water, but often not in a dissolved form that would be considered a pollutant.
What can we do to keep our streams clean? We know humans impact water quality by introducing pollutants into the environment. We also have the power to clean up those pollutants. Even better, we can prevent them from entering our streams and lakes in the first place. Read below to find out how people can help stop water pollution.
Controlling point source pollution Pollution from point sources is often highly concentrated and quite harmful. Fortunately, these sources can be identified and controlled. If the pollution exceeds acceptable limits, then the responsible party can be made to reduce or eliminate it. Oftentimes fines will be levied until the responsible party complies.
Strict Federal and State regulations help to stop water pollution before it happens. Point sources are required to get a permit from the Environmental Protection Agency (EPA) or State water quality agency. This “permit to pollute” tells them how much and which types of pollutants they can be discharged.
Controlling nonpoint source pollution Nonpoint sources are more difficult to identify and control due to their widespread nature. For example, a stream may run through municipal areas, industry and agriculture, all within a relatively small area. Contamination of that stream must first be traced to one of these sources. Then, it must be determined where within that source the pollution is coming from. If the source is lawn fertilizer from a suburb, the challenge then is to educate each homeowner about the dangers of over-fertilizing.
212

Utah Stream Team Unit VI. Utah Water Information
The complex nature of nonpoint source pollution cleanup requires individuals, households and communities to take responsibility for their own actions. The difficulty of enforcing nonpoint source regulations increases the importance of individual and community responsibility.
Here are a few things we can do:
Use less harmful alternatives instead of hazardous materials at home. For example, a weak vinegar solution, or even water, makes a good substitute for glass cleaner. Baking soda and vinegar can help to unclog drains instead of toxic drain cleaners. Reduce your use of hazardous materials. Use only the amount needed and share leftovers with others. Recycle! Recycling is a good way to handle some types of hazardous wastes. Contact your local recycler to find out what materials they will accept.
Recycling and water quality Did you know it takes
the energy from 12 oz of gasoline to produce an aluminum can?! But, it only takes 2 oz to recycle a can into a new one! By recycling just one can, you prevent the pollution generated by burning 10 oz of fuel.
Follow directions to ensure that you handle, store, and dispose of hazardous chemicals properly. Take hazardous waste to a handling center – don’t dump them down the storm drain or throw them away with your regular garbage. Take special care when handling and discarding the following household items:
- paint removers - pesticide and insecticide cans - paint thinners - herbicide containers
Keep an eye out for local toxic roundups. Most communities collect unwanted, hazardous household waste once or twice a year. They dispose of the material properly instead of sending it to the landfill where it may leak into surface and groundwater supplies. Educate others about pollution. Share what you have learned about pollution prevention with you friends, family, school and community. Posters, collages, and poems are just a few ways to teach others. Refer to “Stewardship,” section V-3, for more ideas.
- fingernail polish removers - auto fluids (antifreeze, batteries) - used oil and oil filters
Composting lawn clippings and table scraps is a great way to convert these materials back to a useful form. When these materials are reused in gardens, it improves your soil. It also keeps the nutrients and organic materials contained in this waste from finding their way into our streams.
Sometimes we feel as if we can’t make a difference in our world. Using these tips and others we can make a difference. Revisit “Drop in a Bucket” from above to remind yourself of just how little pollution it takes to degrade water quality. Now, think about how much water you’ve helped just by properly disposing of a cup of chemicals or by recycling just one drink container. When you teach others about water pollution you multiply that effect. You can make a difference.
213

Utah Stream Team Unit VI. Utah Water Information
Resources for Further Investigation Environmental Defense Fund (EDF) – Enter your zip code on the home page to find the types, sources and amounts of pollutants being released into your community. The site will also rank your county against other counties in the State and across the nation in these categories. Find in- depth information on air and water pollution, industrial pollutants, animal waste, pollution standards and criteria, and more. There is also a section on how to take action against pollution in your particular community. www.scorecard.org
This EDF site has information on water pollution and personal actions to prevent water pollution. There’s a separate section for kids and teachers. www.edf.org/programs/PPA/TakeAction/pollprev.html
Home Environmental First Aid Kit – This 22 page guide contains a number of suggestions that every person can use to make a difference in handling household pollutants. The publication also provides colorful illustrations and facts about keeping groundwater healthy and the benefits of energy and water conservation. City of Anaheim, Public Utilities Department, Environment and Safety Division, (714) 254-4279.
Water Conservation and Nonpoint Source Pollution – A compilation of background material, lesson plans and activities for studying water pollution and conservation. International Office for Water Education, Utah Water Research Laboratory, Utah State University, Logan, UT 84322- 8200. (800) 922-4693.
Bibliography Agricultural Research Service, U.S. Department of Agriculture. “Agricultural Phosphorus and Eutrophication.” ARS-149, July, 1999.
California State Water Quality Control Board. Water Quality Criteria. State Water Quality Control Board, Sacramento, CA. 1963.
Environmental Protection Agency. “Polluted.” Office of Wetlands, Oceans and Watersheds. EPA-841-F-94-005, 1994
Mitchell, Mark and William Stapp. Field Manual for Water Quality Monitoring. Thompson- Shore Printers. Dexter, MI. 1994.
Moore, J.A., and J.R. Miner. “Stream Temperatures: Some Basic Considerations.” Oregon State University Extension Service. May, 1997.
Murdoch, Tom, et al. Streamkeeper’s Field Guide. Everett, WA. Adopt-A-Stream Foundation. 1996.
University of Wisconsin – Environmental Resources Center. Give Water a Hand. College of Agriculture and Life Science, Madison, WI. 1997.
Utah Division of Water Quality. 1996 Water Quality Assessment Report to Congress (538- 6146). Salt Lake City, UT. 1996.
214

Utah Stream Team Unit VI. Utah Water Information
IV-4. Water Regulations
Key Terms prior appropriation doctrine riparian doctrine water quality criteria water quality standards
(numeric and narrative) total maximum daily load (TMDL)
How do we define water quality? Every state, has regulations to protect water quality. But, how do we define water quality? In “Water Pollution,” section VI-3, we learned that there is no single definition for “good” or “poor” water quality. A fish would find water from your faucet to be highly polluted (too much chlorine and not enough dissolved oxygen). Conversely, you would get quite sick drinking water in which some critters thrive. In order to define the water quality of a stream, lake or reservoir we must first determine how the water body is to be used - its beneficial uses.
What are beneficial uses?
Clean Water Act In response to public concern about water quality in our Nation’s waters, Congress enacted landmark legislation in 1972. This statute, the Clean Water Act, greatly expanded and built upon existing laws to control and prevent water pollution. The Environmental Protection Agency (EPA), enforces the act by requiring individual states to meet water quality standards. States must report their water quality conditions to the EPA every 2 years.
Within Utah, each waterbody is assigned a beneficial use(s) designation that defines how that waterbody is to be used. These uses may include: drinking, agriculture (e.g., irrigation, animal watering), recreation (e.g. swimming), fish and wildlife habitat, aesthetics, and mineral extraction. Refer to Tables 3 and 4 for beneficial use designations in Utah.
Table VI-3. Beneficial Use Designations in Utah (Partial List)
Class 1 - Drinking water designations 1C – Domestic purposes with prior treatment (drinking water)
Class 2 – Protected for recreation and aesthetics
2A – Primary contact recreation (swimming) 2B – Secondary contact recreation (boating, wading)
Class 3 – Protected for aquatic wildlife
3A – Coldwater species of game fish and other aquatic life 3B – Warmwater species of game fish and other aquatic life 3C – Nongame fish and other aquatic life 3D – Waterfowl, shore birds and other water oriented wildlife
Class 4 – Protected for agricultural uses (irrigation and stock watering)
Class 5 – Protected for the Great Salt Lake only (primary and secondary contact
recreation, aquatic wildlife and mineral extraction)
215

Utah Stream Team Unit VI. Utah Water Information
Table VI-4. Examples of Stream and Lake Designations in Utah
Bear River from GSL to Utah - Idaho border – 2B, 3B, 3D, 4
Deer Creek Reservoir - 1C, 2A, 2B, 3A, 4
Fish Lake - 2B, 3A, 4
Flaming Gorge Reservoir (Utah portion) - 1C, 2A, 2B, 3A, 4
Great Salt Lake - 5
Hyrum Reservoir - 2A, 2B, 3A, 4
Jordanelle Reservoir - 1C, 2A, 3A, 4
Lake Powell - 1C, 2A, 2B, 3B, 4
Logan River and tributaries from Cutler Reservoir to headwaters - 2B, 3A, 3D, 4
Pineview Reservoir - 1C, 2A, 2B, 3A, 4
Porcupine Reservoir - 2B, 3A, 4
Utah Lake - 2B, 3B, 3D, 4
Weber River and tributaries from GSL to Slaterville Diversion – 2B, 3C, 3D, 4
Willard Bay Reservoir - 1C, 2A, 2B, 3B, 3D, 4
[Visit the Utah Division of Water Quality web site for a complete listing]
http://www.eq.state.ut.us/eqwq/dwq_home.ssi]
What are water quality standards? Once we have designated the beneficial uses for a waterbody, we must then determine the maximum or minimum concentration of chemicals (e.g., nitrate) or other properties (e.g., turbidity) that can exist in the waterbody while still supporting the beneficial use. The specific criteria that are set for each beneficial use are called water quality standards. When a State water quality management agency (e.g. Utah Division of Water Quality, Utah Division of Drinking Water) collects water samples, they compare the values they measure with the standard. Water quality standards come in two forms – numeric criteria and narrative criteria.
Numeric criteria Numeric criteria are chemical, physical or biological properties of water typically expressed in concentrations (e.g. mg/L). Refer to Table VI-5 for numeric criteria for Utah Stream Team water quality parameters.
Narrative criteria Narrative criteria state that no material may be put in State waters that will degrade the water quality. For example, “all waters should be free from substances… that: 1) settle to form objectionable deposits; 2) float as debris, scum, oil, or other matter to form nuisances; …” While not as specific as numeric criteria, narratives can provide powerful blanket protection for water bodies. They can also be loosely interpreted, which can cause debate over their use.
An indicator is another way to gauge water pollution. Indicators are not legal criteria, but rather a sign that there may be a problem. For example, a nitrate concentration of 4 mg/L indicates a potential pollution problem. When these levels are exceeded, further studies are required.
216
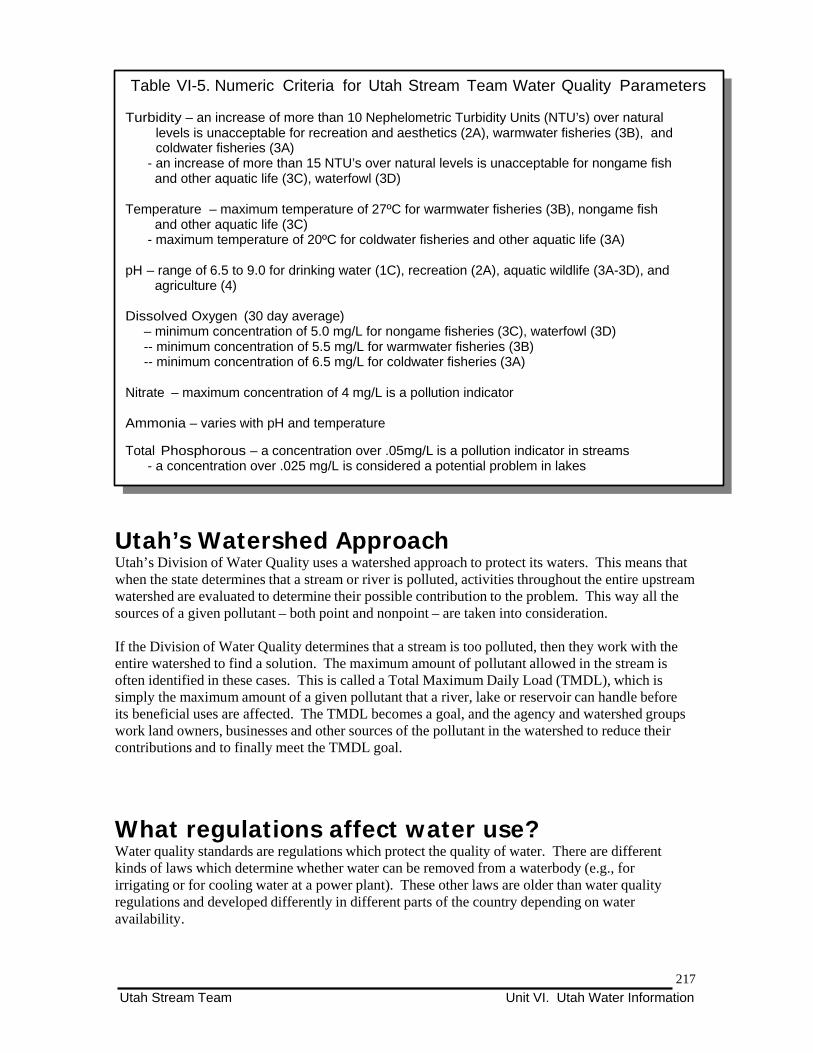
Utah Stream Team Unit VI. Utah Water Information
Table VI-5. Numeric Criteria for Utah Stream Team Water Quality Parameters
Turbidity – an increase of more than 10 Nephelometric Turbidity Units (NTU’s) over natural levels is unacceptable for recreation and aesthetics (2A), warmwater fisheries (3B), and coldwater fisheries (3A)
- an increase of more than 15 NTU’s over natural levels is unacceptable for nongame fish and other aquatic life (3C), waterfowl (3D)
Temperature – maximum temperature of 27ºC for warmwater fisheries (3B), nongame fish
and other aquatic life (3C) - maximum temperature of 20ºC for coldwater fisheries and other aquatic life (3A)
pH – range of 6.5 to 9.0 for drinking water (1C), recreation (2A), aquatic wildlife (3A-3D), and
agriculture (4)
Dissolved Oxygen (30 day average) – minimum concentration of 5.0 mg/L for nongame fisheries (3C), waterfowl (3D) -- minimum concentration of 5.5 mg/L for warmwater fisheries (3B) -- minimum concentration of 6.5 mg/L for coldwater fisheries (3A)
Nitrate – maximum concentration of 4 mg/L is a pollution indicator
Ammonia – varies with pH and temperature
Total Phosphorous – a concentration over .05mg/L is a pollution indicator in streams - a concentration over .025 mg/L is considered a potential problem in lakes
Utah’s Watershed Approach Utah’s Division of Water Quality uses a watershed approach to protect its waters. This means that when the state determines that a stream or river is polluted, activities throughout the entire upstream watershed are evaluated to determine their possible contribution to the problem. This way all the sources of a given pollutant – both point and nonpoint – are taken into consideration.
If the Division of Water Quality determines that a stream is too polluted, then they work with the entire watershed to find a solution. The maximum amount of pollutant allowed in the stream is often identified in these cases. This is called a Total Maximum Daily Load (TMDL), which is simply the maximum amount of a given pollutant that a river, lake or reservoir can handle before its beneficial uses are affected. The TMDL becomes a goal, and the agency and watershed groups work land owners, businesses and other sources of the pollutant in the watershed to reduce their contributions and to finally meet the TMDL goal.
What regulations affect water use? Water quality standards are regulations which protect the quality of water. There are different kinds of laws which determine whether water can be removed from a waterbody (e.g., for irrigating or for cooling water at a power plant). These other laws are older than water quality regulations and developed differently in different parts of the country depending on water availability.
217

Utah Stream Team Unit VI. Utah Water Information
Prior Appropriation Most Western states, including Utah, follow the prior appropriation doctrine. When pioneers settled Utah they claimed rights to streams (or other waterbodies). Under this doctrine, they were allowed to divert a specified amount of water from a public water source for their own use. The first person or family to claim rights had priority to use the water over those who followed. In dry years the first claimant, or first few claimants, may have been the only ones to be able to draw water. We call this doctrine, which still exists today, the “first in time, first in right” doctrine. Most western states, including Utah, also apply the prior appropriation doctrine to groundwater.
Riparian doctrine The riparian doctrine, or common law doctrine, gives a private land owner certain rights to water that borders or crosses his/her property. These rights include use of water for household needs, live stock, recreation (including fishing) and power generation. This type of water law is found in eastern states, where water is more plentiful.
Resources for Further Investigation Introduction to Water Quality Standards – This Environmental Protection Agency publication provides general information about the water quality standards program. Information is also included about where to obtain additional information about water quality standards. Contact: U.S. Environmental Protection Agency, Office of Water Quality, Office of Science and Technology, Standards and Applied Science Division (4305), 401 m St, SW, Washington, DC 20460; www.epa.gov
A Guide to Wetland and Stream Permitting in Utah – This guide provides an overview of the major permits, regulatory laws, policies and programs that apply to Utah’s water bodies, and the agencies that oversee each. Contact: Utah State University Extension Service, 4900 Old Main Hill, Utah State University, Logan, UT 84322-4900; (435)797-2465, Fax: (435)797-2443; [email protected]/natres/wq/inde.g.htm
Standards of Quality for Waters of the State – This State of Utah web site provides a complete listing of designated beneficial uses and numeric water quality criteria for State waters. Find your waterbody here. http://www.rules.state.ut.us/publicat/code/r317/r317-002.htm#H8
USGS Guide to Federal Environmental Laws and Regulations - Water Quality – This web site provides an overview of all major federal laws involving water quality. http://water.usgs.gov/eap/env_guide/h2o_quality.html
Bibilography Daugs, Don. Water Education…with an Emphasis on Deer Creek Reservoir – Provo River Drainage Area. Mountainland Association of Governments. Provo, UT. No date.
Office of Water - Environmental Protection Agency. Introduction to Water Quality Standards (EPA-823-F-99-020). Environmental Protection Agency. Washington, DC. 1999.
State of Utah. Rule R317-2. Standards of Quality for Waters of the State. http://www.rules.state.ut.us/publicat/code/r317/r317-002.htm#H8
218

Utah Stream Team Unit VI. Utah Water Information
United States Geological Survey. “Water Quality Standards and Implementation Plans” [303 (33 U.S.C. 1313)]. USGS Guide to Federal Environmental Laws and Regulations - Water Quality. http://water.usgs.gov/eap/env_guide/h2o_quality.html
Utah Division of Water Quality. 1996 Water Quality Fact Sheet. Utah Department of Environmental Quality. Salt Lake City, UT. 1996.
State of Utah. Rule R317-2. Standards of Quality for Waters of the State. http://www.rules.state.ut.us/publicat/code/r317/r317-002.htm#H8
219

Utah Stream Team Unit VI. Utah Water Information
220

Utah Stream Team Unit VII. Appendices
VII. Appendices
1. Feedback
2. Contacts and Resources
3. Utah Science Core Curriculum Matrix
4. A Note to Volunteers
5. Sampling Directions and Data Sheets (Masters)
6. Overhead Masters
7. Funding Your Monitoring Program
8. Purchasing Supplies
9. Making Your Own Monitoring Equipment
10. Monitoring in the Classroom
11. Conversion Charts
12. Glossary
13. Index
221

Utah Stream Team Unit VII. Appendices
222

Utah Stream Team Unit VII. Appendices
Appendix 1. Feedback
223

Utah Stream Team Unit VII. Appendices
224

Utah Stream Team Unit VII. Appendices
Utah Stream Team Evaluation Form
Thank you for participating in the Utah Stream Team Program. We hope that you and your participants benefited from the activities, and that the program was a success. To help us better maintain and update the Utah Stream Team Manual, please complete the following evaluation form.
Have you used the Utah Stream Team Manual before?
What size group did you have?
How often do you use the program?
During which season did you use the program?
Which stream or which type of waterway (i.e. river, lake, pond, etc.)?
Do you plan to use the Utah Stream Team Program again? Why or why not?
Please rate the following from 1 to 10, 1 being the lowest, and 10 being the highest.
Organization of the Manual 1 2 3 4 5 6 7 8 9 10
Ease of obtaining materials 1 2 3 4 5 6 7 8 9 10
Completeness and accuracy of information 1 2 3 4 5 6 7 8 9 10
Ease of bringing community issues into the program 1 2 3 4 5 6 7 8 9 10
Connections to Core Curriculum 1 2 3 4 5 6 7 8 9 10
Ease of implementing program 1 2 3 4 5 6 7 8 9 10
Overall rating of the Utah Stream Team 1 2 3 4 5 6 7 8 9 10
225

Utah Stream Team Unit VII. Appendices
1. Do you feel that the Utah Stream Team Program was beneficial for the participants? Was the manual appropriate to your group’s ages and abilities?
2. Was the Utah Stream Team Manual easy to use, identifying enough resources and activities for your program?
3. Using the Utah Stream Team Manual, do you feel comfortable facilitating a water quality investigation with your students or group?
4. Is there anything that you would like to see expanded upon in the manual, or is there anything that you feel was not useful in the manual?
5. Any other comments you may have regarding the Utah Stream Team Program.
Please return to Nancy Mesner, Department of Geography and Earth Resources, Utah State University, Logan, UT 84322-5240 or fax to (435) 797-4048 or email comments to [email protected].
226

Utah Stream Team Unit VII. Appendices
Appendix 2. Contacts and Resources
227

Utah Stream Team Unit VII. Appendices
228

Utah Stream Team Unit VII. Appendices
Resources
Monitoring Publications Adopt-A-Watershed – Adopt-A-Watershed supports student monitoring through an impressive k-12 continuum of 15 sequential curriculum units covering all elements of watersheds (wildlife, water geology, etc.). Among the curriculum units are: The Streamside Community for primary grades, focusing on interdependence in natural systems, a study of amphibians, a streambank restoration project and a community display. Another is Wildlife, a 16-lesson middle school unit that focuses on the concept of natural selection, and involves various population studies leading towards a wildlife enhancement project. Both units are multi-disciplinary, comprehensive and very teacher-friendly. Contact: Adopt-A-Watershed, PO Box 1850, Hayfork CA 96041, (530) 628 5334, www.tcoe.trinity.k12.ca.us/aaw
Educating Young People About Water - Three guides developed by the U.S Dept. of Agriculture Cooperative State Research and Extension Service: A Guide to Program Planning and Evaluation walks program planners through the steps in setting up and evaluating a youth water education program- bringing together the key components that can lead to an effective, sustainable program; A Guide to Unique Program Strategies tells the story of 37 program coordinators from around the country. Discover how they integrate community water education issues and youth development needs into unique program designs; A Guide to Goals and Resources, 2nd ed., provides the program coordinator with 100 water education curricula summaries, environmental education topics and goals, and multimedia resources. Contact: http://www.uwex.edu/erc/ywc/
Field Manual for Water Quality Monitoring: An Environmental Education Program for Schools (6th edition) by Mitchell, Mark and William Stapp, 1992. The basic text used by Project GREEN programs worldwide. Instructions for eight chemical and physical water quality tests plus fecal coliforms and macroinvertebrates; also chapters on heavy metals testing, cross-cultural partnerships, and computer networking. Contact: William Stapp, 2050 Delaware, Ann Arbor, MI 48103. Spanish edition (titled Manual de Campo del Proyecto del Rio) also available for $9 from Project GREEN, 216 S. State St., Ste. 4, Ann Arbor, MI 48104; 313-761-8142.
A Guide to Goals and Resources – This guide provides summary descriptions of about 120 water education curricula. The web site is searchable by grade level or by topic, and each entry also includes information about how to obtain the materials. A less up-to-date printed version, containing 100 entries, is also available for $5. Contact: 800-276-0462 and ask for, 2nd ed www.uwex.edu/erc/ywc/.
Monitor's Guide to Aquatic Macroinvertebrates by Kellogg, L.L. 1994. 60 pages. A pocket-sized guide including a key (with some important fly families), descriptions of major invertebrate groups, sampling protocols for both rocky bottoms and muddy bottoms, and sample data sheets. Excellent illustrations. Contact: Save Our Streams, Izaak Walton League of America, 707 Conservation Lane, Gaithersburg, MD 20878; 800-BUG-IWLA. $5.
Sourcebook for Watershed Education – Provides detailed guidelines for the development of watershed-wide education programs, focusing on program goals, funding and school-community partnerships. It contains a rich set of interdisciplinary classroom activities and outlines GREEN’s
229

Utah Stream Team Unit VII. Appendices
education philosophy. Contact: GREEN, 721 E. Huron Street, Ann Arbor, MI, 48104, 313-761- 4951, web: www.igc.apc.org/green
Streamkeepers Field Guide: Watershed Inventory and Stream Monitoring Methods by Tom Murdoch, Martha Cheo, and Kate O’Laughlin (2nd Edition). Section on understanding watersheds, conducting field inventories, water quality monitoring programs, keys to plant and animal life, methods of analyzing and presenting your data and how to effect changes in attitude and policy. Manual is adaptable for use by students ages 12-adult. Companion video also available. Contact: Adopt-A-Stream Foundation, 600-128th St SE, Everett, WA 98208, 425-316- 8592; www.streamkeepers.org
The Volunteer Monitor - The National Newsletter of Volunteer Water Quality Monitoring The Volunteer Monitor newsletter facilitates the exchange of ideas, monitoring methods, and practical advice among volunteer environmental monitoring groups (including school groups) across the nation. You can obtain this free biannual publication by mail or via the EPA’s web site. Contact: Elanor Ely, Editor, 1318 Masonic Avenue, San Francisco, CA, 94117; 415-255- 8409. www.epa.gov/OWOW/volunteer/vm_index.html
The Volunteer Monitor’s Guide to: Quality Assurance Project Plan (QAPP) – The QAPP is a document that outlines monitoring procedures for those who want to ensure that the data they collect and analyze meets EPA requirements. It is an invaluable planning and operating tool that outlines the project’s methods of data collection, storage and analysis. It serves not only to convince skeptical data users about the quality of the project’s findings, but also to record methods, goals and project implementation steps for current and future volunteers and for those who may wish to use the project’s data over time. Contact: Alice Mayio at USEPA (4503F), 401 M St. SW, Washington, DC 20460; 202/260-7018; [email protected]. www.wa.gov/ecology/wq/wow/wdw/monlevel.html
Volunteer Stream Monitoring: A Methods Manual - This 210-page manual is the third in a series of methods manuals published by Environmental Protection Agency (the first and second covered lakes and estuaries). It takes the reader through an introduction to streams and discussion of watershed survey methods, then proceeds to offer in-depth, step-by-step approaches to monitoring macroinvertebrates, habitat, water quality, and physical conditions. The manual concludes with a chapter on managing and presenting data. Several volunteer monitoring programs assisted EPA in developing this manual by sharing their protocols and expertise. For a free copy of the manual, contact Alice Mayio at USEPA (4503F), 401 M St. SW, Washington, DC 20460; 202-260-7018; [email protected]. Also available on the web: www.epa.gov/owow/monitoring/vol.html.
Monitoring Programs Adopt-A-Stream Foundation – The mission of Adopt-A-Stream Foundation is: “To teach people to become stewards of their watersheds.” They achieve their mission through two focus areas: Environmental Education and Habitat Restoration. The long term goal of AASF is to ensure the protection and care of every stream by encouraging schools, community groups, sports clubs, civic organizations and individuals to adopt their streams, and to become Streamkeepers. The Foundation publishes the Streamkeepers manual (see the “Curriculum” section), offers other educational materials and opportunities, and technical support. Contact: The Adopt-A-Stream Foundation at the Northwest Stream Center, 600-128th Street SE Everett, WA 98208-6353 425- 316-8592; Fax: 425-338-1423; E-mail: [email protected]; www.streamkeepers.org
230
Utah Stream Team Unit VII. Appendices
The Global Rivers Environmental Network (GREEN) – GREEN is affiliated with the School of Natural Resources and Environment at the University of Michigan in Ann Arbor. GREEN is an international network of active schools and communities in over 50 nations and every state in the United States. The Central Office is also a clearinghouse of teaching and monitoring strategies to study water quality. GREEN provides materials and ideas for people interested in evaluating and improving local water quality through hands-on monitoring and problem-solving. Contact: GREEN, 721 E. Huron Street, Ann Arbor, MI, 48104, 313-761-4951, web: www.igc.apc.org/green>
Nature Mapping Program – The goal of Nature Mapping is to help students and communities create a biodiversity report card on which to base future land use decisions in their area. Volunteers help wildlife biologists amass reliable information about habitats, wildlife and invasive species. In support, Nature Mapping provides monitoring guidelines at their web site (currently for wildlife and water, with more modules to come), data entry software, teacher- training workshops, a video, posters, a field kit, preparatory activities for middle school classes, and final report cards. Contact: The Nature Mapping Program, University of Washington, Washington Cooperative Fish and Wildlife Research Unit, School of Fisheries, Box 357980, Seattle WA 98195-7980, 206-543-6475, http://salmo.cqs.washington.edu/~wagap/nm
Project GLOBE – Global Learning and Observations to Benefit the Environment (GLOBE) is an international hands-on environmental science and education program that uses scientific instruments and state-of-the-art technology to make science relevant to K-12 students. The water quality section, one of the many monitoring opportunities, offers lots of background information and classroom and field testing directions. Globe will store and graph data for each class. Students can share their data on the web site with schools from around the world and ask scientists for help interpreting the significance of their data. Contact: www.globe.gov/
The River Watch Network – The multi-faceted River Watch Network provides middle/high schools and community groups with an array of water monitoring services designed to yield high quality data and effective community partnerships. They help many groups develop their own programs; provide workshops for teachers, including a week-long summer institute; and help organize student workshops such as Clean Water Congresses. Among the Network’s publications are Testing the Waters: Chemical and Physical Vital Signs of a River (211 pp., $25) and Benthic Macroinvertebrate Monitoring Manual (200 pp., $25). For those establishing monitoring programs, there is a Program Organizing Guide (24 pp., $10) and a Study Design Workbook (39 pp., $10). Contact: Education Coordinator, River Watch Network, 153 State St., Montpelier, VT 05602, 802-223-3840, http://www.riverwatch.org
Monitoring Supplies Acorn Naturalists – Acorn Naturalists is a clearinghouse for environmental education resources, including material specific to water quality monitoring. In their catalog, published yearly, you will find descriptions and ordering information for books, puzzles, field guides, monitoring equipment, field investigation tools and much more. Contact: 800-422-8886; www.acornnaturalists.com
Chemetrics - Chemeterics offers a wide variety of water quality monitoring test kits, supplies and replacement materials. Customer service and educational materials support volunteer
231
Utah Stream Team Unit VII. Appendices
monitors. Contact: Chemetrics, Rt 28, Calverton, VA 20138; 800-356 3072; fax 504-788-4856; email: [email protected]; web: http://www.chemetrics.com
Hach Company – Hach offers a wide variety of water quality monitoring test kits, supplies and replacement materials. Customer service and educational materials support volunteer monitors. Contact: Hach Co., PO Box 389, Loveland, CO, 80539; 800-227-4224; www.hach.com
LaMotte Company – LaMotte offers a wide variety of water quality monitoring test kits, supplies and replacement materials. Customer service and educational materials support volunteer monitors. Contact: LaMotte Company, P.O. Box 329, 802 Washington Ave., Chestertown, Maryland, 21620 800-344-3100; fax 410-778-6394; www.lamotte.com
Nasco Science – Nasco offers a wide variety of water quality monitoring test kits, supplies and replacement materials. You will also find other science supplies and equipment. Contact: Nasco Science, 4825 Stoddard Rd, Modesto, CA 95356-9316; 800-558-9595; fax 209-545-1669; email: [email protected]; web: http://www.nascofa.com
Water Quality Sampling Equipment and Homemade Sampling Equipment by theTennessee Valley Authority, 1988. Two 16-page booklets, designed to be used as a set. The first describes professional sampling equipment and tells how to obtain it; the second contains instructions for making low-cost facsimiles of the same equipment (Secchi disks, plankton samplers, artificial substrates, nets for macroinvertebrate sampling, and more). Contact: Carol A. Davis, 311 Broad St., Chattanooga, TN 37402-2801; 615-751-7338. Free (one set only).
Curricula The Comprehensive Water Education Book. This curriculum guide seeks to promote water literacy amongst grades K-6. Topics include: Physical and Chemical Properties, The Hydrologic Cycle, All Things are Dependent on Water to Maintain Life, Water is Essential for Human Activities, and Fun and Games. Each one is supported by background information for the teacher and dozens of well-designed activities and lesson plans. Contact: International Office for Water Education, Utah Water Research Laboratory, Utah State University, Logan, UT 84322-8200, 435- 797-3182, 800-922-4693.
Hands On Save Our Streams: The Save Our Streams Teachers Manual - A 215-page curriculum for grades 1-12. It contains classroom and field activities relating to watersheds, pollution sources, stream monitoring, and the relationship between land use and water quality. Also included is a science project guide with ideas for turning stream study into a science fair or community project. Contact: 800-BUG-IWLA; www.iwla.org.
The Indoor River Book by : The Complete Guide of Integrated Activities for Building and Maintaining a Model Watershed inYour Classroom by Jim Higgins, Martin Kemple Foods Works (1994). This is a simple step-by-step teacher's guide for building an indoor aquatic habitat modeled after the local watershed. For grades 4 and up, includes lists of materials and activities across the curriculum – science, math, social studies, language arts, creative arts,and design technology. Adaptable for teachers with little or no experience conducting an environmental/community-based activity in school. Includes diagrams, illustrations, and photos of the process.
Project Aquatic Wild Education Activity Guide. Project Aquatic Wild is an interdisciplinary, supplementary conservation and environmental education program emphasizing aquatic wildlife
232

Utah Stream Team Unit VII. Appendices
and the natural and human forces that affect them. Dozens of activities address topics such as “Awareness and Appreciation,” “Management and Conservation,” and “Responsible Human Actions.” Activities address grades K-12 and may be easily integrated into existing courses of study, or the entire set of activities may serve as the basis for a course a study. Educators in non- school settings will also find the materials of use. Contact: Project Wild, 707 Conservation Lane, Suite 305, Gaithersburg, MD 20878, 301-527-8900, fax 301-527-8912, E-mail: [email protected], web: www.projectwild.org
Project WET. This curriculum and activity guide is an education program for educators and young people, grades K-12. Its goal is to facilitate and promote awareness, appreciation, knowledge and stewardship of water resources through the development and assimilation of classroom-ready teaching aids and through the establishment of state and internationally sponsored Project WET programs. Project WET activities incorporate a variety of formats, such as large and small group learning, whole-body activities, laboratory investigations, discussion of local and global topics, and involvement in community service projects. The guide is available to formal and informal educators through workshops. Contact: Project WET, 201 Culbertson Hall, Montana State University, Bozeman, MT 59717-0570, p: 406-994-5392, fax 406-994-1919, email: [email protected], web: www.montana.edu/wwwwet
Rivers Curriculum Project – The Illinois Rivers Project developed this river curriculum series. The river is the central theme that binds together six teacher resource books – and six content areas – in this interdisciplinary high school curriculum. Students learn to work together to make a difference in their own community while exploring vital topics. The Rivers Curriculum units work together to form a complete, interdisciplinary program, or stand alone as supplements to your existing curriculum. Topics include Chemistry, Geography, Mathematics, Biology, Earth Science, and Language Arts. Contact: Rivers Project, Southern Illinois University, Box 2222, Edwardsville, IL, 62026-2222, 618-692-2466, http://www.siue.edu/OSME/river
The Stream Scene: Watersheds, Wildlife and People. The Stream Scene looks at watersheds from many perspectives. The arrangement of the curriculum will guide the user from the broad spectrum of watershed systems, riparian areas and their respective components to the specific nature of streams and the aquatic life they support. Materials – background information, activities and activity extensions, and bibliographies – can stand alone but are designed to prepare students to perform field investigations (e.g., water quality monitoring, fish sampling). Sampling directions, data collections sheets, equipment lists and more support the field investigations. Materials are designed for grades 6-12 but, are adaptable for younger students. Contact: Oregon Department of Fish and Wildlife, PO Box 59, Portland, OR 97207.
Utah Nonpoint Source Education Activities for Grades 1-12. This activity booklet includes directions for ten hands-on activities demonstrating nonpoint source pollution concepts, a glossary, and a correlation to the 1994 Utah Core Curriculum for Science. Contact: Contact: Your local [county] Cooperative Extension Service – or – Utah State University Extension, 1500 N 800 E, ASTE Dept, Utah State University, Logan, UT 84322-2300, 435-797-3389. extension.usu.edu/natres/wq/
Water Conservation and Nonpoint Source Pollution – This activity book features hands-on, minds-on activities for elementary grades. The booklet incorporates the activities in the Utah Nonpoint Source Education Activities for Grades 1-12 and the Groundwater Flow Demonstration Model Activities for Grades 6-12 and includes new materials on water conservation. It was developed to provide inservice training to teachers on water quality and quantity issues. Contact: Your local [county] Cooperative Extension Service – or – Utah State University Extension, 1500
233

Utah Stream Team Unit VII. Appendices
N 800 E, ASTE Dept, Utah State University, Logan, UT 84322-2300, 435-797-3389. extension.usu.edu/natres/wq/
Water Education…with emphasis on Deer Creek Reservoir – Provo River Drainage Area. This manual is a compilation of lesson plans for grades 5 to 8. It is designed to integrate water resources, conservation, management, and environmental education into the regular school curriculum (Utah State Core Curriculum connections are identified). A multi-disciplinary, activity oriented approach is used. Each lesson plan provides Background Information for the Teacher and Activities. Although emphasis is placed on Deer Creek Reservoir, you’ll find plenty of applicable and useful information about water – especially Utah water. You’ll also find a Utah Water Education Speakers Bureau Organizational Listing (with phone numbers). Contact: Mountainland Association of Governments, 2545 North Canyon Road, Provo, Utah 84604
Watershed Science for Educators - Cornell Center for the Environment’s new 213-page manual is designed for high school and middle school science classes and after-school science clubs. It covers biological, chemical, and physical monitoring and the use of topographic maps and aerial photographs. Each of the 15 activities includes a teachers page with background information and preparation suggestions. Clear instructions and photo-copyable data forms make the manual easy to use. Contact: Cornell University Media and Technology Services Resource Center, 6 Business & Technology Park, Ithaca, NY 14850; 607-255-2080; [email protected].
Teaching Resources Diatomaceous Earth Model – By pouring colored water over a silt-like material and various “accessories” you can demonstrate how rivers form watersheds and how land development affects overland flow. Lots of fun! Contact: Utah State University Extension, 1500 N 800 E, ASTE Dept, Utah State University, Logan, UT 84322-2300, 435-797-3389. extension.usu.edu/natres/wq/
Enviroscape – This is a large, plastic model that illustrates the major natural and human features of a watershed. Spray the model with water to simulate rain and surface flow, add food coloring to trace pollution flow, and manipulate land uses to affect water quality. The model is an excellent interactive tool for teaching a variety of watershed and water quality concepts. Comes with guides (User and Resource) and added components that facilitate investigations of Watersheds, Riparian areas, Groundwater, Wetlands, and Hazardous waste. Contact : Your local [county] Cooperative Extension Service – or – Utah State University Extension, 1500 N 800 E, ASTE Dept, Utah State University, Logan, UT 84322-2300, 435-797-3389. extension.usu.edu/natres/wq/ To purchase one: JT&A, inc., 4 Herbert Street, Alexandria, VA 22305, 703-519-2180, Fax 703-519-2190, email: [email protected], web: Http://www.jtainc.com
The Groundwater Flow Demonstration Model – These models are used to demonstrate groundwater movement principles. The model is constructed of clear plexiglass which allows viewers to watch how the water within a groundwater system moves. The model is ideal for classrooms, children’s (and adult’s) festivals and Scout and 4-H groups. There are 14 models throughout Utah that can be used free-of-charge for educational purposes. An activity book with directions for hands-on lessons accompanies. Cooperative Extension County staff are often available to provide demonstrations using the model. Contact: Your local [county] Cooperative Extension Service – or – Utah State University Extension, 1500 N 800 E, ASTE Dept, Utah State University, Logan, UT 84322-2300, 435-797-3389. extension.usu.edu/natres/wq/
CD-Rom
234

Utah Stream Team Unit VII. Appendices
Utah Groundwater – This IBM-compatible software program discusses ground water concepts including the hydrologic cycle, types of aquifers, and ground water contamination. It is designed to be self-pacing and interactive by using hyper-text and computer graphics. Contact: Your local [county] Cooperative Extension Service – or – Utah State University Extension, 1500 N 800 E, ASTE Dept, Utah State University, Logan, UT 84322-2300, 435-797-3389.
Utah Residential Water Conservation Techniques – This IBM-compatible software program discusses water conservation techniques in and around the home. It is designed to be self-pacing and interactive by using hyper-text and computer graphics. Contact: Your local [county] Cooperative Extension Service – or – Utah State University Extension, 1500 N 800 E, ASTE Dept, Utah State University, Logan, UT 84322-2300, 435-797-3389.
Watershed – This IBM-compatible software program uses a multi-media format to explain what a watershed is and the water quality issues facing land users. Provides a quick overview of various watersheds being monitored in Utah, and a simulation gaming format for youth to make decisions on land use and the consequences of those land use decisions. Contact: Your local [county] Cooperative Extension Service – or – Utah State University Extension, 1500 N 800 E, ASTE Dept, Utah State University, Logan, UT 84322-2300, 435-797-3389.
Web Sites Adopt Your Watershed - This EPA web site is a national catalog of groups involved in local watershed protection efforts. Thousands of watershed alliances, volunteer monitoring groups, cleanup efforts, and advocacy organizations are listed. A great way to form partnerships and learn from other monitoring efforts. www.epa.gov/surf/adopt
Index of Watershed Indicators – This EPA web site compiles information on the condition and vulnerability of watersheds in Utah and the nation. Fifteen indicators are used, including: ability of waters to meet designated uses, fish consumption advisories, and aquatic/wetland species at risk. These indicators are combined to determine an overall index score for every watershed in the nation. Find out how your watershed scores! www.epa.gov/surf/iwi/
Project Green - The Global Rivers Environmental Education Network (GREEN) middle and high school-aged youth to understand, improve and sustain their watersheds and the water quality within. Youth learn how to use the proper tools and then undertake projects to improve environmental quality based on otheir findings. Water monitoring equipment, resource and action guides and a network of support are just some of the key elements GREEN provides its participants. Their website now offers a Hands-On Center where you can take your findings and learn more about the background behind your chemical water monitoring tests. They will also show you how to begin to take action on your research. http://www.earthforce.org/green/
Science in Your Watershed – The U.S. Geological Survey’s Science in Your Watershed web site can help you find scientific information organized on a watershed basis. This information, coupled with observations and measurements made by watershed groups, provides a powerful foundation for characterizing, assessing, analyzing, and maintaining the status of a watershed. The web site has information on using GIS, active projects, case studies, and more. www.water.usgs.gov/wsc/
Surf Your Watershed – This web site is designed to help users locate, use, and share environmental information about a watershed or community. You can find out about protection
235

Utah Stream Team Unit VII. Appendices
efforts and volunteer opportunities in your watershed, and even build, view, and download a customized map of your area including such things as roads, streams, and EPA-regulated facilities. www.epa.gov/surf
Utah Environmental Hotline Web Page – The Utah Environmental Hotline 1-800-CLEANUP and website, is a public/private partnership designed to empower Utah residents with proactive environmental information and programs through a single network. As this program continues to grow, it will expand to include even more community specific information. New links to community specific environmental information and programs will be highlighted here, designed to make it easy for anyone, inside or outside the state, to access information about our state's environmental pollution prevention programs. www.1800cleanup.org/StatePrograms/States/Utah/ut.htm
UtahLink – This exhaustive site for Utah Educators links to many other sites and resources relevant to water quality monitoring. You’ll find information on aquatic wildlife and ecosystems, water chemistry, funding sources, curriculum, and much, much more. A great place to learn how to make water quality monitoring a successful component of the school experience. www.uen.org/utahlink/
Water Pollution - This web site is an excellent starting point when looking for water- and water quality-related information on the web. You’ll information on water pollution, monitoring, education, sewage and plumbing, wastewater treatment and much more. Sampling parameters (ex. nitrate) are described along with sampling techniques. You’ll also find an exhaustive list of links (with abstracts) to other water education and water quality monitoring sites. www.geocities.com/RainForest/5161/wwlinks.htm
State Monitoring Agencies Adopt-A-Waterbody – This Utah Department of Agriculture program recognizes and assists volunteer groups that provide stewardship to a body of water in Utah. Contact: Shelly Quick, 350 N Redwood Rd, PO Box 1465000, Salt Lake City, UT 84114-6500, (801)538-7100; www.ag.state.us/divisns/mkt&cons/aaw.htm
4-H – 4-H is a youth education program administered by the Cooperative Extension Service. The “National 4-H Environmental Stewardship” program helps youth learn how to turn a concern for the environment into action. Educational experiences guide youth toward a balanced approach to community problem solving, protecting the environment, managing resources, and taking appropriate action. For information on 4-H programs in your area, contact your state or county Cooperative Extension Office (see Utah State Cooperative Extension Service below for contact information). For information on the National 4-H Council in Maryland - 301-961-2866 or 301- 961-2833.
Utah Department of Natural Resources (UDNR) - The Utah Division of Water Rights is an agency of Utah State Government within the Department of Natural Resources. Their web site provides information on water rights, wells and groundwater, dams, stream alterations, geographical information (you can download topographical maps of your area), water-related publications, and streamflow data. Contact: http://nrwrt1.nr.state.ut.us/; [email protected]; or call 801-538-7240.
236
Utah Stream Team Unit VII. Appendices
Utah Division of Water Resources (UDWR) – The UDWR, a department of the Utah Division of Natural Resources, implements water education and conservation programs that encourage wise municipal, industrial, agricultural and environmental water use. They also maintain accurate and current water supply and land use data for each watershed in the state. Check out their Water Conservation Web Site to learn about water use in Utah, and how we can protect and conserve our clean water supplies. You can also request UDWR publications (e.g., Utah Water Facts brochure). http://www.nr.state.ut.us/WTRRESC/water/Cons/cons.htm
Utah Division of Water Quality (UDWQ) – A department of the Utah Department of Environmental Quality. Their mission is to protect, maintain and enhance the quality of Utah's surface and underground waters for appropriate beneficial uses; and to protect the public health through eliminating and preventing water related health hazards which can occur as a result of improper disposal of human, animal or industrial wastes while giving reasonable consideration to the economic impact. Their Utah Water Quality Project Assistance Program (WQPAP) was created by the State Legislature in 1983 to provide financial assistance and state participation with the needs and requirements associated with conserving, developing, treating, restoring and protecting the waters of the State. Contact: State of Utah, Department of Environmental Quality, Department of Water Quality, PO Box 144870, Salt Lake City, UT 84114-4870, 801-538 6146, http://www.eq.state.ut.us/eqwq [Alan Daly, Head of State Program for Water Education - [email protected]; Monitoring Section - Richard Denton 538-6055]
Utah Division of Wildlife Resources (UDWR) - The UDWR manages the state’s fish resources, primarily for recreational use (sport fishing) and aquatic ecosystem health. To help them do this they have developed the Aquatic Resource Education (ARE) program which educates the public about the state’s aquatic resources. Through ARE you will find many different educational resources as well as opportunities to be involved in or partner with habitat enhancement programs. The UDWR can also provide resource specialists to help you with your aquatic studies. Contact: UDWR, Box 146301, Salt Lake City, UT 84114-6301; 801-538-4774.
Utah Natural Resource and Conservation Service (NRCS) - The mission of the NRCS is to provide leadership in a partnership effort to help people conserve, improve, and sustain our natural resources and environment. They provide water conservation materials for teachers and students as well as technical assistance to stream and wetland monitoring groups. Contact: Utah State Office, 125 South State Street, Salt Lake City, Utah 84138, PO Box 11350, Salt Lake City, UT 84147-0350, 801-524-4550, fax: 801-524-4403, www.nrcs.usda.gov
Utah State Cooperative Extension Service - The Extension Water Quality Program at Utah State University offers up to date, unbiased, research-based information and assistance to Utah citizens about the quality of surface and ground water, best management practices to reduce pollution to our waters, and the function and protection of watersheds. In addition they provide information and assistance with hands-on activities for schools, 4-H, and other youth groups. Contact: Nancy Mesner, Water Quality Extension Specialist, 4900 Old Main Hill, Utah State University, Logan, UT 84322-4900; (435)797-2465, Fax: (435)797-2443; [email protected]/natres/wq/index.htm
Federal Monitoring Agencies Bureau of Land Management (BLM) – The BLM, which administers most of the public land in Utah and the West, is an important resource for water quality monitors. They can provide maps, up-to-date information on streams and watersheds, staff expertise, volunteer opportunities,
237

Utah Stream Team Unit VII. Appendices
partnership information, teacher resources, and more. Check out their web site for contact information on your local District and a link to their Environmental Education Home Page. You can also reach the Utah State Office to find contact information for your local district. Contact: Bureau of Land Management, Utah State Office, PO Box 45155, Salt Lake City, Utah 84145- 0155, (801) 539-4001, fax: (801) 539-4013, web: www.blm.gov
Soil Conservation Service – The Soil Conservation Service, US Department of Agriculture, has offices in nearly every county to assist the nation’s private landowners to conserve, improve and sustain all natural resources through conservation programs and practices. Most SCS education and volunteer activities are locally based. Youth and leaders should contact their local SCS office for assistance, opportunities and materials. Check you local telephone directory under US Government, Department of Agriculture, Soil Conservation Service, for the address and phone number of you nearest Soil Conservation Service office.
US Environmental Protection Agency (EPA) – The EPA supports the volunteer monitoring movement in a number of ways. It sponsors national and regional conferences to encourage information exchange between volunteer groups, government agencies, businesses, and educators; publishes sampling methods manuals for volunteers; produces a nationwide directory of volunteer programs; and through its ten regions, provides some technical assistance (primarily on quality control and lab methods) and regional coordination. Grants to States that can be used to support volunteer monitoring in lakes and for nonpoint source pollution control are also managed by the EPA Regions. Contact: www.epa.gov/ow (Office of Water Homepage). Numerous links extend from there.
US Forest Service (USFS) – The environmental education branch of the USFS, the Conservation Education program, provides structured educational experiences and activities targeted to varying age groups and populations. Conservation Education enables people to realize how natural resources and ecosystems affect each other and how resources can be used wisely. The Conservation Education's Home Page includes information on specific programs and activity dates, as well as on curricular resources for teachers and others. Programs are listed by target audiences, and include information on locations, costs, and who to contact. Also included are contacts for Conservation Education in each state. Reach the Region 4 Office (Utah’s region) to find contact information on your local district. Contact: Region 4 Administration, Federal Building 324, 25th Street, Ogden, UT 84401; Hours 8:00 to 4:15 MT, 801-625-5608, Fax: 801- 625-5127, E-mail: mailroom/[email protected], web:www.fs.fed.us/intro/directory/rg-4.htm
US Geological Survey – The Water Resources Division of the USGS offers hydrology data, water quality and water education publications, technical resources and water quality programs. The USGS is also an excellent place to look for maps of your watershed. Contact the Utah office of the USGS at: Kimball Goddard, 1745 West 1700 South, Rm 1016 Administrative Building, Salt Lake City, UT 84104, (801) 975-3350, Fax: (801) 975-3424; [email protected]; http://www.water.usgs.gov/
Non-Governmental Organizations Ducks Unlimited - The mission of Ducks Unlimited (DU) is to fulfill the annual life cycle needs of North American waterfowl by protecting, enhancing, restoring and managing important wetlands and associated uplands. DU offers educational resources for teachers and often serves as a partner in restoration projects. Contact: Ducks Unlimited, Inc., One Waterfowl Way, Memphis, TN 38120; http://www.ducks.org/
238

Utah Stream Team Unit VII. Appendices
Izaak Walton League – The Izaak Walton League promotes protection and preservation of natural resources, encourages conservation education, and defends America’s soil, air, woods, waters and wildlife. Izaak Walton League chapters can provide valuable information about local environmental issues and conservation projects. The League’s Save Our Streams (SOS) program encourages participants to adopt a stream by conducting water and habitat quality monitoring and completing appropriate restoration activities. Contact: Izaak Walton League of America, 1401 Wilson Blvd, Level B, Arlington, VA 22209 (800)BUG-IWLA
Trout Unlimited (TU) – Trout Unlimited is the nation’s leading non-profit coldwater fisheries conservation organization and has over 75,000 members in 435 chapters across the country. TU’s mission is to conserve, protect, and restore coldwater fisheries and other watersheds. TU chapters work at the local level to restore trout and salmon waters degraded by pollution, clean up litter on streams and rivers, and teach the public about the ecological and economic importance of healthy streams. An excellent organization to partner with on monitoring or restoration projects. Trout Unlimited, PO Box 11861, Salt Lake City, UT 84147; email: [email protected]
239

Utah Stream Team Unit VII. Appendices
240

Appendix 3. Utah Science Core Curriculum Matrix
Utah Stream Team Unit VII. Appendices 241

246
242
Utah Stream Team Unit VII. Appendices

VII-8. Utah State Science Core Curriculum Connections “X” identifies sections of the manual that address (directly or indirectly) Science Core Curriculum standards and objectives.
5th Grade Science
Stream
Survey
Stream
flow
Stream
Shape
Tu
rbidity
Temperature
pH
dissolved oxygen
nitrogen
phosphorus
macroinvertebrates
riparian vegetation
illustrating data
reflecting on data
stewardship
water cycle
watersheds
water pollu
tion
water regu
lations
classroom monitoring
Stan
dards
1.1
X
X
X X X X X X
X
X
2.1
X
X
X
X X X X
2.3
X
X
X X X X
5.1 X
5.2
X X X X X X X X
243
Utah Stream Team Unit VII. Appendices
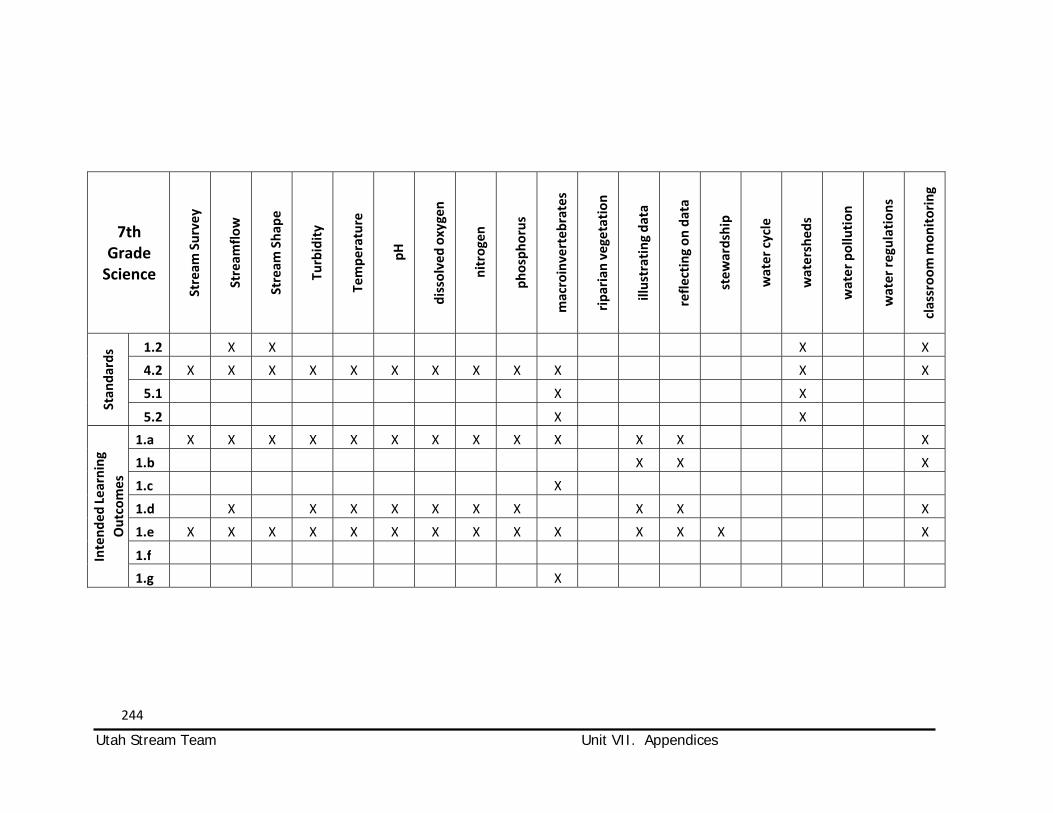
246
Outcomes
7th Grade Science
Stream
Survey
Stream
flow
Stream
Shape
Tu
rbidity
Temperature
pH
dissolved oxygen
nitrogen
phosphorus
macroinvertebrates
riparian vegetation
illustrating data
reflecting on data
stewardship
water cycle
watersheds
water pollu
tion
water regu
lations
classroom monitoring
Stan
dards 1.2 X X X X
4.2 X X X X X X X X X X X X
5.1 X X
5.2 X X
Intended Learning
1.a X X X X X X X X X X X X X
1.b X X X
1.c X
1.d X X X X X X X X X X
1.e X X X X X X X X X X X X X X
1.f
1.g X
244
Utah Stream Team Unit VII. Appendices

243
Outcomes
8th Grade Science
Stream
Survey
Stream
flow
Stream
Shape
Tu
rbidity
Temperature
pH
dissolved oxygen
nitrogen
phosphorus
macroinvertebrates
riparian vegetation
illustrating data
reflecting on data
stewardship
water cycle
watersheds
water pollu
tion
water regu
lations
classroom monitoring
Stan
dards
1.1 X X X X X
1.2 X X X X X X X X X
2.1 X
2.3 X X X X X X X X X X X X
3.2 X X
3.4 X X X X
4.2 X X
4.3 X X
Intended Learning
1.a X X X X X X X X X X X X X
1.b X X X
1.c X
1.d X X X X X X X X X X
1.e X X X X X X X X X X X X X X
1.f
1.g X
245
Utah Stream Team Unit VII. Appendices

for Life
9‐12th Grade Science
Stream
Survey
Stream
flow
Stream
Shape
Turbidity
Temperature
pH
dissolved oxygen
nitrogen
phosphorus
macroinvertebrates
riparian vegetation
illustrating data
reflecting on data
stewardship
water cycle
watersheds
water pollu
tion
water regu
lations
classroom monitoring
Earth
System
s
Stan
dards
2.2 X X X X X X X X X X X X
4.1 X X X X X X X
5.1 X X X X X X X X X X X X
Chemistry 6.3 X
Biology 1.2 X X X X X
1.3 X X
5.1 X
5.3 X
7‐12th Grade Social
Studies
Stream
Survey
Stream
flow
Stream
Shape
Turbidity
Temperature
pH
dissolved oxygen
nitrogen
phosphorus
macroinvertebrates
riparian vegetation
illustrating data
reflecting on data
stewardship
water cycle
watersheds
water pollu
tion
water regu
lations
classroom monitoring
Utah Studies
Stan
dards
1.1 X X X X X X X X X X X X
1.2 X X X X X X X X X X X X
1.3 X X X X X X X X X X X X
1.4 X X X X X X X X X X X X
Geograp
hy 2.1 X X X X X X X X
3.1 X X X X X X
5.1 X X X X X X X X X X X X X
5.2 X X X X
246

Utah Stream Team Unit VII. Appendices
Appendix 4. A Note to Volunteers
247

Utah Stream Team Unit VII. Appendices
248

Utah Stream Team Unit VII. Appendices
Utah Stream Team
Thank you for being a volunteer with the Utah Stream Team Program! We appreciate your time and effort in helping make this experience a success. The following is an overview of our program to give you some background information before heading into the field. The Utah Stream Team has provided a hands-on program for all ages. Due to the fact that all the measurements are done in the field, volunteers should exercise caution, and be aware of the always-changing environmental conditions. The participants will gain an appreciation for our natural resources through hands-on activities in natural settings. The goal of the Utah Stream Team program is to promote water quality monitoring through physical, chemical and biological testing. The information obtained will help us to better understand how our activities effect water quality, determine the overall health of our water, and identify specific water quality problems. Physical Measurements
a. Stream flow is the amount of water that flows past a specific point over a specific period of time. We measure stream flow by determining the average velocity (how fast an object moves in the stream) and multiplying that by a cross sectional area of the stream. Participant will wade into the stream to take several depth measurements.
b. Stream shape refers to the physical structure of the stream. The stream channel may be meandering (making many tight “s-turns”), straight, or braided (continually splitting and rejoining). The stream may contain riffles (areas where the water is flowing over rocks and gravel), runs (long smooth areas), or pools (deep slow moving areas). We also measure substrate, which is the material that makes up the streams channel. Substrate is divided into six categories based on size. The participants will pick up, measure and record the size of the rocks on the stream bottom.
Chemical Measurements a. pH is the measurement of how acidic or basic the water is. We measure pH
on a scale from 1 to 14, with 1 being acidic, 7 being neutral, and 14 being basic. Water with extremely high or low pH is deadly to plants and animals. We sample pH using colored litmus strips which are dipped into the water. The color strips react with the water and are then compared with a chart to determine the pH. The allowable range of pH is 6.5 to 9.0 in the State of Utah.
b. Dissolved oxygen is a measurement of the amount of oxygen molecules in the water (the oxygen is invisible to our eyes; bubbles contain oxygen that is not dissolved). To test for dissolved oxygen, stream water is mixed with chemicals in a small glass ampoule, which then change color depending on the amount of oxygen present in the water. The darker blue, the more oxygen
249

Utah Stream Team Unit VII. Appendices
dissolved in the water. The minimum concentration for Utah is 6.5 mg/liter for coldwater fish, and 5.5 mg/liter for warmwater fish.
c. Nitrogen (we measure nitrate and ammonia) is used in building proteins, and is therefore an essential nutrient for plant and animal growth. Too much nitrate in a stream however, may cause too many plants to grow, which may cause problems when they die and decay. Both nitrate and ammonia can also be poisonous. The nitrate and ammonia tests are color tests, where the amount of color change is proportional to the amount of pollutant being measured. The State of Utah considers nitrate concentrations of 4 ppm(mg/liter) to be an indicator of pollution problems. Ammonia is much more toxic in warm water or at higher pH levels.
d. Phosphorus is another important plant nutrient. Phosphorus is often the nutrient that limits how much plant growth occurs in a stream, lake or reservoir. We also measure phosphorus with a color test. The State of Utah considers a total phosphorus concentration of 0.05 ppm(mg/liter) in a stream or river an indicator of possible pollution problems.
e. Turbidity is a measurement of the amount of suspended solids present in a stream. This affects how deeply light can penetrate. We measure turbidity with a turbidity tube. Fill the tube with stream water, then release the water until you can see the black and white disk at the bottom. The depth in the tube to this point is then converted into turbidity units (NTU’s). The higher the NTU’s, the cloudier the appearance.
f. The temperature of the water is influenced by seasons, the geographic area of the stream, the source of water and the channel shape or shading from plants on the bank. We sample temperature with a field thermometer. The maximum temperature allowed for warm water fish and aquatic wildlife is 27 degrees Celcius. The maximum temperature allowed for cold water fish and aquatic wildlife is 20 degrees Celcius.
Biological Measurements a. The tiny animals that live in the streams are called aquatic macroinvertebrates.
The types and abundance of macroinvertebrates found in a stream are important for two reasons. One, they indicate water quality. Different macroinvertebrates tolerate different types of stream conditions. Two, they are important parts of the aquatic and terrestrial food chain. We sample macroinvertebrates directly from the stream by dislodging them from the rocks they cling to and collecting them in a net. They can be observed with a magnifying glass or counted for a water quality index.
b. The riparian zone is the green ribbon of life alongside a stream. The riparian zone connects the uplands zone to the aquatic zone. Well-functioning riparian zones are critical to a healthy watershed. All riparian measurements are taken by walking a transect and recording the plants with each step. We measure the types of plants that grow at the waters edge (the green line) to tell if these are plants which can hold on to the banks. We sample the canopy cover to see how shady the riparian area is. We sample the plants from the streams edge upward to see how extensive the riparian area is.
250

Utah Stream Team Unit VII. Appendices
Appendix 5. Sampling Directions and Data Sheets (Masters)
251

Utah Stream Team Unit VII. Appendices
252

Utah Stream Team Unit VII. Appendices
General Stream Survey
Site and Sampling Date Information
Stream name Date
Time of Day Watershed name
School/group name Teacher/leader
Group members
Location of stream section Weather in past 24 hours:
Weather now: Air Temperature
storm (heavy rain) storm (heavy rain)rain (steady rain) rain (steady rain)showers (intermittent rain) showers (intermittent rain)overcast overcast degrees Fclear/sunny clear/sunny degrees C
Water and Watershed Information
Water appearance: Smell: Land use around site: clear rotten egg (sulphurous) factories brown musky pavement multi-colored sheen chlorine agriculture foamy other logging milky grazing scummy homes muddy/cloudy mining orange/red wildlands green water treatment plant other stream modifications
unpaved roads/trails other
NOTES
253

Utah Stream Team Unit VII. Appendices
254

Utah Stream Team Unit VII. Appendices
Stream Flow
If your stream is too deep to wade into disregard the
following directions. You can obtain accurate, up-to-the-hour data from the US Geological Survey – www.ga.water.usgs.gov
Step 1 - Measure length of stream section 1. Choose a fairly straight section of stream.
Time – 45 minutes Persons - 4 Materials: Measuring tape (at least 50 feet) 8 surveyor’s flags stopwatch or watch with a second hand float (ping pong ball, bobber, orange) 2 sets of waders Physical Data Collection Sheet
2. Use the tape measure to measure a 50 foot section. Place flags at both ends (next to the water’s edge).
3. Record the length stream section as “50 feet” in Step 1 of the Physical Data Collection Sheet.
Step 2 - Measure cross-section area a. Measure width of stream section (see Figure IV-2 for help) 1. Stretch a tape across the stream between two flags. 2. Record your width in Step 2a of the Data Collection Sheet in inches. 3. Keep holding the tape measure between the two flags. You will need it for the next step.
b. Measure average depth of stream section (see Figure IV-2 for help) 1. With the tape measure strung between the two zero ft flags, have a third person move one-
fourth of the way across the width of the stream. To find this distance divide your width by 4. For example, if your stream is 20 feet, you would move 5 feet across.
255

Utah Stream Team Unit VII. Appendices
2. At this one-quarter mark, rest your yard stick on the stream bottom (do not dig) and record the depth in Step 2b of the Physical Data Collection Sheet. Record depth in inches.
3. Move the same distance out along your tape measure (you will now be one-half way across
the stream). Record the second depth measurement in Step 2b.
4. Record the depth at three-fourths of the way across the stream.
5. Add the three depths and divide by three to get an average depth for your stream section. c. Calculate cross-section area Fill-in the boxes in Step 2c – “Cross-section Area” – on the Physical Data Collection Sheet. Multiply the width times the depth. You now have cross sectional area in square inches. Divide that value by 144 for cross sectional area in square feet.
Step 3 – Measure velocity [ see Figure IV-3 for help] a. Calculate average travel time – the time it takes an object to travel your 50 foot section
1. Drop a floating object (ping pong ball) in the main channel upstream of your zero flag. Start the stopwatch when the object passes the zero flag (the “starting line”).
2. Yell to stop the clock when the object passes the 50 ft flag (the “finish line”).
3. Collect the object and record the time on the data sheet.
4. Repeat steps 1-3 two more times. Throw out any tests where the float gets stuck in rocks or debris.
5. Add all three travel times and divide by 3 to get an average. Record on data sheet.
Calculate velocity Divide stream section length by average travel time.
This will give you velocity in feet per second (feet/sec).
Step 4 – Calculate stream flow
Illustration: Holly Broome-Hyer
Figure IV-3
Multiply the average cross-section area times the average velocity to determine stream flow for your section. Your flow will be in cubic feet per second.
256
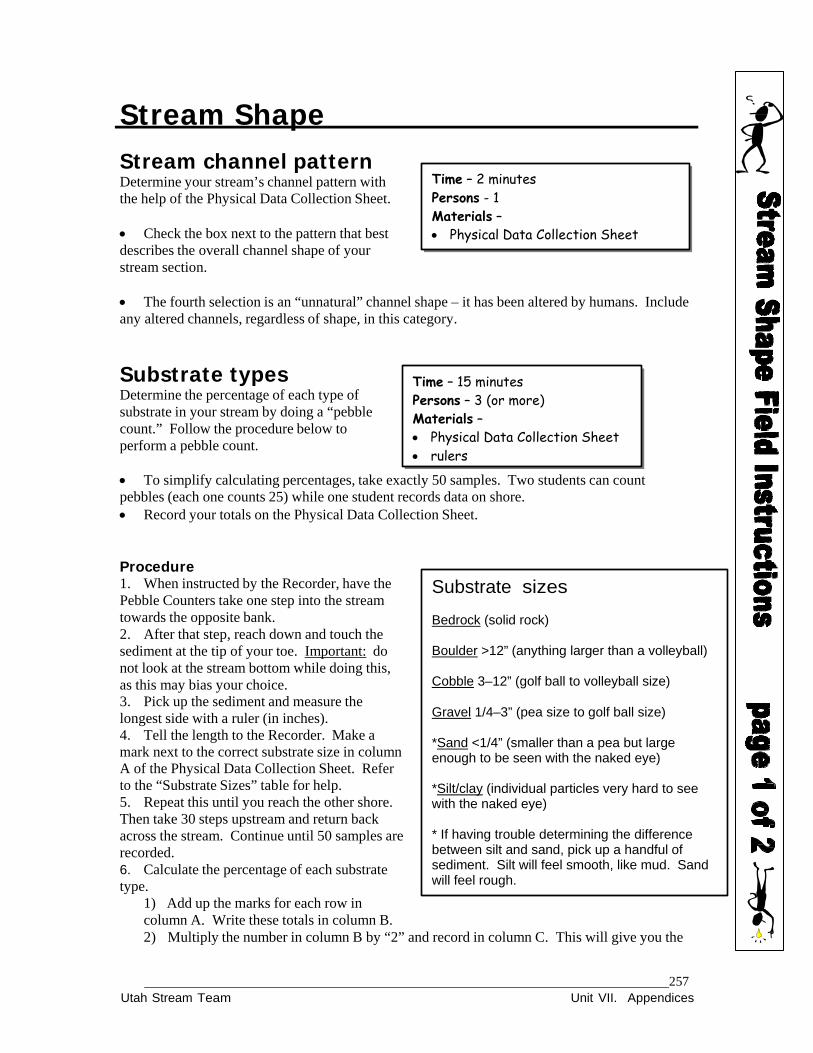
Utah Stream Team Unit VII. Appendices
Stream Shape
Stream channel pattern Determine your stream’s channel pattern with the help of the Physical Data Collection Sheet.
Check the box next to the pattern that best describes the overall channel shape of your stream section.
Time – 2 minutes Persons - 1 Materials – Physical Data Collection Sheet
The fourth selection is an “unnatural” channel shape – it has been altered by humans. Include any altered channels, regardless of shape, in this category.
Substrate types Determine the percentage of each type of substrate in your stream by doing a “pebble count.” Follow the procedure below to perform a pebble count.
Time – 15 minutes Persons – 3 (or more) Materials – Physical Data Collection Sheet rulers
To simplify calculating percentages, take exactly 50 samples. Two students can count pebbles (each one counts 25) while one student records data on shore. Record your totals on the Physical Data Collection Sheet.
Procedure 1. When instructed by the Recorder, have the Pebble Counters take one step into the stream towards the opposite bank. 2. After that step, reach down and touch the sediment at the tip of your toe. Important: do not look at the stream bottom while doing this, as this may bias your choice. 3. Pick up the sediment and measure the longest side with a ruler (in inches). 4. Tell the length to the Recorder. Make a mark next to the correct substrate size in column A of the Physical Data Collection Sheet. Refer to the “Substrate Sizes” table for help. 5. Repeat this until you reach the other shore. Then take 30 steps upstream and return back across the stream. Continue until 50 samples are recorded. 6. Calculate the percentage of each substrate type.
1) Add up the marks for each row in column A. Write these totals in column B.
Substrate sizes Bedrock (solid rock) Boulder >12” (anything larger than a volleyball)
Cobble 3–12” (golf ball to volleyball size)
Gravel 1/4–3” (pea size to golf ball size) *Sand <1/4” (smaller than a pea but large enough to be seen with the naked eye) *Silt/clay (individual particles very hard to see with the naked eye) * If having trouble determining the difference between silt and sand, pick up a handful of sediment. Silt will feel smooth, like mud. Sand will feel rough.
2) Multiply the number in column B by “2” and record in column C. This will give you the
257

Utah Stream Team Unit VII. Appendices
percent of each substrate type. For example, if you recorded 31 cobbles then, (31 X 2) = 62. This means that 62% of the substrate in your stream section are cobbles.
Riffle/run/pool ratio The riffle/run/pool ratio is a measure of the kinds of habitat in your stream for fish, macroinvertebrates and other aquatic life.
Time – 15 minutes Persons – 3 Materials – Physical Data Collection Sheet
Notes Use Figure 6 below to help you correctly identify pools, riffles and runs. Practice identifying in the field before sampling.
The “Riffle/Run/Pool Procedure” can be done at the same time as the “Substrate Sampling Procedure.” Record both measurements each time you take a step across the stream.
Procedure 1. Walk along the edge of your stream, using even paces. Stop after each step and look across the stream. Determine whether the stream is a riffle, pool or run at this point in the river. Note: If there are several habitat types, choose the most common type. 2. Mark the correct habitat type in column A on the Pool/Run/Riffle chart on the Physical Data Collection Sheet. 3. Continue for exactly 50 paces (this simplifies calculating the percentage). 4. Add your marks for each row in column B. 5. Multiply the number in Column B by 2 to find the percentage of pools, runs and riffles in the stream. For example, if you sampled 31 riffles then 31 X 2 = 62. This tells you that 62% of your stream section consists of riffles.
Riffles, runs and pools
258

Utah Stream Team Unit VII. Appendices
Date:
Streamflow Recorder:
Step 1 - length of stream section feet
Step 2 - cross-section area (width x depth)
a) width (inches)
C)
cross section area
b) depth 1 (inches)
2 (inches)
+ 3. (inches)
width (inches)
x depth (inches)
= (square inches) ÷ 144 =
÷ 3 =
(inches) (inches)
= cross section area (square feet)
Step 3 – velocity
a) travel times
1. (sec)
2. (sec)
b) velocity
length (feet)
÷ average travel time (sec)
+ 3.
=
(sec) (sec)
= velocity (feet/sec)
÷ 3 =
average travel time (sec)
Step 4 – stream flow cross section area (square feet)
X velocity (feet/sec)
= stream flow (feet³/sec)
259

Utah Stream Team Unit VII. Appendices
_
__
___
Stream Shape
Channel Pattern
Substrate Type Substrate type A. Record each
observation B. Total number of observations
C. Percent substrate type (column B x 2)
Silt (individual particles very hard to see with the naked eye)
Sand 1/4” (smaller than a pea but large enough to be seen with the naked eye)
Gravel ¼” – 3” (pea size to golf ball size)
Cobble 3” – 12” (golf ball to volleyball size)
Boulder >12” (anything larger than a volleyball)
Bedrock (solid rock)
Riffle/Run/Pool Ratio Feature A. Number of
observations B. Total number of observations
C. Percent feature type (column B x 2)
Riffle
Run
Pool
260

Utah Stream Team Unit VII. Appendices
pH
Time – 3 minutes Persons – 1
Materials pH strips
Step 1 Dip one strip of indicator paper into the stream for 30 seconds then pull it out.
Step 2 Wait 2 minutes.
Step 3 Compare the color of the litmus paper to the pH color key on the pH box.
Step 4 Record the number associated with the correct color match on the Chemical Properties Field Data Sheet.
Remember: Take pH readings directly in the stream. If this cannot be done safely, collect water in a bucket and take the pH reading of this water immediately.
The allowable range of pH is 6.5 to 9.0 in the State of Utah.
261

Utah Stream Team Unit VII. Appendices
262

Utah Stream Team Unit VII. Appendices
Dissolved Oxygen
This test detects dissolved oxygen
concentrations of 0 to 12 mg/L (ppm) Collecting and handling of the water
should be done with as little shaking as possible. Shaking may cause oxygen from the air to dissolve into the water sample and produce a inaccurate measurement.
Time – 3 minutes Persons - 1 Materials - CHEMets DO Sampling Kits
Sunlight can damage the ampoules in your DO kit. Keep them shaded at all times.
Step 1 1. Pre-rinse collection bottle with stream water. 2. Fill the sample cup to the 25 mL mark with your sample.
Step 2 1. Place the CHEMet ampoule in the sample cup. 2. Snap the tip by pressing the ampoule against the side of the cup. 3. The ampoule will fill, leaving a small bubble that will help you mix the
contents of the ampoule.
Step 3 1. Mix the contents of the ampoule by turning it up and down several
times, allowing the bubble to travel from end to end each time. 2. Wipe all liquid from the outside of the ampoule.
Step 4 1. Wait 2 minutes for color development.
Step 5 1. With the sun (or another light source) shining on the comporator –
rack of colored tubes – from directly above, place the dissolved oxygen ampoule between the color standards for viewing. It is important that the ampoule be compared by placing it on both sides of the color standard tube before deciding that it is darker, lighter or equal to the color standard.
2. Record the concentration of the best color match
In Utah: The minimum concentration for coldwater fish is 6.5 mg/L The minimum concentration for warmwater fish is 5.5 mg/L.
263

Utah Stream Team Unit VII. Appendices
264

Utah Stream Team Unit VII. Appendices
Nitrate
This test detects Nitrate at
concentrations of 0.1 to 5 mg/L (ppm)
The range for this test is 0 to 5 mg/L (ppm)
Time – 15 minutes Persons - 1 Materials - CHEMets Nitrate Sampling Kits
Sunlight can damage the ampoules in your Nitrogen kit. Keep them shaded at all times.
Step 1 1. Pre-rinse collection bottle with stream water. 2. Fill the sample cup to the 15 mL mark with your sample.
Step 2 1. Empty the contents of one Cadmium Foil Packet into the sample cup. Use caution when handling the Cadmium Packet. Tear it carefully or open with scissors. Do NOT use teeth. 2. Cap the sample cup and shake it vigorously for exactly 3 minutes. 3. Allow the sample to sit undisturbed for 30 seconds. Step 3 1. Place the ampoule in the sample cup. 2. Snap the tip by pressing the ampoule against the side of the cup. The ampoule will fill leaving a small bubble to help mixing.
Step 4 1. Mix the contents of the ampoule by turning it up and down several times, allowing the bubble to travel from end to end each time. 2. Wipe all liquid from the outside of the ampoule. Step 5 1. Wait 10 minutes for color development. Step 6 1. Use the appropriate comparator to determine the level of nitrate- nitrogen in the sample. For low range, use the tube comparator. For high range use the rack comparator.
a. Tube Comparator – Place the ampoule, flat end down into the center tube of the low range comparator. Direct the top comparator
265

Utah Stream Team Unit VII. Appendices
up to the sun or another bright light source while viewing from the bottom. Rotate the comparator until the color standard below the ampoule shows the closest match.
b. Rack Comparator – Hold the rack horizontal while standing underneath a bright light source. Place the ampoule between the color standards moving it from right to left along the comparator rack until the best color match is found. Step 7 1. Record the number of the best match on the comparator on your Chemical Properties Field Data Sheet. This is your nitrate-nitrogen concentration in mg/liter (ppm).
In Utah:
The maximum concentration of nitrate allowed in drinking water is 10 mg/liter.
The State of Utah considers nitrate concentrations of 4 mg/liter to be an indicator of pollution problems.
266

Utah Stream Team Unit VII. Appendices
.
Ammonia
NOTE: These directions are for concentrations less than 3 mg/liter. More detailed instructions can be found in the kit Detection limit = 0.10 mg/liter
Time – 5 minutes Persons - 1 Materials Hach ammonia sampling kit
Step 2 – place blank in viewer
Step 1 - assemble color viewer
Add color wheel to color comparator.
1. Pre-rinse two tubes with sample water 2. Fill one tube to the 5 ml mark with sample water 3. Place the tube in the top, left opening of the viewer. This will be your blank to control for natural water color or turbidity.
Step 3 – prepare the sample
1. Add three drops of Nessler Reagent to one tube 2. Swirl to mix. NOTE: Wait at least 1 minute but not more than 5 minutes before proceeding to Step 4
Fill to this mark
267
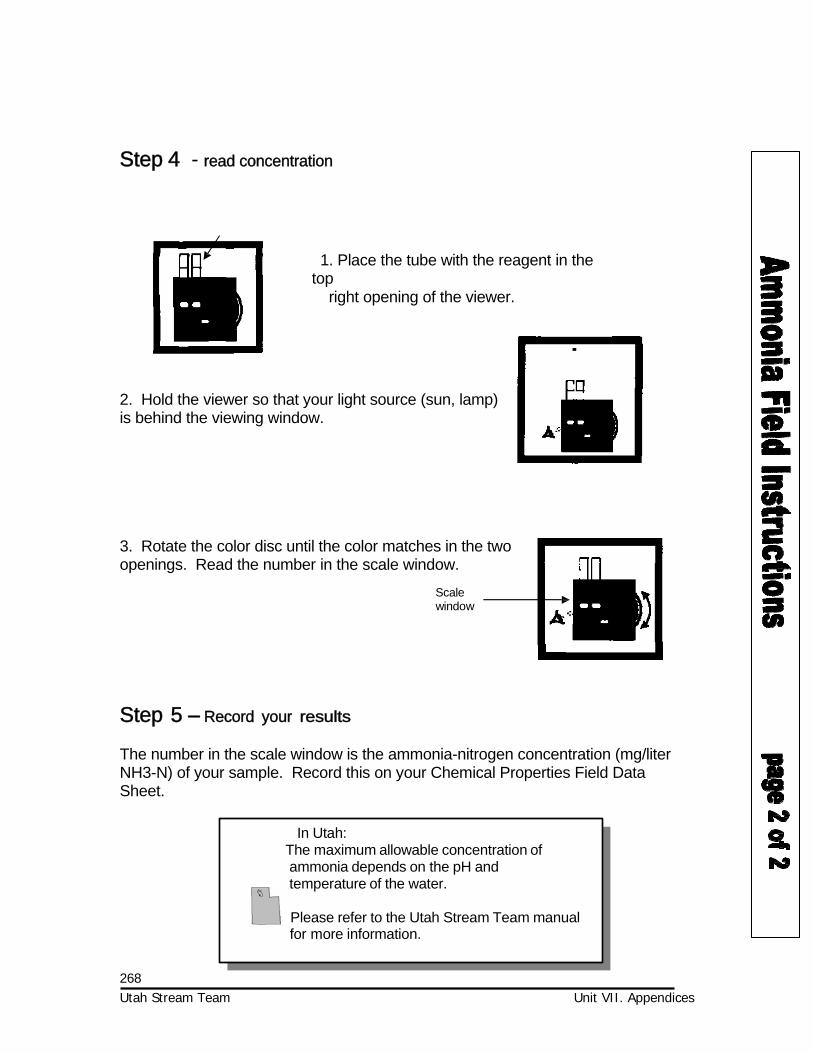
Utah Stream Team Unit VII. Appendices
Plm
Step 4 - read concentration
1. Place the tube with the reagent in the top
right opening of the viewer.
2. Hold the viewer so that your light source (sun, lamp) is behind the viewing window.
3. Rotate the color disc until the color matches in the two openings. Read the number in the scale window.
Scale window
Step 5 – Record your results
The number in the scale window is the ammonia-nitrogen concentration (mg/liter NH3-N) of your sample. Record this on your Chemical Properties Field Data Sheet.
In Utah: The maximum allowable concentration of ammonia depends on the pH and temperature of the water.
Please refer to the Utah Stream Team manual for more information.
268

269Utah Stream Team Unit VII. Appendices
Phosphorus (phosphate)
NOTE: These directions are for concentrations less than 0.3 mg/liter PO4 - P. More detailed instructions can be found in the kit. Detection limit = 0.01 mg / liter
Time – 5 minutes Persons – 1 Materials Hach phosphorus sampling kit
Step 1 - assemble color viewer
1. Add Long Path Viewing Adaptor. 2. Add color wheel.
Step 2 - pour the blank
1. Pre-rinse 1 test tube with stream water and fill to top mark with sample water. 2. Place this tube in the left top opening of the viewer. This is your blank.
Fill to this mark
Step 3 – develop color
1. Fill square bottle to the 20 ml mark with stream water.
2. Add contents of Phosphorus Reagent packet into bottle.
3. Swirl until the powder is dissolved.

270 Utah Stream Team Unit VII. Appendices
NOTE: Wait at least 8 minutes but not more than 10 minutes before proceeding to Step 4.
Step 4 - read the color (concentration)
1. Fill 2nd tube to the top mark with prepared sample from Step 3.
3. Hold the viewer so that the top of the tube points toward a light source.
2. Place in top right opening of viewer.
4. Rotate the color disc until the color matches in the two openings. Read the # in the scale window.
scale window
Step 5 – Calculate and record your results
Divide the number in the scale window by 150.
This is the phosphate-phosphorus concentration (mg / liter of (PO43- -P) .
The State of Utah considers a total phosphorus concentration of 0.05 mg/liter in
a stream or river to be an indicator of pollution problems. A concentration of 0.025 mg/liter in lakes is considered a potential problem.

271 Utah Stream Team Unit VII. Appendices
Turbidity
Detection limit = 6 NTU
Step 1 – collect your sample 1. Dip the tube into the water at your
sampling site and fill to the top. Be careful to sample flowing water and not the stream bottom.
Time – 2 minutes Persons - 1 Materials – Turbidity tube
Step 2 – Take your measurement (see figure below for help) 1. Take your filled turbidity tube to a shaded spot. If there is no shade around, use your
body to block the sun from shining on the tube. 2. With your hand over the opening, shake the tube vigorously. This will help to re-suspend
any sediment that has settled to the bottom. 3. Look down through the tube toward the target disk on the bottom of the tube.
If the disk is visible, record the water level in centimeters (cm). If the disk is not visible, slowly release water from the release valve, until the disk
becomes visible. Record the water level in centimeters (cm) on the Chemical Data Collection Sheet.
Step 3 – Convert from centimeters (cm) to turbidty units (NTU’s) 1. Match your turbidity measurement in centimeters to the corresponding NTUs using the conversion chart on the back of this page. Record on the Data Collection Sheet.
Look down into water from above

Utah Stream Team Unit VII. Appendices
Turbidity Conversion ChartDistance from bottom of tube
(cm)
NTU’s
< 6.25 > 2406.25 to 7 240 7 to 8 185 8 to 9.5 150 9.5 to 10.5 120 10.5 to 12 100 12 to 13.75 90 13.75 to 16.25 65 16.25 to 18.75 50 18.75 to 21.25 40 21.25 to 23.75 35 23.75 to 26.25 30 26.25 to 28.75 27 28.75 to 31.25 24 31.25 to 33.75 21 33.75 to 36.25 19 36.25 to 38.75 17 38.75 to 41.25 15 41.25 to 43.75 14 43.75 to 46.25 13 46.25 to 48.75 12 48.75 to 51.25 11 51.25 to 53.75 10 53.75 to 57.5 9 57.5 to 60 8 Over the top 6
Utah standards state that an increase of more than 10 NTUs is unacceptable for most waters.
This increase can be over natural levels or from one location to
another nearby downstream location.
272

Utah Stream Team Unit VII. Appendices
Temperature
Time – 2 minutes Persons – 1 Materials – Thermometer
Step 1 1. Dip the thermometer into a moving part of the stream or river. 2. Wait for the temperature to stop changing (at least 1 minute). Step 2 1. Read the temperature and record on the data sheet. Be sure to record
your temperature in degrees Celsius. 2. Use the equations below to convert between degrees Celsius to degrees Fahrenheit.
Converting Fahrenheit to Celsius: C = (5/9) x (F - 32) Converting Celsius to Fahrenheit: F = [(9/5) x C] + 32
The maximum temperature allowed for warm water water fisheries and aquatic wildlife is 27 C (81 F).
The maximum temperature allowed for cold water fisheries and aquatic wildlife is 20 C (68 F).
273

Utah Stream Team Unit VII. Appendices
274

Utah Stream Team Unit VII. Appendices
Date: Recorder:
Your Results Compare your results toUtah’s requirements
Water Temperature
ºF (or) ºC
The maximum temperature for: warmwater fisheries is 27 C (81 F) coldwater fisheries is 20 C (68 F).
pH (Value of the color match)
The allowable range for most waters in Utah is 6.5 to 9.0
Dissolved Oxygen (Value of the color match)
mg / liter
The minimum concentration for: warmwater fisheries is 5.5 mg/liter coldwater fisheries is 6.5 mg/liter.
Nitrate (Value of the color match)
mg / liter Nitrate-nitrogen
The maximum concentration for drinking water is 10 mg/liter. The concentration which indicates a possible pollution problem for streams and rivers is 4 mg/liter.
Ammonia (Value of the color match)
mg / liter
Ammonia-nitrogen
The maximum allowable concentration depends on the water’s pH and temperature. Please check the Ammonia section in the manual.
Phosphate (Divide value of the color match by 150)
mg / liter
Phosphate-phosphorus
The concentration which indicates a possible pollution problem: in streams and rivers is .05 mg/liter in lakes is .025 mg/liter
Turbidity (Use chart to convert target distance to NTUs)
NTUs
The maximum increase over natural levels in most streams and rivers is 10 NTUs.
275

Utah Stream Team Unit VII. Appendices
276

Utah Stream Team Unit VII. Appendices
Macroinvertebrate Sampling
Step 1 - Choose your sample site Select sampling reaches that are safe and easily
accessed by everyone in your group. A riffle will offer the best variety of organisms.
You may also want to collect samples from other habitats such as pools, aquatic vegetation and stream margins. Compare the different results you obtain from these areas and discuss why (think about Functional Feeding Groups, different flows, or available oxygen).
Step 2 – Collect your sample.
Time – 40 minutes Persons – 2 Materials - 1 kick net 1 plastic pan transfer pipettes plastic4 petri dishes magnifying glasses dichtomous key OPTIONAL paint brushes (for transferring) 5 gal plastic bucket (for decanting) waders (for sampling in cold or deep
water)
Note: Follow these directions if you are sampling in flowing water. 1. Wade into the stream and place your net so the mouth of the net is perpendicular to and facing the flow
of water. 2. Stand upstream of the net and disturb the stream bottom with your feet and hands. 3. Carefully pick up and rub stones directly in front of the net to remove attached animals. The stream
bottom material and organisms will be carried by the current into the net. If the rocks are lodged in the stream bottom, rub them vigorously, concentrating your effort on any cracks or indentations.
4. After removing all large stones, disturb the sand and gravel to a depth of about 3 inches by raking and stirring with your hands.
5. Continue this process until you can see no additional animals or organic matter being washed into the net.
Note: Follow these directions if you are sampling in pools or highly-vegetated areas. 1. Scoop material from the stream bottom. 2. Push and pull the net through aquatic vegetation. 3. Hand pick organisms from sticks and other structures.
Step 3 – Empty your sample 1. Hold your sampling net over a plastic pan and use a bucket of stream water to wash the material into
the pan. 2. If your sample contains a lot of rocks or debris, stir the sample in the pan to suspend the animals, then
pour the suspended material back into your net. Rinse the debris from the pan, then wash the animals in the net back into the pan.
Step 4 – Sort out the bugs 1. Use plastic transfer pipettes, small paint brushes or your fingers to remove bugs from pans. For easier
observation, place the animals into smaller water-filled containers (plastic ice cube trays or petri dishes work well).
2. Use the keys provided in this section to identify the bugs.
277
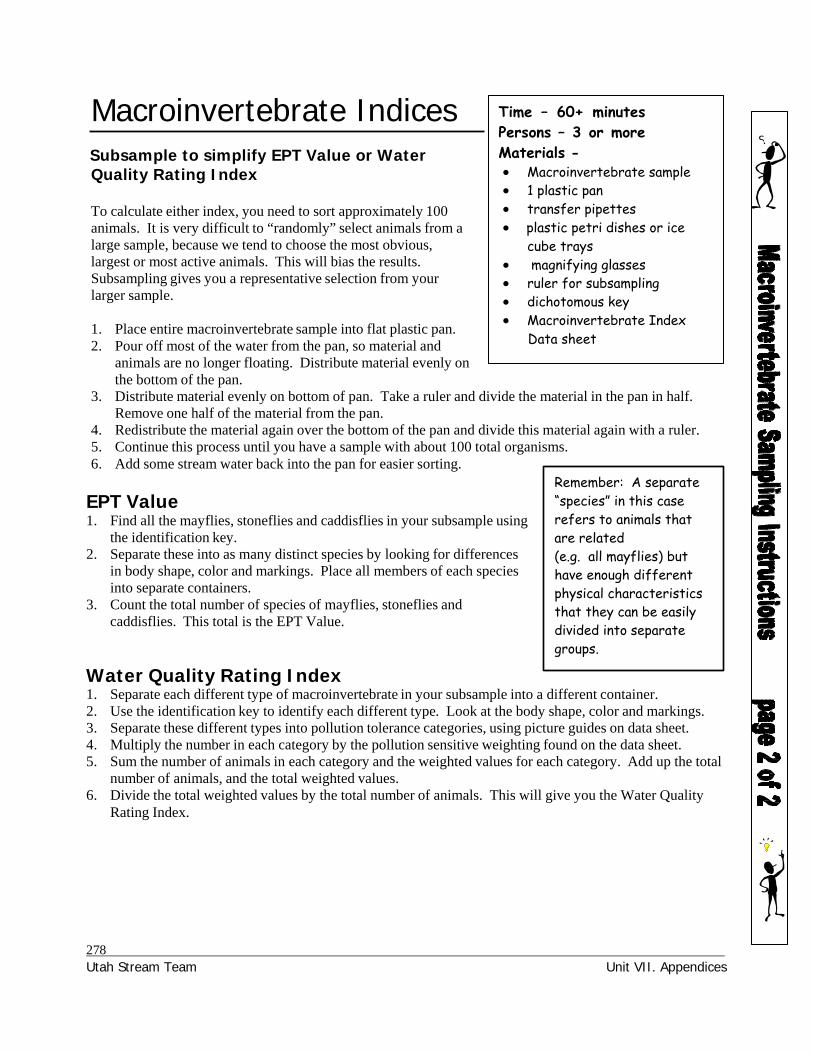
Utah Stream Team Unit VII. Appendices
Macroinvertebrate Indices
Subsample to simplify EPT Value or Water Quality Rating Index
To calculate either index, you need to sort approximately 100 animals. It is very difficult to “randomly” select animals from a large sample, because we tend to choose the most obvious, largest or most active animals. This will bias the results. Subsampling gives you a representative selection from your larger sample.
1. Place entire macroinvertebrate sample into flat plastic pan. 2. Pour off most of the water from the pan, so material and
animals are no longer floating. Distribute material evenly on the bottom of the pan.
Time – 60+ minutes Persons – 3 or more Materials - Macroinvertebrate sample 1 plastic pan transfer pipettes plastic petri dishes or ice
cube trays magnifying glasses ruler for subsampling dichotomous key Macroinvertebrate Index
Data sheet
3. Distribute material evenly on bottom of pan. Take a ruler and divide the material in the pan in half. Remove one half of the material from the pan.
4. Redistribute the material again over the bottom of the pan and divide this material again with a ruler. 5. Continue this process until you have a sample with about 100 total organisms. 6. Add some stream water back into the pan for easier sorting.
EPT Value 1. Find all the mayflies, stoneflies and caddisflies in your subsample using
the identification key. 2. Separate these into as many distinct species by looking for differences
in body shape, color and markings. Place all members of each species into separate containers.
3. Count the total number of species of mayflies, stoneflies and caddisflies. This total is the EPT Value.
Water Quality Rating Index
Remember: A separate “species” in this case refers to animals that are related (e.g. all mayflies) but have enough different physical characteristics that they can be easily divided into separate groups.
1. Separate each different type of macroinvertebrate in your subsample into a different container. 2. Use the identification key to identify each different type. Look at the body shape, color and markings. 3. Separate these different types into pollution tolerance categories, using picture guides on data sheet. 4. Multiply the number in each category by the pollution sensitive weighting found on the data sheet. 5. Sum the number of animals in each category and the weighted values for each category. Add up the total
number of animals, and the total weighted values. 6. Divide the total weighted values by the total number of animals. This will give you the Water Quality
Rating Index.
278

279Utah Stream Team Unit VII. Appendices
EPT Value Water Quality Rating Index Time – 45 minutes 60 minutes Persons – 3+ 3+ Materials (needed for either sampling method) 1 plastic pan 4 plastic petri dishes 4 transfer pipettes 1 kick net
4 magnifying glasses dichotomous keys 1 pair waders
(for cold and/or deep water)
EPT VALUE
Aquatic invertebrate Group Number of different
“species” found
MAYFLIES
STONEFLIES
CADDISFLIES
TOTAL
Total “species” equals EPT Value
[ ] >10 not affected (excellent water quality)
[ ] 6 – 10 slightly affected (good water quality)
[ ] 2 – 5 moderately affected (fair water quality)
[ ] < 2 severely affected (poor water quality)
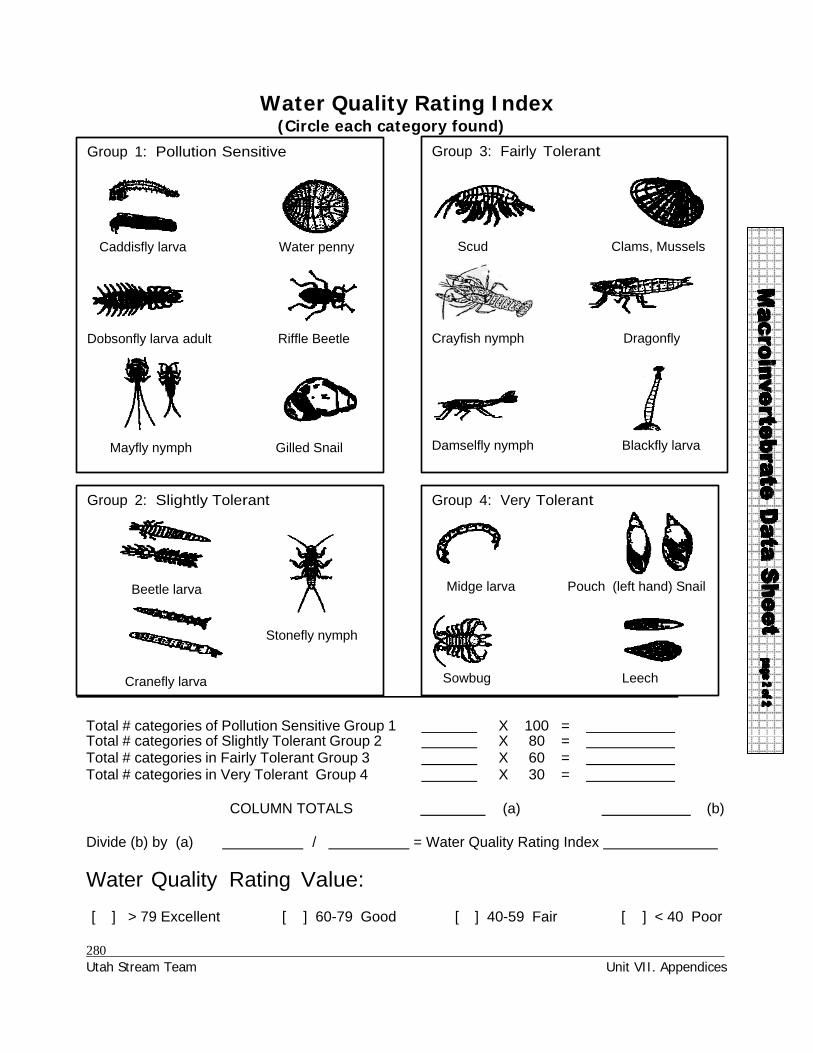
280 Utah Stream Team Unit VII. Appendices
Water Quality Rating Index (Circle each category found)
Group 1: Pollution Sensitive
Caddisfly larva Water penny
Dobsonfly larva adult Riffle Beetle
Mayfly nymph Gilled Snail
Group 3: Fairly Tolerant
Scud Clams, Mussels
Crayfish nymph Dragonfly Damselfly nymph Blackfly larva
Group 2: Slightly Tolerant
Beetle larva
Stonefly nymph
Cranefly larva
Group 4: Very Tolerant
Midge larva Pouch (left hand) Snail
Sowbug Leech
Total # categories of Pollution Sensitive Group 1 X 100 =
Total # categories of Slightly Tolerant Group 2 X 80 = Total # categories in Fairly Tolerant Group 3 X 60 = Total # categories in Very Tolerant Group 4 X 30 =
COLUMN TOTALS (a) (b)
Divide (b) by (a) / = Water Quality Rating Index
Water Quality Rating Value:
[ ] > 79 Excellent [ ] 60-79 Good [ ] 40-59 Fair [ ] < 40 Poor

Unit VII. AppendicesUtah Stream Team
Riparian Zone
Greenline
NOTE: The “greenline transect” can be done at the same time as the “canopy cover transect.” To save time have your directions and data sheets ready for both. 1. Measure a 100 ft stretch along your stream. Place a flag near the water at the beginning and end points. 2. Standing at the first flag, look toward the water. Note the vegetation type that is closest to the water and record it in row (1) of the data sheet. 3. Take one pace toward the other flag and stop. A pace is a normal stride you would take while walking. Look toward the water and record the vegetation type closest to the water. 4. Repeat these steps until you reach the other flag. 5. Add up the total number of steps you took and record in row (2). 6. Sum up all the observations and record in row (3) 7. For each vegetation category, divide the number in row (2) by the number in row (3), multiply by 100 and record in row (4). This will give you the percentage of the greenline that is made up of that vegetation category. For example, if you took 50 steps and found grass at 20 of them then 40% of your greenline consists of grasses.
Time – 30 minutes Persons – 2 Materials – Flagging Tape measure Riparian Zone Data Collection Sheet Plant guide (optional)
Figure 1
8. For each vegetation category, multiply the number in row (4) by the factor in row (5) and record in row (6). This will give you the “site score” for each vegetation category. Because sedges and rushes have the strongest roots and prevent erosion the best they receive the highest factor - “9.” Bare ground doesn’t prevent erosion so it receives the lowest factor – “1.” 9. Add the individual site scores in row (6) together to get the “total site score” for that stretch of stream.
281

Unit VII. AppendicesUtah Stream Team
Canopy Cover Note: At each point where you record greenline data you will also record canopy cover data. 1. Point the ocular tube straight up in
Time – 30 minutes Persons – 2 Materials – ocular tube measuring tape Riparian Zone Data Collection Sheet
the air (90 degree angle) and look through it with one eye. Your partner who is recording data can help you adjust the tube until it is as straight as possible. 2. Tell the recorder whether the “X” at the end of the tube points at sky (a “miss”) or a part of a tree or bush (a “hit”). Record this on your “canopy cover data chart.” 3. Repeat these steps for the rest of the greenline. 4. Add up the total hits and misses and record in the second row. 5. Add the two scores recorded in row 2. This will tell you the “total number of steps” you took along the transect (the greenline). Record this total in row 3. 6. Divide the number of “hits” in row 2 by the total observations in row 3 and multiply by 100. This will give you the percent canopy cover for the transect.
Ground Cover Note: Riparian ground cover transects start at the stream edge and extend 15 paces away from the stream, into the riparian vegetation. A pace is a normal stride you would take while walking.
Time – 35 minutes Persons – 2 Materials – Measuring tape Riparian Zone Data Collection Sheet
1. You will collect data along five separate transects in your stream stretch, spaced out at approximately equal distances along your stream reach. If possible, you should run two transects on one side of the stream and three on the other to get a better picture of the total riparian zone. Refer to the figure on page 1 of these instructions for help locating these transects. 2. Starting at the stream’s edge take one pace away from the stream. Touch your finger to the ground at the tip of your front foot. 3. Note the ground cover type that your finger touches. The categories are: bare ground, live vegetation, litter (dead vegetation or sticks) or rock. Record the type with a slash in the appropriate box on the “ground cover data chart.” Note that each column on the data chart is for a separate transect. 4. Repeat steps 2 – 3 for 15 paces. Then move on to the second transect. Repeat. 5. When you’ve finished with all five transects, add the totals for each row or cover type. Record your totals for each ground cover category in the category total column. In the next column, divide the categoy total by 75 (your total number of steps) and multiply by 100. This will give you a percentage of ground cover for each type in the riparian zone. To check your math, add up your percentages for each ground cover type. They should total 100%. * The percentage of each ground cover type provides a measure of ground cover that can be compared to other sites or to compare changes over time (between different years or seasons). As a general rule, though, a healthy riparian zone will be covered by a mixture of litter, rock and vegetation. An important exception to this are desert streams, which have very sandy banks.
282
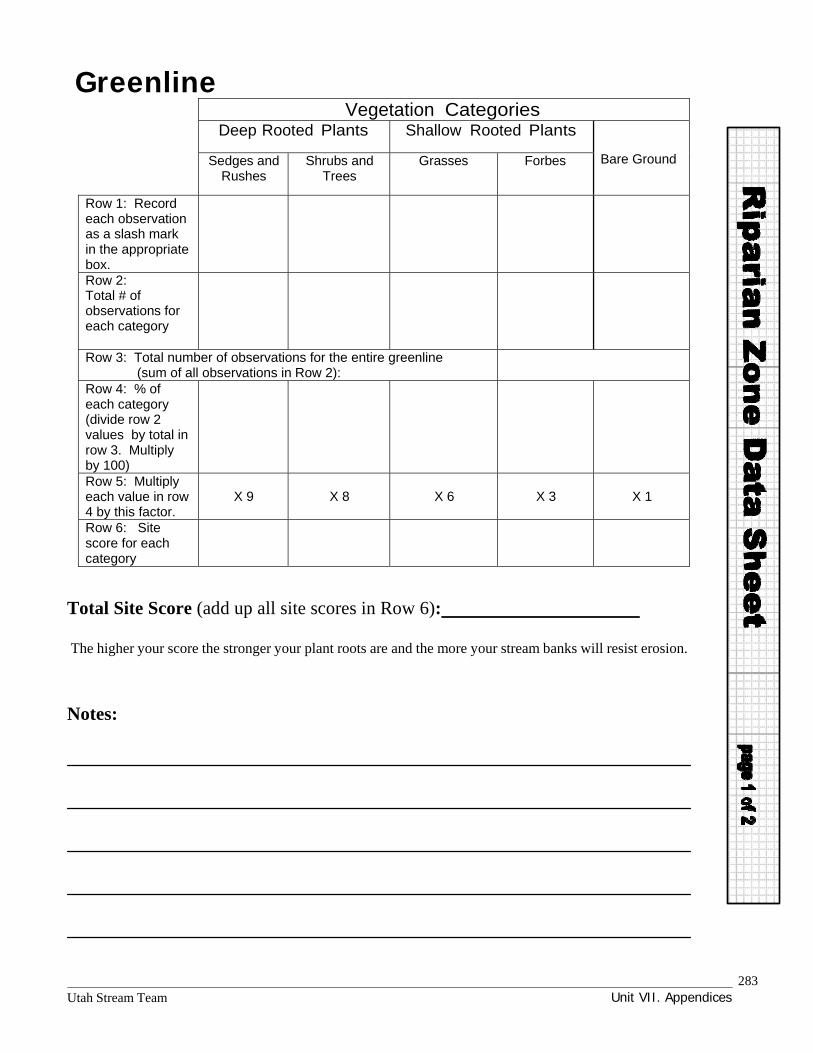
Unit VII. AppendicesUtah Stream Team
Greenline
Vegetation CategoriesDeep Rooted Plants Shallow Rooted Plants
Bare Ground Sedges and
Rushes Shrubs and
Trees Grasses Forbes
Row 1: Record each observation as a slash mark in the appropriate box.
Row 2: Total # of observations for each category
Row 3: Total number of observations for the entire greenline (sum of all observations in Row 2):
Row 4: % of each category (divide row 2 values by total in row 3. Multiply by 100)
Row 5: Multiply each value in row 4 by this factor.
X 9
X 8 X 6 X 3
X 1
Row 6: Site score for each category
Total Site Score (add up all site scores in Row 6):
The higher your score the stronger your plant roots are and the more your stream banks will resist erosion.
Notes:
283

Unit VII. AppendicesUtah Stream Team
Canopy cover
“Miss” (Open sky) “Hit” (Vegetation)
At each step along green line, record with a slash whether you see a “miss” (open sky) or a “hit” (vegetation) in your ocular tube.
Total # of slash marks for each category
Total number of observations
% Canopy cover: Divide total “hits” by total observations and multiply by 100
The more “covered” area you have the more shading your stream receives (this keeps the water cool and provides food for aquatic organisms).
Ground cover
Transects Perpendicular to the Greenline
1
2
3 4 5 Category
Total
Percent of each category (divide category total by 75 and multiply by 100)
Live vegetation
Litter
Rocks
Bare ground
284

Utah Stream Team Unit VII. Appendices
Appendix 6. Overhead Masters
285

Utah Stream Team Unit VII. Appendices
286

line of maximum velocity
deposition
. erOSIOn
. erosion deposition
287
Utah Stream Team Unit VII. .Appendices

288 Utah Stream Team Unit VII. Appendices
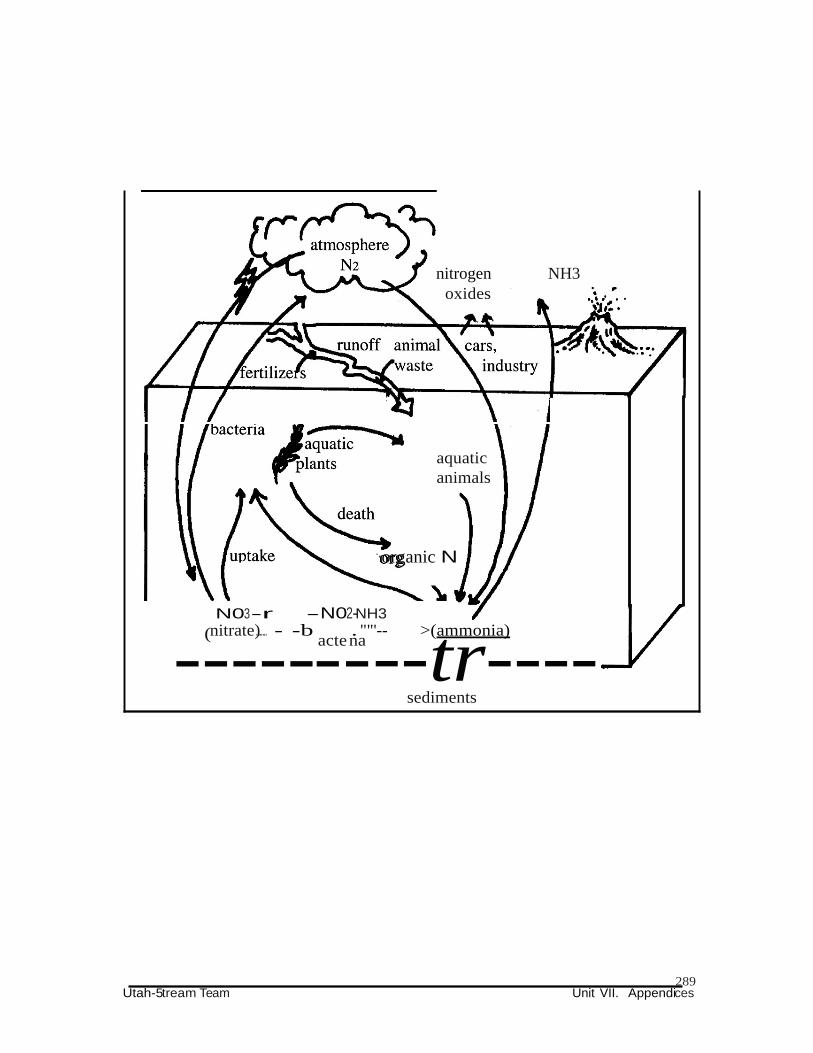
nitrogen NH3 oxides
aquatic animals
·organic N
N03-r -N02-NH3
(nitrate)........ - -b . ""'-- >(ammonia)
------acte-na
--tr---- sediments
289 Utah-5tream Team Unit VII. Appendices

Utah Stream Team Unit VII. Appendices
pH Scale Common substances Biological effects
Stomach acid 1
Lemon juice
2
Vinegar 3
Soda 4
All fish die
ACIDIC
Tomatoes Caddis and may flies die
Carrots 5
Normal rain Salmon eggs and alevin die
6 Bass and trout begin to die
Milk Snails and tadpoles begin to die
NEUTRAL 7
BASIC Human blood Optimum for most fish
Egg whites 8
Baking soda 9
10
Ammonia
11
Bleach 12
Lye 13
14
All fish die
290
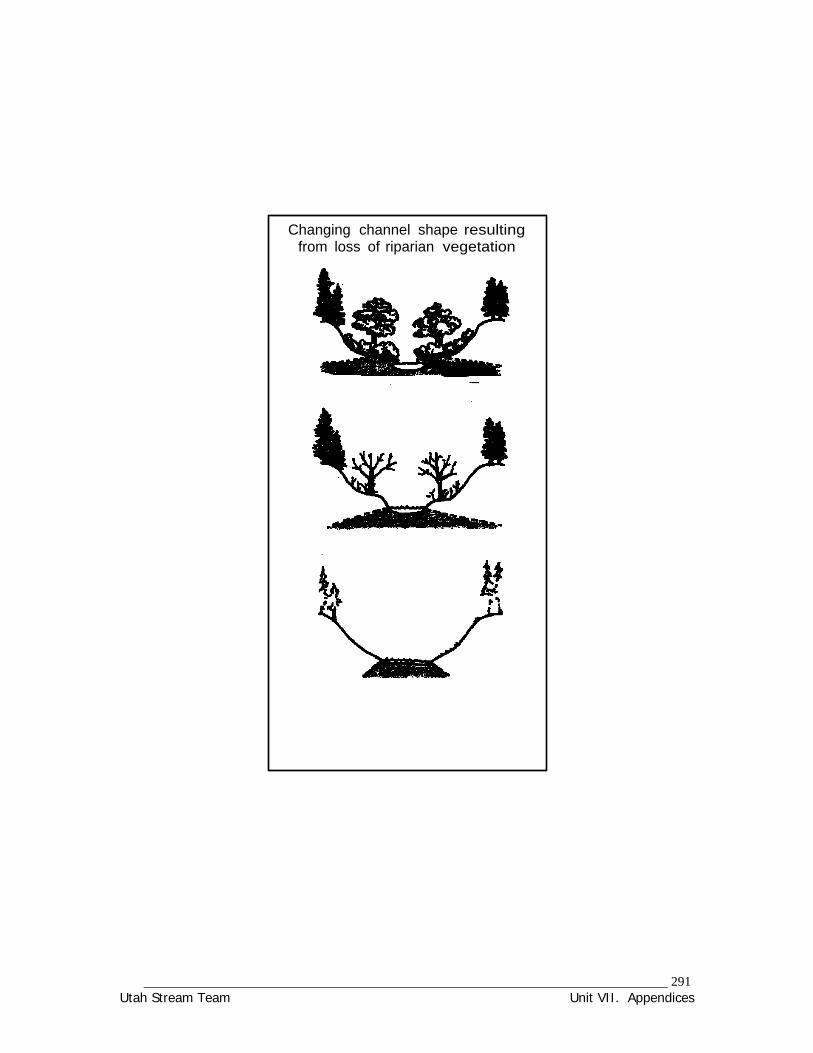
Utah Stream Team Unit VII. Appendices
Changing channel shape resulting from loss of riparian vegetation
291

Utah Stream Team Unit VII. Appendices
Temperature Scales Celsius Fahrenheit
Boiling point of water at sea level
38C (98.6 F) – average human body temperature Average room temperature Melting (freezing) point of ice (water) at sea level
-50C (-59F) – 2nd lowest recorded temperature
in continental US (near Logan, UT)
-67C (-89F) – lowest recorded temperature - Antarctica, July, 1983
100 90 80 70 60 50 40 30 20 10 0
-10 -20 -30 -40 -50 -60 -70 -80 -90 -100
212 194 176 158 140 122 104 86 68 50 32 14 -4 -22 -40 -58 -76 -94 -112
-130 -148
Converting Fahrenheit to Celsius Converting Celsius to Fahrenheit C = (5/9) x (F-32) F = [(9/5) x C] + 32
292

Utah Stream Team Unit VII. Appendices
293

Utah Stream Team Unit VII. Appendices
.,,
Macroinvertebrates in your stream
,..-'( ('"'·.,,,, ,,.., f ' .... ' ......
Springtail (jumper)
........,,.....,..""''''"''
Water penny (clinger)
Damselfly (climber)
Mosquito (floater)
Burrowing mayfly
(burrower)
Stonefly
(sprawler)
Water strider
(skater)
Provonsha in McCafferty, Aquatic Entomology, 1998: Jones and Bartlett Publishers, Sudbury, MA. www.jg[ub.com. Reprinted with permission
294

Utah Stream Team Unit VII. Appendices
Macroinvertebrate Life Cycle
Provonsha in McCafferty, Aquatic Entomology, 1998: Jones and Bartlett Publishers, Sudbury, MA. www.jg[ub.com. Reprinted with permission
D
295
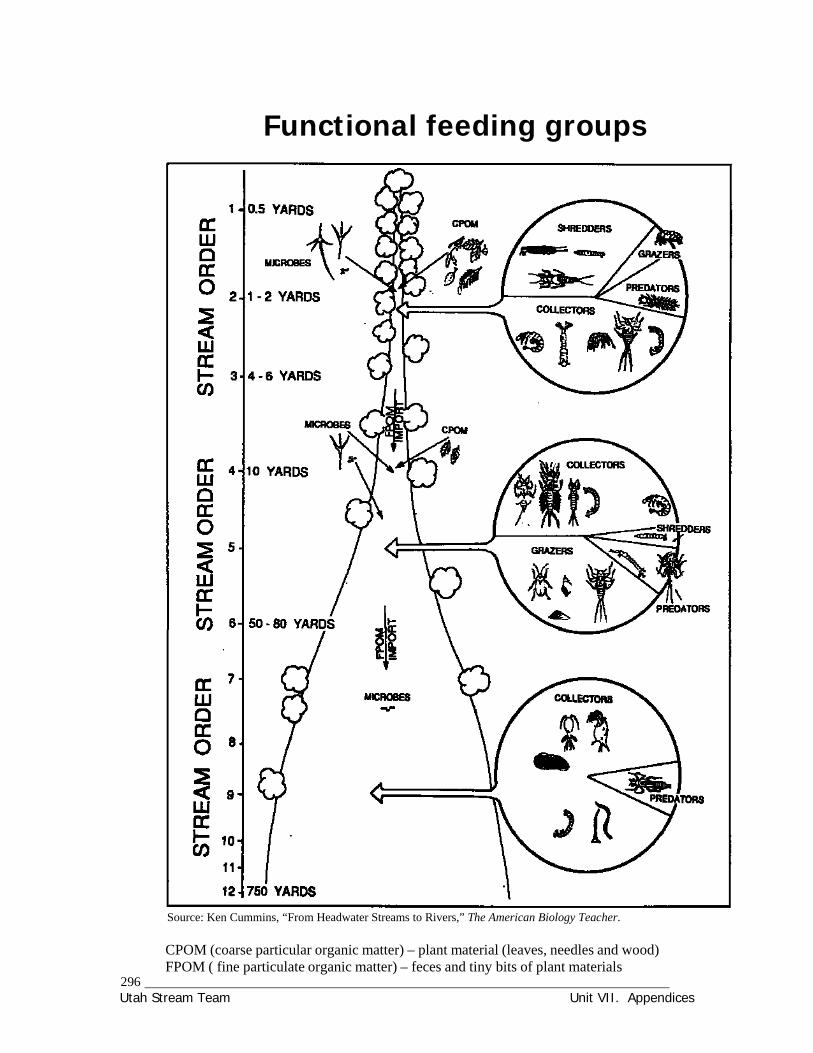
Utah Stream Team Unit VII. Appendices
Functional feeding groups
Source: Ken Cummins, “From Headwater Streams to Rivers,” The American Biology Teacher.
CPOM (coarse particular organic matter) – plant material (leaves, needles and wood) FPOM ( fine particulate organic matter) – feces and tiny bits of plant materials
296

Utah Stream Team Unit VII. Appendices
Vegetation Types
297
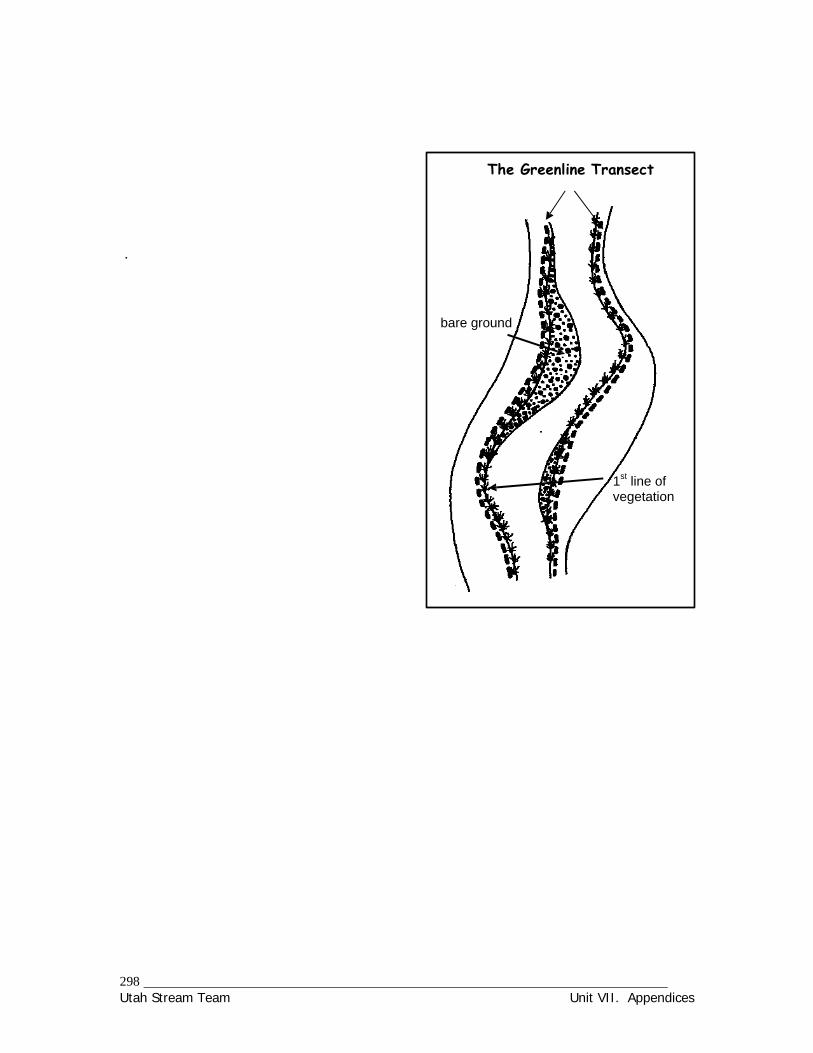
Utah Stream Team Unit VII. Appendices
The Greenline Transect
.
bare ground
1st line of vegetation
298

L
H
L
Figure Vl-2.1
Adapted from: Volunteer Monitor's Guide to Quality Assurance Project Plans
299
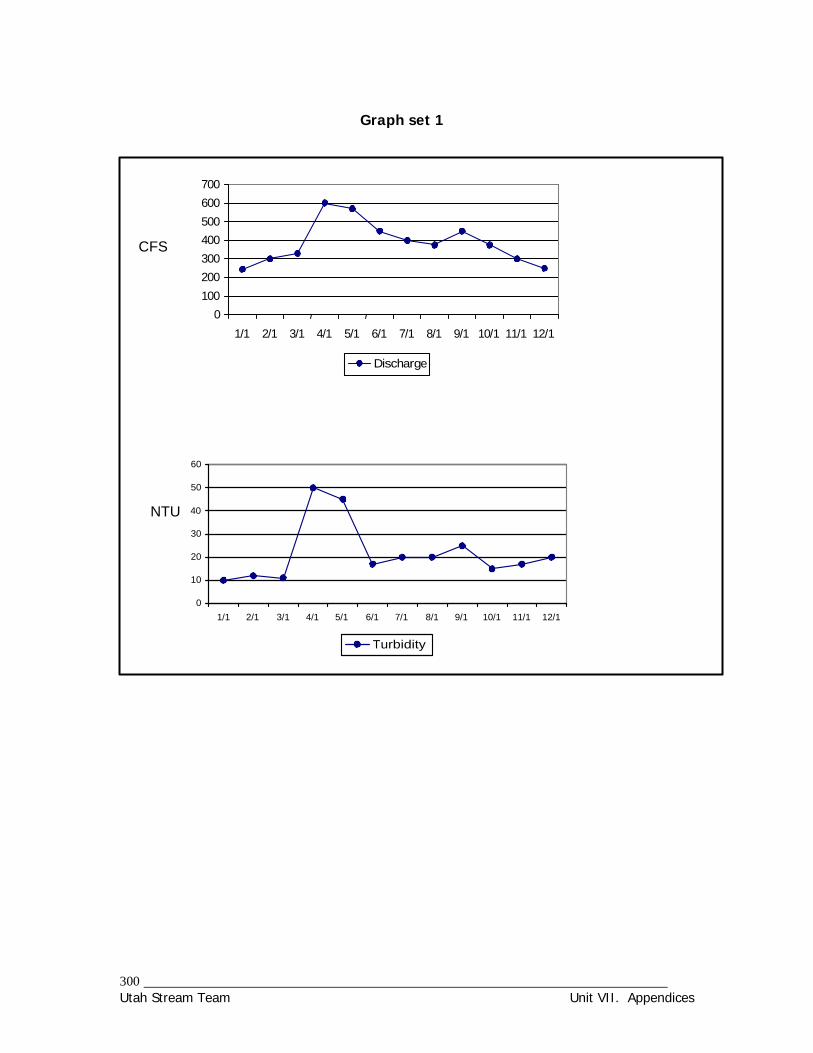
Utah Stream Team Unit VII. Appendices
Graph set 1
CFS
700
600
500
400
300
200
100
0
1/1 2/1 3/1 4/1 5/1 6/1 7/1 8/1 9/1 10/1 11/1 12/1
Discharge
60
50
NTU 40
30
20
10
0
1/1 2/1 3/1 4/1 5/1 6/1 7/1 8/1 9/1 10/1 11/1 12/1
Turbidity
300

Utah Stream Team Unit VII. Appendices
1/5
1/5
2/5
2/5
3/5
3/5
4/5
4/5
5/5
5/5
6/5
6/5
7/5
7/5
8/5
8/5
9/5
9/5
10/5
10/5
11/5
11/5
12/5
12/5
Graph set 2
10
8 pH
6
4
2
0
pH
mg/L
1.2
1
0.8
0.6
0.4
0.2
0
nitrate
1. and precise nature of the data points suggests sampling error is not a factor. Contact a water quality specialist to investigate further.
301

Utah Stream Team Unit VII. Appendices
Graph 3
10
9
8
mg/L 7
6
5
4
3
2
Dissolved Oxygen Concentrations 1/1 2/1 3/1 4/1 5/1 6/1 7/1 8/1 9/1 10/1 11/1 12/1
site 1 site 2 site 3
302

Utah Stream Team Unit VII. Appendices
303

Utah Stream Team Unit VII. Appendices
304

Utah Stream Team Unit VII. Appendices
Appendix 7. Funding Your Monitoring Program
305

Utah Stream Team Unit VII. Appendices
306

Utah Stream Team Unit VII. Appendices
Funding Your Monitoring Program
Why do we need funding? Funding presents one of the biggest obstacles to any field monitoring program. An on-going program needs money to purchase supplies and new equipment. Money also secures transportation which means more field time and better water quality assessments. Unfortunately, most school and community groups lack monetary support. This section will help you to overcome this obstacle by providing strategies and sources for obtaining funding.
Where do we obtain funding? Support for your program can come from many sources: fundraisers (sales, special events) grants (foundation, government, and corporate) solicitations (local businesses, community groups,
PTA, school board) partnerships (resource management agencies,
community groups, non-profit environmental organizations)
How do we obtain funding? Your available time, commitment, and resources will determine which of the previous sources, you target. Regardless of your approach, follow these general principles: Diversify! You will have more success if you
approach a variety of funding sources. Most funding sources like to give to new programs:
finding support for a continuing program will
The Utah Stream Team suggests monitoring groups obtain their own monitoring tubs. Tubs are available on loan for free (see “The Utah Stream Team Monitoring Kit,” section III-6). However, supplies are limited. Having your own tub allows you to monitor whenever you wish and to tailor your equipment to fit your specific monitoring objectives. For example, if you are interested in acidity levels, you may want to purchase a pH meter, which gives more accurate and precise measurements than pH strips provided by the Utah Stream Team.
prove more difficult. Since monitoring is, by nature, an ongoing process, you may try adding a new wrinkle to your program to attract interest.
If your data is benefiting someone – a land owner, municipality or agency – ask them to help share the cost.
Businesses are always looking for strategic ways to give away money and gain publicity. Monitoring programs make excellent recipients. Contact corporations with offices or stores in your town. When you approach them to ask for money, include ways you will recognize the company’s contributions.
Remember, in-kind support (equipment, volunteers, technical assistance, laboratory analysis, training) can be just as valuable as money, if not more so. A great many sources can be of help, including: natural resource management agencies, local government agencies, non- profit organizations, universities, community groups, and more.
Collaborate! Work with other teachers in your school, school district and beyond to create a watershed level approach to water quality monitoring. Integrated programs are more likely to receive funding than individual programs.
307

Utah Stream Team Unit VII. Appendices
Grantwriting Tips [adapted from: Nancy Light, “Proposal Writing Made Simple(r),” The Volunteer Monitor. 5(2) Fall 1993]
Believe in your program and your confidence will shine through in your application. Be honest. Know your grantmaker and tailor your request to the foundation’s specific interests. Follow proposal guidelines to a tee. Don’t limit yourself to environment-specific grants. Be creative in how you address grant
requirements. Define your water quality program precisely and concisely. You should be able to summarize
your program in one or two sentences. State very clearly the nature of the water quality problem and why you are addressing it. Leave
out the hyperbole. Tell the grantmaker how you are going to fix the problem (it does not necessarily need to be
fixed through monitoring). If you are monitoring, explain exactly what will be done with the data after you have collected it.
Provide a line-by-line budget if possible.
What are some specific funding sources? The organizations and programs described below provide consistent opportunities for obtaining money or in-kind support. Of course, these are but a few of the hundreds of potential funding sources available. Consult the next section “Grant Clearinghouses” for publications and web sites that list other state and national funding sources.
Cooperative Extension Service The Cooperative Extension Service is a national organization that seeks to extend research-based knowledge into the community. In Utah, that mission has included support for school monitoring programs. Extension provides in-kind support in the form of technical expertise, equipment, supplies and training. Contact your local Cooperative Extension Agent or the State Water Quality Coordinator Nancy Mesner, Extension Specialist, 435-797-2465, Fax: 435-797- 2443; E-mail [email protected].
Adopt-A-Waterbody This program coordinates the efforts of volunteer
Consider forming a relationship with a local
water treatment plant. Often, plants will run back-up tests of samples, analyze difficult parameters for you (e.g., bacteria), provide training, and give tours of the plant. In the process, students see another real-life application for water quality monitoring.
groups around the State to “adopt” portions of rivers, lakes, wetlands and groundwater. Adoption may include cleaning up, monitoring, mapping, educating, restoring and more. Small grants are made available to volunteer groups to help supply materials for their project. For more information about grants and a copy of the funding review criteria contact Shelly Quick, Utah Division of Water Quality, 288 N. 1460 W. SLC, UT 84116; 801-538-6516.
School Foundations Many counties, cities, and school districts in Utah have foundations who’s purpose is to support school programs. Support comes in the form of money, transportation, volunteers and in-kind
308

Utah Stream Team Unit VII. Appendices
support. Consult you local School District Office or Board of Education to locate a foundation in your area.
Toyota USA Foundation This foundation has a primary interest in K-12 math and science education programs which are broad in scope, incorporate interdisciplinary curricula, and have "real world" application. Schools may not directly apply to the Foundation but may be the recipient of an independent nonprofit agency's funding request. Grants are used to support the development and implementation of programs. Contact: Foundation Administrator, Toyota USA Foundation, A404, 19001 S. Western Ave., Torrance, CA 90509
Toyota USA also supports the Toyota TAPESTRY Grant Program which offers grants to K–12 science teachers. Grants are awarded in two categories: Environmental Education and Physical Science applications. The Environmental Education category funds projects that emphasize the efficient use of natural resources and protection of the environment. Students participating in these projects should gain an increased awareness of the terrestrial, aquatic, and/or atmospheric environment and an understanding of their own interdependence with the natural world. Contact: National Science Teachers Association, 1840 Wilson Boulevard, Arlington VA 22201-3000, 703-243-7100; www.nsta.org
Environmental Protection Agency - Environmental Education Grants The Environmental Education Grants program supports projects that enhance the public’s awareness, knowledge, and skills to make informed decisions that affect environmental quality. Any local or tribal education agency, college or university, state educational or environmental agency, nonprofit organization, or noncommercial educational broadcasting entity is eligible for these grants. The majority of grants are for under $5,000. To receive a solicitation of notice, mail a request, including your name, organization, address, and phone number, to: Environmental Education Grants – [year], U.S. EPA (A-107), 401 M Street, SW Washington, DC 20460
Chevron Corporation Grants Chevron currently focuses its giving in the areas of K-12 math and science education ($1.7 million in '98), and environmental conservation ($1.6 million in '98), with an emphasis on habitat preservation, wildlife protection, and environmental education programs. Contact: http://www.chevron.com/community/grants/main.html
American Honda Foundation Grants Grants are made for projects that focus on math, science, and environmental education. Eligibile groups include nonprofit organizations, K-12 schools and districts, education institutions, nonprofit scientific and education organizations. If the staff receive preliminary proposals a month before the deadline, they can provide feedback in time for applicants to make changes and still meet the deadline. Contact person: Kathy Carey, American Honda Foundation, 1919 Torrance Blvd, Bldg 100, Torrance, CA 90501 310-781-4090.
Resources to help you find grants The Catalog of Federal Domestic Assistance Programs (CFDA) - This government-wide compendium of all 1,424 federal programs, projects, services, and activities that provide
309

Utah Stream Team Unit VII. Appendices
assistance or benefits to the American public. These programs provide grants, loans, loan guarantees, services, information, scholarships, training, insurance, and more. http://aspe.os.dhhs.gov/cfda/index.htm
EE Link – One section of EE Link is devoted to helping teachers and administrators obtain funding for science and environmental education programs. You’ll find links to sites that offer strategies and techniques to develop funding for EE programs, and information on education- related grants that may be applicable to EE. http://eelink.net/grants-generalinformation.html
The Foundation Center – The Foundation Center, an independent national organization established by foundations, produces numerous publications on foundations and fundraising and also maintains library collections that are free to the public. To find out about Foundation Center publications, call 800-424-9836.
National Science Teachers Association (NSTA) – This web site offers dozens of national science education-related grants. Use the “search” option to find a grant that fits your program. www.nsta.org/
ScienceWise – This website has a user-friendly education and research funding search component. Check out Federal Opportunities for the latest grant opportunities available from U.S. federal agencies and Foundation & Corporate Opportunities for grant opportunities from private corporations. http://www.sciencewise.com/grantscontracts/
U.S. Department of Education (USDOE) – This USDOE web site provides information on current grants (applications available on-line) and grant-writing help. http://www.ed.gov/funding.html
Utah State Office of Education (USOE) / Planning and Project Services – Go to the Grant Requirements and Application Forms section of the USOE web site for up-to-date information on grants that are specifically available to Utah schools. www.usoe.k12.ut.us/data/grants.htm
Resources to help you write grants EPA Grant Writing Tutorial – This web-based software walks users through the grant-writing process and helps them learn to write more competitive grants. It has detailed information and tips on writing a grant proposal and completing a grant application package; sections on three EPA grant programs; examples of good, complete grant packages; and, a mock grant-writing activity. (available for download or on a CD-ROM); http://www.epa.gov/grtlakes/seahome/grants.html
Grant Funding for Your Environmental Education Program: Strategies and Options - By M. Archie. 1993, 30 pp. For those of us with limited resources, this book is packed with tips, advice, and resource suggestions to better target fundraising efforts and to hone proposal writing skills. Available via the NAAEE website - www.naaee.org/ - for $9 nonmember / $5 for NAAEE members.
“River Wealth” – This 40-page booklet produced by River Network contains ideas for more than 50 ways to raise money from local community sources. Most of the suggestions are illustrated by a specific example from a river protection group. Available for $7 (includes shipping) from River Network, P.O. Box 8787, Portland, OR 97207; 800-423-8747.
310
Utah Stream Team Unit VII. Appendices
The Volunteer Monitor – This bi-annual EPA publication addresses all aspects of water quality monitoring, including those specific to school and youth groups. Volume 5 (2), Fall 1993 focuses on Funding Your Water Quality Monitoring Program. You can find this issue on the internet. www.epa.gov/volunteer/spring97
Bibliography Bidlack, Cindy, and Robert Williams. “Grantwriting for Teachers,” The Volunteer Monitor. 5(2), Fall 1993.
Environmental Protection Agency. EPA Grantwriting Tutorial. http://www.epa.gov/grtlakes/seahome/grants.html no date available.
Fabisch, Sue. Personal Communication. July, 1999.
Green, Jack. Personal Communication. June, 1999.
Green, Linda, and Jeff Schloss. “Cooperative Extension Support for Citizen Monitoring,” The Volunteer Monitor. 5(2), Fall 1993.
Handley, Susan. “What Makes an Effective Fundraising Program?” The Volunteer Monitor. 5(2), Fall 1993.
Heacock, Craig. “Finding and Keeping Corporate Sponsors,” The Volunteer Monitor. 5(2), Fall 1993.
Light, Nancy. “Proposal Writing Made Simple(r),” The Volunteer Monitor. 5(2), Fall 1993.
311

Utah Stream Team Unit VII. Appendices
312

Utah Stream Team Unit VII. Appendices
Appendix 8. Purchasing Supplies
313

Utah Stream Team Unit VII. Appendices
314
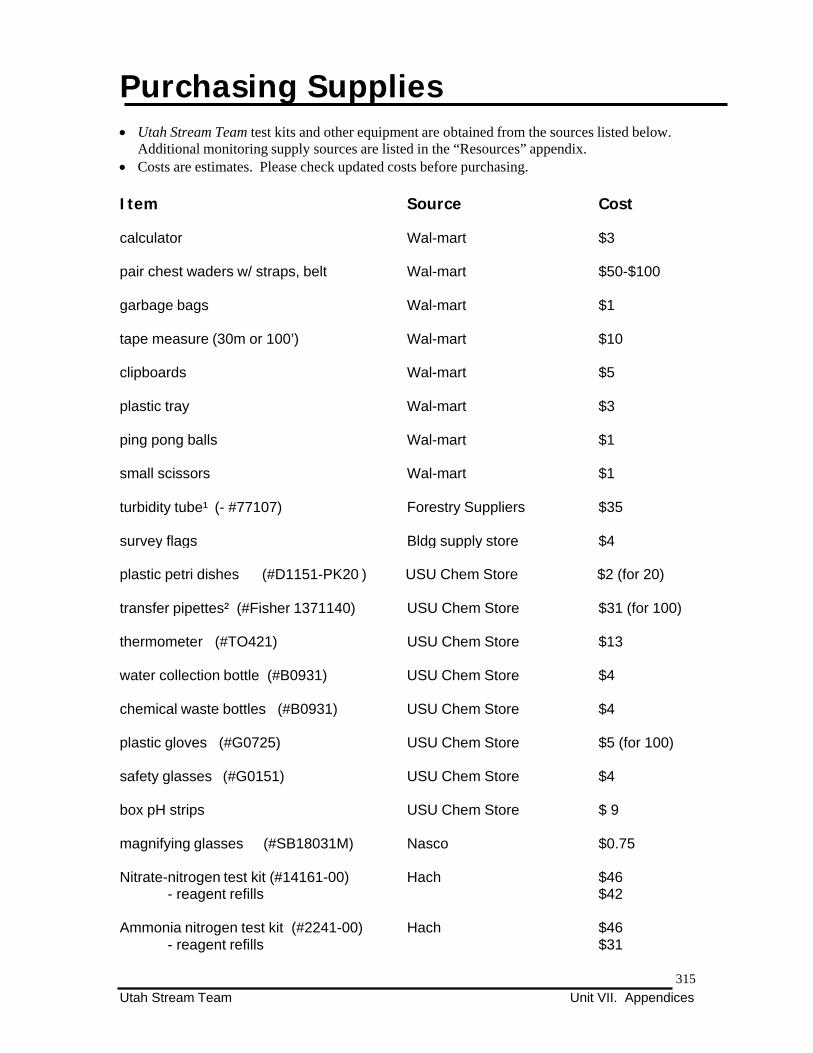
Utah Stream Team Unit VII. Appendices
Purchasing Supplies Utah Stream Team test kits and other equipment are obtained from the sources listed below.
Additional monitoring supply sources are listed in the “Resources” appendix. Costs are estimates. Please check updated costs before purchasing.
Item Source Cost
calculator Wal-mart $3
pair chest waders w/ straps, belt Wal-mart $50-$100
garbage bags Wal-mart $1
tape measure (30m or 100’) Wal-mart $10
clipboards Wal-mart $5
plastic tray Wal-mart $3
ping pong balls Wal-mart $1
small scissors Wal-mart $1
turbidity tube¹ (- #77107) Forestry Suppliers $35
survey flags Bldg supply store $4 plastic petri dishes (#D1151-PK20 ) USU Chem Store $2 (for 20)
transfer pipettes² (#Fisher 1371140) thermometer (#TO421)
USU Chem Store
USU Chem Store
$31 (for 100)
$13
water collection bottle (#B0931) USU Chem Store $4
chemical waste bottles (#B0931) USU Chem Store $4
plastic gloves (#G0725) USU Chem Store $5 (for 100)
safety glasses (#G0151) USU Chem Store $4
box pH strips USU Chem Store $ 9
magnifying glasses (#SB18031M) Nasco $0.75
Nitrate-nitrogen test kit (#14161-00) Hach $46 - reagent refills $42
Ammonia nitrogen test kit (#2241-00) Hach $46
- reagent refills $31
315

Utah Stream Team Unit VII. Appendices
Kit
Dissolved Oxygen test kit (#K-7512 ) Chemetrics $38 - reagent refills $19
Phosphate Test 3
(#PO-19) Hach $59 -reagent refills $18
kick net you make it $7
occular tube you make it --
macroinvertebrate ID key we will provide --
¹ Attach a string from the tube to the bottom rubber piece to keep from losing it. ² Snip the end of the pipette to make it larger. Opening should be ¼” wide. 3
Range 0 – 1 mg / liter
Contact Information
Hach Company PO Box 389 Loveland, CO 80539 800-227-4224 (ph) 970-669-2932 email: [email protected] web: www.hach.com
Forestry Suppliers, Inc. PO Box 8397 Jackson, MS 39284-8397 800-647-5368 (ph) 800-543-4203 (f) www.forestry-suppliers.com
Chemetrics Rt 28 Calverton, VA 20138 800-356-3072 (ph) 504-788-4856 (f) [email protected] http://www.chemetrics.com Nasco 4825 Stoddard Rd Modesto, CA 95356-9316 800-558-9595 (ph) 209-545-1669 (f) [email protected] http://www.nascofa.com
Utah State University Chemistry Stores Department of Chemistry and Biochemistry Widstoe Hall Room 129 Logan, UT 84322-0300 435-797-1616 (ph) 435-797-3390 (f)
316
Utah Stream Team Unit VII. Appendices
Appendix 9. Making Your Own Monitoring Equipment
317

Utah Stream Team Unit VII. Appendices
318

Utah Stream Team Unit VII. Appendices
Make Your Own Monitoring Equipment
Stadia Rod A stadia rod is used to take depth measurements in a stream channel. With this rod you can measure in both metric and English systems. You can also take length measurements in feet and tenths of feet at the same time. To measure, rest the rod on the bottom of the stream (do not dig in). Then read the depth on the downstream side of the rod (water piles up on the upstream side and will render a false measurement).
Materials - a 5 ft length of wooden dowel, rebar or PVC (¾ or ¼ in
diameter) - paint (red and white) / paint brush - measuring tape
Directions 1. Paint the rod in either metric or English units (or both).
Illustration: Holly Broome-Hyer
2. If you use English paint the rod with alternating 6 in long sections of bright red and white. Let dry. Then, paint black lines over the red and white, marking 0.1 foot intervals.
Occular Tube An occular tube is used to sample canopy cover – see “The Riparian Zone – Canopy Cover Directions,” section IV-4c. It is easy and cheap to make and easy to use.
Materials - 6 in of 1 in wide PVC or other tubing material - 2 paper clips - Duct tape
Directions 1. Cut a 6 in length of PVC. 2. Make 4 notches every 90 degrees on one end.
Illustration: Holly Broome-Hyer
3. Straighten paper clips and lay into notches. Bend excess length over the outside of the tube. 4. Duct tape around the ends of the paper clips to hold them in place. 5. Duct tape over the edges of the viewing end of the tube to make a smooth surface.
319

Utah Stream Team Unit VII. Appendices
Staff/Crest Gauge [source: Ken Pritchard, Vol Monitor, 7 (2), Fall 1995] This combination gauge serves as both a staff gauge to measure the water level of a stream at the time of inspection, and a crest gauge to measure the highest level reached by that stream between the last inspection and the current inspection.
By taking successive staff and crest gauge readings and plotting them on a time graph, you can obtain a general picture of how a stream behaves in response to rain. For instance, a rapid rise and fall in stream level would denote the watershed’s inability to slowly release water (probably due to a lack of vegetation). Long-term trends can also show a correspondence between stream levels and land use changes. For example, the data might show that runoff from a new shopping center has caused the stream to crest several inches higher after receiving the same amount of precipitation.
You can correlate your crest gauge readings (ft) to flow readings (CFS). Then, in the future, you will be able to determine stream flow based soley on your crest gauge readings.
Materials - 6 ft fence post or rebar - PVC pipe, 1in diameter (or wider), 4 or 5 ft
long (length depends on anticipated change in stream level)
- 2 end caps for the PVC pipe - 2 or 3 metal clamps or U-bolts - Section of 2 in x 2 in wood, (about the same
length as PVC pipe) - Wooden dowel, ¼ in to ½ in diameter, to fit
inside PVC pipe - Granulated cork - Permanent, waterproof marker - Tape measure - Drill - Saws for cutting pipe and wooden dowel
Directions 1. Permanently mark 2 in x 2 in in 1/4 in increments. (Alternative: affix length of measuring
tape to 2 in x 2 in.) 2. Glue end cap to bottom of PVC pipe. Drill three or four vent holes in section of pipe that will
always be immersed in water. This will allow water to flow into pipe. Drill one vent hole near top of pipe, to allow air to escape.
3. Drive fence post or rebar into streambed in a location where water flows permanently and where you will be able to reach the gauge without getting wet.
4. Attach 2 in x 2 in to fence post or rebar using clamps or U-bolts. 5. Attach PVC pipe to 2 in x 2 in, aligning bottom of pipe with zero point marked on 2 in x 2 in. 6. Cut dowel to same length as PVC pipe (dowel should fit snugly so it won't float). Place dowel
and granulated cork inside PVC pipe. Place end cap (DO NOT GLUE) on top end of pipe.
Calibrating the crest gauge Calibrate the gauge by measuring the difference between the lowest point on the stream bed and the zero point on the scale marked on the 2 in x 2 in. (Note that the lowest point on the stream bed
320

Utah Stream Team Unit VII. Appendices
won't necessarily be the point where the gauge is located, but it must be along the same cross section.) This "depth-of-stream factor" must always be added to the gauge readings. Recalibrate the gauge yearly, and also after severe episodes of erosion or deposition.
Reading the crest gauge To read the crest gauge, remove the top end cap and take out the dowel. Use the scale on the 2 in x 2 in to measure the level of the cork powder "ring." Don't forget to add the depth-of-stream factor (see "Calibration," above). After taking the reading, wipe off the cork powder and replace the dowel. Occasionally you may need to add more cork powder.
[For more information, contact Ken Pritchard, Special Projects Coordinator, Adopt a Beach, P.O. Box 21486, Seattle, WA 98111; 206-624-6013.]
Kick Net Kick nets, which consist of screening material stretched between two poles, are used for sampling macroinvertebrates. Sampling is done by pushing the two poles into the substrate until the edge of the screen rests on the bottom. Organisms are dislodged by disrupting the substrate on the upstream side of the stream, allowing them to be carried by the current into the screen. For more information on sampling with a kick net, refer to “Macroinvertebrate Sampling Directions,” section IV-4b.
Materials - two 3 ft x 1.5 in sections of wooden dowel - one 3 ft x 2 ft section of metal window screen - duct tape - staple gun
Illustration: Holly Broome-Hyer
Directions 1. stretch window screen length-wise between dowels 2. attach window screen to dowels with staples and duct tape (wrap as much screen around
dowel as possible to properly secure it)
Hester-Dendy sampler A Hester-Dendy sampler is a fancy word for “bug hotel.” Aquatic macroinvertebrates will colonize the spaces between the rough-textured plates of the sampler. Anchor the sampler to the bottom of the stream or suspend in the water column (different placements will attract different populations). Allow at least 4 weeks to attract a sizable population. Wrap a fine mesh bag around the sampler when you remove it to investigate. This will catch any macros that float off of the squares. Also, remember to flag your sampler so you can find it later.
Illustration: Holly Broome-Hyer
321

Utah Stream Team Unit VII. Appendices
Materials - 8 large plates (made of wood, cement, unglazed porcelain or anything rough and durable)
about 3 in square and 1/8 in thick. - 7 smaller plates should be about 1in square and ¼ in thick. - 1 eye bolt 6 in long - 20 washers - 2 nuts - bailing wire (or similar wire) - drill
Directions 1. Drill a hole through the middle of each plate the size of your eye bolt and washers. 2. Stack plates on the eyebolt and separate with washers. Place larger plates on bottom. Using
the washers, vary the space between plates to provide for different habitats. 3. Secure the plates in place with a nut. 4. Using the bailing wire, anchor the sampler to the bottom substrate or suspend from above.
Remember to flag the sampler to help you relocate it.
Secchi Disc The Secchi disc is used to measure light penetration which tells us the level of turbidity in the water. Secchi discs work well for still bodies of water like lakes, wetlands and pools in streams. Slowly lower the disc into the water until it disappears; record this depth. Then, pull it back up until it is barely visible; record this depth. Average two measurements. This should be done in a shady area if possible.
Materials - a lid from a ½ gallon paint can (or similar-size, stiff lid) - black and white paint - 6 ft of ½ in line - drill
Directions 1. paint the lid, in alternating quarters, black and white 2. drill a hole through the middle of the lid 3. attach the line through the hole with knots
Underwater Viewer An underwater viewer allows you to see what’s happening under the surface with surprising clarity. In shallow riffle areas the viewer works well for investigating substrate and macroinvertebrate habitat.
Materials - plastic ½ gallon milk jug - thick plastic wrap
322
Illustration: Holly Broome-Hyer
Illustration: Holly Broome-Hyer

Utah Stream Team Unit VII. Appendices
- heavy rubber bands
Directions 1. Cut off the top of the jug leaving the handle 2. Cut off the bottom of the jug 3. Wrap a piece of plastic wrap over the bottom of the jug, making sure there are no wrinkles.
Secure the wrap to the jug with the rubber bands.
Using the underwater viewer Press the viewer down into the water making sure not allow the water to rise over the rubber bands. Hold the handle and look through the top opening. The water slightly magnifies the objects you will see.
Resources for Further Investigation Water Quality Sampling Equipment and Homemade Sampling Equipment by theTennessee Valley Authority, 1988. Two 16-page booklets, designed to be used as a set. The first describes professional sampling equipment and tells how to obtain it; the second contains instructions for making low-cost facsimiles of the same equipment (Secchi disks, plankton samplers, artificial substrates, nets for macroinvertebrate sampling, and more). Contact: Carol A. Davis, 311 Broad St., Chattanooga, TN 37402-2801; 615-751-7338. Free (one set only).
323

Utah Stream Team Unit VII. Appendices
324

Utah Stream Team Unit VII. Appendices
Appendix 10. Monitoring in the Classroom
325

Utah Stream Team Unit VII. Appendices
326

Utah Stream Team Unit VII. Appendices
Monitoring in the Classroom
This section will help you to create a rewarding classroom monitoring experience If possible, combine your classroom monitoring with a field experience. If not, students lose an opportunity to connect with their local stream – to experience the beauty and complexity of a natural water body – and to see how scientific information is gathered in the field.
How do we monitor in the classroom? The following are four approaches you can take to monitor in the classroom.
1. Water samples from your local stream can be brought back to the classroom for sampling. Classes without access to a water body will welcome this opportunity as will classes who wish to augment their field experience with additional monitoring. See “How do we sample water from the field?” which follows.
2. Classes can sample water brought in from various sources around the community (a pristine mountain stream, water near industrial, municipal or construction sites, ponds and lakes, anywhere you wish to sample from). These waters can be sampled periodically to assess changes over time or they can be compared with one another. See “How do we sample water from the field?” which follows.
3. Water samples with known concentrations of chemicals (common household substances or prepared samples) can be measured. Usually, classes sample in this manner in order to practice their sampling techniques or to perform controlled water quality experiments. Rely on the lesson plans found in the “Background Information” sections for each chemical parameter to help you design your experiments.
4. Classes can create aquariums as a way to perform on-going monitoring experiments that involve living, dynamic systems. Aquarium monitoring can be a simple or complex task, depending on your objectives. Detailed information on aquarium monitoring can be found at the end of the Classroom Monitoring section.
How do we sample water from the field? Sampling water from your local stream or other areas of your community and watershed is a great way to connect the classroom with the outside environment. However, there are special considerations you must account for with each sampling parameter.
General Stream Survey A General Stream Survey, section V-1, cannot be made from the classroom. However, students can complete the survey in one, short visit to the stream. Also, if you (the teacher) bring the samples in from your local stream you can perform the survey and then share the results with your class. This information will be helpful when interpreting the results of your classroom monitoring.
Stream Flow Stream flow, V-2B, cannot be measured from the classroom. However, you can obtain this information from outside sources, such as the U.S. Geological Survey (see to the “Resources” section for contact information).
Stream Shape Stream shape, V-2C, cannot be measured from the classroom. If you make only one visit to your stream, have students measure stream shape. It should not change much over a year’s time. You can also obtain
327

Utah Stream Team Unit VII. Appendices
aerial photos of your stream from your local Soil Conservation District office (see the “Resources” appendix for contact information).
Turbidity Turbidity, section V-2D, can be measured accurately in the classroom within 24 hours (if you wait longer algae may begin to grow and increase turbidity). Fill a large bucket with water from the field and bring it back to the class. Stir the bucket thoroughly to re-suspend the material in the water. Then, pour the water into a turbidity tube and record your measurement (just as you would in the field).
Temperature The temperature, section V-2E, of your stream water will probably change considerably when you bring it from the field to the classroom. Take a minute to record temperature when you collect your water samples.
Nitrogen (nitrate, ammonia) Nitrogen, section V-3D, can be measured in the classroom. Sample within 48 hours to obtain an accurate concentration. Your sample must be kept cool and dark from the time you collect until the time you sample (a cooler with ice or a refrigerator works well).
Phosphorus Phosphorus, section V-3D, can be measured in the classroom. Follow the same procedures outlined for nitrogen.
pH The pH of your stream water will probably change from the time you collect it until the time you sample in the classroom. Measure pH in the field when you collect your water samples.
Dissolved Oxygen (DO) DO concentrations will change considerably from the field to your classroom. Sample DO yourself when collecting the water samples or obtain values for your water body from the Utah Division of Water Quality (see the “Resources” appendix for contact information).
Macroinvertebrates Macroinvertebrates can be brought into the classroom and studied. Place them in a large container of water (5 gallon bucket) so the water remains cool and DO concentrations remain high. If you wish to keep them for an extended period, place an aquarium “aerator” in their container to maintain DO concentrations.
328

Utah Stream Team Unit VII. Appendices
Aquarium monitoring Monitoring aquariums provides unique opportunities to perform hands-on scientific investigations. In a controlled, accessible environment you can investigate water chemistry, aquatic food chains, water quality–plant interactions, sampling techniques and much more. These variables can be isolated and exaggerated in experiments to help you better see and understand science concepts.
How do we design a scientific investigation using aquarium monitoring? There are many ways to perform scientific investigations using aquarium monitoring. This section outlines a fairly basic approach. Think how you might modify this activity to fit your group’s specific interests and objectives.
Overview By using classroom aquariums you can create different aquatic environments (ex. a turbulent environment, a heavily vegetated environment, an environment with critters). Demonstrate and measure the effects of changes in water quality (ex. high pH) in each aquarium. Materials you may need [] aquariums (this is your classroom stream) [] stream water (to better mimic the field environment) [] substrate from your stream (for aquatic plants and animals to live in) [] aquatic plants (from your stream or pet store) [] aquarium oxygenators (to maintain oxygen levels) [] Utah Stream Team Materials Tub (for sampling kits) [] Utah Stream Team Manual (to help you research your investigation and to provide sampling directions) [] measuring devices and eye droppers (to add specific amounts of chemicals/materials) [] one fish net (to transfer critters) [] timer or watch (to make precise measurements) [] aluminum foil (to cover aquaria from light when necessary) [] fish or other stream critters (see “Be Respectful” at the end of this section).
Procedure
Aquariums can be… - Standard “pet store” aquariums (nice but expensive) - Glass bowls (also available at pet stores) - One gallon glass jars - Plastic tubs - Whatever you can find * Make sure you sterilize your aquarium with boiling water before adding components.
Sample pH in the morning and at night to see changes that result
1. Use the Utah Stream Team manual, other reference materials, and your field experiences to determine which aspects of water quality you would like to examine. Develop a guiding question(s) based on your research to structure the investigation. For example; “How will different pH levels affect the growth of aquatic vegetation?” 2. Divide students evenly into groups. Each group will maintain one aquarium. 3. Divide a sample of stream water evenly among the aquariums. Each aquarium should contain at least one gallon. These samples are called “split” samples; they have all come from the same source and are stored and treated in the exact same way throughout the experiment (except for the variables applied to each). Important: Sample your water in the field when you collect it. Then, sample again immediately after you have set up
from the photosynthetic activity of aquatic plants. Nitrate levels in aquariums will rise over time as fish and other aquatic life convert food into waste. This presents a great opportunity to monitor changes over time. Why do nitrate levels continually rise in an aquarium but not in a well-functioning pond? Place aquatic plants in your aquarium to find your answer.
329

Utah Stream Team Unit VII. Appendices
your experiment. These initial measurements will serve as benchmarks to assess future changes. They will also ensure that each split starts with the same water quality. 4. To each container add the variables (e.g. acids and bases to raise and lower pH) you wish to experiment with. Make no changes to the control aquarium. A control sample, which has no experimental influences or variables applied to it, will be the standard of comparison for the other samples. Changes may occur in the control aquarium but they should not be due to any experimental activities. 5. Sample as often as you need to in order to track changes. Record and chart your information. A dry- erase or chalk board near the aquariums allows all students to see changes occurring in each aquarium. 6. Refer to “Ilustrating Your Data,” section V-1, and “Reflecting On Your Data,” section V-2, sections of this unit for help processing your activity.
How can we replicate real-life conditions in an aquarium? Real-life influences, both human and natural, are described in the Utah Stream Team manual for each sampling parameter (see Unit IV). The Dissolved Oxygen chart below provides examples of how to replicate these influences in your aquarium.
Dissolved Oxygen (DO)Natural Influence Classroom Equivalent Water Temperature Use lamps, shading, fans or other devices to affect aquarium water temperature.
Higher temperatures will decrease DO concentrations. Hint: Use real plants to mimic shading that would come from riparian vegetation.
Aquatic Vegetation Place different amounts of aquatic vegetation in each aquarium. More vegetation will increase DO concentrations (until it dies; the effects will then be reversed). Hint: Start with the same amount and type of vegetation in each aquarium. Use nutrients (fertilizer) to create different amounts of vegetation. Sample the different DO levels that result. This will demonstrate how different water quality parameters influence each other.
Turbulence Vary the amount of turbulence using an oxygenator or mechanical device (a small propeller). Turbulent water, like riffles, are more oxygenated than still areas, such as pools.
Human Influence Classroom Equivalent Organic wastes Add different amounts of decayed material, such as manure, to the aquarium.
Bacteria multiply and use up oxygen during decomposition. Hint: Increase water temperatures to enhance the decomposition process and rate of DO depletion.
Land uses Using plants, differ the amount of shading each tank receives to see effects on water temperature and DO. This will mimic effects of loss of riparian vegetation. Add salt to mimic runoff from nearby salted roads. Add fertilizer to mimic runoff from lawns and agricultural areas.
What else should we know about classroom monitoring? Be realistic You can exaggerate variables (e.g. add extreme amounts of nutrients) to illustrate a point. However, students should be well aware of the amounts of material added to the aquarium relative to amounts that would be added in a real stream. To help students gain a better understanding of the relative amounts of pollutants affecting streams have them measure out the pollutants themselves and add. Refer to “A Drop in the Bucket,” found in the “Water Pollution” section, for help determining realistic amounts of pollutants.
330

Utah Stream Team Unit VII. Appendices
Know what you are monitoring Nature is highly variable. Numerous factors besides “chemical pollution” affect the health of a stream or the aquatic species within. For example, most aquatic plants would die in drinking water due to lack of nutrients. It would be an error to interpret the water quality as “polluted by chemicals” because the plant died (the water was not polluted, only lacking nutrients). Make sure you know specifically what you are sampling for: Are you trying to determine whether the water is polluted by chemicals or that it can support plant life? Then, make sure you isolate the variable that you are testing: in this example, a lack of nutrients clouded the chemical pollution assessment. Connect with the field Use classroom activities to introduce or reinforce field work. For example, if you monitor the pH of your stream you probably want to investigate natural influences on it. If you read through “pH,” section IV-3b, you will find that the photosynthetic activity of aquatic vegetation raises pH. Set up your aquariums with different amounts of vegetation and monitor the effects on pH. Ask your class: “How would our stream be affected if it had these different amounts of vegetation in it?” “How would the resulting pH levels affect the aquatic life in our stream?”
Be respectful The Utah Stream Team strongly advocates against harming fish or other aquatic animals in your aquariums by “experimenting” with them. If you use live critters, then your monitoring should focus on maintaining a healthy environment for them.
Resources for further investigation Aquatic Habitats: Exploring Desktop Ponds, by Katharine Barrett and Carolyn Willard. In this unique series of life-science activities for grades two through six, student groups set up and observe living, desktop models of a pond. Over a period of weeks, each group studies and adds one type of organism at a time to a small tank, transforming the containers into aquatic habitats. As the model ponds develop and change over time, students discover firsthand some of the complex interactions within a typical pond ecosystem. Contact: http://www.lhs.berkeley.edu./GEMS/GEMaquatic.html
“A Constructed Wetland,” by Dan Kowal. The Green Teacher. Spring-Summer 1998, Issue #55. pp. 28-31. This article details how a Colorado school’s water quality monitoring project evolved into an experiment using constructed wetlands to treat toxic mine runoff. You’ll find information on mines, the filtering effects of wetlands, and instructions on how to build your own schoolyard wetland. Take classroom monitoring one step further! Note: This article is part of a larger issue on environmental monitoring (an excellent resource for any volunteer water quality monitor). Contact: http://www.web.ca/~greentea/
“Freshwater Studies Using Cattle Drinking Troughs,” by Roger Lock and Nigel Collins. Journal of Biological Education, v.30, Autumn 1996, pp. 166-168. Cattle troughs are relatively cheap and very effective for studying a variety of water quality parameters. This article will inform and inspire you to develop a trough pond on your own school grounds.
“Keeping Classroom Aquaria – A Simple Guide for the Teacher.” Project Wild Aquatic Education Activity Guide. pp.213-216. This short, to-the-point guide will get you started with a classroom aquarium. You’ll find an equipment list, directions for making your own aquarium and tips on caring for animals. The rest of the activity guide is full of hands-on activities to support your water education and water quality monitoring program. Contact: Project Wild, 707 Conservation Lane, Suite 305, Gaithersburg, MD 20878, 301-527-8900 (p), 301-527-8912 (f), email: [email protected], web: www.projectwild.org
331

Utah Stream Team Unit VII. Appendices
Trout in the Classroom – This extensive web site provides all the information you need to operate a classroom fish hatchery. You’ll find curriculum materials, background information, life cycle and identification charts, and numerous links to fish hatchery resources. There is even a chat section to share information with other classrooms around the nation. Contact: http://www.newberg.k12.or.us/EY/HTML/trout.html
Bibliography Barrett, Katherine and Carolyn Willard. Aquatic Habitats: Exploring Desktop Ponds. GEMS. Berkely, CA. 1993
Hershey, David R. “Evaluation of Irrigation Water Quality,” The American Biology Teacher. 55(4), April, 1993.
LaMotte Company. The Pondwater Tour. LaMotte Company Chestertown, MD, no date.
Western Regional Environmental Education Council (WREEC). “Keeping Classroom Aquaria – Simple Guide for the Teacher,” Aquatic Project WILD. Project WILD. Boulder, CO. 1987. pp. 213-215.
332

Utah Stream Team Unit VII. Appendices
Appendix 11. Conversion Charts
333

Utah Stream Team Unit VII. Appendices
334

Utah Stream Team Unit VII. Appendices
Conversion Chart
If you know Multiply By To get To get Divide By If you know
Length
inches (in) 2.5 centimeters (cm) feet (ft) 30.0 centimeters (cm) yards (yd) 0.9 meters (m)miles (mi) 1.6 kilometers (km)
Area square inches (in²) 6.5 square centimeters (cm²) square feet (ft²) 0.093 square meters (m²) square yards (yd²) 0.84 square meters (m²) square mile (mi²) 640.0 acres (acre)acre (acre) 43,560 square feet (ft²) acre (acre) 4,047 square meters (m²) acre (acre) 0.405 hectacres (ha)
Mass ounces (oz) 28.35 grams (g) pounds (lb) 0.45 kilograms (kg)
Volume teaspoons (tsp) 5.0 mililiters (ml) tablespoons (tbs) 15.0 mililiters (ml) fluid ounces (fl oz) 30.0 mililiters (ml)cups (c) .24 liters (l)pints (pt) .47 liters (l)quarts (qt) 0.95 liters (l)gallon (gal) 0.134 cubic feet (ft³) gallon (gal) 3.79 liters (L)cubic feet (ft³) 0.03 cubic meters (m³) cubic feet (ft³) 28.32 liters (L) acre-feet (af) 1.234 thousand cubic meters (m³x10³)acre-feet (af) 325,850 gallons (gal) acre-feet (af) 43,560 cubic feet (ft³)
Flow cubic feet per second (cfs) 0.03 cubic meters per sec (m³/s)cubic feet per second (cfs) 1.98 acre-feet per day (af/day) cubic feet per second (cfs) 448.8 gallons per minute (gpm) cubic feet per second (cfs) 646,320 gallons per day (gpd)
Temperature degrees Celsius (C°) (9/5 x °C) + 32 degrees Fahrenheit (°F) degrees Fahrenheit (°F) 5/9 x (°F – 32) degrees Celsius (°C)
Other water equivalents 1 cubic foot (ft³) = 7.48 gallons (gal) = 62.4 pounds of water (lb/ft³) 1 cubic foot per second (cfs) flowing for one year = 724 acre-feet (af) 1 gallon (gal) = 0.134 cubic feet = 8.34 pounds of water (lb/gal) 1 acre-foot = one and a half football fields 1 foot deep 1 acre-foot = a typical garden hose (5 gpm) flowing continuously for 45 days 1 acre-foot = approximately 3,475,700 12 oz. cans of soda
335

Utah Stream Team Unit VII. Appendices
336

Utah Stream Team Unit VII. Appendices
Appendix 12. Glossary
337

Utah Stream Team Unit VII. Appendices
338
Utah Stream Team Unit VII. Appendices
Glossary
For a more extensive listing of water quality definitions check out the Nevada Division of Water Planning’s Water Words Dictionary at: http://www.state.nv.us/cnr/ndwp/dict- 1/waterwds.htm.
Accuracy - A measure of how close repeated trials are to the desired target. Acid – Any substance that has a pH level below 7, or that has more free hydrogen ions (H+)
than hydrogen ions. Acidity - A measure of the number of free hydrogen ions (H') in a solution that can chemically
react with other substances. Acre-foot – (AC-FT) is the quantity of water required to cover 1 acre to a depth of 1 foot and is
equal to 43,560 cubic feet or about 326,000 gallons or 1,233 cubic meters. Adaptation - The modification, over time, of the structure, function, or behavior of an
organism, which enables it to be better suited to its environment. Adhesion – The attraction of water molecules to other materials as a result of hydrogen bonding. Aerobic – Able to live only in the presence of air or free oxygen; conditions that exist only in the
presence of air or free oxygen. Alkalinity - A measure of the negative ions that are available to react and neutralize free
hydrogen ions. Some of most common of these include hydroxide (OH-), sulfate (SO), phosphate (POQ), bicarbonate (HCO') and carbonate (COQ).
Ambient - Pertaining to the current environmental condition. Ammonia - A highly water-soluble, gaseous compound, NH3, usually produced by the direct combination of nitrogen and hydrogen gases. Anaerobic – Able to live and grown only where there is no air of free oxygen; condition that
exist only in the absence of free air and free oxygen. Aquarium – A man-made aquatic environment. Aquatic zone – The area of the stream channel covered by water. Aquifer – A geologic formation, or group of formations, or part of a formation that contains
sufficient saturated permeable material to yield significant quantities of water to wells and springs.
Assemblage - The set of related organisms that represent a portion of a biological community (e.g., benthic macroinvertebrates).
Atmosphere – The layer of gases surrounding Earth; composed mainly of nitrogen and oxygen. Backwaters – Areas of water to the side of a main stream channel usually formed by flooding. Bacteria – Microscopic unicellular organisms, typically spherical, rod-like, or spiral and threadlike in shape, often, clumped into colonies. Some bacteria cause disease, while others perform an essential role in nature in the recycling of materials; for example, by decomposing organic matter into a form available for example, by decomposing organic matter into a form available for reuse by plants. Bar graph - A graph using parallel bars of varying lengths, as to illustrate comparative data. Base flow – The portion of the stream flow that is relatively consistent throughout the year. Basic – Alkaline. Basic water contains high concentrations of hydroxyl ions (OH-). Bed material – The rock, sediment and organic matter that comprises the bottom of a stream
channel. Beneficial use – The legal, designated uses for a water body including, drinking, recreation, fish
and wildlife, etc. Water quality standards are designed to support a water body’s beneficial use(s).
Benthic - Pertaining to the bottom (bed) of a water body. Biochemical oxygen demand (BOD) – A measure of the quantity of dissolved oxygen, in
milligrams per liter, necessary for the decomposition of organic matter micro-organisms, such as
339

Utah Stream Team Unit VII. Appendices
bacteria. Biodiversity – A measure of the distinct characteristics, qualities, or elements of plant and animal
life in a defined area; a measure of biological differences. Biological integrity – The condition of the aquatic community inhabiting unimpaired water
bodies as measured by community structure and function. Buffer – To maintain high pH levels. Alkaline soils keep the pH of water from getting too low. Capillary action – Forces of adhesion and cohesion help water to move through the soil from areas of greater concentration to areas of lesser concentration. Cause – The producer of an effect. Channel - The section of the stream that contains the main flow. Channelization - The straightening of a stream; this often is a result of human activity Climate – The meterological element, including temperature, precipitation, and wind, that characterize the general conditions of the atmosphere over a period of time at any one place or region of the Earth’s surface. Earth has three climate zones: polar, temperate, and tropical. Climate zones are further classified into ecosystems and biomes. Cobble - Medium-sized rocks (2-10 inches) that are found in a stream bed. Cohesion – The attraction of water molecules to each other as well as a result of hydrogen
bonding. Collectors – Macroinvertebrates that collect bits of food from the water column. Community - The whole of the plant and animal population inhabiting a given area. culvert –
man-made construction that diverts the natural flow of water. Comparability – The degree to which we can compare data between dates and locations. Concentration – The amount of a specific substance dissolved in a given amount (volume) of another substance. Condensation – The process by which a vapor becomes a liquid; the opposite of evaporation. Confined aquifer – A water-saturated layer of soil or rock that is bounded above and below by impermeable layers. Contaminant – Any substance that when added to water (or another substance) makes it impure
and unfit for consumption or use. Control - A standard for comparing, checking, or verifying the results of an experiment or
activity. Correlation – The mutual relation of two or more things. Cubic foot per second (ft³/s) – Units typically used in measuring streamflow that express rate of
discharge. The measurement is equal to the discharge in a stream cross section one foot wide and one foot deep (or one meter wide and one meter deep), flowing with an average velocity of one foot (or meter) per second; 1 cfs = 44.8 gallons per minute (gpm); 1 cms = 1,000 liters per second.
Decomposition – The breakdown or decay of organic matter through the digestive processes of microorganisms, macroinvertebrates, and scavengers.
Deionized water - Water that has had al l of the ions (atoms or molecules) other than hydrogen and oxygen removed.
Density – The compactness or crowdedness of matter (ex. water molecules) in a given area. Deposition – The process of laying down sediment or accumulating layers of material carried in suspension. Designated beneficial uses - State-established desirable uses that waters should support, such as
fishing, swimming, and aquatic life. Listed in state water quality standards. Detection limit – The lowest point at which a particular piece of sampling equipment can
accurately assess chemical concentrations. D-frame net - A fine mesh net that is attached to a pole and used for sampling. It resembles a
butterfly net. Dichotomous key – A tool for identifying objects, such as macroinvertebrates. The key presents
340

Utah Stream Team Unit VII. Appendices
a series of “yes or no” questions to the observer; each question brings the observer closer to the identification.
Diffusion – The movement of a substance from an area of high concentration to an area of low concentration.
Discharge – The volume of water (or more broadly, volume of fluid plus suspended sediment) that passes through a cross-section of the channel within a given period of time.
Discharge limits – Any restriction on quantities, rates, and concentrations of chemical, physical, biological or other constituents which are discharged from point sources.
Dissolved - Solids are classified as "dissolved" if they pass through a standard glass-fiber filter with about one micrometer pore size.
Dissolved oxygen (DO) - Oxygen dissolved in water and available for living organisms to use for respiration.
Distillation – The purification of water. When water evaporates the vapor separates from impurities.
Distilled water - Water that has had most of its impurities removed. Divide – The boundary between two watersheds. Downstream – In the direction of a stream’s current; in relation to water rights, refers to water
uses or locations that are affected by upstream uses or locations. Drainage basin – Part of the surface of the earth that is occupied by a drainage system, which
consists of a surface stream or a body of impounded surface water together with all tributary surface streams and bodies of impounded surface water. See watershed.
Ecology – The study of the relationships of living things to one another and to the environment. Ecoregion - Geographic areas that are distinguished from others by ecological characteristics such as climate, soils, geology, and vegetation. Ecosystem – A community of living organisms and their interrelated physical and chemical
environment; also, a land area within a climate. Eddie – An area of water current that swirls or moves upstream. Eddies are usually formed as
water flows past or over an obstruction, such as a boulder or log. Effluent – Waste material discharged into the environment, including waters of the United States. Embeddedness - The degree to which rocks in the streambed are surrounded by sediment. Emergent plants - Plants rooted underwater, but with their tops extending above the water. Engulfers – Macroinvertebrate predators that feed by swallowing their prey whole. Environment – All of the external factors, conditions, and influences that affect an organism or a
biological community. Ephemeral – Occurs intermittently. Ephemeral streams flow only during and shortly after
extreme precipitation or snowmelt events. EPT Value – A index of water quality derived from the percent of Ephemeroptera (mayflies),
Plecoptera (stoneflies), and Tricoptera (caddisflies) in a 100-individual sample of macroinvertebrates.
Erlenmeyer flask - A flask having a wide bottom and a smaller neck and mouth that is used to mix liquids.
Erosion – The wearing down or washing away of the soil and land surface by the action of water, wind or ice.
Erosive – The power of wind or water to wear away sediment. Highly erosive water can wear away more sediment.
Eutrophic – A condition in which the water in a lake, pond, or reservoir is enriched with plant nutrients such as nitrogen and phosphorous which results in large amounts of plant and algal production. As the plants and algae die and sink to the bottom, an organic sediment is created which removes oxygen from the water as it decays.
Evaporation – The conversion of a liquid (ex. water) into a vapor (a gaseous state) usually through the application of heat energy; the opposite of condensation.
341

Utah Stream Team Unit VII. Appendices
Evapotranspiration – The loss of water from the soil through both evaporation and transpiration from plants.
Excretion – The act or process of removing waste material from living organisms. Fecal coliform bacteria – Bacteria that are present in the intestines or feces of warmblooded
animals. They are often used as indicators of the sanitary quality of the water. Floating plants - Plants that grow free floating, rather that being attached to the stream bed. Flocculent (floc) - A mass of particles that form into a clump as a result of a chemical reaction. Flood – Any relatively high streamflow overtopping the natural or artificial banks of a stream. Floodplain – Any normally dry land area that is susceptible to being inundated by water from
any natural source; usually lowland adjacent to a stream or lake. Forbs – Plants with broad leaves and net-like veins; stems are solid and spongy and die back to
the ground every year. Friction – Resistance of a force. For example, rocks in a stream provide friction for the
streamflow. Functional feeding groups – Classification of macroinvertebrate groups according to their mode
of feeding. Gas (gaseous) – The state of water in which individual molecules are highly energized and
mover about freely; also known as vapor. Glide/run – A section of a stream with a relatively high velocity and with little or no turbulence
on the surface of the water. Gradient – A measure of degree of incline; the steepness of slope. Graduated cylinder - A cylinder used to measure liquids that is marked in units. Grass – Plants with hollow stems that are jointed and leaves with parallel veins. The leaves
come off the stem opposite to each other. Gravity – The natural force of attraction exerted by Earth on objects or materials on its surface
that tends to draw them down toward its center. Greenline – A line of vegetation that runs alongside the stream. It is the first line of vegetation you encounter as you move away from the water. Groundwater – Water found in spaces between soil particles underground (located in the zone
of saturation). Habitat – The environment occupied by individuals of a particular species, population, or
community. Headwaters – The source of a stream. Humidity – The degree of moisture in the air. Hydrogen bond – A type of chemical bond caused by electromagnetic forces, occurring when
the positive pole of one molecule (ex. water) is attracted to and forms a bond with the negative pole of another molecule (ex. another water molecule).
Hydrograph – A representation of water discharge over time. Hydrology – The study of Earth’s waters, including water’s properties, circulation, principles
and distribution. Hydrophilic – Water-loving. Hypoxia - Depletion of dissolved oxygen in an aquatic system. impairment - degradation. Impaired waters – Waters that fail to meet applicable water quality standards or to protect designated uses (such as fishing or swimming). Impermeable layer – A layer of material (ex. clay) in an aquifer through which water does not
pass. Impoundment - A body of water contained by a barrier, such as a dam. inert - not chemically or
physically active. Independent variable – A factor in a relationship that is not affected by the relationship. Time
is a common independent variable. Indicator – A gauge of water pollution: not legal criteria but, rather a sign that there may be a 342

Utah Stream Team Unit VII. Appendices
problem. When an indicator level is exceeded, further studies are done. Instream flow – The minimum amount of water required in a stream to maintain the existing
aquatic resources and associated wildlife and riparian habitat. Instream use – Uses of water within a stream’s channel (ex. by fish and other aquatic life, or for
recreation, navigation and hydroelectric power production). Intermittent – A stream that does not flow year round. Irrigation – The controlled application of water to cropland, hay fields, and/or pasture to
supplement that supplied by nature. Kick-net - A fine mesh net used to collect organisms. Kick-nets vary in size, but generally are
about three feet long and are attached to two wooden poles at each end. land uses - activities that take place on the land, such as construction, farming, or tree clearing.
Lake-effect – A weather phenomenon that results from air currents passing over a large lake and then over a mountain range. The warm lake water warms the air, allowing it fill with moisture. As the air climbs up and over the mountains it cools and then drops its moisture.
Large woody material – Fallen trees and limbs in a stream. Larva - The immature, wingless, feeding stage of an insect that undergoes complete
metamorphosis. Leach – The movement of dissolved particles by the percolation of water through soils. Levee – An embarkment or raised area that prevents water from moving from one place to another. Line graph – An illustration of data points where individual points are connected by a line. Line
graphs show a continuous trend. Litter – Dead plant material on the ground. Macroinvertebrate - Organisms that lack a backbone and can be seen with the naked eye. Mainstem – The primary path for waterflow in a watershed. Mean - Average. The sum of all the measurement values divided by the number of measurements. Meandering – The curving pattern of a stream channel. Metabolism – The physical and chemical processes in an organism that produce energy and that
result in the production, maintenance, or destruction of materials in the body. Many metabolic processes involve water.
Metal - An elementary substance, such as gold or silver, which is crystalline when solid and yields positively charged ions in aqueous solutions of its salts. Metals can be very toxic in streams at low concentrations.
Metamorphosis – A change in form from one stage to the next in the life history of an organism, as from the caterpillar to the pupa and from the pupa to the adult butterfly.
Minimum instream flow requirements – Regulations set by management agencies that determine the least amount of water a stream can hold. Requirements protect the aquatic ecosystem and balance competing out-of-stream uses.
Municipal water system – A network of pipes, pumps, and storage and treatment facilities designed to deliver potable water to homes, schools, businesses and other users in the city or town and to remove an treat waste materials.
Narrative criteria - Chemical, physical or biological concentrations in water that are expressed in words.
National Pollutant Discharge Elimination System (NPDES) - A national program in which pollution dischargers such as factories and sewage treatment plants are given permits to discharge. These permits contain limits on the pollutants they are allowed to discharge. Nephelometer (turbidity tube) – A clear tube used to measure the turbidity of a stream or water body. Nephelometric turbidity unit (NTU) – A unit used to describe turbidity measurements. Neutral – A substance, such as distilled water, with a pH of 7. Niche – The role, or combination of functions, that an organism holds in the environment.
343
Utah Stream Team Unit VII. Appendices
Nitrate – A nitrogen compound (NO3) that functions as a plant nutrient. An overabundance of nitrate is considered a water pollutant.
Nitrite – A combination of nitrogen, ammonia and oxygen (NO2) that functions as a plant nutrient. An overabundance of nitrite is considered a water pollutant.
Nitrogen fixation – Changing nitrogen gas into ammonia. Some plants and algae fix nitrogen. Nonconsumptive uses – Instream use of water that does not reduce the supply; or, removing water returning it to the source without reducing the supply. Nonpoint source pollution – Refers to pollution sources that are diffuse and do not have a single
pint of origin. Run-off from agriculture, forestry and construction sites are examples. Numeric criteria – Chemical, physical or biological concentrations in water that are typically
expressed as concentrations, such as milligrams per liter. Nutrient – An element, such as nitrogen or phosphorus, or compound needed for the
reproduction, survival or growth of plants and animals. Nymph – The young of an insect that undergoes incomplete metamorphosis Occular tube – A device used to measure canopy cover. Organic - Of, related to, or derived from living organisms. Organic substances contain carbon. Orthophosphate - Inorganic phosphorus dissolved in water. Outlet – The point where water exits a watershed (flows into a larger watershed). Outlier – A point on a graph that does not fit within the range of the rest of the data points. Parameter – A distinguishing characteristic or feature. For example, nitrate is a water quality parameter. Particle-size – The diameter, in millimeters (mm) of a particle in a stream bed. Particulate phosphorus - Parts per million (ppm)/parts per billion (ppb) - Units typically used in measuring the number
of "parts" by weight of a substance in water; commonly used in representing pollutant concentrations.
Pathogen - A disease-producing agent, especially a microorganism. Peak flow – The largest rate of flow during a certain time period. Piercers – Macroinvertebrate predators that feed by injecting a sharp mouth part into their prey
and sucking out body fluids. Percent saturation – The amount of dissolved oxygen in water compared to the amount of
dissolved oxygen the water can hold. Percolation – Describes the action of water as it moves through spaces in the soil and rock. Perennial – Occurs year-round. Perennial streams hold water throughout the year. Permeable - Capable of transmitting water (e.g., porous rock, sediment, or soil). Permeable layer - A layer of porous material (rock, soil, unconsolidated sediment); in an aquifer, the layer through which water freely passes as it moves through the ground. Permit – Legal authority to carry out a regulated activity.
pH - A numerical measure of the hydrogen ion concentration used to indicate the alkalinity or acidity of a substance. Measured on a scale of 1.0 (acidic) to 14.0 (basic); 7.0 is neutral.
Phosphorus - A nutrient that is essential for plants and animals. Photosynthesis - The chemical reaction in plants that utilizes light energy from the sun to convert water and carbon dioxide into simple sugars. This reaction is facilitated by chlorophyll. Pipet - An eye dropper-like instrument that can measure very small amounts of a liquid. Playa – The sandy, salty, or mud-caked flat floor of a desert watershed having interior drainage,
usually occupied by a shallow lake during or after prolonged, heavy rains. Point source pollution - Refers to pollution resulting from discharges into receiving waters
from any discernible confined and discrete conveyance such as a pipe, ditch, or sewer. Pool – A deeper portion of a stream where water flows slower than in neighboring, shallower
portions. Pore spaces – Open areas between grains of soil. Water and air exist in these spaces. Tiny
grains have smaller pore spaces than large grains.
344

Utah Stream Team Unit VII. Appendices
Precipitation - Water falling, in a liquid or solid state, from the atmosphere to Earth (e.g., rain, snow).
Precision - A measure of how close repeated trials are to each other. Predator – An animal, such as a macroinvertebrate, that feeds on other animals. Protocol - A defined procedure. Reagent - A substance or chemical used to indicate the presence of a chemical or to induce a
chemical reaction to determine the chemical characteristics of a solution. Redds – A fish spawning area. Redds are usually round or eliptical areas of clean gravel about
1-3 feet long. Representative – Accurately depicting the true characteristics of the stream. Reservoir – A still, lake-like water body that forms upstream from a dam. Reservoirs store
water and often provide for recreation. Respiration - The act or process by which an organism exchanges gases with its environment; in
animals with lungs, the process of inhaling and exhaling, or breathing. Cellular respiration involves the release of energy from food through chemical reactions. Restoration. The act or process of bringing something back to a previous condition or position.
Ridge lines - Points of higher ground that separate two adjacent streams or watersheds; also known as divides.
Riffle – A shallow area in a stream where water flows swiftly over gravel and rock. Riparian zone - The vegetative area on each bank of a body of water that receives flood waters. Riprap - Rocks used on an embankment to protect against bank erosion. River system – The network of connecting streams. Smaller streams serve as tributaries for
larger streams, forming a vein-like pattern. Run/glide - See glide/run. Runoff - Precipitation that flows overland to surface streams, rivers, and lakes. Rushes – Similar to sedges but have round (verses triangular) stems and very small or no leaves.
Rushes stabilize stream banks well and preventing erosion. Salinization - The condition in which the salt content of soil accumulates over time to above the
normal level; occurs in some parts of the world where water containing high salt concentration evaporates from fields irrigated with standing water
Saturated - Inundated; filled to the point of capacity or beyond. Saturation concentration – The amount of dissolved oxygen a body of water can hold. Scrapers – Macroinvertebrates that feed by scraping algae and other material from the surface of
plants, wood and rock. Also known as grazers. Season - A period of time during the year classified by length of day and weather conditions. Secchi disk – A black and white disc used to measure the turbidity of a pond or lake. Sedges – Sedges resemble grasses but have solid, triangular stems with no joints. The leaves
have parallel veins and come off the stem in three directions. Sedges are effective at stabilizing stream banks and preventing erosion.
Sediment – Solid material that originates mostly from disintegrated rocks and is transported by, suspended in, or deposited from water; it includes chemical and biochemical precipitates and decomposed organic material such as humus. The quantity, characteristics, and cause of the occurrence of sediment in streams are influenced by the quantity and intensity of precipitation.
Sheen - The glimmering effect that oil has on water as light is reflected more sharply off of the surface. Shredder – A macroinvertebrate that feeds by cutting or tearing on leaves and woody material
that falls into the stream. Shrubs – Plants with woody stems that remain alive all year. The leaves tend to have net-like veins. Shrubs rarely grow larger than 13 ft tall; if they do they may be considered “trees.” Siltation – An increased supply of fine sediments to a stream bottom or channel. Siltation can cover up and harm fish spawning areas and macroinvertebrate habitat.
345

Utah Stream Team Unit VII. Appendices
Sinuosity – The degree to which a stream meanders, or curves. Soil - The top layer of Earth's surface, containing unconsolidated rock and mineral particles
mixed with organic material. Solute – Any substance that is dissolved in water. Solids - Water, a liquid, can contain quite a bit of solid material, both in dissolved and suspended forms. Solids captured on the filter are, by definition, "suspended" solids. Solids which settle out of a water sample on standing for a period of an hour are defined as "settlable." Soluble – Able to be dissolved in water. Solute - A substance dissolved in another substance (the solvent) create a solution. Solvent - A material such as water that dissolves another subs (the solute) to form a solution. Spreadsheet - A work sheet that is arranged in the manner of a mathematical matrix and
contains a multicolumn analysis of related entries for easy reference on a single sheet. Stomata - Tiny pores in the epidermis or surface of plant leaves or through which gases and
water vapor are exchanged with the environment. Storm drain - Constructed o a road system through which " runoff from the road surface into an
underground sewer system. Stratification – A natural process in which bodies of standing water become colder near the
bottom and warmer near the surface. The two layers are separated by a thinner middle layer characterized by a rapidly changing temperature profile.
Stream - Any body moving under oaf running w gravity's influence through clearly defined natural channels to progressively 1 levels.
Streamflow – The discharge that occurs in a natural channel. Although the term “discharge” can be applied to the flow of a canal, the word “streamflow” uniquely describes the discharge in surface stream course. The term “streamflow” is more general than “runoff” as streamflow may be applied to discharge whether or not it is affected by diversion or regulation.
Stream order – A system used to classify and analyze streams. Sub-basin – A smaller watershed that comprises part of a larger watershed. Sublimation - The transition of a substance from the solid directly to the vapor phase, or versa,
without passing intermediate liquid phase. Submergent plants - Plants that live and grow fully submerged under the water. Substrate - Refers to a surface. This includes the material comprising the stream bed or the
surfaces which plants or animals may attach or live upon. Surface runoff – Water that flows over the surface of the land or through the upper layer of soil. Surface tension - The attraction among water molecules at the surface of a liquid; creates a skinlike barrier between air and underlying water molecules. Surface water - Water above the surface of the land, including lakes, rivers, streams, ponds,
floodwater, and runoff. Suspended solids – Particles carried in water without being dissolved. Swale – A low point on the surface of the land. Swales in riparian zones are usually filled with
fine sediments and organic matter. Taxon (plural taxa) - A level of classification within a scientific system that categorizes living
organisms based on their physical characteristics. Taxonomic key - A quick reference guide used to identify organisms. They are available in
varying degrees of complexity and detail. Temperature - The measurement of the average kinetic energy of moving molecules within a
substance. Temperature regulation - The processes through which an organism's temperature is adjusted
to certain metabolic requirements or conditions in its environment. Thalweg – The line of maximum velocity in a stream. Titration - The addition of small, precise quantities of a reagent to a sample until the sample
reaches a certain endpoint. Reaching the endpoint is usually indicated by a color change.
346

Utah Stream Team Unit VII. Appendices
Tolerance - The ability to withstand a particular condition - e.g. pollution tolerant indicates that ability to live in polluted waters.
Topography – The shape of the land’s surface. Total dissolved solids – A measure of the amount of solid (generally inorganic) material carried in solution by a body of water. Toxic – Poisonous or damaging. Transpiration - The process by which water absorbed by plants (usually through the roots) is
evaporated into the atmosphere from the plant surface (principally from the leaves). Tributary - A body of water that drains into another, typically larger, body of water. Turbidity - Murkiness or cloudiness of water, indicating the presence of some suspended sediments, dissolved solids, natural or man-made chemicals, algae, etc. Turbidity tube (nephelometer) – A clear tube for measuring the turbidity of a stream or water
body. Unconfined aquifer - An aquifer in which the upper boundary is the top of the water table. Uplands zone – The area of the watershed that does not receive regular flooding by a stream. The uplands zone borders the riparian zone. Upstream – Toward the source or upper part of a stream; against the current. In relation to
water rights, refers to water uses or locations that affect water quality or quantity of downstream water uses or locations.
Utah State Standard – The legally designated allowable concentration of an impurity in a water body. Concentrations over this state standard are considered as pollution.
Variable - A quantity or function that may assume any given value or set of values. Velocity – The speed of water flow. Volume – The amount of water in a stream. Volumetric flask - A flask that holds a predetermined amount of liquid. Wastewater - Water that contains unwanted materials from homes, businesses, and industries; a
mixture of water and dissolved or suspended substances Wastewater treatment - Any of the mechanical or chemical processes used to modify the
quality of wastewater in order to make it more compatible or acceptable to humans and the environment.
Water (H2O) - An odorless, tasteless, colorless liquid made up of a combination of hydrogen and oxygen. Water forms streams, lakes, and seas, and is a major constituent of all living matter. The word water and important concepts related to water appear on almost every page of this text.
Water allocation - In a hydrologic system in which there are multiple uses or demands for water, the process of measuring a specific amount of water devoted to a given purpose. Water cycle - The paths water takes through its various states-vapor, liquid, and solid-as it moves throughout Earth's systems (oceans, atmosphere, ground water, streams, etc.). Also known as the hydrologic cycle. Water molecule - The smallest unit of water; consists of two hydrogen atoms and an oxygen
atom. Water pressure - The downward force of water upon itself and other materials; caused by the
pull of gravity. Water quality - The chemical, physical, and biological characteristics of water with respect to
its suitability for a particular use. Water quality criteria - Maximum concentrations of pollutants that are acceptable, if those
waters are to meet water quality standards. Listed in state water quality standards. Water quality rating index – An index of water quality derived from a 100-individual sample of
macroinvertebrates. The more pollution-intolerant individuals found in the sample the better the water quality.
Water quality standard - Recommended or enforceable maximum contaminant levels of chemicals of materials (e.g. nutrients). In relation to water rights, refers to water
347
Utah Stream Team Unit VII. Appendices
uses or locations that affect water quality or quantity of downstream water uses or locations. Water right - A legal right to use a specified amount of water for beneficial purposes Watershed – The land area from which surface runoff drains into a stream channel, lake, reservoir or other body of water; also called a drainage basin. Water table - The top of an unconfined aquifer; indicates the level below which soil and rock are
saturated with water. Weather – The composite condition of the near-Earth atmosphere, including temperature,
barometric pressure, wind, humidity, clouds, and precipitation. Weather variations in a given area over a long period of time create climate.
Wetlands – Lands where water saturation is the dominant factor determining the nature of soil development and the types of plant and animal communities. Other common names for wetlands are sloughs, ponds and marshes.
Xeriscaping – A form of landscaping that utilizes a variety of indigenous and drought-tolerant plants, shrubs, and ground cover.
Zone of aeration – The unsaturated surface layer of the ground in which some of the spaces between soil particles are filled with water and others are filled with air. Some of the water in the zone of aeration is lost to the atmosphere through evaporation.
Zone of saturation – The part of a ground water system in which all of the spaces between soil and rock material are filled with water. Water found within the zone of saturation is called ground water. The water table is the top of the zone of saturation.
348

Utah Stream Team Unit VII. Appendices
Appendix 13. Index
349

Utah Stream Team Unit VII. Appendices
350

Utah Stream Team Unit VII. Appendices
INDEX Accuracy, 40, 175 Acidic, 85, 87 Acid Rain, 86, 103 Acre-foot, 66 Agriculture, 192, 199 Algae Blooms, 115 Alkalinity, 39, 85 Ammonia, 83, 102-112
Field Instructions, 104, 109-110, Appendix 5 Data Sheet, 133, Appendix 5
Aquatic Zone, 153 Aquifer, 189, 201 Atmosphere, 190, 192 Backwaters, 39 Bar Graph, 171 Basic, 85, 193 Bed Material, 71 Beneficial use, 209, 215 Biological Properties, 13, 53
Introduction, 135 Collecting samples, 40 Macroinvertebrates, 137-152 Riparian Zone, 153-166 Data Sheets, 151, 152, 165, 166 Appendix 5
Buffer, 85, 86 Bureau of Land Management, 49 Capillary action, 190 Celcius, 125 Channel, 71, 75, 76
Pattern, 76, 77 Shape, 77
Channelization, 63,64 Chemical Properties, 13, 53
Introduction, 83 pH, 85-89 Dissolved Oxygen, 91-98 Nutrients, 99
Nitrogen, 101-112 Phosphorus, 113-117
Turbidity, 119-124 Temperature, 125-131 Sample Collection, 40 Data sheet, 133
Chemical safety, 47 Chlorine, 57 Climate, 63, 155, 197 Cobble, 74 Cold Water Fish (See Fish) Collectors, 140, 142
Colorado Basin River Forecast Center, 68 Colorado River System, 203 Condensation, 189-190 Cubic Feet per Second (CFS), 177 Dams, 64, 75 Data
Summary, 169 Presentation, 169-172 Interpretation, 176-180
Decomposition, 115 Dependent Variable, 171 Deposition, 72 Designated beneficial uses, 215-216 Detection limit, 83, 107, 109, 117, 123, Detritus, 102 Discharge, 63, 190 Dissolved Oxygen, 13,65, 41, 53, 83, 91-98, 172
Field Instructions, 94, 97, Appendix 5 Data Sheet, 133, Appendix 5 Requirements for fish (see Fish)
Distillation, 191 Divide, 195 Documenting, 38 Eddie, 39 Emergents, 154 Environmental Protection Agency, 49 Ephemeral (See Streamflow) EPT value, 145, 151 Equipment, 43 Erosion, 72, 77, 196 Eutrophication, 115, 199 Evaporation, 190-190, 198 Evapotranspiration Farenheight, 125 Field Activities
Safety, 47 Organization, 43, 47 Field behavior, 45
Fish: Coldwater, 127, 127 Warmwater, 127, 127 Effect of pH, 85 Effect of Dissolved oxygen, 94, 133 Effect of Ammonia, 106 Effect of Temperature, 127, 127, 133 Effect of Turbidity, 120
Floodplain, 156, 201 Forbs, 159 Forestry, 200 Friction, 73 Functional feeding groups, 142-144 General Stream Survey (see Stream Survey)
351

Utah Stream Team Unit VII. Appendices
Geography, 192 Geology, 39 Grass , 159 Gravity, 192 Great Basin System, 202 Greenline, 157, 160, 162-163 Groundwater, 64, 189 Groundwater Recharge, 156 Headwaters, 196 Hemoglobin, 93 Human influences, 39, 41, 45, 57, 64-65, 74-75, 86, 93, 103,114, 120, 126, 140, 155- 156, 193, 199-201 Impact comparisons, 38 Impermeable layer Impoundment, 203 Independent variable, 171 Indicator, 216 Instructional strategies, 17, 27-30
Action-orientation, 28 Constructivism, 27 Cooperative learning, 28 Interdisciplinary learning, 28 Holistic learning, 28 Learner centered instruction, 28
Interdisciplinary study, 17, 31-33 Language arts, 31 Math, 31 Science, 31 Social Studies, 31 Visual arts, 31
Intermittent (See Streamflow) Kick-net, 51 Lake-effect, 197 Land use, 55, 65, 93 Larva, 137 Line graphs, 171 Litter, 164, 166 Macroinvertebrates, 14, 39, 41, 53, 72, 76, 120, 127, 135-149,160, 177, 196, 212
Field Instructions, 145, 149-150, Appendix 5 (See also, functional feeding groups, etc etc,) Data Sheet, 151-152, Appendix 5
Mainstem, 195 Mean, 169 Meandering, 63, 71 Metals, 170 Metamorphosis, 139 Mining, 200 Monitoring Kit, 51-51
Checklist, 51
Purchasing supplies, 51, Appendix 8 Locations, 51, Appendix 8
Nephelometer (turbidity tube), 120 Nephelometric turbidity unit, 120 Neutral, 85 Niche, 156 Nitrate, 41, 53, 83, 101-112
Field Instructions, 104, 107-108, Appendix 5 Data Sheet, 133, Appendix 5
Nitrogen, 101-112 (See also Nitrate, Ammonia)
Nitrogen Cycle, 102 Nonpoint source pollution, 201, 209-210, 212 Numeric criteria, 216 Nutrients, 13, 41, 53, 83, 99, 210 Nymph, 137 Occular tube, 157 Organic Waste, 93 Orthophosphate, 113 Outlet, 195 Outlier, 178 Oxygen (See Dissolved Oxygen) Percolation, 86, 190 Perennial (See Streamflow) pH, 13, 39, 41, 53, 83, 85-89, 105, 189
Field instructions, 87, 89, Appendix 5 Data sheet, 133, Appendix 5
pH Scale, 85 Phosphorus, 53, 113-116
Phosphorus cycle, 114 Field Instructions, 116, 117-117, Appendix 5 Data Sheet, 133, Appendix 5
Photosynthesis, 91 Physical Properties, 13, 53
Introduction to, 62 Stream flow, 13, 53, 63-70 Stream Shape, 13, 53, 71-80 Data sheet, 81-82, Appendix 5 Sample collection, 40, 66, 69-70, 76, 79- 80
Piercers, 143 Pipet, 51 Playa, 203 Point source pollution, 86, 201, 209, 212, Pool, 72, 76, 77, 80 Pore spaces, 189, 192 Precipitation, 189 Precision, 40, 175 Predator, 143 Project Wet, 32
352

Utah Stream Team Unit VII. Appendices
Quality control, 175-176 Redds, 45, 120 Representative sections, 38 Reservoir, 215 Respiration, 92 Ridge lines, 155 Riffle, 39, 72, 76, 77, 80, 191 Riparian zone, 14, 53, 65, 153-164
Vegetation, 73, 157-159, 163-164, 212 Field Instructions, 157-159, 163-164, Appendix 5 Data Sheet, 165-166, Appendix 5
River system, 196 Run/glide, 72, 76, 77, 80 Runoff, 41 Rushes, 74, 75, 154 Seasonal effects, 41 Safety, 47 Scrapers, 140, 142 Secchi disk, 120 Sedges, 74, 75, 154 Sediment, 74, 76, 210 Sheen, 56 Shredder, 140, 142 Shrubs, 74, 159 Site Selection, 38 Site Documentation, 38 Sinuosity, 63, 71
Channelization, 63, 71 Meandering, 63, 71
Soluble, 83 Sourcebook for Watershed, 32 Soil Conservation District, 77 Spreadsheet, 174 Stream Channel, 71, 79
Braided, 71 Meandering, 71 Straight, 71
Stream Flow, 13, 53, 63-70, 197 Stream order, 63 Stream Shape, 13, 53, 71-80
Field Instructions, 76, 79-80, Appendix 5 Data Sheet, 82, Appendix 5
Streamflow, 13, 41, 53 Field Instructions, 66, 69-70, Appendix 5 Data Sheet, 81, Appendix 5 Ephemeral, 63 Intermittent, 63 Perennial, 63
Stream Survey, 53, 55-59 Data sheet, 59, Appendix
Stewardship, 181-185 Sub-basin, 195
Substrate, 64, 73, 74, 76, 77, 79, 140 Supplies (See Monitoring Kit) Surface runoff, 189-190 Surface water, 190 Suspended solids, 211 Swale, 155 Tamarisk, 75 Temperature, 13, 41, 53, 91, 105, 125-129, 172
Effect on dissolved oxygen, 92 Effect on ammonia toxicity, 106 Field Instructions, 127, 131, Appendix 5 Data Sheet, 133, Appendix 5
Tolerance levels, 141 Topography, 155, 192, 197 Total dissolved solids, 210 Toxic, 104 Transpiration, 191, 198 Tributary, 196 Trout Unlimited, 49 Turbid, 196 Turbidity, 13, 65, 41, 53, 76, 83, 119-121
Field Instructions, 120, 123-124, Appendix 5 Data Sheet, 133, Appendix 5
Turbidity tube, 120 United States Geological Survey, 55, 66, 68,
77 United States Forest Service, 49 Uplands zone, 153 Utah Department of Water Resources, 49,
68 Utah Division of Water Quality, 49, 194 Utah Science Core Curriculum, 17, 23- 26,
Appendix 8 Utah State Standard, 172, 176 USU cooperative Extension, 49 Vegetation, 64, 39, 192 Velocity, 63, 66 Volume, 63 Warm Water Fish, (See Fish) Wastewater treatment plants, 57 Water cycle, 14 Water quality, 65, 67 Water Quality Criteria, 216, 217
pH, 87, 89, 133 Dissolved Oxygen, 94, 97, 133 Nitrate, 105, 108, 133 Ammonia, 106, 110, 133 Phosphorus, 116, 117 Turbidity, 121, 124, 133 Temperature, 127, 131, 133 Narrative, 216
353

Utah Stream Team Unit VII. Appendices
Water quality index rating, 145 Water quality monitoring, 13 Water quality standards, 216 Water table, 64, 75, 154 Water, 13 Watershed, 14, 55, 195-208
Bear River Watershed, 202 Cedar/Beaver Watersheds, 202 Jordan Watershed, 202 Sevier Watershed, 203 Weber Watershed, 203
354