Embed Size (px)
Citation preview

BRC RESEARCH REPORT No. 16
The Structure of the Automobile Value Chain in
Southeast Asia
March 2017
Ikuo Kuroiwa
Bangkok Research Center
JETRO Bangkok/IDE-JETRO

Bangkok Research Center, JETRO Bangkok/IDE-JETRO
16th Fl. of Nantawan Bldg., 161 Rajadamri Road, Bangkok 10330, THAILAND
©2017 by Bangkok Research Center, JETRO Bangkok/IDE-JETRO
No part of this publication may be reproduced without the prior permission of Bangkok Research
Center, JETRO Bangkok/IDE-JETRO.

1
The Structure of the Automobile Value Chain in
Southeast Asia
Ikuo Kuroiwa
Abstract
This paper explores the structure of the automobile value chains in Southeast Asia.
Trade in value added analysis and its decomposition method are applied to the OECD
Inter-Country Input-Output (ICIO) data. Also, the method of value chain mapping is
introduced to illustrate upstream and downstream transactions of goods and services
along the value chain. The result of this analysis suggests that there are several groups
of industries or countries that are deeply involved in the automobile value chain in
Southeast Asia. Among them, Southeast Asian countries have become important
suppliers of parts and components, although they are still highly dependent on Japan
and other Northeast Asian countries especially for procurement of basic metal. Value
chain mapping shows that motor vehicles have the highest induced value added in all
the Southeast Asian countries, although the Philippine and Vietnam have relatively low
intra-industry transactions in motor vehicles. A significant portion of automobile outputs
are distributed to its own sector, as well as gross fixed capital formation and household
consumption. It also shows that part of the motor vehicle outputs are exported to Japan
and neighbouring Southeast Asian countries, as well as Australia and Saudi Arabia.

2
1. Introduction
Participation in global value chains (GVCs) has become increasingly important as a
strategy for economic development. Unlike in the past, a current developing country can
leap into the GVCs of sophisticated products by specialising in a niche segment of the
value chain, and become an exporter of such products.
However, participation in GVCs is not sufficient in itself. Structural
transformation, in particular industrial deepening―the formation of backward linkages
by creating a robust supplier base (ADB 2013)―is necessary for sustained economic
growth, especially for industries with significant economies of scale, such as motor
vehicles. Note that development of a local supplier base increases the competitiveness
of assembly industry by delivering parts and components at lower cost, in a shorter time,
and with more flexibility―which is considered an important element of the benefits of
agglomeration. In the case of the automotive industry, spatial proximity between the
local suppliers and assemblers not only saves on transport costs for heavy and bulky
components, but also facilitates just-in-time production and delivery.
Due to the benefits of agglomeration including the above, many developing
countries, including Southeast Asian countries, have tried to develop their automobile
industry by adopting a protective policy, especially for local suppliers. However, many

3
have failed, and the current development literature, which focuses on engagement in
GVCs, tends to emphasise the importance of access to lower-cost or higher-quality
imported inputs, and thus, any trade protection measures that protect the local suppliers
of intermediate inputs at the cost of production efficiency would not be recommended
as an effective policy option (OECD 2013).1 Moreover, such protective measures have
become increasingly difficult to implement as a result of trade liberalisation efforts in
recent years. In particular, the local content requirement (LCR), which was extensively
used to protect local suppliers during the era of import substitution, has been prohibited
by the WTO Agreement on Trade-Related Investment Measures (TRIMs).
Furthermore, declining trade and transportation costs have increased the benefits
of specialisation and exchange, reaping significant gains from international trade. For
instance, some types of automobile parts―such as a wire harness―are labour intensive,
so that it would be more efficient to procure these parts from less developed countries
and promote intra-industry trade of intermediate inputs. Moreover, manufacturing of
1 It is demonstrated that an industry with a high share of imported inputs displays, on
average, higher productivity in the OECD countries, because foreign inputs embody
more productive technology, and resources are re-allocated more efficiently. In
particular, increased productivity results from: (1) A price effect: increased intermediate
imports result in stronger competition and therefore lower prices for inputs. (2) A supply
effect: increased imports enhance the variety of inputs available. (3) A productivity
effect: new intermediate inputs may spur innovation in the final goods sector by
enhancing access to knowledge (OECD 2013).

4
key parts and components―such as engine and transmission parts―involves a large
fixed cost and requires a well-established local supplier base; therefore, it would be
more efficient to concentrate production in a single country rather than set up factories
in many countries. In fact, the ASEAN countries have implemented various policy
measures, such as the Brand to Brand Complementation (BBC) Scheme, the ASEAN
Industrial Cooperation (AICO) Scheme, and the ASEAN Free Trade Agreement (AFTA),
to promote the intra-regional trade in automotive parts and components within the
region.
In summary, there are two forces working in opposite directions. One, is the
benefit of agglomeration, which encourages local supplier development and increases
domestic transactions. The other, is the benefit of specialisation and exchange, which
promotes trade of intermediate inputs and increases international transactions. It is
therefore a matter of empirical evidence how the inputs are procured from domestic or
international markets and which type of transactions―domestic or international―are
increased as a result of the procurement of inputs.
The objective of this paper is to demonstrate the structure of automobile
value chains in five Southeast Asian countries, Thailand, Indonesia, Malaysia, the
Philippines, and Vietnam, using the OECD inter-country input-output (ICIO) data for
5
2011.2 Since the international input-output data covers both domestic and international
intermediate transactions, it demonstrates how inter-industry linkages have been
established in the automobile value chain: in particular it reveals the types of inputs that
are procured from the domestic market; those imported from abroad, and the source
countries.
As part of the value chain analysis, the paper first introduces the method of
trade in value added. The analysis of trade in value added has been used in recent years
to calculate the measure of vertical specialisation (VS) and to decompose trade data (see
Hummels, Ishii, and Yi, 2001; Daudin, Rifflart, and Schweisguth, 2011; Johnson and
Noguera, 2012; Koopman, Wang, and Wei, 2014). Furthermore, this paper introduces
the method of decomposition of the VS measures, so that the share of foreign content
embodied in specific products can be estimated by sector and by country of origin. A
similar method of decomposition is applied to domestic content.
Second, the paper introduces a method of value chain mapping with the
inter-country input-output tables, first adopted in Kuroiwa (2016). The value chain
mapping with international input-output data shows the overall value chain of a specific
2 The OECD ICIO tables cover 62 countries or regions with 34 sector classifications.
They include Thailand, Indonesia, Malaysia, the Philippines, and Vietnam, and their major trade partners, such as China, Japan, Korea, the USA and the European countries, are also included as the
endogenous countries in the tables.
6
product or service and demonstrates how domestic and imported inputs are used to
produce final outputs (i.e. upstream transactions). Simultaneously, induced value added
is calculated for both the domestic and foreign industries. Furthermore, the technique of
value chain mapping is applied to the downstream transactions by adopting a similar
method to the ICIO tables. The downstream transactions cover both intermediate and
final demand transactions. Thus, it demonstrates how outputs of the automobile industry
are used by the respective industries or final demand components in the respective
countries.
The result of analysis suggests that there are several groups of industries or
countries that are deeply involved in the automobile value chain in Southeast Asia.
Among them, Southeast Asian countries have become important suppliers of parts and
components, although they are still highly dependent on Japan and other Northeast
Asian countries especially for procurement of basic metal. Value chain mapping shows
that motor vehicles have the highest induced value added in all the Southeast Asian
countries, although the Philippine and Vietnam have relatively low intra-industry
transactions in motor vehicles. A significant portion of automobile outputs are
distributed to its own sector, as well as gross fixed capital formation and household
consumption. It also shows that part of the motor vehicle outputs are exported to Japan

7
and neighbouring Southeast Asian countries, as well as Australia and Saudi Arabia.
The paper first discusses the structure of vertical specialisation in the
automotive industry in five ASEAN countries using the method of trade in value added.
Second, the method of value chain mapping is applied to the automobile industry.
Finally, the paper concludes with a summary of important findings.
2. Structure of vertical specialisation
In this section, the analysis of trade in value added is implemented using the OECD
inter-country input-output tables (the OECD ICIO tables) for 2011. First, the vertical
specialisation (VS) share is calculated to illustrate the structure of the vertical trade in
the automobile industry. Second, the value added content―as well as the VS share―is
decomposed into its components by (i) Country of origin, (ii) Domestic content by
industry of origin, and (iii) Foreign content by industry of origin.
2.1 The VS share
The vertical specialisation (VS) share represents the percentage share of foreign content
embodied in exports, i.e. the share of value added that is induced by exports, but accrues
to the foreign countries. However, it should be noted that although the VS share by

8
definition indicates the foreign content of exports, the same numerical value
applies to the foreign content of other final demand components, such as
private consumption, government consumption, and investment. This is due
to the assumption of an input-output model whereby the input structure is
the same regardless of the final demand components (for details of the VS share
and its decomposition method, see Appendix 1).
Therefore, the VS share indicates the true dependency (in value added terms)
of exports or other final demand components on foreign inputs, and its value tends to
increase as the production processes are increasingly fragmented across national borders.
Figure 1, shows the VS share of the automotive industry in 16 countries or regions.3
Japan had an extremely low VS share, reflecting its highly self-sufficient industrial
structure. On the other hand, some Southeast Asian countries, such as Malaysia,
Thailand, and Vietnam, have high VS shares. As discussed below, this reflects the fact
that the automotive industry in Southeast Asia is heavily dependent on imported inputs,
especially from Japan and the neighbouring Southeast Asian countries. Note that a
similar structure can be seen in Canada and Mexico, which have a close relationship
3 In this analysis, a group of countries―such as the EU member countries―are
aggregated into one region, as shown in Figure 1.

9
with the USA through the North American Free Trade Agreement (NAFTA).4
-Figure 1-
On the other hand, Indonesia has a relatively low VS share, reflecting its
relatively large population and market size: note that a larger country tends to have a
higher self-sufficiency level. However, the Indonesian motor vehicle industry still needs
to import key auto parts and components from Japan and its neighbouring Southeast
Asian countries.
2.2 Decomposition of the value added components
(1) Decomposition of the value added components by country of origin
Table 1, shows the decomposition of the value added components by country of origin
4 Note that similar phenomena can be observed in Europe. For instance, among the 62
countries or regions covered by the OECD ICIO tables, Hungary has the highest VS
share (62%), followed by the Slovak Republic (61%). These countries are heavily
dependent on inputs imported from Germany and other European countries: for
instance, a unit of automotive final demand in Hungary induced 16.9 % of value added
in Germany, 3.9 % in Italy, and 3.7% in the USA. In the case of the Slovak Republic, the
shares were 12.6% in Germany, 9.8% in the Rest of the World, and 4.0% in the Czech
Republic. On the other hand, in Mexico, such shares were 16.5% in the USA, 5.9% in
China, and 3.7% in Japan, and in Canada 26.0% in the USA, 5.7% in Japan, and 5.0% in
Mexico. The USA occupied the dominant position as a supplier of automotive parts and
components in North America. As discussed below, Japan plays a similar role to
Germany and the USA in Southeast Asia.
10
embodied in automotive exports or other final demand components in Southeast Asia:
due to space limitation, only the 15 highest countries are listed in the table. First, it
shows that the highest value added is generated in its own country: that is, domestic
content has the highest share in all the countries. For example, the share of domestic
content in Indonesia is 74.5 %, followed by the Philippines.5 This is not surprising
given the fact that many Southeast Asian countries have a long history of promoting the
automobile and its ancillary industries. It is also natural that local procurement is
prioritized by the automobile companies due to the benefit of spatial proximity and
lower transport costs.
- Table 1 -
The share of Japanese content is the highest in all the countries except
Vietnam: note that the share of Japanese content is high, especially in Thailand. China
has the second highest foreign content in all the countries except Vietnam.
Other countries that have high foreign content are classified into four groups.
The first group is the Southeast Asian countries, in particular Thailand and Indonesia:
5 It holds that the VS share (as shown in Figure 1) + the domestic content share = 1,
where the VS share is the sum of the foreign content by country of origin.

11
Thailand, for example, has the third highest foreign content in Indonesia, while
Indonesia has the sixth highest in Thailand. Other countries, such as Malaysia,
Singapore, and the Philippines, also have a high foreign content share.
The second group comprises motor vehicle producing countries in the
Asia-Pacific region, especially Korea and the USA. For example, Korea has the fourth
highest foreign content in Vietnam, followed by the USA, Australia, and Taiwan.
The third group comprises major motor vehicle producing countries in Europe,
particularly Germany, which demonstrate the fourth highest foreign content in Malaysia.
Other European countries, such as Great Britain and France, also have a high foreign
content in Malaysia.
The fourth group is the natural resource rich countries, such as Saudi Arabia
and Russia: the Rest of the World (ROW) also appears frequently as a major supplier of
natural resources. These countries provide natural resources or processed materials,
such as mining, refined petroleum products, chemicals, and basic metals for the motor
vehicle industry. Saudi Arabia and Russia, for instance, have the fourth and eight
highest foreign contents in the Philippines.
(2) Decomposition of domestic content by industry of origin

12
Table 2, shows the decomposition of domestic content by industry of origin. Obviously
the motor vehicle industry―which comprises parts and components as well as assembly
activities―has the highest domestic content in all the countries. For instance, the
domestic content of motor vehicles in Indonesia is 55.8 %, and that in the other
countries exceeded 20%. It should also be noted that motor vehicles occupy a dominant
share of the domestic content, as exemplified by the example of Indonesia, where motor
vehicles comprises 75% of domestic content (compare the 1st row in Tables 1 and 2).
- Table 2 -
Service industries―such as wholesale and retail trade, transportation services,
post and telecommunications, financial intermediation, real estates, business services,
electricity, gas, and water―have a high domestic content. For instance, the second in
terms of domestic content was wholesale and retail trade in all the countries except
Vietnam: financial intermediation also has a high domestic content, particularly in
Thailand and Indonesia.
(i) Agriculture (rubber trees, wood trees, animal hides, and natural fibres) and
(ii) mining (iron ore, coal, aluminium, copper, and crude petroleum) have a high
13
domestic content: for example, mining that have the fourth highest domestic content in
Indonesia. Although these natural resource-based industries are not directly used by the
automobile industry, their value added is contained and induced indirectly through the
material industries that process the products of the natural resource-based industries.
Material industries, which comprise (i) Basic metals, fabricated metal products,
(ii) Refined petroleum products, chemical products, rubber and plastic products, (iii)
Non-metallic mineral products, and (iv) Textiles, have a high domestic content. In
particular, iron and steel are the most important materials for manufacturing motor
vehicles, so that fabricated metal products and basic metals have a high domestic
content, as seen in Vietnam, where they have the second and seventh highest domestic
content respectively. Also, rubber and plastic products are important materials, as
shown by the rubber and plastic products, refined petroleum products, and chemical
product in the Philippines.
The last group is the machinery industry, comprising electrical machinery,
computers, electronics, and optical equipment; machinery and equipment; and other
transport equipment: computers, electronics, and optical equipment, for example, have
the fourth highest domestic content in the Philippines, while machinery and equipment
have the fourth highest domestic content in Thailand.

14
(3) Decomposition of foreign content by industry of origin
As discussed above, a higher domestic content creates a significant benefit of
agglomeration. On the other hand, the benefit of specialisation and exchange could be
obtained by procurement from countries where the products are produced at a lower
cost or at a higher level of efficiency due to factor endowments or economy of scale in
production.
Table 3, shows that unlike domestic content, motor vehicles do not have the
highest foreign content share, but wholesale and retail trade do have the highest foreign
content share, as shown in Malaysia and Thailand. Note that other service activities―
such as transportation, financial intermediation, business services―also have a high
foreign content. Motor vehicles, on the other hand, have the second highest foreign
content in Indonesia and a relatively high content in other countries.
The share of service imports is high, because many services inputs are used and
embodied in traded goods and indirectly traded in international transactions. The other
factor is that some service activities―such as wholesale and retail trade, transport, and
storage-are combined by international trade and thus directly traded.
15
- Table 3 -
Mining and material products― especially basic metals, fabricated metal
products, refined petroleum products, chemical products, rubber and plastic products―
comprise an important portion of foreign content.6 Mining products need to be
imported (or imported indirectly through the import of materials), if a country is not
endowed with natural resources or cannot produce them at low cost. In fact, the
Southeast Asian countries have a high foreign content in mining: for example, mining
has the highest foreign content in the Philippines; the second highest in Thailand,
Vietnam and Malaysia; and the third highest in Indonesia.
Also, basic metals have a high foreign content, as shown by the third highest
foreign content in Thailand, Vietnam and the Philippines; and the fourth highest in
Indonesia and Malaysia. In fact, Southeast Asian countries lack the capacity to produce
high-quality iron and steel―which is essential for motor vehicle manufacturing. Thus,
they are highly dependent on the iron and steel imported from Japan and the other
Northeast Asian countries.
6 Note that the mining industry has a higher value added ratio (i.e. the ratio of value
added to gross output) than other industries, so that even if imports of mining products
are relatively low, it could achieve a higher share of foreign content.

16
In addition to motor vehicles, other machinery industry―such as electrical
machinery, computers, electronics, optical equipment, machinery, and equipment―
also indicate a high foreign content. For instance, computers, electronics, and optical
equipment have the third highest foreign content in Malaysia and the fifth highest in the
Philippines. Note that these machinery products―in tandem with automobile parts and
components―comprise essential inputs and thus need to be imported to produce
automobiles in Southeast Asia.
Finally, it is important to note that, although the foreign content in motor
vehicles is not particularly high, each Southeast Asian country is highly dependent on
specific countries for procurement of parts and components. Such a structure in the
value chains reflects the comparative advantages of the respective countries, as well as
the historical path of regional integration in Southeast Asia.7 Furthermore, the motor
vehicle industry in Southeast Asia is still highly dependent on the parts and components
imported from Japan, reflecting the higher share of Japanese automobile companies in
Southeast Asia, although there was a significant shift in the source countries especially
from Japan to the ASEAN countries (Kuroiwa 2017).
7 It is well-known that the respective Southeast Asian countries specialise in the
production of specific automobile parts or components, such as diesel engines in
Thailand, gasoline engines in Indonesia, and transmissions in the Philippines.
Furthermore, intra-regional trade in these products has been promoted through
regional trade agreements in ASEAN, such as the BBC, AICO, and AFTA.

17
To investigate the structure of the automobile value chain in more detail, we
explore in the next section the result of the value chain mapping of the automobile
industry. Note that the analyses in this section―which decompose domestic and foreign
content by country of origin and by industry of origin―are all integrated into the value
chain mapping analysis, which focuses on the overall value chain of a specific country.
3. Value chain mapping of the automotive industry in Southeast Asia
Figures 2.a-6.a show the upstream value chains in the motor vehicle industry in the
five ASEAN countries for 2011. The upstream value chain demonstrates the flow of
intermediate transactions, as well as value added, induced by a unit of final demand
― which is normalised to 100 units in this study. In these figures intermediate
(1) represents the intermediate transactions that are induced directly by
the induced output of motor vehicles. Similarly, intermediate (2)
represents transactions that are induced directly by the induced output of
intermediate (1). Moreover, due to space limitation, only intermediate
transactions and value added whose values exceed one percent of the initial final
demand are recorded in the figures.

18
On the other hand, Figures 2.b-6.b show the downstream value chains in the
motor vehicle industry. The downstream value chains demonstrate the flow of the
intermediate transactions, as well as the final demand, induced by 100 units of value
added (for the analysis method, see Appendix 3).
a. Thailand
Figure 2.a shows that when 100 units of final demand are given to the Thai
motor vehicle industry, 24.5 units of motor vehicles are provided (as intermediate
inputs) in its own sector, and this is followed by machinery, equipment and basic metals.
Similarly, a large proportion of the induced intermediate transactions occurred not only
in the manufacturing sectors but also in a range of the service sectors, including
wholesale and retail trade, financial intermediation, electricity, gas, and water supply,
and transportation.
Regarding international transactions, Japan is the most important supplier of
motor vehicle inputs (i.e. parts and components) and basic metal, whereas Australia,
China, Korea, and the Rest of the World are the major suppliers of basic metals, and the
Philippines is an important supplier of motor vehicle inputs to Thailand.
The upper left column in Figure 2.a shows that 25.7 units of value added are

19
generated in the motor vehicle industry. It is worth noting that all the five industries in
the upper left column of Figure 2.a are listed in the upper middle column. A similar
phenomenon is observed in other countries. This implies that those industries whose
intermediate transactions are stimulated more strongly tend to have higher induced
value added.
- Figures 2.a and 2.b -
Higher value added is induced in wholesale and retail trade, basic metals, and
motor vehicles in Japan. Mining in Saudi Arabia and the Rest of the World is also
induced strongly. Service and mining tend to have a relatively high induced value added
vis-à-vis induced intermediate transactions owing to their higher value added ratio (i.e.
ratio of value added to output).
Figure 2.b shows the downstream value chain in the Thai automotive industry.
This figure shows how many units of the intermediate transactions and final demand
components would be stimulated in the international and domestic markets, when 100
units of the primary inputs for motor vehicles are generated.
Regarding intermediate transactions, 24.5 units of motor vehicles are provided
in its own industry. Motor vehicles are also provided for the motor vehicle industry in

20
Indonesia, Japan, Malaysia, and the ROW. Interestingly, motor vehicles in Thailand
stimulate community, social, and personal services in Indonesia, which finally induce
household consumption in the latter country.
For the final transactions, 31.3 units of gross fixed capital formation (GFC) and
12.0 units of household consumption (HC) are stimulated in Thailand. Simultaneously,
GFC is stimulated significantly in Australia, Saudi Arabia, the Philippines, Malaysia
and the ROW. Since many motor vehicles produced in Thailand are commercial
vehicles―especially pickup trucks―they are used for fixed capital formation in export
markets.
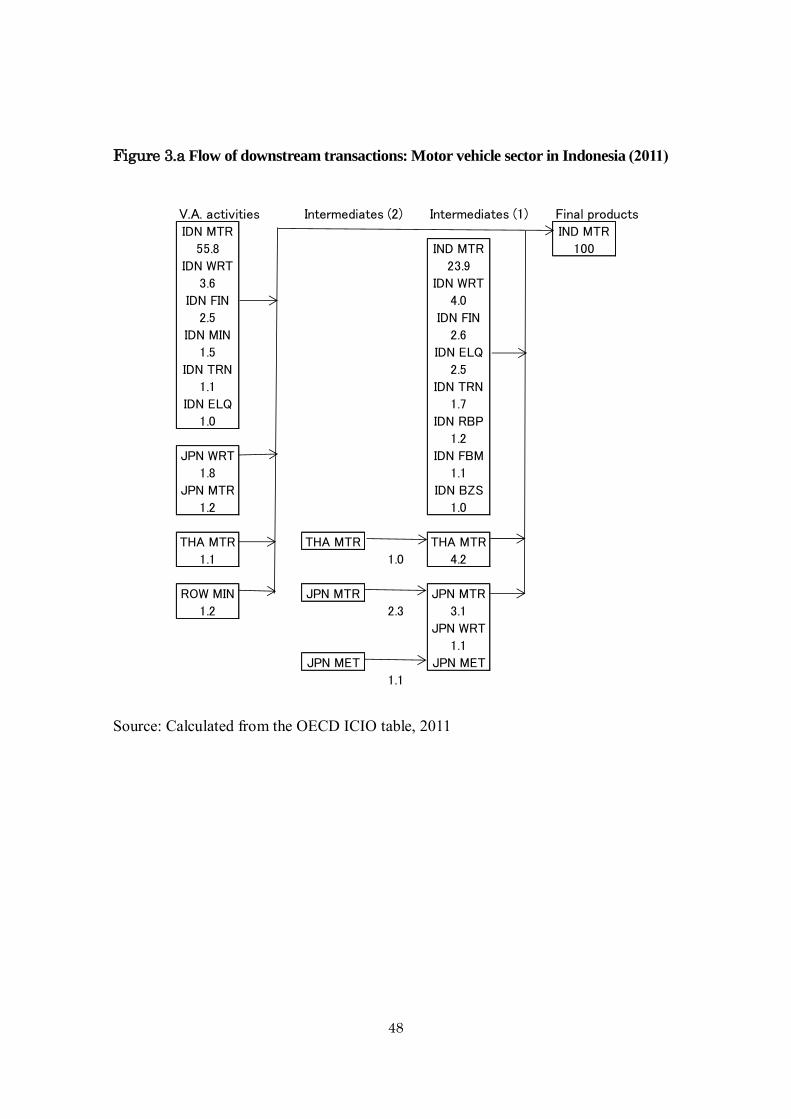
b. Indonesia
Figure 3.1 shows that motor vehicles are the largest supplier of inputs for its
own industry, and this was followed by wholesale and retail trade and financial
intermediation. Material industries, such as rubber and plastic products and fabricated
metal products also demonstrated a similar trend. Motor vehicles in Thailand and Japan
are major suppliers of inputs for the Indonesian motor vehicle industry. Moreover, Japan
is an important supplier of basic metals to Indonesia.
As a reflection of higher intermediate transactions, 55.8 units of value added

21
are induced in the Indonesian motor vehicle industry: note that this share is extremely
high compared with other Southeast Asian countries. Simultaneously, 1.2 units and 1.1
units of value added are generated respectively in motor vehicles in Japan and Thailand.
- Figures 3.a and 3.b -
Figure 3.b shows that motor vehicles stimulate 26.9 units of intermediate
transactions in other community, social and personal services, which then induced a
variety of service activities, such as transportation, public administration, and wholesale
and retail trade: moreover, these service activities are finally embodied in household
consumption and the government’s general final consumption. A significant amount of
motor vehicle inputs is provided to the motor vehicle industry in Indonesia, as well as in
Thailand and Japan.
Unlike Thailand, motor vehicles in Indonesia stimulate more household
consumption than gross fixed capital. In addition, they induce more than one unit of
fixed capital formation in Saudi Arabia, Thailand, and the Philippines.
c. Malaysia

22
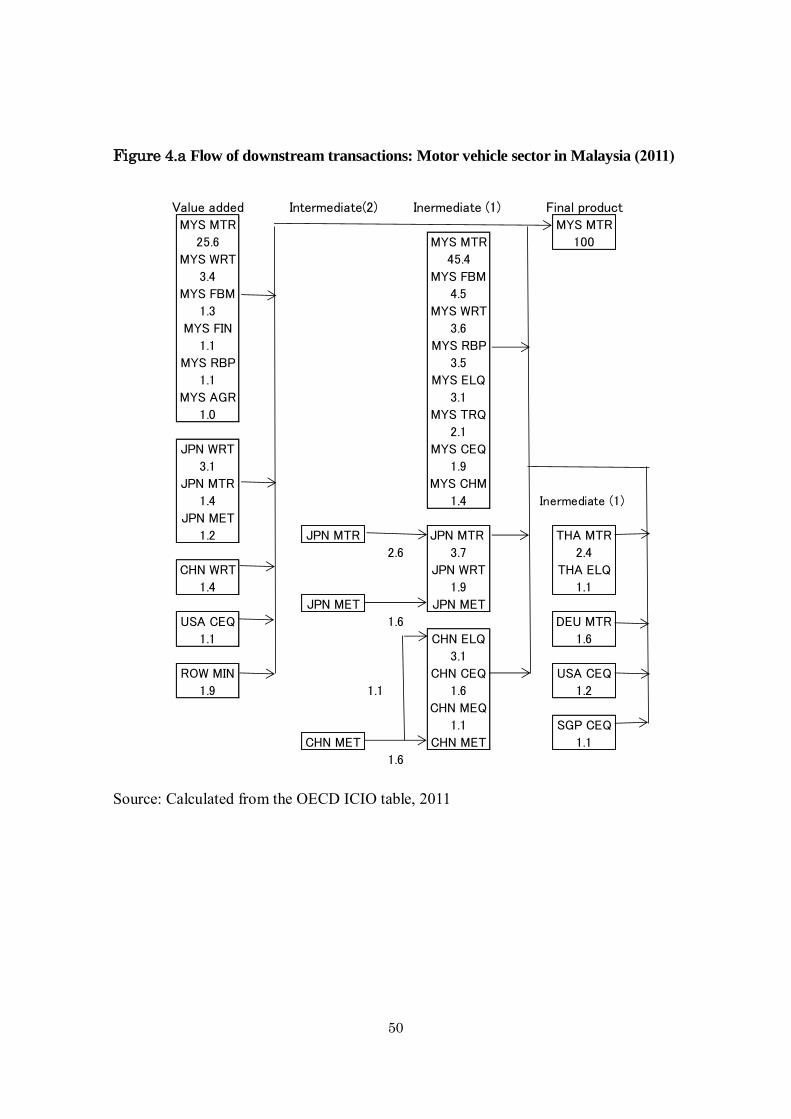
Table 4.a shows that motor vehicles are the largest supplier of intermediate inputs in
Malaysia, followed by fabricated metals and wholesale and retail trade. Also, the
machinery industry, such as electrical machinery, other transport equipment, computers,
electronics, and optical equipment, are import suppliers of inputs.
Japan is an important supplier of motor vehicle inputs, followed by Thailand and
Germany. Computers, electronics, and optical equipment are provided by China, the
USA, and Singapore.
25.6 units of Malaysian value added are induced in motor vehicles, followed by
wholesale and retail trade and fabricated metal products. Also 1.0 unit of value added is
stimulated in agriculture. Japanese value added is stimulated in the wholesale and retail
trade, motor vehicles, and basic metals, followed by wholesale and retail trade in China
and computers, electronics, and optical equipment in the USA.
- Figures 4.a and 4.b -
Figure 4.b shows that 45.4 units of motor vehicles are used as inputs in its own
sector. It is interesting to note that food products are induced by wholesale and retail
trade and agriculture, and the food products affect household consumption. Gross fixed

23
capital formation was induced more strongly than household consumption. No
significant foreign final demand was induced by the Malaysian motor vehicle industry.
d. Philippines
Figure 5.a shows that motor vehicles in the Philippines, Thailand, and Japan are major
suppliers of inputs for the Philippines motor vehicle industry. It should be noted that the
value in the Philippines is much lower than that of Thailand, Indonesia, and Malaysia8.
This reflects the weak supplier base of the Philippines motor vehicle industry. On the
other hand, basic metals are the largest supplier of inputs, supplemented by imports
from Japan, China, and Korea.
As in other countries, the value added in motor vehicles is induced most strongly by
motor vehicles’ final demand. The material and natural resource-based industries are
also affected significantly―in particular basic metals, rubber and plastic products, and
refined petroleum products in the Philippines, mining in Saudi Arabia and the Rest of
the World.
8 Unlike Thailand, Indonesia, and Malaysia, induced value added in motor vehicles in
the Philippines (23.5 units) is much greater than the induced intermediate transactions
of motor vehicles (6.0 units). This occurs because the initial final demand for motor
vehicles induces only value added in the same sector, and it significantly increases value
added in the motor vehicle sector, even if repercussion effects through intermediate
demand are very small. Note that a similar phenomenon is observed in the Vietnamese
motor vehicle industry.

24
- Figures 5.a and 5.b -
Figure 5.b shows that motor vehicles in the Philippines provide inputs to its
own industry in Thailand and Japan, which then induce final demand in the latter
countries. This suggests that the Philippines is integrated into the automobile supply
chain in eastern Asia as a supplier of parts and components. On the other hand, only 6.0
units of input are provided to its own industry, reflecting the weak supplier network
within the country.
Gross fixed capital and household consumption are induced significantly in the
Philippines. In addition, it induces gross fixed capital and household consumption in
other east Asian countries, such as Thailand, Japan, and Indonesia.
e. Vietnam
Figure 6.a shows that the material industry―such as fabricated metal products,
basic metals, non-metallic mineral products, rubber and plastic products, and chemical
products―are stimulated strongly by automobiles’ final demand. Moreover, basic
metals are imported from Korea, China, Japan, and Taiwan. In cotrast, similar as in the

25
Philippines, only 4.1 units of motor vehicle input are provided for own sector,
suggesting the weak supplier base in Vietnam.
Significant amount of value added is induced not only in the motor vehicle
industry but also in the mining and material industries, such as fabricated metals,
mining, non-metallic mineral products, and metal products. Value added is also induced
in the metal products in Japan, China, and Korea, as well as mining in Saudi Arabia and
the Rest of the World.
- Figures 6.a and 6.b -
Figure 6.b shows that the impact of motor vehicle production in Vietnam is
concentrated in gross fixed capital and household consumption. In addition, more than
one unit of household consumption or gross fixed capital is induced in Japan and the
United States. Motor vehicle inputs are provided in Vietnam and Japan, but the value in
Vietnam is extremely low compared with the other Southeast Asian countries, including
Thailand, Indonesia, and Malaysia.
4. Conclusion

26
Participation in global value chains (GVCs) has become increasingly important as a
strategy for economic development. However, participation in GVCs is not sufficient.
Industrial deepening and development of the local supplier base is necessary for
sustainable economic growth, especially for industries with significant economies of
scale such as motor vehicles. This paper explores the structure of the automobile value
chain in Southeast Asia. Trade in value added analysis is applied to the OECD
Inter-Country Input-Output (ICIO) data. Also, the method of value chain mapping is
introduced to illustrate the upstream and downstream transactions of goods and services
along the value chain.
The result of the analysis suggests that there are several group of countries that
have a higher foreign content in the automobile value chain in Southeast Asia, namely
the largest supplier countries of inputs, such as Japan and China; neighbouring
Southeast Asian countries, particularly Thailand and Indonesia; major motor vehicle
producing countries in the Asia-Pacific region, such as Korea and the USA; major
motor vehicle producing countries in Europe, particularly Germany; and natural
resource rich countries, such as Saudi Arabia and Russia.
Decomposition of the domestic content shows that motor vehicles have the
highest domestic content in all the countries. Other industries which have a high
27
domestic content are the service industries, particularly wholesale and retail trade and
financial intermediation; agriculture and mining; the materials industry, such as basic
metals, chemical products, non-metallic mineral products, and textiles; and the
machinery industry, such as electrical and electronic machinery, general machinery, and
other transport equipment.
Unlike the domestic content, motor vehicles do not have the highest foreign
content, but the wholesale and retail trade has the highest foreign content in several
countries. Mining and materials as well as the machinery industry also have a high
foreign content. In particular, basic metals have a high foreign content because the
Southeast Asian countries do not produce high-quality iron and steel and depend on
Japan and the other Northeast Asian countries for procurement of these materials.
Although the foreign content in motor vehicles is not particularly high, each
Southeast Asian country is highly dependent on a specific country for procurement of
parts and components. Such a structure in the value chains reflects the comparative
advantage of the respective countries, as well as the historical path of regional
integration in Southeast Asia. Furthermore, the motor vehicle industry in Southeast Asia
is still highly dependent on parts and components imported from Japan, reflecting the
higher share of Japanese automobile companies in Southeast Asia.

28
Regarding upstream transactions in the value chain mapping, motor vehicles
have the highest induced value added in all the Southeast Asian countries. Those
industries whose intermediate transactions are stimulated most strongly also tend to
have a higher induced value added, although the Philippines and Vietnam have
relatively low intra-industry transactions in motor vehicles. This structure in the
Philippines and Vietnam reflects the weak supplier base of the motor vehicle industry.
Regarding downstream transactions, a significant portion of automobile outputs
are distributed to its own sector (as intermediate inputs), as well as gross fixed capital
formation and household consumption. In countries like Thailand, where many motor
vehicles are used for commercial purposes, gross fixed capital formation is greater than
household consumption. It also shows that part of the motor vehicle outputs are
exported to Japan and neighbouring Southeast Asian countries, as well as Australia and
Saudi Arabia.

29
References:
Asian Development Bank (2013) “Asia’s Economic Transformation: Where to, How,
and How Fast?” Key Indicators for Asia and the Pacific. Part 1 Special Chapter.
Daudin, Guillaume, Christine Rifflart, and Danielle Schweisguth. 2011. “Who Produces
for Whom in the World Economy” Canadian Journal of Economics 44 (4):
1403-37.
Ghosh, Ambica. 1958. “Input-Output Approach to an Allocation System” Econometrica,
25, 58-62.
Hummels, David, Jun Ishii, and Kei-Mu Yi. 2001. “The nature and growth of vertical
specialisation in world trade,” Journal of International Economics, 54: 75-96.
Johnson, Robert C., and Guillermo Noguera. 2012. “Accounting for Intermediates:
Production Sharing and Trade in Value Added.” Journal of International
Economics 86 (2): 224-36.
Koopmans, Robert, Zhi Wang, and Shag-Jin Wei. 2012. “Tracing Value Added and
Double Counting in Gross Exports.” NBER Working Paper 18579, National
Bureau of Economic Research.
Kuroiwa, Ikuo. 2016. “Mapping agricultural value chains with the use of international
input-output data,” IDE Discussion Paper, Chiba: Institute of Developing
Economies (IDE-JETRO).

30
,2017.”The Automotive Value Chain in Thailand.” ERIA Discussion Paper
Series (forthcoming).
OECD. 2013. "Interconnected Economies: Benefitting from the Global Value Chains.”
Synthesis Report. http://www.oecd.org/sti/ind/interconnected-economies-
GVCs-synthesis.pdf (downloaded on 25 October, 2015).
Ozaki, Iwao. 1980. “Structural Analysis of Economic Development (3): Determination
of the Basic Structure of the Economy (in Japanese Keizai Hatten no Kouzou
Bunseki (3): Keizai no Kihonteki Kouzou no Kettei.” Keio Journal of
Economics. Vol.73, No. 5: 720-748.

31
Appendix 1: Calculation of the VS share index
The VS share represents the percentage share of foreign content embodied in exports,
i.e. the share of value added induced by exports accruing to foreign countries. The
methodology was originally developed by Hummels, Ishi, and Yi (2001), and it was
introduced into the analysis of “Trade in value added” by Koopmans, Wang, and Wei
(2014).
Using the notation in Appendix 2, the VS share is calculated as
, where 𝑉𝑆𝑗𝑠 represents the share of foreign content
contained in the exports of sector j in country s. Here the VS share is expressed in
percentage terms, so that it can take a range of 0 to 100.
Moreover, 𝑉𝑆𝑗𝑠 is decomposed as follows:
(1) Share of foreign content by country of origin:
where 𝑉𝑆𝑗𝑟𝑠 represents the share of foreign content of country r contained in the
exports of sector j in country s.
(2) Share of foreign content by sector of origin:

32
where 𝑉𝑆𝑖𝑗𝑠 represents the share of foreign content of sector i contained in the exports
of sector j in country s.
(3) The share of domestic content by sector of origin:
𝐷𝐶𝑖𝑗𝑠 = 100 X V(c)𝑖
𝑆 𝐿𝑖𝑗𝑆𝑆
where 𝐷𝐶𝑖𝑗𝑠 represents the share of domestic content of sector i contained in the exports
of sector j in country s.

33
Appendix 2: Sector classification of the OECD ICIO tables
- Table A1 -

34
Appendix 3: Method for mapping the value chains
(1) Upstream transactions
This section introduces the method for the structural analysis, which was originally
developed by Ozaki (1980) for a single country input-output model. Here, it is extended
to a multi-country model, so that cross-border transactions of goods and services can be
traced inside the model. Moreover, induced value added is calculated to trace the
sequence of value adding activities.9
Using an input coefficient matrix, the accounting identity on the output side (i.e.
the equality between total output and intermediate input plus final demand) can be
expressed as
𝐱 = 𝐀𝐱 + 𝐟 (1)
where
is the vector of total output (𝐱𝑟 is country
𝑟′ s n x 1 vector of output: m and n
respectively represent the number of
countries and sectors).
is the multi-country input coefficient
matrix (𝐀𝑟𝑠 is an 𝑛 × 𝑛 sub-matrix that
indicates the ratio of intermediate inputs
provided by the industries in country 𝑟 to
9 For the technical details of the method, see Kuroiwa 2016.

35
the industries in country s relative to the
industrial outputs in country s).
is the vector of final demand ( 𝐟𝑟 is
country 𝑟’s n x 1 vector of final demand).
Solving the equation (A1) for 𝑋 yields
𝐱 = (𝐈 − 𝐀)−1𝐟 = 𝐋𝐟 (2)
where
is the identity matrix (sub-matrix 𝐈 is an
𝑛 × 𝑛 identity matrix and 𝐎 represents
an 𝑛 × 𝑛 matrix of zeros)
is the multi-country Leontief Inverse
matrix (𝐋𝑟𝑠 is an 𝑛 × 𝑛 Leontief
Inverse sub-matrix).
Then, differentiating each element in x in equation (2) with regard to each element in f
yields
𝑙𝑖𝑗𝑟𝑠=
∆𝐗𝑖𝑟
∆𝐟𝑗𝑆 (3)
That is to say, the ij element in the sub-matrix rs in the Leontief Inverse indicates the

36
output of sector i in country r that is induced directly or indirectly by one unit of final
demand of sector j in country s. Thus, a column vector of, say, sector j in country s
reveals the output of all the sectors (i.e. sector 1 through sector n) in all the countries (i.e.
country 1 through country m) that is induced by one unit of final demand (for sector j in
country s) as shown below:
𝐥𝒋�� = [𝑙1𝑗
1𝑠, ⋯ 𝑙𝑛𝑗1𝑠 , ⋯ 𝑙1𝑗
𝑟𝑠,⋯ 𝑙𝑛𝑗𝑟𝑠 ,⋯ 𝑙1𝑗
𝑚𝑠,⋯ 𝑙𝑛𝑗𝑚𝑠]
′
=[∆𝐗1
1
∆𝐟𝑗𝑠 ,⋯
∆𝐗𝑛1
∆𝐟𝑗𝑠 , ⋯
∆𝐗1𝑟
∆𝐟𝑗𝑠 ,⋯
∆𝐗𝑛𝑟
∆𝐟𝑗𝑠 , ⋯
∆𝐗1𝑚
∂∆𝐟𝑗𝑠 , ⋯
∆𝐗𝑛𝑚
∆𝐟𝑗𝑠 ] ′. (4)
Then, the unit structure for the upstream value chain can be obtained by
post-multiplying A by the diagonal matrix of column vector 𝐥𝒋��.
𝐔𝒋��=𝐀��𝒋
��
=
[ 𝐀11 ⋯ 𝐀1𝑠 ⋯ 𝐀1𝑚
⋮ ⋮ ⋮𝐀𝑟1 ⋯ 𝐀𝑟𝑠 ⋯ 𝐀𝑟𝑚
⋮ ⋮ ⋮𝐀𝑚1 ⋯ 𝐀𝑚𝑠 ⋯ 𝐀𝑚𝑚]
[ ��𝒋
�� 𝟏 ⋯ 0 ⋯ 0
⋮ ⋱ ⋮ ⋮
0 ⋯ ��𝒋�� 𝒓 ⋯ 0
⋮ ⋮ ⋱ ⋮
0 ⋯ 0 ⋯ ��𝒋�� 𝒎
]
, (5)
where ��𝒋�� is the diagonal matrix of column vector 𝐥𝒋
��.
Analogously, induced value added is calculated by post-multiplying the row
vector of the value added coefficients by ��𝒋��.
𝐯𝒋��′=𝐯(𝐜)′��𝒋
��
37
= [𝐯(𝐜)1′ ⋯ 𝐯(𝐜)𝑟′ ⋯ 𝐯(𝐜)𝑚′]
[ ��𝒋
�� 𝟏 ⋯ 0 ⋯ 0
⋮ ⋱ ⋮ ⋮
0 ⋯ ��𝒋�� 𝒓 ⋯ 0
⋮ ⋮ ⋱ ⋮
0 ⋯ 0 ⋯ �� ���� 𝒎
]
(6)
where
𝐯(𝐜) =
[ 𝐯(𝐜)1
⋮𝐯(𝐜)𝑟
⋮𝐯(𝐜)𝑚]
is a column vector of the value added
coefficients (𝐯(𝐜)𝑟 is country 𝑟’s 𝑛 × 1
vector of the value added coefficients).
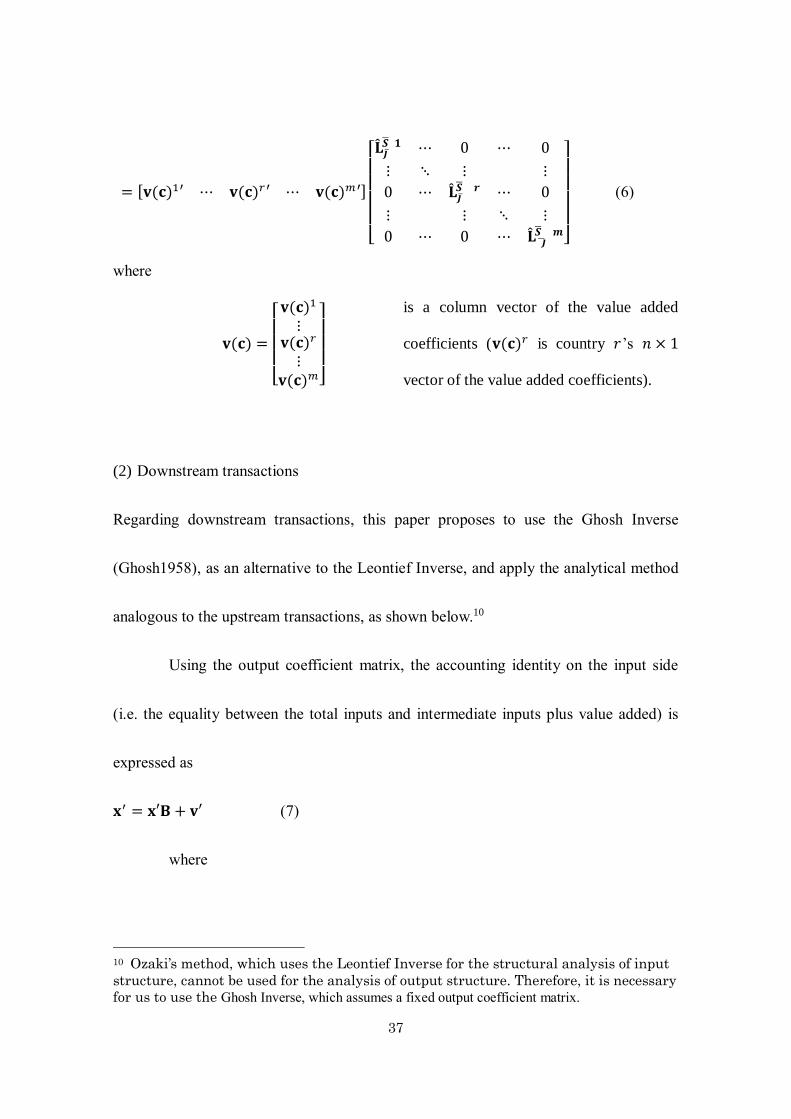
(2) Downstream transactions
Regarding downstream transactions, this paper proposes to use the Ghosh Inverse
(Ghosh1958), as an alternative to the Leontief Inverse, and apply the analytical method
analogous to the upstream transactions, as shown below.10
Using the output coefficient matrix, the accounting identity on the input side
(i.e. the equality between the total inputs and intermediate inputs plus value added) is
expressed as
𝐱′ = 𝐱′𝐁 + 𝐯′ (7)
where
10 Ozaki’s method, which uses the Leontief Inverse for the structural analysis of input
structure, cannot be used for the analysis of output structure. Therefore, it is necessary
for us to use the Ghosh Inverse, which assumes a fixed output coefficient matrix.
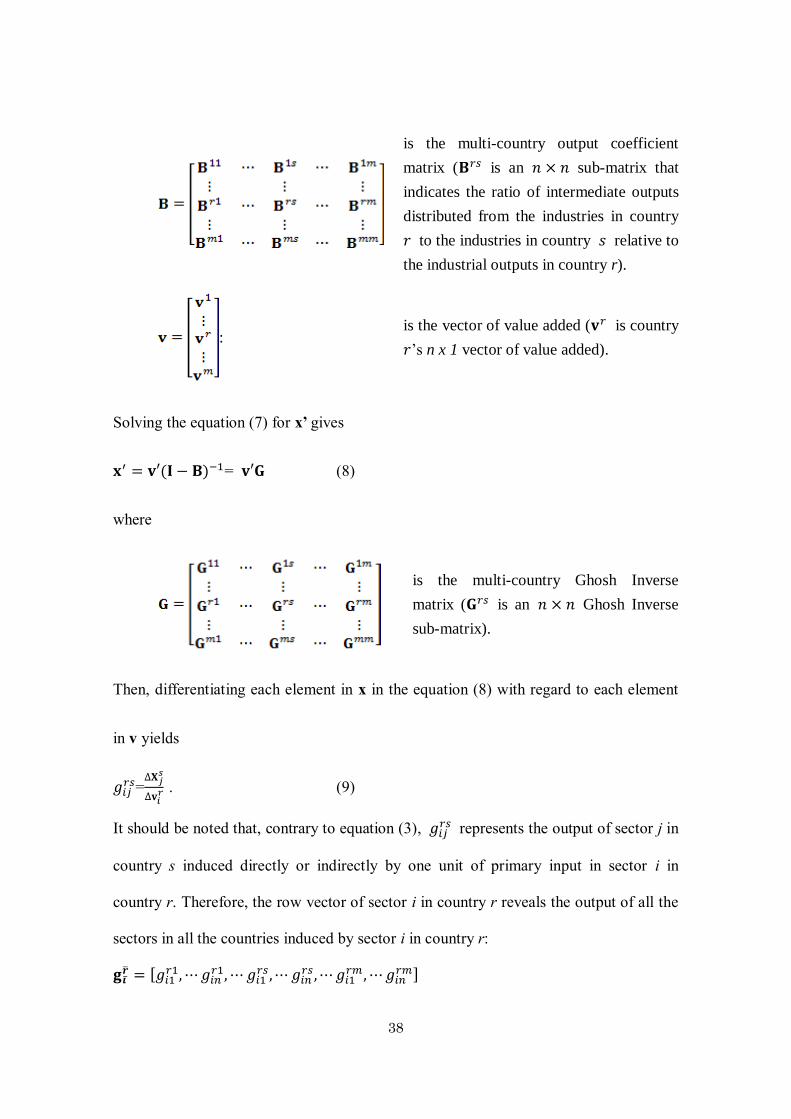
38
is the multi-country output coefficient
matrix (𝐁𝑟𝑠 is an 𝑛 × 𝑛 sub-matrix that
indicates the ratio of intermediate outputs
distributed from the industries in country
𝑟 to the industries in country 𝑠 relative to
the industrial outputs in country r).
: is the vector of value added (𝐯𝑟 is country
𝑟’s n x 1 vector of value added).
Solving the equation (7) for x’ gives
𝐱′ = 𝐯′(𝐈 − 𝐁)−1= 𝐯′𝐆 (8)
where
is the multi-country Ghosh Inverse
matrix (𝐆𝑟𝑠 is an 𝑛 × 𝑛 Ghosh Inverse
sub-matrix).
Then, differentiating each element in x in the equation (8) with regard to each element
in v yields
𝑔𝑖𝑗𝑟𝑠=
∆𝐗𝑗𝑠
∆𝐯𝑖𝑟 . (9)
It should be noted that, contrary to equation (3), 𝑔𝑖𝑗𝑟𝑠 represents the output of sector j in
country s induced directly or indirectly by one unit of primary input in sector i in
country r. Therefore, the row vector of sector i in country r reveals the output of all the
sectors in all the countries induced by sector i in country r:
𝐠𝒊�� = [𝑔𝑖1
𝑟1,⋯𝑔𝑖𝑛𝑟1,⋯ 𝑔𝑖1
𝑟𝑠,⋯ 𝑔𝑖𝑛𝑟𝑠,⋯𝑔𝑖1
𝑟𝑚 ,⋯𝑔𝑖𝑛𝑟𝑚]

39
=[∆𝐗1
1
∆𝐯𝑖𝑟 ,⋯
∆𝐗𝑛1
∆𝐯𝑖𝑟 , ⋯
∆𝐗1𝑠
∆𝐯𝑖𝑟 ,⋯
∆𝐗𝑛𝑠
∆𝐯𝑖𝑟 , ⋯
∆𝐗1𝑚
∆𝐯𝑖𝑟 , ⋯
∆𝐗𝑛𝑚
∆𝐯𝑖𝑟 ] (11)
Then, the unit structure for the downstream transactions can be obtained by
pre-multiplying B by the diagonal matrix of row vector 𝐠𝒊��.
𝐃𝒊��=��𝒊
��𝐁
=
[ ��𝒊
𝒓 1 ⋯ 0 ⋯ 0
⋮ ⋱ ⋮ ⋮0 ⋯ ��𝒊
�� 𝑠 ⋯ 0
⋮ ⋮ ⋱ ⋮0 ⋯ 0 ⋯ ��𝒊
𝒓 𝑚]
[ 𝐁11 ⋯ 𝐁1𝑠 ⋯ 𝐁1𝑚
⋮ ⋮ ⋮𝐁𝑟1 ⋯ 𝐁𝑟𝑠 ⋯ 𝐁𝑟𝑚
⋮ ⋮ ⋮𝐁𝑚1 ⋯ 𝐁𝑚𝑠 ⋯ 𝐁𝑚𝑚]
(12)
where ��𝒊�� is the diagonal matrix of row vector 𝐠𝒊
��.
Finally, the induced final demand is calculated as
𝐅𝒊��=��𝒊
��𝐅(𝐜)
=
[ ��𝒊
1 ⋯ 0 ⋯ 0
⋮ ⋱ ⋮ ⋮0 ⋯ ��𝒊
�� 𝑠 ⋯ 0
⋮ ⋮ ⋱ ⋮0 ⋯ 0 ⋯ ��𝒊
�� 𝑚]
[ 𝐅(𝐜)1
⋮𝐅(𝐜)𝑠
⋮𝐅(𝐜)𝑚]
(13)
where
𝐅(𝐜) =
[ 𝐅(𝐜)1
⋮𝐅(𝐜)𝑠
⋮𝐅(𝐜)𝑚]
:
is the matrix of the final demand
coefficient 11 (𝐅(𝐜)𝑟 is country 𝑟 ’s 𝑛 ×
6 sub-matrix of the final demand
coefficient).12
11 A final demand coefficient is the ratio of final demand to total output. 12 The reason why the final demand matrix for each country has 6 x 𝑚 columns is that
in the ICIO tables the distribution of goods and services for final consumption is divided
into 𝑚 destination countries and six final demand columns (i.e. household consumption,
non-profit institutions serving households, general government final consumption,
gross fixed capital formation, changes in inventories, and direct purchases abroad by
residents) for each destination country.

40

41
Table A1. Sector classification of the OECD ICIO table
AGR Agriculture, hunting, forestry and fishing PUH Private households with employed persons
MIN Mining and quarrying
FOD Food products, beverages and tobacco HC Household consumption
TEX Textiles, textile products, leather and footwear NPI Non-profit institution serving household
WOD Wood and products of wood and cork GGF General government final consumption
PAP Pulp, paper, paper products, printing and publishing GFC Gross fixed capital formation
PET Coke, refined petroleum products and nuclear fuel INV Changes in inventories
CHN Chemicals and Chemical products CON Direct purchase abroad by residents
RBP Rubber and plastic products DISC Discrepancies
NMM Other non-metallic mineral products
MET Basic metals VA Value added
SFBM Fabricated metal products CT Output at basic prices
MEQ Machinery and equipment, nec
CEO Computer, Electronic and optical equipment
ELQ Electrical machinery and apparatus, nec
MTR Motor vehicles, trailers and semi-trailers
TRQ Other transport equipment
OTM Manufacturing nec; recycling
EGW Electricity, gas and water supply
CON Construction
WRT Wholesale and retail trade; repairs
HTR Hotels and restaurants
TRN Transport and storage
PTL Post and telecommunications
FIN Financial intermediation
REA Real estate activities
RMQ Renting of machinery and equipment
ITS Computer and related activities
BZS R&D and other business activities
GOV Public admin. and defence; compulsory social security
EDU Education
HTH Health and social work
OTS Other community, social and personal services
Source: the OECD ICIO table, 2011

42
Table 1 Decomposition of Value Added Components by Country of Origin (2011)
Thailand Indonesia Malaysia Philippines Vietnam
THA 43.5 IDN 74.5 MYS 40.9 PHL 59.7 VNM 44.9
JPN 14.9 JPN 6.2 JPN 11.3 JPN 6.9 CHN 11.9
CHN 6.5 CHN 3.2 CHN 9.6 CHN 5.3 JPN 7.2
ROW 5.1 THA 2.5 USA 5.2 ROW 3.9 ROW 5.1
AUS 3.1 ROW 1.9 DEU 3.7 SAU 3.1 KOR 5.0
USA 2.9 USA 1.1 ROW 3.5 IDN 2.3 USA 2.4
IDN 2.3 KOR 1.1 THA 2.9 KOR 2.2 AUS 2.2
KOR 2.2 DEU 0.9 IDN 2.4 USA 2.2 TWN 2.2
DEU 1.9 AUS 0.9 SGP 2.3 RUS 1.8 THA 2.1
RUS 1.8 IND 0.7 KOR 2.3 THA 1.7 IDN 1.6
SAU 1.3 MYS 0.7 TWN 1.7 AUS 1.4 DEU 1.5
MYS 1.3 SGP 0.7 AUS 1.4 TWN 1.4 SAU 1.4
PHL 1.2 SAU 0.6 GBR 1.2 MYS 1.1 MYS 1.3
TWN 1.1 RUS 0.6 FRA 1.2 SGP 0.9 RUS 1.3
IND 1.0 TWN 0.4 IND 1.0 IND 0.7 IND 0.9
Source: Calculated from the OECD ICIO table, 2011

43
Table 2 Decomposition of Domestic Content by Industry of Origin (2011)
Thailand Indonesia Malaysia Philippines Vietnam
MTR 25.7 MTR 55.8 MTR 25.6 MTR 23.5 MTR 27.4
WRT 3.3 WRT 3.6 WRT 3.4 WRT 8.6 FBM 3.7
FIN 2.3 FIN 2.5 FBM 1.3 MET 7.0 WRT 3.1
MEQ 2.2 MIN 1.5 FIN 1.1 CEQ 3.6 MIN 1.6
EGW 1.2 TRN 1.1 RBP 1.1 RBP 3.0 NMM 1.2
MET 0.9 ELQ 1.0 AGR 1.0 EGW 2.7 EGW 1.1
MIN 0.7 PTL 0.9 EGW 0.9 PET 1.8 MET 1.0
AGR 0.7 OTS 0.8 CHM 0.7 FIN 1.8 FIN 0.8
ELQ 0.7 BZS 0.7 MIN 0.6 CHM 1.0 REA 0.8
TRN 0.7 PET 0.7 TRN 0.5 TRN 0.9 RBP 0.8
OTS 0.6 CHM 0.6 ELQ 0.5 MIN 0.8 AGR 0.5
RBP 0.6 AGR 0.5 PET 0.5 REA 0.7 BZS 0.4
BZS 0.5 FBM 0.5 BZS 0.4 BZS 0.7 CHM 0.4
PTL 0.5 TEX 0.5 TRQ 0.4 AGR 0.6 ELQ 0.3
FBM 0.5 RBP 0.4 REA 0.4 FBM 0.4 CON 0.3
Source: Calculated from the OECD ICIO table, 2011

44
Table 3 Decomposition of Foreign Content by Industry of Origin (2011)
Thailand Indonesia Malaysia Philippines Vietnam
WRT 10.3 WRT 4.6 WRT 10.8 MIN 9.4 WRT 8.9
MIN 8.4 MTR 3.4 MIN 5.6 WRT 6.4 MIN 8.8
MET 8.3 MIN 3.0 CEQ 4.4 MET 4.9 MET 8.1
TRN 3.7 MET 2.7 MET 4.3 TRN 2.1 TRN 3.2
MTR 3.6 TRN 1.4 MTR 3.9 CEQ 1.7 CHM 3.0
FIN 2.7 BZS 1.4 TRN 3.6 MTR 1.7 FBM 2.8
BZS 2.6 FIN 1.2 ELQ 3.4 BZS 1.6 BZS 2.4
MEQ 2.3 CHM 0.7 BZS 3.4 CHM 1.6 FIN 2.2
CHM 1.7 MEQ 0.6 MEQ 3.2 FIN 1.5 ELQ 1.5
EGW 1.3 ELQ 0.6 FIN 2.2 RBP 1.4 MEQ 1.5
FBM 1.3 EGW 0.6 CHM 1.8 PET 0.9 EGW 1.4
RBP 1.1 CEQ 0.5 FBM 1.3 EGW 0.8 MTR 1.2
ELQ 1.0 RBP 0.5 REA 1.2 ITS 0.7 PET 1.2
REA 1.0 FBM 0.5 EGW 1.1 AGR 0.7 RBP 1.1
PET 0.8 REA 0.5 RBP 1.0 REA 0.6 REA 1.0
Source: Calculated from the OECD ICIO table, 2011

45
Figure 1 VS share by Country (2011)
Source: Calculated from the OECD ICIO table, 2011
0
10
20
30
40
50
60
70
CAN MYS THA VNMTWNMEX PHL KOR USA IND IDN AUS ROW CHN EU JPN

46
Figure 2.a Flow of downstream transactions: Motor vehicle sector in Thailand
(2011)
Source: Calculated from the OECD ICIO table, 2011
V.A. activities Intermediates (2) Intermediates (1) final productsTHA MTR THA MTR
25.7 100
THA WRT THA MTR
3.3 24.5
THA FIN THA MEQ THA MEQ
2.3 2.4 7.3
THA MEQ THA MET
2.2 3.2
THA EGW THA WRT
1.2 2.8
THA RBP
JPN WRT 2.4
3.5 THA ELQ
JPN MET 2.0 Intermediates (1) Intermediates (2)
3.0 THA FIN
JPN MTR 1.8 AUS MET
1.9 THA EGW 1.9
1.6
SAU MIN THA FBM KOR MET KOR MET
1.1 1.3 2.0 1.4
3.3 THA TRN
CHN MET JPN MTR 1.0 CHN MET CHN MET
1.0 1.7 1.5
JPN WRT JPN MTR
ROW MIN 1.2 5.0 ROW MIN ROW MET
3.3 JPN MET JPN MET 1.0 1.34.0 4.1
JPN WRT PHL MTR
2.3 1.2

47
Figure 2.b Flow of upstream transactions: Motor vehicle sector in Thailand (2011)
Source: Calculated from the OECD ICIO table, 2011
Primary input Intermediate (1) Intermediate (2) Final demandTHA MTR
100
THA MTR THA GFC SAU GFC
24.5 31.3 2.5
THA WRT THA HC
2.3 12.0 PHL GFC
THA INV 1.4
IDN OTS 2.0
2.0 MYS GFC
IDN MTR AUS GFC 1.4
1.8 3.3
AUS HC ROW GFC
JPN MTR JPN MTR 3.1 3.3
1.6 1.1 ROW HC
SAU GFC 1.4
MYS MTR 2.5
1.3
IDN GFC
ROW OTS 1.4
2.0 IDN HC
ROW MTR 1.1 2.2
1.8
48
Figure 3.a Flow of downstream transactions: Motor vehicle sector in Indonesia (2011)
Source: Calculated from the OECD ICIO table, 2011
V.A. activities Intermediates (2) Intermediates (1) Final productsIDN MTR IND MTR
55.8 IND MTR 100
IDN WRT 23.9
3.6 IDN WRT
IDN FIN 4.0
2.5 IDN FIN
IDN MIN 2.6
1.5 IDN ELQ
IDN TRN 2.5
1.1 IDN TRN
IDN ELQ 1.7
1.0 IDN RBP
1.2
JPN WRT IDN FBM
1.8 1.1
JPN MTR IDN BZS
1.2 1.0
THA MTR THA MTR THA MTR
1.1 1.0 4.2
ROW MIN JPN MTR JPN MTR
1.2 2.3 3.1
JPN WRT
1.1
JPN MET JPN MET
1.1

49
Figure 3.b Flow of upstream transactions: Motor vehicle sector in Indonesia (2011)
Source: Calculated from the OECD ICIO table, 2011
Primary input Intermediate (1) Intermediate (2) Final demand
IDN MTR100
IDN TRN IDN HC 12.1
3.8 1.8 31.8
IDN CON IDN GFC 2.2
1.8 18.6
IDN INV
1.7
IDN OTS IDN GOV IDN GGF
26.9 1.5 1.7
IDN WRT
1.2
IND MTR
23.9 SAU GFC
2.7
THA GFC
1.7
JPN MTR JPN MTR PHL GFC
1.5 1.1 1.5
THA MTR
1.4
50
Figure 4.a Flow of downstream transactions: Motor vehicle sector in Malaysia (2011)
Source: Calculated from the OECD ICIO table, 2011
Value added Intermediate(2) Inermediate (1) Final productMYS MTR MYS MTR
25.6 MYS MTR 100
MYS WRT 45.4
3.4 MYS FBM
MYS FBM 4.5
1.3 MYS WRT
MYS FIN 3.6
1.1 MYS RBP
MYS RBP 3.5
1.1 MYS ELQ
MYS AGR 3.1
1.0 MYS TRQ
2.1
JPN WRT MYS CEQ
3.1 1.9
JPN MTR MYS CHM
1.4 1.4 Inermediate (1)
JPN MET
1.2 JPN MTR JPN MTR THA MTR
2.6 3.7 2.4
CHN WRT JPN WRT THA ELQ
1.4 1.9 1.1
JPN MET JPN MET
USA CEQ 1.6 DEU MTR
1.1 CHN ELQ 1.6
3.1
ROW MIN CHN CEQ USA CEQ
1.9 1.1 1.6 1.2
CHN MEQ
1.1 SGP CEQ
CHN MET CHN MET 1.1
1.6

51
Figure 4.b Flow of upstream transactions: Motor vehicle sector in Malaysia (2011)
Source: Calculated from the OECD ICIO table, 2011
Intermediate (1) Intermediate (2) Intermediate (3) Final demandMYS MTR MYS GFC
100 MYS MTR 48.59
45.43 MYS HC
MYS WRT 25.74
9.93 1.00 1.00
MYS AGR MYS FOD MYS FOD
2.39 1.56 1.44
MYS TRQ
1.25
MYS BZS
1.07

52
Figure 5.a Flow of downstream transactions: Motor vehicle sector in the Philippines (2011)
Source: Calculated from the OECD ICIO table, 2011
V.A. activities Intermediate(2) Inermediate (1) Final productPHL MTR PHL MTR
23.5 100
PHL WRT PHL MET 9.4
8.6 PHL WRT 1.4
PHL MET PHL PET 1.4
7.0 PHL EGW 1.4
PHL CEQ JPN MET PHL MET
3.6 1.0 19.4
PHL RBP PHL CHM PHL RBP
3.0 1.8 8.1
PHL EGW PHL CEQ PHL CEQ
2.7 PHL WRT 5.2 7.0
PHL PET 1.1 PHL WRT
1.8 6.4
PHL FIN PHL MTR
1.8 6.0
SAU MIN PHL PET
SAU MIN 1.5 3.7
3.0 PHL EGW
1.8
JPN WRT PHL TRN
1.6 1.4
ROW MIN THA MTR
2.7 1.3
JPN MET JPN MET
2.4 1.9
JPN MTR
1.2
KOR MET KOR MET
1.7 1.0
CHN MET CHN MET
1.5 1.4

53
Figure 5.b Flow of upstream transactions: Motor vehicle sector in the Philippines (2011)
Source: Calculated from the OECD ICIO table, 2011
Primary input Intermediate (1) Intermediate (2) Final demand PHL MTR PHL GFC
100 32.9
PHL MTR PHL HC
6.0 23.1
PHL INV
1.9 1.3
THA MTR THA MTR THA GFC
6.2 1.5 7.7
THA HC
1.6 1.8
JPN MTR JPN MTR JPN HC
5.3 3.6 2.2
JPN GFC
1.3 1.8
IND GFC
1.2

54
Figure 6.a Flow of downstream transactions: Motor vehicle sector in Vietnam (2011)
Source: Calculated from the OECD ICIO table, 2011
V.A. activities Intermediate(2) Inermediate (1) Final productVNM MTR VNM MTR
27.4 3.0 100
VNM FBM VNM FBM VNM FBM
3.7 13.3
VNM WRT VNM RBP 1.2 VNM MTR
3.1 4.1
VNM MIN VNM MET
1.6 3.8
VNM NMM VNM WRT
1.2 3.6
VNM EGW VNM NMM
1.1 3.1
VNM MET VNM RBP
1.0 2.2
VNM CHM
JPN MET 1.6
2.0 VNM ELQ
JPN WRT 1.6
1.6
KOR MET KOR MET
ROW MIN 3.8 2.4
3.0
CHN MET CHN MET
CHN MET 3.0 2.1
1.7 CHN FBM
CHN WRT 1.9
1.5 CHN ELQ
CHN MIN 1.7
1.4
JPN MET JPN MET
KOR MET 2.6 1.8
1.3
TWN MET TWN MET
SAU MIN 1.1 1.2
1.2

55
Figure 6.b Flow of upstream transactions: Motor vehicle sector in Vietnam (2011)
Source: Calculated from the OECD ICIO table, 2011
Primary input Intermediate (1) Intermediate (2) Final demandVNM MTR VNM GFC
100 41.4
VNM MTR VNM HC
4.1 32.9
VNM WRT
4.0 JPN HC
1.3
JPN MTR JPN MTR JPN GFC
3.0 2.0 1.0
USA HC
1.3