Embed Size (px)
Citation preview

The State of Natural Gas SupplyAPPA/NGSA Joint Meeting
September 30, 2010Chicago, IL
1

A Decade Makes A DifferenceThen
• Shale known but uneconomic
• Storage rates regulated
• Four LNG ports, not all active
• “Associated” gas dominates
• 63-year supply
• Incomplete price transparency
• Limited means to respond to sudden demand changes
Now
• Burgeoning production
• Market-based storage rates
• Eight-plus active LNG ports
• Shale gas replacing associated gas
• 100-year supply
• Most transparent fuel market in the world
• Highly market-responsive supply
#2

3
Decade of Growing Natural Gas Infrastructure

# 4
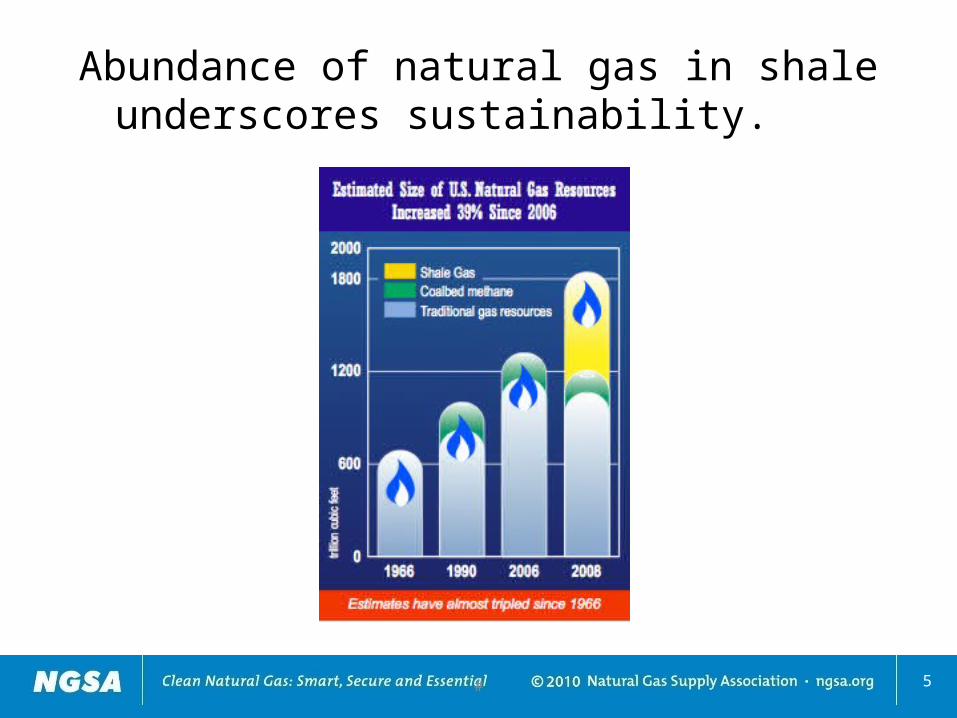
Abundance of natural gas in shale underscores sustainability.
5# 5

How Shale Produces Natural Gas
#
6SouSource: Energy Tomorrow
# 6

# 7

8# 8

Cha
nges
in p
rice
Source: CME Group, a CME/Chicago Board of Trade Company
Ebb and Flow of Commodity PricesNatural Gas 2002-2010

Source: CME Group, a CME/Chicago Board of Trade Company
Ebb and Flow of Commodity PricesNatural Gas compared to Crude Oil & Coal 2002-2010

Ebb and Flow of Commodity PricesNatural Gas compared to other Major Commodities
2002-2010
Source: CME Group, a CME/Chicago Board of Trade Company

Natural Gas MythsMYTH #1 –”There’s not enough natural gas to meet demand from
manufacturers and electrics” – U.S. supply up 40 percent since 2006 due to shale – 100-year supply with potential to grow
MYTH #2 – “Offshore drilling ban will hurt natural gas customers”– Most GOM gas production located in shallow water and excluded from ban
MYTH # 3 – “Heavy-handed regulation of shale could stop its production”– States are heavily invested in shale production – 50,000 jobs created in 2009 in
Pennsylvania alone
MYTH #4 – “Natural gas is vulnerable to Middle East policies”– Between 1 and 3 percent of U.S. demand is met by LNG imports– 75 percent of those imports are from Trinidad & Tobago, remainder from Norway, Algeria,
Egypt, Nigeria and Qatar.

13
Final Thoughts
• Entire gas industry significantly expanded since 2000
• “Fracking” issue real, but manageable• Competitive market has dampened price
volatility• “Dash to Gas” issue overstated• U.S. enjoys most robust, transparent, and
reliable natural gas industry in world