Embed Size (px)
Citation preview
Ana Laura Paixão
Dissertation presented to obtain the Ph.D degree in BiochemistryInstituto de Tecnologia Química e Biológica António Xavier | Universidade Nova de Lisboa
The role of pneumococcal carbon metabolism
in colonisation and invasive disease
Oeiras,March, 2015

i
The role of pneumococcal carbon
metabolism in colonisation and
invasive disease
Ana Laura Paixão
Supervisor: Dr. Ana Rute Neves
Co-Supervisors: Professor Peter William Andrew and Dr.
Hasan Yesilkaya
Interim Co-Supervisor: Professor Adriano Oliveira Henriques
(2012-2015)
Dissertation presented to obtain the Ph.D degree in Biochemistry Instituto de Tecnologia Química e Biológica António Xavier | Universidade Nova de Lisboa
Oeiras, March, 2015
ii
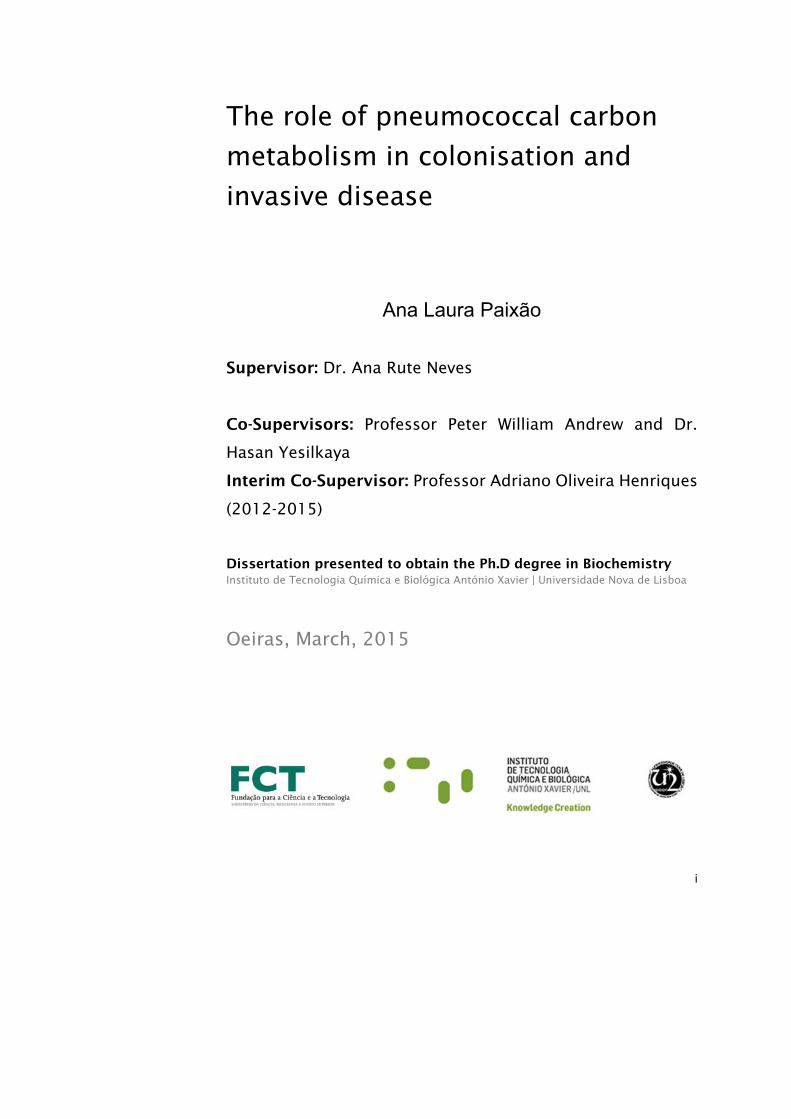
From left to right: Patrick Maria Franciscus Derkx, Raquel Sá Leão
Domingues da Silva, Karina de Bívar Xavier, Cecília Maria Pais de Faria de
Andrade Arraiano, Ana Laura Paixão, Ana Rute Neves, Adriano Oliveira
Henriques and Sofia Rocha Pauleta.
Oeiras, March 27th, 2015
Apoio financeiro da Fundação para a Ciência e Tecnologia e do FSE no
âmbito do Quadro Comunitário de apoio, Bolsa de Doutoramento com a
referência SFRH/BD/46997/2008.
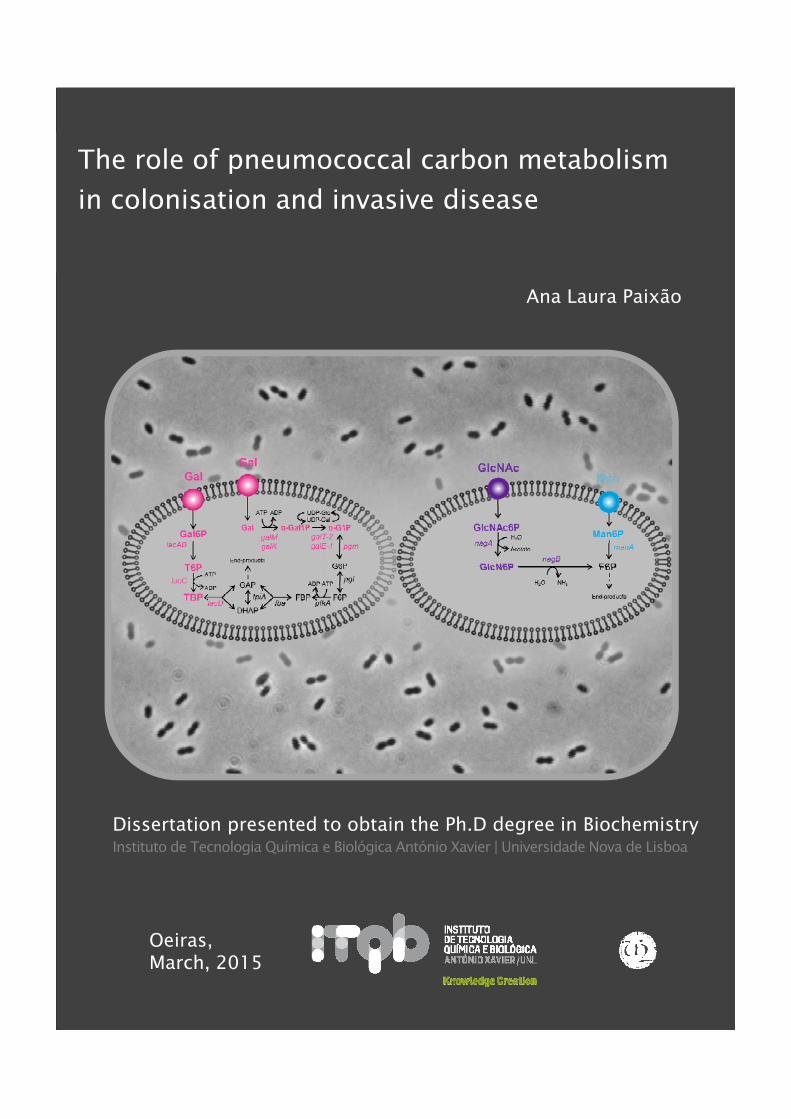
Cover page: Schematic representation of S. pneumoniae and catabolic
pathways for galactose, mannose and N-acetylglucosamine. Background:
phase contrast image of S. pneumoniae.
iii
Acknowledgments
It was a long journey since I started my PhD, in the end of 2009. A full
life experience. A path full of mixed feelings. The energy and motivation
of a new beginning and the fear of failing such a challenge. The happiness
of achieving the goals of this work, the surprise of reaching unexpected
results and the frustration of failed experiments. The winnings and losses,
laughs and tears, and the discovery of different worlds. And now? A new
beginning. But before, I would like to express my gratitude to those that
enriched this work and personal experience.
First, I would like to thank my supervisor, Dr. Rute Neves, for the
opportunity I was given to conduct my PhD in the LAB & in vivo NMR
laboratory. Thank you for giving me the conditions to accomplish this work
until the end, for the guidance, the scientific mentoring and the critical
support in reviewing and writing this thesis. I thank the final effort to
conclude this thesis in time. The encouragement to share my results in
several European meetings and the opportunity to travel to amazing
places.
I thank my co-supervisors, Prof. Peter William Andrew and Dr. Hasan
Yesilkaya, for accepting me as a PhD student. For the openness to
discuss my work and reviewing the first manuscript, contributing to a
fruitful collaboration.
To Prof. Adriano Henriques, my “borrowed” co-supervisor, who
accepted me in a very difficult period. For all the wise advices and for
helping me not to give up. For contributing to my serenity in the most
iv
troublesome times. I am thankful for being always open to discuss my
work and for teach me to do one thing at a time.
To Dr. Jan-Willem Veening who received me in his lab (Molecular
Genetics - Groningen Institute of Biomolecular Sciences & Biotechnology)
and supervised my work during my stay in Groningen. The best work
experience I ever had. Thank you for running such a nice lab, full of
interesting people, who received me so well.
To my dearest post-doc, Morten Kjos, the kindest person I have ever
met. Always concerned with my work and my well-being while I was in
Groningen. Thank you for all the support and help in the complementation
assays, especially when I left Groningen and there were still experiments
to be concluded.
To Prof Helena Santos for the valuable discussions held in her lab
meeting presentations during the first years of my PhD.
To Ana Lúcia Carvalho for her tireless help. For her support and effort
to conclude all the in vivo NMR experiments with me before leaving to her
new professional challenge. For teaching me everything she knew about
HPLC and in vivo NMR. And most importantly, for her friendship. Thank
you for all the good moments in and outside the lab.
To José Caldas I thank all the help, dedication and interest in the
microarrays analysis. Thank you for such a fruitful collaboration.
To Nuno Borges, for being always available to help both by giving
technical tips to conduct my experiments and by showing openness to
share lab material.
v
To Luis Gafeira, for being such an enthusiastic, passionate about
science, who contributes with creative ideas to the work of everyone,
including mine. Always willing to help. I will remember him for being a
good listener and a friend.
To Paula Gaspar for sharing her knowledge and technical support.
To all the past and present members of Cell Physiology and NMR
group (because you are so many I won’t enumerate – I could fail
someone), for being always available to help and for sharing good parties
with the LAB & in vivo NMR laboratory.
To Joana Oliveira for doubling my hands in the growth experiments.
Thank you for the effort.
To all my colleagues in the in the LAB & in vivo NMR that contributed
to this experience in so many ways.
To Dr. Susana Vinga and André Veríssimo for the modelling of the
growth curves and statistical analysis.
To Dr. Rita Ventura and Eva Lourenço for the synthesis of
phosphorylated compounds.
To all the other collaborators that contributed in different ways to this
thesis: Dr. Tomas Kloosterman, Dr. Vitor Fernandes and Prof. Dr. Oscar
Kuipers.
To Dr. Mariana Pinho and her students Pedro, Pedrinho and Raquel,
that moved to our laboratory without disturbing my ongoing work.

vi
To Teresa Maio, Ana Mingote, Sónia Estêvão, Teresa Ferreira, Tiago
Pais and Marta Rodrigues for contributing to the most hilarious times in
and outside the lab.
To all my colleagues from the 2010 PhD classes with whom I shared
good moments.
To Fundação para a Ciência e a Tecnologia for the financial support
that made this doctoral work possible (SFRH / BD / 46997 / 2008).
With the greatest gratitude, I dedicate this thesis to my parents and my
husband, Gonçalo. This experience was also yours. I am grateful for your
unconditional support, comprehension, love, and advices. Without them,
it would have been much more difficult. Thank you for being always there
when I needed the most.
A special word to my siblings Tiago, Afonso and Mariana: love you
guys. Thank you for sharing the most important times with me.
vii
Abstract
Streptococcus pneumoniae is a common asymptomatic commensal of
the human nasopharynx. However, it is better known as a threatening
pathogen that causes serious diseases such as pneumonia, meningitis
and sepsis, as well as other less severe but more prevalent infections
(e.g. otitis media). With the increase of antibiotic resistance and the limited
efficacy of vaccines, pneumococcal infections remain a major problem.
Therefore, the discovery of new therapeutic targets and preventive drugs
are in high demand. Given this panorama, much attention has been
dedicated to classical aspects of virulence (e.g. toxins, capsule or cell wall
components), but the knowledge of in vivo physiology and metabolism of
S. pneumoniae is still limited. This is intriguing, considering that to a large
extent, pneumococcal pathogenesis relies on efficient acquisition and
metabolism of the nutrients required for growth and survival in the host
niches. In line with this view, recent work uncovers substantial
interdependencies between carbohydrate metabolism and virulence.
These findings denote a far greater importance of basic pneumococcal
physiology than previously imagined. However, a scarcity of data on sugar
metabolism and its regulation in S. pneumoniae hampers a
comprehensive understanding of the connections between these
processes.
The ultimate goal of this thesis is to improve our understanding of S.
pneumoniae basic physiology and discover links between carbohydrate
metabolism and the ability of the bacterium to colonise and cause disease.
S. pneumoniae is a strictly fermentative microorganism that relies on
glycolytic metabolism to obtain energy, but free monosaccharides are
limited in the airways. The most abundant sugars present in the natural
niche of S. pneumoniae are the glycoproteins mucins, which are generally
viii
composed of N-acetylglucosamine (GlcNAc), N-acetylgalactosamine
(GalNAc), N-acetylneuraminic acid (NeuNAc), galactose (Gal), fucose
(Fuc) and sulphated sugars linked to the protein core. Importantly, S.
pneumoniae possesses a large set of extracellular glycosidases that act
over glycans and release free sugars that can potentially be used for grow.
Therefore, we hypothesised that the pneumococcus depends on one or
multiple glycan-derived sugars to grow.
To disclose prevalent pathways during growth on mucin we resorted to
a transcriptome analysis comparing transcript levels during growth on the
model glycoprotein porcine gastric mucin and glucose (Glc). The gene
expression profile revealed Gal, Man and GlcNAc as the most probable
glycan-derived sugars to be used as carbon sources by S. pneumoniae
D39. Accordingly, D39 was able to grow on these sugars, but not on other
host-derived glycan monosaccharides (Fuc, NeuNAc, GalNAc), as
expected from its genomic potential. An in depth characterization of
growth profiles on a chemically defined medium supplemented with each
carbohydrate using two different sugar concentrations (30 and 10 mM)
was performed. S. pneumoniae displayed a preference for GlcNAc,
whereas Gal was the least preferable carbohydrate for growth, but
energetically the most favourable. The inefficient Gal catabolism could be
partially explained by the absence of a high affinity Gal transporter. Gal
caused a remarkable metabolic shift from homolactic to a truly mixed acid
fermentation. The in silico predicted pathways for the catabolism of each
sugar were experimentally validated at the biochemical level by
determining sugar-specific intracellular metabolites and pathway specific
enzyme activities. Furthermore, mutants were generated in each pathway
by inactivation of a gene encoding a pathway specific enzyme, and their
analysis proved at the genetic level the biochemical analyses. Curiously,
inactivation of galK (Leloir pathway) rendered a strain unable to grow on
Gal even though an alternative pathway for Gal processing is available
ix
(tagatose 6-phosphate pathway), suggesting a subtle regulatory link
between the two pathways.
Intranasal mouse infection models of pneumococcal colonisation and
disease (bronchopneumonia with bacteraemia) showed that mutants in
the Gal catabolic genes (∆lacD, ∆galK, ∆lacD∆galK) were attenuated, but
mutants on Man (∆manA) and GlcNAc (∆nagA) pathways were not. Our
data identified Gal as a key nutrient for growth in the respiratory tract.
Strengthening this view is the large fraction of genes committed to Gal
catabolism induced by mucin (25%) as well as the considerable group of
virulence genes (8.2%) displaying altered expression in response to Gal.
The response to Gal, GlcNAc and Man (test sugars) was also
evaluated at the transcriptional and metabolic levels. The transcriptional
response was substantial and sugar-specific. Gal, GlcNAc and Man
affected the expression of up to 8.4%, 11.4%, and 14.2% of the genome,
respectively, covering multiple cellular processes, including specific sugar
pathways, central metabolism and virulence. An overview of the
transcriptional response of central carbon metabolism functions (sugar
transport and sugar specific pathways, glycolysis and fermentation
pathways) to growth on the glycan-derived sugars as compared to Glc is
presented. A complete correlation between expression profiles and
pneumococcal phenotypic traits was not observed, denoting regulation at
other cellular layers, such as post-transcriptional and/or metabolic levels.
Hence, the glycolytic dynamics of S. pneumoniae D39 during catabolism
of the glycan-derived sugars were monitored in resting cells by in vivo 13C-
NMR. The rate of GlcNAc utilization was similar to that of the fast
metabolizable sugar Glc, and likewise the glycolytic metabolite fructose
1,6-bisphosphate (FBP), a metabolic activator of homolactic metabolism,
accumulated to considerably high concentrations (circa 30 mM). In line,
this sugar displayed a fully homolactic end-product profile. In contrast, the
rates of Gal and Man utilization were 2-fold lower, the accumulation of

x
FBP was considerably reduced to circa 12 mM, and a mixed-acid
fermentation profile was observed. In addition, specific metabolic
intermediates (α-galactose 6-phosphate and mannose 6-phosphate)
accumulated, suggesting metabolic bottlenecks in the specific steps
converting Gal and Man to glycolytic intermediates. On Man, the
metabolic constriction most likely occurs at the level of mannose 6-
phosphate isomerase, since growth is improved when this activity is
positively modulated by varying the gene expression.
In the host S. pneumoniae has to cope with fluctuating concentrations
of carbon sources. While free sugars, particularly Glc, are scarce in the
nasopharynx, in the bloodstream and during infection Glc is comparatively
higher. Therefore, we hypothesised that during the transition from
colonisation to invasive disease S. pneumoniae adapts to the nutritional
changes through a specific response to a Glc stimulus that result in
changes in gene regulation and metabolism.
Thus, cells growing in glycan-derived sugars or in a sugar mixture of
Gal, GlcNAc and Man were challenged in exponential phase with a Glc
pulse. The response to this stimulus was evaluated at the transcriptional,
physiological and metabolic (for Gal-adapted cells) levels. Glc was readily
consumed independently of the initial substrate adaptation, strengthening
the view that Glc is the preferred carbohydrate for pneumococcal growth.
The transcriptional response to a Glc stimulus was large, the most
represented COG category being carbohydrate metabolism and transport.
Except for Man-adapted cells, Glc exerted mostly negative regulation over
the majority of genes encoding central carbon metabolism functions.
Additionally, Glc induced shifts to more homolactic profiles and, which on
Gal was accompanied by an increase on the FBP concentration following
the Glc pulse.
The expression of classical virulence factors was also sugar
dependent, but Glc consistently exerted a repressive effect over virulence
xi
genes. Interestingly, cells adapted to grow on a sugar mixture (Gal, Man
and GlcNAc) displayed the smallest transcriptional response to Glc,
suggesting improved fitness of S. pneumoniae when exposed to varied
sugars. We suggest that the nasopharynx is the reservoir for the
development of niche-specific virulence traits, essential for successful
colonisation of the niche. In addition, the majority of these virulence
factors are downregulated by a Glc stimulus, and are therefore not
required in disease. The link between sugar metabolism and virulence is
herein reinforced.
Overall, the findings of this thesis substantially contribute to the
comprehension of the interdependency between carbohydrate
metabolism, adaptation to host niches and virulence. Furthermore, the
“omic” data collected at different regulatory layers can in the future be
used to fuel multi-scale metabolic models. Such mathematical
representations of metabolism are expected to provide robust platforms
for data integration and interpretation, and thus generate testable
hypothesis, which in the future will facilitate the identification of novel
targets for alternative therapeutic and preventive drugs.

xiii
Resumo
Streptococcus pneumoniae é um organismo comensal assintomático
comummente encontrado na nasofaringe humana. Contudo, é mais
conhecido no seu papel patogénico ameaçador que causa doenças como
a pneumonia, a meningite ou septicémia, bem como outras infeções
menos severas mas mais recorrentes (e.g. otite média). Com o aumento
da resistência a antibióticos e a eficácia limitada das vacinas, as infeções
pneumocócicas permanecem um importante problema. Assim sendo, há
uma grande necessidade em descobrir novos alvos terapêuticos e drogas
preventivas. Neste contexto, a atenção tem-se focado em aspetos
clássicos da virulência (e.g., toxinas, cápsula ou componentes da parede
celular). No entanto, o conhecimento da fisiologia in vivo e do
metabolismo de Streptococcus pneumoniae é ainda limitado. Esta
situação é intrigante, considerando que em grande medida, a
patogenicidade pneumocócica baseia-se na aquisição eficiente e
subsequente metabolismo de nutrientes necessários para o crescimento
e a sobrevivência em nichos no hospedeiro. A corroborar esta afirmação,
estudos recentes revelam interdependências substanciais entre o
metabolismo dos hidratos de carbono e a virulência, e sugerem que o
conhecimento sólido da fisiologia pneumocócica básica é mais
importante do que antecipado. Contudo, a escassez de dados relativos
ao metabolismo de açúcares e a sua regulação em S. pneumoniae limita
a compreensão das ligações entre estes processos.
O objetivo último desta tese é o de melhorar o conhecimento da
fisiologia básica de S. pneumoniae e descobrir relações entre o
metabolismo dos hidratos de carbono e a capacidade da bactéria em
colonizar e causar doença.
xiv
S. pneumoniae é um microrganismo estritamente fermentativo que
depende do metabolismo glicolítico para obter energia, mas os
monossacáridos livres são escassos nas vias respiratórias. Os açúcares
mais abundantes presentes no nicho natural de S. pneumoniae são as
glicoproteínas mucinas, compostas geralmente por N-acetylglucosamina
(GlcNAc), N-acetylgalactosamina (GalNAc), ácido N-acetilneuramínico
(NeuNAc), galactose (Gal), fucose (Fuc) e açúcares sulfatados ligados a
um núcleo proteico. De realçar que S. pneumoniae possui um grande
conjunto de glicosidases extracelulares que atuam sobre os glicanos e
libertam açúcares que podem potencialmente ser utilizados para
crescimento. Por conseguinte, colocámos e testámos a hipótese de que
os pneumococos podem depender, para crescimento, de um ou de
múltiplos açúcares derivados destes glicanos.
Para revelar as vias predominantes durante o crescimento em
mucinas recorremos a uma análise de transcriptómica comparando os
níveis de transcrição durante o crescimento na presença de mucina
gástrica de suíno, enquanto glicoproteína modelo, e na presença de
glucose (Glc). O perfil de expressão génica revelou que a Gal, Man e
GlcNAc são os açúcares derivados de glicano mais provavelmente
utilizados como fontes de carbono por S. pneumoniae D39. Em
consonância, a estirpe D39 cresce nestes açúcares, mas não em outros
monossacáridos derivados de glicanos do hospedeiro (Fuc, NeuNAc,
GalNAc), como antecipado do seu potencial genómico. Realizou-se uma
caracterização aprofundada dos perfis de crescimento em meio
quimicamente definido suplementado com cada hidrato de carbono
usando duas concentrações de açúcar (30 e 10 mM). S. pneumoniae
demonstrou preferência por GlcNAc, enquanto Gal foi o hidrato de
carbono menos preferido para crescimento, mas energeticamente mais
favorável. O ineficiente catabolismo de Gal pode ser parcialmente
explicado pela ausência de um transportador de Gal de alta afinidade. A
xv
galactose causou um desvio pronunciado da fermentação homolática
para ácidos mistos. As vias catabólicas previstas in silico para cada
açúcar foram experimentalmente validadas ao nível bioquímico, pela
determinação de metabolitos intracelulares específicos de cada açúcar e
atividades enzimáticas específicas de cada via. Adicionalmente,
geraram-se mutantes por inativação de um gene que codifica uma
enzima específica de cada via, e a sua análise confirmou ao nível
genético a análise bioquímica. Curiosamente, a inativação de galK (via
Leloir) originou uma estirpe incapaz de crescer em Gal, apesar de ter uma
via alternativa disponível para o processamento deste açúcar (via da
tagatose 6-fosfato), sugerindo uma conexão subtil na regulação das duas
vias.
Modelos de infeção intranasal de ratinhos de colonização
pneumocócica e doença (broncopneumonia com bacteriemia)
demonstraram que mutantes em genes catabólicos da Gal (∆lacD, ∆galK,
∆lacD∆galK) são atenuados, mas mutantes nas vias da Man (∆manA) e
GlcNAc (∆nagA), não. Os nossos estudos identificaram a Gal como um
nutriente crucial para o crescimento no trato respiratório. A grande fração
de genes do catabolismo da Gal induzida pela mucina (25%) bem como
um grupo considerável de genes de virulência (8.2%) com expressão
alterada em Gal, reforçam esta conclusão.
A resposta à Gal, GlcNAc e Man (açúcares teste) foi também avaliada
aos níveis transcricional e metabólico. A resposta transcricional foi
substancial e dependente do açúcar. Gal, GlcNAc e Man afetaram a
expressão até 8.4%, 11.4% e 14.2% do genoma, respetivamente,
abrangendo múltiplos processos, incluindo vias específicas de açúcar,
metabolismo central e virulência. Apresenta-se uma visão geral da
resposta transcricional de funções do metabolismo central de carbono
(transporte de açúcar e vias específicas de açúcares, glicólise e vias
fermentativas) no crescimento em açúcares derivados de glicanos, em
xvi
comparação com a Glc. Não foi observada uma correlação completa
entre os perfis de expressão e as características fenotípicas do
pneumococo, demonstrando a existência de outros níveis de regulação,
incluindo regulação pós-transcricional e/ou metabólica.
Consequentemente, a dinâmica glicolítica de S. pneumoniae D39 durante
o catabolismo de açúcares derivados de glicanos foi monitorizada em
células em suspensão por in vivo 13C-NMR. A taxa de consumo de
GlcNAc foi semelhante à do açúcar rapidamente metabolizado Glc e, do
mesmo modo o metabolito glicolítico frutose 1,6-bifosfato (FBP), um
ativador do metabolismo homolático, acumulou em concentrações
elevadas (cerca de 30 mM). Em concordância, este açúcar apresentou
um perfil de produtos finais totalmente homolático. Em contraste, as taxas
de consumo de Gal e Man foram 2 vezes inferiores, a acumulação de
FBP foi consideravelmente reduzida a aproximadamente 12 mM, e o
perfil de fermentação de ácidos mistos foi observado. Além disso, foi
detectada a acumulação de intermediários metabólicos específicos (α-
galactose 6-fosfato e manose 6-fosfato), sugerindo estrangulamentos
metabólicos em passos específicos da conversão de Gal e Man a
intermediários glicolíticos. Em Man, a constrição metabólica muito
provavelmente ocorre ao nível da manose 6-fosfato isomerase, uma vez
que o crescimento é melhorado quando esta atividade é positivamente
modulada por alteração da expressão do gene.
No hospedeiro, S. pneumoniae tem que lidar com concentrações
variáveis de fontes de carbono. Enquanto os açúcares livres,
particularmente Glc, são escassos na nasofaringe, na corrente sanguínea
e durante a infeção, a Glc é comparativamente elevada. Deste modo,
colocámos a hipótese que durante a transição de colonização para
doença invasiva S. pneumoniae adapta-se às variações nutricionais
através de uma resposta específica a um estímulo de Glc que resulta em
variações na regulação génica e no metabolismo.

xvii
Deste modo, células a crescerem em açúcares derivados de glicanos
ou numa mistura de Gal, GlcNAc e Man foram sujeitas, durante o
crescimento exponencial, a um pulso de Glc. A resposta a este estímulo
foi avaliada aos níveis transcricional, fisiológico e metabólico (para
células adaptadas a Gal). A Glc foi prontamente consumida
independentemente da adaptação inicial ao substrato, reforçando que a
Glc é o hidrato de carbono preferido para o crescimento dos
pneumococos. A resposta transcricional ao estímulo de Glc foi ampla,
sendo a categoria COG mais representada a do metabolismo de hidratos
de carbono e do transporte. À exceção de células adaptadas a Man, a
Glc exerceu principalmente uma regulação negativa sobre a maioria dos
genes que codificam funções do metabolismo central de carbono.
Adicionalmente, a Glc induziu desvios para perfis mais homoláticos e, em
Gal foi acompanhado por um aumento da concentração de FBP após o
pulso de Glc.
A expressão de fatores de virulência clássicos foi também dependente
do açúcar, mas a Glc exerceu consistentemente um efeito repressivo
sobre os genes de virulência. De interesse, notámos que as células
adaptadas ao crescimento numa mistura de açúcares (Gal, Man e
GlcNAc) originaram uma menor resposta transcricional à Glc, sugerindo
uma melhor aptidão de S. pneumoniae quando exposto a uma variedade
de açúcares. Sugerimos que a nasofaringe é o reservatório para o
desenvolvimento de traços específicos de virulência, essenciais para a
colonização bem-sucedida deste nicho. Adicionalmente, a maioria destes
fatores de virulência são reprimidos pelo estímulo de Glc, não sendo por
conseguinte necessários na doença. A ligação entre metabolismo de
açúcares e virulência é aqui reforçada.
Globalmente, as descobertas desta tese contribuem substancialmente
para a compreensão da interdependência entre o metabolismo de
hidratos de carbono, a adaptação aos nichos do hospedeiro e a

xviii
virulência. Além disso, os dados “ómicos” recolhidos a diferentes níveis
de regulação podem no futuro ser utilizados em modelos metabólicos
multi-escala. É esperado que tais representações matemáticas do
metabolismo constituam plataformas robustas para a integração e a
interpretação de dados e, por conseguinte, para a geração de hipóteses
que no futuro facilitarão a identificação de novos alvos para terapêuticas
alternativas e drogas preventivas.
xix
Contents
Thesis outline ........................................................................................ xxi
Abbreviations ....................................................................................... xxiii
Chapter 1 - General introduction .............................................................. 1
Chapter 2 - Host glycan sugar-specific pathways in Streptococcus pneumoniae ........................................................................................... 71
Chapter 3 - Transcriptional and metabolic effects of glucose on S. pneumoniae utilizing glycan-derived sugars ........................................ 169
Chapter 4 - Overview and concluding remarks .................................... 247

xxi
Thesis outline
Pneumococcal infections have high socio-economic impact, and are
therefore a major burden worldwide. According to the WHO, S.
pneumoniae causes over 1 million deaths per year in children under 5
years of age. Moreover, this high mortality is exacerbated by the rate at
which the organism acquires resistance to traditional antibiotics and by
the re-emergence of non-vaccine type strains. Therefore, the
development of new therapeutic and preventive agents demands an
increasing understanding of S. pneumoniae physiology and virulence.
The overall goal of this thesis is to gain new insights regarding S.
pneumoniae adaptive response to sugar availability and the link to in vivo
fitness and virulence.
Chapter 1 starts with a brief introduction to the main phenotypic traits
of S. pneumoniae, its ability to colonise the nasopharynx and cause
disease, and provides an overview of the traits of the bacterium in the
perspective of a commensal and a pathogen. An overview of the major
virulence factors is given as well as its link to carbohydrate metabolism.
The catabolism, of monosaccharides (galactose, mannose, N-
acetylglucosamine, N-acetylgalactosamine, N-acetylneuraminic acid and
fucose) is reviewed. The relevance of these sugars in the lifestyle of
different bacteria is discussed. Lastly, the current knowledge concerning
central metabolism in S. pneumoniae is overviewed.
In Chapter 2 we identified the sugar catabolic pathways likely used
during growth on a model glycoprotein, porcine gastric mucin, by a whole-
genome transcriptome analysis. An in depth characterization of
pneumococcal growth on the glycan-derived sugars galactose, mannose
xxii
and N-acetylglucosamine is provided. The catabolic pathways of those
sugars were, for the first time, experimentally validated at genetic and
biochemical levels, confirming the in silico predictions. Finally, the
relevance of sugar-specific catabolic genes to in vivo fitness was
assessed in murine models of colonisation (nasopharyngeal carriage) and
pneumococcal disease (bronchopneumonia with bacteraemia).
Chapter 3 describes the transcriptional and metabolic responses in the
presence of galactose, mannose and N-acetylglucosamine, by DNA
microarrays and in vivo 13C-NMR, respectively. Glucose is used as the
reference sugar.
The effect of adding the fast metabolizable sugar glucose to S.
pneumoniae cells actively growing on galactose, mannose, N-
acetylglucosamine or in a mixture thereof is evaluated at the
transcriptional, physiological and metabolic levels.
Furthermore, the influence of the carbohydrate source and the glucose
pulse in the gene expression of known virulence factors is examined at
the transcriptional level by DNA microarrays.
Chapter 4 provides an integrative discussion of the findings reported in
this work.
xxiii
Abbreviations
ABC ATP-binding cassette
BgaA β-galactosidase A
CAP Community-acquired pneumonia
CcpA Carbon catabolite protein A
CCR Carbon catabolite repression
CDM Chemically defined medium
COG Clusters of orthologous groups
CRE Catabolite response elements
DHAP Dihydroxyacetone phosphate
DW Dry weight
EI Enzyme I
EMP Embden-Meyerhof-Parnas
Eno Enolase
F6P Fructose 6-phosphate
Fba Fructose-bisphosphate aldolase
Fuc Fucose
FucA L-fuculose phosphate aldolase
FucI L-fucose isomerase
FucK L-fuculose kinase
FucO L-1,2-propanediol oxidoreductase
FucU Fucose mutarotase
G6P Glucose 6-phosphate
Gal Galactose
Gal6P Galactose 6-phosphate
GalE UDP-glucose 4-epimerase
GalK Galactokinase
GalM Aldolase 1-epimerase (galactose mutarotase)
GalN Galactosamine
xxiv
GalN6P Galactosamine 6-phosphate
GalNAc N-acetylgalactosamine
GalNAc6P N-acetylgalactosamine 6-phosphate
GalP Galactose permease
GalT Galactose 1-phosphate uridylyltransferase
Gap Glyceraldehyde 3-phosphate
Glc Glucose
GlcN Glucosamine
GlcN6P Glucosamine 6-phosphate
GlcNAc N-acetylglucosamine
GlcNAc6P N-acetylglucosamine 6-phosphate
HPLC High performance liquid chromatography
Hpr Histidine phosphocarrier protein HPr
IPD Invasive pneumococcal disease
LacAB Galactose 6-phosphate isomerase subunits LacA andLacB
LacC Tagatose 6-phosphate kinase
LacD Tagatose 1,6-diphosphate aldolase
Lcto Lactate oxidase
LDH Lactate dehydrogenase
Man Mannose
Man6P Mannose 6-phosphate
ManA Mannose 6-phosphate isomerase
ManNAc N-acetylmannosamine
ManNAc6P N-acetylmannosamine 6-phosphate
NagA N-acetylglucosamine 6-phosphate deacetylase
NagB Glucosamine 6-phosphate isomerase
NAD+ Nicotinamide adenine dinucleotide
NADH Dihydronicotinamide adenine dinucleotide
NanA Neuraminidase A
NanE N-acetylmannosamine 6-phosphate epimerase
NanK N-acetylmannosamine kinase
xxv
NBD ATP- or nucleotide-binding domains
NeuNAc N-acetylneuraminic acid
NMR Nuclear magnetic resonance
ODmax Maximum optical density
PCV Pneumococcal conjugate vaccine
PDHC Pyruvate dehydrogenase complex
PFL Pyruvate formate-lyase
PFL-AE Pyruvate formate-lyase activating enzyme
Pgk Phosphoglycerate kinase
Pgm Phosphoglucomutase
PME Phosphomonoester
PTS Phosphoenolpyruvate-dependent carbohydrate phosphotransferase system
Pyk Pyruvate kinase
SBP Solute-binding proteins
Adh Alcohol dehydrogenase
SpxB Pyruvate oxidase
StrH β-N-acetylglucosaminidase
T6P Tagatose 6-phosphate
TBP Tagatose 1,6-bisphosphate
TMD Transmembrane domains
WHO World Health Organization
α-G1P α-glucose 1-phosphate
α-Gal1P α-galactose 1-phosphate
α-Gal6P α-galactose 6-phosphate
μmax Maximum specific growth rate


1
Chapter 1
General introduction
Chapter 1 - General introduction

General introduction
3
Chapter 1 - Contents
Streptococcus pneumoniae ..................................................................... 4
At the core of great discoveries ............................................................ 4
General characteristics ......................................................................... 5
S. pneumoniae, a commensal and a pathogen .................................... 7
Transition from colonisation to disease .............................................. 11
Virulence factors .................................................................................... 12
Virulence and carbohydrate metabolism ............................................ 17
Glycans at the interface of bacteria-host interactions ............................ 20
Pneumococcal carbohydrate metabolism .............................................. 22
Carbohydrate metabolism and its importance for pneumococcal lifestyle ............................................................................................... 22
Sugar transport systems in S. pneumoniae ....................................... 24
Glycan-derived monosaccharides: pathways and functions .............. 27
Galactose ........................................................................................ 27
Galactose catabolism .................................................................. 28
Mannose ......................................................................................... 31
Mannose catabolism ................................................................... 32
Amino sugars: N-acetylneuraminic acid, N-acetylglucosamine and N-acetylgalactosamine ................................................................... 34
NeuNAc and GlcNAc catabolism ................................................ 35
GalNAc catabolism ...................................................................... 40
Fucose ............................................................................................ 42
Fucose catabolism ...................................................................... 43
Glycolysis, glucose and pyruvate metabolism .................................... 47
References ............................................................................................. 51
Chapter 1
4
Streptococcus pneumoniae
At the core of great discoveries
Streptococcus pneumoniae, also known as the pneumococcus, was
discovered in 1881 by Louis Pasteur and George Miller Sternberg in two
independent studies [1,2]. Shortly after its isolation S. pneumoniae was
identified as a major causative agent of human lobar pneumonia [1,2].
Due to its morphology (pairs of coccoid bacteria) and the involvement in
pneumonia the bacterium was then named Diplococcus pneumoniae [1].
The present nomenclature remains since 1974 [1].
The story of S. pneumoniae is intertwined with the history of different
fields of research that range from microbiology, molecular biology,
biochemistry to immunology (reviewed in [1,2]). Indeed, the study of the
pneumococcus was at the centre of critical important discoveries. In 1928,
Griffith demonstrated that when mice were inoculated with a mixture of
dead virulent pneumococcal strains and live avirulent pneumococci,
virulent phenotype strains could be recovered from the pneumonia dead
animals. This phenomenon was denominated the “transforming principle”
[3], and preceded the discovery of DNA as the hereditary material. Indeed,
in 1944, Avery, McLeod and McCarthy proved, that the DNA was the
transforming principle responsible for the phenotypic changes [4].
Importantly, the discovery that pneumococci were “coated” by a
polysaccharide capsule (“sugar-coated microbe” as called by Avery) with
serological reactivity provided the basis for the development of the current
polysaccharide vaccines [5–10]. Furthermore, the pneumococcus is
behind the comprehension of antibiotic resistance. It was one of the first
microorganisms recognized to develop resistance to antibiotics [1]. The
pneumococcus is also closely associated with key discoveries in
General introduction
5
molecular processes such as quorum sensing, autolysis and
opsonisation, as well as to the development of molecular tools, the Gram’s
stain technique and other identification methods (e.g. Quellung reaction
and bile solubility test) still in use today [1,2].
General characteristics
Streptococcus pneumoniae is a low-GC (40%), Gram-positive,
lanceolate cocci (elongated ellipsoid-shape) [11]. These ovoid cells are
commonly designated ovococci (Fig. 1.1) [12,13]. It is usually arranged in
pairs (diplococci), but can occur as single cells or in short chains.
Individual cells can range from 0.5 to 1.25 micrometres in size. S.
pneumoniae is non-motile and a non-spore forming bacterium. It is an
aerotolerant anaerobe and a strictly fermentative microorganism that
mainly converts carbohydrates to lactic acid (homolactic fermentation)
[11].
S. pneumoniae is a fastidious bacterium that requires nutritionally rich
media for growth. Its nutritional requirement for choline is a unique
characteristic of this microorganism [14]. It grows optimally at 37ºC in a
pH range of 6.5-7.5. When cultured until stationary phase of growth the
bacterium displays a tendency to undergo autolysis due to the presence
of efficient autolysins, such as autolysin, LytA [15]. The pneumococci are
also naturally transformable, taking up DNA from the medium (other
bacteria), a phenomenon that contributes to a highly variable genome
[16].
The genus Streptococcus belongs to the phylum Firmicutes,
Lactobacillales order, and Streptococcaceae family. Based on 16S
ribosomal RNA, the pneumococcus belongs to the mitis group alongside
with other bacteria that can be isolated from the human oro-nasopharynx
(e.g. Streptococcus oralis, Streptococcus gordonii, Streptococcus mitis,
Streptococcus infantis, S. pseudopneumoniae) [17,18]. The genome
Chapter 1
6
similarity within this group of microorganisms together with frequent
events of horizontal gene transfer makes it difficult to differentiate S.
pneumoniae from other closely related commensals (S. mitis, S. oralis, S.
infantis, S. pseudopneumoniae) [18–20].
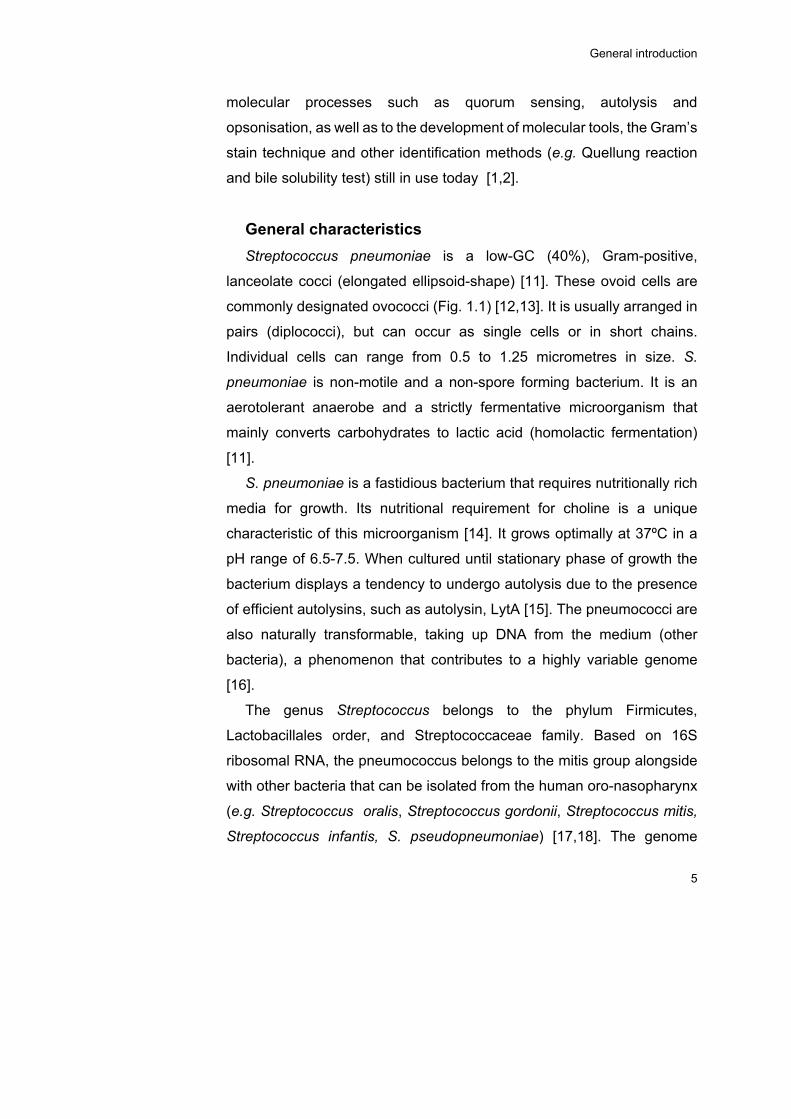
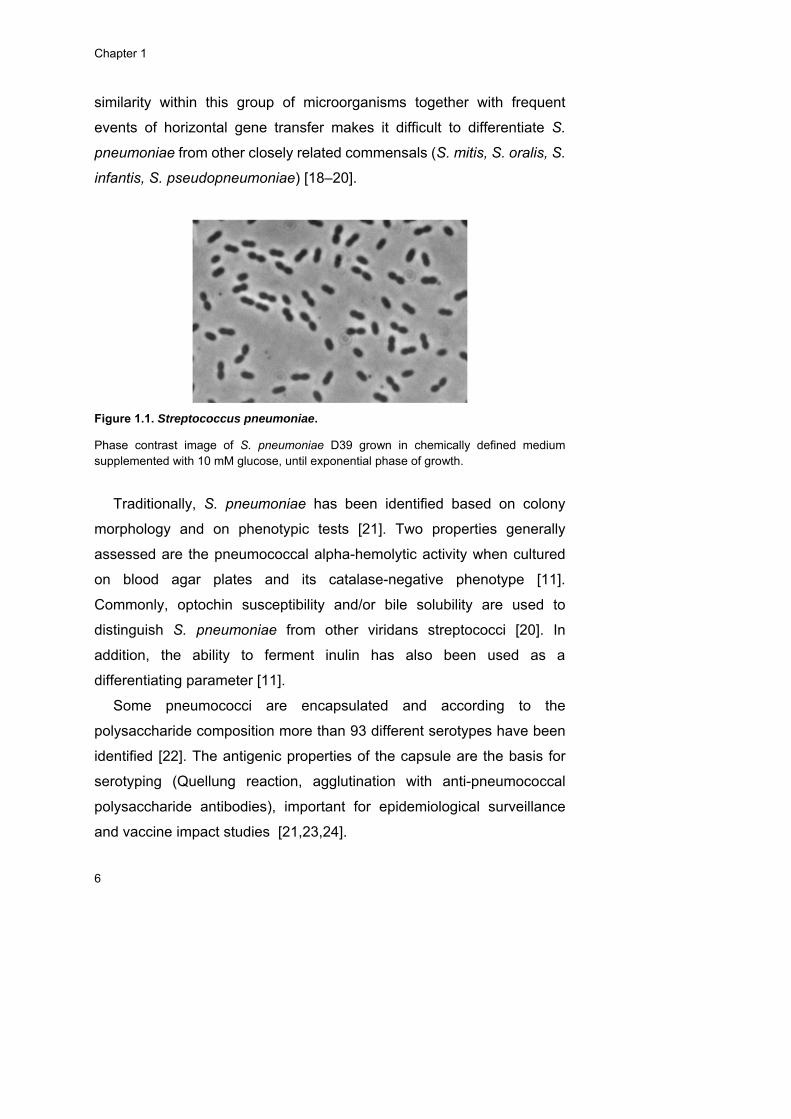
Figure 1.1. Streptococcus pneumoniae.
Phase contrast image of S. pneumoniae D39 grown in chemically defined medium supplemented with 10 mM glucose, until exponential phase of growth.
Traditionally, S. pneumoniae has been identified based on colony
morphology and on phenotypic tests [21]. Two properties generally
assessed are the pneumococcal alpha-hemolytic activity when cultured
on blood agar plates and its catalase-negative phenotype [11].
Commonly, optochin susceptibility and/or bile solubility are used to
distinguish S. pneumoniae from other viridans streptococci [20]. In
addition, the ability to ferment inulin has also been used as a
differentiating parameter [11].
Some pneumococci are encapsulated and according to the
polysaccharide composition more than 93 different serotypes have been
identified [22]. The antigenic properties of the capsule are the basis for
serotyping (Quellung reaction, agglutination with anti-pneumococcal
polysaccharide antibodies), important for epidemiological surveillance
and vaccine impact studies [21,23,24].
General introduction
7
Despite the application of different phenotypic and genotypic
techniques (e.g. PCR targeting virulence genes, pulsed-field gel
electrophoresis, multilocus sequence typing (MLST), multilocus sequence
analysis (MLSA)), and recently proteomic profiling (MALDI-TOF MS),
identification and classification of S. pneumoniae has been problematic
and is still controversial [18,20,21,25,26]. Atypical reactions to standard
identification tests are documented [18,25]. Part of this struggle stems out
from the pneumococcus’ vast pan-genome and its genomic plasticity.
S. pneumoniae, a commensal and a pathogen
The scientific interest on S. pneumoniae was primarily raised because
the organism has been a leading cause of mortality worldwide. In the
beginning of the 20th century, Sir William Osler referred to it as the “captain
of the men of death” [27,28], and pneumonia was the “natural end of
elderly people” [29]. Nowadays, S. pneumoniae is also recognized as a
commensal microorganism, which resides in the mucosal surface lining
the upper respiratory tract, i.e. the nasopharynx of humans [30,31].
Pneumococci are members of the respiratory tract microflora alongside
with other prominent opportunistic pathogens such as Haemophilus
influenzae, Moraxella catarrhalis and Staphylococcus aureus [32].
Colonisation is usually asymptomatic and, for that reason, an important
vehicle for dissemination within the community, which occurs through
direct contact with contaminated secretions or aerosols of healthy or sick
carriers [29,30,33,34]. Colonisation is more frequent in small children,
which are usually colonised during the first year of life [33]. Carriage rates
are age-related, with higher incidence in the childhood (2-3 years) [33],
decreasing to less than 10% in the adult age [30]. The close contact with
children increases the carriage rates in adults [29]. In developing
countries the frequency of carriage in children is 2-3 times higher than in
developed countries [31]. Risk factors associated with higher incidences
Chapter 1
8
of pneumococcal carriage and disease are: ethnicity, crowding (e.g.
attendance to day-care centres, hospitals, schools, contact with older
siblings and children), environmental (e.g. smoking) and socioeconomic
(e.g. living circumstances, income) ([33], reviewed in [35,36]).
Colonisation is a dynamic process in terms of duration and colonising
serotypes in the lifetime of an individual. Carriage with one or more
serotypes can occur simultaneously or sequentially. It is a transient stage
and its duration is serotype-dependent and influenced by past carriage
episodes [31]. It is longer in young than older children [37,38]. Most often
pneumococcal infections occur following a newly-acquired strain [31].
Some serotypes are more commonly involved in carriage while others, a
relatively small number, are more related with invasive pneumococcal
disease [16,39,40]. This finding suggests that the latter clones have
specific genes that facilitate progression to disease [41]. Interestingly,
high mortality rates were found within serotypes of lower invasive potential
[16,39].
The establishment of a carrier state is a pre-requisite for pneumococcal
disease with the colonising homologous strain, which usually occurs when
the bacterium spreads to other parts of the human body [30,33]. Indeed,
the pneumococcus is an opportunistic bacterium and children, elderly
(>65 years old) and immunocompromised people are at increased risk of
pneumococcal disease [33,42]. S. pneumoniae is an etiological agent of
mild respiratory mucosal infections such as sinusitis or otitis media (non-
invasive diseases), but also less prevalent but more serious invasive
pneumococcal diseases (IPD), when the pneumococcus gains access to
normally sterile areas of the human body, such as bacteremic pneumonia
or pneumonia with empyema, meningitis or sepsis [33].
With the advent of antibiotics in the 1950s, there was a general belief
that bacterial infections could be controlled [2]. However, the emergence
of antibiotic resistant phenotypes, the genomic plasticity of the
General introduction
9
pneumococcus, the limited efficacy of pneumococcal vaccines, the aging
of populations and difficulties in clinical diagnosis of pneumococcal
diseases makes S. pneumoniae a re-emergent infectious agent and a
matter of concern. Currently, the impact of pneumococcal disease on
society is still large, with the pathogen being responsible for high
mortalities and morbidities worldwide. It was estimated, by the WHO
(World Health Organization), that the pneumococcus is responsible for
approximately 700 000 to 1 000 000 children deaths every year worldwide
[43]. Among children, pneumococcus is the primary cause of acute otitis
media; this illness is the most common manifestation of pneumococcal
infection and of antibiotic prescription in the United States of America
(USA). Although complications resultant from otitis media are rare the
economic costs are high [44].
The pneumococcus is the most common cause of community-acquired
pneumonia (CAP), and the clinical and economic burden of CAP is
documented [45]. According to the WHO, pneumonia is the largest
infectious cause of death in children worldwide, with high incidence in
South Asia and sub-Saharan Africa countries [46].
Considering this scenario, it is urgent to circumvent pneumococcal
disease. While antibiotic treatment is of key importance to fight
pneumococcal disease, exclusive reliance on this strategy is not prudent
and prevention is mandatory to minimise the disease burden. Currently,
there are three pneumococcal conjugate vaccines (PCV) available for
children (especially younger than 2 years). In 2000, a 7-valent vaccine
(PCV7, Prevnar) was licensed, containing the 7 serotypes most
commonly associated with IPD and antibiotic resistance in children of
North America [29,47]. The immunization with PCV reduced the incidence
of carriage and pneumococcal disease of vaccine serotypes among
vaccinated children, but also reduced transmission, carriage and disease
in non-vaccinated population (children and adults) – the herd effect
Chapter 1
10
[29,48]. This indirect effect promoted a positive impact on public health
systems and economy [48]. However, immunization with PCV accounted
for replacement by non-vaccine serotypes (serotype replacement),
contributing to a unaltered colonisation prevalence [48]. Moreover, an
increase of drug resistant clones not included in PCV7 has also been
reported [29,49]. Approximately nine years after the launch of PCV7, a
10- and 13-valent PCV were licensed, PCV10 (Synflorix) and PCV13
(Prevnar13), respectively, expanding the serotype coverage [47]. Despite
the availability and positive impact of PCVs, only few countries with high
incidence rates of pneumococcal disease have introduced the PCV in
their immunization programmes [47,48]. Today PCV13 is recommended
for children, and additionally some studies point towards the beneficial
use of this vaccine for adults (reviewed in [45]). The use of PCV13 in
adults older than 50 was approved by FDA in 2011 [45]. In a very recent
study [50], the use of PCV13 was found to have an added benefit in
diminishing carriage of antibiotic-nonsusceptible S. pneumoniae over
PCV7, in infants.
The 23-valent pneumococcal polysaccharide vaccine (PPV), which
includes the main serotypes that have developed antibiotic resistance and
causative agents of IPD, is commonly used in adults [29]. This vaccine
has cross-reactivity with serotypes not included in PPV and therefore
potentially protects against more than 23 serotypes [51].
The development of protein-based vaccines has emerged as an
alternative to the currently available vaccines (reviewed in [45]). Currently,
a number of these protein based vaccines are in clinical trial phase I [45].
These products are based in pneumococcal surface proteins (e.g.
pneumolysin, autolysin) and are expected to be cheaper, elicit protection
in all age groups in a serotype-independent way [33].
Despite the intrinsic limitations of vaccines (e.g. number of serotypes
coverage, costs, serotype replacement), it was estimated that
General introduction
11
pneumococcal vaccination could prevent more than 7 million deaths by
2030 at a global scale [52].
Transition from colonisation to disease
While the exact circumstances that trigger the transition from
colonisation to disease are still largely unknown, it is surely a multifactorial
event that results from an imbalance of the equilibrium between the host,
the pathogen and the other niche residents. Pneumococcal disease starts
with a successful colonisation, which relies on the adherence of the
pneumococcus to host structures, the ability to acquire nutrients in
fluctuating conditions to replicate, compete with co-colonisers (e.g. resist
to toxic molecules such as bacteriocins produced by other
microorganisms) and evasion from the host immune system (innate or
acquired immunity) [42,53]. Several experimental animal models of
pneumococcal colonisation and disease have been used to study different
aspects of host-pathogen interactions (e.g. inflammatory host responses,
bacterial virulence factors) (reviewed in [16,30,54]).
During colonisation the expression of specific pneumococcal genes
contributes to its commensal lifestyle and persistence in the airways but,
simultaneously, might influence the virulence potential of this
microorganism. Indeed, virulence can only be seen in the context of host-
pathogen interactions, as it is an outcome of these relations [55]. Since
nasopharynx provides a suitable environment for pneumococcal growth
and proliferation it is likely that disease is accidental as it can result in a
dead end for the microorganism. Therefore, some of the virulence factors
promote pneumococcal lifestyle and for that reason are also considered
colonisation determinants [34,56].
In the following section the classical factors of pneumococcal virulence
will be briefly described.
Chapter 1
12
Virulence factors
The pneumococcal capsule is recognized as a major virulence factor.
The polysaccharide capsule produced by S. pneumoniae is protective
against host defences. This structure is covalently linked to the outer
surface of the cell wall peptidoglycan and is, in general, negatively
charged [30]. At first, capsule prevents the entrapment in the airway
mucus to allow subsequence access to epithelial surfaces [57]. However,
once in this surface, capsule seems to be disadvantageous because it
masks pneumococcal molecules that recognize host receptors.
Therefore, the pneumococcus spontaneously undergoes a phase
variation phenotype between two forms distinguishable by different colony
morphologies: opaque and transparent [58]. In the initial stages of
colonisation transparent variants express a thinner capsule promoting
adherence to host tissues by expressing higher amounts of surface-
exposed proteins. In contrast to opaque variants which display increased
amounts of capsule that mask pneumococcal molecules recognizing host
receptors. These variants are usually isolated from the blood, indicating
that are selected to cross the epithelial barriers [56,59–62]. Part of this
peculiarity is due to enhanced opsonophagocytic resistance [63]. Indeed,
the capsule is highly anti-phagocytic [64], preventing antibodies (e.g. Fc
of IgG) and complement (e.g. iC3b component) associated with bacterial
cell surfaces, from interacting with the correspondent receptors on the
phagocytic cells [65,66]. Moreover, capsule diminishes the spontaneous
or antibiotic-induced autolysis contributing to antibiotic tolerance and has
been associated with reduction of natural competence [30,67–69].
Capsule is regarded as a sine qua non factor for virulence, as clinical
isolates from sterile areas of humans are encapsulated whereas non-
encapsulated derivatives are largely non-virulent [30,70]. Strains with
reduced expression of capsule were avirulent in mouse models of disease
General introduction
13
[71]. Furthermore, the capsular thickness and serotype are associated
with different degrees of virulence [64,72]. In summary, the capsule allows
S. pneumoniae to evade the host immune system during inflammation
and “invade” the host [56].
Besides the polysaccharide capsule, S. pneumoniae possesses an
incredible array of surface-exposed proteins that enable adherence in
various degrees to host structures (glycoconjugates), either directly or by
modulating the functional properties of other pneumococcal proteins, and
thus influencing the colonisation and invasive effectiveness of this
microorganism (reviewed in [57]).
Three main clusters of surface-exposed proteins were identified in S.
pneumoniae: 1) proteins carrying a LPxTG motif covalently linked to the
cell wall peptidoglycan, 2) the lipoproteins, embedded in the
phospholipidic bilayer and 3) choline-binding proteins (CBPs), non-
covalently linked to phosphorylcholine (ChoP) of the cell wall and to lipid-
anchored teichoic acids [14,62,73]. Besides this classification, the cell wall
is decorated with other proteins that do not fulfil these features
(moonlighting proteins) [62,73] (Fig. 1.2).
The LPxTG-anchored proteins encompass a variety of glycosidases
(e.g. neuraminidase (NanA), β-galactosidase (BgaA), β-N-
acetylglucosaminidase (StrH), pullulanase (SpuA), endo-β-N-
acetylglucosaminidase (EndoD), endo-α-N-acetylgalactosaminidase
(Eng)), proteases (e.g. PrtA, ZmpABC), one lyase (SpnHL), among others
[14].
Chapter 1
14
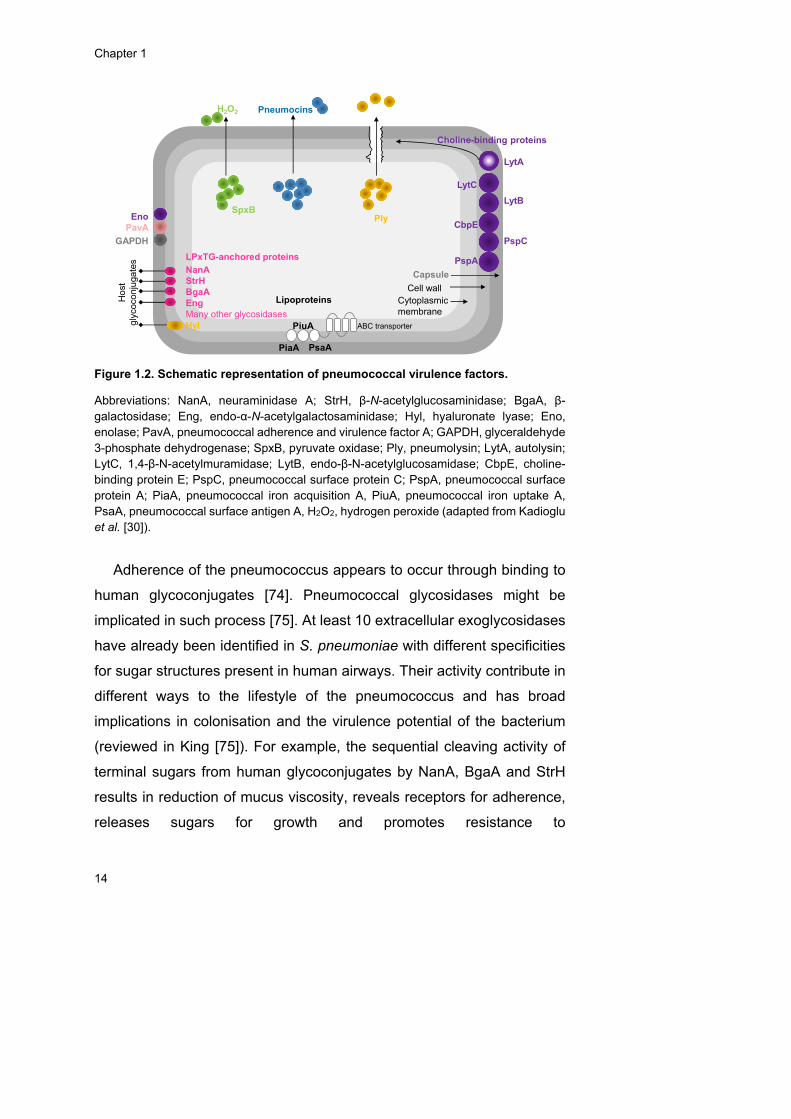
Figure 1.2. Schematic representation of pneumococcal virulence factors.
Abbreviations: NanA, neuraminidase A; StrH, β-N-acetylglucosaminidase; BgaA, β-galactosidase; Eng, endo-α-N-acetylgalactosaminidase; Hyl, hyaluronate lyase; Eno, enolase; PavA, pneumococcal adherence and virulence factor A; GAPDH, glyceraldehyde 3-phosphate dehydrogenase; SpxB, pyruvate oxidase; Ply, pneumolysin; LytA, autolysin; LytC, 1,4-β-N-acetylmuramidase; LytB, endo-β-N-acetylglucosamidase; CbpE, choline-binding protein E; PspC, pneumococcal surface protein C; PspA, pneumococcal surface protein A; PiaA, pneumococcal iron acquisition A, PiuA, pneumococcal iron uptake A, PsaA, pneumococcal surface antigen A, H2O2, hydrogen peroxide (adapted from Kadioglu et al. [30]).
Adherence of the pneumococcus appears to occur through binding to
human glycoconjugates [74]. Pneumococcal glycosidases might be
implicated in such process [75]. At least 10 extracellular exoglycosidases
have already been identified in S. pneumoniae with different specificities
for sugar structures present in human airways. Their activity contribute in
different ways to the lifestyle of the pneumococcus and has broad
implications in colonisation and the virulence potential of the bacterium
(reviewed in King [75]). For example, the sequential cleaving activity of
terminal sugars from human glycoconjugates by NanA, BgaA and StrH
results in reduction of mucus viscosity, reveals receptors for adherence,
releases sugars for growth and promotes resistance to
Capsule
Cell wallCytoplasmicmembrane
PneumocinsH2O2
PlyEnoPavA
GAPDH
SpxB
LPxTG-anchored proteins
NanAStrHBgaAEngMany other glycosidases
Ho
stgl
ycoc
on
juga
tes
Choline-binding proteins
PspA
PspC
CbpE
LytC
LytA
PsaA
Lipoproteins
ABC transporterHyl PiuA
PiaA
LytB
General introduction
15
opsonophagocytosis by neutrophils [75–77]. Recently, BgaA was found
to work as an adhesin promoting adherence to epithelial cells [78].
Another glycosidase, hyaluronidase (Hyl), acts over hyaluronic acid of the
extracellular matrix, and is believed to assist in dissemination through
tissues and colonisation [79,80] (Fig. 1.2).
The exact role of the serine protease, PrtA, in virulence is still unknown,
but PrtA-deficient mutants were attenuated in a murine model of disease
and all clinical isolates possessed this protein [81].
Among the lipoproteins identified (listed in [14]), PsaA (pneumococcal
surface antigen A) is the substrate-binding lipoprotein of an ABC
transporter for manganese. Mutations in this protein caused reduced
adhesion and virulence and increased sensitivity to oxidative stress
[82,83]. Other metal-binding lipoproteins (PiuA and PiaA) were identified
to play role in virulence [30].
ChoP is an uncharacteristic component of cell wall that binds to host
innate immune system components such as receptor for platelet-
activating factor (rPAF) of human epithelial surfaces of nasopharynx and
C-reactive protein [30,73]. ChoP anchors a diversity of CBPs (listed in
[14]). Among these are the hydrolytic enzymes autolysin LytA, endo-β-N-
acetylglucosamidase LytB, 1,4-β-N-acetylmuramidase LytC and CbpE.
LytA degrades the cell wall, leading to the release of highly inflammatory
cell wall components, and pneumolysin (Ply) from the cytoplasm
(reviewed in [30,82,84]). Mutants in the CBPs LytB, LytC, CbpE, CbpD
and CpbG were attenuated in colonisation models and CpbG also played
a role in sepsis [85]. Other members of CBP family are the pneumococcal
surface proteins A (PspA) and C (PspC, also known as CbpA or SpsA).
PspA interferes with complement activation, preventing binding of C3
component on pneumococcal cells, and also binds to lactoferrin and
apolactoferrin protecting the bacterium from the bactericidal activity of
these molecules. Additionally, PspA has high immunogenicity and elicits
Chapter 1
16
antibody response that increase complement deposition, conferring
protection in diverse models of pneumococcal infection. PspC acts as an
adhesin and binds to the complement regulatory protein factor H and to
the human secretory IgA receptor, providing resistance to complement.
PspC mutants presented attenuated virulence in different models of
infection. Both PspA and PspC, are considered good candidates for
protein-based vaccines (reviewed by Nieto et al., 2013 [84] and by
Kadioglu et al. [30]).
S. pneumoniae also have other surface proteins, lacking conventional
anchoring motifs or secretory signals (reviewed in [14]). These “non-
classical surface proteins” display moonlighting functions. They are
usually cytoplasmic with intracellular roles but when they reach the cell
surface have other functions. Among these are, the pneumococcal
adherence and virulence factor A (PavA) and the glycolytic enzymes
enolase (Eno) and glyceraldehyde 3-phosphate dehydrogenase
(GAPDH). PavA is an adhesin that binds to fibronectin, a component of
the extracellular matrix. PavA mutants were attenuated in diverse models
of pneumococcal disease and therefore is considered a crucial virulence
factor [86,87]. Eno and GAPDH are plasmin(ogen)-binding proteins that
allow transmigration through the basement membrane. Interaction of Eno
with plasminogen was found to promote adherence in epithelial and
endothelial cells [88–91].
Pneumolysin (Ply) is a potent virulence factor of S. pneumoniae which
has been extensively studied (reviewed in [30,82]). It is a cytoplasmic pore
forming toxin of the cholesterol-dependent cytolysins [30], released
independently of autolysin activity [92]. Its high toxicity arises from the
ability to bind host cholesterol, thereby leading to the formation of pores
and subsequent lysis of mammalian cells. Ply also inhibits the mucociliary
beat of respiratory epithelium and complement deposition in
pneumococcal surface [93,94]. Ply is presumably essential for the
General introduction
17
development of pneumonia, as mutants lacking Ply were attenuated in
models of pneumococcal pneumoniae [30] (Fig. 1.2).
Other aspect influencing the pneumococcal virulence potential is the
competitive interactions with other microorganisms occupying the same
niche during colonisation. Pneumococci produce bacteriocins
(pneumocins), small antimicrobial peptides to target other bacteria from
the same or closely species that do not produce the cognate immunity
factor. This phenomenon has been hypothesised as the mechanism
behind serotype replacement due to PCV administration [95]. Chemical
warfare is also thought to contribute to the virulence potential. S.
pneumoniae can produce a range of end-products, among them hydrogen
peroxide (H2O2). This metabolite, produced by pyruvate oxidase (SpxB)
as a by-product of pyruvate aerobic metabolism, is known to damage host
tissues and to kill other organisms in the same niche [96–98]. The high
insensitivity of S. pneumoniae to H2O2 is well described [99]. In sum, the
vast diversity of pneumococcal virulence factors endows the bacterium
with an “armory” to survive in the host and compete with other bacteria.
Virulence and carbohydrate metabolism
Several studies, using signature target mutagenesis (STM) [100–102],
microarrays analysis of gene expression [103–106], and Tn-seq [107]
have consistently revealed a link between carbohydrate metabolism and
virulence of S. pneumoniae. Importantly these studies have shown the
dynamics and pattern of gene expression in different stages of
pneumococcal infection, providing a means to evaluate the role of
different genes in colonisation and disease. Carbohydrate uptake systems
(e.g. msmK, satABC, SPD_0295-6-7, scrT, susT1T2X) [108–111] and
glycosidases (e.g. nanA, nanB, eng, bgaC) [112–117] were established
as important for in vivo fitness of S. pneumoniae by testing mutants of
these proteins in different mouse models. Moreover, in addition to Eno
Chapter 1
18
and GAPDH, other central metabolic functions such as pyruvate formate-
lyase (PFL) [118], lactate dehydrogenase (LDH) [119], pyruvate oxidase
(SpxB) [120], have been associated with pathogenicity, as mutant strains
were attenuated or avirulent in the ability to colonise or cause disease in
different mouse models (Fig. 1.3). The PFL mutant phenotype likely
resulted from reduced synthesis of ATP and alterations of membrane lipid
composition [118]. A LDH-deficient mutant was avirulent after intravenous
inoculation and attenuated post intranasal infection. These features were
explained as arising from the different environmental conditions
(carbohydrate availability) encountered in the two niches [119]. SpxB was
found important in adaptation to different host environments. It enhances
colonisation by competing with other host co-colonisers through H2O2
production or biofilm formation. In contrast its role in virulence is still
controversial. Some studies showed that downregulation of spxB is
beneficial for survival in the bloodstream, but this behaviour is in
contradiction to the study by Spellerberg et al., [120] that attributed the
virulence of an SpxB mutant to reduced acetyl-P levels and repression of
several adhesive properties (reviewed in [121]). More recently, a relation
between SpxB expression and capsule production (the major virulence
factor of the pneumococcus) was established [99].
General introduction
19
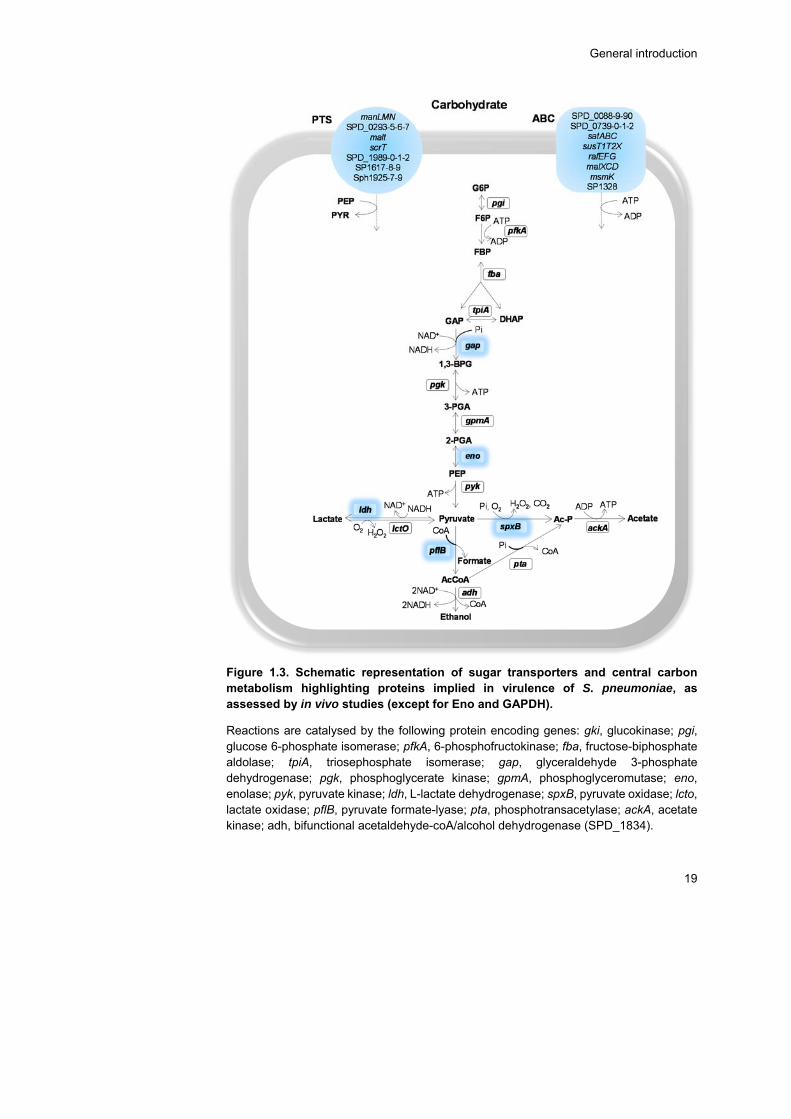
Figure 1.3. Schematic representation of sugar transporters and central carbon metabolism highlighting proteins implied in virulence of S. pneumoniae, as assessed by in vivo studies (except for Eno and GAPDH).
Reactions are catalysed by the following protein encoding genes: gki, glucokinase; pgi, glucose 6-phosphate isomerase; pfkA, 6-phosphofructokinase; fba, fructose-biphosphate aldolase; tpiA, triosephosphate isomerase; gap, glyceraldehyde 3-phosphate dehydrogenase; pgk, phosphoglycerate kinase; gpmA, phosphoglyceromutase; eno, enolase; pyk, pyruvate kinase; ldh, L-lactate dehydrogenase; spxB, pyruvate oxidase; lcto, lactate oxidase; pflB, pyruvate formate-lyase; pta, phosphotransacetylase; ackA, acetate kinase; adh, bifunctional acetaldehyde-coA/alcohol dehydrogenase (SPD_1834).
Chapter 1
20
Intermediates: G6P, glucose 6-phosphate; F6P, fructose 6-phosphate; FBP, fructose 1,6-biphosphate; GAP, glyceraldehyde 3-phosphate; DHAP, dihydroxyacetone phosphate; BPG, 1,3-biphosphoglycerate; 3-PGA, 3-phosphoglycerate; 2-PGA, 2-phosphoglycerate; PEP, phosphoenolpyruvate.
In Gram-positive bacteria, the transcriptional regulator carbon
catabolite protein A (CcpA) plays a major role in carbon catabolite control,
i.e., the hierarchical and highly regulated utilization of carbon sources
[122]. CcpA has been reported to contribute to pneumococcal colonisation
and virulence [123,124]. The involvement of CcpA has been rationalized
as a consequence of regulation of enzymes of central metabolism,
impaired capsule production and/or attachment to the cell envelope, and
influencing the binding of cell wall components [123–125].
Glycans at the interface of bacteria-host interactions
Glycoconjugates are widespread in nature and encompass a wide
variety of molecules consisting of carbohydrates covalently linked to a
non-sugar backbone. The principal categories are glycoproteins (N- or O-
linked to a protein core) and glycopeptides (linked to an oligopeptide),
peptidoglycans (bound to amino acids), glycolipids and
lipopolysaccharides (linked to a lipid moiety) [126]. Despite the vast
diversity of host glyconjugates, their glycan portions are often composed
of the monosaccharides N-acetylglucosamine (GlcNAc), N-
acetylgalactosamine (GalNAc), N-acetylneuraminic acid (NeuNAc),
galactose (Gal) and fucose (Fuc), mannose (Man), glucose (Glc) and
fructose. While the first five sugars are widespread in both N- and O-
glycans (e.g. mucins), the other three are generally restricted to N-
glycans.
General introduction
21
These molecules contribute to important biological functions in different
kingdoms of life (reviewed in [127,128]). The bacterial glycome (e.g.
capsule, exopolysaccharides, lipolysaccharides, peptidoglycan, teichoic
acids and lipoteichoic acids) is far more diverse than that of animals and
is usually located at the cell surface (exception polysaccharides used as
energy reserves). As many bacteria (commensal or pathogens) reside in
mucosal surfaces, the glycoconjugates on the cell envelope play
important roles in bacteria-host interactions [128]. From the bacteria
perspective these molecules are highly important for in vivo fitness. On
the other hand, in animals, and particularly in humans, a glycoconjugate
barrier often prevents direct contact between bacteria and host cells.
Among these, mucins are highly important in the mucosal surfaces (e.g.
respiratory, gastrointestinal tracts). Mucins are major components of the
mucus that cover the epithelial surfaces [129]. They are high molecular
weight glycoproteins, heavily O-glycosylated [130,131], composed of a
protein backbone enriched with threonine or serine (apomucin) containing
one or multiple tandem repeats (TR) to which a diversity of
oligosaccharides are linked via a GalNAc residue [129–131]. The
structure and composition of oligosaccharides in mucins are varied;
generally, the carbohydrate fraction is composed of GlcNAc, GalNAc,
NeuNAc, Gal, Fuc and sulphated sugars. Sulphation confers protection to
the epithelium as it increases resistance against mucin-degrading
enzymes [131]. N-glycosylation is also found on mucins but it is a small
contribution to the mucins molecular size when compared to the O-
glycosylation [131]. The oligosaccharide content of mucins can reach up
to 80% of their total weight [130]. Mucins are produced by eukaryotic cells
and can be cell surface associated or secreted (gel-forming or non-gel
forming). Gel-forming mucins, are the major constituents of mucus and
confer viscoelastic properties [130,132].
Chapter 1
22
Mucus and mucins have a dualistic role. On one hand represent a first
defence barrier (innate defensive barrier) by trapping the microbes and
protecting the underlying host surfaces from interaction with bacteria,
facilitating their removal through mucociliary transport. On the other hand,
the carbohydrate content of mucins provide adhesion sites and nutrients
for bacteria enabling their survival and colonisation at these surfaces
[130,131].
Interactions between mucin and microbes are broad in nature. For
example, expression of mucin can be induced by probiotic bacteria, likely
limiting the infection by pathogens [133]; the lipopolysaccharides of
Helicobacter pylori, decrease mucin synthesis in gastric epithelial cells in
vitro, modulating the mucus barrier [134]; Bacteroides thetaiotaomicron
induces fucosylation of mucin oligosaccharides, subsequently using
fucose as nutrient [135]. Also, microbes have developed strategies to
overcome this barrier: adhesins to bind oligosaccharides (H. pylori,
possesses four adhesins with different specificities) [136]; motility
(flagella) or production of mucin degrading enzymes (proteases and
glycosidases) that destabilize mucus and release carbohydrates that can
be used for growth [75,137,138].
Pneumococcal carbohydrate metabolism
Carbohydrate metabolism and its importance for
pneumococcal lifestyle
The incidence and impact of pneumococcal infections have prompt
intense research on the identification of factors that contribute to S.
pneumoniae pathogenesis. In particular, factors that directly impinge on
host-pathogen interactions, such as toxins, cell wall components,
General introduction
23
adhesins and capsule [30]. Even though the relevance of carbohydrate
metabolism has been recognized for in vivo fitness, only recently the
underlying mechanisms have been systematically addressed [109–
111,118,125]. With the availability of the pneumococcal genome the
relevance of carbohydrates for pneumococcal fitness became apparent
[139]. S. pneumoniae is a strictly fermentative bacterium that relies on
glycolytic metabolism to obtain energy [139]. It lacks a complete set of
respiratory genes and is, for that reason, unable to generate energy by
respiration [139,140]. Among the bacteria sharing the same niche, S.
pneumoniae possesses the highest number of transport systems, and of
those more than 30% were predicted to be involved in the uptake of
sugars [140]. A recent functional genomics approach validated the
majority of the homology based predictions, and identified 32
carbohydrates that can be used by pneumococci [141]. It has been
postulated that the vast diversity in terms of sugar utilization is driven by
adaptations to host niches as a means to proliferate [142–144].
Additionally, it has been reported that sugar transporters contribute to S.
pneumoniae colonisation and disease [103,109–111]. Furthermore,
numerous studies have revealed a consistent link between genes
involved in sugar catabolism and virulence [100–102,105–107,145].
In the human airway free carbohydrates are scarce, being the Glc
concentration below 1 mM, in contrast to its content in blood (~4-6 mM)
[145,146]. Hexoses, and in particular Glc, are generally the preferred
carbon sources for several bacteria and the same seems to be true for
the pneumococcus [125,141]. Therefore, in vivo growth in the
nasopharynx requires alternative carbon sources. The host glycoproteins
(O- and N-linked glycans, and glycosaminoglycans), secreted or lining the
epithelial surfaces appear as good candidates to serve as carbon and
energy sources for pneumococcal growth. S. pneumoniae can grow on
each of the former glycan types as sole carbon source [75,110,147,148].
Chapter 1
24
Furthermore, it is able to grow on mucin as the sole carbon source [147].
In addition to mucins and other glycans, carbohydrates might also be
provided by the host diet and other microbial residents of the same niche
[143].
S. pneumoniae is equipped with at least 10 extracellular (exo- or endo)
glycosidases with a broad range of specificities (reviewed by King [75]).
These enzymes can break down O-linked glycans (e.g. BgaC, Eng) [114–
116], N-linked glycans (e.g. NanA, StrH, BgaA, NanB) [77,148], and
glycosaminoglycans (hyaluronic acid) (e.g. Hyl) [110], providing free
sugars that can potentially be used by the pneumococcus to grow
[110,148].
Sugar transport systems in S. pneumoniae
Sugar transport across the membrane is the first step in catabolism. In
Streptococcaceae there are three types of transport systems: the
secondary carriers, the primary active transporters ATP-binding cassette
superfamily (ABC transporters) and the phosphoenolpyruvate-dependent
carbohydrate phosphotransferase systems (PTS systems) (Fig. 1.4).
Secondary carriers couple the translocation of the carbohydrate to an
electrochemical gradient and comprise symporters (a carbohydrate is
imported together with a solute), antiporters (carbohydrate and solute are
transported in opposite directions) and uniporters (catalyse the
unidirectional translocation of the sugar across the cytoplasmic
membrane) [149].
ABC transporters take up carbohydrate at the expense of ATP, which
is intracellularly hydrolysed to ADP and inorganic phosphate (Pi) [150].

General introduction
25
Figure 1.4. Schematic representation of sugar transport systems in S. pneumoniae.
Abbreviations: A, general solute; SBP, solute-binding protein; NBD, nucleotide-binding domains; TMD, transmembrane domains; ABC, ATP-Binding Cassette transporter; PEP, phosphoenolpyruvate; PTS, phosphoenolpyruvate-dependent-carbohydrate phosphotransferase systems; EI, enzyme I and HPr, histidine phosphocarrier protein are general components of the PTS system; IIAB cytoplasmic proteins and IICD, transmembrane domains of the PTS system. The occurrence of IID component is typical of mannose type-PTS transporter. P~ corresponds to the phosphorylated form of each component.
In general, an ABC is composed of four core domains: two
transmembrane domains (TMD) spanning in the membrane, forming the
pathway of entry of the solute and defining the specificity of the transporter
through the substrate-binding site and two ATP- or nucleotide-binding
domains (NBD) associated with the inner face of the membrane, that
energize the transport via ATP hydrolysis. ABC importers require auxiliary
proteins, the solute-binding proteins (SBP), anchored outside the cell via
lipid groups, that confer high affinity, specificity and directionality to the
transporter [151].
Chapter 1
26
In S. pneumoniae there are 1 CUT2 family ABC transporter and 6-7
CUT1 ABC transporters, differing in the nature of the substrate and
structure. Each locus of the CUT1 family ABC transporter lacks the
predicted ATPase [141]. Recently, a single ATPase (MsmK), was found
to energize multiple carbohydrate ABC transporters, that are involved in
the uptake of sialic acid, raffinose and maltotetraose [108].
The PTS system involves uptake and concomitant phosphorylation of
the incoming sugar via a phosphorylation cascade that transfers a
phosphate group from PEP. It consists of a series of cytoplasmic and
membrane-bound proteins [152]. The PTS permeases (EII complexes),
generally comprise 3 or 4 domains (the cytoplasmic subunits IIA, IIB and
membrane-bound subunits IIC, IID) arranged in different ways, which
allow the transport and phosphorylation of the substrate. While IIAB
domains participate in the phosphorylation of the substrate, IICD
correspond to the membrane permeases. The PTS is also composed by
two PTS energy-coupling proteins, Enzyme I (EI) and the heat stable
histidine phosphocarrier protein HPr, encoded by ptsI and ptsH,
respectively. While the EII subunits are usually substrate-specific, the EI
and HPr are common to all PTS carbohydrates and therefore
denominated general proteins [153,154]. PTS systems are energetically
more favourable since transport and phosphorylation occurs in one step
spending a PEP molecule instead of ATP. PEP is energetically equivalent
to one molecule of ATP as one ATP is formed from PEP to pyruvate in
glycolysis. In non-PTS systems more ATP is expended in both processes.
This likely explains the high number of these systems in anaerobic
bacteria [154].
In S. pneumoniae, the functional genomics approach conducted by
Bidossi et al. [141], identified twenty-one PTS systems, six to seven CUT1
ABC transporters, one CUT2 ABC transporter, one sodium solute
symporter and three aquaporin/glycerol permeases potentially involved in
General introduction
27
carbohydrate uptake. The total number of transporters varies with the
strain [141]. At the time, only a few transporters (beta-glucosides,
sucrose, sialic acid, maltose and raffinose) had been partially
characterized in S. pneumoniae [141]. Thirty-two carbohydrates can be
metabolized by the pneumococcus. Some of these were internalized by
more than one transporter and the same transporter could take up
different sugars [141]. Even though the complement of transporters is well
covered in Bidossi et al. [141], the specificity for substrates is only fully
elucidated for a reduced number of transport systems. More in-depth
studies combining biochemical and genetic approaches are needed to
establish the specificity range of pneumococcal transport systems.
Glycan-derived monosaccharides: pathways and functions
In this section, catabolic pathways for the assimilation of selected
carbohydrates, i.e. monosaccharides present in host glycans, will be
described. The focus will be on S. pneumoniae and closely related
organisms, but alternative pathways in other bacteria are also presented.
In S. pneumoniae the pathways for the catabolism of monosaccharides
can be deduced from genome annotations, but their functionality remains
largely to be proven. In this work we focused on the six carbohydrates
constituents of the highly available glycoprotein, mucin.
Galactose
Galactose is abundant in the airway glycoconjugates (e.g. mucins)
[116]. Available as a monosaccharide through the action of pneumococcal
galactosidases (BgaA, BgaC) [77,115,116,155]. However, it is usually
regarded as a less efficiently metabolized sugar and the type of transport
system dictates, at some extent, the catabolic pathway to be followed. It
has been postulated that its efficient uptake could determine the outcome
of interspecies competition between streptococcus [156,157].
Chapter 1
28
Galactose catabolism
In several Streptococcaceae, metabolism by the Leloir pathway is
preceded by the entry of Gal in the cell through the secondary carrier
galactose permease (GalP) [158–160]. However, homologues of this
protein were not found in the pneumococcus. Recently, Bidossi et al.
[141], implicated the CUT1-family ABC transporter SPD_0088-9-0 in the
uptake of Gal, but the evidence presented was relatively weak, since
inactivation of the transporter resulted in a very mild reduction in Gal
utilization. Possible explanations can be that the inactivation of the ABC
transporter is masked by the activity of other transporters or Gal is
exclusively taken up via PTS-type transporters.
Metabolism of Gal via tagatose 6-phosphate (T6P) pathway is
preceded by transport via a PTS system. In other Streptococcaceae it
occurs through a lactose-specific PTS (PTSlac), encoded by lacFE genes,
albeit with a low efficiency [161–164]. In S. pneumoniae, duplication of
lacFE genes appears to have occurred, but the involvement of these
transporters is not yet disclosed. Nevertheless, our team showed that
lacFE genes were induced by Gal, suggesting a potential contribution of
the lactose-PTS to the uptake of the sugar [125]. Transport of Gal by a
PTS complex other than PTSlac was proposed for Lactococcus lactis,
Streptococcus mutans, Streptococcus gordonii and Streptococcus
oligofermentans (e.g. galactose-specific PTS and/or PTSMan)
[156,157,163,165,166].
In the pneumococcus Gal uptake was attributed to the galactitol-PTS
SPD_0559-1 [141,167]. This seems to be the major Gal uptake system
[141]. Two additional PTS systems were then allocated to Gal, the
mannose-family PTS (ManMNL) and probably a mannose-family PTS
(SPD_0066-7-8-9) [141]. The latter, was assigned based on the presence
of a beta-galactosidase (bgaC) with specificity for Galβ1-3GlcNAc
[115,116].

General introduction
29
In S. pneumoniae genes for the catabolism of Gal through the T6P and
Leloir pathways are encoded in the genome (Fig. 1.5). The product of PTS
transport, galactose 6-phosphate (Gal6P), is metabolized by the T6P
pathway. Briefly, Gal6P is converted to tagatose 6-phosphate (T6P), by
the heteromeric galactose-6-phosphate isomerase (LacAB), which is
subsequently converted to tagatose 1,6-biphosphate (TBP) by tagatose
6-phosphate kinase (LacC) and finally to the glycolytic intermediates
glyceraldehyde 3-phosphate (GAP) and dihydroxyacetone phosphate
(DHAP) by the tagatose 1,6-diphosphate aldolase (LacD). The non-PTS
transport leads the incoming Gal to the Leloir pathway, in which Gal is
phosphorylated to α-galactose 1-phosphate (α-Gal1P) through the
sequential activity of galactose mutarotase (GalM) and galactokinase
(GalK). Through the galactose 1-phosphate uridylyltransferase
(GalT)/UDP-glucose 4-epimerase (GalE) activities α-Gal1P is then
converted to α-glucose 1-phosphate (α-G1P), which is then converted to
glucose 6-phosphate (G6P) by the phosphoglucomutase (PGM), thus
entering in the Embden-Meyerhof-Parnas (EMP) pathway.
Interestingly, in L. lactis and S. mutans a phosphatase that converts
the PTS product, Gal6P to Gal, allowing its processing through the Leloir
has been described, but its identity remains elusive [163,165] (Fig. 1.5).
In contrast to L. lactis, S. mutans apparently does not possess
homologues of galP and galM and therefore Gal enters the exclusively via
PTS [163].
In S. pneumoniae, both pathways seem to be simultaneous active
[125], but the relative contribution of each and conditions that trigger the
prevalence of one pathway over the other remains to be elucidated.
In S. mutans, S. oligofermentans and S. gordonii both pathways are
present but T6P seems to be the preponderant route for Gal catabolism
[156,163,166]. In contrast, in the dairy bacterium L. lactis this feature
seems to be strain dependent [165]. While laboratorial strains possess the
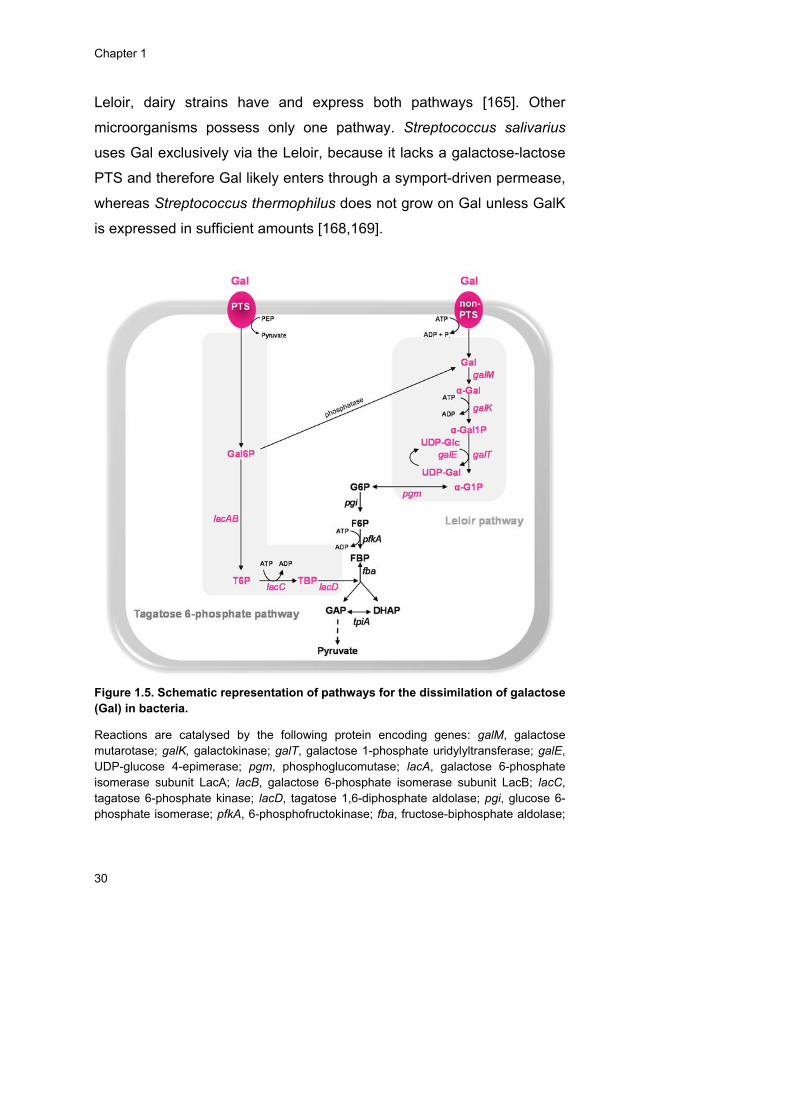
Chapter 1
30
Leloir, dairy strains have and express both pathways [165]. Other
microorganisms possess only one pathway. Streptococcus salivarius
uses Gal exclusively via the Leloir, because it lacks a galactose-lactose
PTS and therefore Gal likely enters through a symport-driven permease,
whereas Streptococcus thermophilus does not grow on Gal unless GalK
is expressed in sufficient amounts [168,169].
Figure 1.5. Schematic representation of pathways for the dissimilation of galactose (Gal) in bacteria.
Reactions are catalysed by the following protein encoding genes: galM, galactose mutarotase; galK, galactokinase; galT, galactose 1-phosphate uridylyltransferase; galE, UDP-glucose 4-epimerase; pgm, phosphoglucomutase; lacA, galactose 6-phosphate isomerase subunit LacA; lacB, galactose 6-phosphate isomerase subunit LacB; lacC, tagatose 6-phosphate kinase; lacD, tagatose 1,6-diphosphate aldolase; pgi, glucose 6-phosphate isomerase; pfkA, 6-phosphofructokinase; fba, fructose-biphosphate aldolase;
General introduction
31
tpiA, triosephosphate isomerase. The lower glycolytic pathway is represented by a dashed arrow. Intermediates: Gal, galactose; α-Gal, α-galactose; α-Gal1P, α-galactose 1-phosphate; α-G1P, α-glucose 1-phosphate; UDP-Glc, UDP-glucose; UDP-Gal, UDP-galactose; Gal6P, galactose 6-phosphate; T6P, tagatose 6-phosphate; TBP, tagatose 1,6-diphosphate; G6P, glucose 6-phosphate; F6P, fructose 6-phosphate; FBP, fructose 1,6-biphosphate; GAP, glyceraldehyde 3-phosphate; DHAP, dihydroxyacetone phosphate. In rose are depicted the intermediates and genes committed specifically to galactose catabolism. For the sake of simplicity transporters other than PTS are designated generically as non-PTS.
While the necessary genes for T6P pathway (lacABCD) are organized
in one operon the Leloir genes are dispersed in the pneumococcal
genome. The organization of Leloir genes seems to be species-specific
probably reflecting the genomic plasticity among LAB [170,171]. Various
combinations of the gal and lac genes have been reported among
streptococci, lactococci and lactobacilli [166].
Mannose
Mannose is the major component of N-glycans [172]. High-mannose-
type glycoproteins are present in host tissues and are components of the
extracellular matrix (e.g. laminin) [173]. Mannosidase activity over
glycoconjugates has been reported in viridans group streptococci and in
particular in S. pneumoniae [173]. The exact role of these enzymes has
not yet been determined but it is possible that their action provides
substrates for growth. In contradiction S. pneumoniae, but not S. mitis
and S. oralis, expose mannose residues of host glycoproteins defence
molecules, through the sequential action of NanA, BgaA and StrH, that
bind pneumococcus and protect the airway, likely allowing its persistence
in the nasopharynx [77]. According to King et al. [77]., the lack of further
deglycosylation through mannosidase is likely due to the of low efficiency
(activity) of this enzyme, it is only present in some isolates or is not
expressed under the conditions used where other sugars were present.
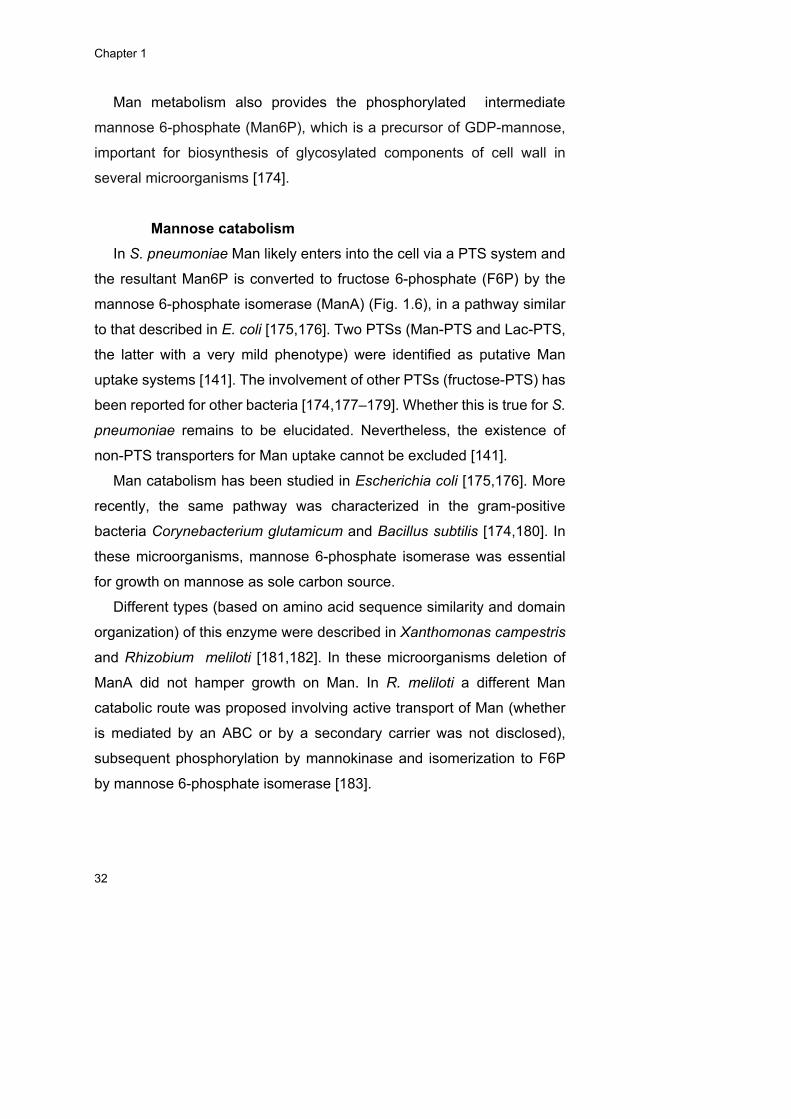
Chapter 1
32
Man metabolism also provides the phosphorylated intermediate
mannose 6-phosphate (Man6P), which is a precursor of GDP-mannose,
important for biosynthesis of glycosylated components of cell wall in
several microorganisms [174].
Mannose catabolism
In S. pneumoniae Man likely enters into the cell via a PTS system and
the resultant Man6P is converted to fructose 6-phosphate (F6P) by the
mannose 6-phosphate isomerase (ManA) (Fig. 1.6), in a pathway similar
to that described in E. coli [175,176]. Two PTSs (Man-PTS and Lac-PTS,
the latter with a very mild phenotype) were identified as putative Man
uptake systems [141]. The involvement of other PTSs (fructose-PTS) has
been reported for other bacteria [174,177–179]. Whether this is true for S.
pneumoniae remains to be elucidated. Nevertheless, the existence of
non-PTS transporters for Man uptake cannot be excluded [141].
Man catabolism has been studied in Escherichia coli [175,176]. More
recently, the same pathway was characterized in the gram-positive
bacteria Corynebacterium glutamicum and Bacillus subtilis [174,180]. In
these microorganisms, mannose 6-phosphate isomerase was essential
for growth on mannose as sole carbon source.
Different types (based on amino acid sequence similarity and domain
organization) of this enzyme were described in Xanthomonas campestris
and Rhizobium meliloti [181,182]. In these microorganisms deletion of
ManA did not hamper growth on Man. In R. meliloti a different Man
catabolic route was proposed involving active transport of Man (whether
is mediated by an ABC or by a secondary carrier was not disclosed),
subsequent phosphorylation by mannokinase and isomerization to F6P
by mannose 6-phosphate isomerase [183].
General introduction
33
Figure 1.6. Schematic representation of pathways for the dissimilation of mannose (Man) in bacteria.
Reactions are catalysed by the following protein encoding genes: manA, mannose 6-phosphate isomerase; manK, mannose kinase; pfkA, 6-phosphofructokinase; fba, fructose-biphosphate aldolase; tpiA, triosephosphate isomerase. The lower glycolytic pathway is represented by a dashed arrow. Intermediates: Man6P, mannose 6-phosphate; F6P, fructose 6-phosphate; FBP, fructose 1,6-biphosphate; GAP, glyceraldehyde 3-phosphate; DHAP, dihydroxyacetone phosphate. In blue are depicted the intermediates and genes committed specifically to mannose catabolism.
Recently, two loci for mannoside catabolism were predicted in two
species of Shewanella. These pathways are different from that descried
in E. coli and its experimental validation is required [184]. According to
this study these loci are restricted to Alteromonadales lineage.
Chapter 1
34
Amino sugars: N-acetylneuraminic acid, N-
acetylglucosamine and N-acetylgalactosamine
The amino sugars NeuNAc, GlcNAc and GalNAc are valuable carbon
and nitrogen sources for growth and are present in high content in mucins,
as determined in the model glycoprotein, porcine gastric mucin: 30%
(wt/v) GlcNAc, 15% (wt/v) GalNAc and 2.6% (wt/v) NeuNAc [116]. The
presence of pneumococcal extracellular glycosidases, with specificity for
GlcNAc (StrH) and NeuNAc (NanA and NanB) residues, contributing to
growth on human glycoconjugates, further supports this claim [148,185–
187]. Besides the mucins, there are other glycan sources of these sugars.
NeuNAc (or generically sialic acid) is copious as a terminal sugar of
eukaryotic surface-exposed glycoconjugates but also in prokaryotes
surfaces [188,189]. GlcNAc can be provided from host diet and
secretions, as well as from peptidoglycan recycling (GlcNAc is a building
block of this structure and also of lipopolysaccharides) and is present in
the extracellular matrix of mammals and chito-oligosaccharides [190–
192]. GalNAc is widespread in host receptors and glycoconjugates and is
a component of bacterial cell wall, lipopolysaccharides and
exopolysaccharides [114,193,194].
Nevertheless, the importance of these sugars goes beyond their
nutritional value. For instances, these sugars contribute to cell wall
synthesis. More recently, NeuNAc was found to act as a signalling
molecule in the pneumococcus, promoting increased colonisation,
invasion of the host’s lower respiratory tract and biofilm formation in vitro
[109,195,196]. In other pathogenic bacteria the presence of NeuNAc in
the bacterial cell surfaces permits evasion from immune system (e.g. H.
influenzae) and is important for interaction with host-cell surfaces
(reviewed in [188]).
Similarly, GlcNAc has been found to act as a signalling molecule in
different kingdoms (reviewed in [190]). In bacteria GlcNAc ensures

General introduction
35
regulation between its catabolism and anabolism ensuring the desired
quantities of UDP-GlcNAc necessary for peptidoglycan synthesis. In E.
coli it is responsible for regulation of virulence factors (e.g. fimbriae) and
its catabolism is important for gut colonisation ([197], reviewed in [190]).
In soil bacteria, such as streptomycetes, it is involved in morphogenesis
regulation namely sporulation and antibiotic production [198–200]. Under
adverse conditions (famine) development (leading to sporulation) and
antibiotic production are triggered whereas under feast periods these
mechanisms are blocked [200]. In addition, the ubiquity of GlcNAc across
kingdoms has revealed a multiplicity of interspecies communication
mediated by this amino sugar (reviewed in [190]).
Adherence of S. pneumoniae and other viridans group streptococci via
carbohydrate-containing receptors of host glycoconjugates has been
demonstrated [193,201,202]. GalNAc-containing receptors were
identified as important for the pneumococcus adherence [203,204]. An O-
glycosidase, Eng, endo-α-N-acetylgalactosaminidase, with specificity for
Galβ1-3GalNAc from core-1 O-linked glycans was characterized. In
conjunction with NanA these glycosidases sequentially deglycosylate the
sialylated core-1 O-linked glycans of glycoconjugates. Moreover, a role in
colonisation of respiratory tract and adherence to human epithelial cells
was established [114].
GalNAc-sensitive coaggregations have also been shown between
viridans group streptococci and between streptococci and actinomyces
[193].
NeuNAc and GlcNAc catabolism
In S. pneumoniae the transport of NeuNAc remains largely unknown,
even though putative sugar transporters are annotated in nanA, nanB and
nanC loci. In the nanAB locus two ABC transporters are encoded
(SPD_1493-4-5 and SPD_1500-1-2) [205]. The first was recently
Chapter 1
36
identified as the main NeuNAc transporter contributing to growth on a
human glycoprotein and colonisation in vivo [109,141]. In this region a
third transporter, Glc-PTS SPD_1496, was allocated to glucosamine
[141]. A major facilitator superfamily (MFS) sodium solute symporter
(SSS) (SP_1328) was identified, in some pneumococcal strains, in the
nanC locus [141,188,206]. This region also comprises a neuraminidase
(nanC), a kinase, a lyase and an epimerase [141]. D39 does not possess
this locus and alternatively carries a putative oligopeptide ABC
transporter, a mutarotase and an epimerase [141]. In opposition, the
nanAB cluster is conserved and was proposed as the responsible for the
uptake and metabolism of NeuNAc [141,205–208], but little is known
about the nanC locus. A relation of nanC presence and invasive
phenotypes in a tissue-specific manner was established and mutations in
nanC locus did not influence the growth on NeuNAc [141,209].
There is a great diversity of NeuNAc transport systems widespread
among bacteria and even in bacteria belonging to the same genus (e.g.
genus Streptococcus) [206]. The first system to be studied in detail was
in E. coli, the NanT, which is a single component system, secondary
transporter, of the MFS [206,210].
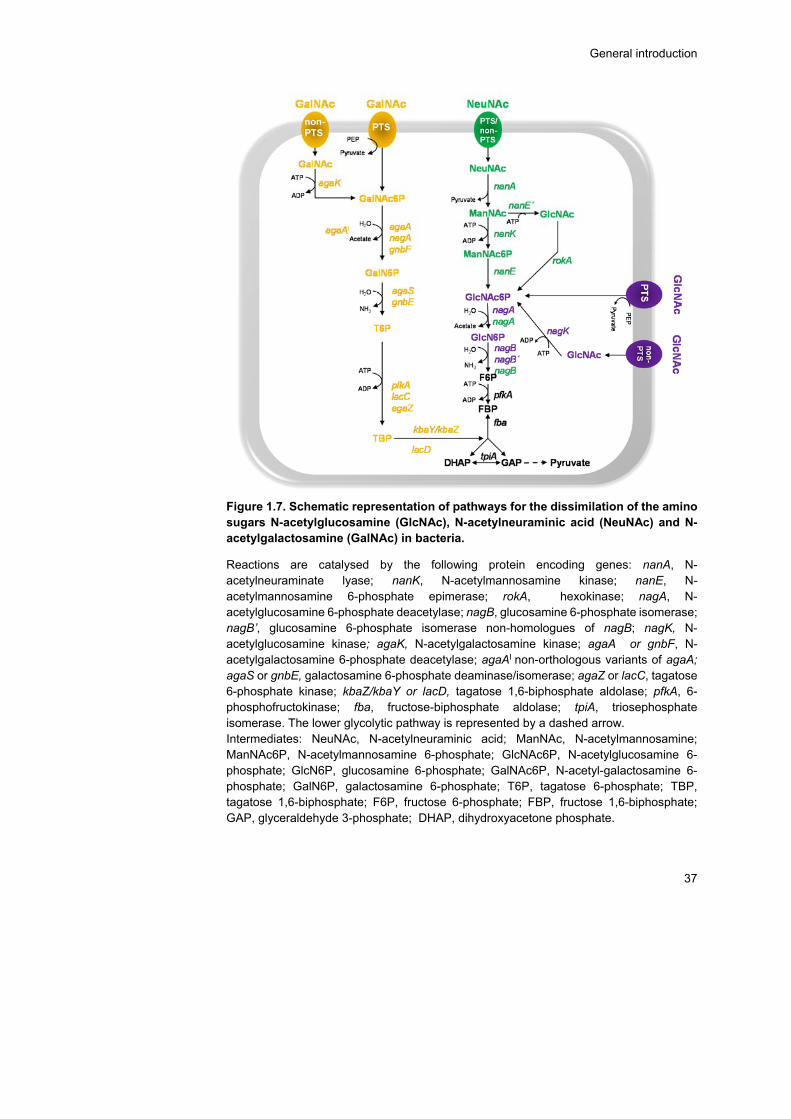
General introduction
37
Figure 1.7. Schematic representation of pathways for the dissimilation of the amino sugars N-acetylglucosamine (GlcNAc), N-acetylneuraminic acid (NeuNAc) and N-acetylgalactosamine (GalNAc) in bacteria.
Reactions are catalysed by the following protein encoding genes: nanA, N-acetylneuraminate lyase; nanK, N-acetylmannosamine kinase; nanE, N-acetylmannosamine 6-phosphate epimerase; rokA, hexokinase; nagA, N-acetylglucosamine 6-phosphate deacetylase; nagB, glucosamine 6-phosphate isomerase; nagB’, glucosamine 6-phosphate isomerase non-homologues of nagB; nagK, N-acetylglucosamine kinase; agaK, N-acetylgalactosamine kinase; agaA or gnbF, N-acetylgalactosamine 6-phosphate deacetylase; agaAI non-orthologous variants of agaA; agaS or gnbE, galactosamine 6-phosphate deaminase/isomerase; agaZ or lacC, tagatose 6-phosphate kinase; kbaZ/kbaY or lacD, tagatose 1,6-biphosphate aldolase; pfkA, 6-phosphofructokinase; fba, fructose-biphosphate aldolase; tpiA, triosephosphate isomerase. The lower glycolytic pathway is represented by a dashed arrow. Intermediates: NeuNAc, N-acetylneuraminic acid; ManNAc, N-acetylmannosamine; ManNAc6P, N-acetylmannosamine 6-phosphate; GlcNAc6P, N-acetylglucosamine 6-phosphate; GlcN6P, glucosamine 6-phosphate; GalNAc6P, N-acetyl-galactosamine 6-phosphate; GalN6P, galactosamine 6-phosphate; T6P, tagatose 6-phosphate; TBP, tagatose 1,6-biphosphate; F6P, fructose 6-phosphate; FBP, fructose 1,6-biphosphate; GAP, glyceraldehyde 3-phosphate; DHAP, dihydroxyacetone phosphate.
Chapter 1
38
In green, purple and orange are depicted the intermediates and genes committed to NeuNAc, GlcNAc and GalNAc catabolism. For the sake of simplicity transporters other than PTS are designated generically as non-PTS.
In H. influenzae and Pasteurella multocida another type of secondary
transporter was characterized: a tripartite ATP-independent periplasmic
(TRAP) transporter (SiaPQM). This is a multicomponent system with an
additional substrate-binding protein (SBP, SiaP) [211–213]. An ATP-
binding cassette (ABC) transporter (SatABCD) was described in
Haemophilus ducreyi [214]. More recently, a secondary carrier of the
sodium solute symporter (SSS) family was reported [205,215].
Opposite to the NeuNAc transporters, for which bacteria have evolved
multiple systems, the catabolic genes of the nan cluster (comprising a
lyase (nanA), a kinase (nanK) and an epimerase (nanE)) seem to be
shared among bacteria, despite the diversity in its organization, and are
confined to human pathogens and commensals. Many of them occupying
mucus rich regions (e.g. gut and respiratory tract) [205]. As demonstrated
in oral streptococci which share the core metabolic activity for NeuNAc
processing [208,216].
One exception is Bacteroides fragilis which lacks NanK and for which
a new epimerase was described, with activity over unphosphorylated N-
acetylmannosamine converting it to GlcNAc, using ATP as a cofactor. The
latter is then phosphorylated by a RokA kinase and the concomitant
product proceeds through the NagAB pathway. Hence a different
catabolic route was established [217,218]. A similar pathway was
predicted in the periodontal pathogen Tannerella forsythia [219] (Fig. 1.7).
The enzymes required for NeuNAc catabolism are encoded in the
pneumococcal genome [140,205]. Catabolism of N-acetylneuraminic acid
involves five specific steps (Fig. 1.7). A pyruvate group is first removed
from the intracellular NeuNAc by N-acetylneuraminate lyase (NanA)
General introduction
39
yielding N-acetylmannosamine (ManNAc). A subsequent phosphorylation
step, mediated by N-acetylmannosamine kinase (NanK), originates N-
acetylmannosamine 6-phosphate (ManNAc6P). ManNAc6P is then
epimerized to N-acetylglucosamine 6-phosphate (GlcNAc6P) by N-
acetylmannosamine 6-phosphate epimerase (NanE). The sequential
removal of the acetyl group by N-acetylglucosamine 6-phosphate
deacetylase (NagA) and removal of amino group and isomerization by
glucosamine 6-phosphate isomerase/deaminase (NagB), yields
glucosamine 6-phosphate (GlcN6P) and the glycolytic intermediate
fructose 6-phosphate (F6P), respectively. The enzymes NagA and NagB
are also involved in the degradation route of GlcNAc, with GlcNAc6P and
GlcN6P as common intermediates of both pathways. Interestingly, in
different bacteria, the nagAB orthologues are not coded closely to the nan
system (except for H. influenzae) [206]. In S. pneumoniae, GlcNAc6P
arises most likely as a product of PTS-mediated transport, as recently
demonstrated by Bidossi et al. [141]. These authors found that ptsI
mutants of strains G54 and the D39 rough derivative DP1004, which lack
PTS activity, were unable to utilize GlcNAc. Similarly, in the closely related
S. mutans UA159, GlcNAc is imported exclusively by a PTS system, with
manLMN playing a dominant role. In contrast, in S. gordonii strain DL1
other GlcNAc transport systems must be present [191]. As for NeuNAc
the diversity in transport systems is wide among bacteria. In E. coli is well
described the PTS-mediated uptake of GlcNAc (NagE) [220,221]. And
recently the same type of transport has been shown for Bacillus subtilis
(NagP) [222]. In contrast, in Streptomyces olivaceoviridis and
Xanthomonas campestris pv. campestris an ABC transporter (Ngc) and a
secondary active transporter from the MFS (NagP), respectively, were
described [192,223]. Novel permeases (NagP and presumably NagX)
were identified in the genome of Alteromonadales (e.g. Shewanella
oneidensis) and Xanthomonadales, lacking GlcNAc-PTS or GlcNAc-ABC
Chapter 1
40
systems [224]. NagP functionality was experimentally validated in S.
oneidensis MR-1 [184]. In these cases, the existence of GlcNAc specific
kinases (NagK) that phosphorylate the incoming sugar is pivotal for
GlcNAc catabolism, and therefore an alternative pathway was proposed
that includes this step before the action of NagAB [192,224]. Indeed,
GlcNAc kinases were identified and characterized in S. oneidensis and X.
campestris pv. campestris [192,224]. In addition, NagB enzymes (NagB-
II), non-homologous to the one found in E. coli, were also characterized
in these microorganisms [192,224] (Fig. 1.7). In contrast, NagA
orthologous are conserved across bacteria and eukaryotes [224].
Genomic reconstruction of GlcNAc catabolism was made for several
proteobacteria [224].
GalNAc catabolism
The transport and catabolism of GalNAc in the pneumococcus is
unknown. Genes for a full catabolic route are not annotated in the
genome. In opposition, GalNAc catabolism has been studied in E. coli K-
12 and C [225–227]. However, K-12 does not grow on GalNAc, due to
deletion and truncation of genes comprising a transporter (agaW’EF) and
a deacetylase (agaA’) [226]. Although this pathway has been proposed in
silico many years ago [225,226], only recently it was experimentally
validated [226–229]. In E. coli, GalNAc enters the cell via a PTS (coded
by agaVWEF), and the concomitant phosphorylated product is
deacetylated by GalNAc deacetylase (AgaA) to form galactosamine 6-
phosphate (GalN6P). The NagA, involved in GlcNAc catabolic pathway,
is seemingly a surrogate for AgaA [227,230]. GalN6P is then deaminated
and isomerised by AgaS to yield T6P. The latter is phosphorylated by 6-
phosphofructokinase (PfkA) yielding TBP, which is then converted to the
glycolytic intermediates DHAP and GAP by a dimeric aldolase
General introduction
41
(KbaY/KbaZ). It was proposed that KbaZ subunit is needed for full activity
and stability of KbaY [226–229] (Fig. 1.7).
A different variant of GalNAc catabolic pathway was proposed for
Shewanella strains and more recently some of those enzyme activities
were experimentally validated for Shewanella sp ANA-3, which grows on
GalNAc [184,230]. In Shewanella the PTS system is substituted by a
permease (AgaP) and a subsequent phosphorylation step mediated by a
GalNAc kinase (AgaK). A nonorthologous GalNAc deacetylase (AgaAII)
converts GalNA6P to GalN6P and AgaS (E. coli like-enzyme) functions
as the main GalN6P isomerase [184,230]. While Shewanella possesses
a gene encoding AgaZ (E. coli like-T6P kinase) genes coding for AgaY
(predicted TBP aldolase) are missing and likely this activity is replaced by
fructose biphosphate aldolase, but confirmation is required [230] (Fig.
1.7).
The genomic GalNAc pathway reconstruction was extended for other
bacteria of the Proteobacteria philum [230]. The initial steps of GalNAc
catabolism are the most variable among proteobacteria, whereas AgaS is
the most conserved. The identities of the enzymes mediating the two final
steps of GalNAc catabolism are not totally disclosed and experimental
validation is needed, as differential patterns of distribution of these genes
was observed among Proteobacteria. Whether AgaZ acts in conjunction
with AgaY or separately or are replaced by other enzymes needs to be
addressed [230].
The first example of a GalNAc pathway in Firmicutes was studied more
recently in Lactobacillus casei [194]. The GalNAc gene cluster
(gnbREFGBCDA) differs from that of proteobacteria studied so far [230].
It comprises a mannose-type PTS (encoded by gnbBCDA, PTSGnb)
involved in transport of GalNAc and the enzymes for subsequent
GalNAc6P catabolism, GalNAc6P deacetylase (GnbF) and GalN6P
deaminase (GnbE). Interestingly it was shown that NagA is also required

Chapter 1
42
for full growth on GalNAc. The genes for T6P processing are encoded in
a different cluster (lacR1ABD2C) comprising a T6P kinase (LacC) and
TBP aldolase (LacD), subsequently leading to triose phosphates (DHAP
and GAP) [194] (Fig. 1.7). However, the gnb cluster is only present in
three lactobacilli species [194].
Fucose
Fucose differs from the other monosaccharides by lacking the hydroxyl
group at position C6 and possessing an L-configuration. It is a widespread
and abundant sugar found in mammalian cells as a major component of
glycoconjugates (N- and O-linked glycans and glycolipids), usually
localized at terminal positions of glycan structures [231]. The diversity of
fucosylated glycoconjugates is wide [231]. Fucose is highly abundant in
the mucins ranging from 4-14% according to the origin of the glycoprotein
[116,232], in the ABO blood group antigens [231,233,234], in intestine
epithelial surfaces and in dietary polysaccharides (e.g. pectin, human
milk oligosaccharides) [235,236], but it can also be found in bacterial
polysaccharides [237]. Therefore it is likely a potential sugar for bacterial
growth. Indeed, both pathogenic and commensal bacteria are able to
grow on Fuc (e.g. Bacteroides thetaiotaomicron [238], Salmonella
enterica serovar Typhimurium LT2 [239], Roseburia inulinivorans [235] or
E. coli [240]).
Interestingly, S. pneumoniae seems unable to use this sugar for growth
despite possessing the genes required to assemble a catabolic pathway
which suggests a non-metabolic role of Fuc metabolism [41,234,241]. In
support, different reports reveal the implication of Fuc metabolic genes in
pneumococcal virulence. A STM analysis implicated two transporter
subunits, a fuculose kinase and an extracellular hydrolase of the Fuc
operon, in pneumococcal virulence [102]. Later, deletion of the whole
operon resulted in attenuated virulence in a mouse model of pneumonia
General introduction
43
but does not have a role in colonisation [241]. More recently it was
suggested that the strain dependency ability to scavenge distinct
fucosylated glycans antigens might play a role in virulence in the
interaction with the host, in a strain-dependent manner [233,242]. Higgins
et al., [234] suggested that Fuc pathway in S. pneumoniae could act as a
mechanism for sensing Fuc-containing oligosaccharides, conducting Fuc
through the pathway being one intermediate, likely fuculose, the signalling
molecule.
Similarly, in other bacteria, non-metabolic functions were described for
Fuc. The enterohemorragic bacteria E. coli (EHEC) uses a Fuc sensing
mechanism to regulate gut colonisation (TCST, FusKR), by modulating
the expression of virulence genes in EHEC [243]. The regular intestinal
coloniser B. thetaiotaomicron, coordinates the expression of Fuc
utilization pathway with expression of a locus regulating the production of
fucosylated glycans in the intestinal enterocytes of the host, controlling
the supply and demand of Fuc [238,244]. Additionally, fucosylated
glycans are adherence targets for bacteria (e.g. Helicobacter pylori,
Campylobacter jejuni [245,246]) and Fuc was found to be a
chemoattractant in C. jejuni [232]. More interestingly H. pilory induces
host cells to produce α-L-fucosidase activity and can attach Fuc to the
bacterial cell surface [247].
All these examples highlight the relevance of fucose for bacteria at a
variety of levels.
Fucose catabolism
Two types of Fuc utilization operons were identified in the
pneumococcal genomes [41,233,234]. Type 1 operon, disclosed by
homology to E. coli and H. influenzae fucose metabolic proteins, is
widespread among pneumococcal genomes (e.g. TIGR4, R6, D39)
whereas Type 2 seems to be confined to a fewer strains (e.g. SP3-BS71)
Chapter 1
44
[41,233]. The general operon (Type 1) codes a fucose regulator (FucR, a
repressor controlling the whole operon), a fucose mutarotase (FucU) that
likely accelerates the conversion of the β and α forms of L-fucose, a L-
fucose isomerase (FucI) that acts over α-L-fucose to yield L-fuculose, a
L-fuculose kinase (FucK) that phosphorylates L-fuculose to L-fuculose 1-
phosphate and a L-fuculose phosphate aldolase (FucA) converts the latter
into DHAP and L-lactaldehyde. DHAP then enters in the glycolysis
[233,234] (Fig. 1.8). Both operons possess conserved features: the
regulator and the fucose processing genes fucI, fucK and fucA [233,234].
The main differences rely on the transport system - the PTS (EIIABCD) of
Type 1 operon is replaced by an ABC transporter in the Type 2 operon -,
and in the extra- and intracellular glycan-processing enzymes. The
extracellular family 98 glycoside hydrolases (GH98) with endo-β-D-
galactosidase activity, present in both operons, have different substrate
specificities. GH98 of Type 1 acts over Lewisantigen to release H-
disaccharide and GH98 of Type 2 operon cleaves A- and B- blood group
antigens to yield A/B trisaccharide products. Moreover, while Type 1
operon encodes a putative intracellular α-1,2-fucosidase GH95A, in
alternative, Type 2 operon codes GH29 and two additional glycosidases:
GH36A (putative α-N-acetylgalactosaminidase) and GH36B (putative α-
galactosidase) [233,234,242]. The different glycan substrate specificities
of GH98 enzymes of both operons, lead to the formulation of two models
for fucosylated-glycan uptake and metabolism [242]. In brief, in Type 1
model, H-disaccharide is transported and concomitantly phosphorylated
via PTS. The intracellular product is then cleaved to β-Fuc and Gal6P, by
GH95A. β-Fuc is converted to α-Fuc by FucU entering in Fuc catabolic
route [242,248]. In Type 2 model the trisaccharides enter the cell without
modification, by an ABC transporter, and are subject to GH36A/GH29
activities yielding α-Fuc, Gal and GalNAc or subject to GH29/GH36B to
yield Gal and α-Fuc [242,248].
General introduction
45
Higgins et al. [234], suggested that Fuc transport is mediated by a non-
specific permease, but the identity of such transporter is not yet known.
The pathway for Fuc metabolism is well established in E. coli [240,249–
251]. The major distinct features between Fuc catabolism in E. coli and in
the pneumococcus are the transport system, E. coli possesses a fucose
permease (H+-symporter [252]) not present in pneumococcal genomes,
and different glycoside hydrolases [234]. Moreover, while FucU catalyzes
the first step in Fuc catabolism in E. coli, in S. pneumoniae it links
glycoside hydrolase activity to bacterial Fuc catabolism [248].
More recently Campylobacter jejuni was found to grow on Fuc in a
strain dependent manner [253,254]. A new pathway, with no homologous
genes (except the permease for Fuc transport and lactaldehyde
dehydrogenase for aerobic degradation of lactaldehyde) to those
described in the enteric bacteria, was proposed, but is yet
uncharacterized [254,255]. Experimental evidence suggest that Fuc
enters the cell by a FucP, but is not phosphorylated, as in E. coli or
Bacteroides [254]. Surrounding FucP a set of genes, with homology to
those of the plant pathogen Xanthomonas campestris which code a new
Fuc pathway, was identified suggesting that Fuc is likely metabolized by
a similar route [254,256].

Chapter 1
46
Figure 1.8. Schematic representation of pathways for the dissimilation of fucose (Fuc) in bacteria.
Reactions are catalysed by the following protein encoding genes: fucU, fucose mutarotase; fucI, L-fucose isomerase; fucK, L-fuculose kinase; fucA, L-fuculose phosphate aldolase; tpiA, triosephosphate isomerase. Intermediates: Fucl, fuculose; Fucl1P, fuculose 1-phosphate; DHAP, dihydroxyacetone phosphate; GAP, glyceraldehyde 3-phosphate. In orange are depicted the intermediates and genes committed specifically to Fuc catabolism.
The general Fuc degradation pathway, comprising an isomerase, a
kinase, and an aldolase has been identified/proposed in several
microorganisms (e.g. E. coli [240,249–251], R. inulinivorans [235], B.
thetaiotaomicron [238], Clostridium phytofermentans [257]). Under
anaerobic conditions, the resultant L-lactaldehyde is reduced to L-1,2-
propanediol by a L-1,2-propanediol oxidoreductase (fucO) [240]. But
whereas in E. coli and B. thetaiotaomicron, L-1,2-propanediol is likely
excreted [235,240], in other microorganisms it is further metabolized.

General introduction
47
Salmonella serovar Typhimurium LT2 encodes an operon (pdu) for
propanediol utilization [258–260]. A different organization of pdu genes,
and with some distinct enzymatic features, was found in R. inulinivorans
[235,257]. Alternatively, in aerobiosis, L-lactaldeheyde is metabolized to
lactate by a lactaldehyde dehydrogenase (ald), and the latter to pyruvate,
in E. coli [260].
Opposite to the previous bacteria several strains of Lactobacillus were
unable to use or only moderately use Fuc [261]. Lactobacillus casei BL23
lacks genes for Fuc catabolism but expresses three α-fucosidases. This
bacterium grows on the fucosylated glycan Fuc-α-1,3-GlcNAc, but uses
only the GlcNAc moiety. The liberated Fuc is released to the environment
by a yet unknown mechanism [262].
Glycolysis, glucose and pyruvate metabolism
Glucose is the preferred carbon and energy sources of the majority of
the Streptococcaceae. S. pneumoniae seems to be no exception
[125,141].
Glucose enters the cell usually by PTS systems and is concomitantly
phosphorylated to glucose 6-phosphate (G6P). Bidossi et al. [141]
proposed the PTS-Man, ManLMN (PTSMan) as the main Glc uptake
system in S. pneumoniae, but transport through other PTSs was not ruled
out. Glc can also be up taken by non-PTS transporters and
phosphorylated by a glucokinase (GKI) yielding G6P. This hypothesis is
in line with the ability of ptsI mutants of S. pneumoniae to use glucose as
sole carbon source for growth [141] (Fig. 1.9). The presence of more than
one transporter for Glc internalization is widespread in bacteria (e.g. L.
lactis, E. coli or B. subtilis) [263–265]. The further processing of G6P into
pyruvate occurs via the Embden-Meyerhof-Parnas depicted in Fig. 1.9.
The net gain of Glc catabolism is two pyruvate molecules, two NADH and
two ATP´s per mole of Glc.
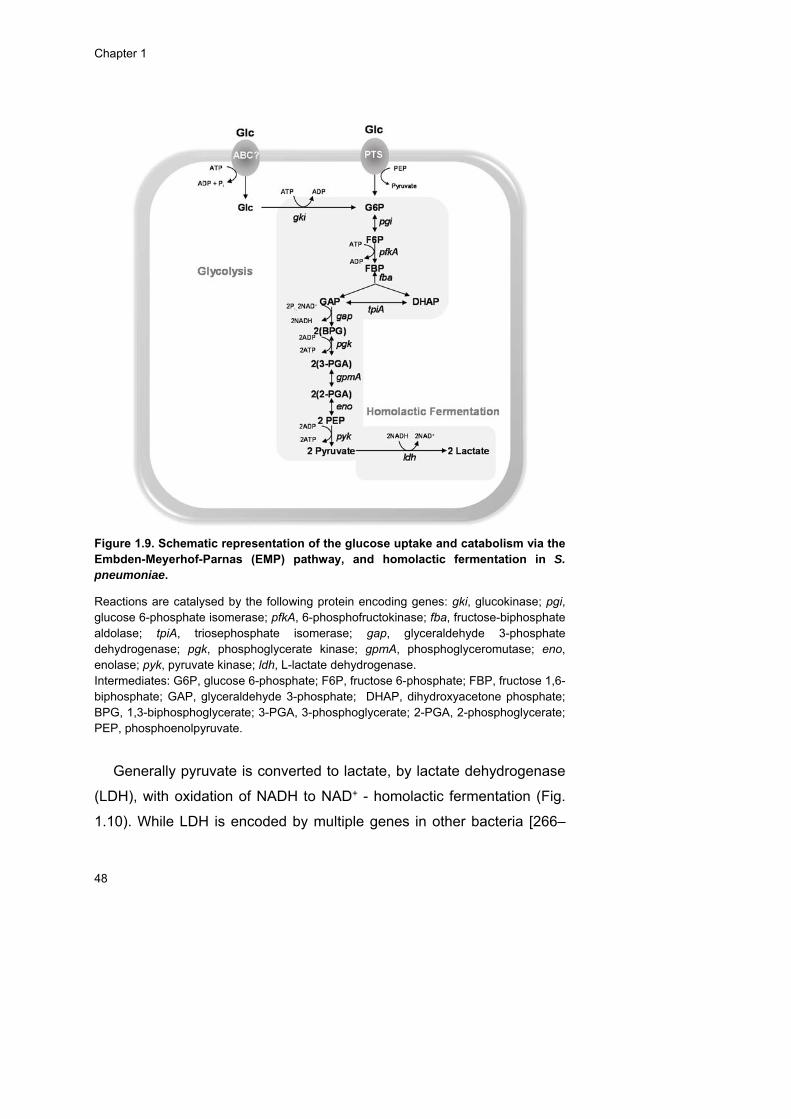
Chapter 1
48
Figure 1.9. Schematic representation of the glucose uptake and catabolism via the Embden-Meyerhof-Parnas (EMP) pathway, and homolactic fermentation in S. pneumoniae.
Reactions are catalysed by the following protein encoding genes: gki, glucokinase; pgi, glucose 6-phosphate isomerase; pfkA, 6-phosphofructokinase; fba, fructose-biphosphate aldolase; tpiA, triosephosphate isomerase; gap, glyceraldehyde 3-phosphate dehydrogenase; pgk, phosphoglycerate kinase; gpmA, phosphoglyceromutase; eno, enolase; pyk, pyruvate kinase; ldh, L-lactate dehydrogenase. Intermediates: G6P, glucose 6-phosphate; F6P, fructose 6-phosphate; FBP, fructose 1,6-biphosphate; GAP, glyceraldehyde 3-phosphate; DHAP, dihydroxyacetone phosphate; BPG, 1,3-biphosphoglycerate; 3-PGA, 3-phosphoglycerate; 2-PGA, 2-phosphoglycerate; PEP, phosphoenolpyruvate.
Generally pyruvate is converted to lactate, by lactate dehydrogenase
(LDH), with oxidation of NADH to NAD+ - homolactic fermentation (Fig.
1.10). While LDH is encoded by multiple genes in other bacteria [266–
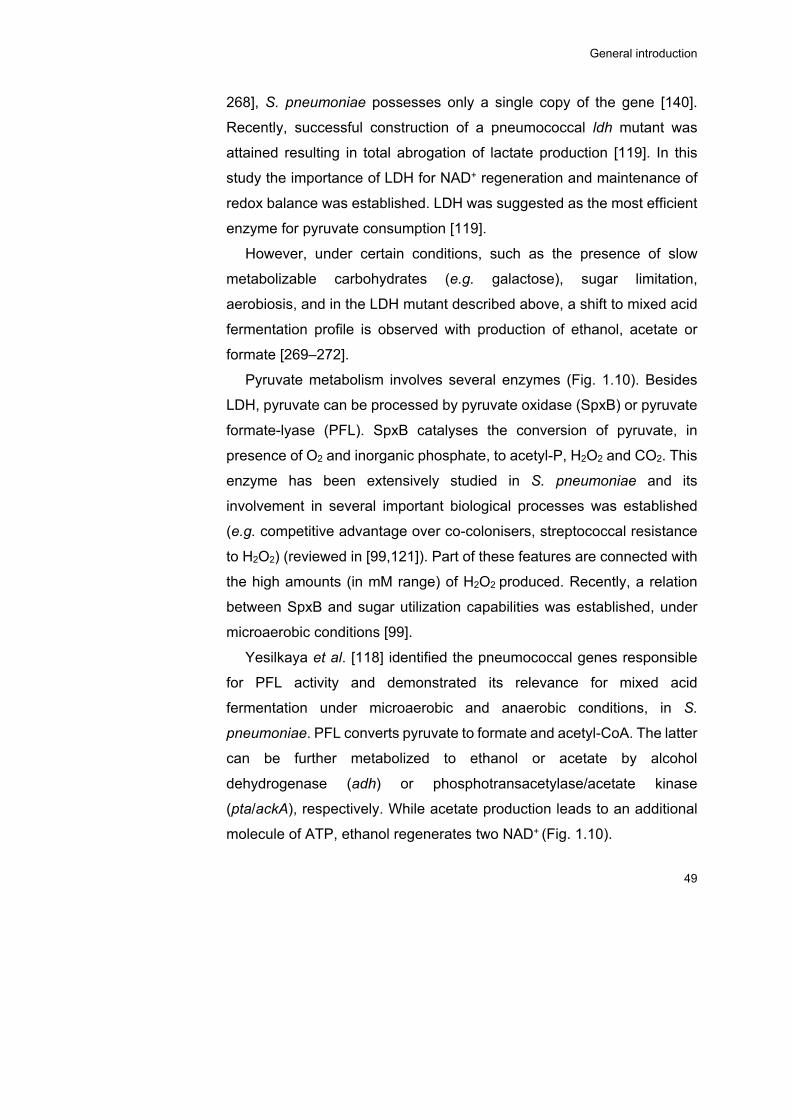
General introduction
49
268], S. pneumoniae possesses only a single copy of the gene [140].
Recently, successful construction of a pneumococcal ldh mutant was
attained resulting in total abrogation of lactate production [119]. In this
study the importance of LDH for NAD+ regeneration and maintenance of
redox balance was established. LDH was suggested as the most efficient
enzyme for pyruvate consumption [119].
However, under certain conditions, such as the presence of slow
metabolizable carbohydrates (e.g. galactose), sugar limitation,
aerobiosis, and in the LDH mutant described above, a shift to mixed acid
fermentation profile is observed with production of ethanol, acetate or
formate [269–272].
Pyruvate metabolism involves several enzymes (Fig. 1.10). Besides
LDH, pyruvate can be processed by pyruvate oxidase (SpxB) or pyruvate
formate-lyase (PFL). SpxB catalyses the conversion of pyruvate, in
presence of O2 and inorganic phosphate, to acetyl-P, H2O2 and CO2. This
enzyme has been extensively studied in S. pneumoniae and its
involvement in several important biological processes was established
(e.g. competitive advantage over co-colonisers, streptococcal resistance
to H2O2) (reviewed in [99,121]). Part of these features are connected with
the high amounts (in mM range) of H2O2 produced. Recently, a relation
between SpxB and sugar utilization capabilities was established, under
microaerobic conditions [99].
Yesilkaya et al. [118] identified the pneumococcal genes responsible
for PFL activity and demonstrated its relevance for mixed acid
fermentation under microaerobic and anaerobic conditions, in S.
pneumoniae. PFL converts pyruvate to formate and acetyl-CoA. The latter
can be further metabolized to ethanol or acetate by alcohol
dehydrogenase (adh) or phosphotransacetylase/acetate kinase
(pta/ackA), respectively. While acetate production leads to an additional
molecule of ATP, ethanol regenerates two NAD+ (Fig. 1.10).
Chapter 1
50
Figure 1.10. Schematic representation of pyruvate metabolism in S. pneumoniae.
Reactions are catalysed by the following protein encoding genes: spxB, pyruvate oxidase; ldh, L-lactate dehydrogenase; lcto, lactate oxidase; pflB, pyruvate formate-lyase; pta, phosphotransacetylase; ackA, acetate kinase; adh, bifunctional acetaldehyde-coA/alcohol dehydrogenase (SPD_1834); PDHC, pyruvate dehydrogenase complex. The occurrence of the reaction catalysed by PDHC is unknown and therefore is depicted in grey.
Several Streptococcaceae also possess the pyruvate dehydrogenase
complex (PDHC), which canalizes the oxidative decarboxylation of
pyruvate to acetyl-CoA and CO2, under aerobic conditions. S. pneumoniae
lacks genes homologous to those encoding PDHC [139,140,273].
However, the presence of a functional pyruvate dehydrogenase in the
pneumococcus is still controversial [118,274].
The versatility of pyruvate metabolism has been proposed to be a way
for effective pneumococcal in vivo fitness [99,119].
General introduction
51
In this thesis, we study the transcriptional response of S. pneumoniae
to mucin. In addition, we assess which monosaccharides, present in the
representative airway glycan mucin, are utilized by the pneumococcus to
grow and how it benefits from the diversity of sugars generated from its
deglycosylation. The biochemical routes predicted in silico for the
catabolism of mannose, galactose and N-acetylglucosamine in S.
pneumoniae D39 are experimentally validated (Chapter 2).
The importance of sugar-specific catabolic genes in galactose,
mannose and N-acetylglucosamine pathways is studied in mouse models
of pneumococcal colonisation and disease (Chapter 2). Furthermore, we
address the impact of carbohydrate availability (nasopharynx
carbohydrates and glucose) in the expression of known virulence factors
(Chapter 3).
We study, at transcriptional and metabolic levels, the response of the
pneumococcus to carbohydrates present in the airways and how S.
pneumoniae responds to the presence of the fast metabolizable sugar,
glucose, existing in comparatively high abundance in blood (Chapter 3).
References
1. Watson DA, Musher DM, Jacobson JW, Verhoef J. A brief history of the pneumococcus in biomedical research: a panoply of scientific discovery. Clin Infect Dis Off Publ Infect Dis Soc Am. 1993;17: 913–924.
2. López R. Pneumococcus: the sugar-coated bacteria. Int Microbiol Off J Span Soc Microbiol. 2006;9: 179–190.
3. Griffith, F. The significance of pneumococcal types. J Hyg. 1928;27: 113–159. 4. Avery OT, Macleod CM, McCarty M. Studies on the chemical nature of the substance
inducing transformation of pneumococcal types: induction of transformation by a desoxyribonucleic acid fraction isolated from pneumococcus type III. J Exp Med. 1944;79: 137–158.
5. Dochez A, Avery OT. The elaboration of specific soluble substance by pneumococcus during growth. J Exp Med. 1917;26: 477–493.
Chapter 1
52
6. Dochez AR, Avery OT. Soluble substance of pneumococcus origin in the blood and urine during lobar pneumonia. Exp Biol Med. 1917;14: 126–127. doi:10.3181/00379727-14-75
7. Avery OT. Immunological relationships of cell constituents of pneumococcus: second paper. J Exp Med. 1925;42: 367–376. doi:10.1084/jem.42.3.367
8. Avery OT, Goebel WF. Chemoimmunological studies on the soluble specific substance of pneumococcus: I. The isolation and properties of the acetyl polysaccharide of pneumococcus type I. J Exp Med. 1933;58: 731–755.
9. M Heidelberger, Avery OT. The soluble specific substance of pneumococcus. J Exp Med. 1923;38: 73–79.
10. Heidelberger M. Immunologically specific polysaccharides. Chem Rev. 1927;3: 403–423. doi:10.1021/cr60012a004
11. Tuomanen E. Streptococcus pneumoniae. In: Dworkin M, Falkow S, Rosenberg E, Schleifer K-H, Stackebrandt E, editors. The Prokaryotes. New York, NY: Springer US; 2006. pp. 149–162. Available: http://link.springer.com/10.1007/0-387-30744-3_4
12. Zapun A, Vernet T, Pinho MG. The different shapes of cocci. FEMS Microbiol Rev. 2008;32: 345–360. doi:10.1111/j.1574-6976.2007.00098.x
13. Pinho MG, Kjos M, Veening J-W. How to get (a)round: mechanisms controlling growth and division of coccoid bacteria. Nat Rev Microbiol. 2013;11: 601–614. doi:10.1038/nrmicro3088
14. Pérez-Dorado I, Galan-Bartual S, Hermoso JA. Pneumococcal surface proteins: when the whole is greater than the sum of its parts: Structural biology of pneumococcal surface proteins. Mol Oral Microbiol. 2012;27: 221–245. doi:10.1111/j.2041-1014.2012.00655.x
15. Martner A, Skovbjerg S, Paton JC, Wold AE. Streptococcus pneumoniae autolysis prevents phagocytosis and production of phagocyte-activating cytokines. Infect Immun. 2009;77: 3826–3837. doi:10.1128/IAI.00290-09
16. Henriques-Normark B, Tuomanen EI. The pneumococcus: epidemiology, microbiology, and pathogenesis. Cold Spring Harb Perspect Med. 2013;3: a010215–a010215. doi:10.1101/cshperspect.a010215
17. Nobbs AH, Lamont RJ, Jenkinson HF. Streptococcus adherence and colonization. Microbiol Mol Biol Rev MMBR. 2009;73: 407–450, Table of Contents. doi:10.1128/MMBR.00014-09
18. Arbique JC, Poyart C, Trieu-Cuot P, Quesne G, Carvalho M d. GS, Steigerwalt AG, et al. Accuracy of phenotypic and genotypic testing for identification of Streptococcus pneumoniae and description of Streptococcus pseudopneumoniae sp. nov. J Clin Microbiol. 2004;42: 4686–4696. doi:10.1128/JCM.42.10.4686-4696.2004
19. Doern CD, Burnham C-AD. It’s not easy being green: the viridans group streptococci, with a focus on pediatric clinical manifestations. J Clin Microbiol. 2010;48: 3829–3835. doi:10.1128/JCM.01563-10
20. Facklam R. What happened to the streptococci: overview of taxonomic and nomenclature changes. Clin Microbiol Rev. 2002;15: 613–630. doi:10.1128/CMR.15.4.613-630.2002
21. Reller LB, Weinstein MP, Werno AM, Murdoch DR. Laboratory diagnosis of invasive pneumococcal disease. Clin Infect Dis. 2008;46: 926–932. doi:10.1086/528798

General introduction
53
22. Song J-H, Dagan R, Klugman KP, Fritzell B. The relationship between pneumococcal serotypes and antibiotic resistance. Vaccine. 2012;30: 2728–2737. doi:10.1016/j.vaccine.2012.01.091
23. Vernet G, Saha S, Satzke C, Burgess DH, Alderson M, Maisonneuve J-F, et al. Laboratory-based diagnosis of pneumococcal pneumonia: state of the art and unmet needs: Laboratory-based diagnosis of pneumococcal pneumonia. Clin Microbiol Infect. 2011;17: 1–13. doi:10.1111/j.1469-0691.2011.03496.x
24. Habib M, Porter BD, Satzke C. Capsular serotyping of Streptococcus pneumoniae using the quellung reaction. J Vis Exp. 2014; doi:10.3791/51208
25. Leegaard TM, Bootsma HJ, Caugant DA, Eleveld MJ, Mannsaker T, Froholm LO, et al. Phenotypic and genomic characterization of pneumococcus-like streptococci isolated from HIV-seropositive patients. Microbiology. 2010;156: 838–848. doi:10.1099/mic.0.035345-0
26. Bandettini R, Melioli G. Laboratory diagnosis of Streptococcus pneumoniae infections: past and future. J Prev Med Hyg. 2012;53: 85–88.
27. Koornhof HJ, Madh SA, Feldman C, Gottberg A von, Klugman KP. A century of South African battles against the pneumococcus –“the Captain of Death.” South Afr J Epidemiol Infect. 2009;24: 7–19.
28. Gennaris A, Collet J-F. The “captain of the men of death”, Streptococcus pneumoniae , fights oxidative stress outside the “city wall”: A novel antioxidant surface defence. EMBO Mol Med. 2013;5: 1798–1800. doi:10.1002/emmm.201303482
29. Braido F, Bellotti M, De Maria A, Cazzola M, Canonica GW. The role of pneumococcal vaccine. Pulm Pharmacol Ther. 2008;21: 608–615. doi:10.1016/j.pupt.2008.04.001
30. Kadioglu A, Weiser JN, Paton JC, Andrew PW. The role of Streptococcus pneumoniae virulence factors in host respiratory colonization and disease. Nat Rev Microbiol. 2008;6: 288–301. doi:10.1038/nrmicro1871
31. Obaro S, Adegbola R. The pneumococcus: carriage, disease and conjugate vaccines. J Med Microbiol. 2002;51: 98–104.
32. Bosch AATM, Biesbroek G, Trzcinski K, Sanders EAM, Bogaert D. Viral and bacterial interactions in the upper respiratory tract. Hobman TC, editor. PLoS Pathog. 2013;9: e1003057. doi:10.1371/journal.ppat.1003057
33. Bogaert D, de Groot R, Hermans P. Streptococcus pneumoniae colonisation: the key to pneumococcal disease. Lancet Infect Dis. 2004;4: 144–154. doi:10.1016/S1473-3099(04)00938-7
34. Hava DL, LeMieux J, Camilli A. From nose to lung: the regulation behind Streptococcus pneumoniae virulence factors: Virulence gene regulation in S. pneumoniae. Mol Microbiol. 2003;50: 1103–1110. doi:10.1046/j.1365-2958.2003.03764.x
35. Lynch JP, Zhanel GG. Streptococcus pneumoniae: epidemiology, risk factors, and strategies for prevention. Semin Respir Crit Care Med. 2009;30: 189–209. doi:10.1055/s-0029-1202938
36. Feldman C, Anderson R. New insights into pneumococcal disease. Respirology. 2009;14: 167–179. doi:10.1111/j.1440-1843.2008.01422.x
37. Hill PC, Cheung YB, Akisanya A, Sankareh K, Lahai G, Greenwood BM, et al. Nasopharyngeal carriage of Streptococcus pneumoniae in Gambian infants: a longitudinal study. Clin Infect Dis Off Publ Infect Dis Soc Am. 2008;46: 807–814. doi:10.1086/528688
Chapter 1
54
38. Högberg L, Geli P, Ringberg H, Melander E, Lipsitch M, Ekdahl K. Age- and serogroup-related differences in observed durations of nasopharyngeal carriage of penicillin-resistant pneumococci. J Clin Microbiol. 2007;45: 948–952. doi:10.1128/JCM.01913-06
39. Sandgren A, Sjostrom K, Olsson-Liljequist B, Christensson B, Samuelsson A, Kronvall G, et al. Effect of clonal and serotype-specific properties on the invasive capacity of Streptococcus pneumoniae. J Infect Dis. 2004;189: 785–796. doi:10.1086/381686
40. Brueggemann AB, Peto TEA, Crook DW, Butler JC, Kristinsson KG, Spratt BG. Temporal and geographic stability of the serogroup-specific invasive disease potential of Streptococcus pneumoniae in children. J Infect Dis. 2004;190: 1203–1211. doi:10.1086/423820
41. Chan PF, O’Dwyer KM, Palmer LM, Ambrad JD, Ingraham KA, So C, et al. Characterization of a novel fucose-regulated promoter (PfcsK) suitable for gene essentiality and antibacterial mode-of-action studies in Streptococcus pneumoniae. J Bacteriol. 2003;185: 2051–2058. doi:10.1128/JB.185.6.2051-2058.2003
42. Nobbs AH, Jenkinson HF, Everett DB. Generic determinants of Streptococcus colonization and infection. Infect Genet Evol. 2014; doi:10.1016/j.meegid.2014.09.018
43. O’Brien KL, Wolfson LJ, Watt JP, Henkle E, Deloria-Knoll M, McCall N, et al. Burden of disease caused by Streptococcus pneumoniae in children younger than 5 years: global estimates. The Lancet. 2009;374: 893–902. doi:10.1016/S0140-6736(09)61204-6
44. Advisory Committee on Immunization Practices. Preventing pneumococcal disease among infants and young children. Recommendations of the Advisory Committee on Immunization Practices (ACIP). MMWR Recomm Rep Morb Mortal Wkly Rep Recomm Rep Cent Dis Control. 2000;49: 1–35.
45. Feldman C, Anderson R. Review: Current and new generation pneumococcal vaccines. J Infect. 2014;69: 309–325. doi:10.1016/j.jinf.2014.06.006
46. Wardlaw TM, Johansson EW, Hodge MJ, UNICEF, Division of Communication, World Health Organization. Pneumonia: the forgotten killer of children. New York: UNICEF : Geneva, Switzerland : World Health Organization; 2006.
47. Johnson HL, Deloria-Knoll M, Levine OS, Stoszek SK, Freimanis Hance L, Reithinger R, et al. Systematic evaluation of serotypes causing invasive pneumococcal disease among children under five: the pneumococcal global serotype project. Cohen J, editor. PLoS Med. 2010;7: e1000348. doi:10.1371/journal.pmed.1000348
48. Davis SM, Deloria-Knoll M, Kassa HT, O’Brien KL. Impact of pneumococcal conjugate vaccines on nasopharyngeal carriage and invasive disease among unvaccinated people: Review of evidence on indirect effects. Vaccine. 2013;32: 133–145. doi:10.1016/j.vaccine.2013.05.005
49. Frazão N, Hiller NL, Powell E, Earl J, Ahmed A, Sá-Leão R, et al. Virulence potential and genome-wide characterization of drug resistant Streptococcus pneumoniae clones selected in vivo by the 7-valent pneumococcal conjugate vaccine. Miyaji EN, editor. PLoS ONE. 2013;8: e74867. doi:10.1371/journal.pone.0074867
50. Dagan R, Juergens C, Trammel J, Patterson S, Greenberg D, Givon-Lavi N, et al. Efficacy of 13-valent versus 7-valent pneumococcal conjugate vaccine against
General introduction
55
nasopharyngeal colonization of antibiotic-nonsusceptible Streptococcus pneumoniae. J Infect Dis. 2014; doi:10.1093/infdis/jiu576
51. El-Solh A, Assaad, El-Masri, Porhomayon J. Pneumonia immunization in older adults: review of vaccine effectiveness and strategies. Clin Interv Aging. 2012; 453. doi:10.2147/CIA.S29675
52. Improving global health by preventing pneumococcal disease. Report from the all-party parliamentary group on pneumococcal disease prevention in the developing world. 2008.
53. Jenkinson HF, Lamont R. Streptococcal adhesion and colonization. Crit Rev Oral Biol Med. 1997;8: 175–200. doi:10.1177/10454411970080020601
54. Catterall JR. Streptococcus pneumoniae. Thorax. 1999;54: 929–937. doi:10.1136/thx.54.10.929
55. Casadevall A, Pirofski L. Host-pathogen interactions: the attributes of virulence. J Infect Dis. 2001;184: 337–344. doi:10.1086/322044
56. Weiser JN. The pneumococcus: why a commensal misbehaves. J Mol Med Berl. 2010;88: 97–102. doi:10.1007/s00109-009-0557-x
57. Nelson AL, Roche AM, Gould JM, Chim K, Ratner AJ, Weiser JN. Capsule enhances pneumococcal colonization by limiting mucus-mediated clearance. Infect Immun. 2007;75: 83–90. doi:10.1128/IAI.01475-06
58. Weiser JN, Austrian R, Sreenivasan PK, Masure HR. Phase variation in pneumococcal opacity: relationship between colonial morphology and nasopharyngeal colonization. Infect Immun. 1994;62: 2582–2589.
59. Cundell DR, Weiser JN, Shen J, Young A, Tuomanen EI. Relationship between colonial morphology and adherence of Streptococcus pneumoniae. Infect Immun. 1995;63: 757–761.
60. Weiser JN, Bae D, Epino H, Gordon SB, Kapoor M, Zenewicz LA, et al. Changes in availability of oxygen accentuate differences in capsular polysaccharide expression by phenotypic variants and clinical isolates of Streptococcus pneumoniae. Infect Immun. 2001;69: 5430–5439.
61. Hammerschmidt S, Wolff S, Hocke A, Rosseau S, Müller E, Rohde M. Illustration of pneumococcal polysaccharide capsule during adherence and invasion of epithelial cells. Infect Immun. 2005;73: 4653–4667. doi:10.1128/IAI.73.8.4653-4667.2005
62. Voß S, Gámez G, Hammerschmidt S. Impact of pneumococcal microbial surface components recognizing adhesive matrix molecules on colonization: Impact of pneumococcal MSCRAMMs on colonization. Mol Oral Microbiol. 2012;27: 246–256. doi:10.1111/j.2041-1014.2012.00654.x
63. Kim JO, Romero-Steiner S, Sørensen UB, Blom J, Carvalho M, Barnard S, et al. Relationship between cell surface carbohydrates and intrastrain variation on opsonophagocytosis of Streptococcus pneumoniae. Infect Immun. 1999;67: 2327–2333.
64. Austrian R. Some observations on the pneumococcus and on the current status of pneumococcal disease and its prevention. Rev Infect Dis. 1981;3 Suppl: S1–17.
65. Musher DM. Infections caused by Streptococcus pneumoniae: clinical spectrum, pathogenesis, immunity, and treatment. Clin Infect Dis Off Publ Infect Dis Soc Am. 1992;14: 801–807.
66. Winkelstein JA. The role of complement in the host’s defense against Streptococcus pneumoniae. Rev Infect Dis. 1981;3: 289–298.
Chapter 1
56
67. Van der Poll T, Opal SM. Pathogenesis, treatment, and prevention of pneumococcal pneumonia. Lancet. 2009;374: 1543–1556. doi:10.1016/S0140-6736(09)61114-4
68. Fernebro J, Andersson I, Sublett J, Morfeldt E, Novak R, Tuomanen E, et al. Capsular expression in Streptococcus pneumoniae negatively affects spontaneous and antibiotic-induced lysis and contributes to antibiotic tolerance. J Infect Dis. 2004;189: 328–338. doi:10.1086/380564
69. Weiser JN, Kapoor M. Effect of intrastrain variation in the amount of capsular polysaccharide on genetic transformation of Streptococcus pneumoniae: implications for virulence studies of encapsulated strains. Infect Immun. 1999;67: 3690–3692.
70. Iannelli F, Pearce BJ, Pozzi G. The type 2 capsule locus of Streptococcus pneumoniae. J Bacteriol. 1999;181: 2652–2654.
71. Shainheit MG, Mule M, Camilli A, Pirofski L. The core promoter of the capsule operon of Streptococcus pneumoniae is necessary for colonization and invasive disease. Infect Immun. 2014;82: 694–705. doi:10.1128/IAI.01289-13
72. MacLEOD CM, Kraus MR. Relation of virulence of pneumococcal strains for mice to the quantity of capsular polysaccharide formed in vitro. J Exp Med. 1950;92: 1–9.
73. Bergmann S. Versatility of pneumococcal surface proteins. Microbiology. 2006;152: 295–303. doi:10.1099/mic.0.28610-0
74. Hammerschmidt S. Adherence molecules of pathogenic pneumococci. Curr Opin Microbiol. 2006;9: 12–20. doi:10.1016/j.mib.2005.11.001
75. King SJ. Pneumococcal modification of host sugars: a major contributor to colonization of the human airway? Mol Oral Microbiol. 2010;25: 15–24. doi:10.1111/j.2041-1014.2009.00564.x
76. Dalia AB, Standish AJ, Weiser JN. Three surface exoglycosidases from Streptococcus pneumoniae, NanA, BgaA, and StrH, promote resistance to opsonophagocytic killing by human neutrophils. Infect Immun. 2010;78: 2108–2116. doi:10.1128/IAI.01125-09
77. King SJ, Hippe KR, Weiser JN. Deglycosylation of human glycoconjugates by the sequential activities of exoglycosidases expressed by Streptococcus pneumoniae. Mol Microbiol. 2006;59: 961–974. doi:10.1111/j.1365-2958.2005.04984.x
78. Limoli DH, Sladek JA, Fuller LA, Singh AK, King SJ. BgaA acts as an adhesin to mediate attachment of some pneumococcal strains to human epithelial cells. Microbiology. 2011;157: 2369–2381. doi:10.1099/mic.0.045609-0
79. Kostyukova NN, Volkova MO, Ivanova VV, Kvetnaya AS. A study of pathogenic factors of Streptococcus pneumoniae strains causing meningitis. FEMS Immunol Med Microbiol. 1995;10: 133–137.
80. Zwijnenburg PJ, van der Poll T, Florquin S, van Deventer SJ, Roord JJ, van Furth AM. Experimental pneumococcal meningitis in mice: a model of intranasal infection. J Infect Dis. 2001;183: 1143–1146. doi:10.1086/319271
81. Bethe G, Nau R, Wellmer A, Hakenbeck R, Reinert RR, Heinz HP, et al. The cell wall-associated serine protease PrtA: a highly conserved virulence factor of Streptococcus pneumoniae. FEMS Microbiol Lett. 2001;205: 99–104.
82. Mitchell AM, Mitchell TJ. Streptococcus pneumoniae: virulence factors and variation. Clin Microbiol Infect. 2010;16: 411–418. doi:10.1111/j.1469-0691.2010.03183.x
83. Berry AM, Paton JC. Sequence heterogeneity of PsaA, a 37-kilodalton putative adhesin essential for virulence of Streptococcus pneumoniae. Infect Immun. 1996;64: 5255–5262.
General introduction
57
84. Nieto PA, Riquelme SA, Riedel CA, Kalergis AM, Bueno SM. Gene elements that regulate Streptococcus pneumoniae virulence and immunity evasion. Curr Gene Ther. 2013;13: 51–64.
85. Gosink KK, Mann ER, Guglielmo C, Tuomanen EI, Masure HR. Role of novel choline binding proteins in virulence of Streptococcus pneumoniae. Infect Immun. 2000;68: 5690–5695. doi:10.1128/IAI.68.10.5690-5695.2000
86. Holmes AR, McNab R, Millsap KW, Rohde M, Hammerschmidt S, Mawdsley JL, et al. The pavA gene of Streptococcus pneumoniae encodes a fibronectin-binding protein that is essential for virulence. Mol Microbiol. 2001;41: 1395–1408.
87. Pracht D, Elm C, Gerber J, Bergmann S, Rohde M, Seiler M, et al. PavA of Streptococcus pneumoniae modulates adherence, invasion, and meningeal inflammation. Infect Immun. 2005;73: 2680–2689. doi:10.1128/IAI.73.5.2680-2689.2005
88. Eberhard T, Kronvall G, Ullberg M. Surface bound plasmin promotes migration of Streptococcus pneumoniae through reconstituted basement membranes. Microb Pathog. 1999;26: 175–181. doi:10.1006/mpat.1998.0262
89. Bergmann S, Rohde M, Chhatwal GS, Hammerschmidt S. alpha-enolase of Streptococcus pneumoniae is a plasmin(ogen)-binding protein displayed on the bacterial cell surface. Mol Microbiol. 2001;40: 1273–1287.
90. Bergmann S, Rohde M, Hammerschmidt S. Glyceraldehyde-3-phosphate dehydrogenase of Streptococcus pneumoniae is a surface-displayed plasminogen-binding protein. Infect Immun. 2004;72: 2416–2419. doi:10.1128/IAI.72.4.2416-2419.2004
91. Bergmann S, Schoenen H, Hammerschmidt S. The interaction between bacterial enolase and plasminogen promotes adherence of Streptococcus pneumoniae to epithelial and endothelial cells. Int J Med Microbiol. 2013;303: 452–462. doi:10.1016/j.ijmm.2013.06.002
92. Balachandran P, Hollingshead SK, Paton JC, Briles DE. The autolytic enzyme LytA of Streptococcus pneumoniae is not responsible for releasing pneumolysin. J Bacteriol. 2001;183: 3108–3116. doi:10.1128/JB.183.10.3108-3116.2001
93. Yuste J, Botto M, Paton JC, Holden DW, Brown JS. Additive inhibition of complement deposition by pneumolysin and PspA facilitates Streptococcus pneumoniae septicemia. J Immunol Baltim Md 1950. 2005;175: 1813–1819.
94. Feldman C, Mitchell TJ, Andrew PW, Boulnois GJ, Read RC, Todd HC, et al. The effect of Streptococcus pneumoniae pneumolysin on human respiratory epithelium in vitro. Microb Pathog. 1990;9: 275–284.
95. Dawid S, Roche AM, Weiser JN. The blp bacteriocins of Streptococcus pneumoniae mediate intraspecies competition both in vitro and in vivo. Infect Immun. 2007;75: 443–451. doi:10.1128/IAI.01775-05
96. Pericone CD, Overweg K, Hermans PW, Weiser JN. Inhibitory and bactericidal effects of hydrogen peroxide production by Streptococcus pneumoniae on other inhabitants of the upper respiratory tract. Infect Immun. 2000;68: 3990–3997.
97. Regev-Yochay G, Trzcinski K, Thompson CM, Malley R, Lipsitch M. Interference between Streptococcus pneumoniae and Staphylococcus aureus: In vitro hydrogen peroxide-mediated killing by Streptococcus pneumoniae. J Bacteriol. 2006;188: 4996–5001. doi:10.1128/JB.00317-06
Chapter 1
58
98. Hoffmann O, Zweigner J, Smith SH, Freyer D, Mahrhofer C, Dagand E, et al. Interplay of pneumococcal hydrogen peroxide and host-derived nitric oxide. Infect Immun. 2006;74: 5058–5066. doi:10.1128/IAI.01932-05
99. Carvalho SM, Farshchi Andisi V, Gradstedt H, Neef J, Kuipers OP, Neves AR, et al. Pyruvate oxidase influences the sugar utilization pattern and capsule production in Streptococcus pneumoniae. Chi J-TA, editor. PLoS ONE. 2013;8: e68277. doi:10.1371/journal.pone.0068277
100. Lau GW, Haataja S, Lonetto M, Kensit SE, Marra A, Bryant AP, et al. A functional genomic analysis of type 3 Streptococcus pneumoniae virulence. Mol Microbiol. 2001;40: 555–571.
101. Polissi A, Pontiggia A, Feger G, Altieri M, Mottl H, Ferrari L, et al. Large-scale identification of virulence genes from Streptococcus pneumoniae. Infect Immun. 1998;66: 5620–5629.
102. Hava DL, Camilli A. Large-scale identification of serotype 4 Streptococcus pneumoniae virulence factors. Mol Microbiol. 2002;45: 1389–1406.
103. Ogunniyi AD, Mahdi LK, Trappetti C, Verhoeven N, Mermans D, Van der Hoek MB, et al. Identification of genes that contribute to the pathogenesis of invasive pneumococcal disease by in vivo transcriptomic analysis. Infect Immun. 2012;80: 3268–3278. doi:10.1128/IAI.00295-12
104. LeMessurier KS. Differential expression of key pneumococcal virulence genes in vivo. Microbiology. 2006;152: 305–311. doi:10.1099/mic.0.28438-0
105. Orihuela CJ, Radin JN, Sublett JE, Gao G, Kaushal D, Tuomanen EI. Microarray analysis of pneumococcal gene expression during invasive disease. Infect Immun. 2004;72: 5582–5596. doi:10.1128/IAI.72.10.5582-5596.2004
106. Song X-M, Connor W, Hokamp K, Babiuk LA, Potter AA. Streptococcus pneumoniae early response genes to human lung epithelial cells. BMC Res Notes. 2008;1: 64. doi:10.1186/1756-0500-1-64
107. Van Opijnen T, Camilli A. A fine scale phenotype-genotype virulence map of a bacterial pathogen. Genome Res. 2012;22: 2541–2551. doi:10.1101/gr.137430.112
108. Marion C, Aten AE, Woodiga SA, King SJ. Identification of an ATPase, MsmK, which energizes multiple carbohydrate ABC transporters in Streptococcus pneumoniae. Infect Immun. 2011;79: 4193–4200. doi:10.1128/IAI.05290-11
109. Marion C, Burnaugh AM, Woodiga SA, King SJ. Sialic acid transport contributes to pneumococcal colonization. Infect Immun. 2011;79: 1262–1269. doi:10.1128/IAI.00832-10
110. Marion C, Stewart JM, Tazi MF, Burnaugh AM, Linke CM, Woodiga SA, et al. Streptococcus pneumoniae can utilize multiple sources of hyaluronic acid for growth. Infect Immun. 2012;80: 1390–1398. doi:10.1128/IAI.05756-11
111. Iyer R, Camilli A. Sucrose metabolism contributes to in vivo fitness of Streptococcus pneumoniae. Mol Microbiol. 2007;66: 1–13. doi:10.1111/j.1365-2958.2007.05878.x
112. Tong HH, Blue LE, James MA, DeMaria TF. Evaluation of the virulence of a Streptococcus pneumoniae neuraminidase-deficient mutant in nasopharyngeal colonization and development of otitis media in the chinchilla model. Infect Immun. 2000;68: 921–924.
113. Manco S, Hernon F, Yesilkaya H, Paton JC, Andrew PW, Kadioglu A. Pneumococcal neuraminidases A and B both have essential roles during infection of the respiratory tract and sepsis. Infect Immun. 2006;74: 4014–4020. doi:10.1128/IAI.01237-05

General introduction
59
114. Marion C, Limoli DH, Bobulsky GS, Abraham JL, Burnaugh AM, King SJ. Identification of a pneumococcal glycosidase that modifies O-linked glycans. Infect Immun. 2009;77: 1389–1396. doi:10.1128/IAI.01215-08
115. Jeong JK, Kwon O, Lee YM, Oh D-B, Lee JM, Kim S, et al. Characterization of the Streptococcus pneumoniae BgaC protein as a novel surface β-galactosidase with specific hydrolysis activity for the Galβ1-3GlcNAc moiety of oligosaccharides. J Bacteriol. 2009;191: 3011–3023. doi:10.1128/JB.01601-08
116. Terra VS, Homer KA, Rao SG, Andrew PW, Yesilkaya H. Characterization of novel β-galactosidase activity that contributes to glycoprotein degradation and virulence in Streptococcus pneumoniae. Infect Immun. 2010;78: 348–357. doi:10.1128/IAI.00721-09
117. Brittan JL, Buckeridge TJ, Finn A, Kadioglu A, Jenkinson HF. Pneumococcal neuraminidase A: an essential upper airway colonization factor for Streptococcus pneumoniae: Streptococcus pneumoniae neuraminidase. Mol Oral Microbiol. 2012;27: 270–283. doi:10.1111/j.2041-1014.2012.00658.x
118. Yesilkaya H, Spissu F, Carvalho SM, Terra VS, Homer KA, Benisty R, et al. Pyruvate formate lyase is required for pneumococcal fermentative metabolism and virulence. Infect Immun. 2009;77: 5418–5427. doi:10.1128/IAI.00178-09
119. Gaspar P, Al-Bayati FAY, Andrew PW, Neves AR, Yesilkaya H. Lactate dehydrogenase is the key enzyme for pneumococcal pyruvate metabolism and pneumococcal survival in blood. Infect Immun. 2014;82: 5099–5109. doi:10.1128/IAI.02005-14
120. Spellerberg B, Cundell DR, Sandros J, Pearce BJ, Idanpaan-Heikkila I, Rosenow C, et al. Pyruvate oxidase, as a determinant of virulence in Streptococcus pneumoniae. Mol Microbiol. 1996;19: 803–813.
121. Hakansson AP. Pneumococcal adaptive responses to changing host environments. J Infect Dis. 2014;210: 1–3. doi:10.1093/infdis/jiu084
122. Deutscher J, Francke C, Postma PW. How phosphotransferase system-related protein phosphorylation regulates carbohydrate metabolism in bacteria. Microbiol Mol Biol Rev. 2006;70: 939–1031. doi:10.1128/MMBR.00024-06
123. Giammarinaro P, Paton JC. Role of RegM, a homologue of the catabolite repressor protein CcpA, in the virulence of Streptococcus pneumoniae. Infect Immun. 2002;70: 5454–5461.
124. Iyer R, Baliga NS, Camilli A. Catabolite Control Protein A (CcpA) Contributes to virulence and regulation of sugar metabolism in Streptococcus pneumoniae. J Bacteriol. 2005;187: 8340–8349. doi:10.1128/JB.187.24.8340-8349.2005
125. Carvalho SM, Kloosterman TG, Kuipers OP, Neves AR. CcpA ensures optimal metabolic fitness of Streptococcus pneumoniae. Horsburgh MJ, editor. PLoS ONE. 2011;6: e26707. doi:10.1371/journal.pone.0026707
126. Sharon N. Nomenclature of glycoproteins, glycopeptides and peptidoglycans (Recommendations 1985). Pure Appl Chem. 1988;60. doi:10.1351/pac198860091389
127. Sasaki N, Toyoda M. Glycoconjugates and related molecules in human vascular endothelial cells. Int J Vasc Med. 2013;2013: 1–10. doi:10.1155/2013/963596
128. Tytgat HLP, Lebeer S. The sweet tooth of bacteria: common themes in bacterial glycoconjugates. Microbiol Mol Biol Rev. 2014;78: 372–417. doi:10.1128/MMBR.00007-14
Chapter 1
60
129. Rose MC, Voynow JA. Respiratory tract mucin genes and mucin glycoproteins in health and disease. Physiol Rev. 2006;86: 245–278. doi:10.1152/physrev.00010.2005
130. Thornton DJ. From mucins to mucus: toward a more coherent understanding of this essential barrier. Proc Am Thorac Soc. 2004;1: 54–61. doi:10.1513/pats.2306016
131. Derrien M, van Passel MW, van de Bovenkamp JH, Schipper RG, de Vos WM, Dekker J. Mucin-bacterial interactions in the human oral cavity and digestive tract. Gut Microbes. 2010;1: 254–268. doi:10.4161/gmic.1.4.12778
132. Linden SK, Sutton P, Karlsson NG, Korolik V, McGuckin MA. Mucins in the mucosal barrier to infection. Mucosal Immunol. 2008;1: 183–197. doi:10.1038/mi.2008.5
133. Mack DR, Michail S, Wei S, McDougall L, Hollingsworth MA. Probiotics inhibit enteropathogenic E. coli adherence in vitro by inducing intestinal mucin gene expression. Am J Physiol. 1999;276: G941–950.
134. Slomiany BL, Slomiany A. Cytosolic phospholipase A2 activation in Helicobacter pylori lipopolysaccharide-induced interference with gastric mucin synthesis. IUBMB Life. 2006;58: 217–223. doi:10.1080/15216540600732021
135. Bry L, Falk PG, Midtvedt T, Gordon JI. A model of host-microbial interactions in an open mammalian ecosystem. Science. 1996;273: 1380–1383.
136. Lindén SK, Wickström C, Lindell G, Gilshenan K, Carlstedt I. Four modes of adhesion are used during Helicobacter pylori binding to human mucins in the oral and gastric niches. Helicobacter. 2008;13: 81–93. doi:10.1111/j.1523-5378.2008.00587.x
137. Corfield AP, Wagner SA, Clamp JR, Kriaris MS, Hoskins LC. Mucin degradation in the human colon: production of sialidase, sialate O-acetylesterase, N-acetylneuraminate lyase, arylesterase, and glycosulfatase activities by strains of fecal bacteria. Infect Immun. 1992;60: 3971–3978.
138. Homer KA, Whiley RA, Beighton D. Production of specific glycosidase activities by Streptococcus intermedius strain UNS35 grown in the presence of mucin. J Med Microbiol. 1994;41: 184–190.
139. Hoskins J, Alborn WE, Arnold J, Blaszczak LC, Burgett S, DeHoff BS, et al. Genome of the bacterium Streptococcus pneumoniae strain R6. J Bacteriol. 2001;183: 5709–5717. doi:10.1128/JB.183.19.5709-5717.2001
140. Tettelin H, Nelson KE, Paulsen IT, Eisen JA, Read TD, Peterson S, et al. Complete genome sequence of a virulent isolate of Streptococcus pneumoniae. Science. 2001;293: 498–506. doi:10.1126/science.1061217
141. Bidossi A, Mulas L, Decorosi F, Colomba L, Ricci S, Pozzi G, et al. A functional genomics approach to establish the complement of carbohydrate transporters in Streptococcus pneumoniae. Miyaji EN, editor. PLoS ONE. 2012;7: e33320. doi:10.1371/journal.pone.0033320
142. Rohmer L, Hocquet D, Miller SI. Are pathogenic bacteria just looking for food? Metabolism and microbial pathogenesis. Trends Microbiol. 2011;19: 341–348. doi:10.1016/j.tim.2011.04.003
143. Buckwalter CM, King SJ. Pneumococcal carbohydrate transport: food for thought. Trends Microbiol. 2012;20: 517–522. doi:10.1016/j.tim.2012.08.008
144. Price CE, Zeyniyev A, Kuipers OP, Kok J. From meadows to milk to mucosa - adaptation of Streptococcus and Lactococcus species to their nutritional environments. FEMS Microbiol Rev. 2012; 36(5):949-71. doi:10.1111/j.1574-6976.2011.00323.x

General introduction
61
145. Shelburne SA, Davenport MT, Keith DB, Musser JM. The role of complex carbohydrate catabolism in the pathogenesis of invasive streptococci. Trends Microbiol. 2008;16: 318–325. doi:10.1016/j.tim.2008.04.002
146. Philips BJ, Meguer J-X, Redman J, Baker EH. Factors determining the appearance of glucose in upper and lower respiratory tract secretions. Intensive Care Med. 2003;29: 2204–2210. doi:10.1007/s00134-003-1961-2
147. Yesilkaya H, Manco S, Kadioglu A, Terra VS, Andrew PW. The ability to utilize mucin affects the regulation of virulence gene expression in Streptococcus pneumoniae. FEMS Microbiol Lett. 2008;278: 231–235. doi:10.1111/j.1574-6968.2007.01003.x
148. Burnaugh AM, Frantz LJ, King SJ. Growth of Streptococcus pneumoniae on human glycoconjugates is dependent upon the sequential activity of bacterial exoglycosidases. J Bacteriol. 2008;190: 221–230. doi:10.1128/JB.01251-07
149. Konings WN, Poolman B, van Veen HW. Solute transport and energy transduction in bacteria. Antonie Van Leeuwenhoek. 1994;65: 369–380.
150. Davidson AL, Dassa E, Orelle C, Chen J. Structure, function, and evolution of bacterial ATP-binding cassette systems. Microbiol Mol Biol Rev. 2008;72: 317–364. doi:10.1128/MMBR.00031-07
151. Higgins CF. ABC transporters: physiology, structure and mechanism – an overview. Res Microbiol. 2001;152: 205–210.
152.Postma PW, Lengeler JW. Phosphoenolpyruvate:carbohydrate phosphotransferase system of bacteria. Microbiol Rev. 1985;49: 232–269.
153. Lorca GL, Barabote RD, Zlotopolski V, Tran C, Winnen B, Hvorup RN, et al. Transport capabilities of eleven gram-positive bacteria: Comparative genomic analyses. Biochim Biophys Acta BBA - Biomembr. 2007;1768: 1342–1366. doi:10.1016/j.bbamem.2007.02.007
154. Postma PW, Lengeler JW, Jacobson GR. Phosphoenolpyruvate:carbohydrate phosphotransferase systems of bacteria. Microbiol Rev. 1993;57: 543–594.
155. Zähner D, Hakenbeck R. The Streptococcus pneumoniae beta-galactosidase is a surface protein. J Bacteriol. 2000;182: 5919–5921.
156. Cai J, Tong H, Qi F, Dong X. CcpA-dependent carbohydrate catabolite repression regulates galactose metabolism in Streptococcus oligofermentans. J Bacteriol. 2012;194: 3824–3832. doi:10.1128/JB.00156-12
157. Zeng L, Xue P, Stanhope MJ, Burne RA. A galactose-specific sugar: phosphotransferase permease is prevalent in the non-core genome of Streptococcus mutans. Mol Oral Microbiol. 2013;28: 292–301. doi:10.1111/omi.12025
158. Grossiord BP, Luesink EJ, Vaughan EE, Arnaud A, de Vos WM. Characterization, expression, and mutation of the Lactococcus lactis galPMKTE genes, involved in galactose utilization via the Leloir pathway. J Bacteriol. 2003;185: 870–878. doi:10.1128/JB.185.3.870-878.2003
159. Thomas TD, Turner KW, Crow VL. Galactose fermentation by Streptococcus lactis and Streptococcus cremoris: pathways, products, and regulation. J Bacteriol. 1980;144: 672–682.
160. Thompson J. Galactose transport systems in Streptococcus lactis. J Bacteriol. 1980;144: 683–691.
161. De Vos WM, Vaughan EE. Genetics of lactose utilization in lactic acid bacteria. FEMS Microbiol Rev. 1994;15: 217–237.
Chapter 1
62
162. LeBlanc DJ, Crow VL, Lee LN, Garon CF. Influence of the lactose plasmid on the metabolism of galactose by Streptococcus lactis. J Bacteriol. 1979;137: 878–884.
163. Zeng L, Das S, Burne RA. Utilization of lactose and galactose by Streptococcus mutans: transport, toxicity, and carbon catabolite repression. J Bacteriol. 2010;192: 2434–2444. doi:10.1128/JB.01624-09
164. Abranches J, Chen Y-YM, Burne RA. Galactose metabolism by Streptococcus mutans. Appl Env Microbiol. 2004;70: 6047–6052. doi:10.1128/AEM.70.10.6047-6052.2004
165. Neves AR, Pool WA, Solopova A, Kok J, Santos H, Kuipers OP. Towards enhanced galactose utilization by Lactococcus lactis. Appl Env Microbiol. 2010;76: 7048–7060. doi:10.1128/AEM.01195-10
166. Zeng L, Martino NC, Burne RA. Two gene clusters coordinate galactose and lactose metabolism in Streptococcus gordonii. Appl Env Microbiol. 2012;78: 5597–5605. doi:10.1128/AEM.01393-12
167. Kaufman GE, Yother J. CcpA-dependent and -independent control of beta-galactosidase expression in Streptococcus pneumoniae occurs via regulation of an upstream phosphotransferase system-encoding operon. J Bacteriol. 2007;189: 5183–5192. doi:10.1128/JB.00449-07
168.Chen Y-YM, Betzenhauser MJ, Snyder JA, Burne RA. Pathways for lactose/galactose catabolism by Streptococcus salivarius. FEMS Microbiol Lett. 2002;209: 75–79.
169. Vaillancourt K, LeMay J-D, Lamoureux M, Frenette M, Moineau S, Vadeboncoeur C. Characterization of a galactokinase-positive recombinant strain of Streptococcus thermophilus. Appl Environ Microbiol. 2004;70: 4596–4603. doi:10.1128/AEM.70.8.4596-4603.2004
170. Afzal M, Shafeeq S, Kuipers OP. LacR is a repressor of lacABCD and LacT an activator of lacTFEG, constituting the lac-gene cluster in Streptococcus pneumoniae. Appl Environ Microbiol. 2014; doi:10.1128/AEM.01370-14
171. Grossiord B, Vaughan EE, Luesink E, de Vos WM. Genetics of galactose utilisation via the Leloir pathway in lactic acid bacteria. Le Lait. 1998;78: 77–84. doi:10.1051/lait:1998110
172. Sharma V, Ichikawa M, Freeze HH. Mannose metabolism: More than meets the eye. Biochem Biophys Res Commun. 2014; doi:10.1016/j.bbrc.2014.06.021
173. Homer KA, Roberts G, Byers HL, Tarelli E, Whiley RA, Philpott-Howard J, et al. Mannosidase production by viridans group Streptococci. J Clin Microbiol. 2001;39: 995–1001. doi:10.1128/JCM.39.3.995-1001.2001
174. Sasaki M, Teramoto H, Inui M, Yukawa H. Identification of mannose uptake and catabolism genes in Corynebacterium glutamicum and genetic engineering for simultaneous utilization of mannose and glucose. Appl Microbiol Biotechnol. 2011;89: 1905–1916. doi:10.1007/s00253-010-3002-8
175. Darzins A, Nixon LL, Vanags RI, Chakrabarty AM. Cloning of Escherichia coli and Pseudomonas aeruginosa phosphomannose isomerase genes and their expression in alginate-negative mutants of Pseudomonas aeruginosa. J Bacteriol. 1985;161: 249–257.
176. Stolz B, Huber M, Marković-Housley Z, Erni B. The mannose transporter of Escherichia coli. Structure and function of the IIABMan subunit. J Biol Chem. 1993;268: 27094–27099.
General introduction
63
177. Martin-Verstraete I, Michel V, Charbit A. The levanase operon of Bacillus subtilis expressed in Escherichia coli can substitute for the mannose permease in mannose uptake and bacteriophage lambda infection. J Bacteriol. 1996;178: 7112–7119.
178. Kornberg HL, Lambourne LTM. Role of the phosphoenolpyruvate-dependent fructose phosphotransferase system in the utilization of mannose by Escherichia coli. Proc Biol Sci. 1992;250: 51–55.
179. Pelletier G, Frenette M, Vadeboncoeur C. Transport of mannose by an inducible phosphoenolpyruvate:fructose phosphotransferase system in Streptococcus salivarius. Microbiol Read Engl. 1994;140 ( Pt 9): 2433–2438.
180. Sun T, Altenbuchner J. Characterization of a mannose utilization system in Bacillus subtilis. J Bacteriol. 2010;192: 2128–2139. doi:10.1128/JB.01673-09
181. Köplin R, Arnold W, Hötte B, Simon R, Wang G, Pühler A. Genetics of xanthan production in Xanthomonas campestris: the xanA and xanB genes are involved in UDP-glucose and GDP-mannose biosynthesis. J Bacteriol. 1992;174: 191–199.
182. Schmidt M, Arnold W, Niemann A, Kleickmann A, Pühler A. The Rhizobium meliloti pmi gene encodes a new type of phosphomannose isomerase. Gene. 1992;122: 35–43. doi:10.1016/0378-1119(92)90029-O
183. Arias A, Gardiol A, Martínez-Drets G. Transport and catabolism of D-mannose in Rhizobium meliloti. J Bacteriol. 1982;151: 1069–1072.
184. Rodionov DA, Yang C, Li X, Rodionova IA, Wang Y, Obraztsova AY, et al. Genomic encyclopedia of sugar utilization pathways in the Shewanella genus. BMC Genomics. 2010;11: 494. doi:10.1186/1471-2164-11-494
185. Berry AM, Lock RA, Paton JC. Cloning and characterization of nanB, a second Streptococcus pneumoniae neuraminidase gene, and purification of the NanB enzyme from recombinant Escherichia coli. J Bacteriol. 1996;178: 4854–4860.
186. Cámara M, Boulnois GJ, Andrew PW, Mitchell TJ. A neuraminidase from Streptococcus pneumoniae has the features of a surface protein. Infect Immun. 1994;62: 3688–3695.
187. Clarke VA, Platt N, Butters TD. Cloning and expression of the beta-N-acetylglucosaminidase gene from Streptococcus pneumoniae. Generation of truncated enzymes with modified aglycon specificity. J Biol Chem. 1995;270: 8805–8814.
188. Severi E, Hood DW, Thomas GH. Sialic acid utilization by bacterial pathogens. Microbiology. 2007;153: 2817–2822. doi:10.1099/mic.0.2007/009480-0
189. Pezzicoli A, Ruggiero P, Amerighi F, Telford JL, Soriani M. Exogenous sialic acid transport contributes to group B streptococcus infection of mucosal surfaces. J Infect Dis. 2012;206: 924–931. doi:10.1093/infdis/jis451
190. Konopka JB. N-acetylglucosamine (GlcNAc) functions in cell signaling. Scientifica. 2012. doi:10.6064/2012/489208
191. Moye ZD, Burne RA, Zeng L. Uptake and metabolism of N-acetylglucosamine and glucosamine by Streptococcus mutans. Appl Env Microbiol. 2014; doi:10.1128/AEM.00820-14
192. Boulanger A, Dejean G, Lautier M, Glories M, Zischek C, Arlat M, et al. Identification and regulation of the N-acetylglucosamine utilization pathway of the plant pathogenic bacterium Xanthomonas campestris pv. campestris. J Bacteriol. 2010;192: 1487–1497. doi:10.1128/JB.01418-09
Chapter 1
64
193. Takahashi Y, Ruhl S, Yoon J-W, Sandberg AL, Cisar JO. Adhesion of viridans group streptococci to sialic acid-, galactose- and N-acetylgalactosamine-containing receptors. Oral Microbiol Immunol. 2002;17: 257–262.
194. Bidart GN, Rodríguez-Díaz J, Monedero V, Yebra MJ. A unique gene cluster for the utilization of the mucosal and human milk-associated glycans galacto- N -biose and lacto- N -biose in L actobacillus casei: Galacto- and lacto- N -biose utilization in Lactobacillus. Mol Microbiol. 2014;93: 521–538. doi:10.1111/mmi.12678
195. Trappetti C, Kadioglu A, Carter M, Hayre J, Iannelli F, Pozzi G, et al. Sialic acid: a preventable signal for pneumococcal biofilm formation, colonization, and invasion of the host. J Infect Dis. 2009;199: 1497–1505. doi:10.1086/598483
196. Parker D, Soong G, Planet P, Brower J, Ratner AJ, Prince A. The NanA neuraminidase of Streptococcus pneumoniae is involved in biofilm formation. Infect Immun. 2009;77: 3722–3730. doi:10.1128/IAI.00228-09
197. Chang D-E, Smalley DJ, Tucker DL, Leatham MP, Norris WE, Stevenson SJ, et al. Carbon nutrition of Escherichia coli in the mouse intestine. Proc Natl Acad Sci U S A. 2004;101: 7427–7432. doi:10.1073/pnas.0307888101
198. Rigali S, Nothaft H, Noens EEE, Schlicht M, Colson S, Müller M, et al. The sugar phosphotransferase system of Streptomyces coelicolor is regulated by the GntR-family regulator DasR and links N-acetylglucosamine metabolism to the control of development. Mol Microbiol. 2006;61: 1237–1251. doi:10.1111/j.1365-2958.2006.05319.x
199. Rigali S, Titgemeyer F, Barends S, Mulder S, Thomae AW, Hopwood DA, et al. Feast or famine: the global regulator DasR links nutrient stress to antibiotic production by Streptomyces. EMBO Rep. 2008;9: 670–675. doi:10.1038/embor.2008.83
200. Swiatek MA, Tenconi E, Rigali S, van Wezel GP. Functional analysis of the N-acetylglucosamine metabolic genes of Streptomyces coelicolor and role in control of development and antibiotic production. J Bacteriol. 2012;194: 1136–1144. doi:10.1128/JB.06370-11
201. Barthelson R, Mobasseri A, Zopf D, Simon P. Adherence of Streptococcus pneumoniae to respiratory epithelial cells is inhibited by sialylated oligosaccharides. Infect Immun. 1998;66: 1439–1444.
202. Andersson B, Beachey EH, Tomasz A, Tuomanen E, Svanborg-Edén C. A sandwich adhesion on Streptococcus pneumoniae attaching to human oropharyngeal epithelial cells in vitro. Microb Pathog. 1988;4: 267–278.
203. Cundell DR, Tuomanen EI. Receptor specificity of adherence of Streptococcus pneumoniae to human type-II pneumocytes and vascular endothelial cells in vitro. Microb Pathog. 1994;17: 361–374. doi:10.1006/mpat.1994.1082
204. Krivan HC, Roberts DD, Ginsburg V. Many pulmonary pathogenic bacteria bind specifically to the carbohydrate sequence GalNAc beta 1-4Gal found in some glycolipids. Proc Natl Acad Sci U S A. 1988;85: 6157–6161.
205. Almagro-Moreno S, Boyd EF. Insights into the evolution of sialic acid catabolism among bacteria. BMC Evol Biol. 2009;9: 118. doi:10.1186/1471-2148-9-118
206. Vimr ER, Kalivoda KA, Deszo EL, Steenbergen SM. Diversity of microbial sialic acid metabolism. Microbiol Mol Biol Rev. 2004;68: 132–153. doi:10.1128/MMBR.68.1.132-153.2004
207. King SJ, Hippe KR, Gould JM, Bae D, Peterson S, Cline RT, et al. Phase variable desialylation of host proteins that bind to Streptococcus pneumoniae in vivo and
General introduction
65
protect the airway: Pneumococcal desialylation of host proteins. Mol Microbiol. 2004;54: 159–171. doi:10.1111/j.1365-2958.2004.04252.x
208. Gualdi L, Hayre J, Gerlini A, Bidossi A, Colomba L, Trappetti C, et al. Regulation of neuraminidase expression in Streptococcus pneumoniae. BMC Microbiol. 2012;12: 200. doi:10.1186/1471-2180-12-200
209. Pettigrew MM, Fennie KP, York MP, Daniels J, Ghaffar F. Variation in the presence of neuraminidase genes among Streptococcus pneumoniae isolates with identical sequence types. Infect Immun. 2006;74: 3360–3365. doi:10.1128/IAI.01442-05
210. Vimr ER, Troy FA. Identification of an inducible catabolic system for sialic acids (nan) in Escherichia coli. J Bacteriol. 1985;164: 845–853.
211. Steenbergen SM, Lichtensteiger CA, Caughlan R, Garfinkle J, Fuller TE, Vimr ER. Sialic acid metabolism and systemic pasteurellosis. Infect Immun. 2005;73: 1284–1294. doi:10.1128/IAI.73.3.1284-1294.2005
212. Allen S, Zaleski A, Johnston JW, Gibson BW, Apicella MA. Novel sialic acid transporter of Haemophilus influenzae. Infect Immun. 2005;73: 5291–5300. doi:10.1128/IAI.73.9.5291-5300.2005
213. Severi E, Randle G, Kivlin P, Whitfield K, Young R, Moxon R, et al. Sialic acid transport in Haemophilus influenzae is essential for lipopolysaccharide sialylation and serum resistance and is dependent on a novel tripartite ATP-independent periplasmic transporter. Mol Microbiol. 2005;58: 1173–1185. doi:10.1111/j.1365-2958.2005.04901.x
214. Post DMB, Mungur R, Gibson BW, Munson RS. Identification of a novel sialic acid transporter in Haemophilus ducreyi. Infect Immun. 2005;73: 6727–6735. doi:10.1128/IAI.73.10.6727-6735.2005
215. Severi E, Hosie AHF, Hawkhead JA, Thomas GH. Characterization of a novel sialic acid transporter of the sodium solute symporter (SSS) family and in vivo comparison with known bacterial sialic acid transporters: An SSS transporter for sialic acid from Salmonella. FEMS Microbiol Lett. 2010;304: 47–54. doi:10.1111/j.1574-6968.2009.01881.x
216. Byers HL, Homer KA, Beighton D. Utilization of sialic acid by viridans streptococci. J Dent Res. 1996;75: 1564–1571. doi:10.1177/00220345960750080701
217. Brigham CJ, Malamy MH. Characterization of the RokA and HexA broad-substrate-specificity hexokinases from Bacteroides fragilis and their role in hexose and N-acetylglucosamine utilization. J Bacteriol. 2005;187: 890–901. doi:10.1128/JB.187.3.890-901.2005
218. Brigham C, Caughlan R, Gallegos R, Dallas MB, Godoy VG, Malamy MH. Sialic acid (N-acetyl neuraminic acid) utilization by Bacteroides fragilis requires a novel N-acetyl mannosamine epimerase. J Bacteriol. 2009;191: 3629–3638. doi:10.1128/JB.00811-08
219. Roy S, Douglas CWI, Stafford GP. A novel sialic acid utilization and uptake system in the periodontal pathogen Tannerella forsythia. J Bacteriol. 2010;192: 2285–2293. doi:10.1128/JB.00079-10
220. Rogers MJ, Ohgi T, Plumbridge J, Söll D. Nucleotide sequences of the Escherichia coli nagE and nagB genes: the structural genes for the N-acetylglucosamine transport protein of the bacterial phosphoenolpyruvate: sugar phosphotransferase system and for glucosamine-6-phosphate deaminase. Gene. 1988;62: 197–207.
Chapter 1
66
221. Alvarez-Añorve LI, Calcagno ML, Plumbridge J. Why does Escherichia coli grow more slowly on glucosamine than on N-acetylglucosamine? Effects of enzyme levels and allosteric activation of GlcN6P deaminase (NagB) on growth rates. J Bacteriol. 2005;187: 2974–2982. doi:10.1128/JB.187.9.2974-2982.2005
222. Gaugué I, Oberto J, Putzer H, Plumbridge J. The use of amino sugars by Bacillus subtilis: presence of a unique operon for the catabolism of glucosamine. Uversky VN, editor. PLoS ONE. 2013;8: e63025. doi:10.1371/journal.pone.0063025
223. Xiao X, Wang F, Saito A, Majka J, Schlösser A, Schrempf H. The novel Streptomyces olivaceoviridis ABC transporter Ngc mediates uptake of N-acetylglucosamine and N,N’-diacetylchitobiose. Mol Genet Genomics. 2002;267: 429–439. doi:10.1007/s00438-002-0640-2
224. Yang C, Rodionov DA, Li X, Laikova ON, Gelfand MS, Zagnitko OP, et al. Comparative genomics and experimental characterization of N-acetylglucosamine utilization pathway of Shewanella oneidensis. J Biol Chem. 2006;281: 29872–29885. doi:10.1074/jbc.M605052200
225. Reizer J, Ramseier TM, Reizer A, Charbit A, Saier MH Jr. Novel phosphotransferase genes revealed by bacterial genome sequencing: a gene cluster encoding a putative N-acetylgalactosamine metabolic pathway in Escherichia coli. Microbiol Read Engl. 1996;142 ( Pt 2): 231–250.
226. Brinkkötter A, Klöss H, Alpert C, Lengeler JW. Pathways for the utilization of N-acetyl-galactosamine and galactosamine in Escherichia coli. Mol Microbiol. 2000;37: 125–135.
227. Hu Z, Patel IR, Mukherjee A. Genetic analysis of the roles of agaA, agaI, and agaS genes in the N-acetyl-D-galactosamine and D-galactosamine catabolic pathways in Escherichia coli strains O157:H7 and C. BMC Microbiol. 2013;13: 94. doi:10.1186/1471-2180-13-94
228. Ezquerro-Sáenz C, Ferrero MA, Revilla-Nuin B, López Velasco FF, Martínez-Blanco H, Rodríguez-Aparicio LB. Transport of N-acetyl-D-galactosamine in Escherichia coli K92: effect on acetyl-amino sugar metabolism and polysialic acid production. Biochimie. 2006;88: 95–102. doi:10.1016/j.biochi.2005.06.011
229. Brinkkötter A, Shakeri-Garakani A, Lengeler JW. Two class II D-tagatose-bisphosphate aldolases from enteric bacteria. Arch Microbiol. 2002;177: 410–419. doi:10.1007/s00203-002-0406-6
230. Leyn SA, Gao F, Yang C, Rodionov DA. N-Acetylgalactosamine utilization pathway and regulon in proteobacteria: genomic reconstruction and experimental characterization in Shewanella. J Biol Chem. 2012;287: 28047–28056. doi:10.1074/jbc.M112.382333
231. Becker DJ, Lowe JB. Fucose: biosynthesis and biological function in mammals. Glycobiology. 2003;13: 41R–53R. doi:10.1093/glycob/cwg054
232. Hugdahl MB, Beery JT, Doyle MP. Chemotactic behavior of Campylobacter jejuni. Infect Immun. 1988;56: 1560–1566.
233. Higgins MA, Abbott DW, Boulanger MJ, Boraston AB. Blood group antigen recognition by a solute-binding protein from a serotype 3 strain of Streptococcus pneumoniae. J Mol Biol. 2009;388: 299–309. doi:10.1016/j.jmb.2009.03.012
234. Higgins MA, Suits MD, Marsters C, Boraston AB. Structural and functional analysis of fucose-processing enzymes from Streptococcus pneumoniae. J Mol Biol. 2014;426: 1469–1482. doi:10.1016/j.jmb.2013.12.006
General introduction
67
235. Scott KP, Martin JC, Campbell G, Mayer C-D, Flint HJ. Whole-genome transcription profiling reveals genes up-regulated by growth on fucose in the human gut bacterium “Roseburia inulinivorans.” J Bacteriol. 2006;188: 4340–4349. doi:10.1128/JB.00137-06
236. Yu Z-T, Chen C, Newburg DS. Utilization of major fucosylated and sialylated human milk oligosaccharides by isolated human gut microbes. Glycobiology. 2013;23: 1281–1292. doi:10.1093/glycob/cwt065
237. Coyne MJ, Reinap B, Lee MM, Comstock LE. Human symbionts use a host-like pathway for surface fucosylation. Science. 2005;307: 1778–1781. doi:10.1126/science.1106469
238. Hooper LV, Xu J, Falk PG, Midtvedt T, Gordon JI. A molecular sensor that allows a gut commensal to control its nutrient foundation in a competitive ecosystem. Proc Natl Acad Sci U S A. 1999;96: 9833–9838.
239. Badía J, Ros J, Aguilar J. Fermentation mechanism of fucose and rhamnose in Salmonella typhimurium and Klebsiella pneumoniae. J Bacteriol. 1985;161: 435–437.
240. Baldomà L, Aguilar J. Metabolism of L-fucose and L-rhamnose in Escherichia coli: aerobic-anaerobic regulation of L-lactaldehyde dissimilation. J Bacteriol. 1988;170: 416–421.
241. Embry A, Hinojosa E, Orihuela CJ. Regions of Diversity 8, 9 and 13 contribute to Streptococcus pneumoniae virulence. BMC Microbiol. 2007;7: 80. doi:10.1186/1471-2180-7-80
242. Higgins MA, Whitworth GE, El Warry N, Randriantsoa M, Samain E, Burke RD, et al. Differential recognition and hydrolysis of host carbohydrate antigens by Streptococcus pneumoniae family 98 glycoside hydrolases. J Biol Chem. 2009;284: 26161–26173. doi:10.1074/jbc.M109.024067
243. Pacheco AR, Curtis MM, Ritchie JM, Munera D, Waldor MK, Moreira CG, et al. Fucose sensing regulates bacterial intestinal colonization. Nature. 2012;492: 113–117. doi:10.1038/nature11623
244. Hooper LV, Gordon JI. Glycans as legislators of host-microbial interactions: spanning the spectrum from symbiosis to pathogenicity. Glycobiology. 2001;11: 1R–10R. doi:10.1093/glycob/11.2.1R
245. Ilver D, Arnqvist A, Ogren J, Frick IM, Kersulyte D, Incecik ET, et al. Helicobacter pylori adhesin binding fucosylated histo-blood group antigens revealed by retagging. Science. 1998;279: 373–377.
246. Cinco M, Banfi E, Ruaro E, Crevatin D, Crotti D. Evidence for l-fucose (6-deoxy-l-galactopyranose)-mediated adherence of Campylobacter spp. to epithelial cells. FEMS Microbiol Lett. 1984;21: 347–351.
247. Liu T-W, Ho C-W, Huang H-H, Chang S-M, Popat SD, Wang Y-T, et al. Role for alpha-L-fucosidase in the control of Helicobacter pylori-infected gastric cancer cells. Proc Natl Acad Sci U S A. 2009;106: 14581–14586. doi:10.1073/pnas.0903286106
248. Higgins MA, Boraston AB. Structure of the fucose mutarotase from Streptococcus pneumoniae in complex with L-fucose. Acta Crystallograph Sect F Struct Biol Cryst Commun. 2011;67: 1524–1530. doi:10.1107/S1744309111046343
249. Chen YM, Zhu Y, Lin EC. The organization of the fuc regulon specifying L-fucose dissimilation in Escherichia coli K12 as determined by gene cloning. Mol Gen Genet MGG. 1987;210: 331–337.
Chapter 1
68
250. Chen YM, Zhu Y, Lin EC. NAD-linked aldehyde dehydrogenase for aerobic utilization of L-fucose and L-rhamnose by Escherichia coli. J Bacteriol. 1987;169: 3289–3294.
251. Lu Z, Lin EC. The nucleotide sequence of Escherichia coli genes for L-fucose dissimilation. Nucleic Acids Res. 1989;17: 4883–4884.
252. Sugihara J, Sun L, Yan N, Kaback HR. Dynamics of the L-fucose/H+ symporter revealed by fluorescence spectroscopy. Proc Natl Acad Sci. 2012;109: 14847–14851. doi:10.1073/pnas.1213445109
253. Muraoka WT, Zhang Q. Phenotypic and genotypic evidence for L-Fucose utilization by Campylobacter jejuni. J Bacteriol. 2011;193: 1065–1075. doi:10.1128/JB.01252-10
254. Stahl M, Friis LM, Nothaft H, Liu X, Li J, Szymanski CM, et al. L-Fucose utilization provides Campylobacter jejuni with a competitive advantage. Proc Natl Acad Sci. 2011;108: 7194–7199. doi:10.1073/pnas.1014125108
255. Hofreuter D. Defining the metabolic requirements for the growth and colonization capacity of Campylobacter jejuni. Front Cell Infect Microbiol. 2014;4. doi:10.3389/fcimb.2014.00137
256. Yew WS, Fedorov AA, Fedorov EV, Rakus JF, Pierce RW, Almo SC, et al. Evolution of enzymatic activities in the enolase superfamily: L-fuconate dehydratase from Xanthomonas campestris. Biochemistry (Mosc). 2006;45: 14582–14597. doi:10.1021/bi061687o
257. Petit E, LaTouf WG, Coppi MV, Warnick TA, Currie D, Romashko I, et al. Involvement of a bacterial microcompartment in the metabolism of fucose and rhamnose by Clostridium phytofermentans. de Crécy-Lagard V, editor. PLoS ONE. 2013;8: e54337. doi:10.1371/journal.pone.0054337
258. Havemann GD, Bobik TA. Protein content of polyhedral organelles involved in coenzyme B12-dependent degradation of 1,2-propanediol in Salmonella enterica serovar Typhimurium LT2. J Bacteriol. 2003;185: 5086–5095. doi:10.1128/JB.185.17.5086-5095.2003
259. Bobik TA, Xu Y, Jeter RM, Otto KE, Roth JR. Propanediol utilization genes (pdu) of Salmonella typhimurium: three genes for the propanediol dehydratase. J Bacteriol. 1997;179: 6633–6639.
260. Chen YM, Lu Z, Lin EC. Constitutive activation of the fucAO operon and silencing of the divergently transcribed fucPIK operon by an IS5 element in Escherichia coli mutants selected for growth on L-1,2-propanediol. J Bacteriol. 1989;171: 6097–6105.
261. Schwab C, Gänzle M. Lactic acid bacteria fermentation of human milk oligosaccharide components, human milk oligosaccharides and galactooligosaccharides: LAB fermentation of HMOs and GOSs. FEMS Microbiol Lett. 2011;315: 141–148. doi:10.1111/j.1574-6968.2010.02185.x
262. Rodriguez-Diaz J, Rubio-del-Campo A, Yebra MJ. Lactobacillus casei ferments the N-acetylglucosamine moiety of fucosyl-alpha -1,3-N-acetylglucosamine and excretes L-Fucose. Appl Environ Microbiol. 2012;78: 4613–4619. doi:10.1128/AEM.00474-12
263. Castro R, Neves AR, Fonseca LL, Pool WA, Kok J, Kuipers OP, et al. Characterization of the individual glucose uptake systems of Lactococcus lactis : mannose-PTS, cellobiose-PTS and the novel GlcU permease. Mol Microbiol. 2009;71: 795–806. doi:10.1111/j.1365-2958.2008.06564.x
General introduction
69
264. Gosset G. Improvement of Escherichia coli production strains by modification of the phosphoenolpyruvate:sugar phosphotransferase system. Microb Cell Factories. 2005;4: 14. doi:10.1186/1475-2859-4-14
265. Paulsen IT, Chauvaux S, Choi P, Saier MH. Characterization of glucose-specific catabolite repression-resistant mutants of Bacillus subtilis: identification of a novel hexose:H+ symporter. J Bacteriol. 1998;180: 498–504.
266. Neves AR, Ramos A, Shearman C, Gasson MJ, Almeida JS, Santos H. Metabolic characterization of Lactococcus lactis deficient in lactate dehydrogenase using in vivo 13C-NMR. Eur J Biochem FEBS. 2000;267: 3859–3868.
267. Gaspar P, Neves AR, Shearman CA, Gasson MJ, Baptista AM, Turner DL, et al. The lactate dehydrogenases encoded by the ldh and ldhB genes in Lactococcus lactis exhibit distinct regulation and catalytic properties − comparative modeling to probe the molecular basis: Lactacte dehydrogenases of Lactococcus lactis. FEBS J. 2007;274: 5924–5936. doi:10.1111/j.1742-4658.2007.06115.x
268. Gaspar P, Neves AR, Gasson MJ, Shearman CA, Santos H. High yields of 2,3-butanediol and mannitol in Lactococcus lactis through engineering of NAD+ cofactor recycling. Appl Environ Microbiol. 2011;77: 6826–6835. doi:10.1128/AEM.05544-11
269. C. Garrigues, P. Loubiere, N. D. Lindley, M. Cocaign-Bousquet. Control of the shift from homolactic acid to mixed-acid fermentation in Lactococcus lactis: predominant role of the NADH/NAD+ ratio. J Bacteriol. 1997;179: 5282–5287.
270. Melchiorsen CR, Jokumsen KV, Villadsen J, Israelsen H, Arnau J. The level of pyruvate-formate lyase controls the shift from homolactic to mixed-acid product formation in Lactococcus lactis. Appl Microbiol Biotechnol. 2002;58: 338–344. doi:10.1007/s00253-001-0892-5
271. Neves AR, Ventura R, Mansour N, Shearman C, Gasson MJ, Maycock C et al. Is the glycolytic flux in Lactococcus lactis primarily controlled by the redox charge? Kinetics of NAD+ and NADH pools determined in vivo by 13C NMR. J Biol Chem. 2002;277: 28088–28098. doi:10.1074/jbc.M202573200
272. Thomas TD, Ellwood DC, Longyear VM. Change from homo- to heterolactic fermentation by Streptococcus lactis resulting from glucose limitation in anaerobic chemostat cultures. J Bacteriol. 1979;138: 109–117.
273. Lanie JA, Ng W-L, Kazmierczak KM, Andrzejewski TM, Davidsen TM, Wayne KJ, et al. Genome sequence of Avery’s virulent serotype 2 strain D39 of Streptococcus pneumoniae and comparison with that of unencapsulated laboratory strain R6. J Bacteriol. 2007;189: 38–51. doi:10.1128/JB.01148-06
274. Ramos-Montañez S, Kazmierczak KM, Hentchel KL, Winkler ME. Instability of ackA (acetate kinase) mutations and their effects on acetyl phosphate and ATP amounts in Streptococcus pneumoniae D39. J Bacteriol. 2010;192: 6390–6400. doi:10.1128/JB.00995-10

71
Chapter 2
Host glycan sugar-specific pathways in
Streptococcus pneumoniae: galactose as a
key sugar in colonisation and infection
The results of this chapter are published in:
Paixão, L, Oliveira, J, Veríssimo, A, Vinga, S, Lourenço, EC, Ventura,
MR, Kjos, M, Veening, J-W, Fernandes, VE, Andrew, PW, Yesilkaya,
H and Neves, AR (2015). Host glycan sugar-specific pathways in
Streptococcus pneumoniae: galactose as a key sugar in colonisation
and infection. Plos One. 2015. In press.
Chapter 2 - Host glycan sugar-specific pathways in
Streptococcus pneumoniae

Host glycan sugar-specific pathways in S. pneumoniae
73
Chapter 2 – Contents
Abstract .................................................................................................. 75
Introduction ............................................................................................ 75
Materials and Methods ........................................................................... 78
Bacterial strains and growth conditions .............................................. 78
Statistical analysis of the growth parameters ..................................... 79
Multiple non-linear regression method for generating confidence interval bands ..................................................................................... 80
General molecular techniques ............................................................ 80
Construction of loss-of-function mutants ............................................ 81
Construction of the pKB01 derivatives for complementation studies . 82
Complementation of deletion strains .................................................. 83
Growth of complemented strains ........................................................ 83
Transcriptome analysis ...................................................................... 83
Microarray experiments ...................................................................... 84
Analysis of microarrays ...................................................................... 84
Quantitative RT-PCR .......................................................................... 85
In silico analysis for catabolic pathway prediction .............................. 85
Growth assay for assessment of sugar utilization by S. pneumoniae D39 ..................................................................................................... 86
Quantification of sugar consumption and fermentation products ....... 86
Cold ethanol extractions and determination of intracellular metabolites by 31P-NMR ........................................................................................ 87
Enzyme activity determination ............................................................ 88
In vivo analysis of pneumococcal strains ........................................... 90
Chemicals ........................................................................................... 92
Ethical disclaimer ............................................................................... 92
Results ................................................................................................... 93
Genomic potential for the utilization of host monosaccharides .......... 93
Chapter 2
74
The ability of host glycan-derived sugars to support growth is sugar dependent .......................................................................................... 95
Mucin induces expression of genes involved in utilization of Gal, GlcNAc and Man ................................................................................ 96
Growth properties on Gal, GlcNAc and Man or on a mixture thereof 99
Growth profiles on Gal, Man and GlcNAc. ..................................... 99
Fermentation products. ................................................................ 105
Growth profiles, substrate consumption and end-products of fermentation in a mixture of Gal, GlcNAc and Man. ..................... 107
Catabolic pathways for the utilization of Gal, GlcNAc and Man as assessed using biochemical and molecular tools ............................ 108
Intracellular metabolites during growth on glycan-derived sugars. ..................................................................................................... 109
Enzymatic activities of key enzymes involved in the catabolism of glycan-derived sugars. ................................................................. 111
Genetic confirmation of pathway functionality. ............................. 113
Attenuated virulence in the absence of a functional Gal pathway ... 115
Discussion and Conclusions ............................................................... 119
Mannose .......................................................................................... 122
N-acetylglucosamine ....................................................................... 122
Galactose ......................................................................................... 123
Acknowledgments ............................................................................... 128
Author’s contribution ............................................................................ 129
References .......................................................................................... 130
Supporting Information ........................................................................ 137
Host glycan sugar-specific pathways in S. pneumoniae
75
Abstract
The human pathogen Streptococcus pneumoniae is a strictly
fermentative organism that relies on glycolytic metabolism to obtain
energy. In the human nasopharynx S. pneumoniae encounters
glycoconjugates composed of a variety of monosaccharides, which can
potentially be used as nutrients once depolymerized by glycosidases.
Therefore, it is reasonable to hypothesise that the pneumococcus would
rely on these glycan-derived sugars to grow. Here, we identified the sugar-
specific catabolic pathways used by S. pneumoniae during growth on
mucin. Transcriptome analysis of cells grown on mucin showed specific
upregulation of genes likely to be involved in deglycosylation, transport
and catabolism of galactose, mannose and N-acetylglucosamine. In
contrast to growth on mannose and N-acetylglucosamine, S. pneumoniae
grown on galactose re-route their metabolic pathway from homolactic
fermentation to a truly mixed acid fermentation regime. By measuring
intracellular metabolites, enzymatic activities and mutant analysis, we
provide an accurate map of the biochemical pathways for galactose,
mannose and N-acetylglucosamine catabolism in S. pneumoniae.
Intranasal mouse infection models of pneumococcal colonisation and
disease showed that only mutants in galactose catabolic genes were
attenuated. Our data pinpoint galactose as a key nutrient for growth in the
respiratory tract and highlights the importance of central carbon
metabolism for pneumococcal pathogenesis.
Introduction
Streptococcus pneumoniae is an important human pathogen
responsible for high morbidity and mortality worldwide, mainly due to

Chapter 2
76
community-acquired pneumonia, meningitis, bacteraemia and otitis
media [1,2]. The pneumococcus is, however, also a transient commensal
that asymptomatically resides and proliferates in the human nasopharynx
[3]. Colonisation of the nasopharynx is of importance as it represents a
reservoir from which bacteria can disseminate throughout the community
[2,4]. Furthermore, the establishment of a carrier state is accepted to be
a pre-requisite for disease [3,5]. Despite the significance of colonisation
to the lifestyle of S. pneumoniae, little is known about the mechanisms
employed by the bacterium to grow and proliferate in the human
nasopharynx.
S. pneumoniae is a strictly fermentative bacterium that relies on
glycolytic metabolism to obtain energy [6]. Therefore, the ability to acquire
and metabolize sugars is of major importance for in vivo fitness of this
microorganism. Indeed, the pneumococcus lacks a complete set of genes
for respiratory proteins and is for this reason unable to generate energy
by respiration [6,7]. The genomic abundance of genes involved in sugar
transport further supports the significant role of carbohydrates in the
lifestyle of S. pneumoniae [6,7]. Over 30% of the transporters in the S.
pneumoniae genome were predicted to be involved in the uptake of
carbohydrates [7], and these predictions were validated by a recent
functional genomic approach targeting carbohydrate transport [8].
Furthermore, several putative carbohydrate degradation pathways have
been annotated in the genome sequences of S. pneumoniae [6,7]. In
summary, S. pneumoniae potentially harbours an incredible flexibility with
respect to sugar consumption. Hexoses, and in particular glucose (Glc),
are the preferred carbon and energy sources of S. pneumoniae [9].
However, in the human airway the abundance of free sugars is scarce,
the concentration of Glc being below 1 mM [10,11]. In this case, in vivo
growth must rely on alternative nutritional reservoirs. In the human
nasopharynx, the glycoproteins lining the epithelial surfaces appear as

Host glycan sugar-specific pathways in S. pneumoniae
77
good candidates to serve as carbon and energy sources for
pneumococcal growth. Importantly, S. pneumoniae is able to grow on
mucin as a sole carbon source [12]. Mucins are major components of the
mucus that cover the epithelial surfaces [13]. These structures are heavily
O-glycosylated glycoproteins and despite their composition variability,
mucins are generally composed of N-acetylglucosamine (GlcNAc), N-
acetylgalactosamine (GalNAc), N-acetylneuraminic acid (NeuNAc),
galactose (Gal), fucose (Fuc) and sulphated sugars linked to the protein
core, most commonly via a N-acetylgalactosamine moiety [13,14].
Furthermore, S. pneumoniae can use other host glycans, such as N-
glycans and glycosaminoglycans [15,16]. In fact, the pneumococcus is
equipped with a high number of extracellular glycosidases covering a wide
range of substrates specificities (reviewed in [17]). The action of these
enzymes on host glycans generates a variety of free sugars that
potentially can be used by the pneumococcus. The deglycosylation
activity of both exo- and endoglycosidades has been previously
demonstrated in S. pneumoniae [15,18–20]. Furthermore, the role of
these enzymes in in vivo fitness is substantiated by the observations that
glycosidase mutants show attenuated ability to colonise and to cause
disease in mouse models [14,19–23].
In this study, we set out to identify the putative catabolic pathways
important for growth on mucin. To this end, we used the well-established
laboratorial model for pneumococcal studies S. pneumoniae D39 [24].
Subsequently, the predicted utilization routes of the glycan-derived sugars
Gal, GlcNAc and Man were functionally established, by positive detection
of phosphorylated metabolic intermediates and measurement of specific
enzyme activities. Inactivation of a unique gene in each catabolic pathway
rendered mutant strains unable or with impaired ability to grow in the
presence of the corresponding sugar. Finally, the contribution of the
sugar-specific catabolic pathways to colonisation and pneumococcal
Chapter 2
78
disease was assessed in appropriate mouse models, demonstrating that
mutants in Gal catabolic pathways were attenuated in their ability to
colonise and had reduced virulence in respiratory infection models.
Overall, we experimentally validated the catabolic pathways of glycan-
derived Gal, Man and GlcNAc and found Gal as a key nutrient during
pneumococcal in vivo growth.
Materials and Methods
Bacterial strains and growth conditions
Streptococcus pneumoniae strain D39 (serotype 2) and its derivatives
are listed in Table S2.1. The D39 isolate was obtained from the culture
collection of the Department of Infection, Immunity and Inflammation, of
the University of Leicester. Stocks and working stocks were prepared as
described elsewhere [25] and stored in 25% (vol/vol) glycerol M17
medium (Difco) at -80°C.
Routinely, S. pneumoniae was grown statically in M17 broth containing
0.5% (wt/vol) glucose (Glc-M17) at 37C. For physiological studies,
bacteria were grown in static rubber-stoppered bottles (80 ml in 100 ml
bottles) at 37ºC and without pH control (initial pH 6.5) in the chemically
defined medium (CDM) described by Carvalho et al. [25]. For each sugar
tested (Gal, GlcNAc, Man and Glc), growth was analysed under sugar
excess (34±2 mM) and a lower concentration (13±1 mM). In sugar
mixtures each carbohydrate (Gal, Man and GlcNAc) was added to an
initial concentration of circa 6.5 mM. Cultures were started by inoculating
fresh CDM, to an initial optical density at 600 nm (OD600) of ~0.05, with a
pre-culture grown until late-exponential phase of growth. Pre-cultures
were performed as described previously [25]. Pre-cultures for growth on
Host glycan sugar-specific pathways in S. pneumoniae
79
sugar mixtures were grown in CDM containing 30 mM of each carbon
source. Growth was monitored by measuring OD600 hourly. Maximum
specific growth rates (μmax) were calculated through linear regressions of
the plots of ln(OD600) versus time during the exponential phase of growth.
The values reported are averages of at least eight independent growths.
Representative growth curves were selected based on the minimum value
of the sum:
22
max maxmax max
max maxOD
OD OD
SD SD
Where, maxOD and max are the averages of the maximum optical density
(ODmax) and μmax, respectively; maxODSD and maxSD are the standard
deviation of ODmax and μmax, respectively.
Statistical analysis of the growth parameters
ANOVA was applied to test the hypothesis that max values are
independent of the sugar. Additionally, the differences across the two
initial substrate conditions were also compared. The same ANOVA
procedure was taken to assess if differences of ODmax values depended
on the sugar and initial condition and assess if they were statistically
significant.
The null hypothesis of equal values for the µmax was tested for all possible
pairwise combinations of initial conditions and sugars. This was
accomplished by independent two-sample t-tests, whose results are
summarized on Table S2.2. Likewise, similar tests were also performed
for the ODmax. Results are presented in Table S2.2.
Chapter 2
80
Multiple non-linear regression method for generating
confidence interval bands
Multiple non-linear regressions were performed for all the combinations
of experimental conditions (4 sugars and 2 initial concentrations) using
the Gompertz model [26]:
maxmax
exp(1)( ; , , ) exp exp 1f t A A t
A
,
where μ is the tangent in the inflection point (maximum growth rate),
is the x-axis intercept of this tangent (lag) and A is the asymptote
0
logy
Ay
. To obtain better fittings, the data were previously log-
transformed as 0
logy
yy
and the parameters estimated directly with
the BGFit web-application [27] using non-linear least squares.
After obtaining the estimates for each sugar and initial concentration
condition, a 95% confidence interval for the data and bands for the
predicted responses of the model were computed. These computations
were performed in MATLAB and Statistics Toolbox R2013a using the
function nlpredci.
General molecular techniques
Chromosomal DNA isolation was performed according to the
procedure described by Johansen and Kibenich [28]. Pwo polymerase
was used according to the supplier’s instructions (Roche). PCRs were
performed with a MyCycler thermal cycler (Bio-Rad). Purification of the
PCR fragments was accomplished using the High Pure PCR product
Purification Kit (Roche) according to the supplier’s instructions. Plasmid
isolation was done using a High Pure Plasmid Isolation Kit (Roche),
Host glycan sugar-specific pathways in S. pneumoniae
81
according to the manufacturer’s protocol. Restriction enzymes were
purchased from New England Biolabs.
Construction of loss-of-function mutants
Chromosomal DNA of S. pneumoniae D39 was used as template in
the PCR amplifications. Oligonucleotide primers used for these constructs
are listed in Table S2.3. galK (SPD_1634), lacD (SPD_1050), manA
(SPD_0641), nagA (SPD_1866) and galT-2 (SPD_1633) disruption was
accomplished by allelic replacement mutagenesis, essentially as
described by Song et al. [29]. The upstream and downstream flanking
regions of the genes to be disrupted were amplified using the appropriate
primers’ combinations KO1_Fw/KO2_Rv_Spe and
KO3_Fw_Spe/KO4_Rv, respectively (Table S2.3). Flanking fragments
were fused to the spectinomycin resistance marker (Spe) (1032 bp,
amplified with primers Spe_Fp and Spe_Rp from pORI38), by overlap
extension PCR using the appropriate primers KO1_Fw and KO4_Rv. The
resulting fused fragments were purified and transformed into D39 as
described before [30]. Positive transformants were selected on Glc-M17
sheep blood (1% vol/vol) agar plates supplemented with 150 µg ml-1 of
spectinomycin. The correct integration of the insert in the mutant clones
was confirmed by PCR. Genomic DNA was used as template for PCR
with primers designed to anneal around 100 bp upstream and
downstream of the recombination site, as well as combinations of these
primers with those used to construct the mutants (Table S2.3).
A double mutant, D39∆lacD∆galK, was constructed by allelic replacement
of the galK gene in the D39∆lacD mutant using trimethoprim (Tmp)
selection. The up and downstream flanking regions of the galK gene were
amplified using the appropriate primer combinations:
GalK_KO1_Fw/GalK_KO2_Rv_Tmp and
GalK_KO3_Fw_Tmp/GalK_KO4_Rv, respectively (Table S2.3). The
Chapter 2
82
regions flanking galK were fused to the Tmp cassette in an overlap
extension PCR reaction with the primer combination
GalK_KO1_Fw/GalK_KO4_Rv, yielding ∆galK::tmp. The purified fused
fragment was transformed into D39∆lacD and positive clones were
selected on Glc-M17 sheep blood (1% vol/vol) agar plates supplemented
with 18 µg ml-1 of trimethoprim. Gene replacement was confirmed as
described above, using the primers listed in Table S2.3.
Construction of the pKB01 derivatives for complementation
studies
pKB01, containing a zinc-inducible PczcD promoter (PZn), was used as
a complementation system [31]. The target genes were amplified using
chromosomal DNA from S. pneumoniae D39. For the construction of
pKB01-lacD, pKB01-galK and pKB01-manA, lacD, galK and manA genes
were amplified using LacD_Fw_EcoRI/LacD_Rv_BamHI,
GalK_Fw_EcoRI/GalK_Rv_BamHI and
ManA_Fw_EcoRI/ManA_Rv_BamHI, respectively. The PCR-amplified
fragments and pKB01 were digested with EcoRI and BamHI and
subsequently ligated. To generate pKB01-nagA the gene was amplified
with its own promoter using primers NagA_Fw_NotI/NagA_Rv_BamHI.
The digested fragment (NotI/BamHI) was cloned into pKB01 using the
same restriction sites. pKB01-galT-2 was made by amplifying galT-2 with
GalT-2_Fw_EcoRI/GalT-2_Rv_NotI. The PCR-fragment and PKB01 were
cleaved using EcoRI/NotI enzymes and ligated. To construct PKB01-
galKgalT-2, galKgalT-2 was amplified using GalK_Fw_EcoRI_B/GalT-
2_Rv_XbaI, digested with EcoRI and XbaI and ligated into pKB01 at the
same restriction sites. The primers used are listed in Table S2.3.
All the generated constructs were transformed into E. coli DH5α [32]. E.
coli was grown in Luria broth at 37ºC supplemented with 100 µg ml-1
ampicillin. The constructs were verified by sequencing at Macrogen.
Host glycan sugar-specific pathways in S. pneumoniae
83
Complementation of deletion strains
The pKB01-based plasmids were transformed into competent cells of
S. pneumoniae D39 loss-of-function mutants. For transformation, 2 µl of
the competence-stimulating peptide (CSP, 0.1 mg ml-1) was added to pre-
competent cells and activation achieved by 12 min at 37ºC. Plasmid DNA
was added and transformation was accomplished by 20 min at 30ºC,
followed by a phenotypic expression period of 90 min at 37ºC and
overnight growth on Columbia blood agar plates supplemented with 1 μg
ml-1 of tetracycline [33]. pKB01 constructs integrate by a double cross-
over into the chromosomal bgaA locus. Correct integration was verified,
in single colonies, by PCR. The constructed strains are listed in Table
S2.1.
Growth of complemented strains
Growth experiments were performed in a 96 well microtiter plate reader
(Tecan Genius) in a total volume of 200 μl C+Y medium [34], devoid of
Glc and sucrose. The medium was supplemented with 55 mM of the
desired carbon source in the presence or absence of 0.1 mM ZnCl2. Cells
were grown at 37ºC and OD595 was measured hourly.
Transcriptome analysis
For microarrays analysis, S. pneumoniae D39 was grown using
Sicard’s defined medium with or without modification [35]. Modification
was done to include mucin as the sole carbon source, replacing Glc and
bovine serum albumin. Porcine gastric mucin (Sigma) was dissolved in
water at a concentration of 10 mg ml-1 and dialysed against water
overnight at 4ºC using snake skin dialysis membrane (MWCO 10 kDa,
Pierce). After freeze drying, the mucin was dissolved in 10 mM potassium
phosphate buffer, pH 7.0, autoclaved at 121ºC for 15 min. This was then
Chapter 2
84
briefly centrifuged to remove insoluble residues and mixed with 2X
concentrated Sicard’s medium. The extraction of RNA was done as
described previously [36,37].
Microarray experiments
Microarray slides were purchased from the Bacterial Microarray Group
at St. George’s Hospital Medical School, University of London. The
SPv1.1.0 array contained spotted PCR products that represent all of the
genes in the S. pneumoniae TIGR4 and R6 genomes. The array design
is available in BµG@Sbase (accession number: A-BUGS-14;
http://bugs.sgul.ac.uk/A-BUGS-14) and also ArrayExpress (accession
number: A-BUGS-14). The Materials and Methods for microarray analysis
followed previously reported methodology [37].
Analysis of microarrays
The microarray slides were scanned using an Axon GenePix 4000A
microarray scanner, which utilises GenePix 5.1 software (Molecular
Devices Ltd) for identification and for a visual analysis of the quality of the
spots. The raw intensity data obtained from four independent experiments
were normalised and further analysed using GeneSpring 7.3 software
(Agilent Technologies). Data were subjected to LOWESS intensity-
dependent normalisation. Statistically significant changes in gene
expression were determined as t-test p-values < 0.05 after Benjamini and
Hochberg false discovery rate correction [38]. Genes of interest were
further identified by requiring >2-fold differences in all four samples
analysed. In addition, the microarray results for selected genes whose
expression significantly altered in the presence of mucin were verified and
confirmed by real time quantitative reverse transcription PCR (qRT-PCR),
in order to ensure that dye affinity did not bias the results.

Host glycan sugar-specific pathways in S. pneumoniae
85
Fully annotated microarray data have been deposited in BµG@Sbase
(accession number E-BUGS-159; http://bugs.sgul.ac.uk/E-BUGS-159)
and also ArrayExpress (accession number E-BUGS-159).
Quantitative RT-PCR
To assess the expression of specific Gal catabolic genes (galT-2, galT-
1, galK, lacD), by qRT-PCR, cells were grown in CDM supplemented with
the appropriate carbohydrate, as previously described, and a 4 ml aliquot
was collected (16,100 x g, 2 min at 27ºC) in mid-exponential phase of
growth. The supernatant was discarded and the pellet suspended in 0.5
ml Trizol (Life Technologies). Samples were stored at -80ºC until further
analysis. RNA extraction was performed as described previously [37].
To confirm the microarray results, two independent RNA preparations
were used for qRT-PCR analysis. First strand cDNA synthesis was
performed on approximately 1 µg DNase-treated total RNA, immediately
after isolation, using 200 U of SuperScript II reverse transcriptase
(Invitrogen) and random hexamers at 42oC for 55 min [39]. cDNA (15 ng)
was amplified in a 20 µl reaction volume that contained 1 x SYBR Green
PCR master mix (Applied Biosystems) and 3 pmol of each primer (Table
S2.3). The transcription level of genes was normalised to gyrB
transcription, amplified in parallel with SPDRT0709F and SPDRT0709R
primers. The reactions were performed in triplicate using the following
cycling parameters with a Rotor Gene real time PCR cycler (Qiagen): 1
cycle of 10 min 95ºC followed by 40 cycles of 30 sec 95ºC, 1 min 55°C,
and 30 sec 72°C. The results were interpreted using the comparative CT
method [40].
In silico analysis for catabolic pathway prediction
Potential catabolic pathways for the monosaccharides Gal, Man,
GlcNAc, NeuNAc, GalNAc and Fuc were predicted in silico by combining
Chapter 2
86
data obtained from the metabolic databases MetaCyc
(http://metacyc.org/META/class-tree?object=Pathways) and Kegg
(http://www.genome.jp/kegg/pathway.html), literature surveys and
genome sequences. In addition, functionally characterized proteins from
other microorganisms were used as query for BlastP searches of S.
pneumoniae D39 genome deposited at NCBI
(http://www.ncbi.nlm.nih.gov/genome/176?project_id=58581).
Growth assay for assessment of sugar utilization by S.
pneumoniae D39
The ability of monosaccharides Glc, Gal, Man, GlcNAc, glucosamine
(GlcN), galactosamine (GalN), and GalNAc to support growth of S.
pneumoniae D39 was investigated using 96-well microtiter plates
containing 250 µl CDM supplemented with 30 mM of each sugar. Cultures
were started at an initial OD595 of ~0.05 by addition of an overnight Glc-
grown pre-culture pelleted (6300 x g, 7 min, RT) and suspended in fresh
CDM without sugar. Growth was monitored at 595 nm over 24 h at 37ºC.
Readings were taken every 30 min, after 1 s shaking, using an ELx808
Absorbance Microplate Reader (BioTek Instruments, Inc.). The growth
curves were generated by using Gen5TM (BioTek Instruments, Inc.). Each
growth condition was done in triplicate using two independent pre-
cultures.
Quantification of sugar consumption and fermentation
products
Strains were grown in CDM supplemented with the appropriate sugar
as described above. Culture samples (2 mL) were taken immediately after
inoculation and at the onset of the stationary phase of growth, and
centrifuged (16,100 x g, 3 min, 4ºC). For high performance liquid
Host glycan sugar-specific pathways in S. pneumoniae
87
chromatography (HPLC) analysis, samples were treated as described by
Carvalho et al. [9]. Fermentation products and Glc were quantified by
HPLC as before [9]. Gal, Man, GlcNAc and formate were quantified by 1H-
NMR and the spectra were acquired with a Bruker AMX300 spectrometer
(Bruker BioSpin GmbH). To quantify Gal the temperature of the probe was
set to 18ºC, whereas for Man and GlcNAc it was 37ºC. DSS (3-
(trimethylsilyl) propionic acid sodium salt) was added to the samples as
an internal concentration standard in 1H-NMR quantifications.
Yields were calculated using the data from samples taken immediately
after inoculation and at the onset of stationary phase of growth. A factor
of 0.38, determined from a dry weight (DW) (mg ml-1) versus OD600 curve,
was used to convert OD600 into DW (mg biomass ml-1). The yield in
biomass was calculated as g of dry weight per mol of substrate consumed.
The ATP yield was determined as the ratio of ATP produced to substrate
consumed at the time of growth arrest assuming that all ATP was
synthesized by substrate-level phosphorylation. The values reported are
averages of at least two independent growths.
Cold ethanol extractions and determination of intracellular
metabolites by 31P-NMR
For ethanol extractions, the Na2-β-glycerophosphate in the CDM
growth medium was replaced by 15.4 g l-1 MES (2-(N-morpholino)
ethanesulfonic acid), to avoid the intense buffer resonance in the
phosphomonoester (PME) region. The ethanol extracts were prepared as
described previously by Carvalho et al. [9]. Cells were harvested (20,980
x g, 4ºC, 5 min) during exponential growth and the pellet suspended in
milliQ water, pH 6.5. Cell suspensions were transferred to the appropriate
volume of cold ethanol 70% (vol/vol) in an ice bath, and extraction was
performed for 30 min with vigorous agitation. Cell debris was removed by
centrifugation (39,191 x g, 4ºC, 20 min). The ethanol in the supernatant
Chapter 2
88
was removed via a rotavap and the extract frozen in liquid nitrogen, and
lyophilized overnight. The dried extract was dissolved in 1 ml of
deuterated water containing 5 mM EDTA. The pH was set to 6.5 and the
extract was stored at -20ºC until analysis by 31P-NMR. Resonances were
assigned by addition of pure compounds to the extracts or on basis of
comparison with previous studies [9]. 31P-NMR spectra were recorded
using a selective probe head (31P-SEX) at 30ºC on a Bruker AVANCE II
500 MHz spectrometer (Bruker BioSpin GmbH) by using standard Bruker
pulse programs. Spectra were referenced to the resonance of external
85% H3PO4, designated at 0 ppm.
Enzyme activity determination
For enzyme activity determination, cells of S. pneumoniae were grown,
in CDM supplemented with 30 mM sugar (Gal, Man, GlcNAc or Glc), until
late-exponential phase of growth, and harvested by centrifugation (7,519
x g, 7 min, 4ºC). The supernatant was removed, the pellet suspended in
cold potassium phosphate buffer (KPi) 10 mM, pH 7.0, and stored at -20ºC
until further analysis. Dithiothreitol (1 mM) was added to the suspension
and cell-free extracts prepared by mechanical disruption in a French
Press (6.21 MPa). Cell debris was removed (16,100 x g for 15 min, at 4ºC)
and the supernatant was used for enzyme activity measurements.
Extracts were kept on ice during these measurements.
For measurement of galactokinase (GalK) activity, removal of low
molecular weight substances from the cell-free extract was performed
using a PD-10 desalting column equilibrated with KPi buffer 10 mM pH
7.0 according to the supplier’s instructions (GE Healthcare Life Sciences).
The GalK assay mixture contained 100 mM triethanolamine (TEA) buffer
pH 7.6, 5 mM MgCl2, 10 mM ATP and 10 mM galactose. The mixture was
incubated at 37ºC, in a Thermomixer® comfort (Eppendorf) and the
reaction started by the addition of the cell-free extract. The reaction was
Host glycan sugar-specific pathways in S. pneumoniae
89
stopped, at different time points, by incubating for 5 min at 85ºC and
subsequently freezing in liquid nitrogen. Samples were stored at -20ºC
until further analysis. Quantification of galactose 1-phosphate formed was
accomplished by 1H-NMR spectroscopy using a Brucker AMX300
spectrometer (Brucker BioSpin GmbH). DSS was added to the samples
and used as an internal concentration standard. The slopes of the
galactose 1-phosphate (Gal1P) formed versus time were determined
using linear regression.
Tagatose 1,6-diphosphate aldolase (LacD) activity was determined
essentially as described by Crow and Thomas [41]. The reaction mixture
(1 ml) contained 50 mM TEA buffer pH 7.8, 0.25 mM NADH, 1.2 U α-
glycerolphosphate dehydrogenase (Roche), 11.5 U triosephosphate
isomerase from rabbit muscle (Sigma-Aldrich) and 0.16 mM tagatose 1,6-
diphosphate (TBP). The oxidation of NADH was measured by the
decrease in absorbance at 340 nm.
N-acetylglucosamine 6-phosphate deacetylase (NagA) activity was
enzymatically assayed as described by Homer et al. [42]. The method
couples this activity to the other GlcNAc-specific catabolic enzyme –
glucosamine 6-phosphate isomerase (NagB). To ensure the applicability
of this protocol, the specific activity of NagB was measured [43]. The
specific activity of this enzyme was higher than that of NagA for all
conditions assayed, thus showing that the glucosamine 6-phosphate
isomerase activity was not a rate limiting step. The reaction mixture (1 ml)
contained 40 mM sodium phosphate buffer pH 7.5, 1 mM N-
acetylglucosamine 6-phosphate, 0.2 mM NADP+, 4 U phosphoglucose
isomerase (Sigma) and 1.5 U glucose 6-phosphate dehydrogenase
(Roche). Glucosamine 6-phosphate isomerase was measured in an
identical assay but N-acetylglucosamine 6-phosphate was replaced by
glucosamine 6-phosphate. NADPH formation was monitored by
measuring the increase in absorbance at 340 nm spectrophotometrically.
Chapter 2
90
Mannose 6-phosphate isomerase (ManA) activity was measured
essentially as described by Gracy and Noltmann [44], and modified as
follows: the assay mixture contained 100 mM TEA pH 7.6, 10 mM
mannose 6-phosphate, 2 mM NADP+, 1 U of phosphoglucose isomerase
(Sigma) and 1 U of glucose 6-phosphate dehydrogenase (Roche), in a
total volume of 250 μl. The rate of change of absorbance at 340 nm (due
to NADP+ reduction), coupled to mannose 6-phosphate isomerization,
was measured spectrophotometrically.
The coupled enzyme protocols were carried out at 25ºC. All the reactions
were started by adding adequate amounts of freshly prepared cell-free
extracts. The absorbance changes were recorded in a Shimadzu UV-
1603 spectrophotometer (Shimadzu Corporation).
One unit (U) of GalK activity is defined as the amount of protein required
for the formation of 1 μmol of Gal1P per minute. For the coupled enzyme
protocols, the enzyme activity is given as the amount of protein required
to catalyse the oxidation or reduction of 1 µmol of NADH or NADP+,
respectively, per minute. Specific activity was expressed as units (µmol
min-1) per milligram of protein (U mg protein-1). Protein concentration in
the cell-free extracts was determined by the Pierce BCA protein assay kit
(Thermo Scientific). All the determinations were made at least in triplicate
in two extracts obtained from independent cultures.
In vivo analysis of pneumococcal strains
Ten-week-old female MF1 outbred mice (Charles River) were used.
Before use, a standard inoculum for each pneumococcal strain was
prepared as described before [39].
To assess the virulence of pneumococcal strains, mice were lightly
anesthetized with 3% (vol/vol) isoflurane over oxygen, and an inoculum of
50 µl containing approximately 1 X 10⁶ CFU in PBS was given drop by
drop into the nostrils. After infection, the inoculum dose was confirmed by
Host glycan sugar-specific pathways in S. pneumoniae
91
viable counting on blood agar plates. Animals were monitored for disease
signs (progressively starry coat, hunched, and lethargic) every six hours
in the first 24 h. After the onset of disease signs, which is after 24 h post-
infection, the mice were monitored every 2 hours [39,45]. When the mice
become lethargic, they were culled by cervical dislocation. Therefore, time
to reach lethargic state was defined as the “survival time.” Mice that were
alive 7 days after infection were deemed to have survived the infection.
Colonisation experiments were done essentially as described above
except that mice were administered with 5 X 10⁵ CFU of S. pneumoniae
in 10 µl PBS. For intravenous infections, approximately 5 X 10⁵ CFU of S.
pneumoniae in 100 µl PBS (pH 7.0) were administered via a tail vein. The
inoculum dose was confirmed by plating onto blood agar, as described
above.
To monitor the development of bacteraemia, approximately 20 µl of
venous blood was obtained from each mouse at predetermined time
points after infection, and viable counts were determined, as described
above. The growth of pneumococci in the nasopharynx was also
determined, as described previously [39,45]. For this, at predetermined
time intervals following intranasal infection, pre assigned groups of mice
were deeply anesthetized with 5% (vol/vol) isoflurane over oxygen, and
the mice were subsequently killed by cervical dislocation.
Nasopharyngeal tissue was collected as described previously [39,45] and
transferred into 10 ml of sterile PBS, weighed, and then homogenized with
an Ultra Turrax blender (Ika-Werke). Viable counts in homogenates were
determined as described above.
Survival times were calculated by using GraphPad Prism software and
analysed by the Mann-Whitney U test. Data were analysed by an analysis
of variance followed by the Bonferroni post-test. Statistical significance
was considered to be a p-value of < 0.05.

Chapter 2
92
Chemicals
N-acetylglucosamine 6-phosphate (GlcNAc6P) was obtained through
a modification of established procedures [46,47] according to Fig. S2.1.
The synthesis of tagatose 1,6-diphosphate (TBP) is described in Fig.
S2.2. Modifications to the synthesis of TBP previously published [48] were
made in order to optimize the process (see Text S2.1). The synthesized
compounds were quantified by 1H-NMR, using a Brucker AMX300
spectrometer (Brucker BioSpin GmbH). DSS, used as an internal
concentration standard in 1H-NMR quantifications, was purchased from
Merck.
Galactose, mannose, and N-acetylneuraminic acid were purchased from
Sigma-Aldrich. Glucose was supplied by Merck and N-acetyl-D-
galactosamine, N-acetyl-D-glucosamine, glucosamine and
galactosamine were purchased from Applichem. All other chemicals used
were reagent grade.
Ethical disclaimer
Mouse experiments at the University of Leicester were performed
under appropriate project (no. 60/4327) and personal (no. 80/10279)
licenses according to the United Kingdom Home Office guidelines and
local ethical approval. The animal work is approved by Animal Welfare
and Ethical Review Body (AWERB) ethics committee. Where appropriate,
the procedures were carried out under anaesthesia with isoflurane.
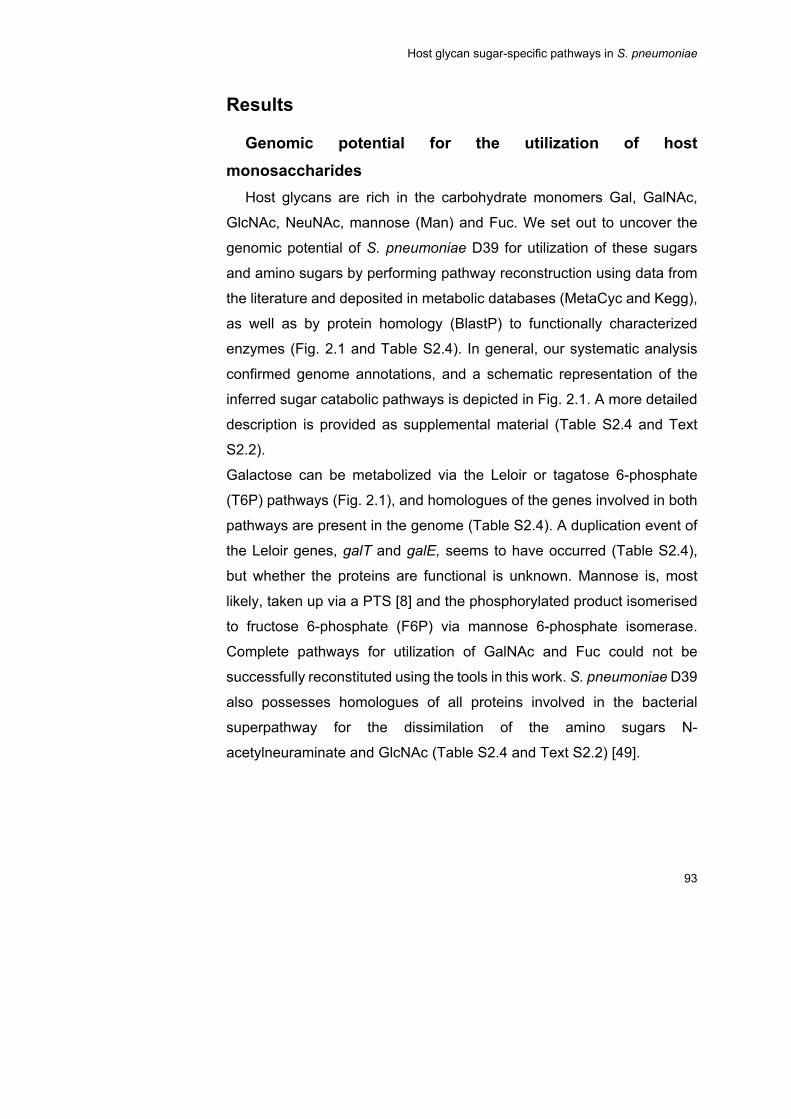
Host glycan sugar-specific pathways in S. pneumoniae
93
Results
Genomic potential for the utilization of host
monosaccharides
Host glycans are rich in the carbohydrate monomers Gal, GalNAc,
GlcNAc, NeuNAc, mannose (Man) and Fuc. We set out to uncover the
genomic potential of S. pneumoniae D39 for utilization of these sugars
and amino sugars by performing pathway reconstruction using data from
the literature and deposited in metabolic databases (MetaCyc and Kegg),
as well as by protein homology (BlastP) to functionally characterized
enzymes (Fig. 2.1 and Table S2.4). In general, our systematic analysis
confirmed genome annotations, and a schematic representation of the
inferred sugar catabolic pathways is depicted in Fig. 2.1. A more detailed
description is provided as supplemental material (Table S2.4 and Text
S2.2).
Galactose can be metabolized via the Leloir or tagatose 6-phosphate
(T6P) pathways (Fig. 2.1), and homologues of the genes involved in both
pathways are present in the genome (Table S2.4). A duplication event of
the Leloir genes, galT and galE, seems to have occurred (Table S2.4),
but whether the proteins are functional is unknown. Mannose is, most
likely, taken up via a PTS [8] and the phosphorylated product isomerised
to fructose 6-phosphate (F6P) via mannose 6-phosphate isomerase.
Complete pathways for utilization of GalNAc and Fuc could not be
successfully reconstituted using the tools in this work. S. pneumoniae D39
also possesses homologues of all proteins involved in the bacterial
superpathway for the dissimilation of the amino sugars N-
acetylneuraminate and GlcNAc (Table S2.4 and Text S2.2) [49].
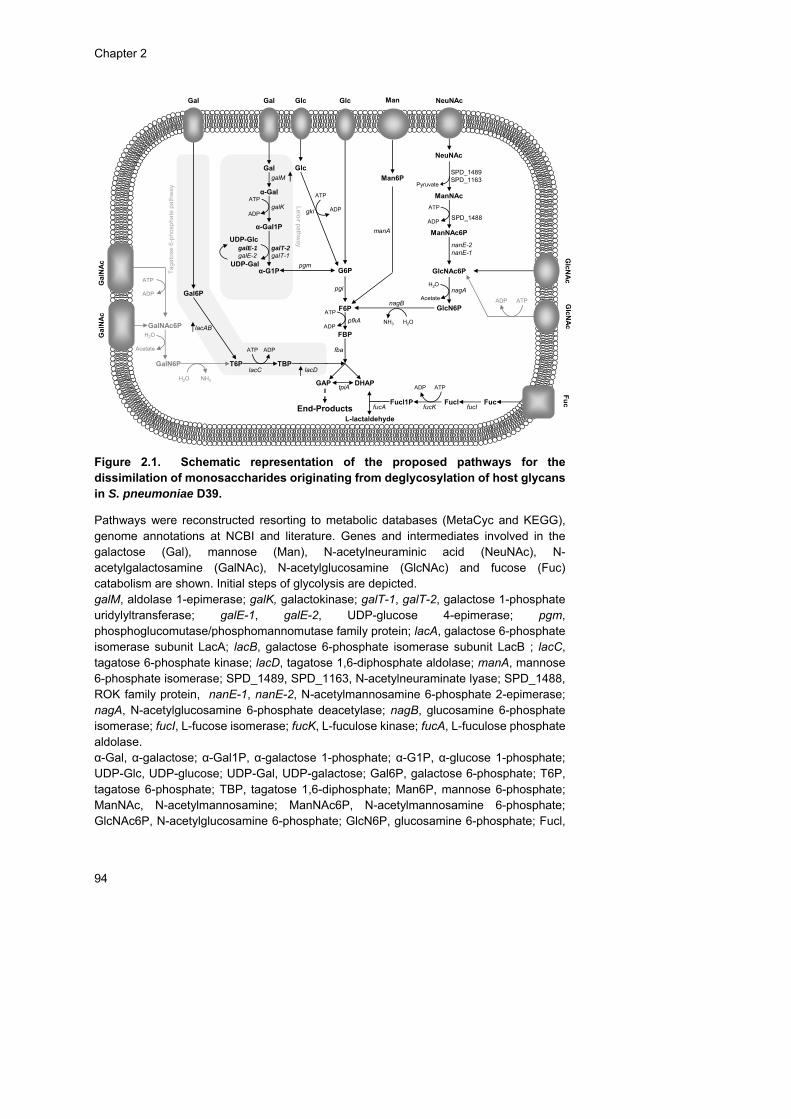
Chapter 2
94
Figure 2.1. Schematic representation of the proposed pathways for the dissimilation of monosaccharides originating from deglycosylation of host glycans in S. pneumoniae D39.
Pathways were reconstructed resorting to metabolic databases (MetaCyc and KEGG), genome annotations at NCBI and literature. Genes and intermediates involved in the galactose (Gal), mannose (Man), N-acetylneuraminic acid (NeuNAc), N-acetylgalactosamine (GalNAc), N-acetylglucosamine (GlcNAc) and fucose (Fuc) catabolism are shown. Initial steps of glycolysis are depicted. galM, aldolase 1-epimerase; galK, galactokinase; galT-1, galT-2, galactose 1-phosphate uridylyltransferase; galE-1, galE-2, UDP-glucose 4-epimerase; pgm, phosphoglucomutase/phosphomannomutase family protein; lacA, galactose 6-phosphate isomerase subunit LacA; lacB, galactose 6-phosphate isomerase subunit LacB ; lacC, tagatose 6-phosphate kinase; lacD, tagatose 1,6-diphosphate aldolase; manA, mannose 6-phosphate isomerase; SPD_1489, SPD_1163, N-acetylneuraminate lyase; SPD_1488, ROK family protein, nanE-1, nanE-2, N-acetylmannosamine 6-phosphate 2-epimerase; nagA, N-acetylglucosamine 6-phosphate deacetylase; nagB, glucosamine 6-phosphate isomerase; fucI, L-fucose isomerase; fucK, L-fuculose kinase; fucA, L-fuculose phosphate aldolase. α-Gal, α-galactose; α-Gal1P, α-galactose 1-phosphate; α-G1P, α-glucose 1-phosphate; UDP-Glc, UDP-glucose; UDP-Gal, UDP-galactose; Gal6P, galactose 6-phosphate; T6P, tagatose 6-phosphate; TBP, tagatose 1,6-diphosphate; Man6P, mannose 6-phosphate; ManNAc, N-acetylmannosamine; ManNAc6P, N-acetylmannosamine 6-phosphate; GlcNAc6P, N-acetylglucosamine 6-phosphate; GlcN6P, glucosamine 6-phosphate; Fucl,
Glc
G6P
UDP-Glc
ADP
Gal
α-Gal1P
UDP-Gal
NH3 H2O
NeuNAc
Pyruvate
ManNAc
ATP
ADP
ManNAc6P
GlcN6P
H2O
Acetate
GlcN
Ac
nagB
nagA
nanE-2nanE-1
galK
galT-2galT-1
α-G1P
galE-1galE-2
SPD_1489SPD_1163
Gal
ATP
NeuNAc
pgm
Gal
NA
c
GalNAc6P
GalN6P T6P TBP
ATP ADP
H2O
Acetate
H2O NH3
Gal6P
GAP
FBP
Gal
α-Gal
lacC lacD
lacAB
galM
SPD_1488
End-Products
Glc
Glc
ATP
ADPgki
pfkA
fba
pgi
Fu
cFucFuclfucI
Fucl1PfucKfucA
L-lactaldehyde
ATPADP
Ta
gato
se6
-ph
osph
ate
path
wa
y
Lelo
irpa
thw
ay
ATPADP
DHAP tpiA
Man
Man6P
manAG
lcNA
c
F6P
GlcNAc6P
ATP
ADP
Gal
NA
c
ATP
ADP
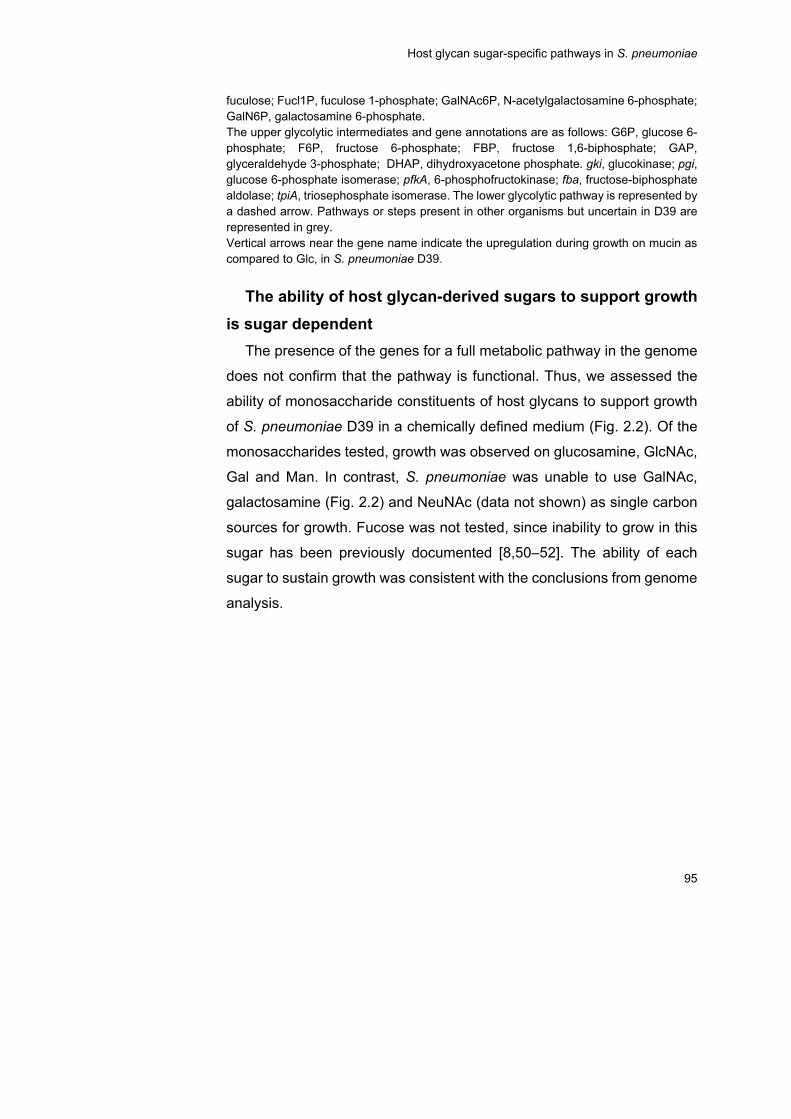
Host glycan sugar-specific pathways in S. pneumoniae
95
fuculose; Fucl1P, fuculose 1-phosphate; GalNAc6P, N-acetylgalactosamine 6-phosphate; GalN6P, galactosamine 6-phosphate. The upper glycolytic intermediates and gene annotations are as follows: G6P, glucose 6-phosphate; F6P, fructose 6-phosphate; FBP, fructose 1,6-biphosphate; GAP, glyceraldehyde 3-phosphate; DHAP, dihydroxyacetone phosphate. gki, glucokinase; pgi, glucose 6-phosphate isomerase; pfkA, 6-phosphofructokinase; fba, fructose-biphosphate aldolase; tpiA, triosephosphate isomerase. The lower glycolytic pathway is represented by a dashed arrow. Pathways or steps present in other organisms but uncertain in D39 are represented in grey. Vertical arrows near the gene name indicate the upregulation during growth on mucin as compared to Glc, in S. pneumoniae D39.
The ability of host glycan-derived sugars to support growth
is sugar dependent
The presence of the genes for a full metabolic pathway in the genome
does not confirm that the pathway is functional. Thus, we assessed the
ability of monosaccharide constituents of host glycans to support growth
of S. pneumoniae D39 in a chemically defined medium (Fig. 2.2). Of the
monosaccharides tested, growth was observed on glucosamine, GlcNAc,
Gal and Man. In contrast, S. pneumoniae was unable to use GalNAc,
galactosamine (Fig. 2.2) and NeuNAc (data not shown) as single carbon
sources for growth. Fucose was not tested, since inability to grow in this
sugar has been previously documented [8,50–52]. The ability of each
sugar to sustain growth was consistent with the conclusions from genome
analysis.
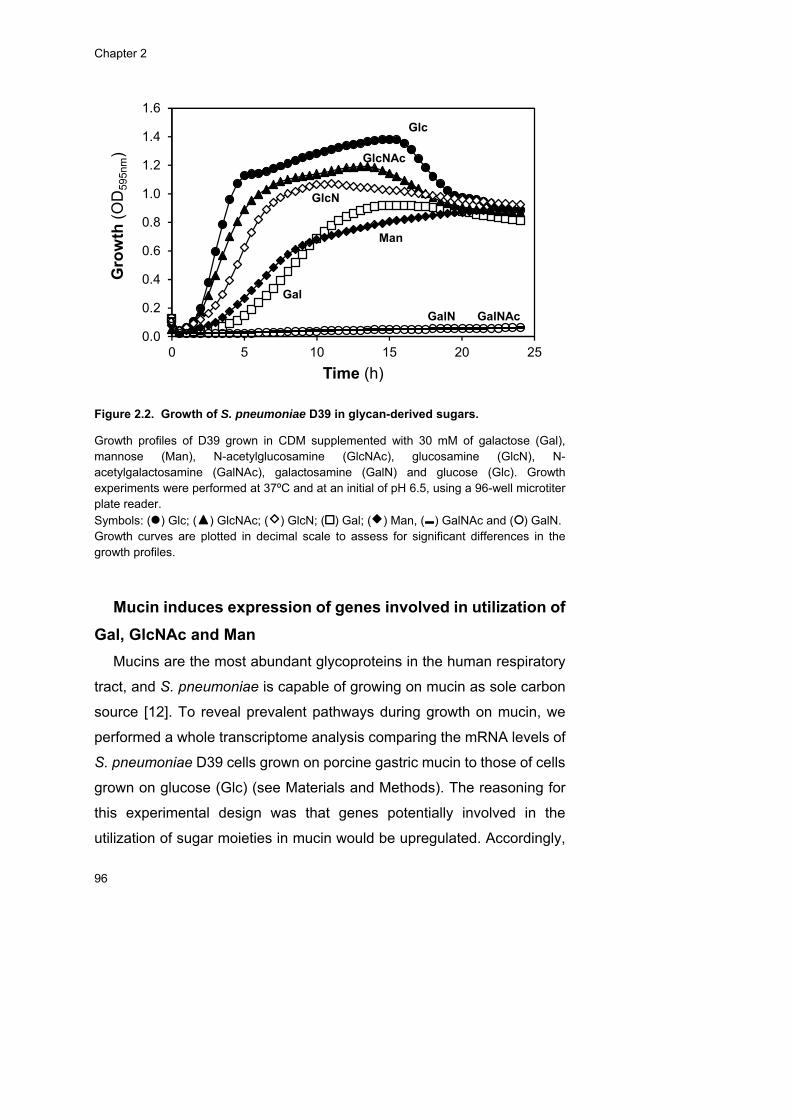
Chapter 2
96
Figure 2.2. Growth of S. pneumoniae D39 in glycan-derived sugars.
Growth profiles of D39 grown in CDM supplemented with 30 mM of galactose (Gal), mannose (Man), N-acetylglucosamine (GlcNAc), glucosamine (GlcN), N-acetylgalactosamine (GalNAc), galactosamine (GalN) and glucose (Glc). Growth experiments were performed at 37ºC and at an initial of pH 6.5, using a 96-well microtiter plate reader. Symbols: ( ) Glc; ( ) GlcNAc; ( ) GlcN; ( ) Gal; ( ) Man, ( ) GalNAc and ( ) GalN. Growth curves are plotted in decimal scale to assess for significant differences in the growth profiles.
Mucin induces expression of genes involved in utilization of
Gal, GlcNAc and Man
Mucins are the most abundant glycoproteins in the human respiratory
tract, and S. pneumoniae is capable of growing on mucin as sole carbon
source [12]. To reveal prevalent pathways during growth on mucin, we
performed a whole transcriptome analysis comparing the mRNA levels of
S. pneumoniae D39 cells grown on porcine gastric mucin to those of cells
grown on glucose (Glc) (see Materials and Methods). The reasoning for
this experimental design was that genes potentially involved in the
utilization of sugar moieties in mucin would be upregulated. Accordingly,
0.0
0.2
0.4
0.6
0.8
1.0
1.2
1.4
1.6
0 5 10 15 20 25
Gro
wth
(OD
595n
m)
Time (h)
GalNAcGalN
Glc
GlcNAc
GlcN
Gal
Man
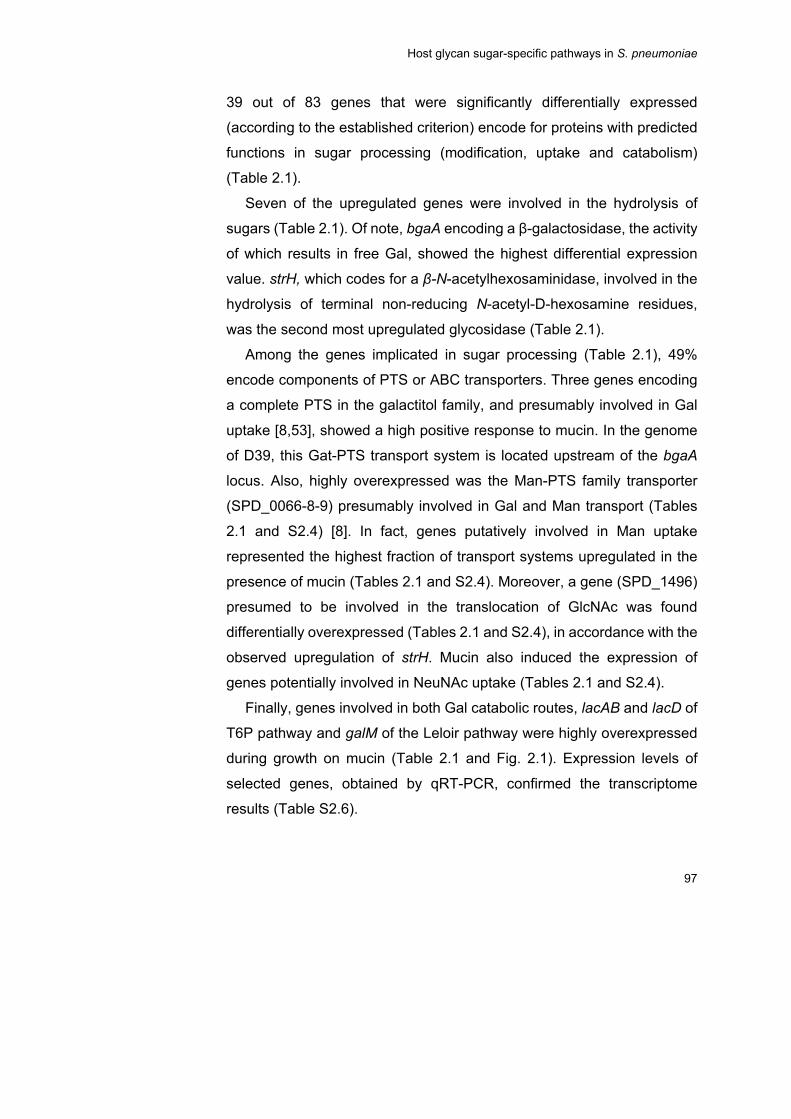
Host glycan sugar-specific pathways in S. pneumoniae
97
39 out of 83 genes that were significantly differentially expressed
(according to the established criterion) encode for proteins with predicted
functions in sugar processing (modification, uptake and catabolism)
(Table 2.1).
Seven of the upregulated genes were involved in the hydrolysis of
sugars (Table 2.1). Of note, bgaA encoding a β-galactosidase, the activity
of which results in free Gal, showed the highest differential expression
value. strH, which codes for a β-N-acetylhexosaminidase, involved in the
hydrolysis of terminal non-reducing N-acetyl-D-hexosamine residues,
was the second most upregulated glycosidase (Table 2.1).
Among the genes implicated in sugar processing (Table 2.1), 49%
encode components of PTS or ABC transporters. Three genes encoding
a complete PTS in the galactitol family, and presumably involved in Gal
uptake [8,53], showed a high positive response to mucin. In the genome
of D39, this Gat-PTS transport system is located upstream of the bgaA
locus. Also, highly overexpressed was the Man-PTS family transporter
(SPD_0066-8-9) presumably involved in Gal and Man transport (Tables
2.1 and S2.4) [8]. In fact, genes putatively involved in Man uptake
represented the highest fraction of transport systems upregulated in the
presence of mucin (Tables 2.1 and S2.4). Moreover, a gene (SPD_1496)
presumed to be involved in the translocation of GlcNAc was found
differentially overexpressed (Tables 2.1 and S2.4), in accordance with the
observed upregulation of strH. Mucin also induced the expression of
genes potentially involved in NeuNAc uptake (Tables 2.1 and S2.4).
Finally, genes involved in both Gal catabolic routes, lacAB and lacD of
T6P pathway and galM of the Leloir pathway were highly overexpressed
during growth on mucin (Table 2.1 and Fig. 2.1). Expression levels of
selected genes, obtained by qRT-PCR, confirmed the transcriptome
results (Table S2.6).

Chapter 2
98
Table 2.1. Expression levels of genes upregulated in S. pneumoniae D39
cells grown in mucin as compared to glucose-grown cells a,b.
Locus-tag Gene Function Overexpression fold
SPD_0562 bgaA Beta-galactosidase 71.8
SPD_1057 PTS system transporter subunit IIB 61.3
SPD_0561 PTS system transporter subunit IIC 45.5
SPD_0068 PTS system transporter subunit IID 25.4
SPD_1053 lacA Galactose 6-phosphate isomerase subunit LacA
24.5
SPD_0069 PTS system transporter subunit IIA 23.9
SPD_1052 lacB Galactose 6-phosphate isomerase subunit LacB
21.7
SPD_0071 galM Aldose 1-epimerase 19.4
SPD_1050 lacD Tagatose 1,6-diphosphate aldolase 17.6
SPD_0559 PTS system transporter subunit IIA 15.1
SPD_0560 PTS system transporter subunit IIB 12.1
SPD_1494 Sugar ABC transporter permease 10.3
SPD_0070 agaS Sugar isomerase 9.8
SPD_0063 strH Beta-N-acetylhexosaminidase 8.7
SPD_1663 treC Alpha,alpha-phosphotrehalase 8.0
SPD_0066 PTS system transporter subunit IIB 7.8
SPD_0287 Hyaluronate lyase 7.7
SPD_1495 Sugar ABC transporter sugar-binding protein
6.7
SPD_0293 PTS system transporter subunit IIA 6.5
SPD_1834 Bifunctional acetaldehyde-CoA/alcohol dehydrogenase
5.8
SPD_0292 Gluconate 5-dehydrogenase 5.3
SPD_1409 Sugar ABC transporter ATP-binding protein
4.8
SPD_1934 malX Maltose/maltodextrin ABC transporter maltose/maltodextrin-binding protein
4.8
SPD_0297 PTS system transporter subunit IID 4.4
SPD_1496 PTS system transporter subunit IIBC 4.4
SPD_1006 glgC Glucose 1-phosphate adenylyltransferase 4.4
SPD_0621 lctO Lactate oxidase 4.0
SPD_1935 malC Maltodextrin ABC transporter permease 3.9
SPD_0420 pflB Formate acetyltransferase 3.7
SPD_1007 glgD Glucose 1-phosphate adenylyltransferase, GlgD subunit
3.5
SPD_1005 glgB Glycogen branching protein 2.9
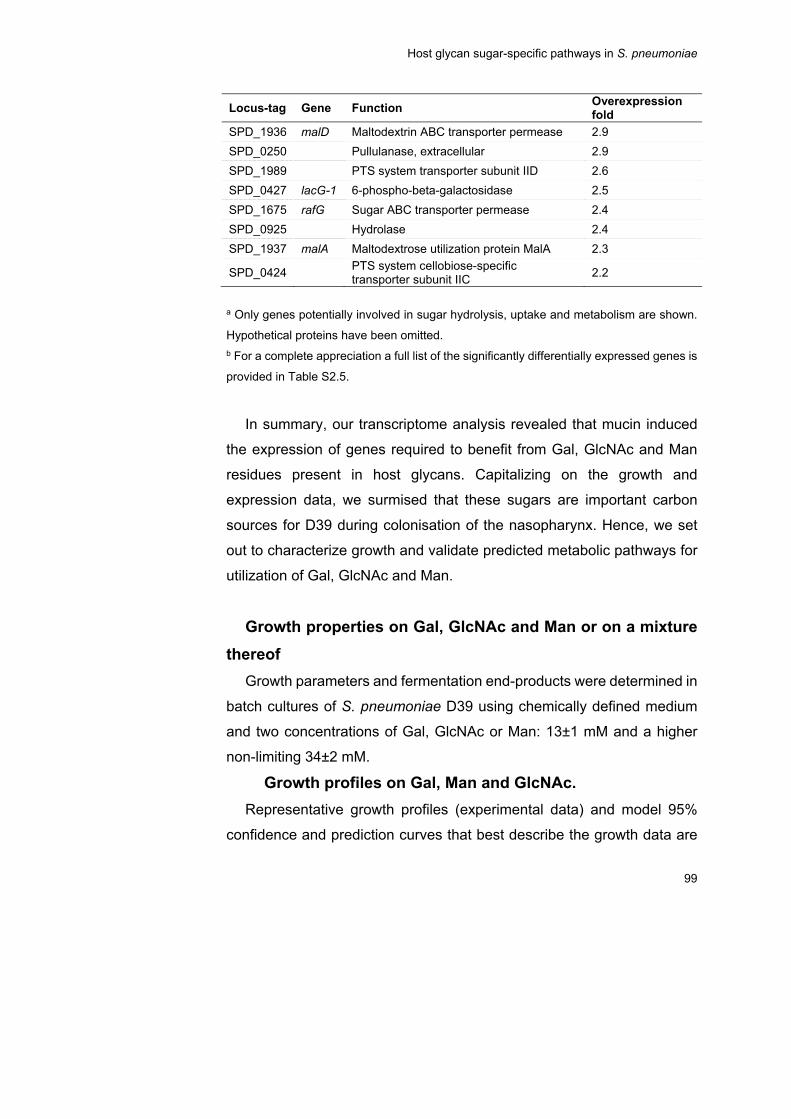
Host glycan sugar-specific pathways in S. pneumoniae
99
Locus-tag Gene Function Overexpression fold
SPD_1936 malD Maltodextrin ABC transporter permease 2.9
SPD_0250 Pullulanase, extracellular 2.9
SPD_1989 PTS system transporter subunit IID 2.6
SPD_0427 lacG-1 6-phospho-beta-galactosidase 2.5
SPD_1675 rafG Sugar ABC transporter permease 2.4
SPD_0925 Hydrolase 2.4
SPD_1937 malA Maltodextrose utilization protein MalA 2.3
SPD_0424 PTS system cellobiose-specific transporter subunit IIC
2.2
a Only genes potentially involved in sugar hydrolysis, uptake and metabolism are shown.
Hypothetical proteins have been omitted. b For a complete appreciation a full list of the significantly differentially expressed genes is
provided in Table S2.5.
In summary, our transcriptome analysis revealed that mucin induced
the expression of genes required to benefit from Gal, GlcNAc and Man
residues present in host glycans. Capitalizing on the growth and
expression data, we surmised that these sugars are important carbon
sources for D39 during colonisation of the nasopharynx. Hence, we set
out to characterize growth and validate predicted metabolic pathways for
utilization of Gal, GlcNAc and Man.
Growth properties on Gal, GlcNAc and Man or on a mixture
thereof
Growth parameters and fermentation end-products were determined in
batch cultures of S. pneumoniae D39 using chemically defined medium
and two concentrations of Gal, GlcNAc or Man: 13±1 mM and a higher
non-limiting 34±2 mM.
Growth profiles on Gal, Man and GlcNAc.
Representative growth profiles (experimental data) and model 95%
confidence and prediction curves that best describe the growth data are
Chapter 2
100
depicted in Fig. 2.3. In general, the model fits well with the experimental
data. The 95% confidence curves (Fig. 2.3) reveal that the larger
differences between biological growth replicas occur at the final stage of
the growth, as shown by higher discrepancies in the final optical density
(ODmax) rather than specific growth rate (µmax). The parameters derived
from the growth analysis are shown in Table 2.2. Analysis through ANOVA
and pairwise t-tests allowed assessment of the statistical significance of
the growth parameter differences across the experimental conditions
(Table S2.2).
In medium containing the higher substrate concentration, GlcNAc
supported a significantly faster growth than Gal and Man (Tables 2.2 and
S2.2). However, no significant differences (p=0.15) were found between
cells growing on higher concentrations of Gal or Man, with the specific
growth rate similar in both conditions (Tables 2.2 and S2.2). In contrast,
for the lower substrate concentration, the growth rate was sugar
dependent with the amino sugar supporting a significantly higher growth
rate than Man or Gal (Tables 2.2 and S2.2). The specific growth rate is
independent of the initial substrate concentration (Table 2.2), except for
Gal which supports higher growth rates when the substrate is in excess.
The involvement of a low affinity transporter in the uptake of this sugar
would explain this behaviour.
When the higher substrate concentration was used, Gal supported the
highest final biomass, which was similar to that on Glc (p=0.06) (Tables
2.2 and S2.2). No significant differences in the final biomass (p=0.89)
were observed between growths on GlcNAc and Man, which were lower
than that on Gal (Tables 2.2 and S2.2). At the lower substrate
concentration the biomass formed was similar for the glycan-derived
sugars and Glc, and unsurprisingly lower than those obtained using non-
limiting sugar concentrations (Fig. 2.3, Tables 2.2 and S2.2).
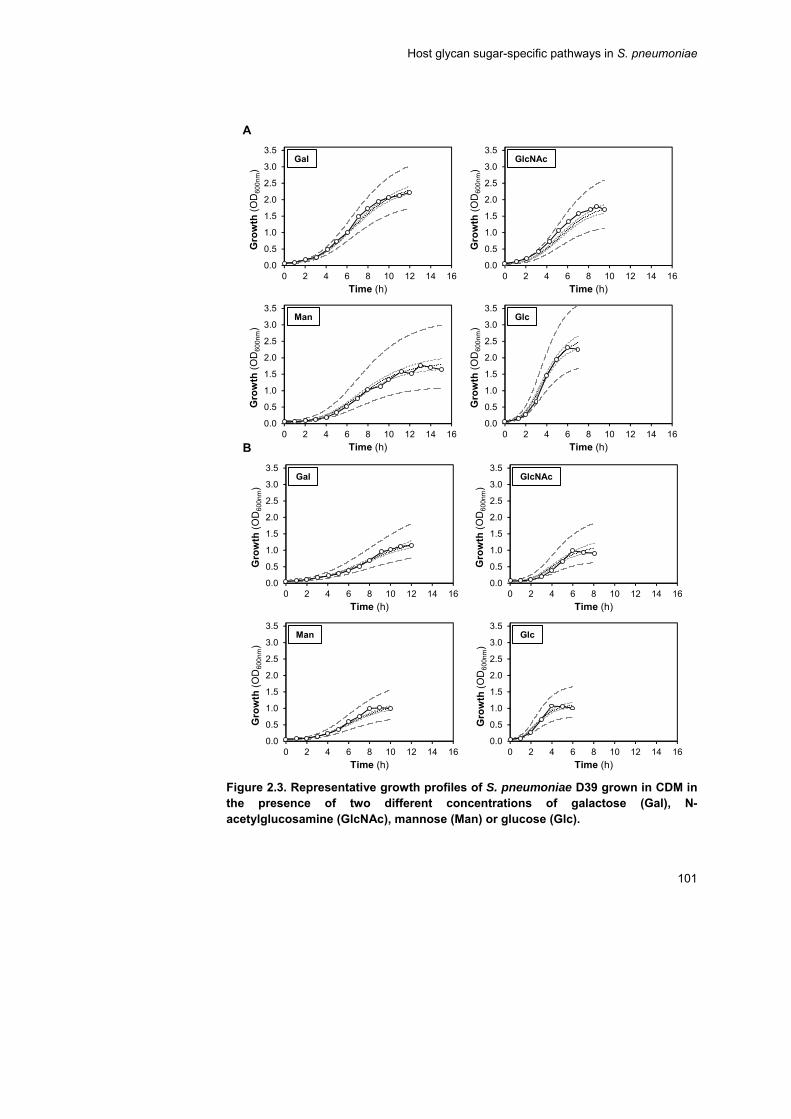
Host glycan sugar-specific pathways in S. pneumoniae
101
Figure 2.3. Representative growth profiles of S. pneumoniae D39 grown in CDM in the presence of two different concentrations of galactose (Gal), N-acetylglucosamine (GlcNAc), mannose (Man) or glucose (Glc).
0.0
0.5
1.0
1.5
2.0
2.5
3.0
3.5
0 2 4 6 8 10 12 14 16
Gro
wth
(OD
600n
m)
Time (h)
Glc
A
0.0
0.5
1.0
1.5
2.0
2.5
3.0
3.5
0 2 4 6 8 10 12 14 16
Gro
wth
(OD
600n
m)
Time (h)
Gal
0.0
0.5
1.0
1.5
2.0
2.5
3.0
3.5
0 2 4 6 8 10 12 14 16
Gro
wth
(OD
600n
m)
Time (h)
GlcNAc
0.0
0.5
1.0
1.5
2.0
2.5
3.0
3.5
0 2 4 6 8 10 12 14 16
Gro
wth
(OD
600n
m)
Time (h)
Man
B
0.0
0.5
1.0
1.5
2.0
2.5
3.0
3.5
0 2 4 6 8 10 12 14 16
Gro
wth
(OD
600n
m)
Time (h)
Glc
0.0
0.5
1.0
1.5
2.0
2.5
3.0
3.5
0 2 4 6 8 10 12 14 16
Gro
wth
(OD
600n
m)
Time (h)
Gal
0.0
0.5
1.0
1.5
2.0
2.5
3.0
3.5
0 2 4 6 8 10 12 14 16
Gro
wth
(OD
600n
m)
Time (h)
GlcNAc
0.0
0.5
1.0
1.5
2.0
2.5
3.0
3.5
0 2 4 6 8 10 12 14 16
Gro
wth
(OD
600n
m)
Time (h)
Man
Chapter 2
102
Growth profiles in 80 ml batch cultures using (A) excess substrate concentration (34±2 mM) and (B) a 3-fold lower initial substrate concentration (13±1 mM). Representative growth curves (empty dots) were selected based on the established criterion (see Materials and Methods). The experimental data was fitted using the Gompertz model with all replicates (estimated curve in black dashed line) and the 95% confidence bands (small dashed light grey lines) and 95% predicted bands (big dashed dark grey lines) were determined (see Materials and Methods). Growth was performed at 37ºC, under semi-anaerobic conditions, without pH control (initial pH 6.5). Growth curves are plotted in decimal scale to allow the visual discernment between significantly differences in the growth parameters using the two initial substrate concentrations.
In medium with Gal, growth arrest occurred before substrate depletion,
even for the low Gal concentration (Table 2.2). For the higher sugar
concentrations, a pH decrease of about one unit was observed at the
onset of stationary phase, which is consistent with growth arrest due to
acidification. However, the observed change in pH of 0.5 units does not
explain the arrest of growth in the lower Gal concentration. Even though
a full explanation cannot be put forward, the possession of only low-affinity
Gal importers can be proposed as a cause for growth slow-down with
decreasing Gal concentrations.
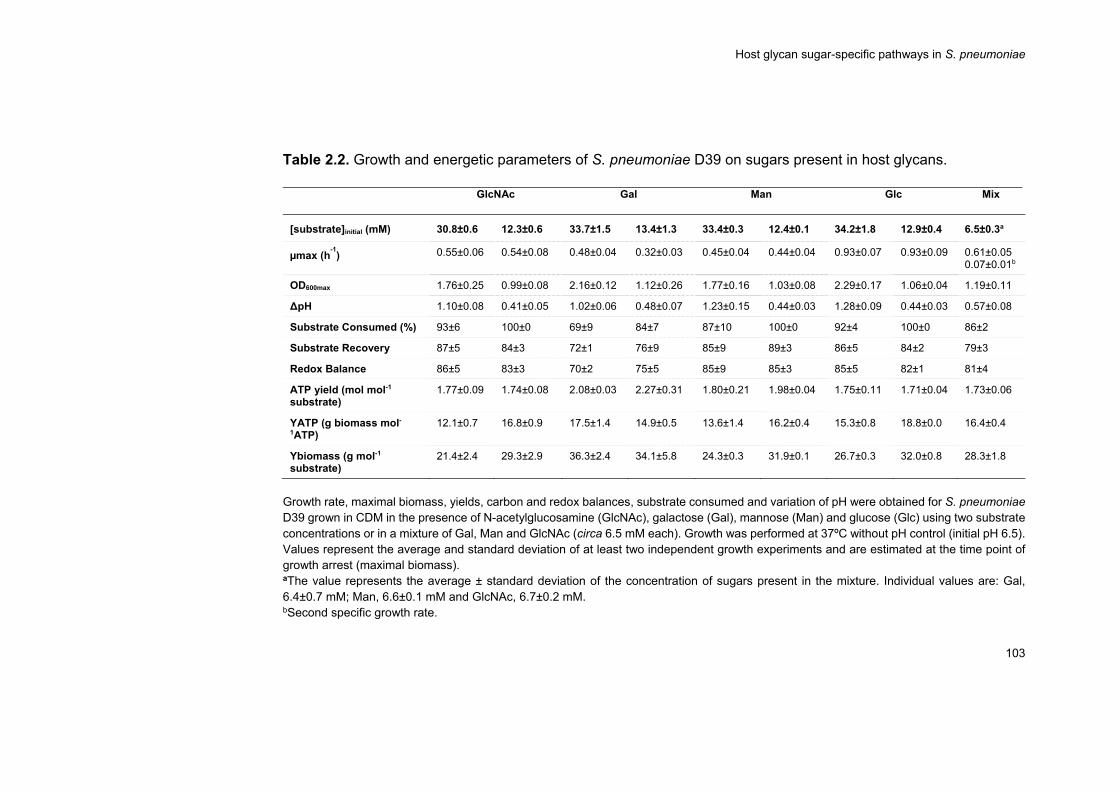
Host glycan sugar-specific pathways in S. pneumoniae
103
Table 2.2. Growth and energetic parameters of S. pneumoniae D39 on sugars present in host glycans.
Growth rate, maximal biomass, yields, carbon and redox balances, substrate consumed and variation of pH were obtained for S. pneumoniae D39 grown in CDM in the presence of N-acetylglucosamine (GlcNAc), galactose (Gal), mannose (Man) and glucose (Glc) using two substrate concentrations or in a mixture of Gal, Man and GlcNAc (circa 6.5 mM each). Growth was performed at 37ºC without pH control (initial pH 6.5). Values represent the average and standard deviation of at least two independent growth experiments and are estimated at the time point of growth arrest (maximal biomass). aThe value represents the average ± standard deviation of the concentration of sugars present in the mixture. Individual values are: Gal, 6.4±0.7 mM; Man, 6.6±0.1 mM and GlcNAc, 6.7±0.2 mM. bSecond specific growth rate.
GlcNAc Gal Man Glc Mix
[substrate]initial (mM) 30.8±0.6 12.3±0.6 33.7±1.5 13.4±1.3 33.4±0.3 12.4±0.1 34.2±1.8 12.9±0.4 6.5±0.3a
µmax (h-1
) 0.55±0.06 0.54±0.08 0.48±0.04 0.32±0.03 0.45±0.04 0.44±0.04 0.93±0.07 0.93±0.09 0.61±0.05 0.07±0.01b
OD600max 1.76±0.25 0.99±0.08 2.16±0.12 1.12±0.26 1.77±0.16 1.03±0.08 2.29±0.17 1.06±0.04 1.19±0.11
ΔpH 1.10±0.08 0.41±0.05 1.02±0.06 0.48±0.07 1.23±0.15 0.44±0.03 1.28±0.09 0.44±0.03 0.57±0.08
Substrate Consumed (%) 93±6 100±0 69±9 84±7 87±10 100±0 92±4 100±0 86±2
Substrate Recovery 87±5 84±3 72±1 76±9 85±9 89±3 86±5 84±2 79±3
Redox Balance 86±5 83±3 70±2 75±5 85±9 85±3 85±5 82±1 81±4
ATP yield (mol mol-1 substrate)
1.77±0.09 1.74±0.08 2.08±0.03 2.27±0.31 1.80±0.21 1.98±0.04 1.75±0.11 1.71±0.04 1.73±0.06
YATP (g biomass mol-1ATP)
12.1±0.7 16.8±0.9 17.5±1.4 14.9±0.5 13.6±1.4 16.2±0.4 15.3±0.8 18.8±0.0 16.4±0.4
Ybiomass (g mol-1 substrate)
21.4±2.4 29.3±2.9 36.3±2.4 34.1±5.8 24.3±0.3 31.9±0.1 26.7±0.3 32.0±0.8 28.3±1.8
Chapter 2
104
ΔpH is the difference between the initial pH and the pH at the time of growth arrest; substrate recovery is the percentage of carbon in metabolized sugar that is recovered in the fermentation products (lactate, ethanol, acetate, and formate); redox balance is the ratio between [lactate]+2×[ethanol] and 2×[substrate consumed] multiplied by 100.
Host glycan sugar-specific pathways in S. pneumoniae
105
Fermentation products.
End-products resulting from the fermentations of Gal, GlcNAc and Man
are shown in Table 2.3. S. pneumoniae displayed a fully homolactic
fermentation profile when GlcNAc was the sole carbon source, regardless
of the initial concentration. In addition to lactate, acetate, ethanol and
formate were produced as minor fermentation products (Table 2.3). On
Man, the fermentation profile was still mainly homolactic. However, a shift
towards mixed acid fermentation was evident, accounting for 9% and 17%
of the substrate consumed in the higher and lower substrate
concentrations, respectively. In contrast, cells grown on Gal showed a
pronounced mixed acid fermentation (Table 2.3), independently of the
initial concentration of sugar. Formate, ethanol and acetate were
produced in the ratio 2:1:1, as expected from mixed acid fermentation
under anaerobic conditions. Lactate was detected as a minor fermentation
product, accounting for 8% and 2% of the consumed Gal, for the higher
and lower substrate concentration, respectively (Table 2.3). The shift
towards mixed acid fermentation profile was generally higher for the lower
substrate concentrations.
The calculated values for substrate recovery are in good agreement
with fermentative metabolism (above 80%). On Gal, carbon balances in
the 70% range were determined, indicating an additional carbon sink
(Table 2.2).

Chapter 2
106
Table 2.3. End-products derived from the catabolism of N-acetylglucosamine (GlcNAc), galactose (Gal), mannose
(Man) and glucose (Glc) by S. pneumoniae D39, using 34±2 mM or 13±1 mM initial substrate concentrations.
Growth was done in CDM supplemented with the appropriate sugar, at 37ºC, under semi-anaerobic conditions, without pH control (initial pH
6.5). The results represent averages of at least two experiments and the error bars the standard deviation.
BDL, below detection limit. In glucose grown cells, formate was produced, but in quantities below the limit of quantification.
Higher substrate concentration Lower substrate concentration
Sugar GlcNAc Man Gal Glc GlcNAc Man Gal Glc
[End-products] (mM)
Lactate 49.02±8.19 43.80±0.11 3.88±0.54 53.10±1.59 19.42±0.35 17.27±1.63 0.50±0.00 20.93±0.29
Acetate 0.92±0.10 2.68±0.17 14.91±1.24 0.83±0.38 0.79±0.14 2.44±0.26 8.43±0.06 0.46±0.12
Ethanol 0.48±0.08 2.66±1.67 14.30±1.53 0.10±0.04 0.42±0.11 1.64±0.43 8.16±0.86 0.08±0.02
Formate 1.62±0.43 5.10±0.75 29.43±1.85 BDL 1.82±0.73 3.77±0.44 16.53±0.84 BDL
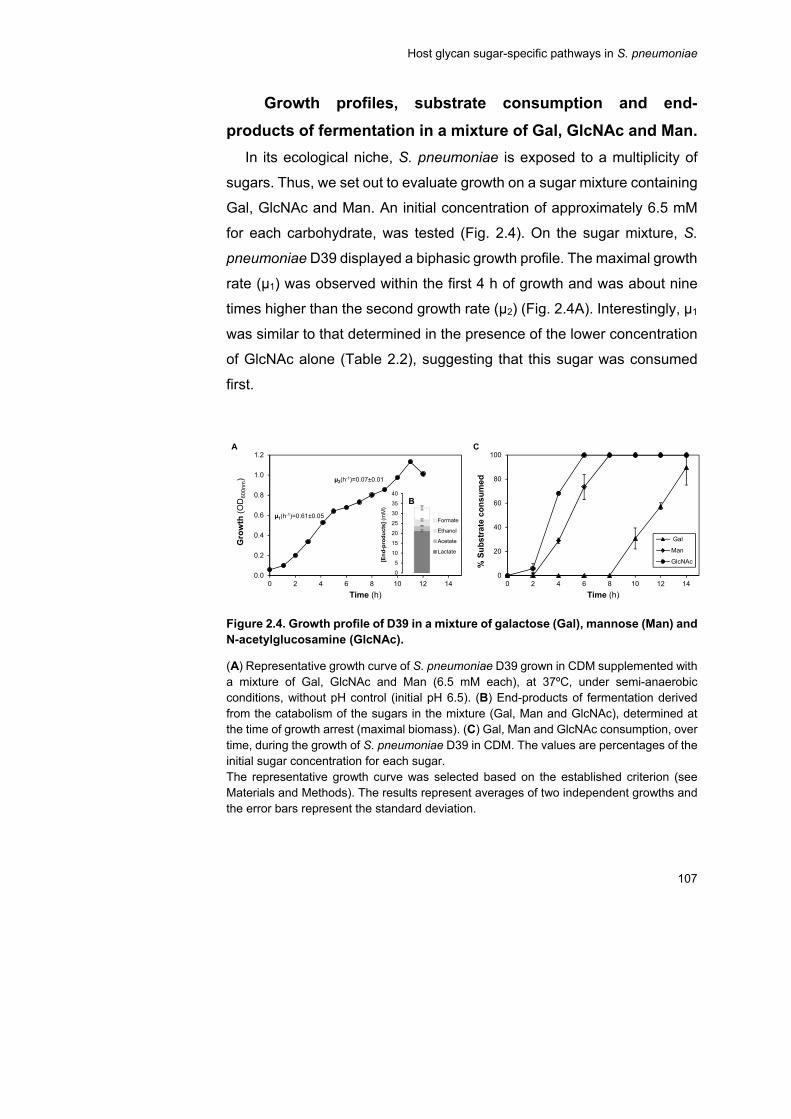
Host glycan sugar-specific pathways in S. pneumoniae
107
Growth profiles, substrate consumption and end-
products of fermentation in a mixture of Gal, GlcNAc and Man.
In its ecological niche, S. pneumoniae is exposed to a multiplicity of
sugars. Thus, we set out to evaluate growth on a sugar mixture containing
Gal, GlcNAc and Man. An initial concentration of approximately 6.5 mM
for each carbohydrate, was tested (Fig. 2.4). On the sugar mixture, S.
pneumoniae D39 displayed a biphasic growth profile. The maximal growth
rate (µ1) was observed within the first 4 h of growth and was about nine
times higher than the second growth rate (µ2) (Fig. 2.4A). Interestingly, µ1
was similar to that determined in the presence of the lower concentration
of GlcNAc alone (Table 2.2), suggesting that this sugar was consumed
first.
Figure 2.4. Growth profile of D39 in a mixture of galactose (Gal), mannose (Man) and N-acetylglucosamine (GlcNAc).
(A) Representative growth curve of S. pneumoniae D39 grown in CDM supplemented with a mixture of Gal, GlcNAc and Man (6.5 mM each), at 37ºC, under semi-anaerobic conditions, without pH control (initial pH 6.5). (B) End-products of fermentation derived from the catabolism of the sugars in the mixture (Gal, Man and GlcNAc), determined at the time of growth arrest (maximal biomass). (C) Gal, Man and GlcNAc consumption, over time, during the growth of S. pneumoniae D39 in CDM. The values are percentages of the initial sugar concentration for each sugar. The representative growth curve was selected based on the established criterion (see Materials and Methods). The results represent averages of two independent growths and the error bars represent the standard deviation.
0.0
0.2
0.4
0.6
0.8
1.0
1.2
0 2 4 6 8 10 12 14
Gro
wth
(OD
600n
m)
Time (h)
0
20
40
60
80
100
0 2 4 6 8 10 12 14
% S
ub
str
ate
co
ns
um
ed
Time (h)
Gal
Man
GlcNAc
µ1(h-1)=0.61±0.05
µ2(h-1)=0.07±0.01
0
5
10
15
20
25
30
35
40
[En
d-p
rod
uct
s] (
mM
)
Formate
Ethanol
Acetate
Lactate
A C
B

Chapter 2
108
The profile of sugar utilization was determined by measuring the
sugars in the culture medium using 1H-NMR (Fig. 2.4C). We confirmed
that GlcNAc was consumed first and was totally depleted after 6 h of
growth. Consumption of Man started while GlcNAc was still available, and
its depletion occurred 8 h after inoculation. Interestingly, Gal was only
used after depletion of GlcNAc and Man. This is in good agreement with
the two distinct growth rates found: the first is related to GlcNAc and Man
consumption, whereas the second mostly reflects the utilization of Gal.
In the sugar mixture, the end-products profile was mainly homolactic,
with lactate as the major product (21.2 ± 0.5 mM) (Fig. 2.4B). Minor
quantities of formate, ethanol and acetate were formed in a proportion of
2:1:1. (Fig. 2.4B). Growth arrest was most likely not due to acidification,
since only a modest change in pH (ΔpH) was registered (Table 2.2). On
the other hand, Gal was not fully consumed, with approximately 40%
remaining in the medium at the time of growth arrest (12 h after
inoculation) (Table 2.2 and Fig. 2.4C). A similar behaviour was observed
when Gal was used as single carbon source. These results demonstrated
that S. pneumoniae D39 is able to metabolize different carbon sources
simultaneously or sequentially. In a mixture consisting of 6.5 mM GlcNAc,
Man and Gal, strain D39 had a preference for GlcNAc, but could use Man
concurrently. Gal was the least preferred sugar, and was only consumed
after exhaustion of the two other carbon sources.
Catabolic pathways for the utilization of Gal, GlcNAc and
Man as assessed using biochemical and molecular tools
Experimental confirmation of the predicted metabolic routes for the
catabolism of Gal, Man and GlcNAc was performed at the biochemical
level through metabolite profiling by 31P-NMR and enzyme activity
measurements, and at the genetic level by mutating key genes in the
pathways.
Host glycan sugar-specific pathways in S. pneumoniae
109
Intracellular metabolites during growth on glycan-derived
sugars.
Ethanol extracts of growing cells were examined for phosphorylated
intermediates of catabolic pathways by targeted metabolomics using 31P-
NMR. In extracts derived from S. pneumoniae D39 Gal-grown cells,
phosphorylated intermediates of the Leloir pathway, α-galactose 1-
phosphate (α-Gal1P) and α-glucose 1-phosphate (α-Glc1P), as well as
phosphorylated metabolites involved in the T6P pathway: galactose 6-
phosphate (Gal6P) and tagatose 1,6-diphosphate (TBP), were detected
(Fig. 2.5), indicating the active presence of both catabolic routes for Gal
catabolism. These data are in agreement with an earlier report for a
different isolate of S. pneumoniae strain D39 [9]. The accumulation of
mannose 6-phosphate (Man6P) during growth on Man is a strong
indication of the functioning of the predicted catabolic route (Figs. 2.1 and
2.5). The intracellular intermediates predicted in the catabolic pathway of
GlcNAc, N-acetylglucosamine 6-phosphate (GlcNAc6P) and glucosamine
6-phosphate (GlcN6P), were detected in the extracts of cells grown on
this carbon source (Figs. 2.1 and 2.5). Surprisingly, fructose 6-phosphate
(F6P) was highly accumulated under this condition.
Thus, the occurrence of specific phosphorylated metabolites in cell
extracts correlated well with the predicted metabolic intermediates in the
catabolism of each sugar.

Chapter 2
110
Figure 2.5. Phosphomonoester region of 31P-NMR spectra of ethanol extracts obtained in late-exponential cells of S. pneumoniae D39 grown in CDM with galactose (Gal), mannose (Man) or N-acetylglucosamine (GlcNAc).
Ethanol extracts of glucose (Glc) grown cells were used as control. The glycolytic intermediates fructose 1,6-biphosphate (FBP), glucose 6-phosphate (G6P) and 3-phosphoglycerate (3-PGA) were firmly assigned. Abbreviations: αGal1P, α-galactose 1-phosphate; αGlc1P, α-glucose 1-phosphate; TBP, tagatose 1,6-diphosphate; Gal6P, galactose 6-phosphate; Man6P, mannose 6-phosphate; GlcN6P, glucosamine 6-phosphate; GlcNAc6P, N-acetylglucosamine 6-phosphate and F6P, fructose 6-phosphate. Identification of phosphorylated intermediates was performed by spiking the ethanol
extracts with pure compounds. Symbols: ( ) FBP, ( ) G6P, ( ) 3-PGA.
*
Host glycan sugar-specific pathways in S. pneumoniae
111
Enzymatic activities of key enzymes involved in the
catabolism of glycan-derived sugars.
To further substantiate the functioning of the predicted pathways, we
selected enzymes presumed to be required for pathway activity,
galactokinase (GalK, SPD_1634) and tagatose 1,6-diphosphate aldolase
(LacD, SPD_1050) for Gal, mannose 6-phosphate isomerase (ManA,
SPD_0641) for Man and N-acetylglucosamine 6-phosphate deacetylase
(NagA, SPD_1866) for GlcNAc, and determined their specific activities
using specific biochemical assays (see Materials and Methods).
On galactose, the specific activities of GalK and LacD in cell-free
extracts of D39 were considerably higher than those measured on Glc-
grown cells (Table 2.4), suggesting induction of the pathway on Gal.
These data are consistent with the functioning of both pathways during
growth on Gal. The GalK specific activity was higher than the LacD
specific activity, under the conditions assayed (Table 2.4).
The specific activity of N-acetylglucosamine 6-phosphate deacetylase
(NagA), the enzyme dedicated to GlcNAc catabolism, was 2-fold higher
when grown on GlcNAc than in Glc-grown cells (Table 2.4). The method
to assay NagA, couples its activity to that of glucosamine 6-phosphate
isomerase (NagB). The latter was not limiting in the assay, since its
specific activity was 4 times higher than that of NagA (data not shown).

Chapter 2
112
Table 2.4. Enzyme specific activities determined in extracts of S.
pneumoniae derived from cells grown to late-exponential phase of growth
in CDM supplemented with different monosaccharides.
Specific activities (U mg protein-1)
Strain
Growth condition (carbon source)
GalK LacD NagA ManA
D39 Gal 0.89 ± 0.11
0.08 ± 0.01 - -
D39 GlcNAc - - 0.04 ± 0.00 -
D39 Man - - - 0.10 ± 0.01
D39 Glc BDL BDL 0.02 ± 0.00 0.07 ± 0.01
D39∆galK Glc BDL - - -
D39∆lacD Gal - BDL - -
D39∆nagA Glc - - BDL -
D39∆manA Glc - - - 0.04 ± 0.01
Specific activity is expressed as units (U) (µmol min-1) per milligram of protein (U mg protein-1). GalK specific activity is defined as the amount of protein required for the formation of 1 μmol of Gal1P min-1 mg protein-1. LacD specific activity is given as the amount of protein required to catalyse the oxidation of 1 µmol of NADH min-1 mg protein-1. NagA and ManA specific activities are the amount of protein to reduce 1 µmol of NADP min-1 mg protein-1. The values reported represent averages ± standard deviation obtained in cell-free extracts of at least two independent cultures. -, not determined. BDL, below detection limit.
The key enzyme of the Man catabolic pathway, ManA, was detected in
Man-grown cells, but the level was only marginally reduced (30%) in Glc-
grown cells (Table 2.4).
In summary, enzyme activities of dedicated sugar catabolic enzymes
were detected for each metabolic pathway assayed, indicating the
operability of the dissimilation routes proposed.
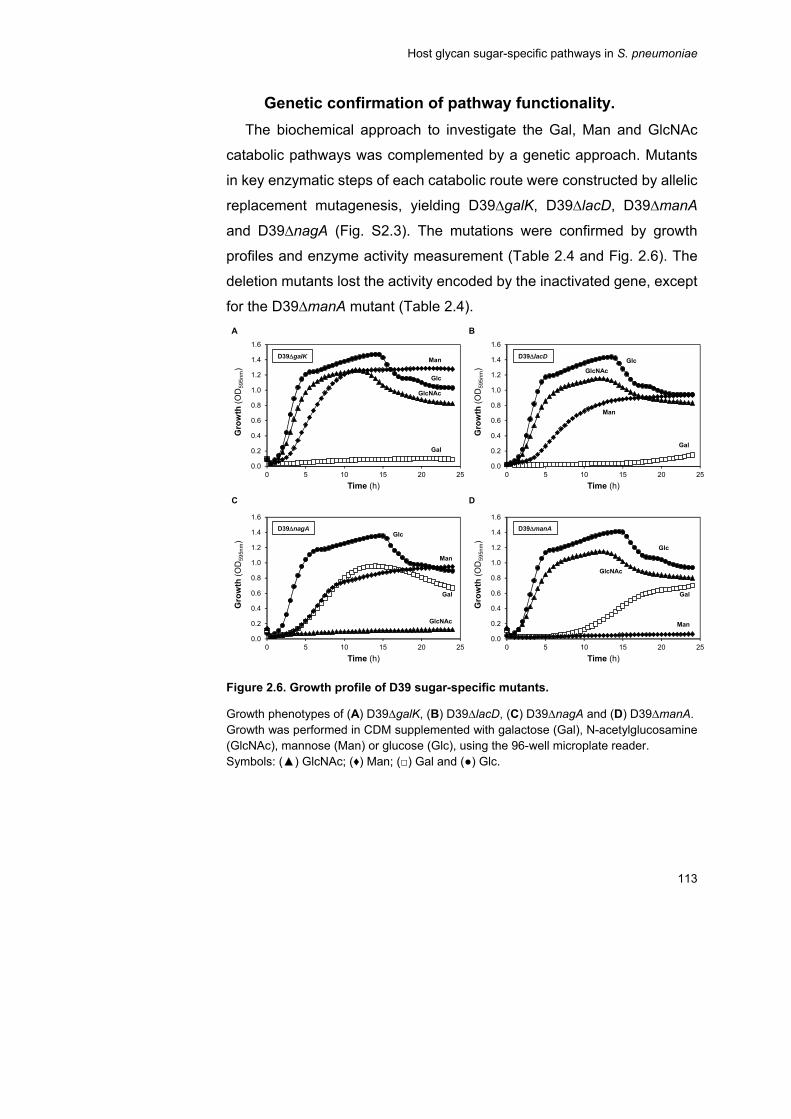
Host glycan sugar-specific pathways in S. pneumoniae
113
Genetic confirmation of pathway functionality.
The biochemical approach to investigate the Gal, Man and GlcNAc
catabolic pathways was complemented by a genetic approach. Mutants
in key enzymatic steps of each catabolic route were constructed by allelic
replacement mutagenesis, yielding D39∆galK, D39∆lacD, D39∆manA
and D39∆nagA (Fig. S2.3). The mutations were confirmed by growth
profiles and enzyme activity measurement (Table 2.4 and Fig. 2.6). The
deletion mutants lost the activity encoded by the inactivated gene, except
for the D39∆manA mutant (Table 2.4).
Figure 2.6. Growth profile of D39 sugar-specific mutants.
Growth phenotypes of (A) D39∆galK, (B) D39∆lacD, (C) D39∆nagA and (D) D39∆manA. Growth was performed in CDM supplemented with galactose (Gal), N-acetylglucosamine (GlcNAc), mannose (Man) or glucose (Glc), using the 96-well microplate reader. Symbols: (▲) GlcNAc; (♦) Man; (□) Gal and (●) Glc.
0.0
0.2
0.4
0.6
0.8
1.0
1.2
1.4
1.6
0 5 10 15 20 25
Gro
wth
(OD
595
nm)
Time (h)
Glc
GlcNAc
Man
Gal
A
D39galK
0.0
0.2
0.4
0.6
0.8
1.0
1.2
1.4
1.6
0 5 10 15 20 25G
row
th(O
D5
95nm
)Time (h)
Glc
GlcNAc
Man
Gal
B
D39lacD
0.0
0.2
0.4
0.6
0.8
1.0
1.2
1.4
1.6
0 5 10 15 20 25
Gro
wth
(OD
595n
m)
Time (h)
Glc
GlcNAc
Man
Gal
D39nagA
0.0
0.2
0.4
0.6
0.8
1.0
1.2
1.4
1.6
0 5 10 15 20 25
Gro
wth
(OD
595n
m)
Time (h)
Glc
GlcNAc
Man
Gal
D39manA
C D

Chapter 2
114
In Glc-grown D39∆manA, the activity of mannose 6-phosphate
isomerase showed a 43% and 60% reduction compared to that in Glc- or
Man-grown wild type D39 cells, respectively (Table 2.4).
Importantly, the D39∆manA or D39∆nagA strains were unable to use
Man or GlcNAc as sole carbon source, respectively (Fig. 2.6C and 6D).
D39∆lacD was able to grow on Gal, although only after a lag period of
circa 20 h (Fig. 2.6B). A mutant in both Gal catabolic pathways was
constructed, D39∆lacD∆galK, which lost the ability to grow on this
monosaccharide. Unexpectedly, inactivation of galK alone resulted in a
strain unable to grow on Gal, even though the T6P pathway was still intact
(Fig. 2.6A). All pathway-specific mutants were able to grow on sugars
other than the substrate of the targeted catabolic pathway (Fig. 2.6). To
ensure that growth abrogation was unrelated to possible polar effects,
complementation studies were conducted (see Materials and Methods,
Fig. S2.4). D39∆manA and D39∆lacD complemented with manA and lacD
under the Zn2+-inducible promoter (PczcD) [54], had fully restored growth
on Man and Gal, respectively. It is worth noting that growth on Man was
better in the complemented D39∆manA as compared to wild type D39,
suggesting that the ManA activity level might be a limiting factor for Man
utilization (Fig. S4D). For the D39∆nagA, the ability to grow on GlcNAc
was recovered by expressing, in trans, nagA under its own promoter (Fig.
S4C).
For D39∆galK, the ability to grow on Gal was not recovered by
complementation in trans with galK. RNA-Seq data [55] showed that galK
is co-transcribed with the downstream gene galT-2 and a polar effect of
the galK deletion on galT-2 is therefore possible (Fig. S2.3). Indeed, the
growth phenotype on Gal could be restored by complementation in trans
with galKgalT-2 (Fig. S4A). Importantly, complementation with galT-2
alone was not successful, suggesting that abrogation of growth on Gal is
a consequence of galK inactivation.
Host glycan sugar-specific pathways in S. pneumoniae
115
To further analyse the effect of gene deletions in the Leloir pathway, a
D39∆galT-2 mutant was constructed. The D39∆galT-2 grew on Gal, but
the time to reach maximal biomass was 2.3-fold longer as compared to
the wild type (data not shown). This result indicates the occurrence of an
alternative galactose 1-phosphate activity, likely to be encoded by galT-1.
On Gal, the expression level of galT-1 in D39∆galT-2 was 49-fold higher
than in D39, as shown by qRT-PCR (Table S2.7). Expression of lacD was
87-fold higher in Gal-grown D39∆galT-2 (Table S2.7) than in Gal-grown
wild type, indicating that in the D39∆galT-2 mutant the lac operon is
expressed and the T6P pathway is active.
Attenuated virulence in the absence of a functional Gal
pathway
The contribution of genes encoding proteins involved in catabolism of
host-derived glycans was tested in mouse models of colonisation, and of
models of bronchopneumonia with bacteraemia that result from intranasal
infection. While the bronchopneumonia model allows evaluation of factors
that are important for acute infection and invasiveness, the colonisation
model is ideal to evaluate the determinants of longer term pneumococcal
survival in vivo [56].
Mice infected with the mutants in Gal catabolic pathways survived
significantly longer than wild type D39 strain in the bronchopneumonia
model (Fig. 2.7A) (average survival time of mice infected with: D39
44±30.7 h, n=20; D39∆galK 60±36.3 h, n=10; D39∆lacD 59±54.1 h, n=10
and D39∆lacD∆galK 123±55.8 h, n=10; p<0.01 for D39∆galK, and
p<0.001 for D39∆lacD and D39∆lacD∆galK; Mann-Whitney U test). In
addition, reintroduction of an intact copy of galK and lacD into D39∆galK
and D39∆lacD, respectively, reconstituted the virulence of these strains
with the median survival times of mice infected with D39∆galKcomp
(44±40.3 h, n=10) and D39∆lacDcomp (51.2±40.3 h, n=10), not

Chapter 2
116
significantly different from the wild type infected cohort (p>0.05). This
shows that the observed reduction in virulence was not due to polar effect
of mutations.
Figure 2.7. Impaired virulence of pneumococcal strains defective in galactose catabolic pathways following intranasal infection.
(A) Survival time of mice after infection with approximately 1 X 10⁶ CFU pneumococci. Symbols show the times mice became severely lethargic. The horizontal bars mark the median times to the severely lethargic state. (B) Growth of bacteria in the blood. Each point is the mean of data from ten mice except for D39, which represents 20 mice. Error bars show the standard error of the mean. Symbols: * p<0.05; ** p<0.01; *** p<0.001.
The progression of bacteraemia in animals infected with the
pneumococcal strains was also determined. At 24 h post-infection mice
infected either with D39∆galK (log10 3.10±0.7, n=10), D39∆lacD (log10
3.54±0.6, n=10), or D39∆lacD∆galK (log10 2.23±0.75, n=10) had
significantly lower mean CFU ml-1 of bacteria in the blood than that of the
wild type infected cohort (log10 5.21±0.4, n=20) (p<0.01 for D39∆galK,
p<0.05 for D39∆lacD, and p<0.001 for D39∆lacD∆galK) (Fig. 2.7B). At 48
h post-infection, the blood bacterial counts recovered from
D39∆lacD∆galK (log10 3.48±1.16, n=10) infected cohort was still
significantly lower than that of the wild type infected (log10 7.76±0.48,
n=20) (p<0.001), however, the numbers of D39∆galK (log10 6.53±0.81,
n=10) and D39∆lacD (log10 5.92±1.13, n=10) were similar to the wild type
B10
Time post-Infection (h)
Lo
g10
CF
U p
er
ml
of
blo
od
8
6
4
2
024 48
D39
∆galK
∆lacD
∆galKcomp
∆lacDcomp
∆lacD∆galK***
***
***
200
150
100
50
0
Su
rviv
al
tim
e (h
)
Strains
***** ***
A
Host glycan sugar-specific pathways in S. pneumoniae
117
(p>0.05). Furthermore, no significant difference could be detected in the
numbers of D39∆galKcomp (24 h: log10 4.47±0.64 and 48 h: log10
6.86±0.82 n=10), D39∆lacDcomp (24 h: log10 3.81±0.86 and 48 h: log10
5.59±1.24 n=10), and the wild type at 24 and 48 h post-infection (p>0.05).
D39∆manA and D39∆nagA were also tested in bronchopneumonia
model, however, the virulence properties of these strains were similar to
the wild type (data not shown).
In the colonisation model, the counts for all the pneumococcal strains
were determined in nasopharyngeal tissue at the time of infection, and at
3 and 7 days after infection (Fig. 2.8). The results show that at 3 and 7
days post-infection the numbers of D39∆galK (log10 1.75±0.14 and log10
1.80±0.17 n=5), D39∆lacD (log10 1.72±0.2 and log10 1.87±0.24, n=5), and
D39∆lacD∆galK (log10 1.08±0.33 and log10 0.89±0.25, n=5) were
significantly lower than the counts of wild type (log10 2.82±0.02; and log10
2.77±0.08, n=5, for days 3 and 7, respectively) (p<0.01 for D39∆galK,
p<0.0001 for D39∆lacD∆galK, and p<0.01 and p<0.05 for D39∆lacD for
3 and 7 days post-infection, respectively).
Similar to the bronchopneumonia model, in the colonisation model no
phenotypic differences were observed between the wild type and
D39galKcomp, D39lacDcomp (Fig. 2.8) (p>0.05), and the wild type and
D39∆manA and D39∆nagA (data not shown).
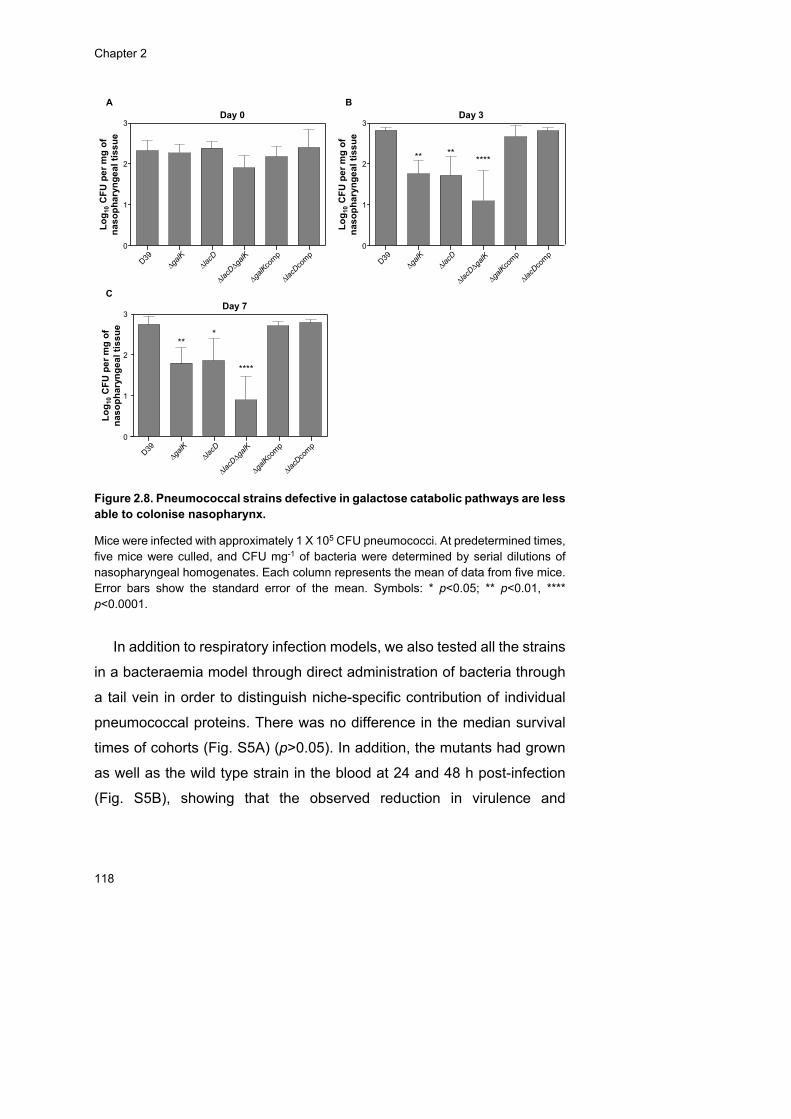
Chapter 2
118
Figure 2.8. Pneumococcal strains defective in galactose catabolic pathways are less able to colonise nasopharynx.
Mice were infected with approximately 1 X 10⁵ CFU pneumococci. At predetermined times, five mice were culled, and CFU mg-1 of bacteria were determined by serial dilutions of nasopharyngeal homogenates. Each column represents the mean of data from five mice. Error bars show the standard error of the mean. Symbols: * p<0.05; ** p<0.01, **** p<0.0001.
In addition to respiratory infection models, we also tested all the strains
in a bacteraemia model through direct administration of bacteria through
a tail vein in order to distinguish niche-specific contribution of individual
pneumococcal proteins. There was no difference in the median survival
times of cohorts (Fig. S5A) (p>0.05). In addition, the mutants had grown
as well as the wild type strain in the blood at 24 and 48 h post-infection
(Fig. S5B), showing that the observed reduction in virulence and
Lo
g10
CF
U p
er
mg
of
nas
op
ha
ryn
ge
al
tiss
ue
1
0
2
3Day 0
A
Lo
g10
CF
U p
er
mg
of
nas
op
ha
ryn
ge
al
tiss
ue
1
0
2
3
** ******
Day 3B
Lo
g10
CF
U p
er
mg
of
nas
op
ha
ryn
ge
al
tis
su
e
1
0
2
3Day 7
***
****
C

Host glycan sugar-specific pathways in S. pneumoniae
119
colonisation in D39∆galK, D39∆lacD and D39∆lacD∆galK was specific to
the respiratory tract.
Overall, the results showed that Gal catabolic mutants, particularly
D39∆lacD∆galK, were attenuated in the ability to colonise the
nasopharynx and have reduced virulence in a respiratory infection mouse
model.
Discussion and Conclusions
The study of S. pneumoniae has been heavily focused on factors that
directly impinge on host-pathogen interactions, such as toxins, cell wall
components, adhesins and capsule [3]. In contrast, investigation of
pneumococcal physiology has only recently been addressed, in spite of it
being a fundamental aspect of pneumococcal survival in vivo. This
important pathogen is a strictly fermentative organism, which possesses
one of the highest genomic abundances of genes encoding sugar
transporters [6,7,24]. Thus, we surmised that the ability to take up and
metabolize sugars is of key importance for the lifestyle of S. pneumoniae.
Our view is strongly supported by previous studies consistently identifying
genes involved in sugar catabolism as essential for virulence [11,57–61]
as well as reports showing that sugar transporters contribute to S.
pneumoniae colonisation and disease [16,62–64]. In the nasopharynx
free sugars are scarce, but recent findings indicate that sugars derived
from deglycosylation provide suitable carbon and energy sources for
nasopharyngeal growth [12,14,15]. In order to understand the role of
different host derived sugars in pneumococcal lifestyle and pathogenicity,
we followed a top-down approach to identify, establish and validate
functional sugar-specific catabolic pathways implicated in the utilization of
Chapter 2
120
sugars that may originate from glycan deglycosylation and evaluated the
impact of sugar-specific pathways on the ability to colonise and cause
disease in vivo.
Despite the vast diversity of host glyconjugates, their glycan portions
are often composed of the monosaccharides GalNAc, Gal, NeuNAc,
GlcNAc, Fuc, Man, Glc and fructose. While the first five sugars are
widespread in both N- and O-glycans (e.g. mucins), the other three are
generally restricted to N-glycans. S. pneumoniae can grow on mucin as
sole carbon source [12]. This ability is associated to a range of
glycosidases that hydrolyse the mucins releasing to the medium
neuraminic acids (NeuNAc and N-glycolylneuraminic acid), Gal and
GalNAc, and to a less extent also GlcNAc and Fuc [14]. From our own
analysis of the genomic content and the work of others [8,9,14,39,49,63],
S. pneumoniae D39 harbours genes to potentially catabolise the glycan
components Gal, GlcNAc, NeuNAc and Man. A bias towards utilization of
the monosaccharide Gal and GlcNAc by S. pneumoniae D39 during
growth on an O-glycan was hypothesised, since the monosaccharides
account respectively for 14% and 30% (wt/vol) of the mucin [14].
Furthermore, S. pneumoniae is equipped with the machinery to utilize
those constituents including glycosidases (at least two galactosidases,
BgaA and BgaC, and a N-acetylglucosaminidase StrH [14,20,65,66]),
putative transporters and catabolic genes (Table S2.4). This hypothesis
was corroborated in a transcriptome analysis comparing gene expression
of cells growing on porcine gastric mucin to Glc. Of the genes showing
significant increased expression on mucin, the vast majority was
implicated in the uptake and internal metabolism of Gal (25% of genes
involved in sugar metabolism (Table 2.1)), and GlcNAc. Of note, mucin
highly induced the expression of bgaA and strH encoding a β-
galactosidase and a β-N-acetylglucosaminidase, whose activities result in
free Gal and GlcNAc, respectively [18,65–68]. Growth of S. pneumoniae
Host glycan sugar-specific pathways in S. pneumoniae
121
on mucin was shown to reduce by 30% the content in Gal of the
glycoprotein, while the content in GlcNAc was not altered. This was
rationalized as resulting from the complex structure of mucin, in which
GlcNAc residues might be masked by other sugars.
Genes associated with the transport of Man, a monosaccharide
generally found in N-glycans, were also upregulated in mucin. Like Gal
and GlcNAc, Man could sustain growth of S. pneumoniae D39 in a
chemically defined medium (Fig. 2.2). Whether all the transporters
upregulated show affinity for mannose remains to be investigated. Activity
of α-mannosidase has been described for S. pneumoniae and
homologues of previously characterized streptococcal mannosidase
genes are found in the genome of D39 [69–71], but these genes were not
differentially expressed in mucin-grown cells.
Previously, it was shown that growth on mucin required the activity of
neuraminidase A (NanA) [12]. Initial removal of terminal NeuNAc seems
to be essential for further breakdown by other glycosidases and
subsequent utilization of the glycan-derived sugars [14,18,72]. In our
study, neuraminidase A was not significantly induced in presence of
mucin as compared to Glc, which leads us to propose that its constitutive
expression is sufficient to ensure the activity level to remove terminal
NeuNAc. Furthermore, we (and others) verified that NeuNAc cannot
sustain growth of strain D39 in chemically defined medium, most likely
due to a frame shift mutation in the N-acetylneuraminate lyase gene of the
nanAB operon [8]. The mucin derivatives GalNAc and Fuc also failed to
support growth of S. pneumoniae. For GalNAc we could not firmly identify
genes encoding the activities converting N-acetylgalactosamine 6-
phosphate to tagatose 6-phosphate, although genes with homology to E.
coli counterparts are present in the genome (Text S2.2). Genes implicated
in the downstream processing of L-lactaldehyde, the product of L-fuculose
phosphate aldolase in the Fuc pathway, were not found (Text S2.2) [8].
Chapter 2
122
This inability to identify the full catabolic pathways for Fuc and GalNAc is
in good agreement with previous reports that S. pneumoniae is unable to
grow on these sugars as sole carbon sources [8,50–52].
Overall, our integrated approach combining genomic, transcriptomic
and growth data identified Gal, GlcNAc and Man as the glycan-originating
monosaccharides more likely to be used as substrates for growth of S.
pneumoniae D39 in the respiratory tract.
The predicted routes for Gal, GlcNAc and Man dissimilation in S.
pneumoniae D39 (Fig. 2.1) were validated at the biochemical and genetic
level in this study.
Mannose
The phosphorylated intermediate Man6P accumulated to high levels in
exponential cells and the activity of Man6P isomerase (ManA) was
induced by Man. A manA mutant was unable to grow on Man, even though
mannose 6-phosphate isomerase activity was detected to a certain extent
in the loss-of-function mutant. Homologues of genes coding for ManA or
other known Man6P isomerases were not found in the genome of D39,
suggesting that the residual isomerase activity is non-specific, and
insufficient to support growth on Man, as shown in Fig. 2.6D. Of interest,
a strain expressing manA in trans under the control of an inducible zinc
promoter showed better growth than the wild type D39, suggesting a
bottleneck at the level of ManA. This observation is further supported by
the high accumulation of Man6P during growth on Man.
N-acetylglucosamine
Both intermediates for the catabolism of GlcNAc, GlcNAc6P and
GlcN6P, were present in exponentially-growing cells. Furthermore, the
activity of GlcNAc6P deacetylase was induced by GlcNAc. A nagA mutant
lost the ability to grow on the amino sugar, and the growth could be
restored by in trans complementation. In other bacteria GlcNAc can be
taken up via PTS or non-PTS transporters [73–78]. A recent report

Host glycan sugar-specific pathways in S. pneumoniae
123
indicated that S. pneumoniae internalizes this amino sugar exclusively via
PTS transporter(s) [8], and this has been confirmed for strain D39 (A. M.
Cavaleiro, P. Gaspar, T. Kloosterman, O. P. Kuipers and A. R. Neves,
unpublished data).
Galactose
In a previous study using a different isolate of S. pneumoniae D39, we
reported activity of both the Leloir and the T6P pathways in the utilization
of Gal, since intermediates of both pathways (α-Gal1P and α-Glc1P from
the Leloir and TBP from the T6P pathway) were observed during growth
on Gal [9], and this was confirmed with D39 isolate used in the present
study. Specific activities of enzymes for the Leloir (galactokinase, GalK)
or T6P (tagatose 1,6-diphosphate aldolase, LacD) pathways were
detected during growth on Gal, but not on Glc. This result for GalK and
LacD contrasts with the activities of the other enzymes tested (NagA and
ManA), which showed activity also when grown on Glc and not only on
their dedicated sugars (Table 2.4). These findings may be explained by
the fact that both NagA and ManA are involved in cellular processes other
than the catabolism of the monosaccharides, such as providing
precursors for biosynthesis. Inactivation of both galK and lacD in D39
rendered the pneumococcus unable to grow on Gal. Surprisingly,
inactivation of galK alone abolished growth on Gal, whereas exponential
growth of a lacD mutant was observed although only after a long lag
phase. The behavior of the lacD mutant can be partially explained in the
context of carbon catabolite repression. The Leloir genes are under strong
negative control by the carbon catabolite protein A, CcpA [9], thus
alleviation of the repression is required before the pathway is activated. In
line with this conclusion, in D39 Glc-grown cells the activity of
galactokinase was undetectable. Catabolism via the Leloir pathway is
normally associated with uptake of Gal via a non-PTS permease
(secondary carriers or ABC transporters). Bidossi et al. [8], implicated the

Chapter 2
124
ABC transporter SPD_0088-9-90 CUT1 in the uptake of Gal. On the other
hand, a Lactococcus lactis strain exclusively harboring the Leloir pathway,
inactivated for the Gal permease, translocates Gal by a PTS and the
resulting Gal6P enters the Leloir pathway upon dephosphorylation by a
phosphatase [79]. The same could be active in S. pneumoniae, however,
exclusive transport via the PTS is not in agreement with the observations
that S. pneumoniae G54 and DP1004 devoid of PTS activity (ptsI mutants)
are capable of growing on Gal [8]. Interestingly, a D39 ptsI mutant shows
good growth on Gal, but only after a lag phase of about 11 h (A. M.
Cavaleiro, P. Gaspar, T. Kloosterman, O. P. Kuipers and A. R. Neves,
unpublished data). In light of these results, we propose that induction of
an adequate transport system, presumably a non-PTS type, and
alleviation of the carbon catabolite repression exerted over the Leloir
genes are strict requirements for Gal dissimilation via the Leloir pathway
in S. pneumoniae D39. Our hypothesis is in agreement with the
elimination of the lag phase upon subculturing of the lacD strain on Gal
containing-medium (Fig. S2.6). While the residual growth on Gal in the lacD mutant can be attributed
to activation of the Leloir pathway, we do not know why growth on Gal is
totally abolished in the galK mutant. A plausible explanation relies on the
unintentional elimination of Gal1P uridylyltransferase (GalT) activity that
provides essential precursors for the biosynthesis of structural
polysaccharides. Indeed, inactivation of galK affected the expression of
galT-2, and reversion of the galK mutant to the wild type phenotype on
Gal required complementation with both galK and galT-2. However,
inability to grow on Gal could be largely attributed to the galK mutation,
since expression in trans of galT-2 did not restore growth and a galT-2
mutant was able to grow on Gal (data not shown). In the latter mutant,
expression of galT-1 was substantially increased, indicating that the
product of the duplicated gene accounts for the lost GalT-2 activity, thus

Host glycan sugar-specific pathways in S. pneumoniae
125
restoring the Leloir pathway functionality. Based on our data, we therefore
conclude that Gal metabolism in S. pneumoniae requires an operational
Leloir pathway, or at least an active galactokinase.
In other streptococci, efficient dissimilation of Gal has been associated
with the presence of a high affinity specific Gal transporter [80,81].
According to Bidossi et al. [8], the PTS transporters implicated in the
import of Gal in S. pneumoniae are the mannose-family PTS (ManMNL),
a galactitol-family PTS (SPD_0559-0-1) and probably a mannose-family
PTS (SPD_0066-7-8-9). In addition, our team showed that lacFE genes
are induced by Gal, suggesting a potential contribution of the lactose-PTS
to the uptake of the sugar [9]. Interestingly, the galactitol-family PTS,
which has previously been implicated in Gal uptake [8,53], is a homologue
of the specific galactose-PTS identified in Streptococcus gordonii,
Streptococcus mutans and Streptococcus oligofermentans [80–82].
However, the affinity of this putative galactose-specific PTS for Gal is
seemingly not very high, as noted by markedly decreased growth rates at
low Gal concentration and the inability to fully scavenge Gal from the
culture medium (Fig. 2.3 and Table 2.2). The absence of high-affinity
PTSs would certainly be a bottleneck for efficient functionality of the T6P
pathway, but cannot fully explain the galK phenotype. Moreover, the
uptake of Gal via a PTS system ensures a typical PTS-mediated signal
transduction pathway for CcpA regulation and renders Gal an effective
inducer of catabolite repression [9]. Of note, our team has previously
reported that CcpA repression of key metabolic genes (Leloir pathway and
fermentative pathways) is counterbalanced by a Gal-dependent activation
[9]. In view of the results with the galK mutant we propose that
galactokinase activity is essential for Gal catabolism, and that its product,
α-Gal1P, is likely to be the inducer of gene expression. Collectively, our
data provide evidence that utilization of Gal in S. pneumoniae is subject
to complex regulation and of a subtle regulatory link between the Leloir
Chapter 2
126
and the T6P pathways. Unravelling these regulatory mechanisms
certainly deserves future investigations.
Growth in non-preferential sugars is usually associated with mixed acid
fermentation profiles [83,84]. This is indeed the case for S. pneumoniae
D39 growing on Gal as sole carbon source (Table 2.3; [9]). Unexpectedly,
growth on the other slowly metabolizable monosaccharide, Man, resulted
in only a modest shift towards mixed acid products suggesting a different
regulation of the central carbon pathways in the presence of Man. The
underlying mechanisms are, however, out of the scope of this work and
will be further investigated in the future.
We hypothesised that the ability to efficiently use monosaccharides
originating from mucins conferred on S. pneumoniae a metabolic
advantage during colonisation and subsequent invasive states. S.
pneumoniae strains defective in Gal catabolic genes, and in particular the
double mutant, D39∆lacD∆galK, presented impaired ability to colonise the
murine nasopharynx and had reduced virulence. Inactivation of nagA or
manA had no significant effect in test mice. Importantly, direct
administration of the Gal mutants into the bloodstream induced responses
of the same magnitude (similar survival times and CFU per ml of blood)
as the wild type D39 strain. In the bloodstream the main sugar present is
Glc [10,11], and thus the Gal-deficient phenotype was not expected to
have any impact. Furthermore, this finding adds to the importance of Gal
metabolism in the airways, further supporting the view connecting Gal
metabolism in S. pneumoniae to its virulence in this niche.
At first glance, the inefficient Gal metabolism and the observation that
Gal is a less preferred sugar compared to Man and GlcNAc in vitro, seems
to be in conflict with the role of Gal genes in colonisation and virulence.
The lack of correlation between sugar preferences in vitro and the effect
of mutations in specific sugar catabolic pathways in vivo has been
reported before for E. coli [85]. This apparent inconsistency might arise
Host glycan sugar-specific pathways in S. pneumoniae
127
from the multifactorial milieu in host niches. Furthermore, we showed that
Gal catabolic genes represent the largest fraction of genes induced by
mucin and others had previously established that Gal is widespread and
abundant in the airway glycoconjugates (e.g. mucins). The relevance of
Gal acquisition and metabolism had been previously suggested. Indeed,
loss of beta-galactosidase activity, resulted in attenuated pneumococcal
growth in the nasopharynx [14], and mutants defective in pyruvate formate
lyase, an enzyme essential for Gal fermentation, were attenuated in
virulence [39]. Furthermore, using Tn-seq in S. pneumoniae TIGR4 van
Opijnen et al. [86] identified lacD as relevant for pneumococcal fitness in
the nasopharynx. In addition, they also showed that both galK and lacD
played a critical role for fitness of TIGR4 during in vitro growth on Gal. In
S. pneumoniae D39, galK is essential for growth on Gal, while loss of lacD
causes a long lag phase prior to exponential growth. The different results
in the two studies most likely derive from using different serotypes (D39
vs. TIGR4) or different experimental conditions for growth of S.
pneumoniae. Nevertheless, both studies highlight the relevance of Gal
and its catabolism in the airways.
In light of these results we propose that pneumococcal Gal metabolism
is of key importance during colonisation and throughout the transition from
carriage to an invasive state. The loss of fitness in the Gal mutants can
be due to metabolic impairment and deficient expression of specific
virulence traits induced by Gal. We have previously reported that Gal-
grown cells produce twice as much capsule as Glc-grown cells [9], and it
has been reported that a thicker capsule allows evasion from immune
system and from initial mucociliary clearance in vivo [87]. On Gal, the
carbon balance was lower than on other sugars, but no other end-
products/metabolites were detected, thus we propose that Gal is directed
to processes other than fermentation such as the polysaccharide
synthesis [9]. Whether it is the capsule or other factors such as increased
Chapter 2
128
carbon availability that determines the Gal-associated virulence remains
to be investigated.
In summary, we followed a multidisciplinary approach to identify the
monosaccharides in host glycoproteins that serve as carbon sources for
growth of S. pneumoniae strain D39. Accumulating evidence connects
pathogenesis to carbohydrate metabolism, and the findings herein
presented further strengthen this view as we specifically show that
mutants in Gal catabolic genes showed attenuated ability to colonise and
reduced virulence following intranasal infection in mouse models. With
widespread antibiotic resistance and re-emergence of non-type vaccine
strains, it is urgent that new targets are found for the development of novel
therapeutic and preventive drugs. One such opportunity is perhaps
offered by the discovery of Gal as an “essential” nutrient for pneumococcal
growth and persistence in the host. The Leloir and the tagatose 6-
phosphate pathways are present and conserved across pneumococcal
serogroups (Table S2.8) supporting our suggestion that Gal catabolism
could be a potential target for novel therapeutics.
Acknowledgments
This work was supported by Fundação para a Ciência e a Tecnologia,
Portugal (FCT) and FEDER, project PTDC/SAU-MII/100964/2008, and
through grants PEst-OE/EQB/LA0004/2011 and IDMEC, under LAETA
Pest-OE/EME/LA0022. L. Paixão, E. C. Lourenço and A. Veríssimo
acknowledge FCT for the award of Ph.D. grants SFRH/BD/46997/2008,
SFRH/47702/2008 and SFRH/BD/97415/2013, respectively. M. Kjos was
supported by a FEBS Long-term fellowship. Work in the lab of J.-W.
Veening was supported by European Research Council Starting grant
Host glycan sugar-specific pathways in S. pneumoniae
129
(337399-PneumoCell) and a Vidi fellowship (864.12.001) from the
Netherlands Organisation for Scientific Research (NWO-ALW). S. Vinga
acknowledges support by Program Investigator FCT (IF/00653/2012)
from FCT, co-funded by the European Social Fund (ESF) through the
Operational Program Human Potential (POPH). The NMR spectrometers
are part of The National NMR Facility, supported by Fundação para a
Ciência e a Tecnologia (RECI/BBB-BQB/0230/2012)
Ricardo Sequeira is acknowledged for his support with acquiring and
analysing the 31P-NMR spectra of cell-free extracts. Dr Adam Witney is
acknowledged for his support with depositing microarray data. Anne de
Jong is acknowledged for his support in the blast search of galactose
pathways across pneumococcal genomes.
Author’s contribution
L. Paixão contributed to the design of all the experiments. She performed
and analysed experiments as follows:
Growth Experiments:
Performed: L. Paixão and J. Oliveira
Quantification of end-products formation and sugar consumption by HPLC
and NMR: L. Paixão
Estimation of growth and energetic parameters: L. Paixão
Statistical Analysis:
Performed: L. Paixão and S. Vinga
Simulation analysis of the growth experiments:
Performed: A. Veríssimo and S. Vinga
Construction of loss-of-function mutants:
Performed: L. Paixão and J. Oliveira
Chapter 2
130
Complementation studies:
Performed: L. Paixão and M. Kjos
Transcriptome Analysis:
Analysed: L. Paixão and H. Yesilkaya
qRT-PCR
Performed: H. Yesilkaya
Analysed: L. Paixão
In silico analysis:
L. Paixão and A.R. Neves
Cold Ethanol extracts and intracellular metabolites determination:
Performed: R. Sequeira
Analysed: A.R. Neves
Enzyme Activities:
Designed and Performed: L. Paixão
In vivo analysis of pneumococcal strains:
Performed: H. Yesilkaya, V.E. Fernandes
Analysis: H. Yesilkaya, V.E. Fernandes, L. Paixão
Chemical synthesis of phosphorylated metabolites TBP and
GlcNAc6P:
Designed and Performed: E.C. Lourenço and M.R. Ventura
All authors contributed to the critical reading of this chapter.
References
1. Kadioglu A. Upper and lower respiratory tract infection by Streptococcus pneumoniae is affected by pneumolysin deficiency and differences in capsule type. Infect Immun. 2002;70: 2886–2890. doi:10.1128/IAI.70.6.2886-2890.2002
2. Hava DL, LeMieux J, Camilli A. From nose to lung: the regulation behind Streptococcus pneumoniae virulence factors: Virulence gene regulation in S. pneumoniae. Mol Microbiol. 2003;50: 1103–1110. doi:10.1046/j.1365-2958.2003.03764.x
Host glycan sugar-specific pathways in S. pneumoniae
131
3. Kadioglu A, Weiser JN, Paton JC, Andrew PW. The role of Streptococcus pneumoniae virulence factors in host respiratory colonization and disease. Nat Rev Microbiol. 2008;6: 288–301. doi:10.1038/nrmicro1871
4. Bogaert D, de Groot R, Hermans P. Streptococcus pneumoniae colonisation: the key to pneumococcal disease. Lancet Infect Dis. 2004;4: 144–154. doi:10.1016/S1473-3099(04)00938-7
5. Weiser JN. The pneumococcus: why a commensal misbehaves. J Mol Med (Berl). 2010;88: 97–102. doi:10.1007/s00109-009-0557-x
6. Hoskins J, Alborn WE, Arnold J, Blaszczak LC, Burgett S, DeHoff BS, et al. Genome of the bacterium Streptococcus pneumoniae strain R6. J Bacteriol. 2001;183: 5709–5717. doi:10.1128/JB.183.19.5709-5717.2001
7. Tettelin H, Nelson KE, Paulsen IT, Eisen JA, Read TD, Peterson S, et al. Complete genome sequence of a virulent isolate of Streptococcus pneumoniae. Science. 2001;293: 498–506. doi:10.1126/science.1061217
8. Bidossi A, Mulas L, Decorosi F, Colomba L, Ricci S, Pozzi G, et al. A functional genomics approach to establish the complement of carbohydrate transporters in Streptococcus pneumoniae. Miyaji EN, editor. PLoS ONE. 2012;7: e33320. doi:10.1371/journal.pone.0033320
9. Carvalho SM, Kloosterman TG, Kuipers OP, Neves AR. CcpA ensures optimal metabolic fitness of Streptococcus pneumoniae. Horsburgh MJ, editor. PLoS ONE. 2011;6: e26707. doi:10.1371/journal.pone.0026707
10. Philips BJ, Meguer J-X, Redman J, Baker EH. Factors determining the appearance of glucose in upper and lower respiratory tract secretions. Intensive Care Med. 2003;29: 2204–2210. doi:10.1007/s00134-003-1961-2
11. Shelburne SA, Davenport MT, Keith DB, Musser JM. The role of complex carbohydrate catabolism in the pathogenesis of invasive streptococci. Trends Microbiol. 2008;16: 318–325. doi:10.1016/j.tim.2008.04.002
12. Yesilkaya H, Manco S, Kadioglu A, Terra VS, Andrew PW. The ability to utilize mucin affects the regulation of virulence gene expression in Streptococcus pneumoniae. FEMS Microbiol Lett. 2008;278: 231–235. doi:10.1111/j.1574-6968.2007.01003.x
13. Rose MC, Voynow JA. Respiratory tract mucin genes and mucin glycoproteins in health and disease. Physiol Rev. 2006;86: 245–278. doi:10.1152/physrev.00010.2005
14. Terra VS, Homer KA, Rao SG, Andrew PW, Yesilkaya H. Characterization of novel β-galactosidase activity that contributes to glycoprotein degradation and virulence in Streptococcus pneumoniae. Infect Immun. 2010;78: 348–357. doi:10.1128/IAI.00721-09
15. Burnaugh AM, Frantz LJ, King SJ. Growth of Streptococcus pneumoniae on human glycoconjugates is dependent upon the sequential activity of bacterial exoglycosidases. J Bacteriol. 2008;190: 221–230. doi:10.1128/JB.01251-07
16. Marion C, Stewart JM, Tazi MF, Burnaugh AM, Linke CM, Woodiga SA, et al. Streptococcus pneumoniae can utilize multiple sources of hyaluronic acid for growth. Infect Immun. 2012;80: 1390–1398. doi:10.1128/IAI.05756-11
17. King SJ. Pneumococcal modification of host sugars: a major contributor to colonization of the human airway? Mol Oral Microbiol. 2010;25: 15–24. doi:10.1111/j.2041-1014.2009.00564.x
Chapter 2
132
18. King SJ, Hippe KR, Weiser JN. Deglycosylation of human glycoconjugates by the sequential activities of exoglycosidases expressed by Streptococcus pneumoniae. Mol Microbiol. 2006;59: 961–974. doi:10.1111/j.1365-2958.2005.04984.x
19. Marion C, Limoli DH, Bobulsky GS, Abraham JL, Burnaugh AM, King SJ. Identification of a pneumococcal glycosidase that modifies O-linked glycans. Infect Immun. 2009;77: 1389–1396. doi:10.1128/IAI.01215-08
20. Jeong JK, Kwon O, Lee YM, Oh D-B, Lee JM, Kim S, et al. Characterization of the Streptococcus pneumoniae BgaC protein as a novel surface β-galactosidase with specific hydrolysis activity for the Galβ1-3GlcNAc moiety of oligosaccharides. J Bacteriol. 2009;191: 3011–3023. doi:10.1128/JB.01601-08
21. Brittan JL, Buckeridge TJ, Finn A, Kadioglu A, Jenkinson HF. Pneumococcal neuraminidase A: an essential upper airway colonization factor for Streptococcus pneumoniae: Streptococcus pneumoniae neuraminidase. Mol Oral Microbiol. 2012;27: 270–283. doi:10.1111/j.2041-1014.2012.00658.x
22. Tong HH, Blue LE, James MA, DeMaria TF. Evaluation of the virulence of a Streptococcus pneumoniae neuraminidase-deficient mutant in nasopharyngeal colonization and development of otitis media in the chinchilla model. Infect Immun. 2000;68: 921–924.
23. Manco S, Hernon F, Yesilkaya H, Paton JC, Andrew PW, Kadioglu A. Pneumococcal neuraminidases A and B both have essential roles during infection of the respiratory tract and sepsis. Infect Immun. 2006;74: 4014–4020. doi:10.1128/IAI.01237-05
24. Lanie JA, Ng W-L, Kazmierczak KM, Andrzejewski TM, Davidsen TM, Wayne KJ, et al. Genome sequence of Avery’s virulent serotype 2 strain D39 of Streptococcus pneumoniae and comparison with that of unencapsulated laboratory strain R6. J Bacteriol. 2007;189: 38–51. doi:10.1128/JB.01148-06
25. Carvalho SM, Kuipers OP, Neves AR. Environmental and nutritional factors that affect growth and metabolism of the pneumococcal serotype 2 strain D39 and its nonencapsulated derivative strain R6. Horsburgh MJ, editor. PLoS ONE. 2013;8: e58492. doi:10.1371/journal.pone.0058492
26. Zwietering MH, Jongenburger I, Rombouts FM, van ’t Riet K. Modeling of the bacterial growth curve. Appl Environ Microbiol. 1990;56: 1875–1881.
27. Veríssimo A, Paixão L, Neves A, Vinga S. BGFit: management and automated fitting of biological growth curves. BMC Bioinformatics. 2013;14: 283. doi:10.1186/1471-2105-14-283
28. Johansen E, Kibenich A. Isolation and characterization of IS1165, an insertion sequence of Leuconostoc mesenteroides subsp. cremoris and other lactic acid bacteria. Plasmid. 1992;27: 200–206.
29. Song J-H, Ko KS, Lee J-Y, Baek JY, Oh WS, Yoon HS, et al. Identification of essential genes in Streptococcus pneumoniae by allelic replacement mutagenesis. Mol Cells. 2005;19: 365–374.
30. Kloosterman TG. To have neighbour’s fare: extending the molecular toolbox for Streptococcus pneumoniae. Microbiology. 2006;152: 351–359. doi:10.1099/mic.0.28521-0
31. Overkamp W, Beilharz K, Detert Oude Weme R, Solopova A, Karsens H, Kovacs AT, et al. Benchmarking various green fluorescent protein variants in Bacillus subtilis, Streptococcus pneumoniae, and Lactococcus lactis for live cell imaging. Appl Environ Microbiol. 2013;79: 6481–6490. doi:10.1128/AEM.02033-13

Host glycan sugar-specific pathways in S. pneumoniae
133
32. Sambrook J. Molecular cloning: a laboratory manual. 3rd ed. Cold Spring Harbor, N.Y: Cold Spring Harbor Laboratory Press; 2001.
33. Beilharz K, Nováková L, Fadda D, Branny P, Massidda O, Veening J-W. Control of cell division in Streptococcus pneumoniae by the conserved Ser/Thr protein kinase StkP. Proc Natl Acad Sci USA. 2012;109: E905–913. doi:10.1073/pnas.1119172109
34. Martin B, García P, Castanié MP, Claverys JP. The recA gene of Streptococcus pneumoniae is part of a competence-induced operon and controls lysogenic induction. Mol Microbiol. 1995;15: 367–379.
35. Sicard AM. A new synthetic medium for Diplococcus pneumoniae, and its use for the study of reciprocal transformations at the amia locus. Genetics. 1964;50: 31–44.
36. Stewart GR, Wernisch L, Stabler R, Mangan JA, Hinds J, Laing KG, et al. Dissection of the heat-shock response in Mycobacterium tuberculosis using mutants and microarrays. Microbiology (Reading, Engl). 2002;148: 3129–3138.
37. Bortoni ME, Terra VS, Hinds J, Andrew PW, Yesilkaya H. The pneumococcal response to oxidative stress includes a role for Rgg. Microbiology (Reading, Engl). 2009;155: 4123–4134. doi:10.1099/mic.0.028282-0
38. Green GH, Diggle PJ. On the operational characteristics of the Benjamini and Hochberg False Discovery Rate procedure. Stat Appl Genet Mol Biol. 2007;6: Article27. doi:10.2202/1544-6115.1302
39. Yesilkaya H, Spissu F, Carvalho SM, Terra VS, Homer KA, Benisty R, et al. Pyruvate formate lyase is required for pneumococcal fermentative metabolism and virulence. Infect Immun. 2009;77: 5418–5427. doi:10.1128/IAI.00178-09
40. Livak KJ, Schmittgen TD. Analysis of relative gene expression data using real-time quantitative PCR and the 2(-Delta Delta C(T)) Method. Methods. 2001;25: 402–408. doi:10.1006/meth.2001.1262
41. Crow VL, Thomas TD. D-tagatose 1,6-diphosphate aldolase from lactic streptococci: purification, properties, and use in measuring intracellular tagatose 1,6-diphosphate. J Bacteriol. 1982;151: 600–608.
42. Homer KA, Patel R, Beighton D. Effects of N-acetylglucosamine on carbohydrate fermentation by Streptococcus mutans NCTC 10449 and Streptococcus sobrinus SL-1. Infect Immun. 1993;61: 295–302.
43. White RJ, Pasternak CA. The purification and properties of N-acetylglucosamine 6-phosphate deacetylase from Escherichia coli. Biochem J. 1967;105: 121–125.
44. Gracy RW, Noltmann EA. Studies on phosphomannose isomerase. I. Isolation, homogeneity measurements and determination of some physical properties. J Biol Chem. 1968;243: 3161–3168.
45. Hajaj B, Yesilkaya H, Benisty R, David M, Andrew PW, Porat N. Thiol peroxidase is an important component of Streptococcus pneumoniae in oxygenated environments. Infect Immun. 2012;80: 4333–4343. doi:10.1128/IAI.00126-12
46. Szabó P. Phosphorylated sugars. Part 25. Synthesis and behaviour in acidic media of 2-acetamido-2-deoxy-D-glucose 4- and 6-phosphates and of a “Lipid A” analogue. J Chem Soc, Perkin Trans 1. 1989; 919–924. doi:10.1039/p19890000919
47. Yeager AR, Finney NS. Synthesis of fluorescently labeled UDP-GlcNAc analogues and their evaluation as chitin synthase substrates. J Org Chem. 2005;70: 1269–1275. doi:10.1021/jo0483670

Chapter 2
134
48. Eyrisch O, Sinerius G, Fessner W-D. Facile enzymic de novo synthesis and NMR spectroscopy characterization of D-tagatose 1,6-biphosphate. Carbohyd Res. 1993;238: 287–306.
49. Gualdi L, Hayre J, Gerlini A, Bidossi A, Colomba L, Trappetti C, et al. Regulation of neuraminidase expression in Streptococcus pneumoniae. BMC Microbiol. 2012;12: 200. doi:10.1186/1471-2180-12-200
50. Chan PF, O’Dwyer KM, Palmer LM, Ambrad JD, Ingraham KA, So C, et al. Characterization of a novel fucose-regulated promoter (PfcsK) suitable for gene essentiality and antibacterial mode-of-action studies in Streptococcus pneumoniae. J Bacteriol. 2003;185: 2051–2058. doi:10.1128/JB.185.6.2051-2058.2003
51. Embry A, Hinojosa E, Orihuela CJ. Regions of Diversity 8, 9 and 13 contribute to Streptococcus pneumoniae virulence. BMC Microbiol. 2007;7: 80. doi:10.1186/1471-2180-7-80
52. Higgins MA, Suits MD, Marsters C, Boraston AB. Structural and functional analysis of fucose-processing enzymes from Streptococcus pneumoniae. J Mol Biol. 2014;426: 1469–1482. doi:10.1016/j.jmb.2013.12.006
53. Kaufman GE, Yother J. CcpA-dependent and -independent control of beta-galactosidase expression in Streptococcus pneumoniae occurs via regulation of an upstream phosphotransferase system-encoding operon. J Bacteriol. 2007;189: 5183–5192. doi:10.1128/JB.00449-07
54. Eberhardt A, Wu LJ, Errington J, Vollmer W, Veening J-W. Cellular localization of choline-utilization proteins in Streptococcus pneumoniae using novel fluorescent reporter systems. Mol Microbiol. 2009;74: 395–408. doi:10.1111/j.1365-2958.2009.06872.x
55. Slager J, Kjos M, Attaiech L, Veening J-W. Antibiotic-induced replication stress triggers bacterial competence by increasing gene dosage near the origin. Cell. 2014;157: 395–406. doi:10.1016/j.cell.2014.01.068
56. Richards L, Ferreira DM, Miyaji EN, Andrew PW, Kadioglu A. The immunising effect of pneumococcal nasopharyngeal colonisation; protection against future colonisation and fatal invasive disease. Immunobiology. 2010;215: 251–263. doi:10.1016/j.imbio.2009.12.004
57. Polissi A, Pontiggia A, Feger G, Altieri M, Mottl H, Ferrari L, et al. Large-scale identification of virulence genes from Streptococcus pneumoniae. Infect Immun. 1998;66: 5620–5629.
58. Lau GW, Haataja S, Lonetto M, Kensit SE, Marra A, Bryant AP, et al. A functional genomic analysis of type 3 Streptococcus pneumoniae virulence. Mol Microbiol. 2001;40: 555–571.
59. Hava DL, Camilli A. Large-scale identification of serotype 4 Streptococcus pneumoniae virulence factors. Mol Microbiol. 2002;45: 1389–1406.
60. Orihuela CJ, Radin JN, Sublett JE, Gao G, Kaushal D, Tuomanen EI. Microarray analysis of pneumococcal gene expression during invasive disease. Infect Immun. 2004;72: 5582–5596. doi:10.1128/IAI.72.10.5582-5596.2004
61. Song X-M, Connor W, Hokamp K, Babiuk LA, Potter AA. Streptococcus pneumoniae early response genes to human lung epithelial cells. BMC Research Notes. 2008;1: 64. doi:10.1186/1756-0500-1-64
62. Iyer R, Camilli A. Sucrose metabolism contributes to in vivo fitness of Streptococcus pneumoniae. Mol Microbiol. 2007;66: 1–13. doi:10.1111/j.1365-2958.2007.05878.x
Host glycan sugar-specific pathways in S. pneumoniae
135
63. Marion C, Burnaugh AM, Woodiga SA, King SJ. Sialic acid transport contributes to pneumococcal colonization. Infect Immun. 2011;79: 1262–1269. doi:10.1128/IAI.00832-10
64. Ogunniyi AD, Mahdi LK, Trappetti C, Verhoeven N, Mermans D, Van der Hoek MB, et al. Identification of genes that contribute to the pathogenesis of invasive pneumococcal disease by in vivo transcriptomic analysis. Infect Immun. 2012;80: 3268–3278. doi:10.1128/IAI.00295-12
65. Zähner D, Hakenbeck R. The Streptococcus pneumoniae beta-galactosidase is a surface protein. J Bacteriol. 2000;182: 5919–5921.
66. Clarke VA, Platt N, Butters TD. Cloning and expression of the β-N-acetylglucosaminidase gene from Streptococcus pneumoniae: generation of truncated enzymes with modified aglycon specificity. J Biol Chem. 1995;270: 8805–8814.
67. Pluvinage B, Higgins MA, Abbott DW, Robb C, Dalia AB, Deng L, et al. Inhibition of the pneumococcal virulence factor StrH and molecular insights into N-glycan recognition and hydrolysis. Structure. 2011;19: 1603–1614. doi:10.1016/j.str.2011.08.011
68. Jiang Y-L, Yu W-L, Zhang J-W, Frolet C, Di Guilmi A-M, Zhou C-Z, et al. Structural basis for the substrate specificity of a novel β-N-acetylhexosaminidase StrH protein from Streptococcus pneumoniae R6. J Biol Chem. 2011;286: 43004–43012. doi:10.1074/jbc.M111.256578
69. Homer KA, Roberts G, Byers HL, Tarelli E, Whiley RA, Philpott-Howard J, et al. Mannosidase production by viridans group Streptococci. J Clin Microbiol. 2001;39: 995–1001. doi:10.1128/JCM.39.3.995-1001.2001
70. Suits MDL, Zhu Y, Taylor EJ, Walton J, Zechel DL, Gilbert HJ, et al. Structure and kinetic investigation of Streptococcus pyogenes family GH38 α-mannosidase. Hofmann A, editor. PLoS ONE. 2010;5: e9006. doi:10.1371/journal.pone.0009006
71. Gregg KJ, Zandberg WF, Hehemann J-H, Whitworth GE, Deng L, Vocadlo DJ, et al. Analysis of a new family of widely distributed metal-independent alpha-mannosidases provides unique insight into the processing of N-linked glycans. J Biol Chem. 2011;286: 15586–15596. doi:10.1074/jbc.M111.223172
72. Corfield AP, Wagner SA, Clamp JR, Kriaris MS, Hoskins LC. Mucin degradation in the human colon: production of sialidase, sialate O-acetylesterase, N-acetylneuraminate lyase, arylesterase, and glycosulfatase activities by strains of fecal bacteria. Infect Immun. 1992;60: 3971–3978.
73. Plumbridge J, Vimr E. Convergent pathways for utilization of the amino sugars N-acetylglucosamine, N-acetylmannosamine, and N-acetylneuraminic acid by Escherichia coli. J Bacteriol. 1999;181: 47–54.
74. Moye ZD, Burne RA, Zeng L. Uptake and metabolism of N-acetylglucosamine and glucosamine by Streptococcus mutans. Appl Environ Microbiol. 2014; doi:10.1128/AEM.00820-14
75. Xiao X, Wang F, Saito A, Majka J, Schlösser A, Schrempf H. The novel Streptomyces olivaceoviridis ABC transporter Ngc mediates uptake of N-acetylglucosamine and N,N’-diacetylchitobiose. Mol Genet Genomics. 2002;267: 429–439. doi:10.1007/s00438-002-0640-2
76. Yang C, Rodionov DA, Li X, Laikova ON, Gelfand MS, Zagnitko OP, et al. Comparative genomics and experimental characterization of N-acetylglucosamine
Chapter 2
136
utilization pathway of Shewanella oneidensis. J Biol Chem. 2006;281: 29872–29885. doi:10.1074/jbc.M605052200
77. Boulanger A, Dejean G, Lautier M, Glories M, Zischek C, Arlat M, et al. Identification and regulation of the N-acetylglucosamine utilization pathway of the plant pathogenic bacterium Xanthomonas campestris pv. campestris. J Bacteriol. 2010;192: 1487–1497. doi:10.1128/JB.01418-09
78. Swiatek MA, Tenconi E, Rigali S, van Wezel GP. Functional analysis of the N-acetylglucosamine metabolic genes of Streptomyces coelicolor and role in control of development and antibiotic production. J Bacteriol. 2012;194: 1136–1144. doi:10.1128/JB.06370-11
79. Neves AR, Pool WA, Solopova A, Kok J, Santos H, Kuipers OP. Towards enhanced galactose utilization by Lactococcus lactis. Appl Environ Microbiol. 2010;76: 7048–7060. doi:10.1128/AEM.01195-10
80. Zeng L, Xue P, Stanhope MJ, Burne RA. A galactose-specific sugar: phosphotransferase permease is prevalent in the non-core genome of Streptococcus mutans. Mol Oral Microbiol. 2013;28: 292–301. doi:10.1111/omi.12025
81. Zeng L, Martino NC, Burne RA. Two gene clusters coordinate galactose and lactose metabolism in Streptococcus gordonii. Appl Environ Microbiol. 2012;78: 5597–5605. doi:10.1128/AEM.01393-12
82. Cai J, Tong H, Qi F, Dong X. CcpA-dependent carbohydrate catabolite repression regulates galactose metabolism in Streptococcus oligofermentans. J Bacteriol. 2012;194: 3824–3832. doi:10.1128/JB.00156-12
83. Thomas TD, Turner KW, Crow VL. Galactose fermentation by Streptococcus lactis and Streptococcus cremoris: pathways, products, and regulation. J Bacteriol. 1980;144: 672–682.
84. Garrigues C, Loubiere P, Lindley ND, Cocaign-Bousquet M. Control of the shift from homolactic acid to mixed-acid fermentation in Lactococcus lactis: predominant role of the NADH/NAD+ ratio. J Bacteriol. 1997;179: 5282–5287.
85. Fabich AJ, Jones SA, Chowdhury FZ, Cernosek A, Anderson A, Smalley D, et al. Comparison of carbon nutrition for pathogenic and commensal Escherichia coli strains in the mouse intestine. Infect Immun. 2008;76: 1143–1152. doi:10.1128/IAI.01386-07
86. Van Opijnen T, Camilli A. A fine scale phenotype-genotype virulence map of a bacterial pathogen. Genome Research. 2012;22: 2541–2551. doi:10.1101/gr.137430.112
87. Nelson AL, Roche AM, Gould JM, Chim K, Ratner AJ, Weiser JN. Capsule enhances pneumococcal colonization by limiting mucus-mediated clearance. Infect Immun. 2007;75: 83–90. doi:10.1128/IAI.01475-06

Host glycan sugar-specific pathways in S. pneumoniae
137
Supporting Information_Chapter 2
Supporting Information


Host glycan sugar-specific pathways in S. pneumoniae
139
Supporting Tables
Table S2.1. Bacterial strains and plasmids used in this study.
Strain Relevant genotype Reference/Source
S. pneumoniae
D39 serotype 2 strain, cps2 (a)
D39∆galK D39 ∆galK::spe, SpeR This work
D39∆lacD D39 ∆lacD::spe, SpeR This work
D39∆manA D39 ∆manA::spe, SpeR This work
D39∆nagA D39 ∆nagA::spe, SpeR This work
D39∆lacDΔgalK D39 ∆lacD::spe ∆galK::tmp, SpeR, TmpR
This work
D39∆galT-2 D39 ∆galT-2::spe, SpeR This work
D39∆galK + pKB01-galK D39 ∆galK::spc, bgaA::Pzn-galK-sfgfp(iGEM), SpeR,TetR
This work
D39∆lacD + pKB01-lacD D39 ∆lacD::spc, bgaA::Pzn-lacD-sfgfp(iGEM), SpeR,TetR
This work
D39∆manA + pKB01-manA
D39 ∆manA::spc, bgaA::Pzn-manA-sfgfp(iGEM),SpeR,TetR
This work
D39∆nagA + pKB01-nagA
D39 ∆nagA::spc, bgaA::PownnagA-nagA-sfgfp(iGEM), SpeR,TetR
This work
D39∆galK + pKB01-galT-2
D39 ∆galK::spc, bgaA::PZn-galT-2-sfgfp(iGEM), SpeR,TetR
This work
D39∆galK + pKB01-galKgalT-2
D39 ∆galK::spc, bgaA::PZn-galKgalT-2-sfgfp(iGEM), SpeR,TetR
This work
E. coli
DH5α
F– Φ80lacZΔM15 Δ(lacZYA-argF) U169 recA1 endA1 hsdR17 (rK–, mK+) phoA supE44 λ– thi-1 gyrA96 relA1
Invitrogen (b)
DH5α + pKB01 AmpR (b)
Plasmids
pORI138 Ori+ repA-, deletion derivative of pWV01; SpeR
[1]
pKB01 bgaA, Pzn-sfgfp(iGEM)+, AmpR, TetR
[2]
pKB01-galK bgaA, Pzn-galK-sfgfp(iGEM), AmpR, TetR
This work
pKB01-lacD bgaA, Pzn-lacD-sfgfp(iGEM), AmpR, TetR
This work
pKB01-manA bgaA, Pzn-manA-sfgfp(iGEM), AmpR, TetR
This work
pKB01-nagA bgaA, PownnagA-nagA-sfgfp(iGEM), AmpR, TetR
This work
pKB01-galT-2 bgaA, Pzn-galT-2-sfgfp(iGEM), AmpR, TetR
This work
pKB01-galKgalT-2 bgaA, Pzn-galKgalT-2-sfgfp(iGEM), AmpR, TetR
This work
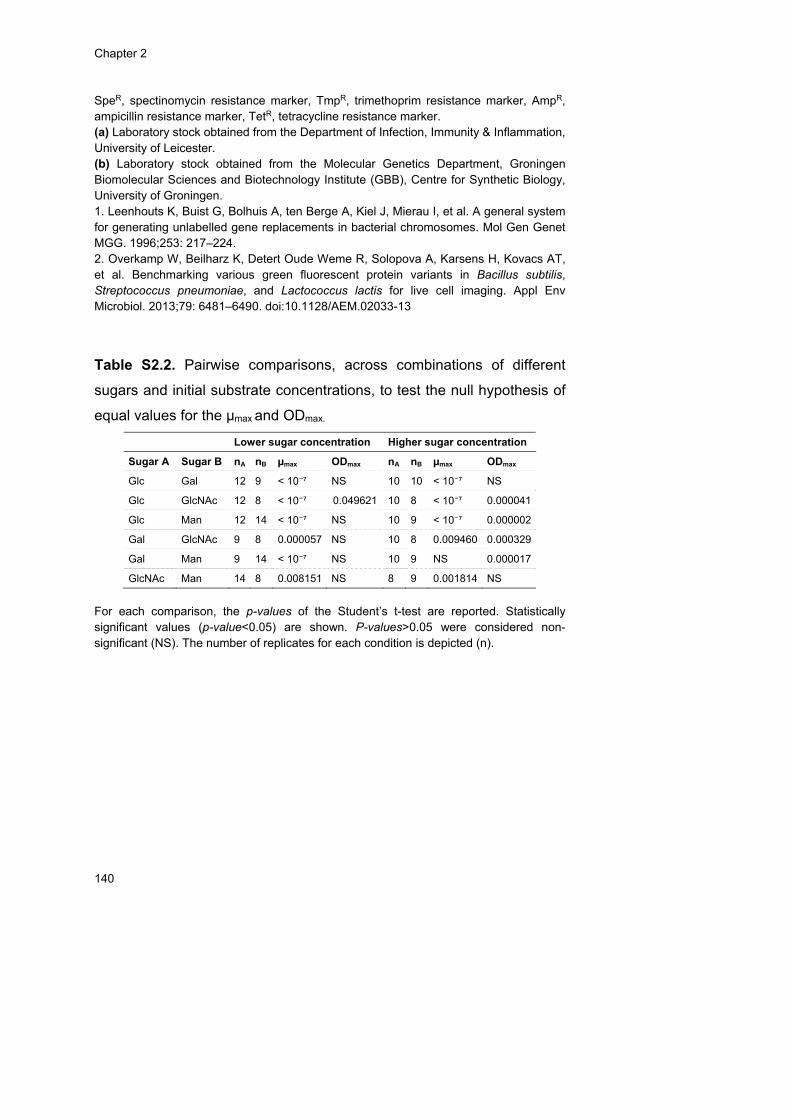
Chapter 2
140
SpeR, spectinomycin resistance marker, TmpR, trimethoprim resistance marker, AmpR, ampicillin resistance marker, TetR, tetracycline resistance marker. (a) Laboratory stock obtained from the Department of Infection, Immunity & Inflammation, University of Leicester. (b) Laboratory stock obtained from the Molecular Genetics Department, Groningen Biomolecular Sciences and Biotechnology Institute (GBB), Centre for Synthetic Biology, University of Groningen. 1. Leenhouts K, Buist G, Bolhuis A, ten Berge A, Kiel J, Mierau I, et al. A general system for generating unlabelled gene replacements in bacterial chromosomes. Mol Gen Genet MGG. 1996;253: 217–224. 2. Overkamp W, Beilharz K, Detert Oude Weme R, Solopova A, Karsens H, Kovacs AT, et al. Benchmarking various green fluorescent protein variants in Bacillus subtilis, Streptococcus pneumoniae, and Lactococcus lactis for live cell imaging. Appl Env Microbiol. 2013;79: 6481–6490. doi:10.1128/AEM.02033-13
Table S2.2. Pairwise comparisons, across combinations of different
sugars and initial substrate concentrations, to test the null hypothesis of
equal values for the µmax and ODmax.
Lower sugar concentration Higher sugar concentration
Sugar A Sugar B nA nB µmax ODmax nA nB µmax ODmax
Glc Gal 12 9 < 10⁻⁷ NS 10 10 < 10⁻⁷ NS
Glc GlcNAc 12 8 < 10⁻⁷ 0.049621 10 8 < 10⁻⁷ 0.000041
Glc Man 12 14 < 10⁻⁷ NS 10 9 < 10⁻⁷ 0.000002
Gal GlcNAc 9 8 0.000057 NS 10 8 0.009460 0.000329
Gal Man 9 14 < 10⁻⁷ NS 10 9 NS 0.000017
GlcNAc Man 14 8 0.008151 NS 8 9 0.001814 NS
For each comparison, the p-values of the Student’s t-test are reported. Statistically significant values (p-value<0.05) are shown. P-values>0.05 were considered non-significant (NS). The number of replicates for each condition is depicted (n).

Host glycan sugar-specific pathways in S. pneumoniae
141
Table S2.3. Oligonucleotide primers used in this study (from 5’ to 3’).
Primer Sequence (from 5’ to 3’) Description
Allelic replacement mutagenesis
GalK_KO1_Fw CTAGACGCTTGTCCTGAATG
GalK_KO2_Rv_Spe TCCTCCTCACTATTTTGATTAGGCGAAGAGTTTCAGCAGTAAGATG Overlap with spe
GalK_KO3_Fw_Spe CGTTTTAGCGTTTATTTCGTTTAGTGTTGCAGGTGGCACTCGCGTC Overlap with spe
GalK_KO4_Rv CGGCAGGTCGGCATTAGATCC
LacD_KO1_Fw CTCAATTCAGGGAGAAACTCG
LacD_KO2_Rv_Spe TCCTCCTCACTATTTTGATTAGGATGATACCATTTTCATCAGAAAG Overlap with spe
LacD_KO3_Fw_Spe CGTTTTAGCGTTTATTTCGTTTAGTGCGACTTCATGGAAAGAACGTGTG Overlap with spe
LacD_KO4_Rv CAATCGACTCCACAAGTTCCAC
ManA_KO1_Fw GACTTTCCTGATAGAGTTGTTC
ManA_KO2_Rv_Spe TCCTCCTCACTATTTTGATTAGGGTACCACCCCAGATTTTTTCTTGC Overlap with spe
ManA_KO3_Fw_Spe CGTTTTAGCGTTTATTTCGTTTAGTTCTTGGACTCTAGAAGGGC Overlap with spe
ManA_KO4_Rv GGTTCTTTACTTCCTCAAACCAG
NagA_KO1_Fw CTAAGACGGTGGTCATTGCGACTG
NagA_KO2_Rv_Spe TCCTCCTCACTATTTTGATTAGGTGTGGGTAGAAAAACTGATCCGC Overlap with spe
NagA_KO3_Fw_Spe CGTTTTAGCGTTTATTTCGTTTAGTGATGGCGTAAAACGTTATCAAGCA Overlap with spe
NagA_KO4_Rv CACGTAGATATTCAGCCTGCATACC
Spe_Fp CTAATCAAAATAGTGAGGAGG
Spe_Rp ACTAAACGAAATAAACGC
GalK_KO2_Rv_Tmp TCCAAGCTCACAAAAATCCGCGAAGAGTTTCAGCAGTAAGATG Overlap with tmp
GalK_KO3_Fw_Tmp CCGTCTATGCGCGTCGTAACGTTGCAGGTGGCACTCGCGTC Overlap with tmp
Tmp_ FW GGATTTTTGTGAGCTTGGA
Tmp_RV GTTACGACGCGCATAGACGG

Chapter 2
142
Primer Sequence (from 5’ to 3’) Description
GalT-2_KO1_Fw CTTCAGCATCCTTGGAGATCTTG
GalT-2_KO2_Rv_Spe TCCTCCTCACTATTTTGATTAGGACATGTGTTACAAATTTATCTACTAAGGTCAC Overlap with spe
GalT-2_KO3_FW_Spe CGTTTTAGCGTTTATTTCGTTTAGTGGAATTTTACTAGACTAG Overlap with spe
GalT-2_KO4_Rv CCCACAATTAGGGCAATAAGAC
Confirmation of genotype by PCR
GalK_S_Fw CCGATAGCTAAACTATCGCTGGC
GalK_S_Rv GAAGTCAAGCGTAGGACAGACATTGG
ManA_S_Fw GGCGCTTCAACAGTTGATAG
ManA_S_Rv GCCATTGCTCTAGGAGCTCAAGCG
LacD_S_Fw CGGCTGGTGGTAAGGGACTCAATG
LacD_S_Rv CGTATGTTGCGTAATCACATCATAG
NagA_S_Fw GTGGGAGCGTTTGAGACAGAC
NagA_S_Rv CGCACCGAATGATAGGGCAG
GalT-2_S_Fw GGGGTTCTTCATTTCTTGCAAGAAGC
GalT-2_S_Rv TGCATAAGCACCATCATTGATTG
Complementation of loss-of-function mutants REnz
GalK_Fw_EcoRI AATTGAATTCCAAAGGAGAAATCATATGACACAACATCTTACTGC EcoRI
GalK_Rv_BamHI GATCGGATCCCTAGTCAAGGACGCGAGTGCC BamHI
GalK_Fw_EcoRI_B AATTGAATTCTAAGGAGGCAAATATGACACAACATCTTACTGC EcoRI
GalT-2_Rv_XbaI ACGTCTAGATGTGCAAGGAGAAAGCTCCT XbaI
LacD_Fw_EcoRI AATTGAATTCTAAAAGAGGTATAAAATGGCTTTAACAGAAC EcoRI
LacD_Rv_BamHI GATCGGATCCTTACACACGTTCTTTCC BamHI
NagA_Fw_NotI AATTGCGGCCGCGAGTTGGAGAAATCCAGC NotI
NagA_Rv_BamHI GATCGGATCCTTATGCTTGATAACGTTTTACGC BamHI
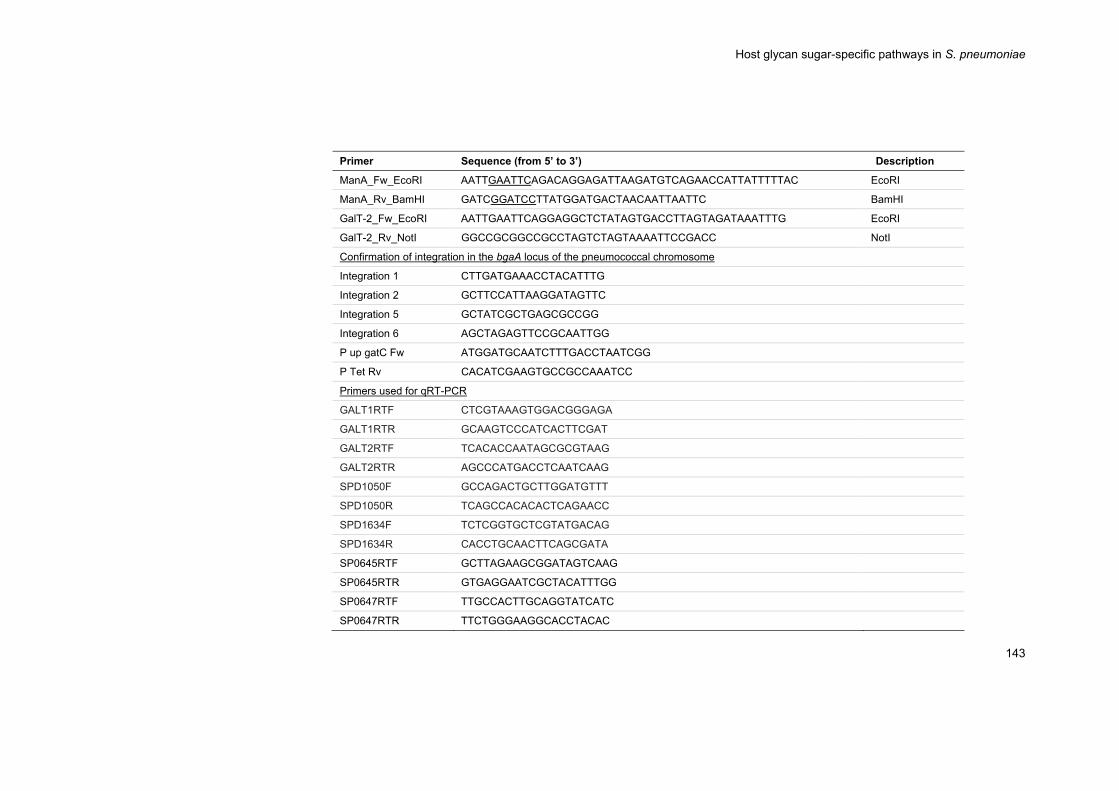
Host glycan sugar-specific pathways in S. pneumoniae
143
Primer Sequence (from 5’ to 3’) Description
ManA_Fw_EcoRI AATTGAATTCAGACAGGAGATTAAGATGTCAGAACCATTATTTTTAC EcoRI
ManA_Rv_BamHI GATCGGATCCTTATGGATGACTAACAATTAATTC BamHI
GalT-2_Fw_EcoRI AATTGAATTCAGGAGGCTCTATAGTGACCTTAGTAGATAAATTTG EcoRI
GalT-2_Rv_NotI GGCCGCGGCCGCCTAGTCTAGTAAAATTCCGACC NotI
Confirmation of integration in the bgaA locus of the pneumococcal chromosome
Integration 1 CTTGATGAAACCTACATTTG
Integration 2 GCTTCCATTAAGGATAGTTC
Integration 5 GCTATCGCTGAGCGCCGG
Integration 6 AGCTAGAGTTCCGCAATTGG
P up gatC Fw ATGGATGCAATCTTTGACCTAATCGG
P Tet Rv CACATCGAAGTGCCGCCAAATCC
Primers used for qRT-PCR
GALT1RTF CTCGTAAAGTGGACGGGAGA
GALT1RTR GCAAGTCCCATCACTTCGAT
GALT2RTF TCACACCAATAGCGCGTAAG
GALT2RTR AGCCCATGACCTCAATCAAG
SPD1050F GCCAGACTGCTTGGATGTTT
SPD1050R TCAGCCACACACTCAGAACC
SPD1634F TCTCGGTGCTCGTATGACAG
SPD1634R CACCTGCAACTTCAGCGATA
SP0645RTF GCTTAGAAGCGGATAGTCAAG
SP0645RTR GTGAGGAATCGCTACATTTGG
SP0647RTF TTGCCACTTGCAGGTATCATC
SP0647RTR TTCTGGGAAGGCACCTACAC
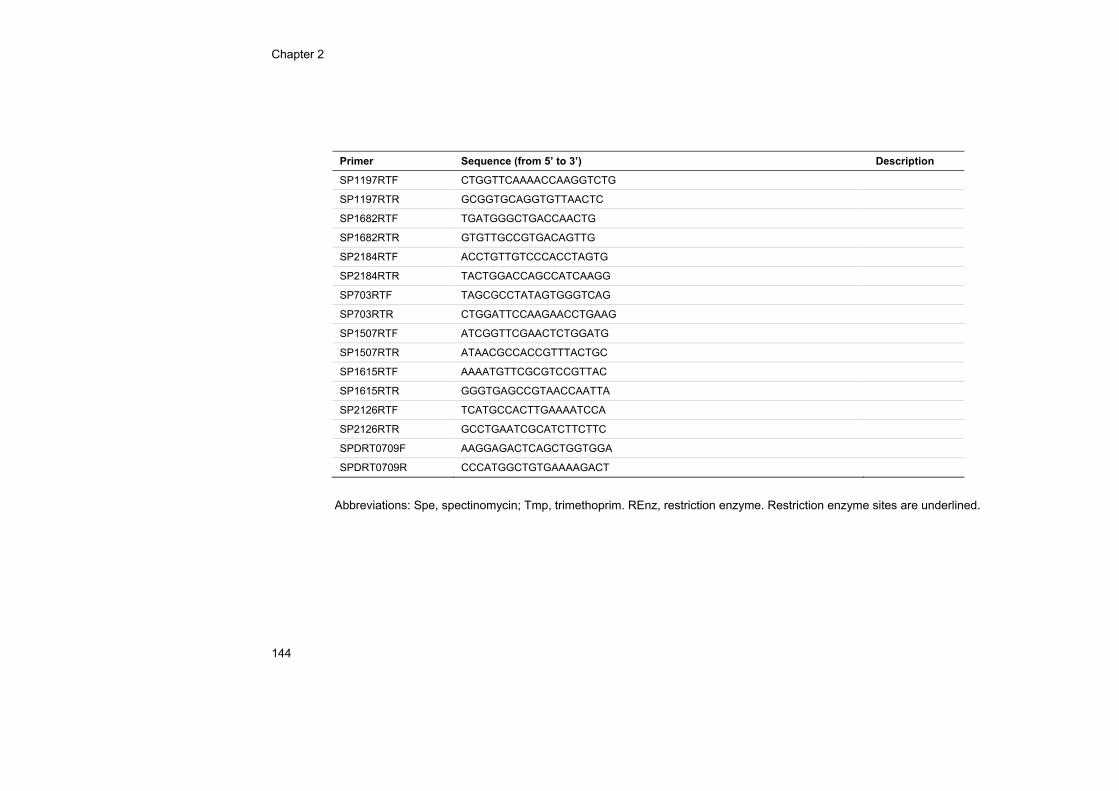
Chapter 2
144
Primer Sequence (from 5’ to 3’) Description
SP1197RTF CTGGTTCAAAACCAAGGTCTG
SP1197RTR GCGGTGCAGGTGTTAACTC
SP1682RTF TGATGGGCTGACCAACTG
SP1682RTR GTGTTGCCGTGACAGTTG
SP2184RTF ACCTGTTGTCCCACCTAGTG
SP2184RTR TACTGGACCAGCCATCAAGG
SP703RTF TAGCGCCTATAGTGGGTCAG
SP703RTR CTGGATTCCAAGAACCTGAAG
SP1507RTF ATCGGTTCGAACTCTGGATG
SP1507RTR ATAACGCCACCGTTTACTGC
SP1615RTF AAAATGTTCGCGTCCGTTAC
SP1615RTR GGGTGAGCCGTAACCAATTA
SP2126RTF TCATGCCACTTGAAAATCCA
SP2126RTR GCCTGAATCGCATCTTCTTC
SPDRT0709F AAGGAGACTCAGCTGGTGGA
SPDRT0709R CCCATGGCTGTGAAAAGACT
Abbreviations: Spe, spectinomycin; Tmp, trimethoprim. REnz, restriction enzyme. Restriction enzyme sites are underlined.

Host glycan sugar-specific pathways in S. pneumoniae
145
Table S2.4. Genes proposed to be involved in the uptake and dedicated
catabolism of galactose (Gal), mannose (Man), N-acetylneuraminic acid
(NeuNAc), N-acetylglucosamine (GlcNAc), fucose (Fuc), and glucose
(Glc) in S. pneumoniae D39.
Locus_Tag Gene Description Identification Method or Ref.
Galactose
Gal transport
SPD_0263 manM PTS system mannose-specific transporter subunit IIC
[1]
SPD_0067a - PTS system transporter subunit IIC [1–3]
SPD_0561 - PTS system transporter subunit IIC [1,4]
SPD_0090 - ABC transporter substrate-binding protein [1]
Gal catabolism
SPD_0071 galM Aldose 1-epimerase Genome annotation at NCBI
SPD_1634 galK Galactokinase Genome annotation at NCBI
SPD_1613 galT-1 Galactose 1-phosphate uridylyltransferase Genome annotation at NCBI
SPD_1633 galT-2 Galactose 1-phosphate uridylyltransferase Genome annotation at NCBI
SPD_1432 galE-1 UDP-glucose 4-epimerase Genome annotation at NCBI
SPD_1612 galE-2 UDP-glucose 4-epimerase Genome annotation at NCBI
SPD_1326 pgm Phosphoglucomutase/phosphomannomutase family protein
Genome annotation at NCBI
SPD_1053 lacA Galactose 6-phosphate isomerase subunit LacA
Genome annotation at NCBI
SPD_1052 lacB Galactose 6-phosphate isomerase subunit LacB
Genome annotation at NCBI
SPD_1051 lacC Tagatose 6-phosphate kinase Genome annotation at NCBI
SPD_1050 lacD Tagatose 1,6-diphosphate aldolase Genome annotation at NCBI
Mannose
Man transport
SPD_0263 manM PTS system, mannose-specific transporter subunit IIC
[1]
SPD_0428 lacE-1 PTS system, lactose-specific transporter subunit IIBC
[1]
SPD_0090 - ABC transporter, substrate-binding protein [1]
SPD_0067 - PTS system transporter subunit IIC Database annotationb
SPD_0296 - PTS system transporter subunit IIC Database annotationb
SPD_1990 - PTS system transporter subunit IIC Database annotationb
Man catabolism
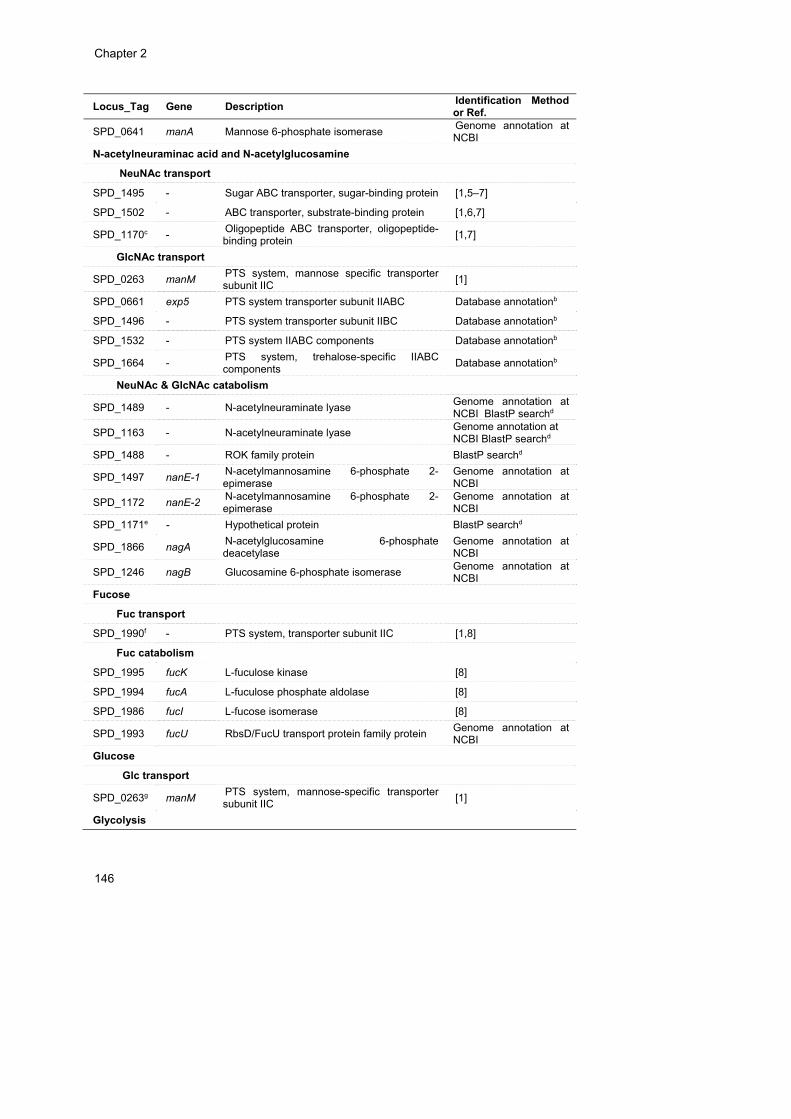
Chapter 2
146
Locus_Tag Gene Description Identification Method or Ref.
SPD_0641 manA Mannose 6-phosphate isomerase Genome annotation at NCBI
N-acetylneuraminac acid and N-acetylglucosamine
NeuNAc transport
SPD_1495 - Sugar ABC transporter, sugar-binding protein [1,5–7]
SPD_1502 - ABC transporter, substrate-binding protein [1,6,7]
SPD_1170c - Oligopeptide ABC transporter, oligopeptide-binding protein
[1,7]
GlcNAc transport
SPD_0263 manM PTS system, mannose specific transporter subunit IIC
[1]
SPD_0661 exp5 PTS system transporter subunit IIABC Database annotationb
SPD_1496 - PTS system transporter subunit IIBC Database annotationb
SPD_1532 - PTS system IIABC components Database annotationb
SPD_1664 - PTS system, trehalose-specific IIABC components
Database annotationb
NeuNAc & GlcNAc catabolism
SPD_1489 - N-acetylneuraminate lyase Genome annotation at NCBI BlastP searchd
SPD_1163 - N-acetylneuraminate lyase Genome annotation at NCBI BlastP searchd
SPD_1488 - ROK family protein BlastP searchd
SPD_1497 nanE-1 N-acetylmannosamine 6-phosphate 2-epimerase
Genome annotation at NCBI
SPD_1172 nanE-2 N-acetylmannosamine 6-phosphate 2-epimerase
Genome annotation at NCBI
SPD_1171e - Hypothetical protein BlastP searchd
SPD_1866 nagA N-acetylglucosamine 6-phosphate deacetylase
Genome annotation at NCBI
SPD_1246 nagB Glucosamine 6-phosphate isomerase Genome annotation at NCBI
Fucose
Fuc transport
SPD_1990f - PTS system, transporter subunit IIC [1,8]
Fuc catabolism
SPD_1995 fucK L-fuculose kinase [8]
SPD_1994 fucA L-fuculose phosphate aldolase [8]
SPD_1986 fucI L-fucose isomerase [8]
SPD_1993 fucU RbsD/FucU transport protein family protein Genome annotation at NCBI
Glucose
Glc transport
SPD_0263g manM PTS system, mannose-specific transporter subunit IIC
[1]
Glycolysis
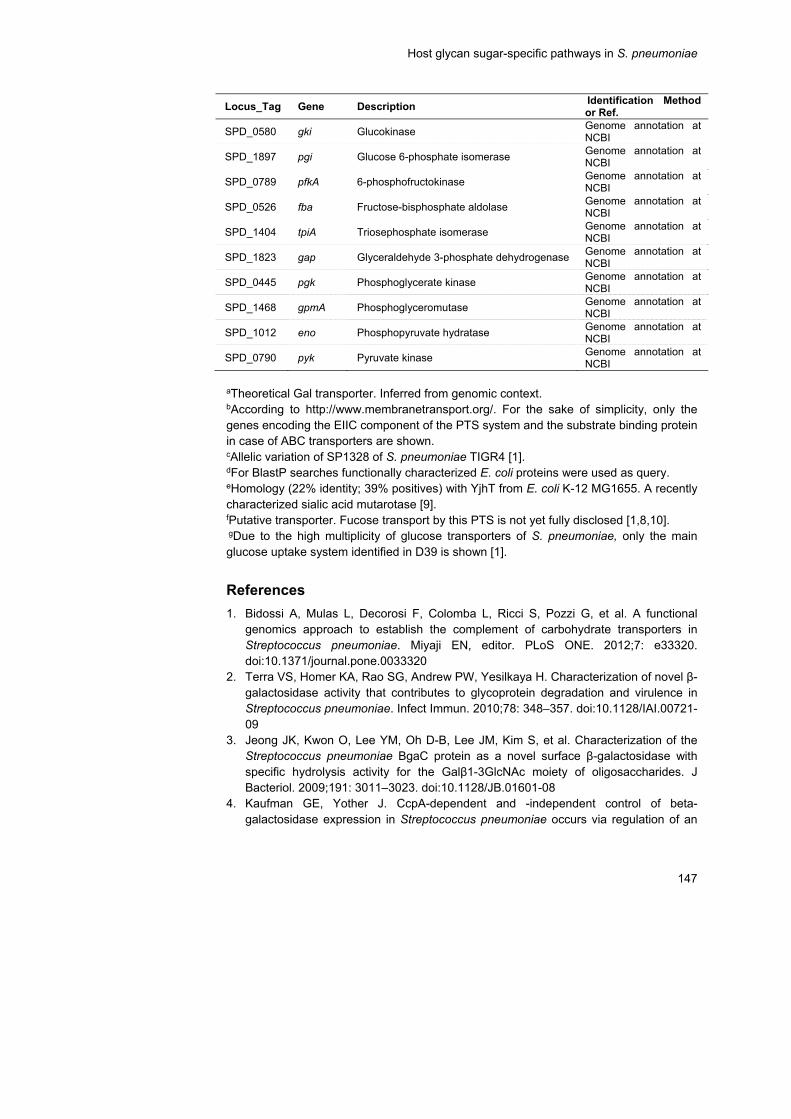
Host glycan sugar-specific pathways in S. pneumoniae
147
Locus_Tag Gene Description Identification Method or Ref.
SPD_0580 gki Glucokinase Genome annotation at NCBI
SPD_1897 pgi Glucose 6-phosphate isomerase Genome annotation at NCBI
SPD_0789 pfkA 6-phosphofructokinase Genome annotation at NCBI
SPD_0526 fba Fructose-bisphosphate aldolase Genome annotation at NCBI
SPD_1404 tpiA Triosephosphate isomerase Genome annotation at NCBI
SPD_1823 gap Glyceraldehyde 3-phosphate dehydrogenase Genome annotation at NCBI
SPD_0445 pgk Phosphoglycerate kinase Genome annotation at NCBI
SPD_1468 gpmA Phosphoglyceromutase Genome annotation at NCBI
SPD_1012 eno Phosphopyruvate hydratase Genome annotation at NCBI
SPD_0790 pyk Pyruvate kinase Genome annotation at NCBI
aTheoretical Gal transporter. Inferred from genomic context. bAccording to http://www.membranetransport.org/. For the sake of simplicity, only the genes encoding the EIIC component of the PTS system and the substrate binding protein in case of ABC transporters are shown. cAllelic variation of SP1328 of S. pneumoniae TIGR4 [1]. dFor BlastP searches functionally characterized E. coli proteins were used as query. eHomology (22% identity; 39% positives) with YjhT from E. coli K-12 MG1655. A recently characterized sialic acid mutarotase [9]. fPutative transporter. Fucose transport by this PTS is not yet fully disclosed [1,8,10]. gDue to the high multiplicity of glucose transporters of S. pneumoniae, only the main glucose uptake system identified in D39 is shown [1].
References
1. Bidossi A, Mulas L, Decorosi F, Colomba L, Ricci S, Pozzi G, et al. A functional genomics approach to establish the complement of carbohydrate transporters in Streptococcus pneumoniae. Miyaji EN, editor. PLoS ONE. 2012;7: e33320. doi:10.1371/journal.pone.0033320
2. Terra VS, Homer KA, Rao SG, Andrew PW, Yesilkaya H. Characterization of novel β-galactosidase activity that contributes to glycoprotein degradation and virulence in Streptococcus pneumoniae. Infect Immun. 2010;78: 348–357. doi:10.1128/IAI.00721-09
3. Jeong JK, Kwon O, Lee YM, Oh D-B, Lee JM, Kim S, et al. Characterization of the Streptococcus pneumoniae BgaC protein as a novel surface β-galactosidase with specific hydrolysis activity for the Galβ1-3GlcNAc moiety of oligosaccharides. J Bacteriol. 2009;191: 3011–3023. doi:10.1128/JB.01601-08
4. Kaufman GE, Yother J. CcpA-dependent and -independent control of beta-galactosidase expression in Streptococcus pneumoniae occurs via regulation of an
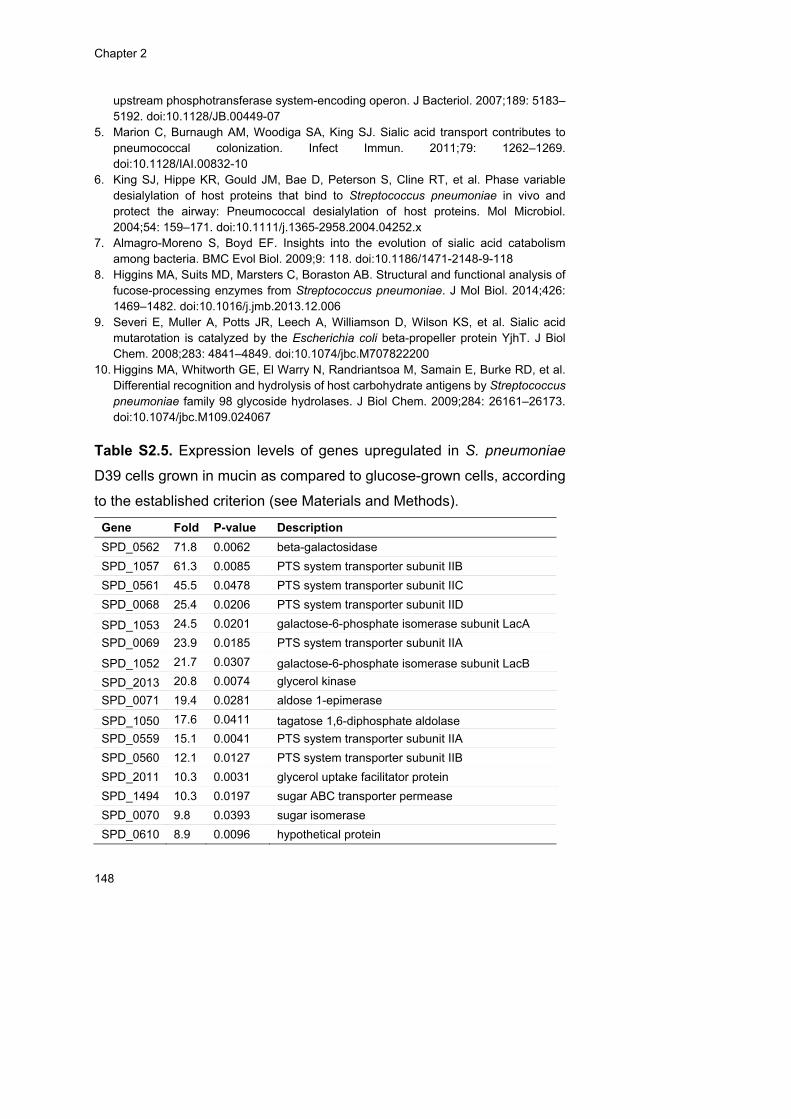
Chapter 2
148
upstream phosphotransferase system-encoding operon. J Bacteriol. 2007;189: 5183–5192. doi:10.1128/JB.00449-07
5. Marion C, Burnaugh AM, Woodiga SA, King SJ. Sialic acid transport contributes to pneumococcal colonization. Infect Immun. 2011;79: 1262–1269. doi:10.1128/IAI.00832-10
6. King SJ, Hippe KR, Gould JM, Bae D, Peterson S, Cline RT, et al. Phase variable desialylation of host proteins that bind to Streptococcus pneumoniae in vivo and protect the airway: Pneumococcal desialylation of host proteins. Mol Microbiol. 2004;54: 159–171. doi:10.1111/j.1365-2958.2004.04252.x
7. Almagro-Moreno S, Boyd EF. Insights into the evolution of sialic acid catabolism among bacteria. BMC Evol Biol. 2009;9: 118. doi:10.1186/1471-2148-9-118
8. Higgins MA, Suits MD, Marsters C, Boraston AB. Structural and functional analysis of fucose-processing enzymes from Streptococcus pneumoniae. J Mol Biol. 2014;426: 1469–1482. doi:10.1016/j.jmb.2013.12.006
9. Severi E, Muller A, Potts JR, Leech A, Williamson D, Wilson KS, et al. Sialic acid mutarotation is catalyzed by the Escherichia coli beta-propeller protein YjhT. J Biol Chem. 2008;283: 4841–4849. doi:10.1074/jbc.M707822200
10. Higgins MA, Whitworth GE, El Warry N, Randriantsoa M, Samain E, Burke RD, et al. Differential recognition and hydrolysis of host carbohydrate antigens by Streptococcus pneumoniae family 98 glycoside hydrolases. J Biol Chem. 2009;284: 26161–26173. doi:10.1074/jbc.M109.024067
Table S2.5. Expression levels of genes upregulated in S. pneumoniae
D39 cells grown in mucin as compared to glucose-grown cells, according
to the established criterion (see Materials and Methods).
Gene Fold P-value Description
SPD_0562 71.8 0.0062 beta-galactosidase
SPD_1057 61.3 0.0085 PTS system transporter subunit IIB
SPD_0561 45.5 0.0478 PTS system transporter subunit IIC
SPD_0068 25.4 0.0206 PTS system transporter subunit IID
SPD_1053 24.5 0.0201 galactose-6-phosphate isomerase subunit LacA
SPD_0069 23.9 0.0185 PTS system transporter subunit IIA
SPD_1052 21.7 0.0307 galactose-6-phosphate isomerase subunit LacB
SPD_2013 20.8 0.0074 glycerol kinase
SPD_0071 19.4 0.0281 aldose 1-epimerase
SPD_1050 17.6 0.0411 tagatose 1,6-diphosphate aldolase
SPD_0559 15.1 0.0041 PTS system transporter subunit IIA
SPD_0560 12.1 0.0127 PTS system transporter subunit IIB
SPD_2011 10.3 0.0031 glycerol uptake facilitator protein
SPD_1494 10.3 0.0197 sugar ABC transporter permease
SPD_0070 9.8 0.0393 sugar isomerase
SPD_0610 8.9 0.0096 hypothetical protein
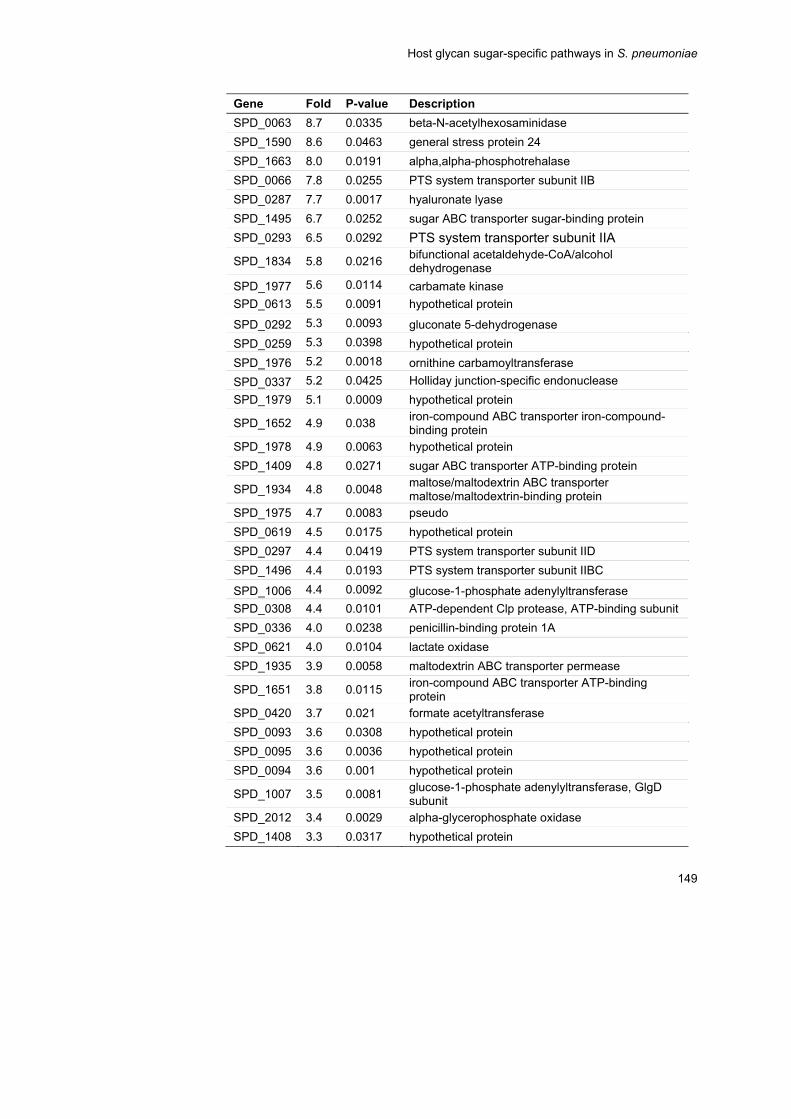
Host glycan sugar-specific pathways in S. pneumoniae
149
Gene Fold P-value Description
SPD_0063 8.7 0.0335 beta-N-acetylhexosaminidase
SPD_1590 8.6 0.0463 general stress protein 24
SPD_1663 8.0 0.0191 alpha,alpha-phosphotrehalase
SPD_0066 7.8 0.0255 PTS system transporter subunit IIB
SPD_0287 7.7 0.0017 hyaluronate lyase
SPD_1495 6.7 0.0252 sugar ABC transporter sugar-binding protein
SPD_0293 6.5 0.0292 PTS system transporter subunit IIA
SPD_1834 5.8 0.0216 bifunctional acetaldehyde-CoA/alcohol dehydrogenase
SPD_1977 5.6 0.0114 carbamate kinase
SPD_0613 5.5 0.0091 hypothetical protein
SPD_0292 5.3 0.0093 gluconate 5-dehydrogenase
SPD_0259 5.3 0.0398 hypothetical protein
SPD_1976 5.2 0.0018 ornithine carbamoyltransferase
SPD_0337 5.2 0.0425 Holliday junction-specific endonuclease
SPD_1979 5.1 0.0009 hypothetical protein
SPD_1652 4.9 0.038 iron-compound ABC transporter iron-compound-binding protein
SPD_1978 4.9 0.0063 hypothetical protein
SPD_1409 4.8 0.0271 sugar ABC transporter ATP-binding protein
SPD_1934 4.8 0.0048 maltose/maltodextrin ABC transporter maltose/maltodextrin-binding protein
SPD_1975 4.7 0.0083 pseudo
SPD_0619 4.5 0.0175 hypothetical protein
SPD_0297 4.4 0.0419 PTS system transporter subunit IID
SPD_1496 4.4 0.0193 PTS system transporter subunit IIBC
SPD_1006 4.4 0.0092 glucose-1-phosphate adenylyltransferase
SPD_0308 4.4 0.0101 ATP-dependent Clp protease, ATP-binding subunit
SPD_0336 4.0 0.0238 penicillin-binding protein 1A
SPD_0621 4.0 0.0104 lactate oxidase
SPD_1935 3.9 0.0058 maltodextrin ABC transporter permease
SPD_1651 3.8 0.0115 iron-compound ABC transporter ATP-binding protein
SPD_0420 3.7 0.021 formate acetyltransferase
SPD_0093 3.6 0.0308 hypothetical protein
SPD_0095 3.6 0.0036 hypothetical protein
SPD_0094 3.6 0.001 hypothetical protein
SPD_1007 3.5 0.0081 glucose-1-phosphate adenylyltransferase, GlgD subunit
SPD_2012 3.4 0.0029 alpha-glycerophosphate oxidase
SPD_1408 3.3 0.0317 hypothetical protein
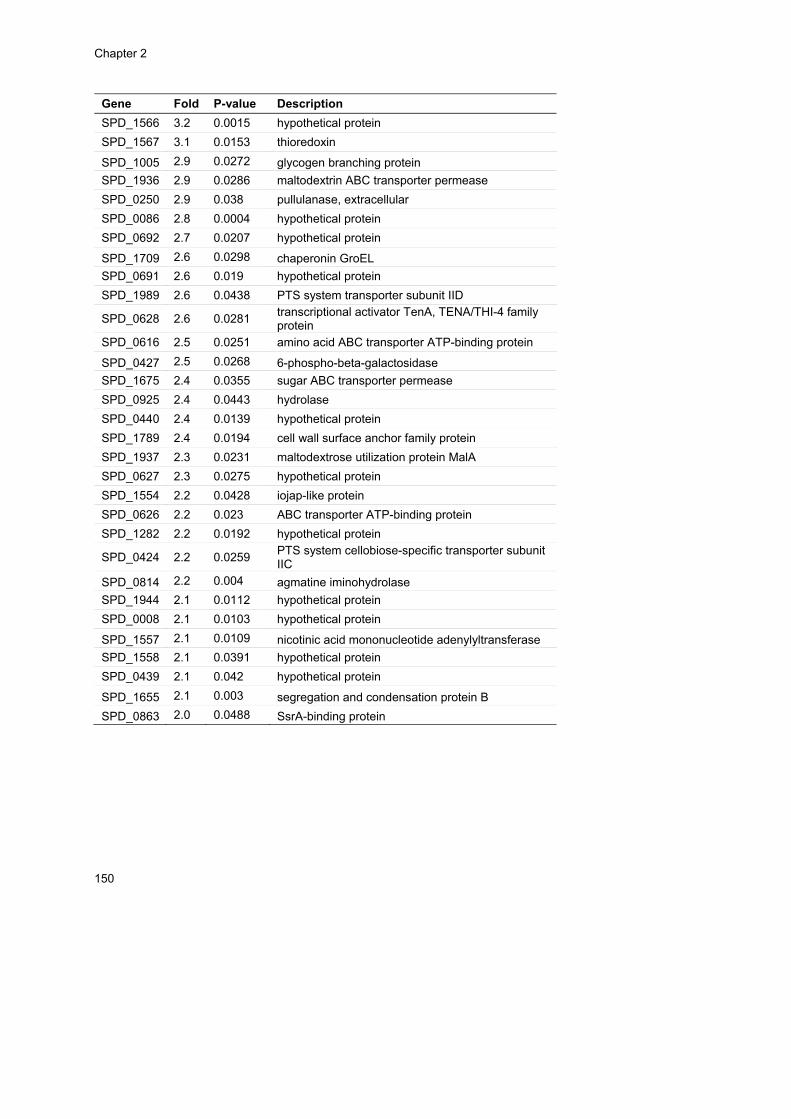
Chapter 2
150
Gene Fold P-value Description
SPD_1566 3.2 0.0015 hypothetical protein
SPD_1567 3.1 0.0153 thioredoxin
SPD_1005 2.9 0.0272 glycogen branching protein
SPD_1936 2.9 0.0286 maltodextrin ABC transporter permease
SPD_0250 2.9 0.038 pullulanase, extracellular
SPD_0086 2.8 0.0004 hypothetical protein
SPD_0692 2.7 0.0207 hypothetical protein
SPD_1709 2.6 0.0298 chaperonin GroEL
SPD_0691 2.6 0.019 hypothetical protein
SPD_1989 2.6 0.0438 PTS system transporter subunit IID
SPD_0628 2.6 0.0281 transcriptional activator TenA, TENA/THI-4 family protein
SPD_0616 2.5 0.0251 amino acid ABC transporter ATP-binding protein
SPD_0427 2.5 0.0268 6-phospho-beta-galactosidase
SPD_1675 2.4 0.0355 sugar ABC transporter permease
SPD_0925 2.4 0.0443 hydrolase
SPD_0440 2.4 0.0139 hypothetical protein
SPD_1789 2.4 0.0194 cell wall surface anchor family protein
SPD_1937 2.3 0.0231 maltodextrose utilization protein MalA
SPD_0627 2.3 0.0275 hypothetical protein
SPD_1554 2.2 0.0428 iojap-like protein
SPD_0626 2.2 0.023 ABC transporter ATP-binding protein
SPD_1282 2.2 0.0192 hypothetical protein
SPD_0424 2.2 0.0259 PTS system cellobiose-specific transporter subunit IIC
SPD_0814 2.2 0.004 agmatine iminohydrolase
SPD_1944 2.1 0.0112 hypothetical protein
SPD_0008 2.1 0.0103 hypothetical protein
SPD_1557 2.1 0.0109 nicotinic acid mononucleotide adenylyltransferase
SPD_1558 2.1 0.0391 hypothetical protein
SPD_0439 2.1 0.042 hypothetical protein
SPD_1655 2.1 0.003 segregation and condensation protein B
SPD_0863 2.0 0.0488 SsrA-binding protein

Host glycan sugar-specific pathways in S. pneumoniae
151
Table S2.6. Expression ratio as determined by qRT-PCR of genes
selected from the microarray experiment comparing mRNA levels in
mucin-grown to glucose-grown S. pneumoniae D39 cells.
Targets Relative fold increase
SD
SPD_0559 PTS system transporter subunit IIA 32.9 5.0
SPD_0561 PTS system transporter subunit IIC 31.4 3.1
SPD_0610 Hypothetical protein 2.4 0.5
SPD_1057 PTS system transporter subunit IIB 38.2 6.3
SPD_1494 Sugar ABC transporter permease 67.0 16.9
SPD_2011 Glycerol uptake facilitator protein 16.0 1.1
SPD_1334 F0F1 ATP synthase subunit epsilon (EC:3.6.3.14) 0.3 0.1
SPD_1839 Transketolase (EC:2.2.1.1) 0.2 0.0
SPD_1956 Dihydroxy-acid dehydratase 0.2 0.1
SD, standard deviation.
Table S2.7. Expression ratio of genes involved in galactose catabolism in
exponentially growing S. pneumoniae D39 cells disrupted in galK or galT-
2 genes.
Carbon source - strain
Gene Glc-∆galK / Glc-D39 Glc-∆galK / Gal-D39 Gal-∆galT-2 / Gal-D39
galT-2 0.54 ± 0.24 0.51 ± 0.22 -
galT-1 ND ND 49.41 ± 3.55
lacD 0.81 ± 0.03 0.0044 ± 0.0002 87.42 ± 5.41
galK - - 19.29 ± 0.74
Values represent the fold difference ± standard deviation transcript levels in the mutant strain as compared to the wild type. Cells were grown in CDM supplemented with glucose or galactose. In the qRT-PCR experiments, the expression values were normalized relative to the housekeeping gene gyrB. ND, not determined.
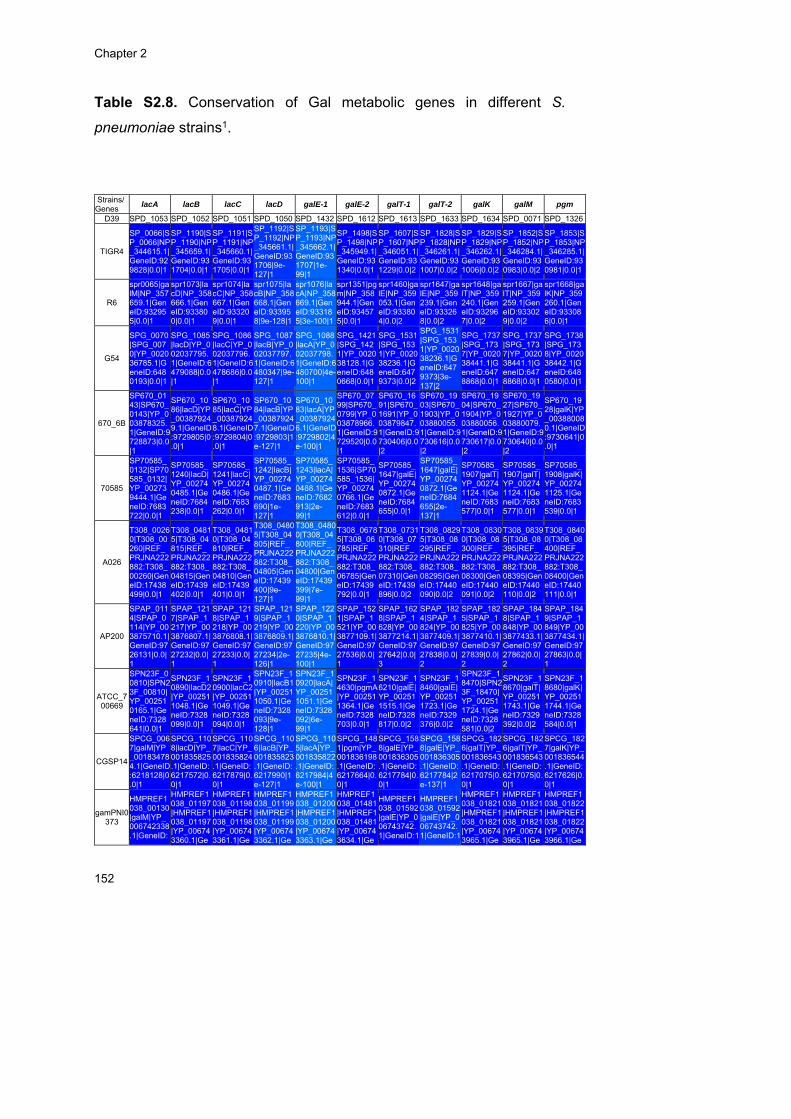
Chapter 2
152
Table S2.8. Conservation of Gal metabolic genes in different S.
pneumoniae strains1.
Strains/Genes
lacA lacB lacC lacD galE-1 galE-2 galT-1 galT-2 galK galM pgm
D39 SPD_1053 SPD_1052 SPD_1051 SPD_1050 SPD_1432 SPD_1612 SPD_1613 SPD_1633 SPD_1634 SPD_0071 SPD_1326
TIGR4
SP_0066|SP_0066|NP_344615.1|GeneID:929828|0.0|1
SP_1190|SP_1190|NP_345659.1|GeneID:931704|0.0|1
SP_1191|SP_1191|NP_345660.1|GeneID:931705|0.0|1
SP_1192|SP_1192|NP_345661.1|GeneID:931706|9e-127|1
SP_1193|SP_1193|NP_345662.1|GeneID:931707|1e-99|1
SP_1498|SP_1498|NP_345949.1|GeneID:931340|0.0|1
SP_1607|SP_1607|NP_346051.1|GeneID:931229|0.0|2
SP_1828|SP_1828|NP_346261.1|GeneID:931007|0.0|2
SP_1829|SP_1829|NP_346262.1|GeneID:931006|0.0|2
SP_1852|SP_1852|NP_346284.1|GeneID:930983|0.0|2
SP_1853|SP_1853|NP_346285.1|GeneID:930981|0.0|1
R6
spr0065|galM|NP_357659.1|GeneID:932955|0.0|1
spr1073|lacD|NP_358666.1|GeneID:933800|0.0|1
spr1074|lacC|NP_358667.1|GeneID:933209|0.0|1
spr1075|lacB|NP_358668.1|GeneID:933958|9e-128|1
spr1076|lacA|NP_358669.1|GeneID:933185|3e-100|1
spr1351|pgm|NP_358944.1|GeneID:934575|0.0|1
spr1460|galE|NP_359053.1|GeneID:933804|0.0|2
spr1647|galE|NP_359239.1|GeneID:933268|0.0|2
spr1648|galT|NP_359240.1|GeneID:932967|0.0|2
spr1667|galT|NP_359259.1|GeneID:933029|0.0|2
spr1668|galK|NP_359260.1|GeneID:933086|0.0|1
G54
SPG_0070|SPG_0070|YP_002036785.1|GeneID:6480193|0.0|1
SPG_1085|lacD|YP_002037795.1|GeneID:6479088|0.0|1
SPG_1086|lacC|YP_002037796.1|GeneID:6478686|0.0|1
SPG_1087|lacB|YP_002037797.1|GeneID:6480347|9e-127|1
SPG_1088|lacA|YP_002037798.1|GeneID:6480700|4e-100|1
SPG_1421|SPG_1421|YP_002038128.1|GeneID:6480668|0.0|1
SPG_1531|SPG_1531|YP_002038236.1|GeneID:6479373|0.0|2
SPG_1531|SPG_1531|YP_002038236.1|GeneID:6479373|3e-137|2
SPG_1737|SPG_1737|YP_002038441.1|GeneID:6478868|0.0|1
SPG_1737|SPG_1737|YP_002038441.1|GeneID:6478868|0.0|1
SPG_1738|SPG_1738|YP_002038442.1|GeneID:6480580|0.0|1
670_6B
SP670_0143|SP670_0143|YP_003878325.1|GeneID:9728873|0.0|1
SP670_1086|lacD|YP_003879249.1|GeneID:9729805|0.0|1
SP670_1085|lacC|YP_003879248.1|GeneID:9729804|0.0|1
SP670_1084|lacB|YP_003879247.1|GeneID:9729803|1e-127|1
SP670_1083|lacA|YP_003879246.1|GeneID:9729802|4e-100|1
SP670_0799|SP670_0799|YP_003878966.1|GeneID:9729520|0.0|1
SP670_1691|SP670_1691|YP_003879847.1|GeneID:9730406|0.0|2
SP670_1903|SP670_1903|YP_003880055.1|GeneID:9730616|0.0|2
SP670_1904|SP670_1904|YP_003880056.1|GeneID:9730617|0.0|2
SP670_1927|SP670_1927|YP_003880079.1|GeneID:9730640|0.0|2
SP670_1928|galK|YP_003880080.1|GeneID:9730641|0.0|1
70585
SP70585_0132|SP70585_0132|YP_002739444.1|GeneID:7683722|0.0|1
SP70585_1240|lacD|YP_002740485.1|GeneID:7684238|0.0|1
SP70585_1241|lacC|YP_002740486.1|GeneID:7683262|0.0|1
SP70585_1242|lacB|YP_002740487.1|GeneID:7683690|1e-127|1
SP70585_1243|lacA|YP_002740488.1|GeneID:7682913|2e-99|1
SP70585_1536|SP70585_1536|YP_002740766.1|GeneID:7683612|0.0|1
SP70585_1647|galE|YP_002740872.1|GeneID:7684655|0.0|1
SP70585_1647|galE|YP_002740872.1|GeneID:7684655|2e-137|1
SP70585_1907|galT|YP_002741124.1|GeneID:7683577|0.0|1
SP70585_1907|galT|YP_002741124.1|GeneID:7683577|0.0|1
SP70585_1908|galK|YP_002741125.1|GeneID:7683539|0.0|1
A026
T308_00260|T308_00260|REF_PRJNA222882:T308_00260|GeneID:17438499|0.0|1
T308_04815|T308_04815|REF_PRJNA222882:T308_04815|GeneID:17439402|0.0|1
T308_04810|T308_04810|REF_PRJNA222882:T308_04810|GeneID:17439401|0.0|1
T308_04805|T308_04805|REF_PRJNA222882:T308_04805|GeneID:17439400|9e-127|1
T308_04800|T308_04800|REF_PRJNA222882:T308_04800|GeneID:17439399|7e-99|1
T308_06785|T308_06785|REF_PRJNA222882:T308_06785|GeneID:17439792|0.0|1
T308_07310|T308_07310|REF_PRJNA222882:T308_07310|GeneID:17439896|0.0|2
T308_08295|T308_08295|REF_PRJNA222882:T308_08295|GeneID:17440090|0.0|2
T308_08300|T308_08300|REF_PRJNA222882:T308_08300|GeneID:17440091|0.0|2
T308_08395|T308_08395|REF_PRJNA222882:T308_08395|GeneID:17440110|0.0|2
T308_08400|T308_08400|REF_PRJNA222882:T308_08400|GeneID:17440111|0.0|1
AP200
SPAP_0114|SPAP_0114|YP_003875710.1|GeneID:9726131|0.0|1
SPAP_1217|SPAP_1217|YP_003876807.1|GeneID:9727232|0.0|1
SPAP_1218|SPAP_1218|YP_003876808.1|GeneID:9727233|0.0|1
SPAP_1219|SPAP_1219|YP_003876809.1|GeneID:9727234|2e-126|1
SPAP_1220|SPAP_1220|YP_003876810.1|GeneID:9727235|4e-100|1
SPAP_1521|SPAP_1521|YP_003877109.1|GeneID:9727536|0.0|1
SPAP_1628|SPAP_1628|YP_003877214.1|GeneID:9727642|0.0|3
SPAP_1824|SPAP_1824|YP_003877409.1|GeneID:9727838|0.0|2
SPAP_1825|SPAP_1825|YP_003877410.1|GeneID:9727839|0.0|2
SPAP_1848|SPAP_1848|YP_003877433.1|GeneID:9727862|0.0|2
SPAP_1849|SPAP_1849|YP_003877434.1|GeneID:9727863|0.0|1
ATCC_700669
SPN23F_00810|SPN23F_00810|YP_002510165.1|GeneID:7328641|0.0|1
SPN23F_10890|lacD2|YP_002511048.1|GeneID:7328099|0.0|1
SPN23F_10900|lacC2|YP_002511049.1|GeneID:7328094|0.0|1
SPN23F_10910|lacB1|YP_002511050.1|GeneID:7328093|9e-128|1
SPN23F_10920|lacA|YP_002511051.1|GeneID:7328092|6e-99|1
SPN23F_14630|pgmA|YP_002511364.1|GeneID:7328703|0.0|1
SPN23F_16210|galE|YP_002511515.1|GeneID:7328817|0.0|2
SPN23F_18460|galE|YP_002511723.1|GeneID:7329376|0.0|2
SPN23F_18470|SPN23F_18470|YP_002511724.1|GeneID:7328581|0.0|2
SPN23F_18670|galT|YP_002511743.1|GeneID:7329392|0.0|2
SPN23F_18680|galK|YP_002511744.1|GeneID:7328584|0.0|1
CGSP14
SPCG_0067|galM|YP_001834784.1|GeneID:6218128|0.0|1
SPCG_1108|lacD|YP_001835825.1|GeneID:6217572|0.0|1
SPCG_1107|lacC|YP_001835824.1|GeneID:6217879|0.0|1
SPCG_1106|lacB|YP_001835823.1|GeneID:6217990|1e-127|1
SPCG_1105|lacA|YP_001835822.1|GeneID:6217984|4e-100|1
SPCG_1481|pgm|YP_001836198.1|GeneID:6217664|0.0|1
SPCG_1588|galE|YP_001836305.1|GeneID:6217784|0.0|1
SPCG_1588|galE|YP_001836305.1|GeneID:6217784|2e-137|1
SPCG_1826|galT|YP_001836543.1|GeneID:6217075|0.0|1
SPCG_1826|galT|YP_001836543.1|GeneID:6217075|0.0|1
SPCG_1827|galK|YP_001836544.1|GeneID:6217626|0.0|1
gamPNI0373
HMPREF1038_00130|galM|YP_006742338.1|GeneID:
HMPREF1038_01197|HMPREF1038_01197|YP_006743360.1|Ge
HMPREF1038_01198|HMPREF1038_01198|YP_006743361.1|Ge
HMPREF1038_01199|HMPREF1038_01199|YP_006743362.1|Ge
HMPREF1038_01200|HMPREF1038_01200|YP_006743363.1|Ge
HMPREF1038_01481|HMPREF1038_01481|YP_006743634.1|Ge
HMPREF1038_01592|galE|YP_006743742.1|GeneID:1
HMPREF1038_01592|galE|YP_006743742.1|GeneID:1
HMPREF1038_01821|HMPREF1038_01821|YP_006743965.1|Ge
HMPREF1038_01821|HMPREF1038_01821|YP_006743965.1|Ge
HMPREF1038_01822|HMPREF1038_01822|YP_006743966.1|Ge

Host glycan sugar-specific pathways in S. pneumoniae
153
Strains/Genes
lacA lacB lacC lacD galE-1 galE-2 galT-1 galT-2 galK galM pgm
13695663|0.0|1
neID:13694484|0.0|1
neID:13694485|0.0|1
neID:13694486|9e-128|1
neID:13694487|2e-99|1
neID:13694764|0.0|1
3694904|0.0|2
3694904|2e-137|2
neID:13695131|0.0|1
neID:13695131|0.0|1
neID:13695132|0.0|1
Hungary19A_6
SPH_0172|SPH_0172|YP_001693594.1|GeneID:6028868|0.0|1
SPH_1308|lacD|YP_001694629.1|GeneID:6029119|0.0|1
SPH_1309|lacC|YP_001694630.1|GeneID:6028693|0.0|1
SPH_1310|lacB|YP_001694631.1|GeneID:6028237|1e-127|1
SPH_1311|lacA|YP_001694632.1|GeneID:6028658|4e-100|1
SPH_1610|SPH_1610|YP_001694905.1|GeneID:6029914|0.0|1
SPH_1720|galE|YP_001695005.1|GeneID:6029325|0.0|1
SPH_1720|galE|YP_001695005.1|GeneID:6029325|3e-137|1
SPH_1968|galT|YP_001695219.1|GeneID:6028304|0.0|1
SPH_1968|galT|YP_001695219.1|GeneID:6028304|0.0|1
SPH_1969|galK|YP_001695220.1|GeneID:6027916|0.0|1
INV104
INV104_00560|INV104_00560|YP_006061766.1|GeneID:12890334|0.0|1
INV104_10250|lacD2|YP_006062675.1|GeneID:12889297|0.0|1
INV104_10260|lacC2|YP_006062676.1|GeneID:12889298|0.0|1
INV104_10270|lacB1|YP_006062677.1|GeneID:12889299|9e-128|1
INV104_10280|lacA|YP_006062678.1|GeneID:12889300|3e-100|1
INV104_12720|pgmA|YP_006062901.1|GeneID:12889544|0.0|1
INV104_13750|galE|YP_006063000.1|GeneID:12889647|0.0|1
INV104_13750|galE|YP_006063000.1|GeneID:12889647|1e-136|1
INV104_15910|galT|YP_006063206.1|GeneID:12889863|0.0|1
INV104_15910|galT|YP_006063206.1|GeneID:12889863|0.0|1
INV104_15920|galK|YP_006063207.1|GeneID:12889864|0.0|1
INV200
SPNINV200_00640|SPNINV200_00640|YP_006065421.1|GeneID:12892837|0.0|1
SPNINV200_10400|lacD2|YP_006066334.1|GeneID:12893843|0.0|1
SPNINV200_10390|lacC2|YP_006066333.1|GeneID:12893842|0.0|1
SPNINV200_10380|lacB1|YP_006066332.1|GeneID:12893841|9e-128|1
SPNINV200_10370|lacA|YP_006066331.1|GeneID:12893840|4e-100|1
SPNINV200_13340|pgmA|YP_006066606.1|GeneID:12894137|0.0|1
SPNINV200_14390|galE|YP_006066707.1|GeneID:12894242|0.0|1
SPNINV200_14390|galE|YP_006066707.1|GeneID:12894242|2e-137|1
SPNINV200_16720|galT|YP_006066933.1|GeneID:12894475|0.0|1
SPNINV200_16720|galT|YP_006066933.1|GeneID:12894475|0.0|1
SPNINV200_16730|galK|YP_006066934.1|GeneID:12894476|0.0|1
JJA
SPJ_0096|SPJ_0096|YP_002735212.1|GeneID:7679307|0.0|1
SPJ_1106|lacD|YP_002736172.1|GeneID:7678952|0.0|1
SPJ_1107|lacC|YP_002736173.1|GeneID:7679693|0.0|1
SPJ_1108|lacB|YP_002736174.1|GeneID:7678624|9e-127|1
SPJ_1109|lacA|YP_002736175.1|GeneID:7679099|4e-100|1
SPJ_1399|SPJ_1399|YP_002736453.1|GeneID:7678642|0.0|1
SPJ_1513|galE1|YP_002736560.1|GeneID:7679002|0.0|2
SPJ_1735|galE2|YP_002736778.1|GeneID:7679225|0.0|2
SPJ_1736|galT1|YP_002736779.1|GeneID:7679139|0.0|2
SPJ_1757|galT2|YP_002736798.1|GeneID:7679807|0.0|2
SPJ_1758|galK|YP_002736799.1|GeneID:7679467|0.0|1
OXC141
SPNOXC_01030|SPNOXC_01030|YP_006063636.1|GeneID:12892523|0.0|1
SPNOXC_10670|lacD2|YP_006064512.1|GeneID:12892053|0.0|1
SPNOXC_10680|lacC2|YP_006064513.1|GeneID:12892054|0.0|1
SPNOXC_10690|lacB1|YP_006064514.1|GeneID:12892055|8e-127|1
SPNOXC_10700|lacA|YP_006064515.1|GeneID:12892056|3e-100|1
SPNOXC_13110|pgmA|YP_006064725.1|GeneID:12892294|0.0|2
SPNOXC_14110|galE|YP_006064821.1|GeneID:12892394|0.0|1
SPNOXC_14110|galE|YP_006064821.1|GeneID:12892394|2e-137|1
SPNOXC_16250|galT|YP_006065024.1|GeneID:12891359|0.0|1
SPNOXC_16250|galT|YP_006065024.1|GeneID:12891359|0.0|1
SPNOXC_16260|galK|YP_006065025.1|GeneID:12891360|0.0|1
P1031
SPP_0130|SPP_0130|YP_002737365.1|GeneID:7681722|0.0|1
SPP_1231|lacD|YP_002738374.1|GeneID:7682622|0.0|1
SPP_1232|lacC|YP_002738375.1|GeneID:7680790|0.0|1
SPP_1233|lacB|YP_002738376.1|GeneID:7682869|9e-128|1
SPP_1234|lacA|YP_002738377.1|GeneID:7682635|2e-99|1
SPP_1518|SPP_1518|YP_002738635.1|GeneID:7682217|0.0|1
SPP_1628|galE2|YP_002738740.1|GeneID:7681911|0.0|2
SPP_1628|galE2|YP_002738740.1|GeneID:7681911|4e-137|2
SPP_1852|galT|YP_002738951.1|GeneID:7681641|0.0|1
SPP_1852|galT|YP_002738951.1|GeneID:7681641|0.0|1
SPP_1853|galK|YP_002738952.1|GeneID:7681858|0.0|1
SPN034156
SPN034156_11710|SPN034156_11710|YP_007765453.1|GeneID:15313175|0.0|1
SPN034156_01550|lacD2|YP_007764514.1|GeneID:15314122|0.0|1
SPN034156_01560|lacC2|YP_007764515.1|GeneID:15312766|0.0|1
SPN034156_01570|lacB1|YP_007764516.1|GeneID:15313128|8e-127|1
SPN034156_01580|lacA|YP_007764517.1|GeneID:15314298|3e-100|1
SPN034156_03990|pgmA|YP_007764726.1|GeneID:15314080|0.0|2
SPN034156_04980|galE|YP_007764821.1|GeneID:15313158|0.0|1
SPN034156_04980|galE|YP_007764821.1|GeneID:15313158|2e-137|1
SPN034156_06980|galT|YP_007765009.1|GeneID:15313148|0.0|1
SPN034156_06980|galT|YP_007765009.1|GeneID:15313148|0.0|1
SPN034156_06990|galK|YP_007765010.1|GeneID:15313130|0.0|1
SPN034183
SPN034183_01090|SPN034183_01090|YP_007813800.1|GeneID:15316268|0.0|1
SPN034183_10670|lacD2|YP_007814667.1|GeneID:15315196|0.0|1
SPN034183_10680|lacC2|YP_007814668.1|GeneID:15315524|0.0|1
SPN034183_10690|lacB1|YP_007814669.1|GeneID:15315420|8e-127|1
SPN034183_10700|lacA|YP_007814670.1|GeneID:15314679|3e-100|1
SPN034183_13100|pgmA|YP_007814881.1|GeneID:15315744|0.0|2
SPN034183_14090|galE|YP_007814975.1|GeneID:15315756|0.0|1
SPN034183_14090|galE|YP_007814975.1|GeneID:15315756|2e-137|1
SPN034183_16280|galT|YP_007815179.1|GeneID:15314538|0.0|1
SPN034183_16280|galT|YP_007815179.1|GeneID:15314538|0.0|1
SPN034183_16290|galK|YP_007815180.1|GeneID:15315034|0.0|1
SPN994038
SPN994038_01090|SPN994038_01090|YP_007811982.1|GeneID:15317785|0.0|1
SPN994038_10560|lacD2|YP_007812845.1|GeneID:15317750|0.0|1
SPN994038_10570|lacC2|YP_007812846.1|GeneID:15316890|0.0|1
SPN994038_10580|lacB1|YP_007812847.1|GeneID:15317206|8e-127|1
SPN994038_10590|lacA|YP_007812848.1|GeneID:15317776|3e-100|1
SPN994038_12990|pgmA|YP_007813058.1|GeneID:15316697|0.0|2
SPN994038_13980|galE|YP_007813153.1|GeneID:15317358|0.0|1
SPN994038_13980|galE|YP_007813153.1|GeneID:15317358|2e-137|1
SPN994038_16170|galT|YP_007813359.1|GeneID:15317536|0.0|1
SPN994038_16170|galT|YP_007813359.1|GeneID:15317536|0.0|1
SPN994038_16180|galK|YP_007813360.1|GeneID:15317211|0.0|1
SPN994039
SPN994039_01090|SPN994039_01090|YP_007762656.1|GeneID:15319150|0.0|1
SPN994039_10570|lacD2|YP_007763519.1|GeneID:15319663|0.0|1
SPN994039_10580|lacC2|YP_007763520.1|GeneID:15319825|0.0|1
SPN994039_10590|lacB1|YP_007763521.1|GeneID:15318841|8e-127|1
SPN994039_10600|lacA|YP_007763522.1|GeneID:15318803|3e-100|1
SPN994039_13000|pgmA|YP_007763732.1|GeneID:15318850|0.0|2
SPN994039_13990|galE|YP_007763826.1|GeneID:15319503|0.0|1
SPN994039_13990|galE|YP_007763826.1|GeneID:15319503|2e-137|1
SPN994039_16180|galT|YP_007764033.1|GeneID:15318996|0.0|1
SPN994039_16180|galT|YP_007764033.1|GeneID:15318996|0.0|1
SPN994039_16190|galK|YP_007764034.1|GeneID:15319135|0.0|1

Chapter 2
154
Strains/Genes
lacA lacB lacC lacD galE-1 galE-2 galT-1 galT-2 galK galM pgm
SPNA45
SPNA45_01963|SPNA45_01963|YP_006702322.1|GeneID:13653306|0.0|1
SPNA45_01452|SPNA45_01452|YP_006701858.1|GeneID:13652797|0.0|1
SPNA45_01453|SPNA45_01453|YP_006701859.1|GeneID:13652798|0.0|1
SPNA45_01454|SPNA45_01454|YP_006701860.1|GeneID:13652799|2e-127|1
SPNA45_01455|SPNA45_01455|YP_006701861.1|GeneID:13652800|3e-100|1
SPNA45_00722|pgmA|YP_006701190.1|GeneID:13652070|0.0|2
SPNA45_00620|galE|YP_006701097.1|GeneID:13651968|0.0|2
SPNA45_00418|SPNA45_00418|YP_006700907.1|GeneID:13651768|0.0|2
SPNA45_00417|SPNA45_00417|YP_006700906.1|GeneID:13651767|0.0|2
SPNA45_00399|galT|YP_006700891.1|GeneID:13651749|0.0|2
SPNA45_00398|galK|YP_006700890.1|GeneID:13651748|0.0|1
ST556
MYY_0140|MYY_0140|YP_006252338.1|GeneID:12900678|0.0|1
MYY_1045|MYY_1045|YP_006253238.1|GeneID:12900478|0.0|1
MYY_1044|MYY_1044|YP_006253237.1|GeneID:12900477|0.0|1
MYY_1043|MYY_1043|YP_006253236.1|GeneID:12900476|9e-127|1
MYY_1042|MYY_1042|YP_006253235.1|GeneID:12900475|7e-99|1
MYY_1427|MYY_1427|YP_006253619.1|GeneID:12901770|0.0|1
MYY_1537|MYY_1537|YP_006253729.1|GeneID:12901881|0.0|2
MYY_1727|MYY_1727|YP_006253917.1|GeneID:12902071|0.0|2
MYY_1728|MYY_1728|YP_006253918.1|GeneID:12902072|0.0|2
MYY_1747|MYY_1747|YP_006253937.1|GeneID:12902091|0.0|2
MYY_1748|MYY_1748|YP_006253938.1|GeneID:12902092|0.0|1
Taiwan19F_14
SPT_0103|SPT_0103|YP_002741615.1|GeneID:7685477|0.0|1
SPT_1036|lacD|YP_002742479.1|GeneID:7686698|0.0|1
SPT_1035|lacC|YP_002742478.1|GeneID:7685228|0.0|1
SPT_1034|lacB|YP_002742477.1|GeneID:7686601|9e-127|1
SPT_1033|lacA|YP_002742476.1|GeneID:7685628|7e-99|1
SPT_1435|SPT_1435|YP_002742841.1|GeneID:7685433|0.0|1
SPT_1547|galE1|YP_002742948.1|GeneID:7685643|0.0|2
SPT_1748|galE2|YP_002743136.1|GeneID:7685733|0.0|2
SPT_1749|galT1|YP_002743137.1|GeneID:7685524|0.0|2
SPT_1769|galT2|YP_002743155.1|GeneID:7686614|0.0|2
SPT_1770|galK|YP_002743156.1|GeneID:7685612|0.0|1
TCH8431_19A
HMPREF0837_10354|HMPREF0837_10354|YP_003723796.1|GeneID:9343608|0.0|1
HMPREF0837_11310|lacD|YP_003724752.1|GeneID:9344568|0.0|1
HMPREF0837_11309|lacC|YP_003724751.1|GeneID:9344567|0.0|1
HMPREF0837_11308|lacB|YP_003724750.1|GeneID:9344566|9e-127|1
HMPREF0837_11307|lacA|YP_003724749.1|GeneID:9344565|7e-99|1
HMPREF0837_11732|pgcA|YP_003725174.1|GeneID:9344995|0.0|1
HMPREF0837_11843|galE|YP_003725285.1|GeneID:9345107|0.0|2
HMPREF0837_12053|galE2|YP_003725495.1|GeneID:9345319|0.0|2
HMPREF0837_12054|galT1|YP_003725496.1|GeneID:9345320|0.0|2
HMPREF0837_12075|galT2|YP_003725517.1|GeneID:9345341|0.0|2
HMPREF0837_12076|galK|YP_003725518.1|GeneID:9345342|0.0|1
1 The table was obtained by a unidirectional Blast search, where the genes of S. pneumoniae D39 was used a query to find homologs in the 25 other genomes. Only the best hit in each genome is shown. Each cell contains the locus tag, e-value and the number of blast hits. The e-value is reflected in the blue colour code. The darker the blue colour, the lower the e-value (and more significant hit). This table is also available on the CD.
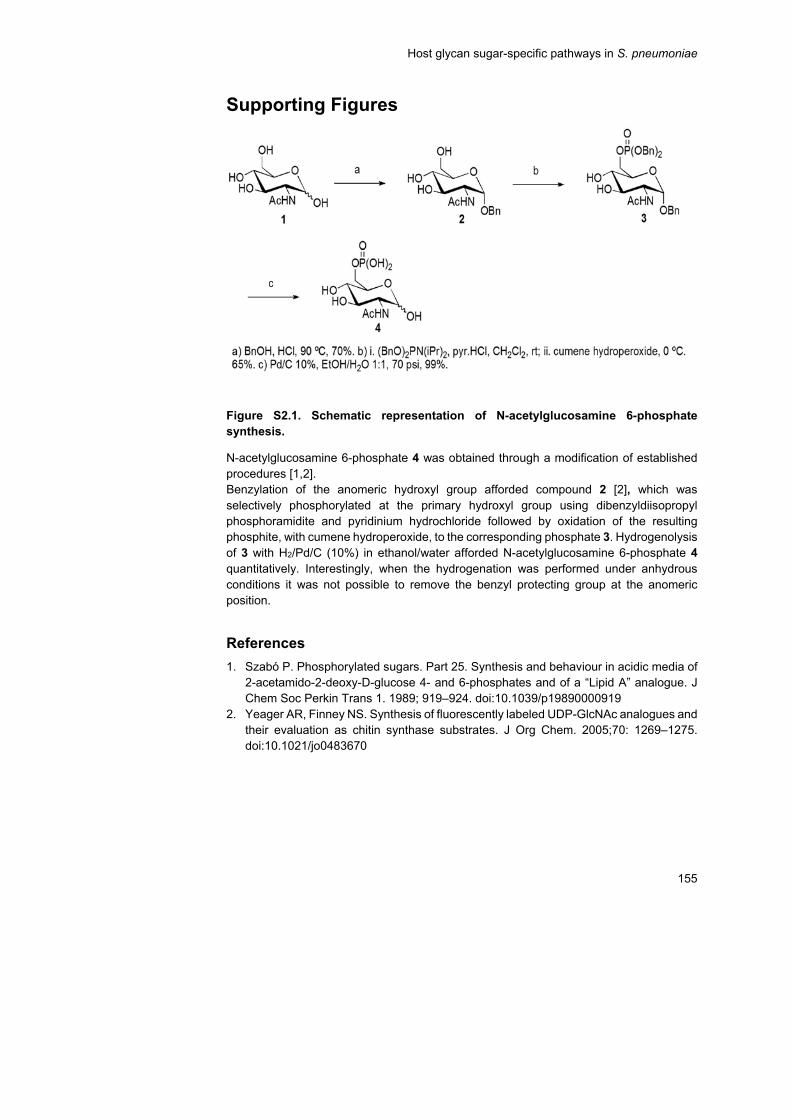
Host glycan sugar-specific pathways in S. pneumoniae
155
Supporting Figures
Figure S2.1. Schematic representation of N-acetylglucosamine 6-phosphate synthesis.
N-acetylglucosamine 6-phosphate 4 was obtained through a modification of established procedures [1,2]. Benzylation of the anomeric hydroxyl group afforded compound 2 [2], which was selectively phosphorylated at the primary hydroxyl group using dibenzyldiisopropyl phosphoramidite and pyridinium hydrochloride followed by oxidation of the resulting phosphite, with cumene hydroperoxide, to the corresponding phosphate 3. Hydrogenolysis of 3 with H2/Pd/C (10%) in ethanol/water afforded N-acetylglucosamine 6-phosphate 4 quantitatively. Interestingly, when the hydrogenation was performed under anhydrous conditions it was not possible to remove the benzyl protecting group at the anomeric position.
References
1. Szabó P. Phosphorylated sugars. Part 25. Synthesis and behaviour in acidic media of 2-acetamido-2-deoxy-D-glucose 4- and 6-phosphates and of a “Lipid A” analogue. J Chem Soc Perkin Trans 1. 1989; 919–924. doi:10.1039/p19890000919
2. Yeager AR, Finney NS. Synthesis of fluorescently labeled UDP-GlcNAc analogues and their evaluation as chitin synthase substrates. J Org Chem. 2005;70: 1269–1275. doi:10.1021/jo0483670
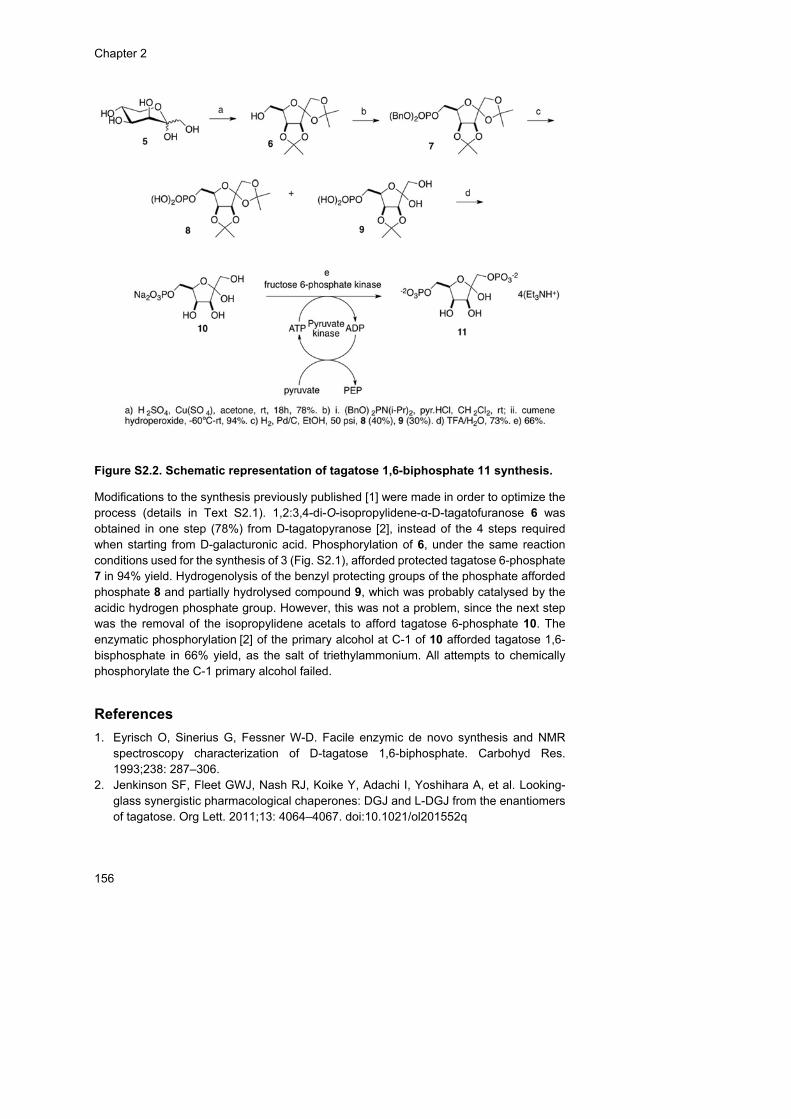
Chapter 2
156
Figure S2.2. Schematic representation of tagatose 1,6-biphosphate 11 synthesis.
Modifications to the synthesis previously published [1] were made in order to optimize the process (details in Text S2.1). 1,2:3,4-di-O-isopropylidene-α-D-tagatofuranose 6 was obtained in one step (78%) from D-tagatopyranose [2], instead of the 4 steps required when starting from D-galacturonic acid. Phosphorylation of 6, under the same reaction conditions used for the synthesis of 3 (Fig. S2.1), afforded protected tagatose 6-phosphate 7 in 94% yield. Hydrogenolysis of the benzyl protecting groups of the phosphate afforded phosphate 8 and partially hydrolysed compound 9, which was probably catalysed by the acidic hydrogen phosphate group. However, this was not a problem, since the next step was the removal of the isopropylidene acetals to afford tagatose 6-phosphate 10. The enzymatic phosphorylation [2] of the primary alcohol at C-1 of 10 afforded tagatose 1,6-bisphosphate in 66% yield, as the salt of triethylammonium. All attempts to chemically phosphorylate the C-1 primary alcohol failed.
References
1. Eyrisch O, Sinerius G, Fessner W-D. Facile enzymic de novo synthesis and NMR spectroscopy characterization of D-tagatose 1,6-biphosphate. Carbohyd Res. 1993;238: 287–306.
2. Jenkinson SF, Fleet GWJ, Nash RJ, Koike Y, Adachi I, Yoshihara A, et al. Looking-glass synergistic pharmacological chaperones: DGJ and L-DGJ from the enantiomers of tagatose. Org Lett. 2011;13: 4064–4067. doi:10.1021/ol201552q

Host glycan sugar-specific pathways in Streptococcus pneumoniae
157
Figure S2.3. Genomic environment of the target genes.
(A) Schematic representation of the genomic context of sugar pathway mutant strains generated in this study. Mutants were constructed by allelic replacement mutagenesis. (B) Organization of genes involved in the catabolism of galactose (A), mannose (B) and N-acetylglucosamine (C). Genes are represented by large arrows. Genes known to be involved in the catabolic reactions (Table S2.4) are shown in black, while other genes in
Chapter 2
158
the same operons are shown in grey. Promoters (arrows) and terminators (lollipops) were determined by RNA-seq [1]. Gene annotations (as from NCBI): galR, galactose operon repressor; galK, galactokinase; galT-2, galactose 1-phosphate uridylyltransferase; lacC, tagatose 6-phosphate kinase; lacD, tagatose 1,6-diphosphate aldolase; lacT, transcription antiterminator LacT; SPD_1867, hypothetical protein; nagA, N-acetylglucosamine 6-phosphate deacetylase; SPD_1865, zinc-containing alcohol dehydrogenase; SPD_0640, pseudo; manA, mannose 6-phosphate isomerase; SPD_0642, sodium-dependent transporter; agaS, sugar isomerase; galM, aldose 1-epimerase; SDP_1617, cell wall surface anchor family protein; SPD_1616, hypothetical protein; SPD_1615, hypothetical protein; SPD_1614, phosphate transport system regulatory protein PhoU; galT-1, galactose 1-phosphate uridylyltransferase; galE-2, UDP-glucose 4-epimerase; SPD_1611, hypothetical protein; SPD_1610, hypothetical protein; SPD_1609, ABC transporter substrate-binding protein; SPD_1608, ABC transporter ATP-binding protein; SPD_1607, ABC transporter permease; SPD_1606, MgtC/SapB family protein; galE-1, UDP-glucose 4-epimerase; SPD_1431, glycosyl transferase family protein; fer, ferredoxin; SPD_1429, hypothetical protein; cmk, cytidylate kinase; pgm, phosphoglucomutase/phosphomannomutase family protein; lacA, galactose 6-phosphate isomerase subunit LacA; lacB, galactose 6-phosphate isomerase subunit LacB; nagB, glucosamine 6-phosphate isomerase; rpsU, 30S ribosomal protein S21. SpeR spectinomycin resistance marker.
References
1. Yuzenkova Y, Gamba P, Herber M, Attaiech L, Shafeeq S, Kuipers OP, et al. Control of transcription elongation by GreA determines rate of gene expression in Streptococcus pneumoniae. Nucleic Acids Res. 2014;42: 10987–10999. doi:10.1093/nar/gku790
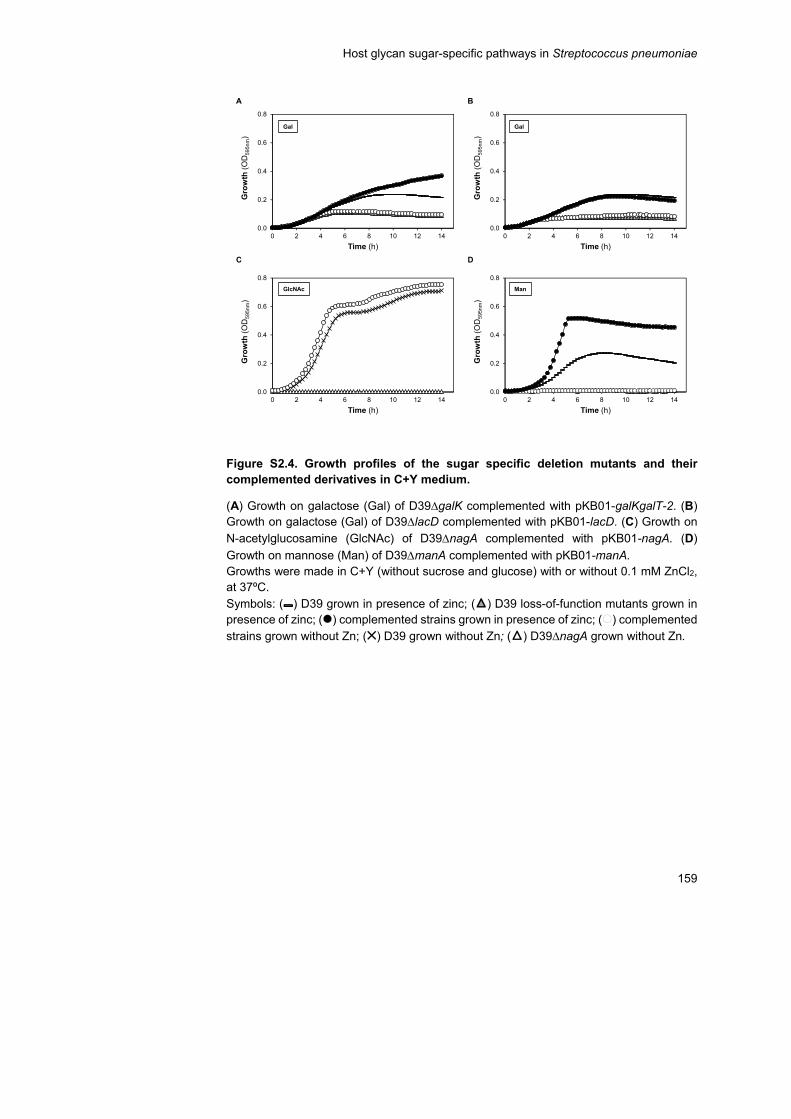
Host glycan sugar-specific pathways in Streptococcus pneumoniae
159
Figure S2.4. Growth profiles of the sugar specific deletion mutants and their complemented derivatives in C+Y medium.
(A) Growth on galactose (Gal) of D39∆galK complemented with pKB01-galKgalT-2. (B) Growth on galactose (Gal) of D39∆lacD complemented with pKB01-lacD. (C) Growth on N-acetylglucosamine (GlcNAc) of D39nagA complemented with pKB01-nagA. (D)
Growth on mannose (Man) of D39manA complemented with pKB01-manA. Growths were made in C+Y (without sucrose and glucose) with or without 0.1 mM ZnCl2, at 37ºC. Symbols: ( ) D39 grown in presence of zinc; ( ) D39 loss-of-function mutants grown in presence of zinc; ( ) complemented strains grown in presence of zinc; ( ) complemented strains grown without Zn; ( ) D39 grown without Zn; ( ) D39∆nagA grown without Zn.
0.0
0.2
0.4
0.6
0.8
0 2 4 6 8 10 12 14
Gro
wth
(OD
595n
m)
Time (h)
0.0
0.2
0.4
0.6
0.8
0 2 4 6 8 10 12 14G
row
th(O
D59
5nm
)Time (h)
Gal
0.0
0.2
0.4
0.6
0.8
0 2 4 6 8 10 12 14
Gro
wth
(OD
595n
m)
Time (h)
Gal
0.0
0.2
0.4
0.6
0.8
0 2 4 6 8 10 12 14
Gro
wth
(OD
595n
m)
Time (h)
GlcNAc Man
A B
C D

Chapter 2
160
Figure S2.5. Analysis of pneumococcal strains in bacteremia model.
Mice were infected intravenously with 100 µl PBS containing approximately 5 X10⁵ CFU through dorsal tail vein. (A) The animals were monitored over 168 h. Symbols show the times when individual mice became severely lethargic, the point when the animals were culled. The horizontal bars mark the median times to the severely lethargic state. (B) Growth of bacteria in the blood. Each point is the mean of data from five mice. Error bars show the standard error of the mean.
Figure S2.6. Subculturing of S. pneumoniae D39∆lacD in chemically defined medium (CDM) supplemented with galactose (Gal).
(A) Pre-culture of S. pneumoniae D39∆lacD in CDM-Gal (55 mM). 1 ml glycerol stock inoculated in 80 ml CDM-Gal (see Materials and Methods). (B) Subculturing of S. pneumoniae D39∆lacD. Inoculation of fresh CDM-Gal (30 mM), to an initial optical density at 600 nm (OD600) of ~ 0.05, with a pre-culture grown in the same sugar (Gal) until late-exponential phase of growth. Growth was performed at 37ºC, under semi-anaerobic conditions, without pH control (initial pH 6.5).
A
Strains
200
150
100
50
0
Su
rviv
al t
ime
(h)
Time post-Infection (h)
D39
∆galK
∆lacD
∆manA
∆nagA
∆lacD∆galK
10
Lo
g10
CF
U p
er m
l o
f b
loo
d
8
6
4
2
024 480
B
-3.0
-2.5
-2.0
-1.5
-1.0
-0.5
0.0
0.5
1.0
0 10 20 30 40 50
Gro
wth
(log 1
0(O
D60
0nm
))
Time (h)
A B
-3.0
-2.5
-2.0
-1.5
-1.0
-0.5
0.0
0.5
1.0
0 10 20 30 40 50
Gro
wth
((lo
g 10(
OD
600n
m))
Time (h)
Host glycan sugar-specific pathways in Streptococcus pneumoniae
161
Supporting Texts
Text S2.1. Modifications to the previously published synthesis of
tagatose 1,6-biphosphate.
Modifications to the synthesis previously published [1] were made in order
to optimize the process.
General.
1H NMR spectra were obtained at 400MHz in CDCl3, with chemical shift
values () in ppm downfield from tetramethylsilane, DMSO-d6 and in D2O,
13C NMR spectra were obtained at 100.61 MHz, 31P NMR spectra were
obtained at 161.97 MHz. Assignments are supported by 2D correlation
NMR studies. Medium pressure preparative column chromatography:
Silica Gel Merck 60 H. Analytical TLC: Aluminium-backed Silica Gel Merck
60 F254. Reagents and solvents were purified and dried according to
Armarego and Chai [2]. All the reactions were carried out under an inert
atmosphere (argon).
6-O-diBenzylphospho-(1,2:3,4)-di-O-isopropylidene-α-D-
tagatofuranose 7. To a stirred solution of 6 (0.53 g, 2.01 mmol) in THF
(10 mL) at r.t. was added dibenzyl N,N-diisopropylphosphoramidite (1.33
mL, 4.02 mmol) and tetrazole (0.28 g, 4.02 mmol). After 24 hours and
complete conversion of the starting material, the reaction was cooled
down to -78ºC and mCPBA (0.69 g, 4.02 mmol) was added. The
temperature was allowed to rise to r.t., and after 90 minutes the reaction
mixture was evaporated. Purification by flash column chromatography on
silica gel (20:80, EtOAc/hexane) afforded the product 6 as a viscous
colourless foam (0.98 g, 94%). 1H NMR (CDCl3): 7.37-7.31 (m, 10H,
CH2Ph), 5.08-5.05 (m, 4H, CH2Ph), 4.73 (dd, 1H, J=3.5 Hz, J=5.8 Hz, H-
4), 4.58 (d, 1H, J=5.8 Hz, H-3), 4.32-4.12 (m, 3H, H-5, 2xH-6), 4.24 (d,

Chapter 2
162
1H, J=9.7 Hz, H-1), 4.01 (d, 1H, J=9.7 Hz, H-1), 1.42 (s, 3H, OMe), 1.38
(s, 3H, OMe), 1.35 (s, 3H, OMe), 1.26 (s, 3H, OMe). 13C NMR (CDCl3):
135.8, 135.7, 128.7, 128.6, 128.5, 128.0, 127.9 (CH2Ph), 112.9 (C-2),
111.9 (C(CH3)2), 111.8 (C(CH3)2), 85.0 (C-3), 79.6 (C-4), 77.7 (d, JC,P=8.0
Hz, C-5), 69.3 (d, JC-P=3.2 Hz, CH2Ph), 69.2 (d, JC-P =2.9 Hz, CH2Ph), 67.3
(d, JC-P=5.7 Hz, C-1), 65.5 (d, JC-P=5.4 Hz, C-6) 26.4 (OMe), 26.3 (OMe),
25.9 (OMe), 24.8 (OMe). 31P NMR (CDCl3): -1.15 (s).
(1,2:3,4)-di-O-isopropylidene-α-D-tagatofuranose 6-(dihydrogen
phosphate) 8. Dibenzyl phosphate 7 (0.98 g, 1.88 mmol) was
hydrogenated at 50 psi in the presence of Pd/C 10% (0.19 g, 0.18 mmol)
in EtOH (12 mL), for 20 hours at r.t. The reaction mixture was then filtered
through celite, washed with EtOH and evaporated. Purification by column
chromatography on silica gel (60:40, MeOH/CH2Cl2) afforded phosphate
diacetal 8 (0.36 g, 56%) and phosphate monoacetal 9 (α/β 1:8.7, 0.23 g,
41%) as colourless viscous foams. The characterisation data for 8 was
identical to the literature [3].
3,4-O-isopropylidene-α/β-D-tagatofuranose 6-(dihydrogen
phosphate) 9. 1H NMR (D2O) : 4.95 (dd, J=3.8 Hz, J=5.9 Hz, H-4 β),
4.91 (dd, J=4.0 Hz, J=6.1 Hz, H-4 α) 4.59 (d, J=5.9 Hz, H-3 β), 4.54 (d,
J=5.9 Hz, H-3 α), 4.36-4.32 (m, H-5 β), 4.30-4.27 (m, H-5 α), 4.10-4.04
(m, H-6 β), 3.96-3.90 (m, H-6 β), 3.74 (d, J=11.6 Hz, H-1 β), 3.60 (d,
J=11.6 Hz, H-1 β), 1.49 (s, OMe α), 1.41 (s, OMe β), 1.32 (s, OMe α), 1.28
(s, OMe β). 31P NMR (D2O): -0.32 (s).
D-Tagatose 6-(dihydrogen phosphate). The product was obtained
following the procedure described in the literature [3]. 1H NMR (D2O):
4.29-4.25 (m), 4.23-4.20 (m), 4.11-4.06 (m), 4.04-3.82 (m), 3.51 (dd,
J=12.0 Hz, J=16.6 Hz, H-1 α), 3.42 (dd, J=12.0 Hz, J=16.6 Hz, H-1 β). 13C
NMR (D2O): 102.7 (C-2), 79.2 (d, JC,P=7.9 Hz, C-5), 70.9, 70.7, 64.6 (d,
JC,P=4.7 Hz, C-6), 62.9 (C-1). 31P NMR (D2O): -0.01 (s).
Host glycan sugar-specific pathways in Streptococcus pneumoniae
163
D-Tagatose 6-phosphate, disodium salt 10. The product was obtained
following the procedure described in the literature [3]. Yield 73%. 1H NMR
(D2O): 4.35-4.32 (m), 4.30-4.28 (m), 4.19-4.11 (m), 4.09-4.00 (m), 3.59
(dd, J=12.0 Hz, J=19.0 Hz, H-1 α), 3.50 (dd, J=12.0 Hz, J=16.4 Hz, H-1
β).
D-Tagatose 1,6-bisphosphate, tetrakis(triethylammonium) salt 11.
The enzymatic phosphorylation of 10 was accomplished following the
procedure described in the literature [3]. The tetrakis(triethylammonium)
salt of 11 was prepared instead of the tetrakis(cyclohexylammonium) salt.
Anomers α:β 1:4, yield 66%. 1H NMR (D2O): 4.54 (t, 1H, J=5.1 Hz, H-4
α), 4.45-4.42 (m, 1H, H-5 α), 4.38 (dd, 1H, J=4.8, J=4.0 Hz, H-4 β), 2.28
(d, 1H, J=4.9 Hz, H-3 β), 4.25-4.20 (m, 1H, H-5 β), 4.17-4.11 (m, 1H, H-6
β), 4.04-4.00 (m, 1H, H-6 β), 3.88 (dd, 1H, J=10.8, J=5.8 Hz, H-1 β), 3.82
(dd, 1H, J=10.8, J=5.08 Hz, H-1 β), 3.19 (q, 24H, J=7.3 Hz, CH3CH2N),
1.27 (t, 36H, J=7.3 Hz, CH3CH2N). 13C NMR (D2O), Anomer β: 101.8 (C-
2), 79.04 (d, J=8.1 Hz, C-5), 70.78 and 70.73 (C-3 and C-4), 65.6 (d,
J=4.99 Hz, C-1), 64.3 (d, J=5.0 Hz, C-6), 46.6 (CH3CH2N), 8.2
(CH3CH2N). 31P NMR (D2O), Anomer β: 0.66 (s), 0.29 (s).
References
1. Eyrisch O, Sinerius G, Fessner W-D. Facile enzymic de novo synthesis and NMR spectroscopy characterization of D-tagatose 1,6-biphosphate. Carbohyd Res. 1993;238: 287–306.
2. Armarego WLF, Chai CLL. Purification of laboratory chemicals. 5th ed. Amsterdam ; Boston: Butterworth-Heinemann; 2003.
3. Jenkinson SF, Fleet GWJ, Nash RJ, Koike Y, Adachi I, Yoshihara A, et al. Looking-glass synergistic pharmacological chaperones: DGJ and L-DGJ from the enantiomers of tagatose. Org Lett. 2011;13: 4064–4067. doi:10.1021/ol201552q
Chapter 2
164
Text S2.2. Genomic potential for the utilization of host
monosaccharides.
Fucose metabolism
Homologues of genes encoding the E. coli Fuc degradation pathway
were found in the D39 genome (Fig. 1 and S4 Table) [1–3]. To further
metabolize anaerobically the final product of Fuc metabolism, L-
lactaldehyde, an L-1,2-propanediol oxidoreductase (FucO) gene is
present in some operons [4]. A BlastP search using as query FucO from
E. coli K-12 MG1655 showed homology (42% identity; 60% positives) to
an iron-containing alcohol dehydrogenase (SPD_1985) of D39, but
whether this protein is functionally active remains to be elucidated.
However, the downstream steps of L-lactaldehyde aerobic degradation
seem to be missing in S. pneumoniae. A PTS system is present in the Fuc
operon of D39, but the implication of this transporter in the uptake of Fuc
is not yet proven. It has been proposed to transport Fuc-containing
oligosaccharides that would subsequently be processed by intracellular
glycoside hydrolases releasing Fuc [2–4].
N-acetylgalactosamine metabolism
Genes involved in the initial steps for the intracellular catabolism of
GalNAc [5–7] remain elusive in the pneumococcus (Fig. 1). However, the
N-acetylgalactosamine 6-phosphate deacetylase (coded by agaA) for
conversion of GalNAc6P to GalN6P in E. coli C str. ATCC 8739, shares
37% amino acid sequence identity with N-acetylglucosamine 6-phosphate
deacetylase (coded by nagA) of D39. Recently, it was shown that NagA
can substitute the activity of AgaA, in E. coli [7,8]. Moreover, in this
microorganism, it was proposed that the isomeration/deamination of
GalN6P to T6P was accomplished by galactosamine 6-phosphate
isomerase (coded by agaS) and not by agaI [7]. The first is annotated in
the genome of D39 and encodes a sugar isomerase (45% amino acid
Host glycan sugar-specific pathways in Streptococcus pneumoniae
165
sequence identity with the one present in E. coli C str. ATCC 8739). A
putative GalNAc transporter (SPD_0293-5-6-7) is annotated in the D39
genome [3] and shares 33% amino acid sequence identity with the
GalNAc transporter subunit EIIC (EcolC_0566) of E. coli C str. ATCC
8739. Additionally, the latter shares 32% amino acid sequence identity
with SPD_1990, which is annotated as being potentially involved in amino
sugar metabolism in D39.
Very recently, the GalNAc pathway was established for Lactobacillus
casei and is encoded in the gnb gene cluster [9]. This route includes a
PTSGnb that transports and phosphorylates the substrate to GalNAc6P
and is subsequently processed through GnbF and GnbE, which encode
for the activities of GalNAc6P deacetylase and GalN6P
deaminase/isomerase, respectively. Moreover, it was found that
conversion of GalNAc6P to GalN6P could also be accomplished by NagA,
as full growth on GalNAc requires both activities.
The PTSGnb shares high amino acid sequence homology with the
pneumococcal mannose-family PTS SPD_0066-7-8-9. In particular the
PTS transport system subunit IIC (LCABL_02930) shares 50% identity
and 65% positives with the S. pneumoniae D39 protein encoded by
SPD_0067. The degradation enzymes GnbF and GnbE share 54% and
48% amino acid sequence identity with NagA (SPD_1866) and AgaS
(SPD_0070) of S. pneumoniae D39, respectively.
In summary, GalNAc catabolic pathways were established in E. coli
and L. casei and according to our analysis S. pneumoniae possesses
gene products showing considerable homology to the proteins in these
organisms. Therefore, it is tempting to suggest that GalNAc is processed
through the combined action of nagA and agaS in S. pneumoniae D39.
However, how to reconcile this hypothesis with the inability to grow on
GalNAc still remains to be investigated.
N-acetylneuraminic acid metabolism
Chapter 2
166
The NeuNAc utilization has been recently studied [3,10,11].
A duplication event might have occurred for the N-acetylneuraminate
lyase gene (SPD_1489 and SPD_1163). N-acetylmannosamine kinase is
annotated in the metabolic database MetaCyc as a glucokinase (gki).
However, a BlastP search led us to suggest that this function is most likely
performed by the ROK family protein (SPD_1488) as this locus is part of
the nanAB operon.
References
1. Chan PF, O’Dwyer KM, Palmer LM, Ambrad JD, Ingraham KA, So C, et al. Characterization of a novel fucose-regulated promoter (PfcsK) suitable for gene essentiality and antibacterial mode-of-action studies in Streptococcus pneumoniae. J Bacteriol. 2003;185: 2051–2058. doi:10.1128/JB.185.6.2051-2058.2003
2. Higgins MA, Whitworth GE, El Warry N, Randriantsoa M, Samain E, Burke RD, et al. Differential recognition and hydrolysis of host carbohydrate antigens by Streptococcus pneumoniae family 98 glycoside hydrolases. J Biol Chem. 2009;284: 26161–26173. doi:10.1074/jbc.M109.024067
3. Bidossi A, Mulas L, Decorosi F, Colomba L, Ricci S, Pozzi G, et al. A functional genomics approach to establish the complement of carbohydrate transporters in Streptococcus pneumoniae. Miyaji EN, editor. PLoS ONE. 2012;7: e33320. doi:10.1371/journal.pone.0033320
4. Higgins MA, Suits MD, Marsters C, Boraston AB. Structural and functional analysis of fucose-processing enzymes from Streptococcus pneumoniae. J Mol Biol. 2014;426: 1469–1482. doi:10.1016/j.jmb.2013.12.006
5. Reizer J, Ramseier TM, Reizer A, Charbit A, Saier MH Jr. Novel phosphotransferase genes revealed by bacterial genome sequencing: a gene cluster encoding a putative N-acetylgalactosamine metabolic pathway in Escherichia coli. Microbiol Read Engl. 1996;142 ( Pt 2): 231–250.
6. Brinkkötter A, Klöss H, Alpert C, Lengeler JW. Pathways for the utilization of N-acetyl-galactosamine and galactosamine in Escherichia coli. Mol Microbiol. 2000;37: 125–135.
7. Hu Z, Patel IR, Mukherjee A. Genetic analysis of the roles of agaA, agaI, and agaS genes in the N-acetyl-D-galactosamine and D-galactosamine catabolic pathways in Escherichia coli strains O157:H7 and C. BMC Microbiol. 2013;13: 94. doi:10.1186/1471-2180-13-94
8. Leyn SA, Gao F, Yang C, Rodionov DA. N-Acetylgalactosamine utilization pathway and regulon in proteobacteria: genomic reconstruction and experimental characterization in Shewanella. J Biol Chem. 2012;287: 28047–28056. doi:10.1074/jbc.M112.382333
9. Bidart GN, Rodríguez-Díaz J, Monedero V, Yebra MJ. A unique gene cluster for the utilization of the mucosal and human milk-associated glycans galacto- N -biose and

Host glycan sugar-specific pathways in Streptococcus pneumoniae
167
lacto- N -biose in L actobacillus casei: Galacto- and lacto- N -biose utilization in Lactobacillus. Mol Microbiol. 2014;93: 521–538. doi:10.1111/mmi.12678
10. Gualdi L, Hayre J, Gerlini A, Bidossi A, Colomba L, Trappetti C, et al. Regulation of neuraminidase expression in Streptococcus pneumoniae. BMC Microbiol. 2012;12: 200. doi:10.1186/1471-2180-12-200
11. Marion C, Burnaugh AM, Woodiga SA, King SJ. Sialic acid transport contributes to pneumococcal colonization. Infect Immun. 2011;79: 1262–1269. doi:10.1128/IAI.00832-10

169
Chapter 3
Transcriptional and metabolic effects of
glucose on S. pneumoniae utilizing glycan-
derived sugars
The results of this chapter will be submitted for publication:
Paixão L, Caldas J, Kloosterman TG, Kuipers OP, Vinga S and Neves
AR (2015). Transcriptional and metabolic effects of glucose on S.
pneumoniae utilizing glycan-derived sugars. Manuscript in preparation.
Chapter 3 - Transcriptional and metabolic effects of
glucose on S. pneumoniae utilizing glycan-derived
sugars


Transcriptional and metabolic responses of S. pneumoniae to sugars
171
Chapter 3 – Contents
Abstract ................................................................................................ 173
Introduction .......................................................................................... 174
Materials and Methods ......................................................................... 178
Bacterial strains and growth conditions ............................................ 178
Quantification of substrate consumption and fermentation products 180
Transcriptome analysis .................................................................... 181
In vivo 13C-NMR experiments with resting cells ............................... 182
Identification of transient resonances ............................................... 184
NMR spectroscopy ........................................................................... 184
Chemicals ......................................................................................... 184
Results and Discussion ........................................................................ 185
Carbon and energy metabolism transcriptome of glycan-derived sugars ............................................................................................... 185
N-acetylglucosamine .................................................................... 190
Mannose ....................................................................................... 191
Galactose ...................................................................................... 193
Glycolytic and end-product profiles on glycan-derived monosaccharides ............................................................................. 196
Catabolism of Glc in galactose-adapted cells .................................. 203
Effect of glucose on the growth of S. pneumoniae ........................... 205
Glucose addition represses mixed acid fermentation profile ............ 210
Effect of glucose on the expression of genes involved in sugar metabolism ....................................................................................... 210
The expression profile of classical virulence factors displays a sugar dependency ...................................................................................... 215
Conclusions ......................................................................................... 221
Acknowledgements .............................................................................. 222
Author’s contribution ............................................................................ 223

Chapter 3
172
References .......................................................................................... 223
Supporting Information ........................................................................ 231
Transcriptional and metabolic responses of S. pneumoniae to sugars
173
Abstract
During the progression from colonisation to disease S. pneumoniae
has to cope with changes in the availability of nutrients, namely glucose
(Glc) a prevailing sugar in blood and inflamed tissues is scarce in the
nasopharynx. We assessed the pneumococcus response to galactose
(Gal), N-acetylglucosamine (GlcNAc) and mannose (Man), which are
present in glycans and support growth of S. pneumoniae D39. The gene
expression and metabolic profiles on glycan-derived sugars were
compared to those on Glc. Gal, GlcNAc and Man affected respectively the
expression of 8.4%, 11.4%, and 14.2% of the genome, covering cellular
functions including central carbon metabolism and virulence. Glycolytic
dynamics were monitored in resting cells using in vivo 13C-NMR. GlcNAc
(and Glc) rendered homolactic fermentation, while Gal and Man
generated mixed-acid profiles. The glycolytic metabolite fructose 1,6-
bisphosphate accumulated, but the pool size was considerably higher
(circa 2.5 times) on GlcNAc (and Glc) than on Man or Gal, consistent with
the homolactic profile. On Gal and Man, the accumulation of specific
metabolic intermediates (α-galactose 6-phosphate and mannose 6-
phosphate) indicated catabolic bottlenecks possibly causing growth
retardation.
S. pneumoniae growing on glycan-derived sugars was challenged with
Glc, and the response to this stimulus was evaluated at transcriptional,
physiological and metabolic levels. Glc was readily consumed (preferred
sugar) and elicited a metabolic shift towards a homolactic profile. On Gal,
this was accompanied by a transient increase of fructose 1,6-
bisphosphate. The transcriptional response to Glc was large (over 5% of
the genome). In central carbon metabolism (most represented category),
Glc exerted mostly negative regulation. Interestingly, the smallest
response was observed on a sugar mix, suggesting that exposure to

Chapter 3
174
varied sugars improves the fitness of S. pneumoniae. The expression of
classical virulence factors was negatively controlled by Glc in a sugar-
dependent manner. Overall, our results strengthen the link between
carbohydrate metabolism, adaptation to host niches and virulence.
Introduction
Streptococcus pneumoniae is a common asymptomatic commensal of
the human nasopharynx, but also a life-threatening pathogen responsible
for severe illnesses such as bacterial meningitis, pneumonia,
septicaemia, as well as milder respiratory infections [1,2]. The
establishment of a carrier state (colonisation) is a precursor for
pneumococcal disease and an important feature for dissemination
through the community [2–4]. Indeed, from the microbe’s fitness
perspective, the success of pneumococcal infections relies on
colonisation, multiplication and transmission to a new host [5].
Consequently, the factors required for its commensal lifestyle might also
be considered virulence factors [5,6]. The mechanisms underlying the
progression from a carrier state to invasive disease are complex, probably
multifactorial and are still poorly understood [7,8]. Notwithstanding,
several studies based on different techniques to evaluate pneumococcal
gene expression, revealed that pneumococcal virulence genes were
differentially expressed in different host niches [7,9–14]. Therefore, we
hypothesise that transition from carriage to disease involves modulation
of pneumococcal gene expression in response to environmental changes.
Indeed, it was shown that changes in the concentrations of metal ions in
different host sites, contributes to virulence in S. pneumoniae (reviewed
in [15,16]).
Transcriptional and metabolic responses of S. pneumoniae to sugars
175
To a large extent the pneumococcal pathogenesis relies on efficient
acquisition and metabolism of carbohydrates required for growth and
survival, but the knowledge of pneumococcal physiology and
pathogenesis is still limited. S. pneumoniae is a strictly fermentative
bacterium relying exclusively on carbohydrates to obtain energy for
growth (Fig. 3.1). Compared to other colonisers of its ecological niche like
Haemophilus influenzae and Neisseria meningitidis, S. pneumoniae
displays the broadest sugar utilization range [17]. Analysis of the genome
suggested the existence of pathways for catabolism of a wide diversity of
carbohydrates [17] and a recent study showed that S. pneumoniae is able
to use at least 32 substrates [18]. In particular, the bacterium has catabolic
pathways for the utilization of galactose (Gal), mannose (Man) and N-
acetylglucosamine (GlcNAc) ([17,18]; Chapter 2). The pneumococcus
possesses at least ten extracellular glycosidases, which enable the
modification and breakdown of host glycans generating free sugars that
can potentially be used for growth (reviewed in King et al. [4]).
Furthermore, over 30% of all the transporters in the genome are
presumably involved in sugar uptake [17,18], a by far larger proportion
than that found in the other microorganisms occupying the same niche
[17,19].
However, to thrive in diverse host environments, the bacterium has to
cope with fluctuations in nature and availability of carbon sources. In the
nasopharynx free sugars are scarce, but glycans are plentiful both in
secretions and on the surface of epithelial cells. In contrast to the airways,
the generally preferred sugar in Streptococcaceae, glucose (Glc), is
present in comparatively higher concentrations in the bloodstream and
during infection [20,21]. We hypothesise that this metabolic flexibility is
important during the transition from colonisation to invasive disease in S.
pneumoniae. To adapt to host environments, the pneumococcus has
developed sophisticated and complex mechanisms.

Chapter 3
176
Figure 3.1. Schematic representation of Gal, Man, GlcNAc and Glc metabolism in S. pneumoniae D39.
Sugar-specific steps, glycolysis and fermentative metabolism are depicted. Putative and functional characterized genes encoding depicted metabolic steps are shown in white boxes. Proposed pathways were reconstructed based on genome information (http://www.ncbi.nlm.nih.gov/genomes/lproks.cgi), literature and database surveys (KEGG, MetaCyc). Gene annotation downloaded from NCBI: gki, glucokinase; pgi, glucose 6-phosphate isomerase; pfkA, 6-phosphofructokinase; fba, fructose bisphosphate aldolase; tpiA, triosephosphate isomerase; gap, glyceraldehyde-3-phosphate dehydrogenase; pgk, phosphogltcerate kinase; gpmA, phosphoglyceromutase; eno, phosphopyruvate hydratase (enolase); pyk, pyruvate kinase; ldh, L-lactate dehydrogenase; lctO, lactate oxidase; spxB, pyruvate oxidase; ackA, acetate kinase; pta, phosphotransacetylase; pflB, pyruvate formate-lyase; adh (spd_1834), bifunctional acetaldehyde-CoA/alcohol dehydrogenase; galM, aldose 1-epimerase; galK, galactokinase; galE-1, UDP-glucose 4-epimerase; galT-2, galactose 1-phosphate uridylyltransferase; pgm, phosphoglucomutase/phosphomannomutase family protein; lacA, galactose 6-phosphate isomerase subunit LacA; lacB, galactose 6-phosphate isomerase subunit LacB; lacC, tagatose 6-phosphate kinase; lacD, tagatose 1,6-diphosphate aldolase; manA, mannose 6-phosphate isomerase; nagA, N-acetylglucosamine 6-phosphate deacetylase; nagB, glucosamine 6-phosphate isomerase. Intermediates: G6P, glucose 6-phosphate; F6P, fructose 6-phosphate; FBP, fructose 1,6-biphosphate; GAP, glyceraldehyde 3-phosphate; DHAP, dihydroxyacetone phosphate;
Pyruvate Ac-P AcetatespxB
ldh NADHNAD+
LactateO2 H2O2
lctO ackA
AcCoA
CoA
Formate
Ethanol
PiCoA
pta
2NADH
2NAD+
CoAadh
pflB
FBP
DHAP
GAPfba
tpiA
Gal6P
T6P
TBP
ADP
ATP
PEP
PYR
lacAB
lacC
lacD
Galactose
G6P
F6PpfkA
PEP
PYR
gki
Glucose
pgi
αG1PαGal1PGal
Galactose
pgm
galT-2
galE-1
UDP-Glc UDP-Gal
galM
galK
ADPATP
ADPATP
NADH
NAD+
1,3-BPG
3-PGA
2-PGA
PEP
pyk
eno
Pi
ATP
ATP
gap
pgk
gpmA
Pi, O2ATPADPH2O2, CO2
Glc
Man6P
Mannose Glucose
manA
NH3H2O
GlcN6P
H2O AcetateGlc
NA
c
GlcNAc6PnagA nagB
PEP
PYR
PE
P
PY
R
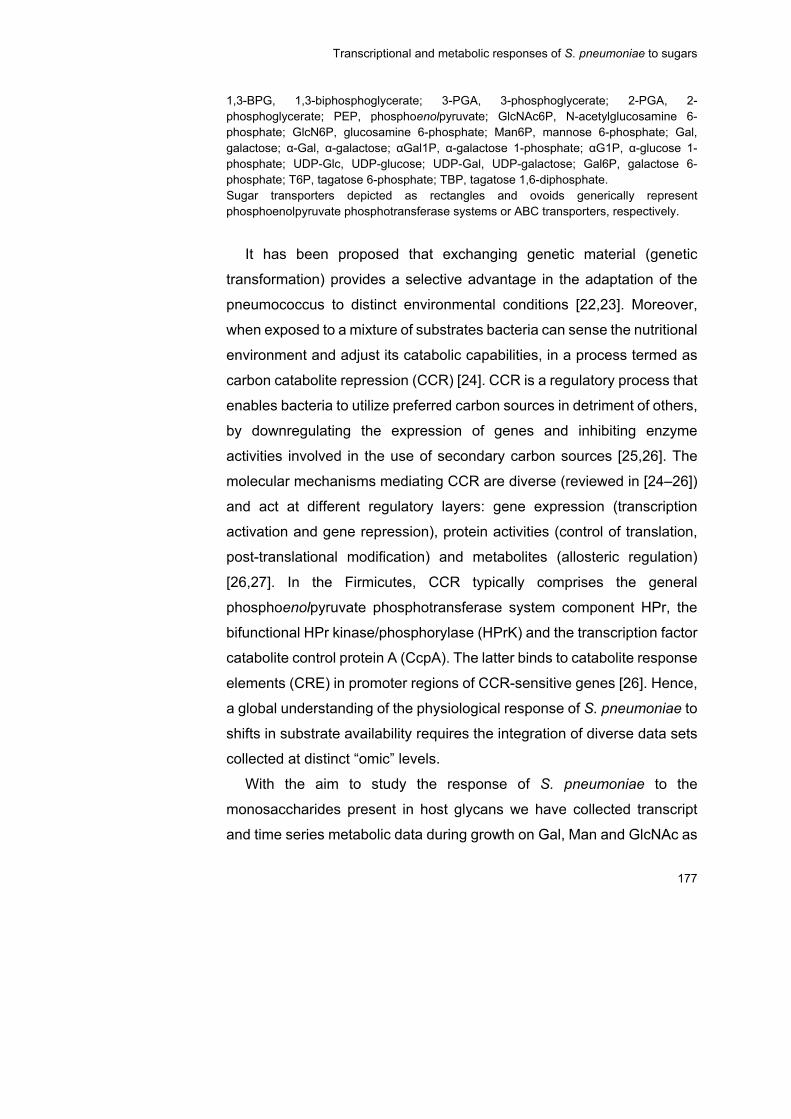
Transcriptional and metabolic responses of S. pneumoniae to sugars
177
1,3-BPG, 1,3-biphosphoglycerate; 3-PGA, 3-phosphoglycerate; 2-PGA, 2-phosphoglycerate; PEP, phosphoenolpyruvate; GlcNAc6P, N-acetylglucosamine 6-phosphate; GlcN6P, glucosamine 6-phosphate; Man6P, mannose 6-phosphate; Gal, galactose; α-Gal, α-galactose; αGal1P, α-galactose 1-phosphate; αG1P, α-glucose 1-phosphate; UDP-Glc, UDP-glucose; UDP-Gal, UDP-galactose; Gal6P, galactose 6-phosphate; T6P, tagatose 6-phosphate; TBP, tagatose 1,6-diphosphate. Sugar transporters depicted as rectangles and ovoids generically represent phosphoenolpyruvate phosphotransferase systems or ABC transporters, respectively.
It has been proposed that exchanging genetic material (genetic
transformation) provides a selective advantage in the adaptation of the
pneumococcus to distinct environmental conditions [22,23]. Moreover,
when exposed to a mixture of substrates bacteria can sense the nutritional
environment and adjust its catabolic capabilities, in a process termed as
carbon catabolite repression (CCR) [24]. CCR is a regulatory process that
enables bacteria to utilize preferred carbon sources in detriment of others,
by downregulating the expression of genes and inhibiting enzyme
activities involved in the use of secondary carbon sources [25,26]. The
molecular mechanisms mediating CCR are diverse (reviewed in [24–26])
and act at different regulatory layers: gene expression (transcription
activation and gene repression), protein activities (control of translation,
post-translational modification) and metabolites (allosteric regulation)
[26,27]. In the Firmicutes, CCR typically comprises the general
phosphoenolpyruvate phosphotransferase system component HPr, the
bifunctional HPr kinase/phosphorylase (HPrK) and the transcription factor
catabolite control protein A (CcpA). The latter binds to catabolite response
elements (CRE) in promoter regions of CCR-sensitive genes [26]. Hence,
a global understanding of the physiological response of S. pneumoniae to
shifts in substrate availability requires the integration of diverse data sets
collected at distinct “omic” levels.
With the aim to study the response of S. pneumoniae to the
monosaccharides present in host glycans we have collected transcript
and time series metabolic data during growth on Gal, Man and GlcNAc as
Chapter 3
178
single carbon sources and compared to the profiles on Glc. Previously,
we have shown that Glc supported the fastest growth followed by GlcNAc
which was a better substrate than Gal or Man (Paixão et al., 2015,
Chapter 2). The markedly different growth profiles led us to surmise that
growth on these sugars is differently regulated. Furthermore, we
investigated the effect of adding the fast metabolizable sugar (Glc) to S.
pneumoniae cells actively growing on Gal, Man, GlcNAc or in a mixture
thereof on the growth physiology and at the transcriptional and metabolic
levels (by in vivo 13C-NMR, for Gal-adapted cells). Finally, we evaluated
the impact of the substrate for growth on the expression of virulence
factors.
In this work we have generated data at transcript, metabolic and
physiological levels, in respect to S. pneumoniae’ response to sugar
availability. These data can in the future be used as input for predictive
multi-level mathematical models of the pneumococcus metabolic
networks. It is expected that such tools will facilitate our understanding of
complex phenomena and enable the identification of novel targets for the
development of therapeutics.
Materials and Methods
Bacterial strains and growth conditions
Streptococcus pneumoniae strain D39 (serotype 2) and its derivative
D39∆cps (A. M. Cavaleiro, P. Gaspar, T. Kloosterman, O. P. Kuipers and
A. R. Neves., unpublished) were used throughout this study. The D39
isolate was obtained from the culture collection of the Department of
Infection, Immunity and Inflammation, of the University of Leicester.
Stocks were prepared as described elsewhere [28] and stored in glycerol
Transcriptional and metabolic responses of S. pneumoniae to sugars
179
(25% vol/vol) at -80°C. Working stocks were done by transferring 1 ml of
the frozen stock to 25 ml Glc-M17 medium (Difco), followed by incubation
at 37ºC until late exponential phase (OD600 ~0.8). Cultures were
centrifuged (6300 x g, 7min, 4ºC), the supernatant discarded and the
pellet suspended in 20 ml 25% (vol/vol) glycerol-M17. 1 ml aliquots were
stored at -80ºC until further use.
Routinely, S. pneumoniae was grown statically in M17 broth (Difco)
containing 0.5% (wt/vol) glucose (Glc-M17) at 37C. For physiological
studies and transcriptome analysis, S. pneumoniae D39 was grown in
static rubber stoppered bottles at 37ºC and without pH control (initial pH
6.5) in the chemically defined medium (CDM) described by Carvalho et
al. [28]. Growth was performed as reported before (Paixão et al. 2015,
Chapter 2). Cells actively metabolizing single sugars Gal, GlcNAc and
Man (12-15 mM) or a sugar mixture (approximately 6 mM each, herein
denominated sugar mix) were challenged or not with a 10 mM pulse of
Glc at mid-exponential phase of growth. In the case of Glc challenge, cells
metabolizing other sugars were herein denominated “sugar”-adapted
cells. Cultures were started by inoculating fresh CDM, to an initial optical
density at 600 nm (OD600) of ~ 0.05, with a pre-culture grown until late
exponential phase of growth. Pre-cultures were performed as described
by Carvalho et al. [28], except pre-cultures for growth on sugar mix, which
were grown in CDM containing 30 mM of each carbon source. Growth
was monitored by measuring OD600 hourly. Maximum specific growth
rates (μmax) were calculated through linear regressions of the plots of
ln(OD600) versus time during the exponential phase of growth after the Glc
pulse. The values reported are averages of two independent growths.
Chapter 3
180
Quantification of substrate consumption and fermentation
products
Strains were grown in CDM supplemented with the appropriate sugar
as described above. Culture samples (2 mL) were taken at inoculation,
immediately and 1 h after the Glc pulse, and at the onset of the stationary
phase of growth, and centrifuged (16,100 x g, 3 min, 4ºC). The
supernatants were filtered (Q-Max® RR NY syringe 0.22 µm filters) and
stored at - 20ºC until further analysis. Fermentation products, Glc and
GlcNAc were quantified by high performance liquid chromatography
(HPLC) equipped with a refractive index detector (Shodex RI-101, Showa
Denko K. K., Japan) using an HPX-87H anion exchange column (Bio-Rad
Laboratories Inc., California, USA) at 60ºC, with 5 mM H2SO4 as the
elution fluid and a flow rate of 0.5 ml min-1. Gal and Man were quantified
by 1H-NMR and the spectra were acquired in a Bruker AMX300
spectrometer (Bruker BioSpin GmbH). To quantify Gal and Man the
temperature of the probe was set to 18ºC and to 37ºC, respectively. DSS
(3-(trimethylsilyl) propionic acid sodium salt) was added to the samples
and used as an internal concentration standard in 1H-NMR quantifications.
Yields were calculated using the data from samples taken immediately
after inoculation and at the onset of stationary phase of growth. A factor
of 0.38, determined from a dry weight (DW) (mg ml-1) versus OD600 curve,
was used to convert OD600 into DW (mg biomass ml-1). The yield in
biomass was calculated as g of dry weight per mol of substrate consumed.
The ATP yield was determined as the ratio of ATP produced to substrate
consumed at the time of growth arrest assuming that all ATP was
synthesized by substrate-level phosphorylation. The values reported are
averages of two independent growths.
Transcriptional and metabolic responses of S. pneumoniae to sugars
181
Transcriptome analysis
The transcript levels of S. pneumoniae D39 growing in CDM
supplemented with Gal, Man or GlcNAc were compared by transcriptome
analysis to Glc-grown cells. Additionally, cells of D39 grown on a single
sugar (Gal, Man or GlcNAc) or in their mixture challenged with a Glc pulse
(10 mM) were compared to unchallenged cells using whole-genome S.
pneumoniae DNA microarrays [29]. Cells were harvested by
centrifugation (7197 x g, 2.5 min, at room temperature) at exponential
phase of growth 1 h after the pulse challenge that was given at mid-
exponential growth. Cell pellets were suspended in the remaining
medium, frozen in liquid nitrogen and stored at -80 °C. mRNA isolation,
synthesis and labelling of cDNA and hybridization were performed as
described before [29]. RNA extraction was performed from three
independent cultures. Microarray experiments and analysis were done
essentially as described elsewhere [29,30].
In all cases, genes were considered significantly differentially
expressed when the Bayesian p-value was < 0.05 / n. The Bonferroni
correction factor n = 1769 x 7 corresponds to the total number of
differential expression significance tests performed and thus accounts for
multiple hypothesis testing. Overrepresentation of COG categories and
Metacyc pathways (with more than five genes) among significant genes
was assessed via hypergeometric tests with a p-value threshold of p <
0.05 / n, with the Bonferroni correction factor n = 63 x 7 corresponding to
the total number of overrepresentation tests performed.
Heatmap were generated by taking into account the genes that were
differentially expressed in each sample subset (single sugars vs. Glc and
Glc challenged experiments vs. unchallenged cells), and intersecting
those genes with the annotated subset categories: sugar transporters and
sugar catabolic genes (reviewed in Chapter 2, Paixão et al., 2015),
Chapter 3
182
glycolytic genes and genes devoted to pyruvate metabolism (according to
NCBI annotation) and virulence factors (Table S3.1).
Venn diagrams were generated with the Venny tool:
http://bioinfogp.cnb.csic.es/tools/venny/. When creating the gene lists, we
consider D39 genes that are differentially expressed in each conditions,
regardless of the direction of differential expression.
In vivo 13C-NMR experiments with resting cells
Cells of S. pneumoniae D39∆cps were grown under anaerobic
conditions, in a 2-L bioreactor (Sartorius Biostat® B plus) in CDM
supplemented with 55 mM of Gal or GlcNAc. On Man, the biomass
generated was insufficient for NMR studies, thus the cells were grown in
presence of 55 mM of Glc supplemented with 0.5 mM of Man. Growth was
performed with controlled pH (6.5) and temperature (37ºC), under
anaerobic conditions essentially as described before [28]. The medium
was aseptically degassed with argon during 60 min before inoculation.
Cultures were kept homogenized by using an agitation speed of 50 rpm.
Cells were harvested (5750 x g, 7min, 4ºC) in the late-exponential phase
of growth and suspensions prepared essentially as described elsewhere
[31]. In brief, cells were washed twice (5750 x g, 5min, 4ºC) with 50 mM
KPi buffer (pH 6.5) supplemented with 1% (wt/vol) choline and suspended
in 35 ml of the same buffer with 6% (vol/vol) of deuterium oxide.
In vivo 13C-NMR experiments were performed online under controlled
conditions of pH (6.5), temperature (37ºC) and atmosphere (anaerobic
conditions, argon atmosphere), using the circulating system as described
by Neves et al. [31]. Substrates specifically labelled with 13C at carbon one
(20 mM) were added to the cell suspension at time zero and spectra (30
s) acquired sequentially. For the two pulse substrate experiment, cells of
D39∆cps actively metabolizing 20 mM of [1-13C]Gal were challenged with
a 10 mM pulse of [2-13C]Glc. 13C enrichment in different carbons allows
Transcriptional and metabolic responses of S. pneumoniae to sugars
183
traceability of the substrates in deriving intracellular metabolites and end-
products. After substrate depletion and when no changes in the
resonances due to end-products and intracellular metabolites were
observed, the NMR experiment was stopped and a total cell extract was
prepared by passing the cell suspension three times through the French
press (6.21 MPa); the resulting total extract was incubated 15 min at 80-
90ºC and cooled down on ice. Cell debris and denaturated
macromolecules were removed by centrifugation (45696 x g, 10 min, 4ºC),
and the supernatant (herein designated as NMR cell extract) was used for
metabolite quantification of end-products and minor metabolites that
remained inside the cells, which was accomplished in fully relaxed 13C-
spectra, at 30ºC. The lactic acid and acetate produced were quantified in
the NMR cell extract by 1H-NMR on a Bruker AMX300 spectrometer
(Bruker Biospin GmbH), using formic acid (sodium salt) as an internal
concentration standard [31].
Due to fast pulsing conditions during in vivo 13C-spectra acquisition,
correction factors were determined allowing the conversion of peak
intensities into concentration of intracellular metabolites. Correction
factors for resonances due to C1 and C6 of FBP were determined
(0.73±0.07) to convert peak intensities to concentrations as described by
Neves et al. [32], but the temperature was kept at 37ºC. Resonances due
to C1 α-mannose 6-phosphate (α-Man6P) and C1 β-mannose 6-
phosphate (β-Man6P) were determined (0.33 and 0.51, respectively), at
37ºC. A value of 3 µl (mg protein)-1 of intracellular volume of S.
pneumoniae was used to determine the intracellular concentrations of
metabolites [33]. The concentration limit for detection of intracellular
metabolites under the conditions employed was 3-4 mM. For dry mass
determination, 1 ml of cell suspension obtained after in vivo 13C NMR
experiment was filtered through 0.22 µm pore size membranes, dried at
100ºC and desiccated for 45 min prior weighing. This was done in
Chapter 3
184
duplicates for each experiment. The quantitative kinetic data for
intracellular metabolites were determined as described elsewhere [31].
The values presented are averages of at least two independent assays.
Identification of transient resonances
Transient resonances observed during in vivo NMR experiments were
assigned by spiking pure compound to NMR extracts obtained from
actively metabolizing cell suspensions. In brief, during the metabolism of
the labelled substrate, 1 ml aliquot was withdrawn and perchloric acid (0.6
M, final concentration) was added. After 20 min stirring on ice the pH was
set neutral with 2M KOH, and the cell extract was centrifuged (60 min,
4ºC, 16100 x g). The supernatant was frozen with liquid nitrogen,
lyophilized and suspended in bi-distilled water.
NMR spectroscopy 13C spectra were acquired at 125.77 MHz using a quadruple nuclei
probe head on a Bruker AVANCE II 500 MH spectrometer (Bruker Biospin
GmbH, Karlsruhe, Germany), as described before [31].
Determination of the correction factors was accomplished by
acquisition of 13C-NMR spectra with a 60º flip angle and a recycle delay
of 1.5 s, for saturating conditions or 60.5 s (relaxed conditions). For
assignment of unknown compounds, carbon NMR spectra were recorded
using a selective de carbon probe head (13C-Dual).
Carbon chemical shifts are referenced to the resonances of external
methanol, designated at 49.3 ppm.
Chemicals
Galactose and mannose were purchased from Sigma-Aldrich. Glucose
was supplied by Merck and N-acetylglucosamine was purchased from

Transcriptional and metabolic responses of S. pneumoniae to sugars
185
Applichem. [1-13C] labelled compounds (galactose, glucose, mannose
and N–acetylglucosamine) and [2-13C]glucose, 99% isotopic enrichment,
were obtained from Cortecnet. DSS and formic acid (sodium salt) were
purchased from Merck. All other chemicals used were reagent grade.
Results and Discussion
Carbon and energy metabolism transcriptome of glycan-
derived sugars
Mucins and other host glycans are composed of a variety of
monosaccharides. We have previously shown the aptitude of S.
pneumoniae D39 to use GlcNAc, Gal and Man as sole carbon sources for
growth (Paixão et al., 2015, Chapter 2). The growth profiles sustained by
these sugars are markedly different, which indicates differential gene
expression. Thus, to investigate the effect of the glycan-derived
monosaccharides on gene expression, a whole-genome transcriptome
analysis was conducted, in which the transcript levels of cells grown on
Gal, Man or GlcNAc were compared to those of Glc-grown cells (Tables
S3.2, S3.3 and S3.4, all provided on the CD). The results are summarized
in Table 3.1.

Chapter 3
186
Table 3.1. Significantly differentially expressed genes (up- or
downregulated) in cells of S. pneumoniae D39 grown in CDM
supplemented with N-acetylglucosamine (GlcNAc), mannose (Man) or
galactose (Gal) as compared to glucose (Glc), determined by DNA
microarraysa.
Up- or downregulationb
Locus_tag Gene Product GlcNAc Man Gal
Sugar-specific catabolismc
SPD_0071 galM aldose 1-epimerase 0.58
SPD_1050 lacD tagatose 1,6-diphosphate aldolase 3.00
SPD_1051 lacC tagatose-6-phosphate kinase 2.87
SPD_1052 lacB galactose-6-phosphate isomerase subunit LacB
3.05
SPD_1163 N-acetylneuraminate lyase, putative 1.39 0.75
SPD_1246 nagB glucosamine-6-phosphate isomerase 0.46
SPD_1432 galE-1 UDP-glucose 4-epimerase 0.77
SPD_1488 ROK family protein 1.58 0.83
SPD_1612 galE-2 UDP-glucose 4-epimerase -0.57
SPD_1633 galT-2 galactose-1-phosphate uridylyltransferase
3.11
SPD_1634 galK galactokinase 0.64 3.30
SPD_1866 nagA N-acetylglucosamine-6-phosphate deacetylase
0.47
SPD_1993 fucU RbsD/FucU transport protein family protein -0.98
SPD_1994 fucA L-fuculose phosphate aldolase -0.82
SPD_1995 fucK L-fuculose kinase FucK, putative -1.25
Glycolysis
SPD_0445 pgk phosphoglycerate kinase 0.46
SPD_0526 fba fructose-bisphosphate aldolase 0.45
SPD_0790 pyk pyruvate kinase 0.57
SPD_1012 eno enolase 0.61
SPD_1823 gap glyceraldehyde-3-phosphate dehydrogenase 0.53
Downstream pyruvate
SPD_0420 pflB pyruvate formate-lyase 1.25
SPD_0621 lcto lactate oxidase 0.38
SPD_0985 pta phosphotransacetylase 0.64
SPD_1834 adh bifunctional acetaldehyde-CoA/alcohol dehydrogenase
1.00
Sugar-specific transportersc
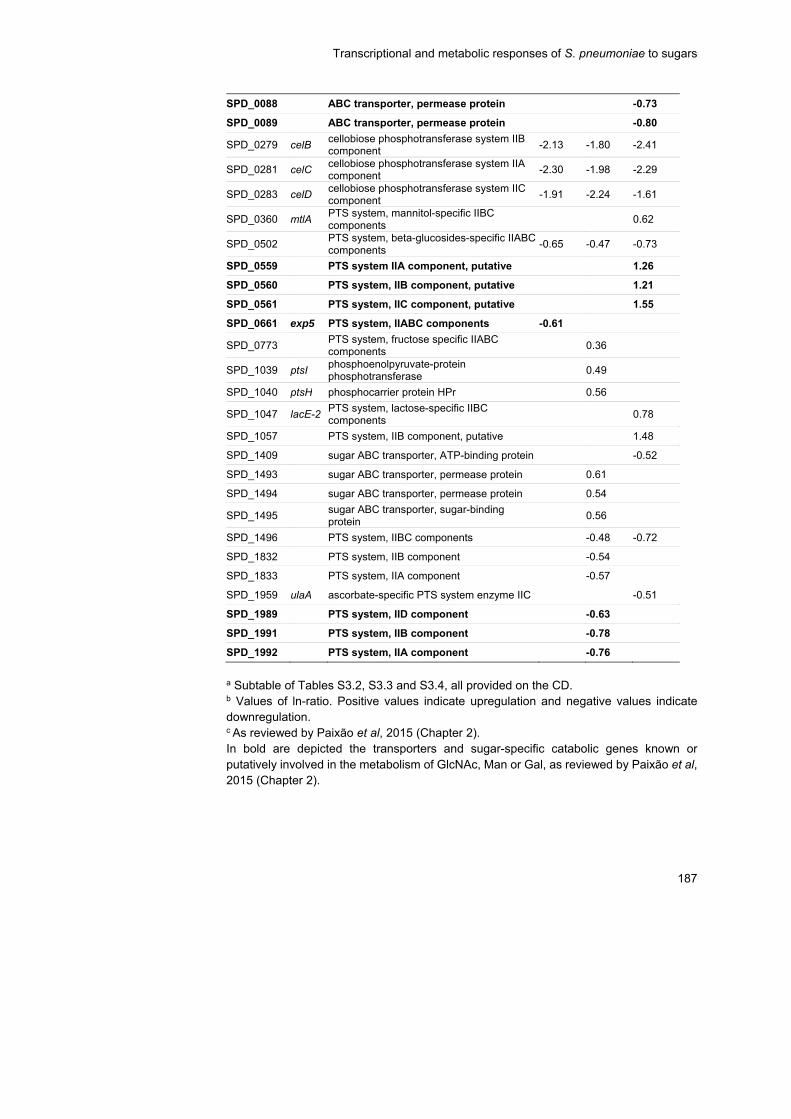
Transcriptional and metabolic responses of S. pneumoniae to sugars
187
SPD_0088 ABC transporter, permease protein -0.73
SPD_0089 ABC transporter, permease protein -0.80
SPD_0279 celB cellobiose phosphotransferase system IIB component
-2.13 -1.80 -2.41
SPD_0281 celC cellobiose phosphotransferase system IIA component
-2.30 -1.98 -2.29
SPD_0283 celD cellobiose phosphotransferase system IIC component
-1.91 -2.24 -1.61
SPD_0360 mtlA PTS system, mannitol-specific IIBC components
0.62
SPD_0502 PTS system, beta-glucosides-specific IIABC components
-0.65 -0.47 -0.73
SPD_0559 PTS system IIA component, putative 1.26
SPD_0560 PTS system, IIB component, putative 1.21
SPD_0561 PTS system, IIC component, putative 1.55
SPD_0661 exp5 PTS system, IIABC components -0.61
SPD_0773 PTS system, fructose specific IIABC components
0.36
SPD_1039 ptsI phosphoenolpyruvate-protein phosphotransferase
0.49
SPD_1040 ptsH phosphocarrier protein HPr 0.56
SPD_1047 lacE-2 PTS system, lactose-specific IIBC components
0.78
SPD_1057 PTS system, IIB component, putative 1.48
SPD_1409 sugar ABC transporter, ATP-binding protein -0.52
SPD_1493 sugar ABC transporter, permease protein 0.61
SPD_1494 sugar ABC transporter, permease protein 0.54
SPD_1495 sugar ABC transporter, sugar-binding protein
0.56
SPD_1496 PTS system, IIBC components -0.48 -0.72
SPD_1832 PTS system, IIB component -0.54
SPD_1833 PTS system, IIA component -0.57
SPD_1959 ulaA ascorbate-specific PTS system enzyme IIC -0.51
SPD_1989 PTS system, IID component -0.63
SPD_1991 PTS system, IIB component -0.78
SPD_1992 PTS system, IIA component -0.76
a Subtable of Tables S3.2, S3.3 and S3.4, all provided on the CD. b Values of ln-ratio. Positive values indicate upregulation and negative values indicate downregulation. c As reviewed by Paixão et al, 2015 (Chapter 2). In bold are depicted the transporters and sugar-specific catabolic genes known or putatively involved in the metabolism of GlcNAc, Man or Gal, as reviewed by Paixão et al, 2015 (Chapter 2).
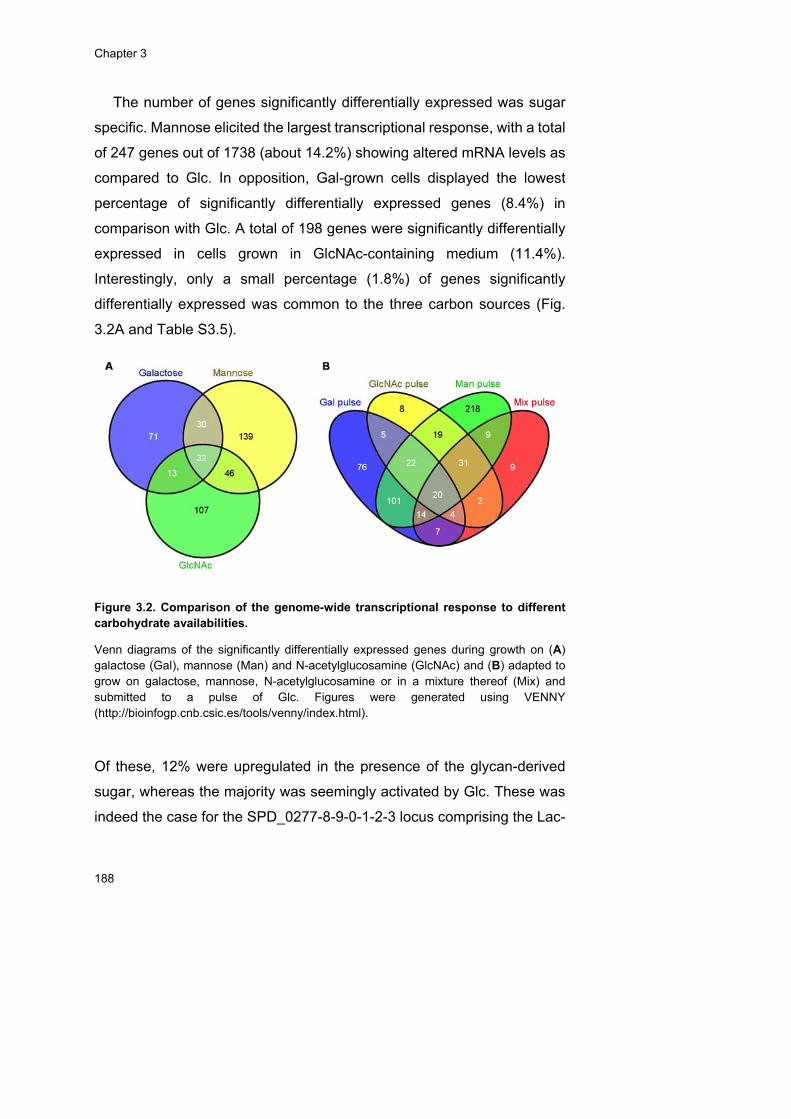
Chapter 3
188
The number of genes significantly differentially expressed was sugar
specific. Mannose elicited the largest transcriptional response, with a total
of 247 genes out of 1738 (about 14.2%) showing altered mRNA levels as
compared to Glc. In opposition, Gal-grown cells displayed the lowest
percentage of significantly differentially expressed genes (8.4%) in
comparison with Glc. A total of 198 genes were significantly differentially
expressed in cells grown in GlcNAc-containing medium (11.4%).
Interestingly, only a small percentage (1.8%) of genes significantly
differentially expressed was common to the three carbon sources (Fig.
3.2A and Table S3.5).
Figure 3.2. Comparison of the genome-wide transcriptional response to different carbohydrate availabilities.
Venn diagrams of the significantly differentially expressed genes during growth on (A) galactose (Gal), mannose (Man) and N-acetylglucosamine (GlcNAc) and (B) adapted to grow on galactose, mannose, N-acetylglucosamine or in a mixture thereof (Mix) and submitted to a pulse of Glc. Figures were generated using VENNY (http://bioinfogp.cnb.csic.es/tools/venny/index.html).
Of these, 12% were upregulated in the presence of the glycan-derived
sugar, whereas the majority was seemingly activated by Glc. These was
indeed the case for the SPD_0277-8-9-0-1-2-3 locus comprising the Lac-
Transcriptional and metabolic responses of S. pneumoniae to sugars
189
PTS transporter celBCD, a 6-phospho-beta-glucosidase celA, a
transcriptional regulator and two hypothetical proteins, which was
downregulated on all conditions tested. Also downregulated was
SPD_0502, which encodes the IIABC components of a Glc-family PTS
system (Table S3.5). Thus, expression of two sugar transporters,
SPD_0502 and CelBCD, supposedly involved in the translocation of beta-
glucosides [18,34,35] is induced by Glc, suggesting a possible role of
these transporters on Glc internalization. The involvement of transporters
other than the PTS-Man (ManLMN) on Glc transport has been postulated,
but not proven to date [18].
Among the three sugars, GlcNAc and Man showed the highest
number of differentially expressed genes in common (46 genes), while
Gal and GlcNAc had the least number of common differentially expressed
genes (only 13 genes) (Fig. 3.2A). In conclusion, growth on Man and
GlcNAc showed the lowest differentially regulation at the transcriptional
level, thus the simultaneous utilization of GlcNAc and Man is likely more
favourable than of one of the previous together with Gal.
Overrepresentation of COG categories among the significantly
differentially expressed genes displayed a sugar dependency (Table S3.6
on the CD). In Gal-grown cells the COG category of “carbohydrate
metabolism and transport” (G) was overrepresented (28 genes out of 146,
fifteen of which were induced) (Tables S3.4 and S3.6, all provided on the
CD). On GlcNAc, the “amino acid metabolism and transport” (E) and the
“translation, ribosomal structure and biogenesis” (J) categories showed
the highest number of genes significantly, differentially expressed (18.7%
and 14.6%, respectively). While in the E category 8 genes out of 37 were
induced, only one gene belonging to the J category was upregulated
(Tables S3.2 and S3.6, all provided on the CD). In Man-grown cells no
differential COG categories were overrepresented, according to the
criterion established (Tables S3.3 and S3.6, all provided on the CD). In
Chapter 3
190
accordance, Man-grown cells displayed the highest percentage (26.3%)
of genes encoding hypothetical proteins differentially expressed.
N-acetylglucosamine
During exponential growth, 198 transcripts were differentially
expressed on GlcNAc as compared to Glc (Bayesian p-value < 0.05 / n).
Of these, only 5.6% belong to the COG category of “carbohydrate
metabolism and transport” (G). Surprisingly, neither GlcNAc specific
transporters nor the dedicated catabolic genes (nagA and nagB) were
altered, except for gene exp5, a putative GlcNAc PTS transporter, which
is downregulated (Tables 3.1 and S3.2 on the CD). This pattern suggests
that Exp5 is not involved in the translocation of the amino sugar, but
further experimental validation is required. In other bacteria, such as
Streptococcus mutans or the model organisms Bacillus subtilis and
Escherichia coli, GlcNAc induced the expression of genes encoding the
specific catabolic pathway [36]. In a previous study, we showed that the
activity of glucosamine 6-phosphate isomerase (NagB) was 4 times
higher than that of N-acetylglucosamine 6-phosphate deacetylase (NagA)
in GlcNAc-grown cells (Paixão et al. 2015, Chapter 2). Re-evaluation of
the microarray data using a less restrictive criterion (Bayesian p-value <
0.001) showed that nagB was slightly induced by GlcNAc (1.40 times), but
the expression of nagA was not altered. In S. mutans, the levels of nagB
and nagA transcripts also differ (mRNA nagB > nagA) [36], and this profile
was interpreted as a mechanism to ensure a response to sugar variations
while keeping the pools of GlcN6P to optimize growth. GlcN6P was
identified as an allosteric effector that alleviates the repression of nagA
and nagB mediated by the transcriptional regulator NagR.
Genes encoding activities in the central carbon pathways, glycolysis
and fermentation (pyruvate conversion) were not significantly differentially
expressed (Table 3.1). The expression data are in good agreement with
our earlier observations showing that fermentation of GlcNAc is
Transcriptional and metabolic responses of S. pneumoniae to sugars
191
essentially homolactic, but fails to explain the lower growth rates on the
amino sugar (about 1.7 times lower than on Glc) (Paixão et al., 2015,
Chapter 2). Growth rate is by far a more complex property, which cannot
be fully explained by differences in the glycolytic flux that might (or not)
arise from differentially expression of genes. A limiting step, however, can
be the uptake of GlcNAc as induction of specific transporters was not
observed.
Of importance, also induced by GlcNAc is the N-
acetylglucosaminidase encoded by strH. This surface-associated
exoglycosidase is involved in the breakdown of GlcNAc residues from
glycans [37,38]. Hence, sensing of free GlcNAc presumably enables S.
pneumoniae to hydrolyse GlcNAc containing glycans.
Mannose
Mannose elicits a global effect and alters considerably the expression
of genes in glycolysis and pyruvate metabolism, as opposed to GlcNAc
(and Gal, see below). Of all the transporters previously postulated as
potentially involved on Man uptake (Paixão et al., 2015, Chapter 2), only
the putative Man-PTS system SPD_1989-1-2 was differentially expressed
on Man. The genes were downregulated, suggesting that their product
might not be involved in Man uptake. Mannose induced a CUT1 ATP-
Binding Cassete (ABC) family transporter (SPD_1493-4-5) and a PTS
system (SPD_0773) (Tables 3.1 and S3.3 on the CD). The first is present
in the sialic acid operon and has been related to sialic acid and N-
acetylmannosamine transport [18,39], whereas the second was assigned
as a fructose transporter [18]. Whether these transporters are involved on
mannose uptake remains to be investigated. Interestingly, the general
components of the PTS systems, phosphocarrier protein HPr (ptsH) and
phosphoenolpyruvate-protein phosphotransferase, Enzyme I (ptsI), were
induced during growth on Man (Table 3.1), indicating that Man
translocation is primarily mediated by a PTS system. In agreement, a ptsI
Chapter 3
192
mutant of strain D39 showed practically no growth on Man, while
inactivation of the PTS-Man (manLMN) dramatically reduced the ability of
strain D39 to grow on mannose (A. M. Cavaleiro, P. Gaspar, T.
Kloosterman, O. P. Kuipers and A. R. Neves, unpublished data). In strain
DP1004, a rough derivative of D39, mutation of ptsI partially reduced the
growth on Man, but non-PTS systems for Man uptake were not ruled out
[18].
The dedicated Man catabolic gene mannose 6-phosphate isomerase
(manA) was not differentially expressed (even using a less restrictive
criterion). The absence of significantly differentially expressed sugar-
specific catabolic genes in the presence of Man and GlcNAc might reflect
the constitutive expression of these genes, as their activities provide
precursors for biosynthesis. In accordance, we have shown activity of
ManA and NagA in Glc-grown cells (Paixão et al., 2015, Chapter 2).
However, we have also reported that in presence of the inducing sugar
their activities were considerable higher (Paixão et al., 2015, Chapter 2).
The lack of correlation between the transcript levels and biochemical data
(enzyme activities) is a recurrent observation in biological systems and
might reflect other layers of regulation [40].
Man induced the expression of glycolytic genes, namely those
encoding fructose-bisphosphate aldolase (fba), glyceraldehyde-3-
phosphate dehydrogenase (gap), phosphoglycerate kinase (pgk),
enolase (eno) and pyruvate kinase (pyk) (Table 3.1). We have proposed
ManA as a metabolic bottleneck in strain D39, since Man-grown cells
accumulate high amounts of mannose 6-phosphate and expression in
trans of manA improves the growth on mannose (Paixão et al., 2015,
Chapter 2). Induction of the glycolytic genes could thereby be a cellular
response to alleviate the burden associated with the accumulation of the
phosphorylated intermediate. Indeed, toxicity ascribed to sugar-
Transcriptional and metabolic responses of S. pneumoniae to sugars
193
phosphate accumulation has often been associated with defects or arrest
of growth [41,42].
Downstream of the pyruvate node, genes encoding the pyruvate
formate-lyase (pflB, SPD_0420), the bifunctional acetaldehyde-
CoA/alcohol dehydrogenase (SPD_1834, adh), and lactate oxidase (lcto)
also showed altered transcription in response to Man (Tables 3.1 and S3.3
on the CD). pflB was among the most upregulated genes in Man-grown
cells. The induction of pyruvate formate-lyase and alcohol dehydrogenase
is in good agreement with the production of formate and ethanol during
growth on the Man (Paixão et al., 2015, Chapter 2).
Galactose
Gal influenced differentially the expression of 146 genes, of which
44.5% were upregulated. On GlcNAc and Man, the fraction of induced
genes was 37.4% and 40.9%, respectively, lower values than on Gal. In
addition, the expression ratios were largest on Gal (Tables S3.2, S3.3 and
S3.4, all provided on the CD), suggesting that Glc is a stronger repressor
of Gal metabolism than of Man or GlcNAc.
Differently from Man and GlcNAc, Gal induced the expression of
putative transporters and specific Gal catabolic genes (Table 3.1). The
galactitol-family PTS, SPD_0559-0-1, was induced (3.4- to 4.7-fold) in
comparison to Glc-grown cells (Tables 3.1 and S3.4 on the CD).
Previously, we reported high upregulation of this operon in mucin-grown
cells (Paixão et al., 2015, Chapter 2, Table 3.1). Our results corroborate
earlier evidence pinpointing SPD_0559-0-1 as a Gal-transporter [18,43].
Additionally, Gal induced the expression of SPD_1057, codifying the EIIB
subunit of a Gat-PTS, and of SPD_1047 (lacE-2) encoding the lactose-
specific IIBC components of a Lac-family PTS. Upregulation of LacFE was
also observed for a different isolate of S. pneumoniae D39 on Gal [27].
The positive effect suggests an involvement of the systems in the uptake
of Gal (Table 3.1). Of note, this Lac-PTS has been implicated in Gal
Chapter 3
194
transport in the closely related organisms S. mutans and L. lactis [44,45].
Induction of mtlA was observed, but this system is specific for mannitol
transport, and the increase expression is most likely due to relief of Glc-
mediated catabolite repression [18]. In contrast, the genes SPD_0088-9,
which encode the permease proteins of a CUT1 ABC transporter
proposed to take up Gal [18], were downregulated (Tables 3.1 and S3.4
on the CD). Whether this finding rules out the involvement of the ABC
transporter in Gal uptake needs experimental confirmation. It should be
noted however, that the evidence previously presented was relatively
weak, since inactivation of the transporter resulted only in a mild reduction
of Gal utilization [18]. A possible explanation is that the inactivation of the
ABC is masked by the activity of other Gal transporters.
As expected, Gal induces both the Leloir and tagatose 6-phosphate
(T6P) pathways (Table 3.1). The Leloir genes galk and galT-2 were
among the most upregulated genes (Table S3.4 on the CD), while UDP-
glucose 4-epimerase (galE-1) and aldolase 1-epimerase (galM) were
induced by 2.2- and 1.8-fold, respectively (Table 3.1). The duplicated
gene galE-2 was downregulated, underpinning the role of galE-1 as the
functional UDP-glucose 4-epimerase in strain D39. The duplicated gene
galT-1 was not differentially expressed, strongly pointing to galT-2 as the
Leloir catabolic gene. Interestingly, we have shown that deletion of galT-
2 resulted in circa 50 times increased expression of galT-1, indicating
galT-1 as a surrogate of galT-2 (Paixão, et al., 2015, Chapter 2). The T6P
pathway genes lacB, lacD and lacC, which codify for galactose 6-
phosphate isomerase subunit LacB, tagatose 1,6-diphosphate aldolase
and tagatose 6-phosphate kinase, respectively, were also highly up-
regulated (Table 3.1). Induction of both pathways in response to Gal is a
recurrent observation in previous studies from our laboratory (Paixão et
al., 2015, Chapter 2, [27]). Curiously, Afzal et al. [46] observed only
increased expression of the T6P pathway genes in response to Gal in S.

Transcriptional and metabolic responses of S. pneumoniae to sugars
195
pneumoniae D39. The different results in the two studies most likely derive
from differences in cultivation medium and/or other experimental
conditions. While we have gathered strong evidence that both pathways
are functional, determining the relative contribution of each pathway to the
metabolism of Gal is, however, not trivial and would require estimating the
flux partitioning between the two routes.
In addition, Gal induced expression of galR, a transcriptional regulator
localized upstream of galK-galT-2 and oriented in the opposite direction.
In other streptococci galR acts as a transcriptional regulator of the Leloir
pathway (gal operon) [47–49]. In S. mutans, GalR represses the gal
operon in the absence of Gal, but intracellular Gal acts as an effective
inducer of the Leloir genes, abolishing the binding of GalR to the
intergenic region of galR-galK [49]. Contradictory studies were reported
for the role of galR in S. thermophillus [50,51]. In S. pneumoniae the role
of galR on Gal metabolism remains to be determined. Gal also induced
the expression of a lactose phosphotransferase system repressor (lacR2),
which recently was identified as a transcriptional repressor of the T6P
pathway in the presence of Glc (and absence of Gal and lactose) [46].
The duplicated gene lacR1 (SPD_0771) was downregulated in presence
of Gal (Table S3.4 on the CD).
Regarding the fermentative genes, only the phosphotransacetylase
gene (SPD_0985, pta), involved in the conversion of acetyl-CoA into
acetyl-phosphate was induced by Gal (Table 3.1). The transcript levels of
ackA, encoding acetate kinase, were unaltered, in agreement with in silico
DNA microarray predictions [27]. This behaviour is however surprising,
considering the remarkable increase (18-fold) in acetate production from
Gal as compared to Glc (Paixão et al., 2015, Chapter 2). Moreover, genes
encoding pyruvate formate-lyase (pflB), pyruvate formate-lyase activating
enzyme (pflA), and the bifunctional acetaldehyde-CoA/alcohol
dehydrogenase were not significantly differentially expressed. This profile
Chapter 3
196
was unexpected, since a pronounced shift to mixed acid fermentation
occurs on Gal (Paixão et al., 2015, Chapter 2, [27]), and induction of the
mixed-acid pathways by Gal was reported before [27]. Also, Gal
reportedly enhances the activity of pyruvate formate-lyase in S. mutans
and L. lactis [52,53]. However, pflB appeared as induced by Gal (ratio
~1.90) in S. pneumoniae D39 when less restrictive significance criterion
(p-value < 0.001 as compared to 0.05 / n) was used as in the study by
Carvalho et al. [27] .
As for many other studies, we also fail to observe a complete
correlation between expression profiles and pneumococcal phenotypic
traits, which ultimately denotes regulation at other cellular layers, such as
post-transcriptional and/or metabolic levels. Thus, in the next section the
glycolytic dynamics of S. pneumoniae D39 during catabolism of the
glycan-derived sugars are investigated.
Glycolytic and end-product profiles on glycan-derived
monosaccharides
Catabolism of GlcNAc, Man and Gal was investigated by in vivo 13C-
NMR in non-growing suspensions of cells grown on the specific sugar
under study. As described, a non-encapsulated derivative of strain D39
was used, D39∆cps. The kinetics of sugar consumption and end-products
formation during the catabolism of [1-13C]GlcNAc, Man and Gal are shown
on Fig. 3.3. Glucose catabolism is shown for comparison on Fig. 3.3D.
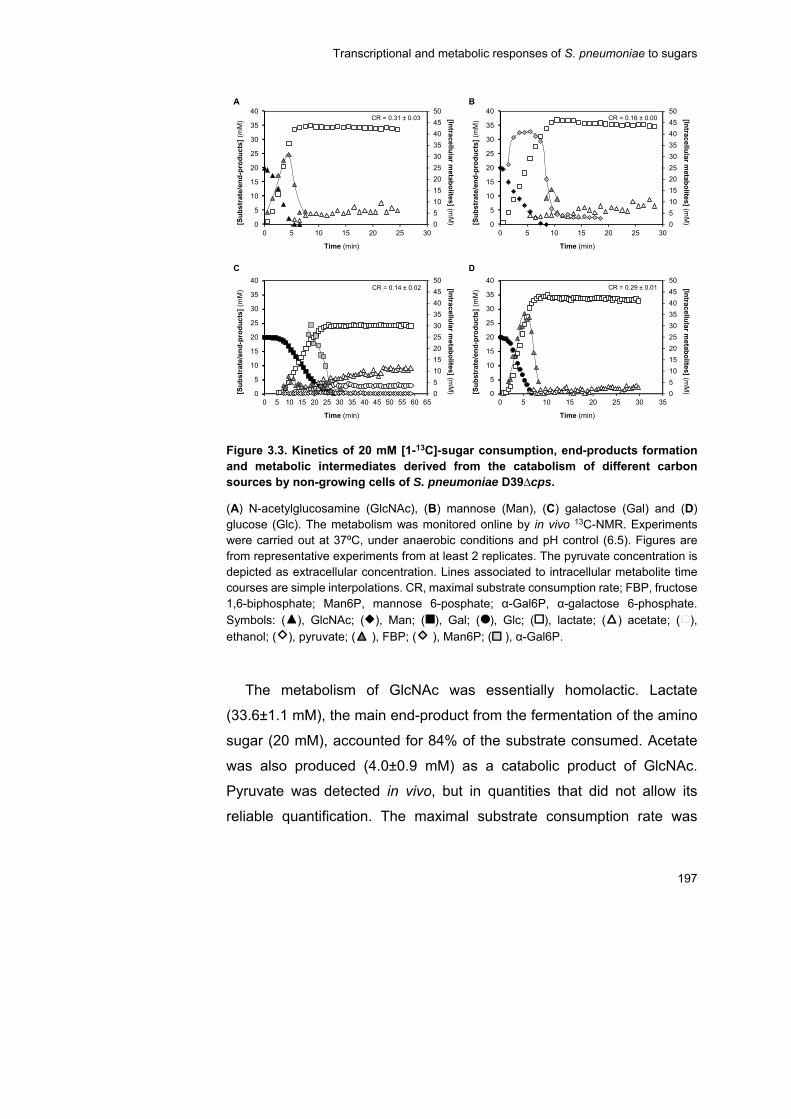
Transcriptional and metabolic responses of S. pneumoniae to sugars
197
Figure 3.3. Kinetics of 20 mM [1-13C]-sugar consumption, end-products formation and metabolic intermediates derived from the catabolism of different carbon sources by non-growing cells of S. pneumoniae D39∆cps.
(A) N-acetylglucosamine (GlcNAc), (B) mannose (Man), (C) galactose (Gal) and (D) glucose (Glc). The metabolism was monitored online by in vivo 13C-NMR. Experiments were carried out at 37ºC, under anaerobic conditions and pH control (6.5). Figures are from representative experiments from at least 2 replicates. The pyruvate concentration is depicted as extracellular concentration. Lines associated to intracellular metabolite time courses are simple interpolations. CR, maximal substrate consumption rate; FBP, fructose 1,6-biphosphate; Man6P, mannose 6-posphate; α-Gal6P, α-galactose 6-phosphate. Symbols: ( ), GlcNAc; ( ), Man; ( ), Gal; ( ), Glc; ( ), lactate; ( ) acetate; ( ), ethanol; ( ), pyruvate; ( ), FBP; ( ), Man6P; ( ), α-Gal6P.
The metabolism of GlcNAc was essentially homolactic. Lactate
(33.6±1.1 mM), the main end-product from the fermentation of the amino
sugar (20 mM), accounted for 84% of the substrate consumed. Acetate
was also produced (4.0±0.9 mM) as a catabolic product of GlcNAc.
Pyruvate was detected in vivo, but in quantities that did not allow its
reliable quantification. The maximal substrate consumption rate was
0
5
10
15
20
25
30
35
40
45
50
0
5
10
15
20
25
30
35
40
0 5 10 15 20 25 30
[Intra
cellu
lar
metab
olites
] (mM
)[Su
bs
trat
e/e
nd
-pro
du
cts
] (m
M)
Time (min)
0
5
10
15
20
25
30
35
40
45
50
0
5
10
15
20
25
30
35
40
0 5 10 15 20 25 30
[Intra
cellu
lar
metab
olites
] (mM
)[Su
bs
trat
e/e
nd
-pro
du
cts
] (m
M)
Time (min)
A B
D
CR = 0.31 ± 0.03 CR = 0.16 ± 0.00
CR = 0.29 ± 0.01
C
CR = 0.14 ± 0.02
0
5
10
15
20
25
30
35
40
45
50
0
5
10
15
20
25
30
35
40
0 5 10 15 20 25 30 35 40 45 50 55 60 65
[Intra
cellu
lar
me
tabo
lites] (m
M)[S
ub
str
ate
/en
d-p
rod
uc
ts]
(mM
)
Time (min)
0
5
10
15
20
25
30
35
40
45
50
0
5
10
15
20
25
30
35
40
0 5 10 15 20 25 30 35
[Intra
cellu
lar
me
tabo
lites] (m
M)[S
ub
str
ate
/en
d-p
rod
uc
ts]
(mM
)
Time (min)
Chapter 3
198
0.31±0.03 µmol min-1 mg-1 of protein (Fig. 3.3A), a value higher than on
Gal or Man, but similar to that on Glc (Fig. 3.3). The fermentation profile
in non-growing suspensions is homolactic as previously shown for
growing cells (Paixão et al., 2015, Chapter 2). In fermentative lactic acid
bacteria, homolactic metabolism has generally been associated with fast
metabolizable sugars [54]. GlcNAc fermentation in S. pneumoniae seems
to be no exception, but the molecular mechanisms underlying this
behaviour have yet to be disclosed (Fig. 3.3).
The glycolytic intermediate fructose 1,6-biphosphate (FBP), was the
only intracellular metabolite detected in non-growing cells by in vivo NMR
(Fig. 3.3A). The FBP pool increased immediately after substrate addition,
reached the maximal concentration at the onset of GlcNAc exhaustion,
and subsequently decreased to undetectable levels (Table 3.2, Fig. 3.3A).
This profile resembles closely the accumulation of FBP during Glc
metabolism (Fig. 3.3D), suggesting that regulation of glycolysis is similar
for both sugars. In agreement, no changes in the transcript levels of
glycolytic and fermentative genes were observed when comparing
expression on GlcNAc to Glc (Tables 3.1 and S3.2 on the CD). Indeed, it
is well documented that FBP accumulates to higher amounts during the
catabolism of fast metabolizable sugars as Glc than less preferred
carbohydrates. The reasons for the accumulation of this metabolite are
diverse [31,54–56] and still matter of debate (reviewed in [57]).
In addition to FBP, the phosphorylated metabolites fructose 6-
phosphate, N-acetylglucosamine 6-phosphate and glucosamine 6-
phosphate were also detected in extracts of cells growing on GlcNAc
(Paixão et al., 2015, Chapter 2, Table S3.7). While the amount of
phosphorylated amino sugars was low, fructose 6-phosphate
accumulated substantially, and thus it is surprising that this metabolite
was not observed in resting cell suspensions (non-growing).
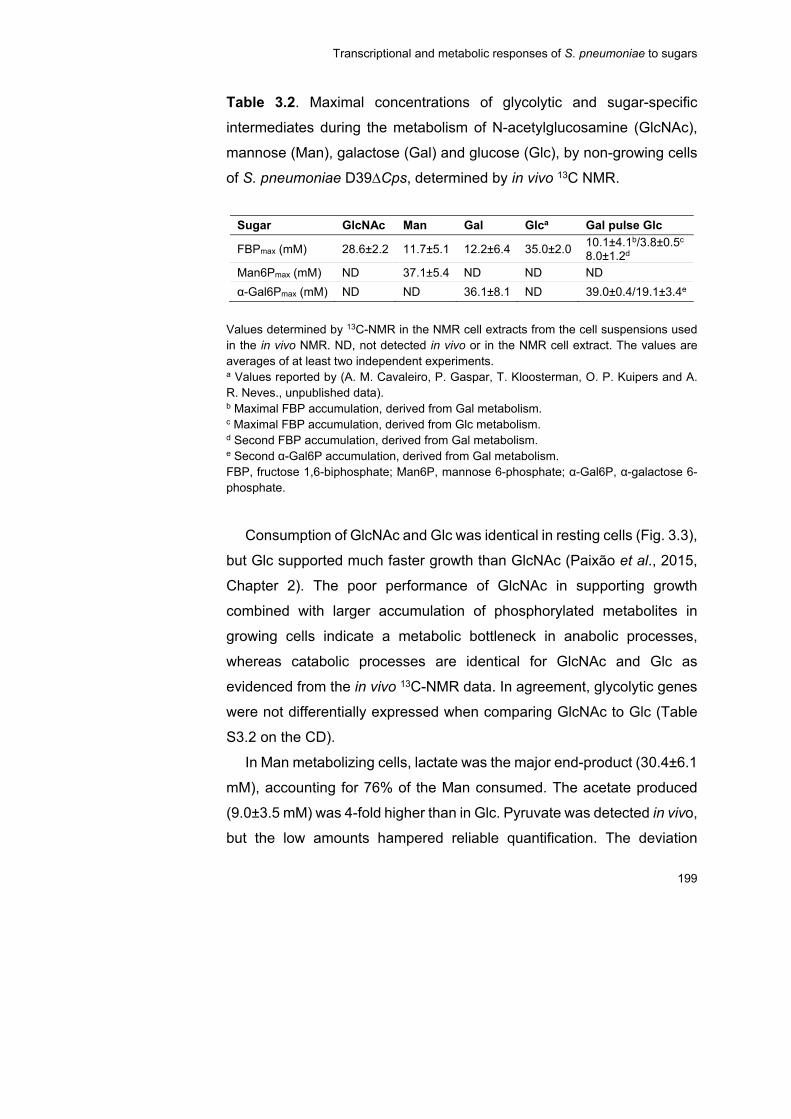
Transcriptional and metabolic responses of S. pneumoniae to sugars
199
Table 3.2. Maximal concentrations of glycolytic and sugar-specific
intermediates during the metabolism of N-acetylglucosamine (GlcNAc),
mannose (Man), galactose (Gal) and glucose (Glc), by non-growing cells
of S. pneumoniae D39∆Cps, determined by in vivo 13C NMR.
Sugar GlcNAc Man Gal Glca Gal pulse Glc
FBPmax (mM) 28.6±2.2 11.7±5.1 12.2±6.4 35.0±2.0 10.1±4.1b/3.8±0.5c
8.0±1.2d Man6Pmax (mM) ND 37.1±5.4 ND ND ND
α-Gal6Pmax (mM) ND ND 36.1±8.1 ND 39.0±0.4/19.1±3.4e
Values determined by 13C-NMR in the NMR cell extracts from the cell suspensions used in the in vivo NMR. ND, not detected in vivo or in the NMR cell extract. The values are averages of at least two independent experiments. a Values reported by (A. M. Cavaleiro, P. Gaspar, T. Kloosterman, O. P. Kuipers and A. R. Neves., unpublished data). b Maximal FBP accumulation, derived from Gal metabolism. c Maximal FBP accumulation, derived from Glc metabolism. d Second FBP accumulation, derived from Gal metabolism. e Second α-Gal6P accumulation, derived from Gal metabolism. FBP, fructose 1,6-biphosphate; Man6P, mannose 6-phosphate; α-Gal6P, α-galactose 6-phosphate.
Consumption of GlcNAc and Glc was identical in resting cells (Fig. 3.3),
but Glc supported much faster growth than GlcNAc (Paixão et al., 2015,
Chapter 2). The poor performance of GlcNAc in supporting growth
combined with larger accumulation of phosphorylated metabolites in
growing cells indicate a metabolic bottleneck in anabolic processes,
whereas catabolic processes are identical for GlcNAc and Glc as
evidenced from the in vivo 13C-NMR data. In agreement, glycolytic genes
were not differentially expressed when comparing GlcNAc to Glc (Table
S3.2 on the CD).
In Man metabolizing cells, lactate was the major end-product (30.4±6.1
mM), accounting for 76% of the Man consumed. The acetate produced
(9.0±3.5 mM) was 4-fold higher than in Glc. Pyruvate was detected in vivo,
but the low amounts hampered reliable quantification. The deviation
Chapter 3
200
towards mixed acid fermentation is consistent with the profile observed in
Man-grown cells (Paixão et al., 2015, Chapter 2). The upregulation of
fermentative genes SPD_1834 (adh) and pflB (Table 3.1) is in accordance
with this shift. However, a more pronounced shift could be expected, as
fermentation of non-preferential sugars is generally associated with mixed
acid profiles [54]. Earlier, we reported Man as a non-preferential sugar for
growth and that it supported the lowest growth rates (Paixão et al., 2015,
Chapter 2), and now we show that catabolism of Man (consumption rate
0.16±0.00 µmol min-1 mg-1 of protein) is 2-times slower than that of Glc.
What renders Man such a poor substrate is not clear, but the upregulation
of glycolytic genes during growth on Man can be surmised as cellular
response to overcome Man-associated metabolic limitations (Tables 3.1
and S3.3 on the CD).
The pools of FBP and mannose 6-phosphate (Man6P) accumulated
during the catabolism of Man (Fig. 3.3B). The Man6P pool increased
sharply to a steady concentration, which swiftly dropped to concentrations
below 5 mM at the onset of Man depletion (Table 3.2 and Fig. 3.3B). In
contrast, FBP became detectable after Man depletion and when the pool
of Man6P was decreasing (Table 3.2 and Fig. 3.3B). Man6P is also the
predominant phosphorylated metabolite in Man-grown cells (Table S3.7,
Paixão et al., 2015, Chapter 2). High concentrations of phosphorylated
metabolites have often been associated with metabolic toxicity [41,58],
and accumulation to high-levels of non-glycolytic phosphorylated
metabolites is a recurrent observation during the metabolism of less
preferred substrates [59,60]. Thus, it is tempting to suggest that Man6P
toxicity results in lower glycolytic and growth rates. In line, a strain
displaying higher Man6P isomerase (ManA) activity grew faster (1.6-fold)
on Man than strain D39 (Paixão et al. 2015, Chapter 2). In fungi
(Saccharomyces cerevisiae and Aspergillus fumigatus) deletion of
phosphomannose isomerase gene led to accumulation of Man6P, which
Transcriptional and metabolic responses of S. pneumoniae to sugars
201
decreased the glycolytic flux [61,62]. In Corynebacterium glutamicum,
overexpression of manA alleviated the accumulation of Man6P (and F6P)
and improved Man catabolism [63].
In this context, induction of glycolytic genes (fba, gap, pgk, eno and
pyk) as observed in presence of Man (Table 3.1), was most likely to
alleviate the stress elicited by the accumulation of Man6P, allowing a more
rapid flow through the central metabolism. On the other hand, we can
speculate that Man6P might exert repression over Man transporters, thus
slowing down the uptake of this sugar and subsequent metabolism.
The profile of Gal consumption was characterized by a plateau
(concentration approx 20 mM), which preceded efficient conversion of Gal
to fermentation end-products. This pattern has been described for L. lactis
when the sugar uptake was exclusively mediated by non-PTS
transporters, such as Glc catabolism in a PTS-mutant or Gal catabolism
[44,64]. Transport systems for Gal in S. pneumoniae D39 have not been
firmly identified, and thus the in vivo NMR data is an additional pointer for
the involvement of non-PTS systems in Gal uptake. A plateau was also
observed for Glc, but the length was smaller. Interestingly, GlcNAc and
Man were used instantly by resting D39 cells, in line with the hypothesis
that uptake of these sugars is exclusively mediated by PTS transporters
[18]. The Gal consumption rate was 0.14±0.02 µmol min-1 mg-1 of protein,
a value similar to the one found on Man, and 2-fold lower than the Glc
consumption rate (Fig. 3.3C). A similar fold reduction was observed when
comparing growth rates on Gal and Man with Glc (Paixão et al., 2015,
Chapter 2), suggesting that for these two sugars catabolism is major in
the multitude of factors determining growth rates. As in growing cells
(Paixão et al., 2015, Chapter 2), catabolism of Gal in resting cell
suspensions showed a pronounced shift to mixed acid fermentation (Fig.
3.3C), with about 35% of the Gal generating acetate (9.8±0.9 mM),
ethanol (3.3±0.6mM) and pyruvate (0.6±0.1 mM), while lactate (24.1±0.2
Chapter 3
202
mM) was lower than in the other sugars. (Fig. 3.3C) A similar profile was
observed in L. lactis cells metabolizing Gal [60], but in the pneumococcus
the deviation towards acetate and ethanol was 4.1- and 1.5-fold higher,
respectively.
Yesilkaya et al. [65] attributed the mixed acid profile of Gal-grown cells
of S. pneumoniae D39 to the activity of pyruvate formate-lyase (PFL)
(encoded by SPD_0420, pflB) and pyruvate formate-lyase activating
enzyme (encoded by SPD_1774, pflA). In presence of slow metabolizable
sugars and anaerobic conditions PFL competes more efficiently with LDH
for pyruvate. In consequence, one more molecule of ATP is generated
(via acetate kinase activity), which is certainly an advantage during the
metabolism of non-preferential sugars (slow metabolizable). The
metabolic shift to mixed-acid fermentation has been the subject of intense
research, and the underlying regulatory mechanisms are still under
debate. Gal-dependent activation of the genes codifying for enzymes
involved in the mixed-acid branch has been reported [27]. In this study,
we observed a modest induction of the pflB gene, which is in accordance
with regulation at the transcriptional level.
Resting D39 cells accumulated during the metabolism of [1-13C]Gal
FBP and the specific intermediate of the T6P pathway, α-galactose 6-
phosphate (α-Gal6P) (Fig. 3.3C). A minor resonance due to 3-PGA, was
observed but reliable quantification was hampered by the strong
resonance of choline. Also, UDP-Glc was detected in very low
concentration during Gal catabolism. In contrast to growing cells,
accumulation of the Leloir intermediates galactose 1-phosphate and
glucose 1-phosphate was not observed (Table S3.7). It is likely that the
concentration of these metabolites is below the detection limit of in vivo
13C-NMR technique. Indeed, the 31P-NMR resonances in spectra of Gal-
grown cell extracts were relatively weak (Paixão et al., 2015, Chapter 2).
The pool of FBP accumulated once Gal started to decline, but the maximal
Transcriptional and metabolic responses of S. pneumoniae to sugars
203
concentration was relatively low (approximately 12 mM) (Fig. 3.3C).
Reduced FBP levels might derive from the slow flux through glycolysis,
and correlate well with the metabolic shift towards mixed-acid
fermentation. It is well established that FBP is an activator of LDH,
whereas trioses-phosphate (DHAP and GAP), inhibit PFL [57]. Due to the
reversibility of the reactions catalysed by FBP aldolase and triose 3-
phosphate isomerase, low trioses-phosphate concentrations are to be
expected when FBP is low. Thus, the activation of LDH and the inhibition
of PFL are relieved and a mixed acid profile emerges. As for other
fermentative organisms, the shift towards mixed acid fermentation is
multifactorial and involves regulation at the different cellular layers.
α-Gal6P was detected after Gal addition, but overlap with the strong
α-Gal resonance hampered reliable quantification during the first 17 min
of Gal metabolism. Once the Gal resonances subsided, integration of the
α-Gal6P resonance was possible: while Gal was abundant, the α-Gal6P
concentration remained high (above 25 mM), declining rapidly to
undetectable levels as Gal was nearing depletion (Fig. 3.3C). The high
accumulation of Gal6P in resting cells, also observed in growing cells
(Table S3.7, Paixão et al., 2015, Chapter 2), suggests a metabolic
constraint in Gal processing through the tagatose 6-phosphate pathway.
In addition, the accumulation of Gal6P is solid evidence for the functionally
of a PTS system, since to our knowledge this is the only reaction capable
of generating Gal6P in living cells [44].
Catabolism of Glc in galactose-adapted cells
Of the three monosaccharides studied, Gal showed the strongest effect
on glycolytic dynamics and end-products profile (Fig. 3.3C). Thus, we
asked whether Gal-adapted cells would be able to efficiently catabolise
the preferred sugar Glc. To test this hypothesis, cells actively metabolizing
20 mM of [1-13C]Gal where challenged with a 10 mM labelled Glc pulse,
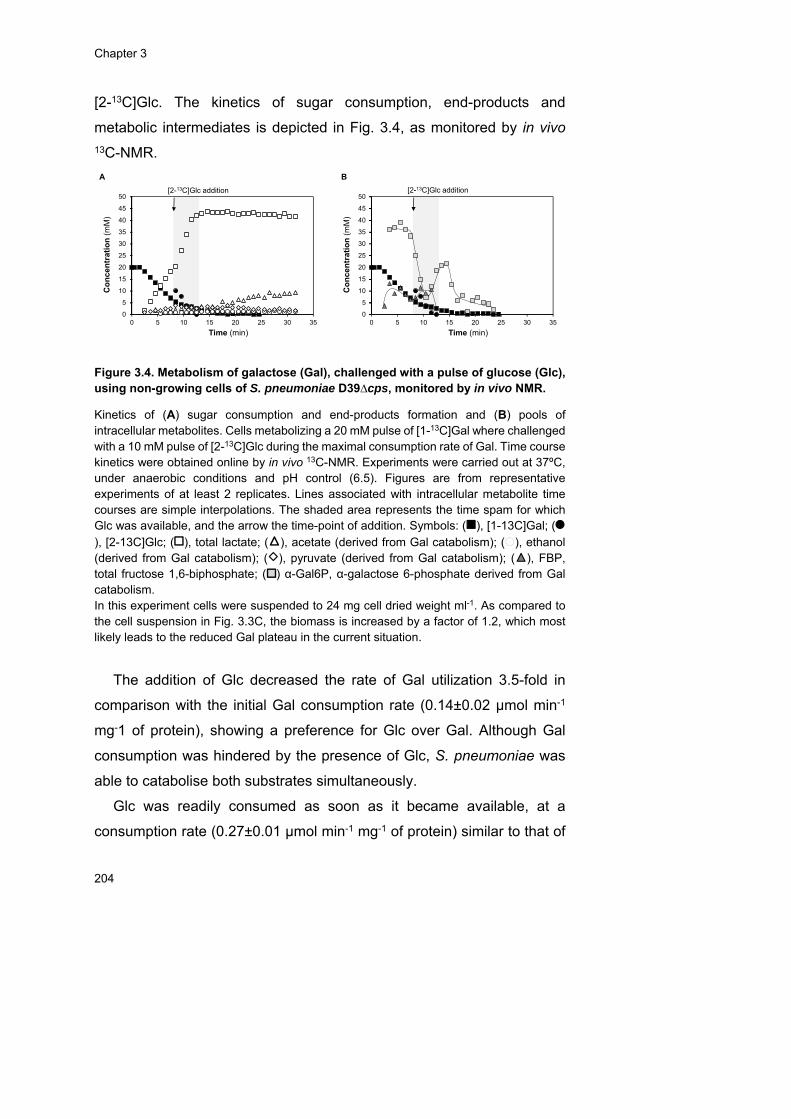
Chapter 3
204
[2-13C]Glc. The kinetics of sugar consumption, end-products and
metabolic intermediates is depicted in Fig. 3.4, as monitored by in vivo
13C-NMR.
Figure 3.4. Metabolism of galactose (Gal), challenged with a pulse of glucose (Glc), using non-growing cells of S. pneumoniae D39∆cps, monitored by in vivo NMR.
Kinetics of (A) sugar consumption and end-products formation and (B) pools of intracellular metabolites. Cells metabolizing a 20 mM pulse of [1-13C]Gal where challenged with a 10 mM pulse of [2-13C]Glc during the maximal consumption rate of Gal. Time course kinetics were obtained online by in vivo 13C-NMR. Experiments were carried out at 37ºC, under anaerobic conditions and pH control (6.5). Figures are from representative experiments of at least 2 replicates. Lines associated with intracellular metabolite time courses are simple interpolations. The shaded area represents the time spam for which Glc was available, and the arrow the time-point of addition. Symbols: ( ), [1-13C]Gal; ( ), [2-13C]Glc; ( ), total lactate; ( ), acetate (derived from Gal catabolism); ( ), ethanol (derived from Gal catabolism); ( ), pyruvate (derived from Gal catabolism); ( ), FBP, total fructose 1,6-biphosphate; ( ) α-Gal6P, α-galactose 6-phosphate derived from Gal catabolism. In this experiment cells were suspended to 24 mg cell dried weight ml-1. As compared to the cell suspension in Fig. 3.3C, the biomass is increased by a factor of 1.2, which most likely leads to the reduced Gal plateau in the current situation.
The addition of Glc decreased the rate of Gal utilization 3.5-fold in
comparison with the initial Gal consumption rate (0.14±0.02 µmol min-1
mg-1 of protein), showing a preference for Glc over Gal. Although Gal
consumption was hindered by the presence of Glc, S. pneumoniae was
able to catabolise both substrates simultaneously.
Glc was readily consumed as soon as it became available, at a
consumption rate (0.27±0.01 µmol min-1 mg-1 of protein) similar to that of
[2-13C]Glc addition
0
5
10
15
20
25
30
35
40
45
50
0 5 10 15 20 25 30 35
Co
nc
en
tra
tio
n(m
M)
Time (min)
0
5
10
15
20
25
30
35
40
45
50
0 5 10 15 20 25 30 35
Co
nc
en
tra
tio
n(m
M)
Time (min)
A B
[2-13C]Glc addition
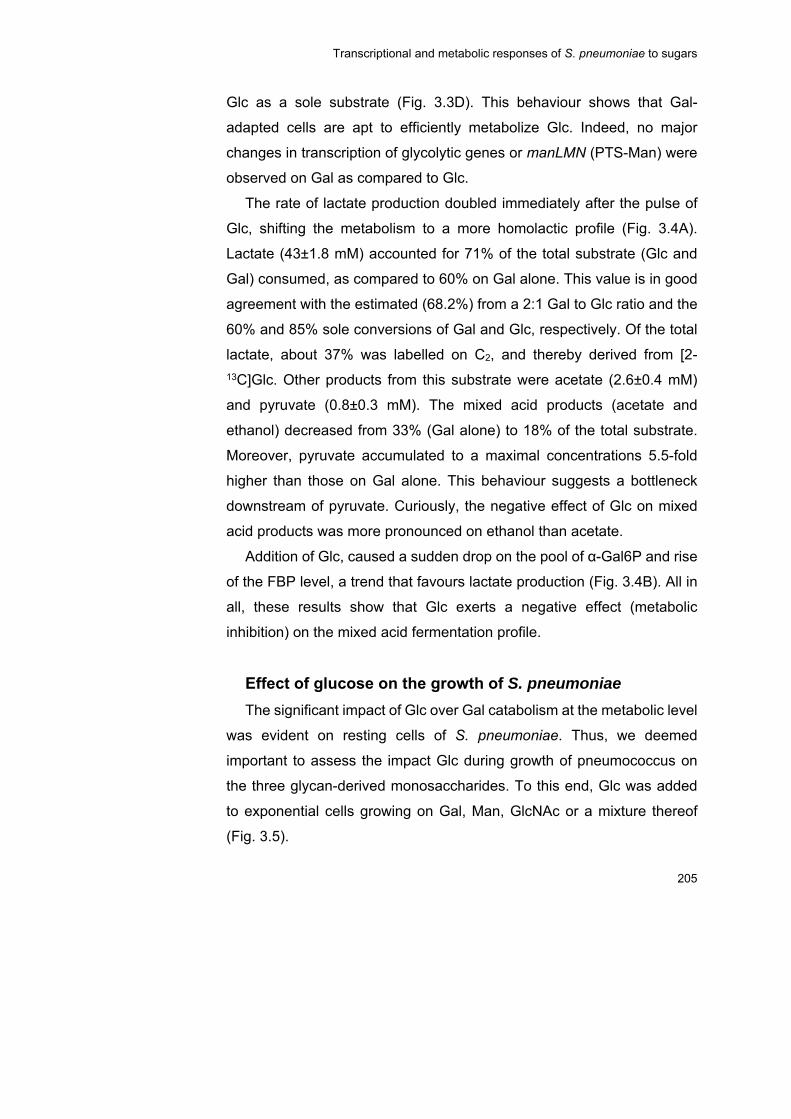
Transcriptional and metabolic responses of S. pneumoniae to sugars
205
Glc as a sole substrate (Fig. 3.3D). This behaviour shows that Gal-
adapted cells are apt to efficiently metabolize Glc. Indeed, no major
changes in transcription of glycolytic genes or manLMN (PTS-Man) were
observed on Gal as compared to Glc.
The rate of lactate production doubled immediately after the pulse of
Glc, shifting the metabolism to a more homolactic profile (Fig. 3.4A).
Lactate (43±1.8 mM) accounted for 71% of the total substrate (Glc and
Gal) consumed, as compared to 60% on Gal alone. This value is in good
agreement with the estimated (68.2%) from a 2:1 Gal to Glc ratio and the
60% and 85% sole conversions of Gal and Glc, respectively. Of the total
lactate, about 37% was labelled on C2, and thereby derived from [2-
13C]Glc. Other products from this substrate were acetate (2.6±0.4 mM)
and pyruvate (0.8±0.3 mM). The mixed acid products (acetate and
ethanol) decreased from 33% (Gal alone) to 18% of the total substrate.
Moreover, pyruvate accumulated to a maximal concentrations 5.5-fold
higher than those on Gal alone. This behaviour suggests a bottleneck
downstream of pyruvate. Curiously, the negative effect of Glc on mixed
acid products was more pronounced on ethanol than acetate.
Addition of Glc, caused a sudden drop on the pool of α-Gal6P and rise
of the FBP level, a trend that favours lactate production (Fig. 3.4B). All in
all, these results show that Glc exerts a negative effect (metabolic
inhibition) on the mixed acid fermentation profile.
Effect of glucose on the growth of S. pneumoniae
The significant impact of Glc over Gal catabolism at the metabolic level
was evident on resting cells of S. pneumoniae. Thus, we deemed
important to assess the impact Glc during growth of pneumococcus on
the three glycan-derived monosaccharides. To this end, Glc was added
to exponential cells growing on Gal, Man, GlcNAc or a mixture thereof
(Fig. 3.5).

Chapter 3
206
For all the conditions tested, an increase of growth rate was observed
upon Glc addition sugar mix (Fig. 3.5 and Table 3.3). This positive effect
was more pronounced in Gal-adapted cells (Fig. 3.5A and Table 3.3), for
which the final biomass and the maximal specific growth rates were
increased by 74% and 172%, respectively. Furthermore, Glc induced
biphasic growth, with a phase displaying a maximal growth rate of
0.87±0.07 h-1), followed by slower growth (0.14 ±0.01 h-1). In the sugar
mix, the final biomass increased by 30%, while the time to reach these
maximal values was shortened by 43% (Fig. 3.5D).
Independently of the carbon source in the medium, growing S.
pneumoniae cells consumed Glc at once after addition (Fig. 3.5). A similar
behaviour was described for the resting cells (Fig. 3.4). A lag phase,
typical of the diauxic behaviour associated with adaptation to the
additional substrate, was not observed for any of the conditions tested.
The rate of Glc utilization was higher than that of the other sugars, as
evidenced by the higher quantity of Glc processed over a defined period
of time. In summary, S. pneumoniae is well equipped to use its preferred
substrate Glc, regardless of pre-conditioning to other sugars. However,
utilization of Glc does not exclude co-metabolism of the other sugars.
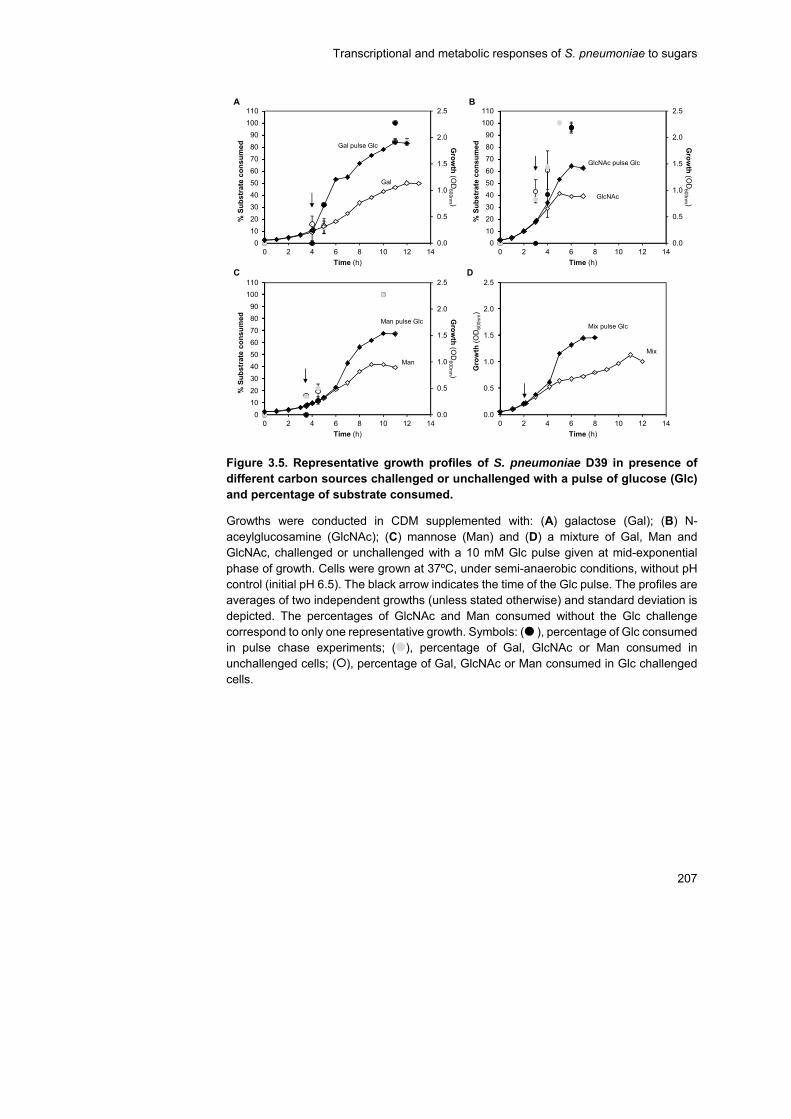
Transcriptional and metabolic responses of S. pneumoniae to sugars
207
Figure 3.5. Representative growth profiles of S. pneumoniae D39 in presence of different carbon sources challenged or unchallenged with a pulse of glucose (Glc) and percentage of substrate consumed.
Growths were conducted in CDM supplemented with: (A) galactose (Gal); (B) N-aceylglucosamine (GlcNAc); (C) mannose (Man) and (D) a mixture of Gal, Man and GlcNAc, challenged or unchallenged with a 10 mM Glc pulse given at mid-exponential phase of growth. Cells were grown at 37ºC, under semi-anaerobic conditions, without pH control (initial pH 6.5). The black arrow indicates the time of the Glc pulse. The profiles are averages of two independent growths (unless stated otherwise) and standard deviation is depicted. The percentages of GlcNAc and Man consumed without the Glc challenge correspond to only one representative growth. Symbols: ( ), percentage of Glc consumed in pulse chase experiments; ( ), percentage of Gal, GlcNAc or Man consumed in unchallenged cells; ( ), percentage of Gal, GlcNAc or Man consumed in Glc challenged cells.
0.0
0.5
1.0
1.5
2.0
2.5
0
10
20
30
40
50
60
70
80
90
100
110
0 2 4 6 8 10 12 14
Gro
wth
(OD
600nm
)
% S
ub
stra
teco
nsu
med
Time (h)
A
0.0
0.5
1.0
1.5
2.0
2.5
0
10
20
30
40
50
60
70
80
90
100
110
0 2 4 6 8 10 12 14
Gro
wth
(OD
600nm
)
% S
ub
stra
teco
nsu
med
Time (h)
0.0
0.5
1.0
1.5
2.0
2.5
0
10
20
30
40
50
60
70
80
90
100
110
0 2 4 6 8 10 12 14
Gro
wth
(OD
600nm
)
% S
ub
stra
teco
nsu
med
Time (h)
0.0
0.5
1.0
1.5
2.0
2.5
0 2 4 6 8 10 12 14
Gro
wth
(OD
600
nm)
Time (h)
B
C D
Gal
Gal pulse Glc
GlcNAc
GlcNAc pulse Glc
Man
Man pulse Glc
Mix
Mix pulse Glc
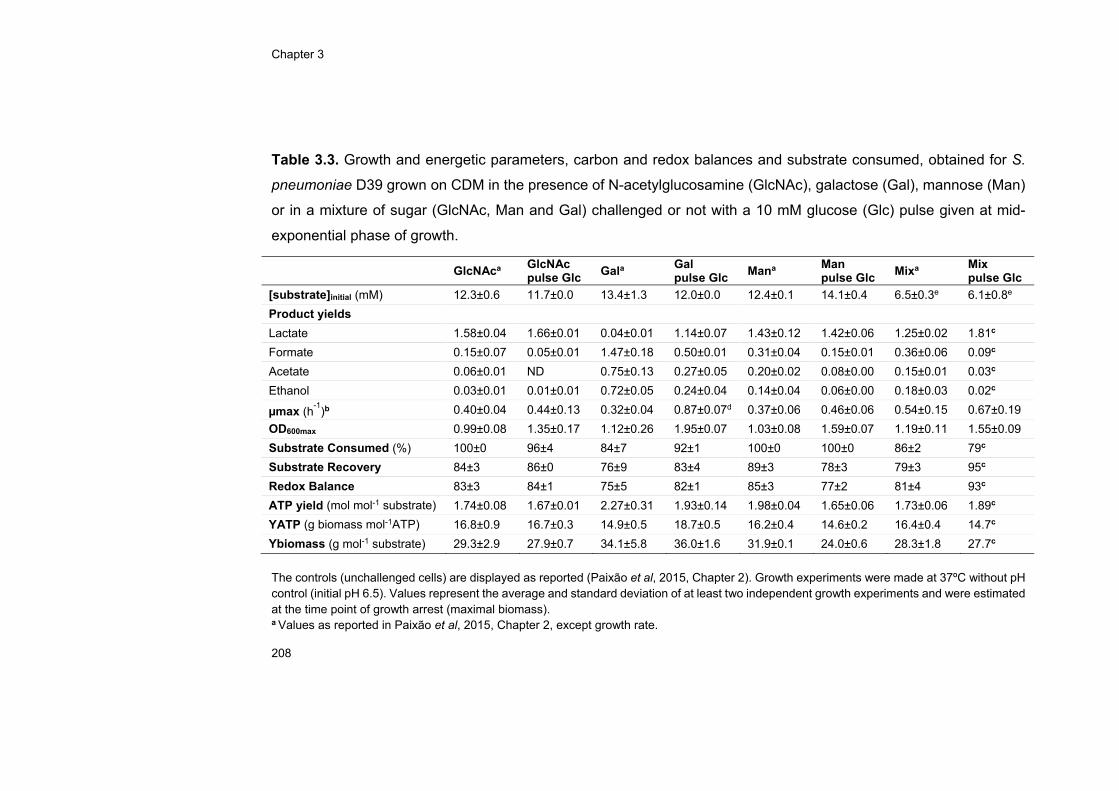
Chapter 3
208
Table 3.3. Growth and energetic parameters, carbon and redox balances and substrate consumed, obtained for S.
pneumoniae D39 grown on CDM in the presence of N-acetylglucosamine (GlcNAc), galactose (Gal), mannose (Man)
or in a mixture of sugar (GlcNAc, Man and Gal) challenged or not with a 10 mM glucose (Glc) pulse given at mid-
exponential phase of growth.
The controls (unchallenged cells) are displayed as reported (Paixão et al, 2015, Chapter 2). Growth experiments were made at 37ºC without pH control (initial pH 6.5). Values represent the average and standard deviation of at least two independent growth experiments and were estimated at the time point of growth arrest (maximal biomass). a Values as reported in Paixão et al, 2015, Chapter 2, except growth rate.
GlcNAca GlcNAc pulse Glc
Gala Gal pulse Glc
Mana Man pulse Glc
Mixa Mix pulse Glc
[substrate]initial (mM) 12.3±0.6 11.7±0.0 13.4±1.3 12.0±0.0 12.4±0.1 14.1±0.4 6.5±0.3e 6.1±0.8e
Product yields
Lactate 1.58±0.04 1.66±0.01 0.04±0.01 1.14±0.07 1.43±0.12 1.42±0.06 1.25±0.02 1.81c
Formate 0.15±0.07 0.05±0.01 1.47±0.18 0.50±0.01 0.31±0.04 0.15±0.01 0.36±0.06 0.09c
Acetate 0.06±0.01 ND 0.75±0.13 0.27±0.05 0.20±0.02 0.08±0.00 0.15±0.01 0.03c
Ethanol 0.03±0.01 0.01±0.01 0.72±0.05 0.24±0.04 0.14±0.04 0.06±0.00 0.18±0.03 0.02c
µmax (h-1
)b 0.40±0.04 0.44±0.13 0.32±0.04 0.87±0.07d 0.37±0.06 0.46±0.06 0.54±0.15 0.67±0.19
OD600max 0.99±0.08 1.35±0.17 1.12±0.26 1.95±0.07 1.03±0.08 1.59±0.07 1.19±0.11 1.55±0.09
Substrate Consumed (%) 100±0 96±4 84±7 92±1 100±0 100±0 86±2 79c
Substrate Recovery 84±3 86±0 76±9 83±4 89±3 78±3 79±3 95c
Redox Balance 83±3 84±1 75±5 82±1 85±3 77±2 81±4 93c
ATP yield (mol mol-1 substrate) 1.74±0.08 1.67±0.01 2.27±0.31 1.93±0.14 1.98±0.04 1.65±0.06 1.73±0.06 1.89c
YATP (g biomass mol-1ATP) 16.8±0.9 16.7±0.3 14.9±0.5 18.7±0.5 16.2±0.4 14.6±0.2 16.4±0.4 14.7c
Ybiomass (g mol-1 substrate) 29.3±2.9 27.9±0.7 34.1±5.8 36.0±1.6 31.9±0.1 24.0±0.6 28.3±1.8 27.7c
Transcriptional and metabolic responses of S. pneumoniae to sugars
209
b Maximal specific growth rate determined in the time range after the Glc pulse. c Values of a representative experiment. d Maximal specific growth rate. µ2=0.14±0.01 h-1. e The value represents the average ± standard deviation of the concentration for all the sugars separately. Individual averages for sugar mixes are: Gal, 6.4±0.7 mM; Man, 6.6±0.1 mM and GlcNAc, 6.7±0.2 mM. Individual averages for sugar mixes with pulse of Glc are: Gal, 5.7±0.1 mM; Man, 5.9±1.4 mM and GlcNAc, 6.5±0.4 mM. ND – Not detected as product of pyruvate metabolism. Substrate recovery is the percentage of carbon in metabolized sugar that is recovered in the fermentation products (lactate, ethanol, acetate and formate). Redox balance is the ratio between [lactate]+2×[ethanol] and 2×[substrate consumed] multiplied by 100.
Chapter 3
210
Glucose addition represses mixed acid fermentation profile
In resting cells actively metabolizing Gal, Glc promoted a more
homolactic fermentation profile. The effects of Glc addition to the end-
products formed during growth are shown on Table 3.3. Cells
exponentially growing on Gal, GlcNAc or the sugar mix, when challenged
with Glc displayed increased lactate yield, which was condition dependent
(Table 3.3). Curiously, this pattern was not observed for Man-adapted
cells (Table 3.3). Gal-adapted cells showed the largest change in lactate
yield, even though no induction of ldh was observed (Table S3.8).
Furthermore, Glc addition repressed the formation of mixed acid
fermentation products (acetate, ethanol and formate) to a larger extent
(except for Gal) than the positive effect on lactate production in all the
conditions tested (Table 3.3). Generally, Glc repressed the expression of
genes involved in mixed acid fermentation (SPD_1834, pflB, pta) (Table
S3.8), and the reduced transcription positively correlates with the reduced
levels of mixed-acid products (Table 3.3). On Man, however, the addition
of Glc resulted in elevated levels of pflB, pta and SPD_1834 transcripts,
but still the mixed acid products were lessened (Tables 3.3 and S3.8).
These results suggest that under this condition, regulatory mechanisms
other than transcription are present.
Based on the results with resting cells we proposed that the partitioning
between lactate and mixed acid products is largely regulated at the
metabolic level. Overall, the results with growing cells further strengthen
this view, without ruling out regulation at the transcriptional level.
Effect of glucose on the expression of genes involved in
sugar metabolism
The effect of a Glc challenge to cells growing on the glycan-derived
sugars was assessed at the transcriptional level (Table S3.8). The

Transcriptional and metabolic responses of S. pneumoniae to sugars
211
number of genes significantly differentially expressed in response to Glc
was dependent on the sugar (Tables S3.9, S3.10, S3.11 and S3.12, all
provided on the CD). The largest transcriptional response was observed
in Man-adapted cells (434 genes out of 1738) and the smallest in cells
adapted to a sugar mixture (5.5% of the total transcripts) (Fig. 3.2B). In
Gal-adapted cells, 249 genes were regulated by Glc, whereas in GlcNAc-
adapted cultures 111 genes were differentially expressed after the Glc
pulse (Fig. 3.2B). The transcriptional response of Gal and Man-adapted
cells to Glc included altered expression of 157 shared genes, of which
101 were exclusive of these conditions. Despite the large number of
common genes in the two conditions, the direction of regulation
(upregulation vs. downregulation) of these genes was not necessarily the
same. Indeed, Glc exerted positive (upregulation) and negative
(downregulation) regulation in all conditions tested. Gal-adapted cells
showed the highest number of upregulated genes (53% of the total),
whereas GlcNAc-adapted cells showed the lowest (22.5% of the total)
(Tables S3.9 and S3.10, all provided on the CD), an indication that Glc is
a mightier repressor of Gal catabolism than of the catabolism of the other
sugars. Interestingly, the lesser response in the sugar mix denotes better
capacity of these cells to cope with a Glc stimulus, which can be perceived
as improved metabolic fitness.
The results presented in Fig. 3.2B and Table S3.8 clearly show sugar-
dependent responses to a Glc stimulus. Progression from colonisation to
invasive disease is presumably associated with a change from an
environment nearly devoid of Glc (nasopharynx) to niches rich in this
sugar (blood, inflamed lung). Thus, determination of the transcriptional
responses to Glc in clinical serotypes of S. pneumoniae should be
pursued in the future.
For all the conditions tested, the COG category of “carbohydrate
metabolism and transport” (G) was overrepresented (Table S3.6 on the
Chapter 3
212
CD), with the proportion of genes showing altered expression in response
to Glc as follows: 32.4%, 28.1%, 16.9% and 12.4% of the total transcripts
on GlcNAc, sugar mix, Gal and Man, respectively. Also, most of the genes
belonging to category G were downregulated by Glc, except for Man-
adapted cultures in which a higher number was induced.
Glucose addition in GlcNAc-adapted cells repressed the expression of
putative and proven transporters of this amino sugar (Paixão et al., 2015,
Chapter 2, Table S3.8), among which the PTS-Man SPD_0262-3-4
(manLMN) was downregulated. This system is most likely the major
GlcNAc transporter in S. pneumoniae D39 [18]. In addition, is also the
principal Glc uptake transporter in S. pneumoniae [18]. Downregulation of
glucose transport proteins in response to Glc is not without precedent,
and in E. coli is one of the molecular mechanisms in the cellular response
to prevent phosphosugar stress [66].
Genes involved in glycolysis were not differentially expressed upon Glc
addition. Interestingly, Glc repressed the expression of the dedicated
GlcNAc-specific catabolic gene nagB, but not nagA in the same
transcriptional unit. Furthermore, only nagB was found upregulated in
GlcNAc-growth medium (using a Bayesian p-value < 0.001) as compared
to Glc. Thus, each gene in the nagAB operon is subjected to specific
regulation.
The direction of the regulation elicited by Glc on Man-adapted cells was
in most opposite to that observed in the other conditions studied (Table
S3.8). Glc induced the expression of transporters presumably involved in
Man uptake (Table S3.8), namely the permeases of the CUT1 ABC
transporter SPD_0088-9, the subunits manLM of PTS-Man and the
subunits IIABD of the mannose-type PTS encoded by SPD_0293-5-7, as
well as other sugar transporters (Table S3.8). In addition, Glc induced the
expression of the glycolytic genes gap and eno (Table S3.8). The
Transcriptional and metabolic responses of S. pneumoniae to sugars
213
expression of the Man-specific catabolic gene, manA, was not affected by
the Glc stimulus.
Furthermore, a large set of genes which was found upregulated when
comparing Man to Glc (eg. glycolytic, fermentative and sugar-specific
catabolic genes), showed increased fold upregulation in response to the
Glc stimulus in Man-adapted cells.
We have shown that Glc hinders the use of Gal (Fig. 3.4) and this
observation is fully substantiated by the transcriptional response to Glc in
Gal-adapted cells. In Gal-adapted cells Glc downregulated the transporter
genes SPD_0559-0-1 and lacEF-2 (Lac-family PTS) (Table S3.8), which
together with the observed upregulation on Gal as compared to Glc-grown
cells (Tables 3.1 and S3.8), point towards their involvement on Gal
uptake. The latter transporter is found in operon-II of the lac gene cluster,
which comprises also a 6-phospho β-galactosidase, lacG-2 (SPD_1046),
and the transcriptional activator lacT (SPD_ 1049) [46]. While lacG-2 was
not differentially expressed, lacT was downregulated by Glc (Table S3.10
on the CD), and so was operon-I encoding the T6P pathway (lacABCD).
Moreover, Glc downregulated the Leloir genes galk and galT-2, as well as
the transcriptional regulator galR (Table S3.8). Our results provide strong
evidence supporting the repressing effect of Glc over the catabolism of
Gal. Previously, Carvalho et al. [27] showed that while CcpA repressed
the Leloir genes independently of the carbon source, Gal was an effective
inducer of this pathway. On the other hand the T6P pathway was weakly
repressed by CcpA on Glc and activated on Gal. In line, Afzal et al. [46]
could not observe a regulatory effect of CcpA on the lac gene cluster.
Instead, LacR was the transcriptional repressor of the lac operon-I (T6P
pathway) on Glc, but not of operon-II, which was under the control of LacT.
For the sugar mix, a negative effect over genes encoding sugar
transporters was observed (Table S3.8). The Gal uptake system
SPD_0559-0-1 [18,43], the permease proteins of the ABC transporter
Chapter 3
214
SPD_0088-9 (involved in Man and Gal uptake) [18] and the IIBC
components of the PTS system (SPD_1496) putatively involved in
GlcNAc uptake (Chapter 2) showed altered expression. Furthermore, Glc
downregulated genes in Gal catabolic pathways (lacAB, galk and galT-2),
but had no impact on the expression of genes devoted to the catabolism
of GlcNAc and Man. A clustering analysis revealed that Glc had a
consistent impact on the N-acetylneuraminic acid processing enzymes:
N-acetylmannosamine 6-phosphate 2-epimerase (nanE-1) and N-
acetylneuraminate lyase, putative (SPD_1163), which were
downregulated in all growth conditions except for Man-adapted cells
(Table S3.13 and Fig. S3.1). Furthermore, Glc affected the expression of
three sugar transporters: the fructose-PTS (SPD_0773) was upregulated
in Man and Gal cells, but downregulated in GlcNAc and in the sugar mix,
and the PTS proteins SPD_1496 (IIBC components) and SPD_0561 (IIC
component) were upregulated on Man, but downregulated on all the other
conditions (Table S3.13 and Fig. S3.1). The physiological interpretation of
these observations requires further experimentation. Also intriguing is the
opposite direction in regulation observed in the presence of Man as
compared to the other sugars. While an explanation cannot be put
forward, one can speculate that the Man signalling cascade is heavily
intertwined with that of Glc, as both sugars are taken up by the Glc/Man-
PTS, a well-recognized major player in catabolite control in low-GC Gram-
positive bacteria. How the cell discriminates between the two sugars is
unknown. From our studies it is clear that the cellular responses to Man
(transcriptional and physiological/metabolic) are large and unique, but the
underlying molecular mechanisms remain to be elucidated.

Transcriptional and metabolic responses of S. pneumoniae to sugars
215
The expression profile of classical virulence factors
displays a sugar dependency
It is now well accepted that sugar metabolism and virulence are
strongly connected, thus contributing in different ways to the pathogenesis
of the pneumococcus [20,67]. Therefore, we investigated the influence of
the carbohydrates GlcNAc, Man and Gal on the expression of known
virulence factors (Tables S3.1 and 3.4). How the ditto virulence factors
responded to a Glc stimulus during growth on the different sugars or a
sugar mix was also examined (Table 3.4).
A clustering analysis identified only two classical virulence genes as
differentially regulated in the three sugars tested, showing that induction
of virulence determinants is sugar dependent (Table 3.4 and Fig. S3.2).
The immunoglobulin A1 protease precursor (SPD_1018, iga) [68] was
upregulated in Gal- and Man-containing medium and downregulated in
presence of GlcNAc, whereas the serine protease (SPD_2068) [69] gene
was upregulated in all growth conditions. Interestingly, Man also induced
the expression of DNA-binding response regulator ciaR, which was shown
to regulate the serine protease. Mutants in both genes show reduced
virulence, but in the ∆ciaR is most likely due to downregulation of the
serine protease [70]. The effect of Glc on the expression of virulence
genes was also sugar dependent (Table 3.4). A clustering analysis
showed that a single virulence gene was regulated by Glc in all the
conditions studied (Table S3.13 and Fig. S3.1). This gene, SPD_0373,
which is found in an operon associated to virulence in bacteraemia and
pneumonia [71] was downregulated by Glc, except for Man-adapted cells.
Galactose influenced the expression of the largest pool of virulence
genes (8.2% of the significantly differential expressed genes), of which
5.5% were upregulated in this sugar (Table 3.4). Of note, the classical
virulence factor β-galactosidase (bgaA) was highly induced (Table 3.4).
Growing evidence supports the role of this gene in early stages of host-
Chapter 3
216
pathogen interactions [72,73]. Moreover, the catabolic genes lacD and
galK were upregulated. We have shown that lacD and galK mutants are
impaired in their ability to colonise the nasopharynx and display
attenuated virulence in a respiratory infection murine model, after
intranasal challenge (Paixão et al., 2015, Chapter 2). Our earlier
assumption that Gal metabolism is linked to virulence (Paixão et al., 2015,
Chapter 2) is further strengthened by the transcriptome data. Interestingly,
the expression of bgaA, lacD and galK was downregulated in Gal-adapted
cells by Glc (Table 3.4). Other virulence factor genes also negatively
regulated by Glc in Gal-adapted cells were tpx (thiol peroxidase), and iga
(immunoglobulin A1 protease precursor). Glc induced the expression of
the choline binding protein (pcpA), a protein involved in the adherence to
nasopharyngeal and lung epithelial cells [74], and virulence determinant
in mouse models of pneumonia and sepsis [75,76].
In GlcNAc-grown cells there was upregulation of strH, encoding the N-
acetylglucosaminidase (Table 3.4). The removal of terminal GlcNAc by
StrH from human N-glycans has been implicated in pneumococcal
colonisation and pathogenesis, since it can facilitate sugars (GlcNAc) for
growth, but it might also promote resistance to opsonophagocytic killing
by avoiding complement deposition [37,38,77]. Interestingly, the gene
was not downregulated in Glc challenged GlcNAc-adapted cells. In this
sugar, all virulence genes responding to the Glc stimulus were
downregulated (Table 3.4). Curiously, Glc stimulus repressed genes
common to two sugar-adapted conditions (bgaC, bgaA, pflB, pflA, galK)
(Table 3.4). This observation could indicate that while expressed in
colonisation states (glycans as carbon sources), these genes are
negatively regulated in conditions where Glc is the predominant sugar,
like the blood or inflamed lungs. Thus it is tempting to suggest that while
important for colonisation, those functions are not required in invasive
disease.

Transcriptional and metabolic responses of S. pneumoniae to sugars
217
Table 3.4. Significantly differentially expressed virulence factors (up- or downregulated) of cells of S. pneumoniae D39
grown in CDM supplemented with N-acetylglucosamine (GlcNAc), mannose (Man) or galactose (Gal) as compared to
glucose (Glc) grown cells, or adapted to these single sugars or to a mixture thereof challenged with a Glc pulse and
compared to unchallenged cells, determined by DNA microarrays.a,b
Up- or downregulationc
Locus_tag Gene Product GlcNAc Man Gal Mix d
without Glc with Glc without Glc with Glc without Glc with Glc with Glc
SPD_0063 strH beta-N-acetylhexosaminidase 0.43 0.90 1.11 -0.48
SPD_0065 bgaC Beta-galactosidase 3 -0.81 0.64 -1.38
SPD_0126 pspA pneumococcal surface protein A 0.68 0.76 -0.79 -0.50
SPD_0250 pullulanase, extracellular 0.47 1.00 -0.70
SPD_0373 hypothetical protein SPD_0373 -1.10 0.76 1.43 -1.50 -1.30
SPD_0420 pflB pyruvate formate-lyase -0.53 1.25 0.70 -0.99
SPD_0558 prtA cell wall-associated serine protease PrtA
0.47 -0.41
SPD_0562 bgaA beta-galactosidase precursor, putative
-0.33 0.71 1.61 -0.82
SPD_0634 hypothetical protein SPD_0634 -0.89 -1.24
SPD_0635 cation-transporting ATPase, E1-E2 family protein
-1.23
SPD_0667 sodA superoxide dismutase, manganese-dependent
-0.47
SPD_0701 ciaR DNA-binding response regulator CiaR
0.82 0.57 -0.53
SPD_0729 hemolysin-related protein 0.44 0.48
SPD_0853 lytB
endo-beta-N-acetylglucosaminidase precursor, putative
0.82
SPD_0889 phtD pneumococcal histidine triad protein D precursor
0.40
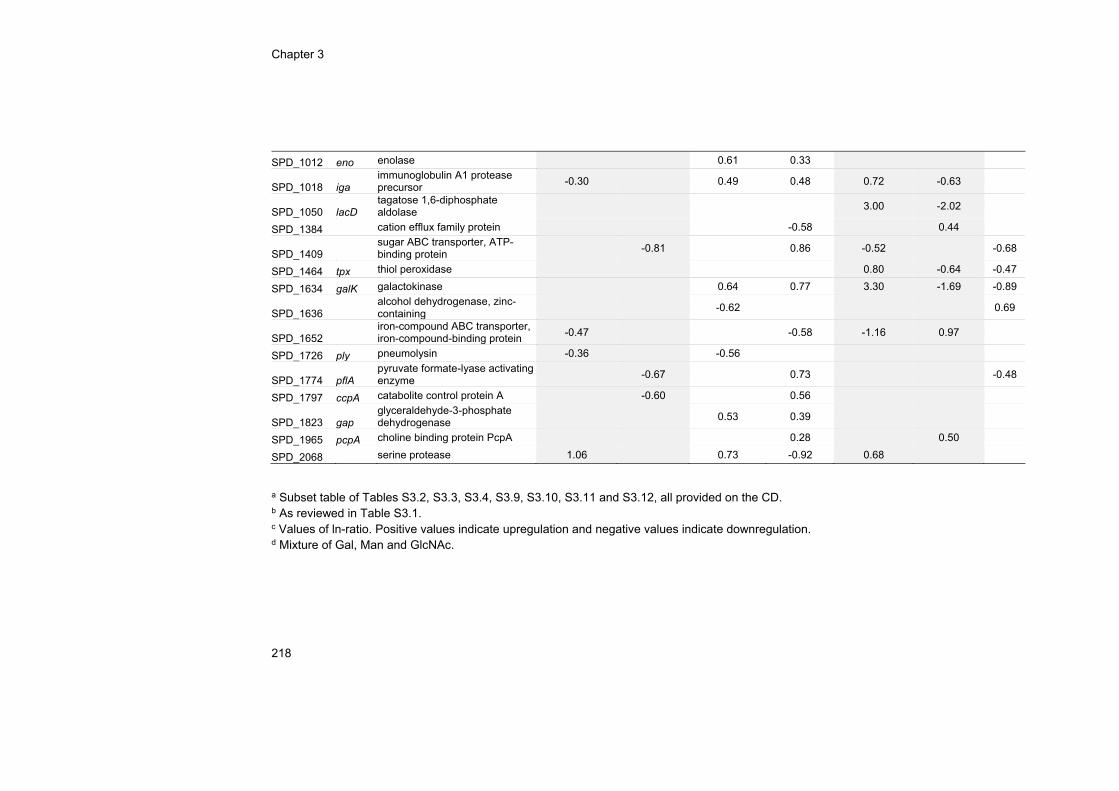
Chapter 3
218
SPD_1012 eno enolase 0.61 0.33
SPD_1018 iga immunoglobulin A1 protease precursor
-0.30 0.49 0.48 0.72 -0.63
SPD_1050 lacD tagatose 1,6-diphosphate aldolase
3.00 -2.02
SPD_1384 cation efflux family protein -0.58 0.44
SPD_1409 sugar ABC transporter, ATP-binding protein
-0.81 0.86 -0.52 -0.68
SPD_1464 tpx thiol peroxidase 0.80 -0.64 -0.47
SPD_1634 galK galactokinase 0.64 0.77 3.30 -1.69 -0.89
SPD_1636 alcohol dehydrogenase, zinc-containing
-0.62 0.69
SPD_1652 iron-compound ABC transporter, iron-compound-binding protein
-0.47 -0.58 -1.16 0.97
SPD_1726 ply pneumolysin -0.36 -0.56
SPD_1774 pflA pyruvate formate-lyase activating enzyme
-0.67 0.73 -0.48
SPD_1797 ccpA catabolite control protein A -0.60 0.56
SPD_1823 gap glyceraldehyde-3-phosphate dehydrogenase
0.53 0.39
SPD_1965 pcpA choline binding protein PcpA 0.28 0.50
SPD_2068 serine protease 1.06 0.73 -0.92 0.68
a Subset table of Tables S3.2, S3.3, S3.4, S3.9, S3.10, S3.11 and S3.12, all provided on the CD. b As reviewed in Table S3.1. c Values of ln-ratio. Positive values indicate upregulation and negative values indicate downregulation. d Mixture of Gal, Man and GlcNAc.
Transcriptional and metabolic responses of S. pneumoniae to sugars
219
Induction of pflB and the glycolytic genes eno and gap during growth
on Man (Table 3.4) is consistent with their roles in early phases of
infection, since Man exists in gycoconjugates. pflB, was recently found to
contribute to attenuated colonisation of the nasopharynx and lungs and
delayed bacteraemia in mice infected intranasally [65], whereas eno and
gap were shown to bind to plasminogen and plasmin, and hence can be
of importance for the dissemination of the pathogen through host tissues
[78,79]. These genes were still upregulated when Man-adapted cells were
spiked with Glc, but the fold-expression values were smaller.
Furthermore, expression of the choline binding protein (pcpA), of the cell
wall-associated serine protease (prtA) of several glycosidase genes (strH,
bgaC, bgaA) as well as pflA and pflB were induced by Glc in Man-adapted
cells.
In S. pneumoniae cells growing on a sugar mix, Glc exerted mainly
negative regulation. In addition to the genes mentioned above, the thiol
peroxidase (tpx) and the pneumococcal surface protein A (pspA) were
also downregulated. The gene encoding the zinc-containing alcohol
dehydrogenase (SPD_1636) was, however, upregulated (Table 3.4).
Virulence studies revealed that this gene is implied in survival in the
bloodstream [80].
Of all the conditions tested, the smallest transcriptional response
elicited by Glc was for cells adapted to the sugar mix (Tables S3.9, S3.10,
S3.11 and S3.12, all provided on the CD). Curiously, it was in this
condition that the highest fraction of virulence genes influenced by Glc
was found (10.4% of the significantly differentially expressed genes) in
comparison to 6.3%, 4.8% and 4.4% in GlcNAc-, Man- and Gal-adapted
cells, respectively. This result strengthens our hypothesis that cells
growing on the sugar mix are better equipped to cope with ever-changing
environments. In these cells, a major adaptation is apparently the
downregulation of virulence factors important in colonisation niches. Of
Chapter 3
220
note, most of the virulence genes were negatively regulated by a Glc
stimulus except in Man-adapted cells for which a significant number of
virulence genes were upregulated. The S. pneumoniae physiological
responses to Man are far from being understood and should be the focus
of future research. In light of the transcriptional response to a Glc stimulus
during growth on Gal, GlcNAc and the sugar mix, we can speculate that
the development of pneumococcal virulence traits occurs in the ecological
niche (nasopharynx), during colonisation, where Gal, Man and GlcNAc
are prevalent in comparison to free Glc. Disease, on the other hand is
accidental, as it culminates in a dead-end for the colonising
microorganism, and likely occurs from an imbalance between the host and
the microbe. In the disease state, the bacterium represses functions
essential for colonisation, but no longer needed when Glc is the
predominant substrate for growth. In accordance with this hypothesis, we
have shown that pneumococcal mutants in the Gal catabolic genes
administrated intravenously were not attenuated in murine models of
disease (Paixão et al., 2015, Chapter 2).
Overall, our results show that sugars influence the virulence potential
of S. pneumoniae D39 both by modulating the expression of specific
catabolic pathways (in vivo fitness) as well as the expression of classical
virulence factors (Table 3.4). Similar findings have been reported for other
Streptococcaceae, such as S. mutans and S. suis [81,82]. Indeed,
successful infections rely on colonisation, multiplication and transmission
to a new host, and therefore the line between factors required for growth
and virulence determinants is blurred [5,6].
Transcriptional and metabolic responses of S. pneumoniae to sugars
221
Conclusions
In this work we have conducted a systems approach to evaluate the S.
pneumoniae response to sugar availability. The combined transcriptional,
physiological and metabolic data collected revealed a strong
carbohydrate-dependency on the phenotypic traits of S. pneumoniae.
Despite the relatively simple metabolism of S. pneumoniae, which
processes sugars through the Embden-Meyerhof-Parnas pathway to
pyruvate, the transcriptional and metabolic responses elicited by each
monosaccharide are remarkable and specific. This is especially relevant
considering that generally this bacterium resides in the human
nasopharynx, an environment poor in Glc, but rich in glycans. But during
progression to disease and in disease states S. pneumoniae is subjected
to changing environments that presumably are enriched in Glc. Our
results firmly show that Glc is a preferential substrate for growth of S.
pneumoniae and while growing on other sugars the bacterium avidly uses
Glc when available. The specific response to the Glc stimulus results in
changes both at the metabolic level (Figs. 3.4 and 3.5) and in gene
regulation (Table S3.8), which allow for short and long term adaptation.
Interestingly, cells adapted for growth on a sugar mixture displayed the
smallest transcriptional response to Glc, suggesting improved metabolic
resilience of S. pneumoniae when exposed to a multitude of sugars. In the
human nasopharynx, S. pneumoniae is exposed to a fluctuating nutritional
milieu that results from a fragile balance between varied factors (host,
microbiota, environmental stimulus). In addition, deglycosylation of
human glycans by bacterial glycosidases generates a varied sugar
mixture. In the context of our observations, exposure to such a diverse
environment improves the fitness of S. pneumoniae.
Carbohydrates specifically modulate the expression of virulence
genes, thus influencing the virulence potential of the pneumococcus. We
Chapter 3
222
suggest that the nasopharynx is the reservoir for the development of
niche-specific virulence traits, essential for successful colonisation of the
niche. Most of these virulence factors are downregulated by a Glc
stimulus, and are therefore not required in disease. Collectively, our data
strengthens the link between sugar metabolism and virulence. Indeed,
effective infections rely on colonisation, multiplication and transmission to
a new host, and therefore factors required for growth are also virulence
determinants.
The “omic” data collected at different regulatory layers can in the future
be used to fuel multi-scale mathematical models. Such mathematical
representation of metabolism hopefully will contribute to deepen our
understanding of how a functional state arises from the components, and
ultimately will facilitate the identification of novel targets for alternative
therapeutic and preventive drugs.
Acknowledgements
This work was supported by Fundação para a Ciência e a Tecnologia,
Portugal (FCT) and FEDER, project PTDC/SAU-MII/100964/2008, and
through grants PEst-OE/EQB/LA0004/2011. L. Paixão acknowledges
FCT for the award of Ph.D. grant SFRH/BD/46997/2008. The NMR
spectrometers are part of The National NMR Facility, supported by
Fundação para a Ciência e a Tecnologia (RECI/BBB-BQB/0230/2012).
Ana Lúcia Carvalho is acknowledged for assistance with in vivo NMR
experiments. Joana Oliveira is acknowledged for her contribution with the
the growth experiments.
Transcriptional and metabolic responses of S. pneumoniae to sugars
223
Author’s contribution
L. Paixão contributed to the design of all the experiments. She performed
and analysed experiments as follows:
Growth Experiments:
Performed: L. Paixão
Quantification of end-products formation and sugar consumption by HPLC
and NMR: L. Paixão
Estimation of growth and energetic parameters: L. Paixão
Transcriptome analysis:
Performed the growth experiments and harvested samples: L. Paixão
Performed the microarrays: T.G. Kloosterman
Analysed: T.G. Kloosterman, J. Caldas, L. Paixão
In vivo 13C- NMR:
Performed: L. Paixão
Analysed: L. Paixão
All authors contributed to the critical reading of this Chapter.
References
1. Giammarinaro P, Paton JC. Role of RegM, a homologue of the catabolite repressor protein CcpA, in the virulence of Streptococcus pneumoniae. Infect Immun. 2002;70: 5454–5461.
2. Bogaert D, de Groot R, Hermans P. Streptococcus pneumoniae colonisation: the key to pneumococcal disease. Lancet Infect Dis. 2004;4: 144–154. doi:10.1016/S1473-3099(04)00938-7
3. Kadioglu A, Weiser JN, Paton JC, Andrew PW. The role of Streptococcus pneumoniae virulence factors in host respiratory colonization and disease. Nat Rev Microbiol. 2008;6: 288–301. doi:10.1038/nrmicro1871
4. King SJ. Pneumococcal modification of host sugars: a major contributor to colonization of the human airway? Mol Oral Microbiol. 2010;25: 15–24. doi:10.1111/j.2041-1014.2009.00564.x
5. Hava DL, LeMieux J, Camilli A. From nose to lung: the regulation behind Streptococcus pneumoniae virulence factors: Virulence gene regulation in S.
Chapter 3
224
pneumoniae. Mol Microbiol. 2003;50: 1103–1110. doi:10.1046/j.1365-2958.2003.03764.x
6. Weiser JN. The pneumococcus: why a commensal misbehaves. J Mol Med Berl. 2010;88: 97–102. doi:10.1007/s00109-009-0557-x
7. Ogunniyi AD, Mahdi LK, Trappetti C, Verhoeven N, Mermans D, Van der Hoek MB, et al. Identification of genes that contribute to the pathogenesis of invasive pneumococcal disease by in vivo transcriptomic analysis. Infect Immun. 2012;80: 3268–3278. doi:10.1128/IAI.00295-12
8. Obaro S, Adegbola R. The pneumococcus: carriage, disease and conjugate vaccines. J Med Microbiol. 2002;51: 98–104.
9. Orihuela CJ, Radin JN, Sublett JE, Gao G, Kaushal D, Tuomanen EI. Microarray analysis of pneumococcal gene expression during invasive disease. Infect Immun. 2004;72: 5582–5596. doi:10.1128/IAI.72.10.5582-5596.2004
10. Orihuela CJ, Janssen R, Robb CW, Watson DA, Niesel DW. Peritoneal culture alters Streptococcus pneumoniae protein profiles and virulence properties. Infect Immun. 2000;68: 6082–6086.
11. Mahdi LK, Ogunniyi AD, LeMessurier KS, Paton JC. Pneumococcal virulence gene expression and host cytokine profiles during pathogenesis of invasive disease. Infect Immun. 2008;76: 646–657. doi:10.1128/IAI.01161-07
12. LeMessurier KS. Differential expression of key pneumococcal virulence genes in vivo. Microbiology. 2006;152: 305–311. doi:10.1099/mic.0.28438-0
13. Ogunniyi AD, Grabowicz M, Mahdi LK, Cook J, Gordon DL, Sadlon TA, et al. Pneumococcal histidine triad proteins are regulated by the Zn2+-dependent repressor AdcR and inhibit complement deposition through the recruitment of complement factor H. FASEB J. 2009;23: 731–738. doi:10.1096/fj.08-119537
14. Ogunniyi AD, Giammarinaro P, Paton JC. The genes encoding virulence-associated proteins and the capsule of Streptococcus pneumoniae are upregulated and differentially expressed in vivo. Microbiology. 2002;148: 2045–2053.
15. Shafeeq S, Kuipers OP, Kloosterman TG. The role of zinc in the interplay between pathogenic streptococci and their hosts: Zinc homeostasis in pathogenic streptococci. Mol Microbiol. 2013;88: 1047–1057. doi:10.1111/mmi.12256
16. Honsa ES, Johnson MDL, Rosch JW. The roles of transition metals in the physiology and pathogenesis of Streptococcus pneumoniae. Front Cell Infect Microbiol. 2013;3: 92. doi:10.3389/fcimb.2013.00092
17. Tettelin H, Nelson KE, Paulsen IT, Eisen JA, Read TD, Peterson S, et al. Complete genome sequence of a virulent isolate of Streptococcus pneumoniae. Science. 2001;293: 498–506. doi:10.1126/science.1061217
18. Bidossi A, Mulas L, Decorosi F, Colomba L, Ricci S, Pozzi G, et al. A functional genomics approach to establish the complement of carbohydrate transporters in Streptococcus pneumoniae. Miyaji EN, editor. PLoS ONE. 2012;7: e33320. doi:10.1371/journal.pone.0033320
19. Paulsen IT, Nguyen L, Sliwinski MK, Rabus R, Saier MH. Microbial genome analyses: comparative transport capabilities in eighteen prokaryotes. J Mol Biol. 2000;301: 75–100. doi:10.1006/jmbi.2000.3961
20. Shelburne SA, Davenport MT, Keith DB, Musser JM. The role of complex carbohydrate catabolism in the pathogenesis of invasive streptococci. Trends Microbiol. 2008;16: 318–325. doi:10.1016/j.tim.2008.04.002
Transcriptional and metabolic responses of S. pneumoniae to sugars
225
21. Philips BJ, Meguer J-X, Redman J, Baker EH. Factors determining the appearance of glucose in upper and lower respiratory tract secretions. Intensive Care Med. 2003;29: 2204–2210. doi:10.1007/s00134-003-1961-2
22. Claverys JP, Prudhomme M, Mortier-Barrière I, Martin B. Adaptation to the environment: Streptococcus pneumoniae, a paradigm for recombination-mediated genetic plasticity? Mol Microbiol. 2000;35: 251–259.
23. Donati C, Hiller NL, Tettelin H, Muzzi A, Croucher NJ, Angiuoli SV, et al. Structure and dynamics of the pan-genome of Streptococcus pneumoniae and closely related species. Genome Biol. 2010;11: R107. doi:10.1186/gb-2010-11-10-r107
24. Titgemeyer F, Hillen W. Global control of sugar metabolism: a gram-positive solution. Antonie Van Leeuwenhoek. 2002;82: 59–71.
25. Deutscher J. The mechanisms of carbon catabolite repression in bacteria. Curr Opin Microbiol. 2008;11: 87–93. doi:10.1016/j.mib.2008.02.007
26. Görke B, Stülke J. Carbon catabolite repression in bacteria: many ways to make the most out of nutrients. Nat Rev Microbiol. 2008;6: 613–624. doi:10.1038/nrmicro1932
27. Carvalho SM, Kloosterman TG, Kuipers OP, Neves AR. CcpA ensures optimal metabolic fitness of Streptococcus pneumoniae. Horsburgh MJ, editor. PLoS ONE. 2011;6: e26707. doi:10.1371/journal.pone.0026707
28. Carvalho SM, Kuipers OP, Neves AR. Environmental and nutritional factors that affect growth and metabolism of the pneumococcal serotype 2 strain D39 and its nonencapsulated derivative strain R6. Horsburgh MJ, editor. PLoS ONE. 2013;8: e58492. doi:10.1371/journal.pone.0058492
29. Kloosterman TG, Hendriksen WT, Bijlsma JJE, Bootsma HJ, van Hijum SAFT, Kok J, et al. Regulation of glutamine and glutamate metabolism by GlnR and GlnA in Streptococcus pneumoniae. J Biol Chem. 2006;281: 25097–25109. doi:10.1074/jbc.M601661200
30. Van Hijum SAFT, de Jong A, Baerends RJS, Karsens HA, Kramer NE, Larsen R, et al. A generally applicable validation scheme for the assessment of factors involved in reproducibility and quality of DNA-microarray data. BMC Genomics. 2005;6: 77. doi:10.1186/1471-2164-6-77
31. Neves AR, Ramos A, Nunes MC, Kleerebezem M, Hugenholtz J, de Vos WM, et al. In vivo nuclear magnetic resonance studies of glycolytic kinetics in Lactococcus lactis. Biotechnol Bioeng. 1999;64: 200–212.
32. Neves AR. Is the Glycolytic Flux in Lactococcus lactis Primarily Controlled by the Redox Charge? kinetics of NAD+ and NADH pools determined in vivo by 13C NMR. J Biol Chem. 2002;277: 28088–28098. doi:10.1074/jbc.M202573200
33. Ramos-Montañez S, Kazmierczak KM, Hentchel KL, Winkler ME. Instability of ackA (acetate kinase) mutations and their effects on acetyl phosphate and ATP amounts in Streptococcus pneumoniae D39. J Bacteriol. 2010;192: 6390–6400. doi:10.1128/JB.00995-10
34. Cote CK, Cvitkovitch D, Bleiweis AS, Honeyman AL. A novel beta-glucoside-specific PTS locus from Streptococcus mutans that is not inhibited by glucose. Microbiol Read Engl. 2000;146 ( Pt 7): 1555–1563.
35. McKessar SJ, Hakenbeck R. The two-component regulatory system TCS08 is involved in cellobiose metabolism of Streptococcus pneumoniae R6. J Bacteriol. 2007;189: 1342–1350. doi:10.1128/JB.01170-06

Chapter 3
226
36. Moye ZD, Burne RA, Zeng L. Uptake and metabolism of N-acetylglucosamine and glucosamine by Streptococcus mutans. Appl Env Microbiol. 2014; doi:10.1128/AEM.00820-14
37. Burnaugh AM, Frantz LJ, King SJ. Growth of Streptococcus pneumoniae on human glycoconjugates is dependent upon the sequential activity of bacterial exoglycosidases. J Bacteriol. 2008;190: 221–230. doi:10.1128/JB.01251-07
38. King SJ, Hippe KR, Weiser JN. Deglycosylation of human glycoconjugates by the sequential activities of exoglycosidases expressed by Streptococcus pneumoniae. Mol Microbiol. 2006;59: 961–974. doi:10.1111/j.1365-2958.2005.04984.x
39. Marion C, Burnaugh AM, Woodiga SA, King SJ. Sialic acid transport contributes to pneumococcal colonization. Infect Immun. 2011;79: 1262–1269. doi:10.1128/IAI.00832-10
40. Heinemann M, Sauer U. Systems biology of microbial metabolism. Curr Opin Microbiol. 2010;13: 337–343. doi:10.1016/j.mib.2010.02.005
41. Andersen HW, Solem C, Hammer K, Jensen PR. Twofold reduction of phosphofructokinase activity in Lactococcus lactis results in strong decreases in growth rate and in glycolytic flux. J Bacteriol. 2001;183: 3458–3467. doi:10.1128/JB.183.11.3458-3467.2001
42. Vanderpool CK, Gottesman S. The novel transcription factor SgrR coordinates the response to glucose-phosphate stress. J Bacteriol. 2007;189: 2238–2248. doi:10.1128/JB.01689-06
43. Kaufman GE, Yother J. CcpA-dependent and -independent control of beta-galactosidase expression in Streptococcus pneumoniae occurs via regulation of an upstream phosphotransferase system-encoding operon. J Bacteriol. 2007;189: 5183–5192. doi:10.1128/JB.00449-07
44. Neves AR, Pool WA, Solopova A, Kok J, Santos H, Kuipers OP. Towards enhanced galactose utilization by Lactococcus lactis. Appl Env Microbiol. 2010;76: 7048–7060. doi:10.1128/AEM.01195-10
45. Zeng L, Das S, Burne RA. Utilization of lactose and galactose by Streptococcus mutans: transport, toxicity, and carbon catabolite repression. J Bacteriol. 2010;192: 2434–2444. doi:10.1128/JB.01624-09
46. Afzal M, Shafeeq S, Kuipers OP. LacR is a repressor of lacABCD and LacT an activator of lacTFEG, constituting the lac-gene cluster in Streptococcus pneumoniae. Appl Environ Microbiol. 2014; doi:10.1128/AEM.01370-14
47. De Vin F, Radstrom P, Herman L, De Vuyst L. Molecular and biochemical analysis of the galactose phenotype of dairy Streptococcus thermophilus strains reveals four different fermentation profiles. Appl Environ Microbiol. 2005;71: 3659–3667. doi:10.1128/AEM.71.7.3659-3667.2005
48. Vaillancourt K, Moineau S, Frenette M, Lessard C, Vadeboncoeur C. Galactose and lactose genes from the galactose-positive bacterium Streptococcus salivarius and the phylogenetically related galactose-negative bacterium Streptococcus thermophilus: organization, sequence, transcription, and activity of the gal gene products. J Bacteriol. 2002;184: 785–793. doi:10.1128/JB.184.3.785-793.2002
49. Ajdić D, Ferretti JJ. Transcriptional regulation of the Streptococcus mutans gal operon by the GalR repressor. J Bacteriol. 1998;180: 5727–5732.
Transcriptional and metabolic responses of S. pneumoniae to sugars
227
50. Vaughan EE, van den Bogaard PTC, Catzeddu P, Kuipers OP, de Vos WM. Activation of silent gal genes in the lac-gal regulon of Streptococcus thermophilus. J Bacteriol. 2001;183: 1184–1194. doi:10.1128/JB.183.4.1184-1194.2001
51. Vaillancourt K, LeMay J-D, Lamoureux M, Frenette M, Moineau S, Vadeboncoeur C. Characterization of a galactokinase-positive recombinant strain of Streptococcus thermophilus. Appl Environ Microbiol. 2004;70: 4596–4603. doi:10.1128/AEM.70.8.4596-4603.2004
52. Abranches J, Nascimento MM, Zeng L, Browngardt CM, Wen ZT, Rivera MF, et al. CcpA regulates central metabolism and virulence gene expression in Streptococcus mutans. J Bacteriol. 2008;190: 2340–2349. doi:10.1128/JB.01237-07
53. Melchiorsen CR, Jokumsen KV, Villadsen J, Johnsen MG, Israelsen H, Arnau J. Synthesis and posttranslational regulation of pyruvate formate-lyase in Lactococcus lactis. J Bacteriol. 2000;182: 4783–4788. doi:10.1128/JB.182.17.4783-4788.2000
54. Garrigues C, Loubiere P, Lindley ND, Cocaign-Bousquet M. Control of the shift from homolactic acid to mixed-acid fermentation in Lactococcus lactis: predominant role of the NADH/NAD+ ratio. J Bacteriol. 1997;179: 5282–5287.
55. Neves AR, Ramos A, Costa H, van Swam II, Hugenholtz J, Kleerebezem M, et al. Effect of different NADH oxidase levels on glucose metabolism by Lactococcus lactis: kinetics of intracellular metabolite pools determined by In vivo nuclear magnetic resonance. Appl Environ Microbiol. 2002;68: 6332–6342. doi:10.1128/AEM.68.12.6332-6342.2002
56. Ramos A, Neves AR, Ventura R, Maycock C, López P, Santos H. Effect of pyruvate kinase overproduction on glucose metabolism of Lactococcus lactis. Microbiol Read Engl. 2004;150: 1103–1111.
57. Neves A, Pool W, Kok J, Kuipers O, Santos H. Overview on sugar metabolism and its control in – The input from in vivo NMR. FEMS Microbiol Rev. 2005;29: 531–554. doi:10.1016/j.femsre.2005.04.005
58. Carvalho AL, Cardoso FS, Bohn A, Neves AR, Santos H. Engineering trehalose synthesis in Lactococcus lactis for improved stress tolerance. Appl Environ Microbiol. 2011;77: 4189–4199. doi:10.1128/AEM.02922-10
59. Neves AR, Ramos A, Shearman C, Gasson MJ, Santos H. Catabolism of mannitol in Lactococcus lactis MG1363 and a mutant defective in lactate dehydrogenase. Microbiol Read Engl. 2002;148: 3467–3476.
60. Neves AR, Pool WA, Castro R, Mingote A, Santos F, Kok J, et al. The alpha-phosphoglucomutase of Lactococcus lactis is unrelated to the alpha-D-phosphohexomutase superfamily and is encoded by the essential gene pgmH. J Biol Chem. 2006;281: 36864–36873. doi:10.1074/jbc.M607044200
61. Fang W, Yu X, Wang B, Zhou H, Ouyang H, Ming J, et al. Characterization of the Aspergillus fumigatus phosphomannose isomerase Pmi1 and its impact on cell wall synthesis and morphogenesis. Microbiol Read Engl. 2009;155: 3281–3293. doi:10.1099/mic.0.029975-0
62. Pitkänen J-P, Törmä A, Alff S, Huopaniemi L, Mattila P, Renkonen R. Excess mannose limits the growth of phosphomannose isomerase PMI40 deletion strain of Saccharomyces cerevisiae. J Biol Chem. 2004;279: 55737–55743. doi:10.1074/jbc.M410619200
63. Sasaki M, Teramoto H, Inui M, Yukawa H. Identification of mannose uptake and catabolism genes in Corynebacterium glutamicum and genetic engineering for

Chapter 3
228
simultaneous utilization of mannose and glucose. Appl Microbiol Biotechnol. 2011;89: 1905–1916. doi:10.1007/s00253-010-3002-8
64. Castro R, Neves AR, Fonseca LL, Pool WA, Kok J, Kuipers OP, et al. Characterization of the individual glucose uptake systems of Lactococcus lactis : mannose-PTS, cellobiose-PTS and the novel GlcU permease. Mol Microbiol. 2009;71: 795–806. doi:10.1111/j.1365-2958.2008.06564.x
65. Yesilkaya H, Spissu F, Carvalho SM, Terra VS, Homer KA, Benisty R, et al. Pyruvate formate lyase is required for pneumococcal fermentative metabolism and virulence. Infect Immun. 2009;77: 5418–5427. doi:10.1128/IAI.00178-09
66. Vanderpool CK. Physiological consequences of small RNA-mediated regulation of glucose-phosphate stress. Curr Opin Microbiol. 2007;10: 146–151. doi:10.1016/j.mib.2007.03.011
67. Iyer R, Camilli A. Sucrose metabolism contributes to in vivo fitness of Streptococcus pneumoniae. Mol Microbiol. 2007;66: 1–13. doi:10.1111/j.1365-2958.2007.05878.x
68. Poulsen K, Reinholdt J, Kilian M. Characterization of the Streptococcus pneumoniae immunoglobulin A1 protease gene (iga) and its translation product. Infect Immun. 1996;64: 3957–3966.
69. Sebert ME, Palmer LM, Rosenberg M, Weiser JN. Microarray-based identification of htrA, a Streptococcus pneumoniae gene that is regulated by the CiaRH two-component system and contributes to nasopharyngeal colonization. Infect Immun. 2002;70: 4059–4067. doi:10.1128/IAI.70.8.4059-4067.2002
70. Ibrahim YM, Kerr AR, McCluskey J, Mitchell TJ. Control of virulence by the two-component system CiaR/H is mediated via HtrA, a major virulence factor of Streptococcus pneumoniae. J Bacteriol. 2004;186: 5258–5266. doi:10.1128/JB.186.16.5258-5266.2004
71. Paterson GK, Blue CE, Mitchell TJ. An operon in Streptococcus pneumoniae containing a putative alkylhydroperoxidase D homologue contributes to virulence and the response to oxidative stress. Microb Pathog. 2006;40: 152–160. doi:10.1016/j.micpath.2005.12.003
72. Limoli DH, Sladek JA, Fuller LA, Singh AK, King SJ. BgaA acts as an adhesin to mediate attachment of some pneumococcal strains to human epithelial cells. Microbiology. 2011;157: 2369–2381. doi:10.1099/mic.0.045609-0
73. Song X-M, Connor W, Hokamp K, Babiuk LA, Potter AA. Streptococcus pneumoniae early response genes to human lung epithelial cells. BMC Res Notes. 2008;1: 64. doi:10.1186/1756-0500-1-64
74. Khan MN, Sharma SK, Filkins LM, Pichichero ME. PcpA of Streptococcus pneumoniae mediates adherence to nasopharyngeal and lung epithelial cells and elicits functional antibodies in humans. Microbes Infect Inst Pasteur. 2012;14: 1102–1110. doi:10.1016/j.micinf.2012.06.007
75. Johnston JW, Briles DE, Myers LE, Hollingshead SK. Mn2+-dependent regulation of multiple genes in Streptococcus pneumoniae through PsaR and the resultant impact on virulence. Infect Immun. 2006;74: 1171–1180. doi:10.1128/IAI.74.2.1171-1180.2006
76. Glover DT, Hollingshead SK, Briles DE. Streptococcus pneumoniae surface protein PcpA elicits protection against lung infection and fatal sepsis. Infect Immun. 2008;76: 2767–2776. doi:10.1128/IAI.01126-07

Transcriptional and metabolic responses of S. pneumoniae to sugars
229
77. Dalia AB, Standish AJ, Weiser JN. Three surface exoglycosidases from Streptococcus pneumoniae, NanA, BgaA, and StrH, promote resistance to opsonophagocytic killing by human neutrophils. Infect Immun. 2010;78: 2108–2116. doi:10.1128/IAI.01125-09
78. Bergmann S, Rohde M, Chhatwal GS, Hammerschmidt S. alpha-enolase of Streptococcus pneumoniae is a plasmin(ogen)-binding protein displayed on the bacterial cell surface. Mol Microbiol. 2001;40: 1273–1287.
79. Bergmann S, Rohde M, Hammerschmidt S. Glyceraldehyde-3-phosphate dehydrogenase of Streptococcus pneumoniae is a surface-displayed plasminogen-binding protein. Infect Immun. 2004;72: 2416–2419. doi:10.1128/IAI.72.4.2416-2419.2004
80. Stroeher UH, Kidd SP, Stafford SL, Jennings MP, Paton JC, McEwan AG. A pneumococcal MerR-like regulator and S-nitrosoglutathione reductase are required for systemic virulence. J Infect Dis. 2007;196: 1820–1826. doi:10.1086/523107
81. Moye ZD, Zeng L, Burne RA. Modification of gene expression and virulence traits in Streptococcus mutans in response to carbohydrate availability. Appl Environ Microbiol. 2014;80: 972–985. doi:10.1128/AEM.03579-13
82. Ferrando ML, van Baarlen P, Orrù G, Piga R, Bongers RS, Wels M, et al. Carbohydrate availability regulates virulence gene expression in Streptococcus suis. Kreth J, editor. PLoS ONE. 2014;9: e89334. doi:10.1371/journal.pone.0089334


Transcriptional and metabolic responses of S. pneumoniae to sugars
231
Supporting Information_Chapter 3
Supporting Information

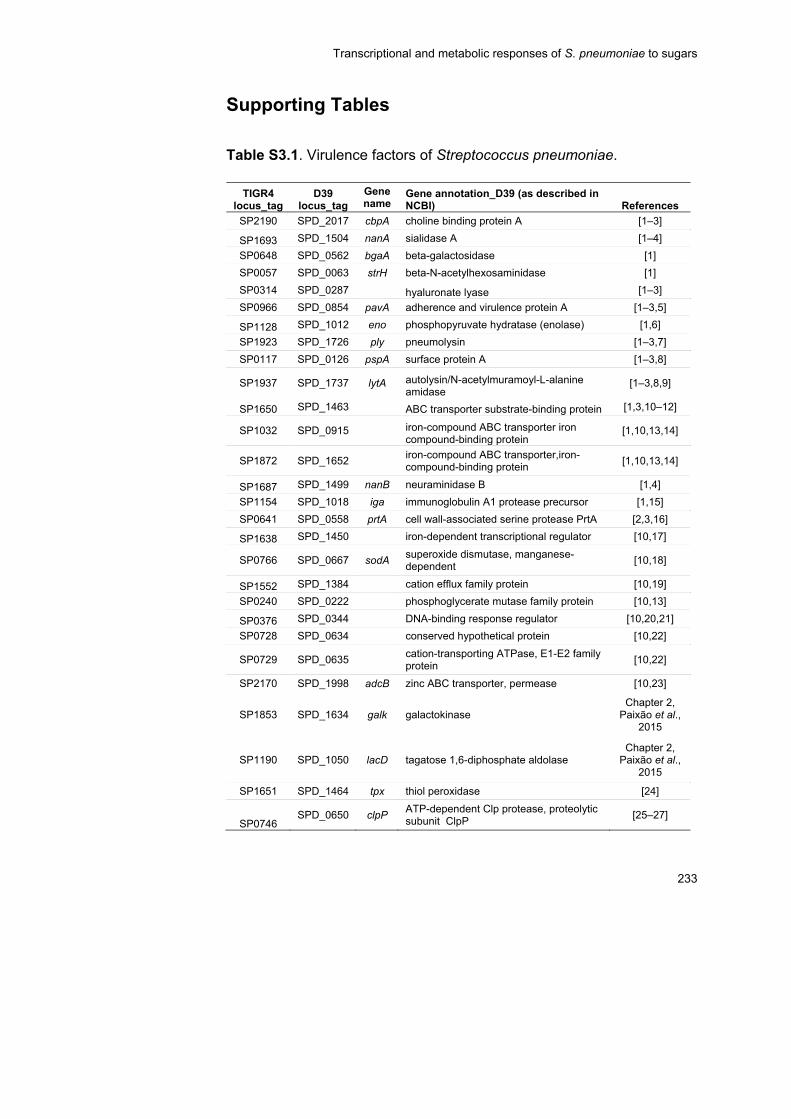
Transcriptional and metabolic responses of S. pneumoniae to sugars
233
Supporting Tables
Table S3.1. Virulence factors of Streptococcus pneumoniae.
TIGR4 locus_tag
D39 locus_tag
Gene name
Gene annotation_D39 (as described in NCBI) References
SP2190 SPD_2017 cbpA choline binding protein A [1–3]
SP1693 SPD_1504 nanA sialidase A [1–4]
SP0648 SPD_0562 bgaA beta-galactosidase [1]
SP0057 SPD_0063 strH beta-N-acetylhexosaminidase [1]
SP0314 SPD_0287 hyaluronate lyase [1–3]
SP0966 SPD_0854 pavA adherence and virulence protein A [1–3,5]
SP1128 SPD_1012 eno phosphopyruvate hydratase (enolase) [1,6]
SP1923 SPD_1726 ply pneumolysin [1–3,7]
SP0117 SPD_0126 pspA surface protein A [1–3,8]
SP1937 SPD_1737 lytA autolysin/N-acetylmuramoyl-L-alanine amidase
[1–3,8,9]
SP1650 SPD_1463 ABC transporter substrate-binding protein [1,3,10–12]
SP1032 SPD_0915 iron-compound ABC transporter iron compound-binding protein
[1,10,13,14]
SP1872 SPD_1652 iron-compound ABC transporter,iron-compound-binding protein
[1,10,13,14]
SP1687 SPD_1499 nanB neuraminidase B [1,4]
SP1154 SPD_1018 iga immunoglobulin A1 protease precursor [1,15]
SP0641 SPD_0558 prtA cell wall-associated serine protease PrtA [2,3,16]
SP1638 SPD_1450 iron-dependent transcriptional regulator [10,17]
SP0766 SPD_0667 sodA superoxide dismutase, manganese-dependent
[10,18]
SP1552 SPD_1384 cation efflux family protein [10,19]
SP0240 SPD_0222 phosphoglycerate mutase family protein [10,13]
SP0376 SPD_0344 DNA-binding response regulator [10,20,21]
SP0728 SPD_0634 conserved hypothetical protein [10,22]
SP0729 SPD_0635 cation-transporting ATPase, E1-E2 family protein
[10,22]
SP2170 SPD_1998 adcB zinc ABC transporter, permease [10,23]
SP1853 SPD_1634 galk galactokinase Chapter 2,
Paixão et al., 2015
SP1190 SPD_1050 lacD tagatose 1,6-diphosphate aldolase Chapter 2,
Paixão et al., 2015
SP1651 SPD_1464 tpx thiol peroxidase [24]
SP0746 SPD_0650 clpP
ATP-dependent Clp protease, proteolytic subunit ClpP
[25–27]
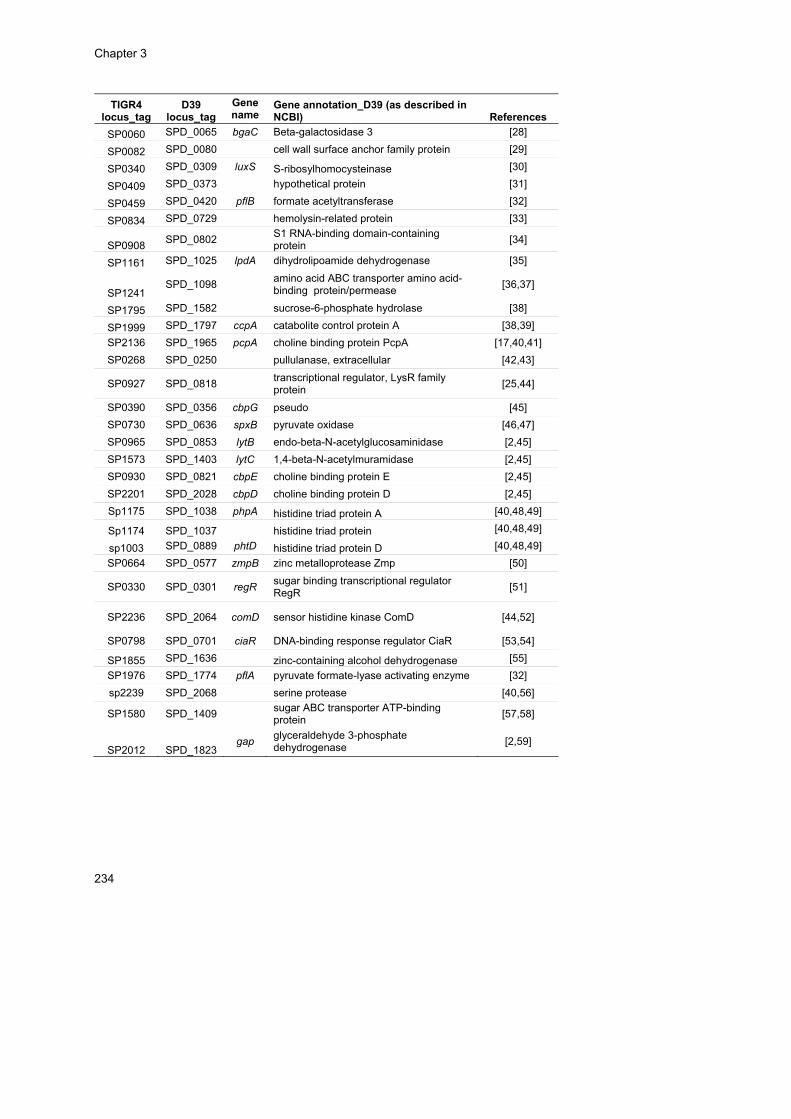
Chapter 3
234
TIGR4 locus_tag
D39 locus_tag
Gene name
Gene annotation_D39 (as described in NCBI) References
SP0060 SPD_0065 bgaC Beta-galactosidase 3 [28]
SP0082 SPD_0080 cell wall surface anchor family protein [29]
SP0340 SPD_0309 luxS S-ribosylhomocysteinase [30]
SP0409 SPD_0373 hypothetical protein [31]
SP0459 SPD_0420 pflB formate acetyltransferase [32]
SP0834 SPD_0729 hemolysin-related protein [33]
SP0908 SPD_0802
S1 RNA-binding domain-containing protein
[34]
SP1161 SPD_1025 lpdA dihydrolipoamide dehydrogenase [35]
SP1241 SPD_1098
amino acid ABC transporter amino acid-binding protein/permease
[36,37]
SP1795 SPD_1582 sucrose-6-phosphate hydrolase [38]
SP1999 SPD_1797 ccpA catabolite control protein A [38,39]
SP2136 SPD_1965 pcpA choline binding protein PcpA [17,40,41]
SP0268 SPD_0250 pullulanase, extracellular [42,43]
SP0927 SPD_0818 transcriptional regulator, LysR family protein
[25,44]
SP0390 SPD_0356 cbpG pseudo [45]
SP0730 SPD_0636 spxB pyruvate oxidase [46,47]
SP0965 SPD_0853 lytB endo-beta-N-acetylglucosaminidase [2,45]
SP1573 SPD_1403 lytC 1,4-beta-N-acetylmuramidase [2,45]
SP0930 SPD_0821 cbpE choline binding protein E [2,45]
SP2201 SPD_2028 cbpD choline binding protein D [2,45]
Sp1175 SPD_1038 phpA histidine triad protein A [40,48,49]
Sp1174 SPD_1037 histidine triad protein [40,48,49]
sp1003 SPD_0889 phtD histidine triad protein D [40,48,49]
SP0664 SPD_0577 zmpB zinc metalloprotease Zmp [50]
SP0330 SPD_0301 regR sugar binding transcriptional regulator RegR
[51]
SP2236 SPD_2064 comD sensor histidine kinase ComD [44,52]
SP0798 SPD_0701 ciaR DNA-binding response regulator CiaR [53,54]
SP1855 SPD_1636 zinc-containing alcohol dehydrogenase [55]
SP1976 SPD_1774 pflA pyruvate formate-lyase activating enzyme [32]
sp2239 SPD_2068 serine protease [40,56]
SP1580 SPD_1409 sugar ABC transporter ATP-binding protein
[57,58]
SP2012 SPD_1823 gap
glyceraldehyde 3-phosphate dehydrogenase
[2,59]
Transcriptional and metabolic responses of S. pneumoniae to sugars
235
References
1. Kadioglu A, Weiser JN, Paton JC, Andrew PW (2008) The role of Streptococcus pneumoniae virulence factors in host respiratory colonization and disease. Nat Rev Microbiol 6: 288–301.
2. Mitchell AM, Mitchell TJ (2010) Streptococcus pneumoniae: virulence factors and variation. Clin Microbiol Infect 16: 411–418.
3. Nieto PA, Riquelme SA, Riedel CA, Kalergis AM, Bueno SM (2013) Gene elements that regulate Streptococcus pneumoniae virulence and immunity evasion. Curr Gene Ther 13: 51–64.
4. Manco S, Hernon F, Yesilkaya H, Paton JC, Andrew PW, et al. (2006) Pneumococcal neuraminidases A and B both have essential roles during infection of the Rrespiratory tract and sepsis. Infect Immun 74: 4014–4020.
5. Holmes AR, McNab R, Millsap KW, Rohde M, Hammerschmidt S, et al. (2001) The pavA gene of Streptococcus pneumoniae encodes a fibronectin-binding protein that is essential for virulence. Mol Microbiol 41: 1395–1408.
6. Bergmann S, Rohde M, Chhatwal GS, Hammerschmidt S (2001) alpha-enolase of Streptococcus pneumoniae is a plasmin(ogen)-binding protein displayed on the bacterial cell surface. Mol Microbiol 40: 1273–1287.
7. Berry AM, Yother J, Briles DE, Hansman D, Paton JC (1989) Reduced virulence of a defined pneumolysin-negative mutant of Streptococcus pneumoniae. Infect Immun 57: 2037–2042.
8. Berry AM, Paton JC (2000) Additive attenuation of virulence of Streptococcus pneumoniae by mutation of the genes encoding pneumolysin and other putative pneumococcal virulence proteins. Infect Immun 68: 133–140.
9. Orihuela CJ, Gao G, Francis KP, Yu J, Tuomanen EI (2004) Tissue-specific contributions of pneumococcal virulence factors to pathogenesis. J Infect Dis 190: 1661–1669.
10. Honsa ES, Johnson MDL, Rosch JW (2013) The roles of transition metals in the physiology and pathogenesis of Streptococcus pneumoniae. Front Cell Infect Microbiol 3: 92.
11. Berry AM, Paton JC (1996) Sequence heterogeneity of PsaA, a 37-kilodalton putative adhesin essential for virulence of Streptococcus pneumoniae. Infect Immun 64: 5255–5262.
12. Marra A, Lawson S, Asundi JS, Brigham D, Hromockyj AE (2002) In vivo characterization of the psa genes from Streptococcus pneumoniae in multiple models of infection. Microbiology 148: 1483–1491.
13. Brown JS, Gilliland SM, Ruiz-Albert J, Holden DW (2002) Characterization of Pit, a Streptococcus pneumoniae iron uptake ABC transporter. Infect Immun 70: 4389–4398.
14. Brown JS, Gilliland SM, Holden DW (2001) A Streptococcus pneumoniae pathogenicity island encoding an ABC transporter involved in iron uptake and virulence. Mol Microbiol 40: 572–585.
15. Poulsen K, Reinholdt J, Kilian M (1996) Characterization of the Streptococcus pneumoniae immunoglobulin A1 protease gene (iga) and its translation product. Infect Immun 64: 3957–3966.
Chapter 3
236
16. Bethe G, Nau R, Wellmer A, Hakenbeck R, Reinert RR, et al. (2001) The cell wall-associated serine protease PrtA: a highly conserved virulence factor of Streptococcus pneumoniae. FEMS Microbiol Lett 205: 99–104.
17. Johnston JW, Briles DE, Myers LE, Hollingshead SK (2006) Mn2+-dependent regulation of multiple genes in Streptococcus pneumoniae through PsaR and the resultant impact on virulence. Infect Immun 74: 1171–1180.
18. Yesilkaya H, Kadioglu A, Gingles N, Alexander JE, Mitchell TJ, et al. (2000) Role of manganese-containing superoxide dismutase in oxidative stress and virulence of Streptococcus pneumoniae. Infect Immun 68: 2819–2826.
19. Rosch JW, Gao G, Ridout G, Wang Y-D, Tuomanen EI (2009) Role of the manganese efflux system mntE for signalling and pathogenesis in Streptococcus pneumoniae: Role of the manganese efflux system mntE. Mol Microbiol 72: 12–25.
20. Ulijasz AT, Andes DR, Glasner JD, Weisblum B (2004) Regulation of iron transport in Streptococcus pneumoniae by RitR, an orphan response regulator. J Bacteriol 186: 8123–8136.
21. Throup JP, Koretke KK, Bryant AP, Ingraham KA, Chalker AF, et al. (2000) A genomic analysis of two-component signal transduction in Streptococcus pneumoniae. Mol Microbiol 35: 566–576.
22. Shafeeq S, Yesilkaya H, Kloosterman TG, Narayanan G, Wandel M, et al. (2011) The cop operon is required for copper homeostasis and contributes to virulence in Streptococcus pneumoniae. Mol Microbiol 81: 1255–1270.
23. McDevitt CA, Ogunniyi AD, Valkov E, Lawrence MC, Kobe B, et al. (2011) A Molecular mechanism for bacterial susceptibility to zinc. PLoS Pathog 7: e1002357.
24. Hajaj B, Yesilkaya H, Benisty R, David M, Andrew PW, et al. (2012) Thiol peroxidase is an important component of Streptococcus pneumoniae in oxygenated environments. Infect Immun 80: 4333–4343.
25. Mahdi LK, Ebrahimie E, Adelson DL, Paton JC, Ogunniyi AD (2013) A transcription factor contributes to pathogenesis and virulence in Streptococcus pneumoniae. PLoS ONE 8: e70862.
26. Robertson GT, Ng W-L, Foley J, Gilmour R, Winkler ME (2002) Global transcriptional analysis of clpP mutations of type 2 Streptococcus pneumoniae and their effects on physiology and virulence. J Bacteriol 184: 3508–3520.
27. Park C-Y, Kim E-H, Choi S-Y, Tran TD-H, Kim I-H, et al. (2010) Virulence attenuation of Streptococcus pneumoniae clpP mutant by sensitivity to oxidative stress in macrophages via an NO-mediated pathway. J Microbiol Seoul Korea 48: 229–235.
28. Terra VS, Homer KA, Rao SG, Andrew PW, Yesilkaya H (2010) Characterization of Novel β-galactosidase activity that contributes to glycoprotein degradation and virulence in Streptococcus pneumoniae. Infect Immun 78: 348–357.
29. Jensch I, Gámez G, Rothe M, Ebert S, Fulde M, et al. (2010) PavB is a surface-exposed adhesin of Streptococcus pneumoniae contributing to nasopharyngeal colonization and airways infections. Mol Microbiol 77: 22–43.
30. Joyce EA, Kawale A, Censini S, Kim CC, Covacci A, et al. (2004) LuxS is required for persistent pneumococcal carriage and expression of virulence and biosynthesis genes. Infect Immun 72: 2964–2975.
Transcriptional and metabolic responses of S. pneumoniae to sugars
237
31. Paterson GK, Blue CE, Mitchell TJ (2006) An operon in Streptococcus pneumoniae containing a putative alkylhydroperoxidase D homologue contributes to virulence and the response to oxidative stress. Microb Pathog 40: 152–160.
32. Yesilkaya H, Spissu F, Carvalho SM, Terra VS, Homer KA, et al. (2009) Pyruvate formate lyase is required for pneumococcal fermentative metabolism and virulence. Infect Immun 77: 5418–5427.
33. Yamaguchi M, Minamide Y, Terao Y, Isoda R, Ogawa T, et al. (2009) Nrc of Streptococcus pneumoniae suppresses capsule expression and enhances anti-phagocytosis. Biochem Biophys Res Commun 390: 155–160.
34. He X, Thornton J, Carmicle-Davis S, McDaniel LS (2006) Tex, a putative transcriptional accessory factor, is involved in pathogen fitness in Streptococcus pneumoniae. Microb Pathog 41: 199–206.
35. Smith AW, Roche H, Trombe M-C, Briles DE, Håkansson A (2002) Characterization of the dihydrolipoamide dehydrogenase from Streptococcus pneumoniae and its role in pneumococcal infection. Mol Microbiol 44: 431–448.
36. Hendriksen WT, Kloosterman TG, Bootsma HJ, Estevão S, de Groot R, et al. (2008) Site-specific contributions of glutamine-dependent regulator GlnR and GlnR-regulated genes to virulence of Streptococcus pneumoniae. Infect Immun 76: 1230–1238.
37. Härtel T, Klein M, Koedel U, Rohde M, Petruschka L, et al. (2011) Impact of glutamine transporters on pneumococcal fitness under infection-related conditions. Infect Immun 79: 44–58.
38. Iyer R, Camilli A (2007) Sucrose metabolism contributes to in vivo fitness of Streptococcus pneumoniae. Mol Microbiol 66: 1–13.
39. Giammarinaro P, Paton JC (2002) Role of RegM, a homologue of the catabolite repressor protein CcpA, in the virulence of Streptococcus pneumoniae. Infect Immun 70: 5454–5461.
40. Hava DL, Camilli A (2002) Large-scale identification of serotype 4 Streptococcus pneumoniae virulence factors. Mol Microbiol 45: 1389–1406.
41. Glover DT, Hollingshead SK, Briles DE (2008) Streptococcus pneumoniae surface protein PcpA elicits protection against lung infection and fatal sepsis. Infect Immun 76: 2767–2776.
42. Bongaerts RJM, Heinz H-P, Hadding U, Zysk G (2000) Antigenicity, expression, and molecular characterization of surface-located pullulanase of Streptococcus pneumoniae. Infect Immun 68: 7141–7143.
43. Lammerts van Bueren A, Ficko-Blean E, Pluvinage B, Hehemann J-H, Higgins MA, et al. (2011) The conformation and function of a multimodular glycogen-degrading pneumococcal virulence factor. Struct Lond Engl 1993 19: 640–651.
44. Lau GW, Haataja S, Lonetto M, Kensit SE, Marra A, et al. (2001) A functional genomic analysis of type 3 Streptococcus pneumoniae virulence. Mol Microbiol 40: 555–571.
45. Gosink KK, Mann ER, Guglielmo C, Tuomanen EI, Masure HR (2000) Role of novel choline binding proteins in virulence of Streptococcus pneumoniae. Infect Immun 68: 5690–5695.
46. LeMessurier KS (2006) Differential expression of key pneumococcal virulence genes in vivo. Microbiology 152: 305–311.
Chapter 3
238
47. Spellerberg B, Cundell DR, Sandros J, Pearce BJ, Idanpaan-Heikkila I, et al. (1996) Pyruvate oxidase, as a determinant of virulence in Streptococcus pneumoniae. Mol Microbiol 19: 803–813.
48. Ogunniyi AD, Grabowicz M, Mahdi LK, Cook J, Gordon DL, et al. (2009) Pneumococcal histidine triad proteins are regulated by the Zn2+-dependent repressor AdcR and inhibit complement deposition through the recruitment of complement factor H. FASEB J Off Publ Fed Am Soc Exp Biol 23: 731–738.
49. Adamou JE, Heinrichs JH, Erwin AL, Walsh W, Gayle T, et al. (2001) Identification and characterization of a novel family of pneumococcal proteins that are protective against sepsis. Infect Immun 69: 949–958.
50. Blue CE, Paterson GK, Kerr AR, Berge M, Claverys JP, et al. (2003) ZmpB, a novel virulence factor of Streptococcus pneumoniae that induces tumor necrosis factor alpha production in the respiratory tract. Infect Immun 71: 4925–4935.
51. Chapuy-Regaud S, Ogunniyi AD, Diallo N, Huet Y, Desnottes J-F, et al. (2003) RegR, a global LacI/GalR family regulator, modulates virulence and competence in Streptococcus pneumoniae. Infect Immun 71: 2615–2625.
52. Bartilson M, Marra A, Christine J, Asundi JS, Schneider WP, et al. (2001) Differential fluorescence induction reveals Streptococcus pneumoniae loci regulated by competence stimulatory peptide. Mol Microbiol 39: 126–135.
53. Ibrahim YM, Kerr AR, McCluskey J, Mitchell TJ (2004) Control of virulence by the two-component system CiaR/H is mediated via HtrA, a major virulence factor of Streptococcus pneumoniae. J Bacteriol 186: 5258–5266.
54. Trihn M, Ge X, Dobson A, Kitten T, Munro CL, et al. (2013) Two-component system response regulators involved in virulence of Streptococcus pneumoniae TIGR4 in infective endocarditis. PLoS ONE 8: e54320. doi:10.1371/journal.pone.0054320.
55. Stroeher UH, Kidd SP, Stafford SL, Jennings MP, Paton JC, et al. (2007) A pneumococcal MerR-like regulator and S-nitrosoglutathione reductase are required for systemic virulence. J Infect Dis 196: 1820–1826.
56. Ibrahim YM, Kerr AR, McCluskey J, Mitchell TJ (2004) Role of HtrA in the virulence and competence of Streptococcus pneumoniae. Infect Immun 72: 3584–3591.
57. Polissi A, Pontiggia A, Feger G, Altieri M, Mottl H, et al. (1998) Large-scale identification of virulence genes from Streptococcus pneumoniae. Infect Immun 66: 5620–5629.
58. Marion C, Burnaugh AM, Woodiga SA, King SJ (2011) Sialic acid transport contributes to pneumococcal colonization. Infect Immun 79: 1262–1269.
59. Bergmann S, Rohde M, Hammerschmidt S (2004) Glyceraldehyde-3-phosphate dehydrogenase of Streptococcus pneumoniae is a surface-displayed plasminogen-binding protein. Infect Immun 72: 2416–2419.
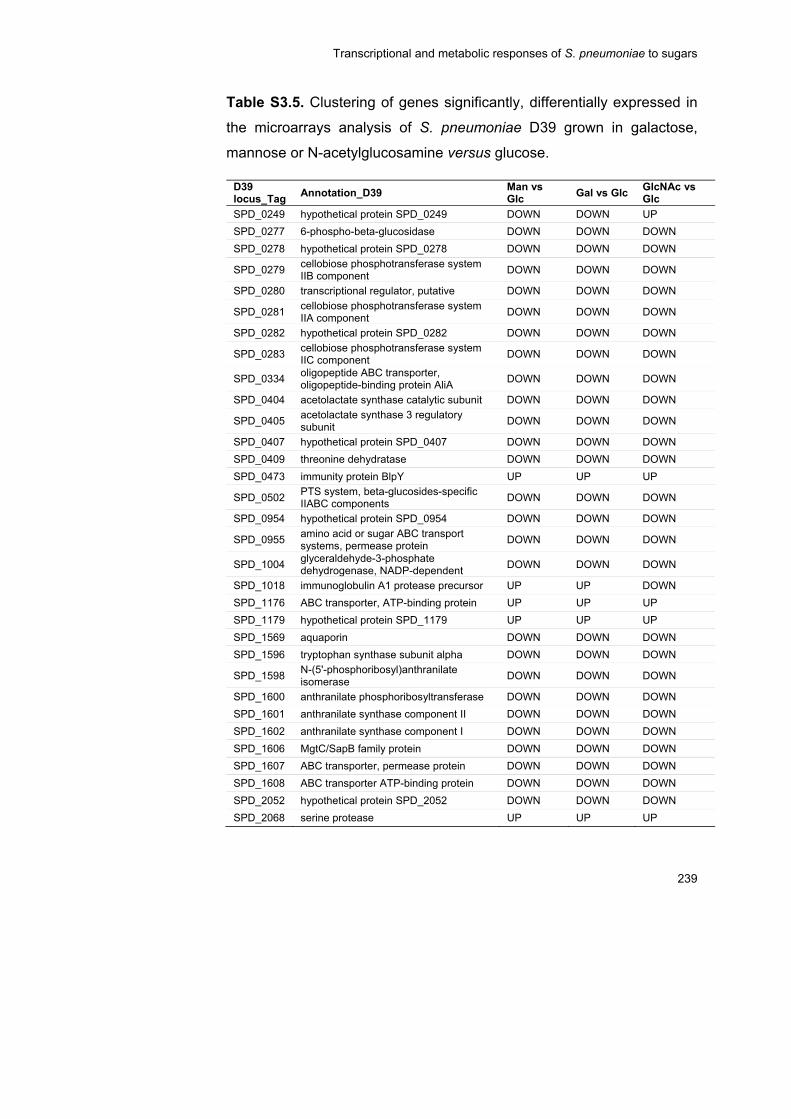
Transcriptional and metabolic responses of S. pneumoniae to sugars
239
Table S3.5. Clustering of genes significantly, differentially expressed in
the microarrays analysis of S. pneumoniae D39 grown in galactose,
mannose or N-acetylglucosamine versus glucose.
D39 locus_Tag
Annotation_D39 Man vs Glc
Gal vs Glc GlcNAc vs Glc
SPD_0249 hypothetical protein SPD_0249 DOWN DOWN UP
SPD_0277 6-phospho-beta-glucosidase DOWN DOWN DOWN
SPD_0278 hypothetical protein SPD_0278 DOWN DOWN DOWN
SPD_0279 cellobiose phosphotransferase system IIB component
DOWN DOWN DOWN
SPD_0280 transcriptional regulator, putative DOWN DOWN DOWN
SPD_0281 cellobiose phosphotransferase system IIA component
DOWN DOWN DOWN
SPD_0282 hypothetical protein SPD_0282 DOWN DOWN DOWN
SPD_0283 cellobiose phosphotransferase system IIC component
DOWN DOWN DOWN
SPD_0334 oligopeptide ABC transporter, oligopeptide-binding protein AliA
DOWN DOWN DOWN
SPD_0404 acetolactate synthase catalytic subunit DOWN DOWN DOWN
SPD_0405 acetolactate synthase 3 regulatory subunit
DOWN DOWN DOWN
SPD_0407 hypothetical protein SPD_0407 DOWN DOWN DOWN
SPD_0409 threonine dehydratase DOWN DOWN DOWN
SPD_0473 immunity protein BlpY UP UP UP
SPD_0502 PTS system, beta-glucosides-specific IIABC components
DOWN DOWN DOWN
SPD_0954 hypothetical protein SPD_0954 DOWN DOWN DOWN
SPD_0955 amino acid or sugar ABC transport systems, permease protein
DOWN DOWN DOWN
SPD_1004 glyceraldehyde-3-phosphate dehydrogenase, NADP-dependent
DOWN DOWN DOWN
SPD_1018 immunoglobulin A1 protease precursor UP UP DOWN
SPD_1176 ABC transporter, ATP-binding protein UP UP UP
SPD_1179 hypothetical protein SPD_1179 UP UP UP
SPD_1569 aquaporin DOWN DOWN DOWN
SPD_1596 tryptophan synthase subunit alpha DOWN DOWN DOWN
SPD_1598 N-(5'-phosphoribosyl)anthranilate isomerase
DOWN DOWN DOWN
SPD_1600 anthranilate phosphoribosyltransferase DOWN DOWN DOWN
SPD_1601 anthranilate synthase component II DOWN DOWN DOWN
SPD_1602 anthranilate synthase component I DOWN DOWN DOWN
SPD_1606 MgtC/SapB family protein DOWN DOWN DOWN
SPD_1607 ABC transporter, permease protein DOWN DOWN DOWN
SPD_1608 ABC transporter ATP-binding protein DOWN DOWN DOWN
SPD_2052 hypothetical protein SPD_2052 DOWN DOWN DOWN
SPD_2068 serine protease UP UP UP
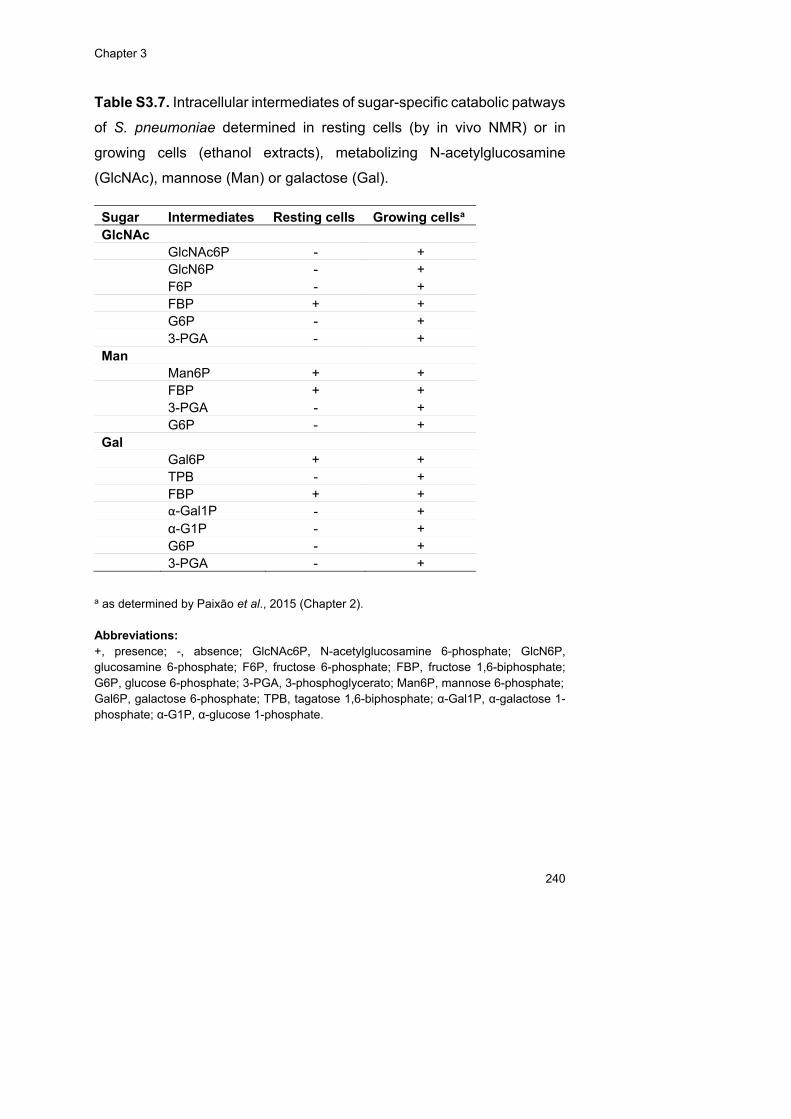
Chapter 3
240
Table S3.7. Intracellular intermediates of sugar-specific catabolic patways
of S. pneumoniae determined in resting cells (by in vivo NMR) or in
growing cells (ethanol extracts), metabolizing N-acetylglucosamine
(GlcNAc), mannose (Man) or galactose (Gal).
Sugar Intermediates Resting cells Growing cellsa GlcNAc GlcNAc6P - +
GlcN6P - + F6P - + FBP + + G6P - +
3-PGA - + Man
Man6P + + FBP + + 3-PGA - +
G6P - + Gal
Gal6P + + TPB - + FBP + + α-Gal1P - + α-G1P - + G6P - +
3-PGA - + a as determined by Paixão et al., 2015 (Chapter 2). Abbreviations: +, presence; -, absence; GlcNAc6P, N-acetylglucosamine 6-phosphate; GlcN6P, glucosamine 6-phosphate; F6P, fructose 6-phosphate; FBP, fructose 1,6-biphosphate; G6P, glucose 6-phosphate; 3-PGA, 3-phosphoglycerato; Man6P, mannose 6-phosphate; Gal6P, galactose 6-phosphate; TPB, tagatose 1,6-biphosphate; α-Gal1P, α-galactose 1-phosphate; α-G1P, α-glucose 1-phosphate.

Transcriptional and metabolic responses of S. pneumoniae to sugars
241
Table S3.8. Summary of the significantly differentially expressed genes
(up- or downregulated) of cells of S. pneumoniae D39 grown in CDM
supplemented with N-acetylglucosamine (GlcNAc), mannose (Man),
galactose (Gal) or in a mixture thereof challenged with a glucose (Glc)
pulse and compared to unchallenged cells, determined by DNA
microarrays.
Locus_tag Gene Product GlcNAc Man Gal Mix c
Sugar-specific catabolismd
SPD_1050 lacD tagatose 1,6-diphosphate aldolase -2.02
SPD_1051 lacC tagatose-6-phosphate kinase -1.76
SPD_1052 lacB galactose-6-phosphate isomerase subunit LacB
0.32 -2.10 -1.05
SPD_1053 lacA galactose-6-phosphate isomerase subunit LacA
-1.95 -1.41
SPD_1163 N-acetylneuraminate lyase, putative -0.55 0.85 -0.82 -0.65
SPD_1246 nagB glucosamine-6-phosphate isomerase
-0.53 0.66
SPD_1488 ROK family protein 0.83 -0.71 -0.68
SPD_1497 nanE-1 N-acetylmannosamine-6-phosphate 2-epimerase
-0.63 0.88 -0.73 -0.54
SPD_1633 gaT-2 galactose-1-phosphate uridylyltransferase
0.45 -1.78 -0.50
SPD_1634 galK galactokinase 0.77 -1.69 -0.89
SPD_1993 fucU RbsD/FucU transport protein family protein
-0.70 -0.65
SPD_1994 fucA L-fuculose phosphate aldolase -0.80 -0.90 -0.40
SPD_1995 fucK L-fuculose kinase FucK, putative -1.38 -0.71
Glycolysis
SPD_1012 eno enolase 0.33
SPD_1823 gap glyceraldehyde-3-phosphate dehydrogenase
0.39
Pyruvate metabolism
SPD_0420 pflB pyruvate formate-lyase -0.53 0.70 -0.99
SPD_0621 lctO lactate oxidase -0.93 0.98 -0.63
SPD_0985 pta phosphotransacetylase -0.34 0.56 -0.80
SPD_1834 adh bifunctional acetaldehyde-CoA/alcohol dehydrogenase
-0.95 0.53 -1.63
Sugar-specific transportersd
SPD_0066 PTS system, IIB component -0.54
SPD_0088 ABC transporter, permease protein
-1.49 1.83 -1.66
SPD_0089 ABC transporter, permease protein
-1.32 1.60 -0.85
SPD_0090 ABC transporter, substrate-binding protein
-0.60
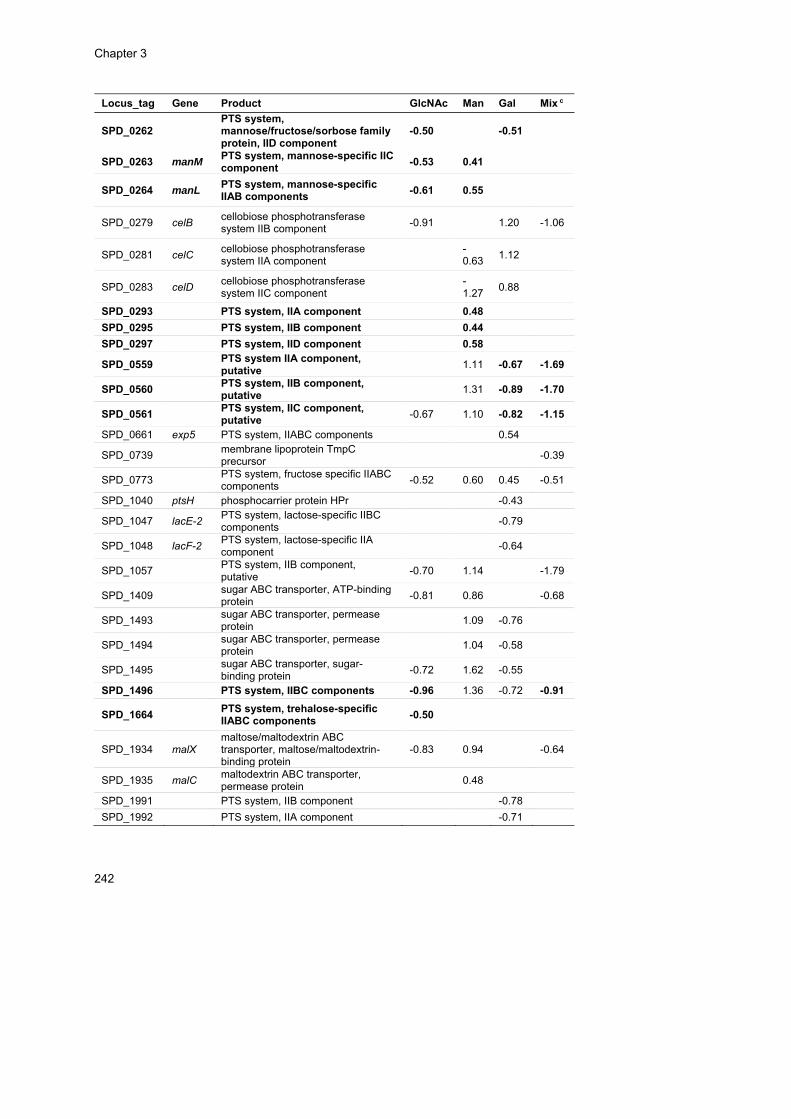
Chapter 3
242
Locus_tag Gene Product GlcNAc Man Gal Mix c
SPD_0262 PTS system, mannose/fructose/sorbose family protein, IID component
-0.50 -0.51
SPD_0263 manM PTS system, mannose-specific IIC component
-0.53 0.41
SPD_0264 manL PTS system, mannose-specific IIAB components
-0.61 0.55
SPD_0279 celB cellobiose phosphotransferase system IIB component
-0.91 1.20 -1.06
SPD_0281 celC cellobiose phosphotransferase system IIA component
-0.63
1.12
SPD_0283 celD cellobiose phosphotransferase system IIC component
-1.27
0.88
SPD_0293 PTS system, IIA component 0.48
SPD_0295 PTS system, IIB component 0.44
SPD_0297 PTS system, IID component 0.58
SPD_0559 PTS system IIA component, putative
1.11 -0.67 -1.69
SPD_0560 PTS system, IIB component, putative
1.31 -0.89 -1.70
SPD_0561 PTS system, IIC component, putative
-0.67 1.10 -0.82 -1.15
SPD_0661 exp5 PTS system, IIABC components 0.54
SPD_0739 membrane lipoprotein TmpC precursor
-0.39
SPD_0773 PTS system, fructose specific IIABC components
-0.52 0.60 0.45 -0.51
SPD_1040 ptsH phosphocarrier protein HPr -0.43
SPD_1047 lacE-2 PTS system, lactose-specific IIBC components
-0.79
SPD_1048 lacF-2 PTS system, lactose-specific IIA component
-0.64
SPD_1057 PTS system, IIB component, putative
-0.70 1.14 -1.79
SPD_1409 sugar ABC transporter, ATP-binding protein
-0.81 0.86 -0.68
SPD_1493 sugar ABC transporter, permease protein
1.09 -0.76
SPD_1494 sugar ABC transporter, permease protein
1.04 -0.58
SPD_1495 sugar ABC transporter, sugar-binding protein
-0.72 1.62 -0.55
SPD_1496 PTS system, IIBC components -0.96 1.36 -0.72 -0.91
SPD_1664 PTS system, trehalose-specific IIABC components
-0.50
SPD_1934 malX maltose/maltodextrin ABC transporter, maltose/maltodextrin-binding protein
-0.83 0.94 -0.64
SPD_1935 malC maltodextrin ABC transporter, permease protein
0.48
SPD_1991 PTS system, IIB component -0.78
SPD_1992 PTS system, IIA component -0.71

Transcriptional and metabolic responses of S. pneumoniae to sugars
243
a Subtable of Tables S3.9, S3.10, S3.11 and S3.12 provided on the CD. b Values of ln-ratio. Positive values indicate upregulation and negative values indicate downregulation. c Mixture of Gal, Man and GlcNAc. d As reviewed by Paixão et al. 2015 (Chapter 2). In bold are depicted the transporters and sugar-specific catabolic genes known or putatively involved in the metabolism of GlcNAc, Man or Gal, as reviewed by Paixão et al. 2015 (Chapter 2).
Table S3.13. Clustering of genes significantly, differentially expressed in
the microarrays analysis of S. pneumoniae D39 grown in galactose,
mannose, N-acetylglucosamine or in a mixture thereof challenged with
glucose versus unchallenged cells.
D39 locus_Tag
MixPulseGlc vs Mix
GlcNAcPulseGlc vs GlcNAc
ManPulseGlc vs Man
GalPulseGlc vs Gal
Annotation_D39
SPD_0277 DOWN DOWN DOWN UP 6-phospho-beta-glucosidase
SPD_0373 DOWN DOWN UP DOWN hypothetical protein SPD_0373
SPD_0476 UP UP DOWN UP hypothetical protein SPD_0476
SPD_0561 DOWN DOWN UP DOWN PTS system, IIC component, putative
SPD_0724 DOWN DOWN UP DOWN phosphopentomutase
SPD_0725 DOWN DOWN UP DOWN pseudo
SPD_0771 DOWN DOWN UP UP lactose phosphotransferase system repressor
SPD_0772 DOWN DOWN UP UP 1-phosphofructokinase, putative
SPD_0773 DOWN DOWN UP UP PTS system, fructose specific IIABC components
SPD_1163 DOWN DOWN UP DOWN N-acetylneuraminate lyase, putative
SPD_1215 UP UP DOWN UP cytoplasmic alpha-amylase
SPD_1299 DOWN DOWN UP DOWN hypothetical protein SPD_1299
SPD_1300 DOWN DOWN UP DOWN thiamine biosynthesis protein ApbE, putative
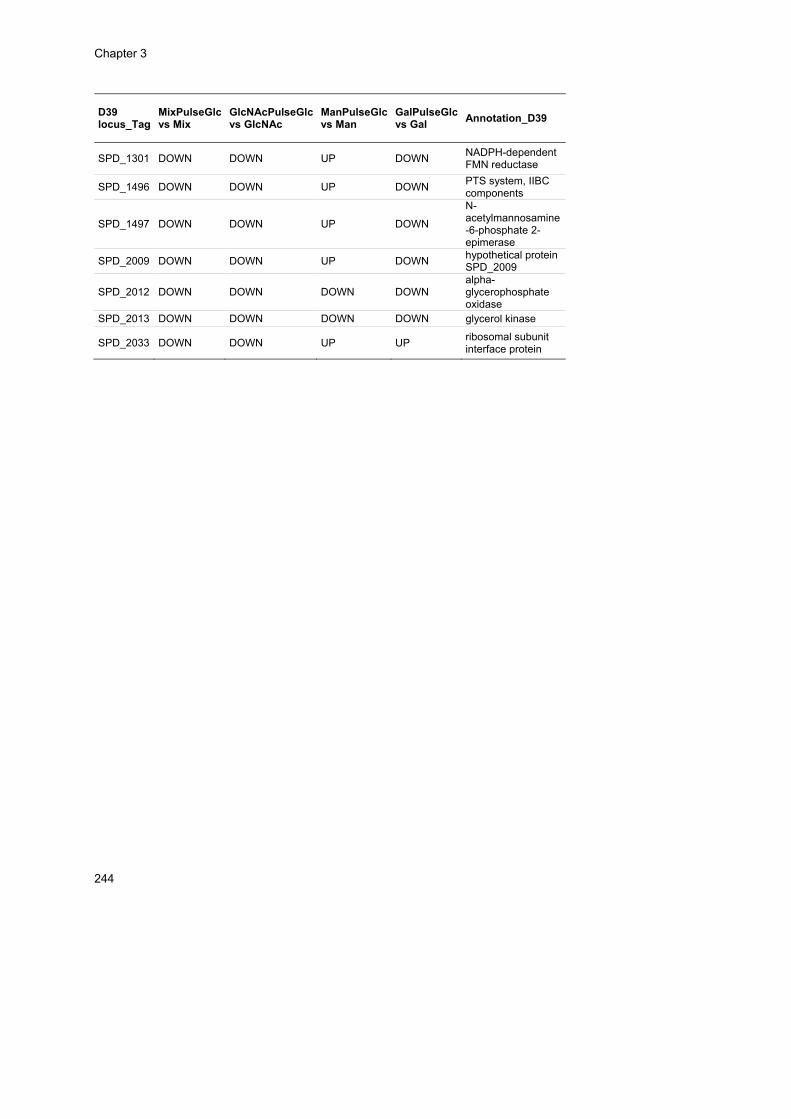
Chapter 3
244
D39 locus_Tag
MixPulseGlc vs Mix
GlcNAcPulseGlc vs GlcNAc
ManPulseGlc vs Man
GalPulseGlc vs Gal
Annotation_D39
SPD_1301 DOWN DOWN UP DOWN NADPH-dependent FMN reductase
SPD_1496 DOWN DOWN UP DOWN PTS system, IIBC components
SPD_1497 DOWN DOWN UP DOWN
N-acetylmannosamine-6-phosphate 2-epimerase
SPD_2009 DOWN DOWN UP DOWN hypothetical protein SPD_2009
SPD_2012 DOWN DOWN DOWN DOWN alpha-glycerophosphate oxidase
SPD_2013 DOWN DOWN DOWN DOWN glycerol kinase
SPD_2033 DOWN DOWN UP UP ribosomal subunit interface protein
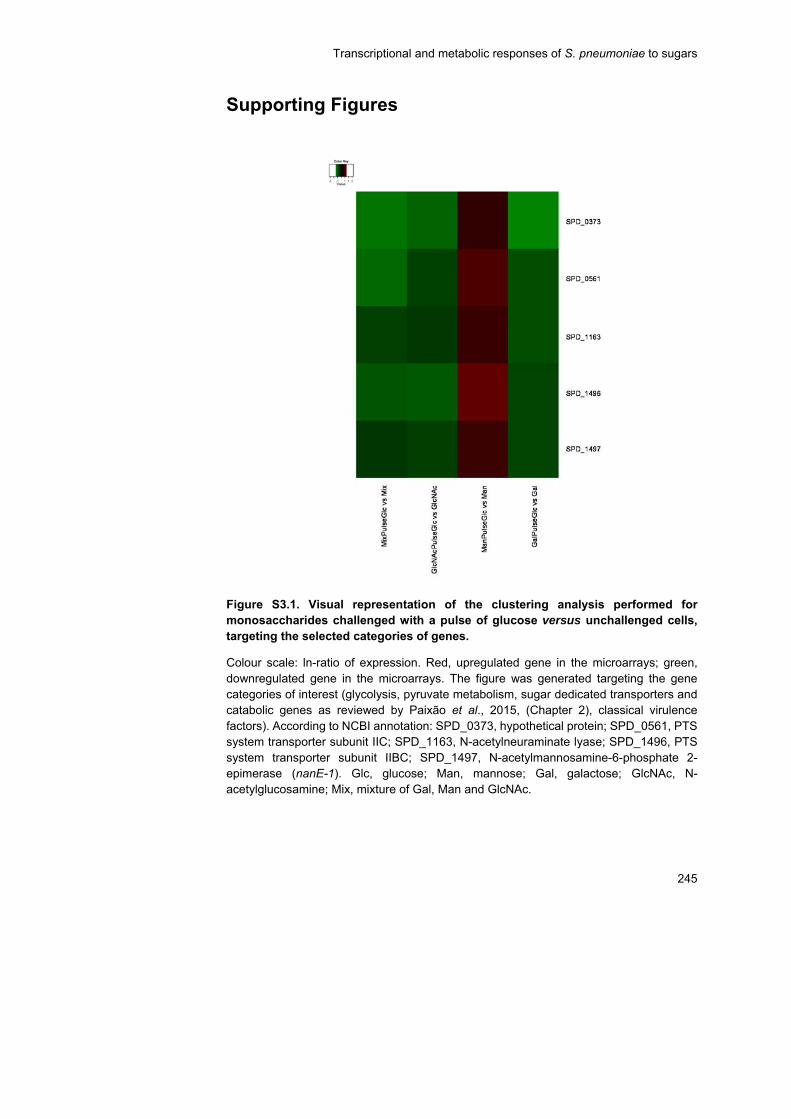
Transcriptional and metabolic responses of S. pneumoniae to sugars
245
Supporting Figures
Figure S3.1. Visual representation of the clustering analysis performed for monosaccharides challenged with a pulse of glucose versus unchallenged cells, targeting the selected categories of genes.
Colour scale: ln-ratio of expression. Red, upregulated gene in the microarrays; green, downregulated gene in the microarrays. The figure was generated targeting the gene categories of interest (glycolysis, pyruvate metabolism, sugar dedicated transporters and catabolic genes as reviewed by Paixão et al., 2015, (Chapter 2), classical virulence factors). According to NCBI annotation: SPD_0373, hypothetical protein; SPD_0561, PTS system transporter subunit IIC; SPD_1163, N-acetylneuraminate lyase; SPD_1496, PTS system transporter subunit IIBC; SPD_1497, N-acetylmannosamine-6-phosphate 2-epimerase (nanE-1). Glc, glucose; Man, mannose; Gal, galactose; GlcNAc, N-acetylglucosamine; Mix, mixture of Gal, Man and GlcNAc.
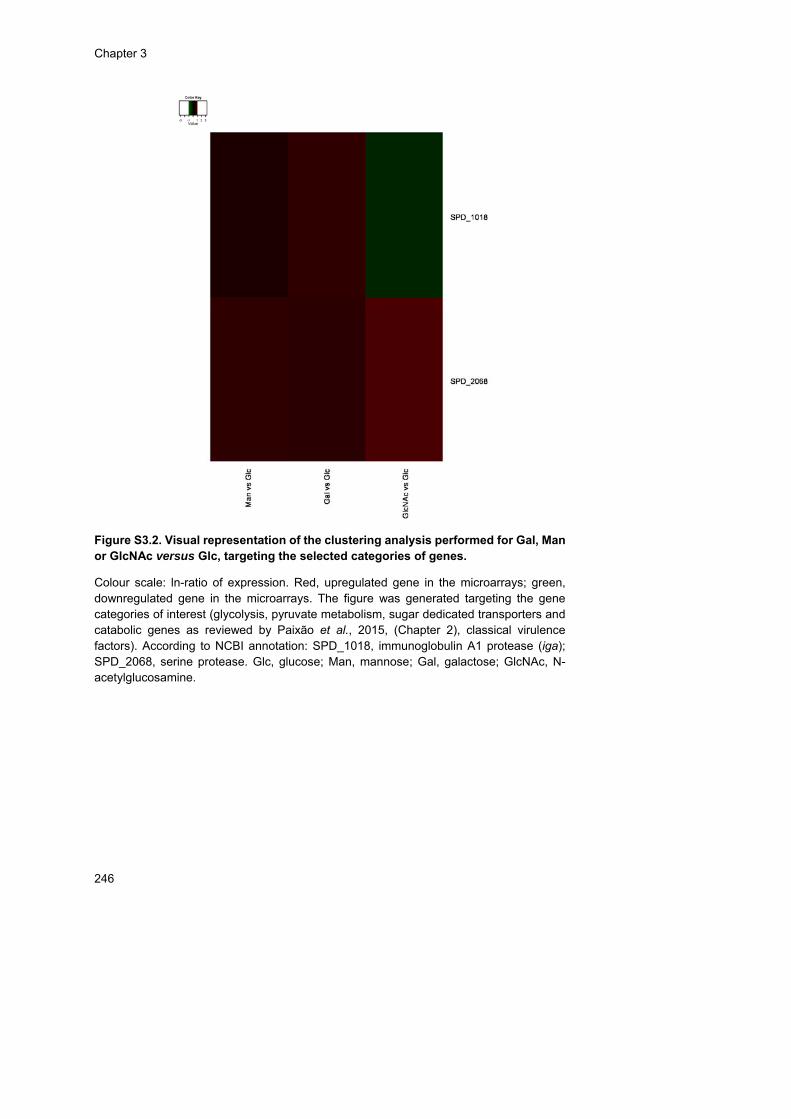
Chapter 3
246
Figure S3.2. Visual representation of the clustering analysis performed for Gal, Man or GlcNAc versus Glc, targeting the selected categories of genes.
Colour scale: ln-ratio of expression. Red, upregulated gene in the microarrays; green, downregulated gene in the microarrays. The figure was generated targeting the gene categories of interest (glycolysis, pyruvate metabolism, sugar dedicated transporters and catabolic genes as reviewed by Paixão et al., 2015, (Chapter 2), classical virulence factors). According to NCBI annotation: SPD_1018, immunoglobulin A1 protease (iga); SPD_2068, serine protease. Glc, glucose; Man, mannose; Gal, galactose; GlcNAc, N-acetylglucosamine.

247
Chapter 4
Overview and concluding remarks
Chapter 4 - Overview and concluding remarks


Overview and concluding remarks
249
Chapter 4 – Contents
Living on mucins and the particular case of the mucin-degrading S. pneumoniae ......................................................................................... 251
Monosaccharide nutrition in the pneumococcus .................................. 260
Carbohydrate regulation in S. pneumoniae ......................................... 265
Sugar metabolism and virulence .......................................................... 275
Concluding note ................................................................................... 279
References ........................................................................................... 280
Supporting Information ........................................................................ 287


Overview and concluding remarks
251
Streptococcus pneumoniae is a common asymptomatic commensal of
the nasopharynx. However, this bacterium is better known as a leading
cause of bacterial meningitis, pneumonia, septicaemia and otitis media.
The ever-increasing antibiotic resistance issues and the re-emergence of
non-type vaccine strains call for the identification of new targets for the
development of novel therapeutic and preventive drugs. Accumulating
evidence strengthens the view that pathogenesis and central metabolism
are profoundly interconnected, and thus the barrier between basic
pneumococcal physiology and virulence is now more diffuse. The focus
of this thesis was to deepen our understanding of carbon metabolism and
its regulation in S. pneumoniae. Carbon metabolism is central to the
physiology of this heterotroph bacterium, which relies on the efficient
acquisition of sugars for energy generation and production of catabolic
intermediates needed for biosynthesis. This work further contributed to
disclose interdependencies between carbohydrate metabolism and
S. pneumoniae virulence.
Living on mucins and the particular case of the
mucin-degrading S. pneumoniae
The highly hydrated mucus gel overlaying the epithelial surfaces of the
human body (e.g. respiratory, oral, gastrointestinal tracts) is a first line of
defence against invading microorganisms, impurities, chemical (toxins),
enzymatic and mechanical disruptions. Besides being a physical barrier it
is also a matrix rich in host antimicrobial molecules (e.g. lysozyme, IgA,
lactoferrin) [1]. The mucus major components are the high molecular
weight glycoprotein mucins, which are constituted by a protein core
heavily decorated with carbohydrate polymers of varied nature and size.
Chapter 4
252
The carbohydrates present in mucins provide alternative binding sites to
bacterial adhesins and, hence enable bacteria to thrive evading
interactions with the underlying epithelium [2]. For example, the ability of
the probiotic bacterium Lactobacillus rhamnosus GG to persist in the
human gut as recently been associated with the ability of a protein in the
pilli to bind host mucins [3]. Remarkably, mucins are also a valuable
nutritional reservoir of carbon and energy sources particularly important
in niches where free carbohydrates are limited, such as the nasopharynx
or micro niches in the gastrointestinal tract, enabling bacterial survival and
colonisation on these surfaces [2,4,5]. Mucins are heavily O-glycosylated
glycoproteins, generally composed of the monosaccharides N-
acetylgalactosamine (GalNAc), galactose (Gal), N-acetylneuraminic acid
(NeuNAc), N-acetylglucosamine (GlcNAc) and fucose (Fuc) [6,7], which
carbohydrate content can reach up to 80% of the mucin molecular mass
[2]. Bacteria have evolved strategies to circumvent the mucin barrier and
take advantage of this structure. Among others, those mechanisms
encompass production of mucin-degrading enzymes that release
carbohydrates from O- or N-linked oligosaccharide side chains
(glycosidases) and proteins (proteases) that destabilize the mucus gel
properties [1]. Thus, the ability to utilise mucin depends, to great extent,
on these activities.
The ability to degrade mucin is present in a number of members of the
human microbiota, and in particular of inhabitants of the nasal and oral
cavity, and the gastrointestinal tract. Interestingly, it was estimated that
only approximately 1% of the total human fecal microbiota was able to use
mucin [8]. Among these are organisms belonging to the genera
Bifidobacterium, Ruminococcus, Clostridium and Bacteroides [9,10] (for a
detailed overview see [2]). Recently, a new species isolated from the gut,
Akkermansia muciniphila, was shown to use mucin as sole carbon and
energy source [4]. Despite possessing a number of glycosidases [2], A.
Overview and concluding remarks
253
muciniphila only grows on a few monosaccharides (GalNAc, GlcNAc and
Glc) and it strictly requires a protein source; in such semi-defined
conditions the growth parameters are poorer than on mucin [4].
Accumulating evidence indicates that microbiota in general, such as the
non-mucin degrading intestinal bacteria E. coli, can benefit from sugars
derived from mucin-degrading organisms [9,11]. Furthermore, it has been
shown that the joint action of mucin-degrading organism increases mucin
degradation [12], which is likely to benefit all ecological partners.
Oral Streptococcus species are also able to use mucin (e.g. S. mitis,
S. sanguis, and S. milleri) [13]. In Streptococcus intermedius UNS35,
growth on mucin significantly increase the levels of several glycosidases
and induced the activity of Man and GlcNAc PTSs. The authors suggested
that these mechanisms may facilitate the persistence and growth of S.
intermedius in vivo [14]. In contrast, its ecological cohabitant
Streptococcus mutans is unable to use mucin as sole carbon and energy
source [13]. However, enhanced survival was observed upon addition of
mucin to sucrose-starved biofilms [15] or to a medium rich in amino acids
[16]. In the latter, an intact tagatose 6-phosphate (T6P) pathway was also
required for growth, suggesting that the mucin somehow provides a
source of Gal. Thus, one can speculate that S. mutans may benefit from
mucins once free carbohydrates become limited in the oral cavity. Of the
mucin sugar constituents, S. mutans is able to use Man, GlcNAc and Gal
as sole carbon sources [17–20].
The nasal cavity inhabitant S. pneumoniae possesses an incredible
array of extracellular glycosidases with different substrate specificities
(reviewed in [21]), which permits its growth on different glycoconjugates
such as N-linked glycans and glycosaminoglycans (hyaluronic acid)
[22,23]. Furthermore, S. pneumoniae is able to grow on mucin (O-linked
glycan) as sole carbon source [24]. This ability is strictly associated with
the expression of a number of glycosidases (Chapter 2), which act on the

Chapter 4
254
mucin releasing neuraminic acids (NeuNAc and N-glycolylneuraminic
acid), Gal and GalNAc, and to a less extent GlcNAc and Fuc [7]. Yesilkaya
and co-authors showed that growth on mucin is heavily dependent on
neuraminidase A (NanA) activity which releases the terminal N-
acetylneuraminic acid of the oligosaccharide side chains [24], as this
feature is seemingly essential for further breakdown of the carbohydrate
polymers by other glycosidases [7,25,26]. Curiously, nanA was not among
the differentially expressed genes on mucin as compared to Glc (Chapter
2). This finding leads us to propose that constitutive expression of nanA
is sufficient to ensure the release of NeuNAc terminal moieties.
Constitutive expression of glycosidase genes has been reported for
enteric bacteria [9]. This mechanism was hypothesized to confer a
selective advantage over organisms that do not express the glycosidases
constitutively in conditions where the substrates are limiting for growth.
We can speculate that the same holds true for S. pneumoniae, since it
exclusively relies on carbohydrates to grow, particularly hexoses that are
scarce in the airways.
In Chapter 2 of this thesis we identified Gal, Man and GlcNAc as the
monosaccharide constituents of porcine gastric mucin (model
glycoprotein) that can potentially sustain growth of S. pneumoniae strain
D39 in the host. Based on a transcriptome analysis comparing mucin vs.
Glc we singled out upregulated genes involved in the catabolism of
sugars, and combined this information with the growth-sustaining
monosaccharides identified in sugar phenotype assays containing
representative mucin carbohydrate moieties. Interestingly, Gal processing
genes represent the largest fraction of genes induced by mucin (Chapter
2), which emphasizes a cellular demand for Gal pathway functionality
during growth on mucin. This finding is in line with an earlier study showing
that upon pneumococcal growth the Gal content in porcine gastric mucin
was reduced by 30%. Of the sugars capable of supporting growth of strain
Overview and concluding remarks
255
D39, Gal suffered the largest decrease [7]. Thus, we propose that Gal is
the main mucin moiety used for growth of the bacterium in the
nasopharynx. Furthermore, Gal is a widespread sugar in glycoproteins.
We also observed induction of transporters specific for substrates in
which the bacterium is unable to grow (e.g. NeuNAc) (Chapter 2). Similar
observations have been reported for other organisms and S. pneumoniae
and are associated with non-metabolic roles for the incoming substrate
[11,27–29]. D39 has a frame shift mutation in the N-acetylneuraminate
lyase gene of nanAB operon [30,31], and we (and others) have related
this genotypic trait to its inability to grow on sialic acid. Recently, NeuNAc
was found to act as a signalling molecule in the pneumococcus, including
strain D39, that promotes increased colonisation, invasion of the host’s
lower respiratory tract and biofilm formation in vitro [32–34]. According to
Gualdi et al. [31], the D39’s inability to catabolise NeuNAc is not hindering
the regulation of the nanAB locus or the strain’s virulence. On the other
hand, upregulation of NeuNAc transporters on mucin suggests that the
amino sugar is still transported to exert exclusively regulatory functions or
that the transporters display specificity for other sugars as well. A detailed
biochemical characterization of each transporter to elucidate sugar
specificity should be carried out in the future. Previously, Bidossi et al.,
[30] demonstrated that the ABC transporters encoded in sialic acid operon
were also implicated in the uptake of ManNAc. This metabolite is the first
intermediate in the sialic acid pathway (Chapter 2, Fig. 2.1).
We and others have shown that S. pneumoniae has the genetic
potential, including glycosidases, transporters and catabolic pathways, for
the use of the glycan-constituent sugars Gal, Man, GlcNAc as sole carbon
sources (Chapter 2, [7,30,35,36]). However, experimental validation of the
catabolic pathways was missing. In this study, we ascertained at the
biochemical and genetic levels the in silico predictions (Fig. 4.1) for the
Chapter 4
256
Gal, Man and GlcNAc catabolic pathways in S. pneumoniae strain D39
(Chapter 2).
The phosphorylated intermediates mannose 6-phosphate (Man6P)
(Man pathway), N-acetylglucosamine 6-phosphate (GlcNAc6P) and
glucosamine 6-phosphate (GlcN6P) (GlcNAc pathway), and tagatose 1,6-
bisphosphate (TBP), galactose 6-phosphate (Gal6P) (T6P pathway for
Gal) and α-galactose 1-phosphate (α-Gal1P) and α-glucose 1-phosphate
(α-G1P) (Leloir pathway for Gal) were detected in ethanol extracts of
exponentially growing cells. Moreover, induction of the dedicated
enzymes of each pathway (ManA, NagA and NagB, GalK and LacD) was
observed in sugar-grown cells (Chapter 2). Interestingly, ManA and NagB
activities were also detected in Glc-grown cells, while the activities of GalK
and LacD were only measured in Gal-grown cells. Constitutive expression
of manA and nagA probably reflects the involvement of their functions in
processes of cellular biosynthesis (Fig. 4.1).
The combined biochemical data (phosphorylated intermediates and
enzyme activities) (Chapter 2) and the increased transcript levels of Leloir
and T6P pathway specific genes (galK, galT-2, galE-1, galM and lacBCD
on Gal-grown cells (Chapter 3); lacABD and galM on mucin (Chapter 2))
prove without doubt the simultaneous activity of both Gal pathways in S.
pneumoniae (Fig. 4.1) [35]. Even though this behaviour is seemingly
energetically costly, it is not a unique feature of the pneumococcus. S.
mutans, Streptococcus oligofermentans, Streptococcus gordonii and
Lactococcus lactis also possess both pathways and simultaneous activity
has been demonstrated [18,37–39]. While in the oral Streptococcus the
T6P pathways is apparently the preponderant route for Gal catabolism
[18,37,38], in the dairy bacterium L. lactis this feature is strain dependent
[39]. The assessment of the relative contribution of each pathway is not
trivial and requires flux partitioning determination, using advanced
labelling techniques coupled to mass spectrometry and/or nuclear
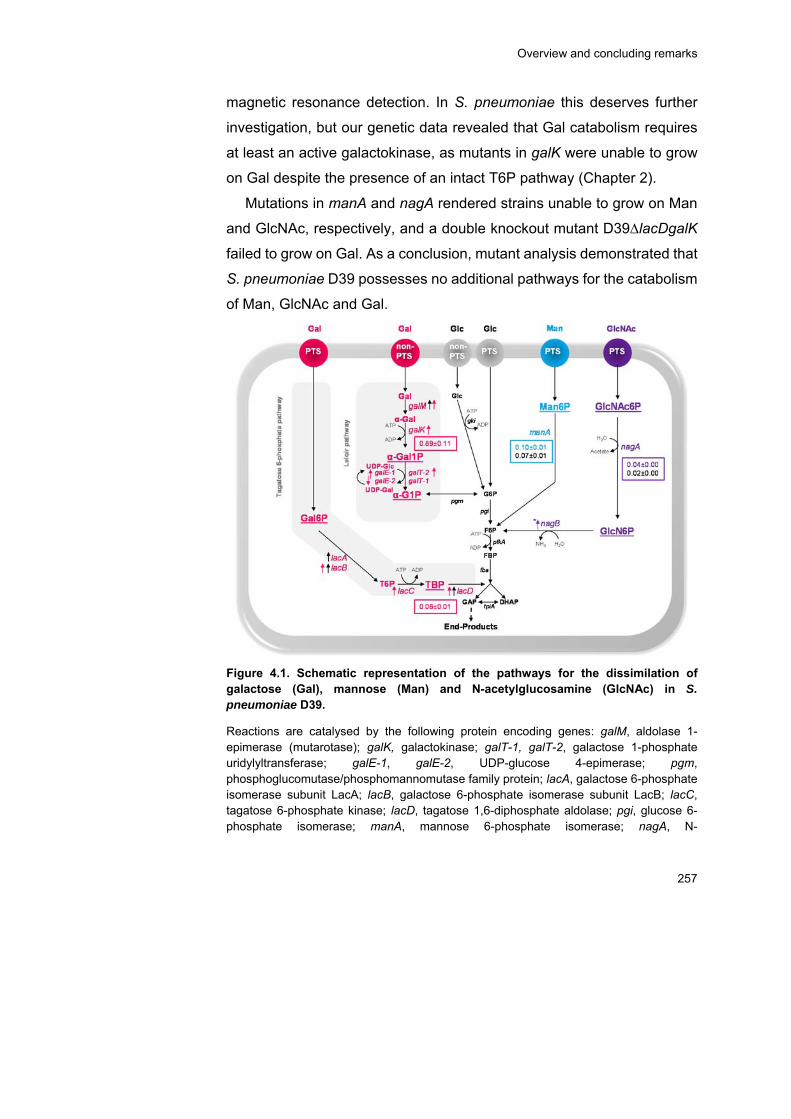
Overview and concluding remarks
257
magnetic resonance detection. In S. pneumoniae this deserves further
investigation, but our genetic data revealed that Gal catabolism requires
at least an active galactokinase, as mutants in galK were unable to grow
on Gal despite the presence of an intact T6P pathway (Chapter 2).
Mutations in manA and nagA rendered strains unable to grow on Man
and GlcNAc, respectively, and a double knockout mutant D39∆lacDgalK
failed to grow on Gal. As a conclusion, mutant analysis demonstrated that
S. pneumoniae D39 possesses no additional pathways for the catabolism
of Man, GlcNAc and Gal.
Figure 4.1. Schematic representation of the pathways for the dissimilation of galactose (Gal), mannose (Man) and N-acetylglucosamine (GlcNAc) in S. pneumoniae D39.
Reactions are catalysed by the following protein encoding genes: galM, aldolase 1-epimerase (mutarotase); galK, galactokinase; galT-1, galT-2, galactose 1-phosphate uridylyltransferase; galE-1, galE-2, UDP-glucose 4-epimerase; pgm, phosphoglucomutase/phosphomannomutase family protein; lacA, galactose 6-phosphate isomerase subunit LacA; lacB, galactose 6-phosphate isomerase subunit LacB; lacC, tagatose 6-phosphate kinase; lacD, tagatose 1,6-diphosphate aldolase; pgi, glucose 6-phosphate isomerase; manA, mannose 6-phosphate isomerase; nagA, N-

Chapter 4
258
acetylglucosamine 6-phosphate deacetylase; nagB, glucosamine 6-phosphate isomerase; gki, glucokinase; pgi, glucose 6-phosphate isomerase; pfkA, 6-phosphofructokinase; fba, fructose-biphosphate aldolase; tpiA, triosephosphate isomerase. The lower glycolytic pathway is represented by a dashed arrow. Intermediates: Gal, galactose; α-Gal, α-galactose; α-Gal1P, α-galactose 1-phosphate; α-G1P, α-glucose 1-phosphate; UDP-Glc, UDP-glucose; UDP-Gal, UDP-galactose; Gal6P, galactose 6-phosphate; T6P, tagatose 6-phosphate; TBP, tagatose 1,6-diphosphate; Man6P, mannose 6-phosphate; GlcNAc6P, N-acetylglucosamine 6-phosphate; GlcN6P, glucosamine 6-phosphate; Glc, glucose; G6P, glucose 6-phosphate; F6P, fructose 6-phosphate; FBP, fructose 1,6-biphosphate; GAP, glyceraldehyde 3-phosphate; DHAP, dihydroxyacetone phosphate. Underlined intermediates represent the sugar-specific pathway intermediates determined in ethanol extracts of cells grown in the glycan-derived sugar. Values are the specific activities (U mgprotein-1) measured in glycan-derived sugar or in Glc-grown cells (black). Black arrows indicate differential expression in mucin-grown cells as compared to Glc-grown cells. Coloured arrows indicate differential expression in the glycan-derived sugar as compared to Glc. The direction of the arrow indicates upregulation (up) or downregulation (down). *Using a less restrictive criterion for microarrays analysis. For the sake of simplicity the identity of putative transporters is not depicted in the figure.
Man, Gal and GlcNAc catabolic pathways are present and conserved
among pneumococcal genomes (Tables S2.8 and S4.1), however events
like single nucleotide polymorphisms that result in loss of activity cannot
be excluded. A good example is provided by the inability of strain D39 to
catabolise NeuNAc. Thus, while the high conservation of the pathways
provides a measure of their physiological relevance, pathway activity
needs to be confirmed in different pneumococcal serotypes.
The first step in sugar catabolism is transport across the cell envelope.
The focus of this work was the intracellular metabolism, but our data, and
in particular the expression data (Chapter 2 and 3) provide important
information for the identification of sugar transporters. However, in most
cases biochemical characterization is recommended to firmly ascertain
substrate specificity.
Metabolism through the Leloir is usually associated with the entry of
Gal via non-PTSs (secondary carriers or ABC). Indeed, Bidossi et al. [30]
designated Gal uptake to a CUT1 family ABC transporter but further
Overview and concluding remarks
259
experimentation is needed since a loss of function mutant displayed only
mild reduction of the Gal phenotype [30] and our expression data revealed
downregulation of the encoding genes on Gal (Chapter 3). Nevertheless,
the ability of ptsI mutants to grow on Gal ([30], and our own unpublished
data) further corroborates that S. pneumoniae internalizes Gal through
still unknown non-PTSs permeases.
On the other hand, accumulation of Gal6P in growing (Chapter 2) and
resting cells (Chapter 3) substantiates the entry of Gal through a PTS
system, which is a requisite for T6P pathway activity. The increased
expression levels of the galactitol-family PTS SPD_0559-0-1 on mucin
(Chapter 2) and on Gal-adapted cells (Chapter 3) further supports the
involvement of this system in Gal translocation [30,40]. This Gat-PTS has
homology to the high affinity galactose-specific PTS present in S.
gordonii, S. oligofermentans and S. mutans [37,38,41]. Regardless of the
transporter identity in S. pneumoniae, the affinity of this uptake system(s)
for Gal is low (Chapter 2).
S. mutans strain UA159 also lacks the high-affinity galactose-PTS,
which correlates with inefficient dissimilation of Gal via the T6P pathway.
Translocation of Gal in this strain occurs via the glucose–PTS permease
EIIMan (ManLMN) and the lactose-PTS permease EIILac (LacFE), but the
Gal-PTS activity is low [18]. In S. pneumoniae, Gal induced the expression
of other PTSs genes including lacE-2, a lactose-PTS known to internalize
Gal [35], and SPD_1057, a Gat-PTS also induced on mucin Chapter 2,
hence their contribution for Gal translocation cannot be ruled out.
Man and GlcNAc transporters were not found differentially positively
regulated in Man- and GlcNAc-grown cells, respectively (Chapter 3).
Whether this behaviour is due to wrong assignment of the protein
functions or that the genes encoding the uptake systems are constitutively
expressed remains to be elucidated. As a concluding note, the importance
of carbohydrates for the pneumococcal lifestyle is apparent form its
Chapter 4
260
genomic potential: S. pneumoniae possesses the highest number of
carbohydrate transporters, relative to its genome size, as compared to
other sequenced prokaryote genomes [42]. Induction of transporters,
other than the expected, reiterates the need for an in depth biochemical
characterization of sugar uptake systems in S. pneumoniae.
The ability of S. pneumoniae to use mucin as sole carbon source and
take advantage of mucin-constituent sugars reveals an evolutionary
adaptation of S. pneumoniae to life in the nasopharynx.
Monosaccharide nutrition in the pneumococcus
S. pneumoniae is a strictly fermentative bacterium and therefore relies
exclusively on carbohydrates to grow. In its natural habitat, the
nasopharynx, free sugars are in general scarce. This is particularly true
for the usually preferred carbohydrate of Gram-positive bacteria Glc,
which content is below 1 mM [43–45]. However, we have experimentally
proved that the pneumococcus has the catabolic pathways for the
molecular breakdown of the monosaccharides Gal, Man and GlcNAc
present in host glycoproteins, such as mucins (Chapter 2). Besides those
three sugars we have shown that S. pneumoniae D39 has the ability to
grow on GlcN as sole carbon source, but not on NeuNAc, GalNAc and
GalN (Chapter 2). The lack of growth on NeuNAc has been discussed
above, but the inability to use GalNAc and GalN was not investigated in
detail. GalNAc accounts for up to 15% of the molecular mass of porcine
gastric mucin, but is reduced by 35% in the mucin upon pneumococcal
growth [7]. Catabolism of GalNAc in bacteria comprises transport by a
PTS yielding N-acetylgalactosamine 6-phosphate (GalNAc6P),
conversion to galactosamine 6-phosphate (GalN6P) by GalNAc6P
Overview and concluding remarks
261
deacetylase, and finally isomerisation/deamination to T6P via GalN6P
isomerase (coded by agaS) [46,47]. Genes encoding homologues of the
GalNAc-PTS and agaS were in the genome sequence of D39,
respectively SPD_0293-5-6-7 and SPD_0070. However, the only gene
encoding an amino sugar deacetylase in D39 is nagA (GlcNAc
catabolism) and a peptidoglycan GlcNAc deacetylase. In E. coli and
Lactobacillus casei NagA can also catalyse the conversion of GalNAc6P
to GalN6P [46–48]. Whether the specificity range is different (narrower) in
S. pneumoniae or the inability to grow in GalNAc arises from a different
mechanism remains to be investigated. More interestingly is the lack of
growth on Fuc, despite the presence of a complete Fuc catabolic pathway
[28]. However, S. pneumoniae apparently lacks the enzymes required for
processing the terminal product of Fuc catabolism, L-lactaldehyde
(Chapter 2, [30]). The transporter in the Fuc operon, SPD_1989-0-1-2, is
selective for fucosylated-oligosaccharides which are then processed by
intracellular glycosidases releasing Fuc [28,49], but specific import of the
monosaccharide by other transporters cannot be excluded. The peculiar
inability to use Fuc despite the genomic capacity suggests a role of Fuc
on non-metabolic functions, such as virulence [50,51] or participation in a
sensing mechanism for fucosylated-compounds [28] (vide introduction for
a detailed description). Transport and intracellular hydrolysis of these
oligosaccharides can provide a nutritional competitive advantage in a
relatively monosaccharide poor environment, as the free sugars are
released in the bacterium cytoplasm.
In the general survey conducted by Bidossi et al. [30], 32 different
substrates, of which 8 were monosaccharides, were able to support
pneumococcal growth, but strain variance was also reported. In our study
a detailed characterization of growth on Gal, Man, GlcNAc and Glc is
provided (Chapter 2). In both studies Glc supported the fastest growth,
but differences on growth rates were observed for the other sugars
Chapter 4
262
(Chapter 2 vs. [30]) which might stem from the use of rather dissimilar
growth conditions or strain DP1004, a rough derivative of D39. Indeed,
previous work in our lab established difference in growth rate between
D39 and its rough derivative R6 growing in identical environmental
conditions [52]. We found the specific growth rate to be independent of
the initial substrate concentration for GlcNAc, Man and Glc. For Gal,
however, the growth rate was considerably reduced (1.5-fold) in the lower
sugar concentration and, in a sugar mixture, Gal was partially consumed
and only after depletion of GlcNAc and Man (Chapters 2 and 3). The
absence of a high affinity Gal transporter was evoked to explain these
observations.
The presence of the high affinity Gal transporter in some strains of the
cariogenic dental pathogen S. mutans and in the oral commensal S.
gordonii has been proposed to give a competitive advantage for efficient
use of Gal in ecological settings particularly in fasting periods [38,41]. In
S. mutans efficient Gal uptake permits the creation of an acid environment
detrimental for S. gordonii survival, whereas in S. gordonii efficient Gal
metabolism permits a more effective antagonism likely through H2O2
production which inhibits S. mutans growth [38,41]. In the latter case Gal
seems to promote a less cariogenic oral flora [38]. The absence of such
a transporter in S. pneumoniae can be a drawback for efficient Gal
metabolism in the host. Thus, it is tempting to speculate that in the
nasopharynx Gal concentration is a not a limiting factor, most likely due
to the activity of at least two pneumococcal galactosidases [7] or the
galactosidase activity of other bacteria in the same niche, combined with
Gal abundance in host glycoproteins. In support, Gal is one of the
carbohydrates profusely released from the mucins upon the action of S.
pneumoniae [7]. Moreover, despite being a less preferred sugar, the
ATPyield is higher in Gal-grown cells than in other carbohydrates, in line
with higher amounts of acetate produced (Chapter 2). Indeed, growth in
Overview and concluding remarks
263
non-preferential sugars (slow metabolizable carbon sources) is usually
associated with mixed acid fermentation profiles in several
Streptococcaceae [53,54]. In agreement, cells of S. pneumoniae D39
grown in Gal-containing medium, retrieved a pronounced shift towards a
mixed acid fermentation products (Chapter 2, [35]), which was attributed
to the activity of pyruvate formate lyase (PFL) and pyruvate formate-lyase
activating enzyme (PFL-AE) [36]. The metabolic enzyme PFL competes
with lactate dehydrogenase (LDH) for pyruvate. The concomitant
generation of one more molecule of ATP (via acetate kinase) is certainly
an advantage during the metabolism of slow metabolizable sugars.
Overall, our results support the general idea that in laboratorial conditions
Gal is a non-preferred substrate for bacterial proliferation [55], however in
complex and ever-changing natural habitats a multitude of factors can
skew the sugar preference palette to a primary use of Gal. Indeed,
attenuation in animal models of disease of S. pneumoniae mutants on the
galactose pathways provides strong evidence for the key role of Gal
catabolism by S. pneumoniae in its natural habitat (Chapter 2).
In this study, Glc is proven the preferred sugar of the pneumococcus,
as previously suggested by us and others [30,35]: i) glucose supports the
fastest growth rates of all monosaccharides tested (Chapter 2); ii) in sugar
mixtures, Glc is the first to be consumed (Chapter 3); iii) in pulse
experiments, Glc utilization starts immediately after the stimulus,
independently of the carbon source used for growth (Chapter 3). Since
Glc is an abundant substrate in the bloodstream and infection sites
[44,45], we hypothesize that the sugar is relevant in the development of
disease as it favours fast growth. In contrast, we can speculate that growth
on the non-preferential sugar Gal, abundant in the airway mucins, allows
the pneumococcus to thrive in the host as a commensal coloniser. In this
milieu poor in nutrients that can support fast growth, fast metabolic activity
Chapter 4
264
is likely deterred by other niche adaptation features required for
persistence.
The ability to co-metabolize sugars (e.g. Man and GlcNAc) (Chapter
2), the readiness to use Glc, and the smaller transcriptional response to
Glc in cells adapted to grow on a sugar mixture (Chapter 3) indicate a
relatively high metabolic flexibility of S. pneumoniae. Furthermore, the
diversity of transporters and the broad range of catabolic substrates, the
redundancy of the transport systems and of some catabolic pathways
encoded in pneumococcal genomes empower the microbe to survive in
varied conditions. This potential can present a fitness advantage in the
pneumococcal ecological niche (nasopharynx) as well as when it has to
cope with dramatic nutritional changes in the passage to invasive states.
Tuning of the catabolic capabilities to sugar availability is a dynamic
adaptive strategy that enables the pneumococcus to benefit from the
carbon sources available and compete with the colonisers in the host.
Indeed, efficient uptake and metabolism of sugars impacts the growth and
the relative proportions of the colonising species [19,38,41].
Interestingly, as compared to the other nasopharyngeal colonisers
Haemophilus influenzae and Neisseria meningitides, S. pneumoniae is
able to use a larger diversity of substrates, a feature likely endowing the
pneumococcus a competitive advantage. In this respect, S. pneumoniae
is more similar to oral and intestinal microbiota [56]. Accumulating
evidence sustains that the range of nutritional diversity is driven by niche
specific adaptations [56–58]. For example, S. thermophilus adapted for
growth in milk has a narrow substrate utilization capacity using lactose
and saccharose preferentially, whereas Glc and fructose support poorer
growth [59]. In contrast, the cariogenic microorganism S. mutans can
metabolize a vast array of carbohydrates most of them common dietary
sugars (e.g. glucose, fructose, maltose and sucrose) reflecting the nature
of its habitat [20,60]. Apparently S. pneumoniae seems more adapted to
Overview and concluding remarks
265
the nutritional environment in the nasopharynx than its counterparts H.
influenzae and N. meningitidis. A full explanation for this observation
cannot be put forward, but it is possible that S. pneumoniae may have
inhabited other richer niches, like the oral cavity, where free sugars from
host diet are available and thus acquired wide metabolic capabilities,
which were not lost through genome reduction events in S. pneumoniae.
Thus, the pneumococcal metabolic flexibility and redundancy in sugar
transporters and pathways might represent a strategy to survive in
environments with ever changing sugar availabilities.
Carbohydrate regulation in S. pneumoniae
Adaptation to changing host environments involves specific responses
to varied cues that result in changes in gene regulation and metabolism.
The pneumococcal response to carbohydrates was evaluated in this
study.
Gal gene clusters are differently organized among LAB and regulatory
mechanisms are variable and species-specific [61]. In S. pneumoniae, the
Leloir genes are widespread in the chromosome whereas the T6P
pathway genes are organized in two operons (Chapter 2, [62]). In our
work, analysis of mutants in Gal catabolic pathways unravelled a subtle
“regulatory” link between the Leloir and the tagatose 6-phosphate
pathways (Chapter 2). We unexpectedly found that a galK pneumococcal
mutant was unable to grow on Gal, despite possessing a complete T6P
pathway. On the other hand, lacD deficient strain was able to grow on Gal
after a prolonged lag phase (Chapter 2). The latter phenotype could be
explained by alleviation of the repression mediated by the transcriptional
regulator carbon catabolite protein A (CcpA) over the Leloir genes prior to
Chapter 4
266
the functional expression of the pathway [35], and/or induction of a non-
PTS system for Gal uptake. This hypothesis is substantiated by our own
data showing nil GalK (and LacD) activity during growth on Glc (Chapter
2). Gal-mediated induction of Gal permeases has been reported for L.
lactis [39].
The peculiar phenotype of the galK mutant is not easily explainable. A
polar effect on the galT-2 gene downstream of galK, resulting in the
unintentional elimination of Gal1P uridylyltransferase activity, could lead
to severe growth defects. However, growth on Glc was not affected by the
galK mutation and complementation in trans with galT-2 did not restore
growth on Gal. A galK mutant of S. mutans strain UA159 displayed a
similar phenotype [63]. In common, S. pneumoniae and S. mutans strain
UA159 lack a high-affinity PTS for Gal. Even though the absence of a
high-affinity PTS is expected to limit the pathway capacity, a complete
blockage is unlikely. Furthermore, PTS-mediated transport of Gal occurs
in S. pneumoniae D39, since Gal6P has been detected in extracts of cells
metabolizing Gal as well as in resting cells by in vivo 13C-NMR (Chapter
2, Chapter 3, [35]). In summary, in S. pneumoniae Gal catabolism requires
a functional galactokinase and we suggest that Gal1P acts as an inducer
of the expression of Gal catabolic genes (Chapter 2).
GalR has been reported as a transcriptional regulator of the Leloir
pathway in other streptococci [64–66]. In S. pneumoniae it is responsive
to carbohydrates (induced in Gal and repressed upon the Glc pulse) but
its involvement in Gal regulation still needs to be addressed (Chapter 3).
Recently, LacR was shown to be a repressor of the T6P pathway in Glc
[62]. Firm identification of the molecular mechanisms underlying the
coordination of Leloir and T6P pathways in the pneumococcus certainly
deserves further investigation.
This work provides, for the first time, an integrated approach of the
pneumococcal response to carbohydrate availability at different regulatory

Overview and concluding remarks
267
layers, retrieving clues of possible metabolic constraints and hints on
regulatory layers. Our results demonstrate that the transcriptional,
metabolic and physiological responses to Gal, Man and GlcNAc are
sugar-dependent (Chapters 2 and 3).
In GlcNAc no significant differences were observed at the
transcriptional (glycolytic, fermentative and sugar-specific catabolic
genes) and metabolic levels in comparison to Glc-grown cells. The end-
products profile (lactate as main product) is in agreement with the
generalized view that the fermentation of fast metabolizable sugars is
homolactic. The underlying mechanism encompasses the accumulation
of high amounts of FBP, a known LDH activator (Chapter 3). The rate of
GlcNAc and Glc utilization in resting cells (anabolism uncoupled) was also
similar. In light of these results it surprising that the growth rates on
GlcNAc and Glc-grown are not identical, with Glc sustaining much faster
growth (Chapter 2). A clue to this phenotype is provided by the
accumulation of other phosphorylated metabolites in growing cells:
fructose 6-phosphate, N-acetylglucosamine 6-phosphate and
glucosamine 6-phosphate (Chapter 2). In particular, fructose 6-phosphate
accumulated substantially. The large accumulation of phosphorylated
metabolites in growing cells combined with the poorer performance of
GlcNAc in supporting growth, indicate a metabolic bottleneck in anabolic
processes.
In S. pneumoniae, likewise in S. mutans, differential regulation of nagB
and nagA was observed in GlcNAc-adapted cells (Chapter 3, [67]) (Fig.
4.2).
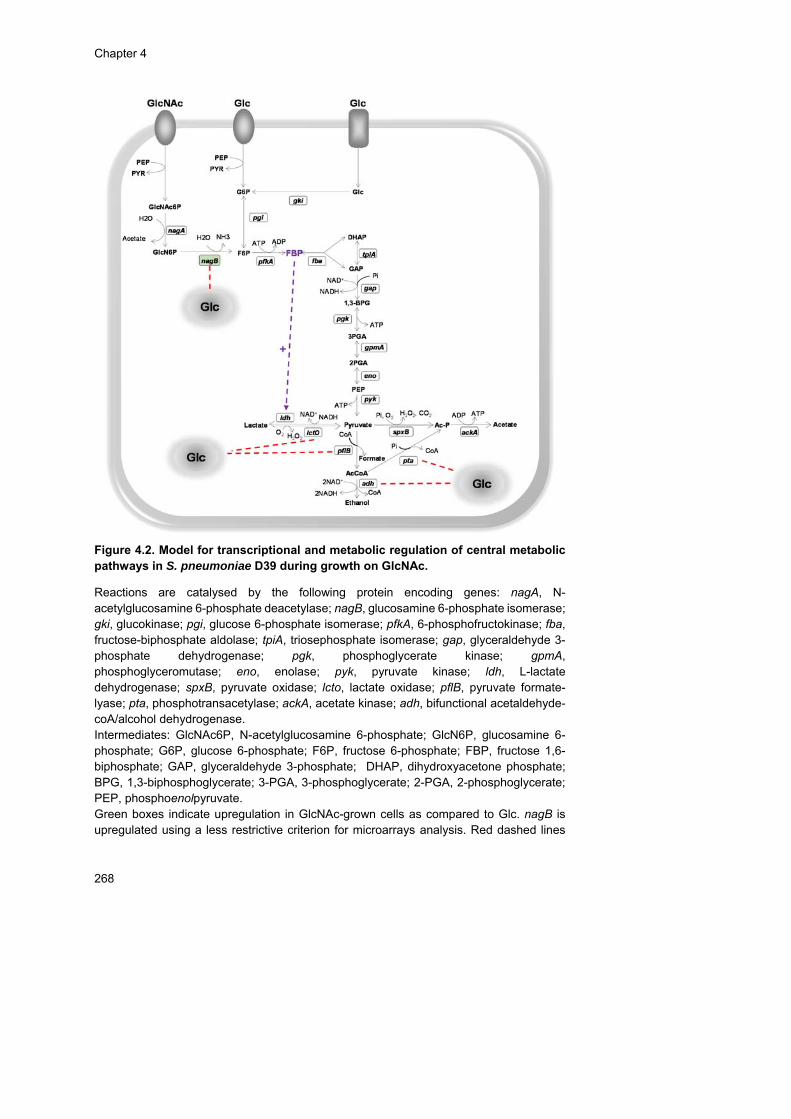
Chapter 4
268
Figure 4.2. Model for transcriptional and metabolic regulation of central metabolic pathways in S. pneumoniae D39 during growth on GlcNAc.
Reactions are catalysed by the following protein encoding genes: nagA, N-acetylglucosamine 6-phosphate deacetylase; nagB, glucosamine 6-phosphate isomerase; gki, glucokinase; pgi, glucose 6-phosphate isomerase; pfkA, 6-phosphofructokinase; fba, fructose-biphosphate aldolase; tpiA, triosephosphate isomerase; gap, glyceraldehyde 3-phosphate dehydrogenase; pgk, phosphoglycerate kinase; gpmA, phosphoglyceromutase; eno, enolase; pyk, pyruvate kinase; ldh, L-lactate dehydrogenase; spxB, pyruvate oxidase; lcto, lactate oxidase; pflB, pyruvate formate-lyase; pta, phosphotransacetylase; ackA, acetate kinase; adh, bifunctional acetaldehyde-coA/alcohol dehydrogenase. Intermediates: GlcNAc6P, N-acetylglucosamine 6-phosphate; GlcN6P, glucosamine 6-phosphate; G6P, glucose 6-phosphate; F6P, fructose 6-phosphate; FBP, fructose 1,6-biphosphate; GAP, glyceraldehyde 3-phosphate; DHAP, dihydroxyacetone phosphate; BPG, 1,3-biphosphoglycerate; 3-PGA, 3-phosphoglycerate; 2-PGA, 2-phosphoglycerate; PEP, phosphoenolpyruvate. Green boxes indicate upregulation in GlcNAc-grown cells as compared to Glc. nagB is upregulated using a less restrictive criterion for microarrays analysis. Red dashed lines
Overview and concluding remarks
269
represent transcriptional repression in presence of Glc. Purple dashed arrow represent metabolic regulation of enzymes. Highlighted in big bold purple font is the glycolytic intermediate accumulated in resting cells as determined by in vivo 13C-NMR.
It is well described that metabolism through non-preferential sugars
generates mixed-acid fermentation profiles. Gal catabolism in S.
pneumoniae was not the exception (Chapters 2 and 3, [35,36]). Results
from our laboratory showed that in S. pneumoniae, the fermentative
pathways are under the control of the transcriptional regulator CcpA [35].
CcpA activates ldh and represses pta, ackA, adh and pflB, hence
favouring homolactic fermentation, i.e., fast growth by ensuring the
efficient regeneration of reducing equivalents for glycolysis. However,
repression of mixed acid genes is counterbalanced by Gal activation [35],
suggesting other mechanisms in effect. In Chapter 3 we provide more
evidence for the transcriptional regulation of Gal catabolism, however this
type of regulation does not suffice to fully explain the observed
phenotypes. Indeed, the gene expression pattern (only pta is upregulated
in this study) does not fully correlate with the metabolic shift, which can
only be explained through metabolic modulation of enzyme activities
(Chapter 3).
The differences in gene expression profiles between this study and that
of Carvalho et al. [35] can derive from the dissimilar analysis of the
microarray data (criteria for significance and/or in silico comparative
transcriptome) or the use of a different D39 isolate. Indeed, phenotypic
differences between the two isolates are evident when comparing the
work in this thesis with previous data [35], of which different growth rates
and end-product profiles on Glc and Gal are obvious. This is not
surprising, as the sequences of two isolates of S. pneumoniae D39
showed a number of mutations, which could be correlated with phenotypic
traits of the isolates. For example, a mutation in the spxB in one of the
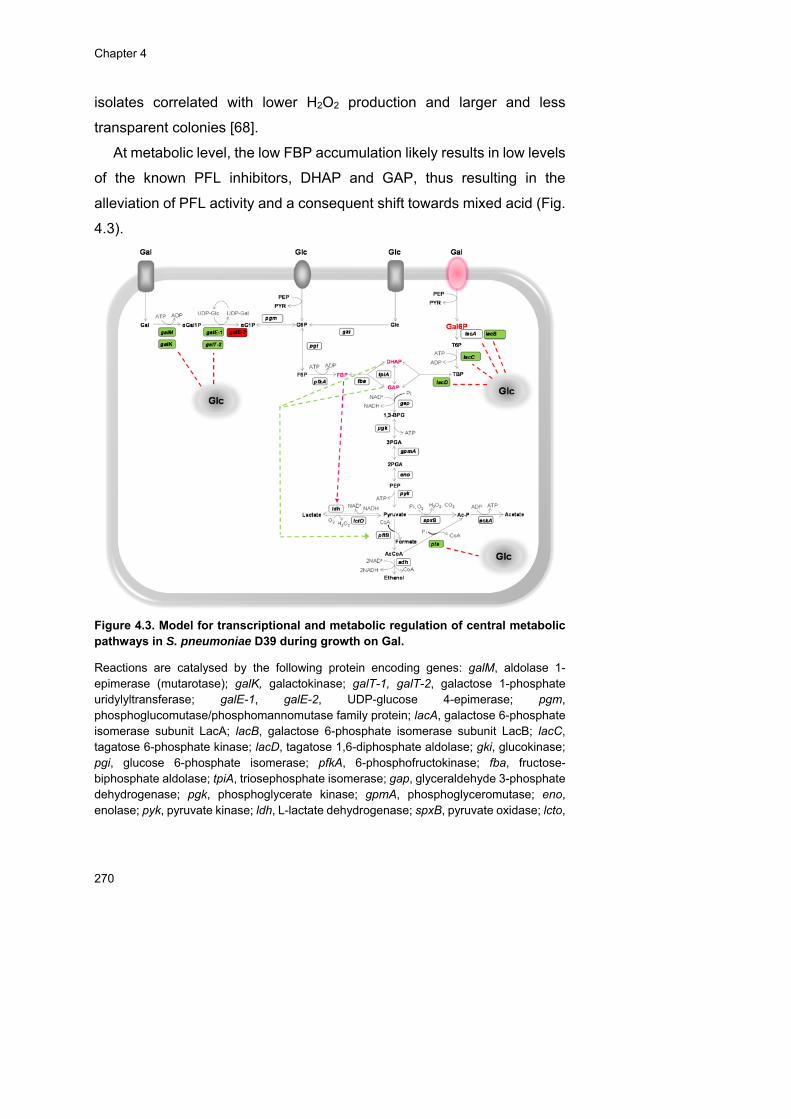
Chapter 4
270
isolates correlated with lower H2O2 production and larger and less
transparent colonies [68].
At metabolic level, the low FBP accumulation likely results in low levels
of the known PFL inhibitors, DHAP and GAP, thus resulting in the
alleviation of PFL activity and a consequent shift towards mixed acid (Fig.
4.3).
Figure 4.3. Model for transcriptional and metabolic regulation of central metabolic pathways in S. pneumoniae D39 during growth on Gal.
Reactions are catalysed by the following protein encoding genes: galM, aldolase 1-epimerase (mutarotase); galK, galactokinase; galT-1, galT-2, galactose 1-phosphate uridylyltransferase; galE-1, galE-2, UDP-glucose 4-epimerase; pgm, phosphoglucomutase/phosphomannomutase family protein; lacA, galactose 6-phosphate isomerase subunit LacA; lacB, galactose 6-phosphate isomerase subunit LacB; lacC, tagatose 6-phosphate kinase; lacD, tagatose 1,6-diphosphate aldolase; gki, glucokinase; pgi, glucose 6-phosphate isomerase; pfkA, 6-phosphofructokinase; fba, fructose-biphosphate aldolase; tpiA, triosephosphate isomerase; gap, glyceraldehyde 3-phosphate dehydrogenase; pgk, phosphoglycerate kinase; gpmA, phosphoglyceromutase; eno, enolase; pyk, pyruvate kinase; ldh, L-lactate dehydrogenase; spxB, pyruvate oxidase; lcto,
Overview and concluding remarks
271
lactate oxidase; pflB, pyruvate formate-lyase; pta, phosphotransacetylase; ackA, acetate kinase; adh, bifunctional acetaldehyde-coA/alcohol dehydrogenase. Intermediates: Gal, galactose; α-Gal, α-galactose; α-Gal1P, α-galactose 1-phosphate; α-G1P, α-glucose 1-phosphate; UDP-Glc, UDP-glucose; UDP-Gal, UDP-galactose; Gal6P, galactose 6-phosphate; T6P, tagatose 6-phosphate; TBP, tagatose 1,6-diphosphate; G6P, glucose 6-phosphate; F6P, fructose 6-phosphate; FBP, fructose 1,6-biphosphate; GAP, glyceraldehyde 3-phosphate; DHAP, dihydroxyacetone phosphate; BPG, 1,3-biphosphoglycerate; 3-PGA, 3-phosphoglycerate; 2-PGA, 2-phosphoglycerate; PEP, phosphoenolpyruvate. Green boxes indicate upregulation in Gal-grown cells as compared to Glc. Red box indicate downregulation in Gal-grown cells as compared to Glc. Red dashed lines represent transcriptional repression in presence of Glc. Pink transporter highlight a metabolic bottleneck in Gal catabolism. Highlighted in pink are the glycolytic and Gal-specific catabolic intermediates detected in resting cells by in vivo 13C-NMR. The size of the font is indicative of the pool size. Accumulation of DHAP and GAP are not detected in vivo but low accumulation as compared to Glc-grown cells is inferred due to the reversibility of the reactions catalysed by FBP aldolase and triose 3-phosphate isomerase. Pink dashed lines represent relief of LDH activation. Green dashed lines represent relief of PFL inhibition.
In S. pneumoniae, the two pathways for Gal catabolism are
transcriptionally regulated, with Gal acting as inducer and Glc inhibitor
(Chapter 3). Previously, the Leloir pathway was found to be regulated in
a CcpA-independent manner [35]. In the same study, the T6P pathway
was induced by CcpA, but CcpA-independent regulation of the pathway
has also been described [35,62]. The contribution of specific Gal
transcriptional regulators should be experimentally addressed to
understand these regulatory mechanisms. We show that expression of
transcriptional regulator galR was modulated by Gal and Glc, while LacR
was induced on Gal (Chapter 3). This regulator has been found to repress
the T6P pathway in the absence of Gal and lactose and presence of Glc
[62].
The inefficient Gal catabolism can be partially explained by the lack of
a high affinity Gal transporter, but the intense accumulation of Gal6P in
resting cells (as well as growing cells, only qualitative) suggests a
metabolic bottleneck during the Gal molecular breakdown (Chapters 2
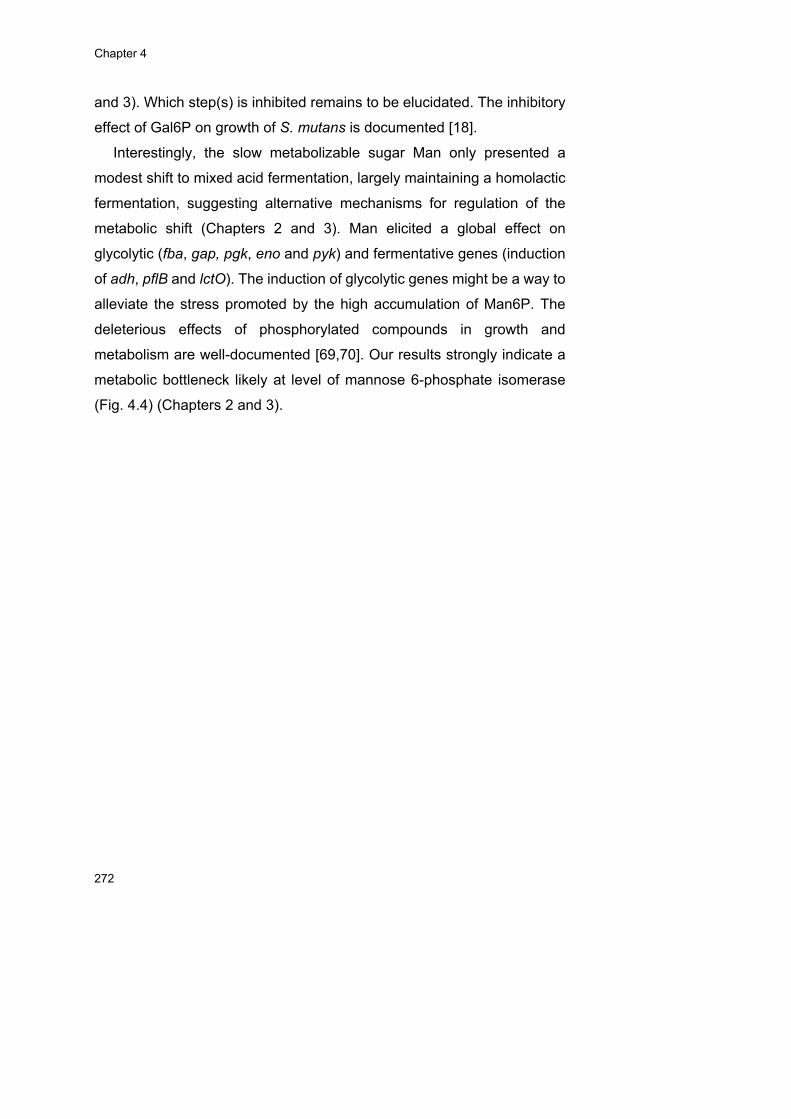
Chapter 4
272
and 3). Which step(s) is inhibited remains to be elucidated. The inhibitory
effect of Gal6P on growth of S. mutans is documented [18].
Interestingly, the slow metabolizable sugar Man only presented a
modest shift to mixed acid fermentation, largely maintaining a homolactic
fermentation, suggesting alternative mechanisms for regulation of the
metabolic shift (Chapters 2 and 3). Man elicited a global effect on
glycolytic (fba, gap, pgk, eno and pyk) and fermentative genes (induction
of adh, pflB and lctO). The induction of glycolytic genes might be a way to
alleviate the stress promoted by the high accumulation of Man6P. The
deleterious effects of phosphorylated compounds in growth and
metabolism are well-documented [69,70]. Our results strongly indicate a
metabolic bottleneck likely at level of mannose 6-phosphate isomerase
(Fig. 4.4) (Chapters 2 and 3).
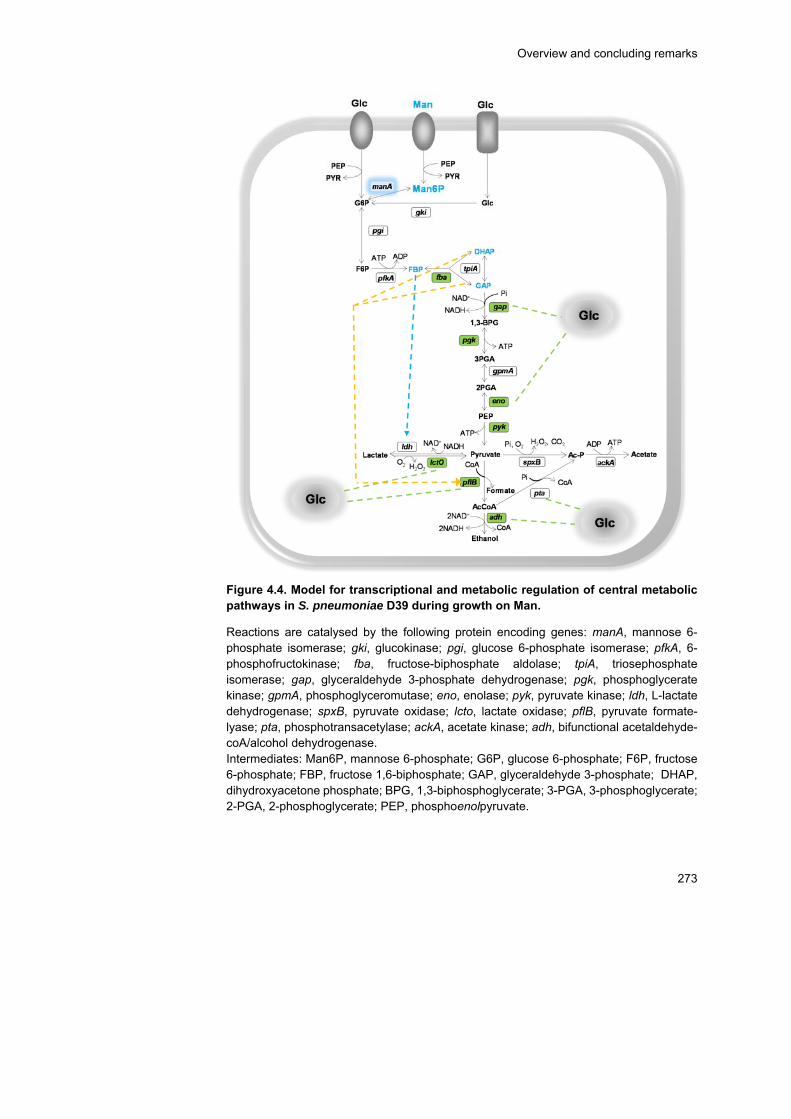
Overview and concluding remarks
273
Figure 4.4. Model for transcriptional and metabolic regulation of central metabolic pathways in S. pneumoniae D39 during growth on Man.
Reactions are catalysed by the following protein encoding genes: manA, mannose 6-phosphate isomerase; gki, glucokinase; pgi, glucose 6-phosphate isomerase; pfkA, 6-phosphofructokinase; fba, fructose-biphosphate aldolase; tpiA, triosephosphate isomerase; gap, glyceraldehyde 3-phosphate dehydrogenase; pgk, phosphoglycerate kinase; gpmA, phosphoglyceromutase; eno, enolase; pyk, pyruvate kinase; ldh, L-lactate dehydrogenase; spxB, pyruvate oxidase; lcto, lactate oxidase; pflB, pyruvate formate-lyase; pta, phosphotransacetylase; ackA, acetate kinase; adh, bifunctional acetaldehyde-coA/alcohol dehydrogenase. Intermediates: Man6P, mannose 6-phosphate; G6P, glucose 6-phosphate; F6P, fructose 6-phosphate; FBP, fructose 1,6-biphosphate; GAP, glyceraldehyde 3-phosphate; DHAP, dihydroxyacetone phosphate; BPG, 1,3-biphosphoglycerate; 3-PGA, 3-phosphoglycerate; 2-PGA, 2-phosphoglycerate; PEP, phosphoenolpyruvate.
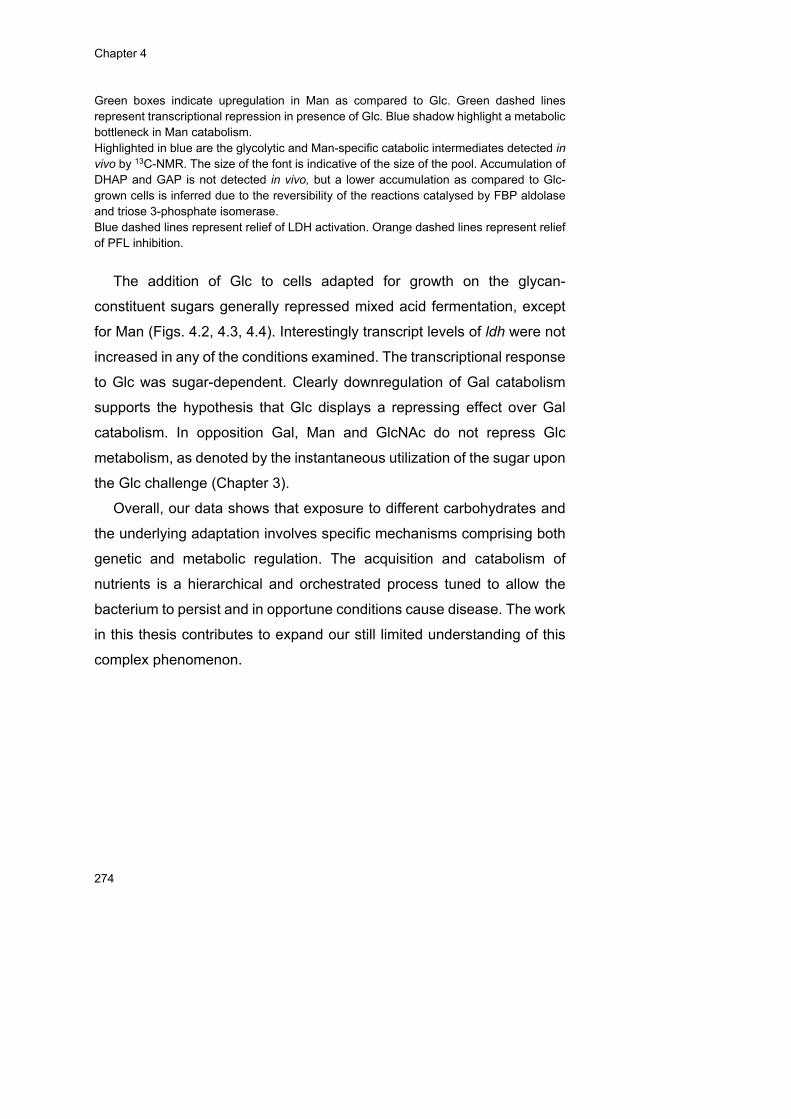
Chapter 4
274
Green boxes indicate upregulation in Man as compared to Glc. Green dashed lines represent transcriptional repression in presence of Glc. Blue shadow highlight a metabolic bottleneck in Man catabolism. Highlighted in blue are the glycolytic and Man-specific catabolic intermediates detected in vivo by 13C-NMR. The size of the font is indicative of the size of the pool. Accumulation of DHAP and GAP is not detected in vivo, but a lower accumulation as compared to Glc-grown cells is inferred due to the reversibility of the reactions catalysed by FBP aldolase and triose 3-phosphate isomerase. Blue dashed lines represent relief of LDH activation. Orange dashed lines represent relief of PFL inhibition.
The addition of Glc to cells adapted for growth on the glycan-
constituent sugars generally repressed mixed acid fermentation, except
for Man (Figs. 4.2, 4.3, 4.4). Interestingly transcript levels of ldh were not
increased in any of the conditions examined. The transcriptional response
to Glc was sugar-dependent. Clearly downregulation of Gal catabolism
supports the hypothesis that Glc displays a repressing effect over Gal
catabolism. In opposition Gal, Man and GlcNAc do not repress Glc
metabolism, as denoted by the instantaneous utilization of the sugar upon
the Glc challenge (Chapter 3).
Overall, our data shows that exposure to different carbohydrates and
the underlying adaptation involves specific mechanisms comprising both
genetic and metabolic regulation. The acquisition and catabolism of
nutrients is a hierarchical and orchestrated process tuned to allow the
bacterium to persist and in opportune conditions cause disease. The work
in this thesis contributes to expand our still limited understanding of this
complex phenomenon.

Overview and concluding remarks
275
Sugar metabolism and virulence
Growing evidence from studies on human bacterial pathogens
indicate that central carbon metabolism can dramatically impact the
pathogenic potential and emphasize the role of sugar acquisition and
catabolism on the in vivo fitness of the bacterium. Indeed, the expression
of sugar specific metabolic pathways is required for survival in different
niches by allowing the pneumococcus to exploit the available
carbohydrates, but a sugar stimulus also influences in a specific fashion
the virulence potential of the bacterium by modulating the expression of
genes encoding virulence factors.
In this work we found that Gal catabolism is of key importance for
pneumococcal growth in the nasopharynx and subsequent invasive
states. This conclusion stems out from our observations that mutants in
Gal catabolic genes, particularly D39∆lacD∆galK, showed attenuated
ability to colonise and reduced virulence following intranasal infection in
mouse models of colonisation and disease (bronchopneumonia with
bacteraemia) (Chapter 2). In contrast, mutans in Man (D39∆manA) or
GlcNAc (D39∆nagA) pathways, performed essentially as the wild-type
strain D39. The lack of any effect upon direct administration of mutant
strains in blood, indicates that Gal catabolism is key in the nasopharynx
but not in the blood. Gal catabolic genes represent the highest fraction of
genes induced by mucin (Chapter 2), an observation that is in agreement
with the hypothesis that Gal is the primary carbon source for S.
pneumoniae D39 in the nasal cavity. We suggested that deficient Gal
catabolism could impact the expression of virulence traits, such as
capsule. In an earlier study, Gal-grown cells were show to produce the
double amount of capsule as compared to Glc-grown, but whether it is the
capsule or other factor remains to be elucidated. Indeed, Gal induced well-

Chapter 4
276
established virulence genes (e.g. bgaA) as well as the new herein
proposed (lacD, galK) (Chapter 3).
Surprisingly, during this work we found that S. pneumoniae cultures
growing on Gal formed visible aggregates, which led us to inspect the
cells under the microscope. Unexpectedly, Gal-grown cells displayed a
different morphology as compared to Glc-grown cells. We went further
and used different molecular dyes to assess cell morphology under
fluorescence microscopy. Cells were grown in CDM supplemented with
Gal or Glc and samples were taken at mid-exponential and early
stationary phases of growth (Fig. 4.5). Interestingly, we observed that Gal-
grown cells have an elongated shape with sharp poles, and that this
phenotype becomes more pronounced at later stages of growth or under
lower Gal concentrations. Concomitantly, formation of chains is observed
(Fig. 4.5). We hypothesised that this morphological adaptation might
confer a strategic advantage for the pneumococcus to survive in the
nasopharynx, while benefiting from Gal residues of mucins. It was shown
that long pneumococcal chains are selected for stable colonisation by
enhancing adherence to epithelial cells. In opposition, short chains are
more likely to evade complement deposition (less complement activation)
and subsequent phagocytosis, and therefore may be selected to invade
the host, accounting for the diplococcal morphology in clinical samples
[71,72]. Rodriguez et al., [71] hypothesised that the environmental niche
provide a signal for long chain formation, thus enhancing adherence of
the pneumococcus. Here we propose that Gal, might be that signal.
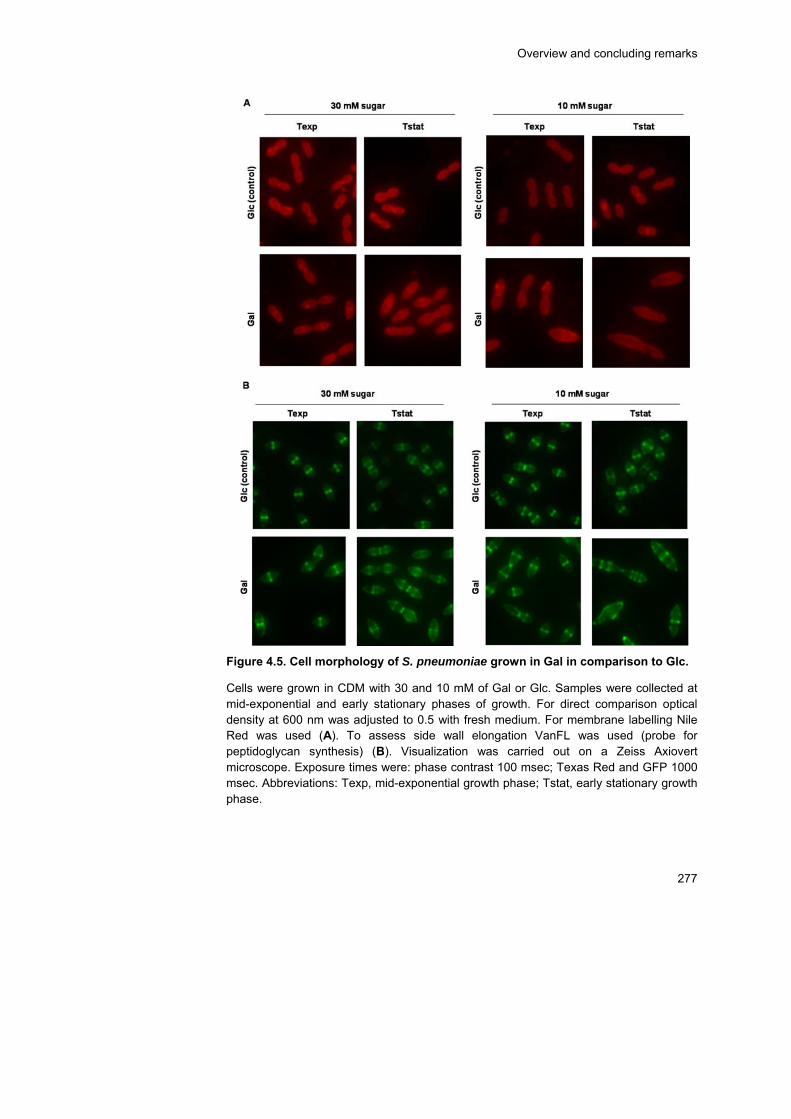
Overview and concluding remarks
277
Figure 4.5. Cell morphology of S. pneumoniae grown in Gal in comparison to Glc.
Cells were grown in CDM with 30 and 10 mM of Gal or Glc. Samples were collected at mid-exponential and early stationary phases of growth. For direct comparison optical density at 600 nm was adjusted to 0.5 with fresh medium. For membrane labelling Nile Red was used (A). To assess side wall elongation VanFL was used (probe for peptidoglycan synthesis) (B). Visualization was carried out on a Zeiss Axiovert microscope. Exposure times were: phase contrast 100 msec; Texas Red and GFP 1000 msec. Abbreviations: Texp, mid-exponential growth phase; Tstat, early stationary growth phase.
Chapter 4
278
We also observed that unlike Glc-grown cells, on Gal-grown cells the
nascent peptidoglycan was not only positioned at the division site in the
midcell (division septum) or at the constriction site between sister cells,
which will form the new cell poles once division is complete. In Gal
cultivations, several septa were observed and this effect was more
pronounced at the stationary phase of growth in cultures with lower Gal
concentration. These results suggest that peptidoglycan synthesis takes
place at multiple division sites along the elongated cell. A model for
sidewall elongation in which peptidoglycan insertion occurs
simultaneously at multiple Z-ring-associated sites was proposed for the
ovococci L. lactis. Moreover, filamentation resulted from septation
inhibition and the contribution of penicillin binding proteins PBP2x (septal
growth) and PBP2b (peripheral growth (elongation)) was described [73].
The biological role of filamentation in bacteria is wide (reviewed in [73]).
In particular, filamentation increases the total bacterial surface, and this
can be rationalized as a response to maximize nutritional uptake [74]. In
S. pneumoniae the elongated filamentous phenotype can be perceived as
a physiological advantage in the the nasopharynx milieu, where free
sugars are scarce. The altered shape of the pneumococcus in response
to carbohydrates is novel and certainly deserves future characterization.
A Glc stimulus during exponential growth of S. pneumoniae produced
sugar specific responses on expression of virulence genes. However, Glc
exerted mostly negative regulation over the known virulence genes (bgaA,
pflA, pflB, galK), suggesting that these factors are required for
colonisation, but not in disease states.
The profile and dynamics of gene expression presented in Chapter 3
highlight that the virulence potential of the pneumococcus is clearly
influenced by the carbon source either by modulation of catabolic
pathways and/or classical virulence factors.
Overview and concluding remarks
279
Concluding note
This work provides a valuable contribution to the comprehension of
carbohydrate metabolism in S. pneumoniae and its influence in
pneumococcal colonisation and disease. The challenging goals set out in
the beginning of this endeavour were at most achieved by a combined
approach comprising a detailed physiological characterization, metabolic
profiling, transcriptional profiling, mutant characterization, and virulence
studies in animal models of disease. The data generated at the different
“omic” layers has just begun to be analysed in the framework
mathematical representations. The multi-level data herein generated can
be used to fuel mathematical models of metabolism and regulation [75],
which are expected to predict factors essential during colonisation and
invasive states. The application of genome scale model to predict novel
drug targets for cancer therapies has been reported [76]. Thus, new
strategies could be followed aimed at developing therapeutics targeting
sugar catabolic pathways to fight pneumococcal disease. Collectively, our
data powerfully strengthens the link between physiology and
pathogenesis. Furthermore, our research paves the way for new lines of
investigation. Certainly the unexpected changes in S. pneumoniae cell
shape in response to Gal deserve future scrutiny. Questions such as “is
this response specific to Gal?”, “does the altered morphology impact the
ability to colonise and cause disease?, “what is the molecular
mechanism?” and “what is the physiological relevance?” should be
addressed in the future. We speculate that a meticulous and targeted
analysis of the transcriptome data will unveil some clues to initiate such
studies.
Also intriguing was the inability of a galK mutant to grow on Gal.
Considering the role of Gal catabolism in the ability to colonise and cause
disease we imagine that unravelling the molecular mechanism is of
Chapter 4
280
importance to further our understanding of carbon metabolism in the host.
Furthermore, the production of virulence factors, including capsule,
should be assessed in Gal-catabolic mutants. How the catabolic mutants
perform in mucin containing medium should also be examined and the
derived knowledge is expected to corroborate our findings in the animal
models.
Inspiration for future research in the field of pneumococcal physiology
and metabolism is provided by the many pointers deriving from our
transcriptome studies. For example, the genes SPD_0502 and celBCD
were induced by Glc in all the conditions tested, and hence a role on Glc
transport can be surmised. Experimental validation can be accomplished
by mutating these genes in a S. pneumoniae Glc/Man-PTS mutant. In fact,
the hypothesis that SPD_0502 and celBCD are involved in Glc uptake has
been tested in our laboratory, in a larger effort to unravel the complement
of Glc transporters in S. pneumoniae.
In conclusion, the data presented in this thesis extends considerably
our knowledge on S. pneumoniae basic physiology and on how
carbohydrate acquisition and metabolism influences the pathogenic
potential of the bacterium. Growing evidence supports a strong
intertwinement between central metabolism and virulence. Additionally,
this thesis raises new research questions that can advance our
understanding of the interactions between S. pneumoniae and its host.
References
1. Linden, S. K., McGuckin, M.A. Microbes at the host surface. Current research,
technology and education topics in applied microbiology and microbial biotechnology.

Overview and concluding remarks
281
A. Méndez-Vilas. Badajoz, Spain: Formatex Research Center; 2010. pp. 591–596. Available: http://www.formatex.org/microbiology2/index.html
2. Derrien M, van Passel MW, van de Bovenkamp JH, Schipper RG, de Vos WM, Dekker J. Mucin-bacterial interactions in the human oral cavity and digestive tract. Gut Microbes. 2010;1: 254–268. doi:10.4161/gmic.1.4.12778
3. Kankainen M, Paulin L, Tynkkynen S, von Ossowski I, Reunanen J, Partanen P, et al. Comparative genomic analysis of Lactobacillus rhamnosus GG reveals pili containing a human- mucus binding protein. Proc Natl Acad Sci U S A. 2009;106: 17193–17198. doi:10.1073/pnas.0908876106
4. Derrien M. Akkermansia muciniphila gen. nov., sp. nov., a human intestinal mucin-degrading bacterium. Int J Syst Evol Microbiol. 2004;54: 1469–1476. doi:10.1099/ijs.0.02873-0
5. Thornton DJ. From mucins to mucus: toward a more coherent understanding of this essential barrier. Proc Am Thorac Soc. 2004;1: 54–61. doi:10.1513/pats.2306016
6. Rose MC, Voynow JA. Respiratory tract mucin genes and mucin glycoproteins in health and disease. Physiol Rev. 2006;86: 245–278. doi:10.1152/physrev.00010.2005
7. Terra VS, Homer KA, Rao SG, Andrew PW, Yesilkaya H. Characterization of novel β-galactosidase activity that contributes to glycoprotein degradation and virulence in Streptococcus pneumoniae. Infect Immun. 2010;78: 348–357. doi:10.1128/IAI.00721-09
8. Miller RS, Hoskins LC. Mucin degradation in human colon ecosystems. Fecal population densities of mucin-degrading bacteria estimated by a “most probable number” method. Gastroenterology. 1981;81: 759–765.
9. Hoskins LC, Agustines M, McKee WB, Boulding ET, Kriaris M, Niedermeyer G. Mucin degradation in human colon ecosystems. Isolation and properties of fecal strains that degrade ABH blood group antigens and oligosaccharides from mucin glycoproteins. J Clin Invest. 1985;75: 944–953. doi:10.1172/JCI111795
10. Salyers AA, West SE, Vercellotti JR, Wilkins TD. Fermentation of mucins and plant polysaccharides by anaerobic bacteria from the human colon. Appl Environ Microbiol. 1977;34: 529–533.
11. Fabich AJ, Jones SA, Chowdhury FZ, Cernosek A, Anderson A, Smalley D, et al. Comparison of carbon nutrition for pathogenic and commensal Escherichia coli strains in the mouse intestine. Infect Immun. 2008;76: 1143–1152. doi:10.1128/IAI.01386-07
12. Willis CL, Cummings JH, Neale G, Gibson GR. In vitro effects of mucin fermentation on the growth of human colonic sulphate-reducing bacteria. Anaerobe. 1996;2: 117–122. doi:10.1006/anae.1996.0015
13. Van der Hoeven JS, van den Kieboom CW, Camp PJ. Utilization of mucin by oral Streptococcus species. Antonie Van Leeuwenhoek. 1990;57: 165–172.
14. Homer KA, Whiley RA, Beighton D. Production of specific glycosidase activities by Streptococcus intermedius strain UNS35 grown in the presence of mucin. J Med Microbiol. 1994;41: 184–190.
15. Renye JA, Piggot PJ, Daneo-Moore L, Buttaro BA. Persistence of Streptococcus mutans in stationary-phase batch cultures and biofilms. Appl Environ Microbiol. 2004;70: 6181–6187. doi:10.1128/AEM.70.10.6181-6187.2004
Chapter 4
282
16. Mothey D, Buttaro BA, Piggot PJ. Mucin can enhance growth, biofilm formation, and survival of Streptococcus mutans. FEMS Microbiol Lett. 2014;350: 161–167. doi:10.1111/1574-6968.12336
17. Abranches J, Chen Y-YM, Burne RA. Characterization of Streptococcus mutans strains deficient in EIIABMan of the sugar phosphotransferase system. Appl Environ Microbiol. 2003;69: 4760–4769. doi:10.1128/AEM.69.8.4760-4769.2003
18. Zeng L, Das S, Burne RA. Utilization of lactose and galactose by Streptococcus mutans: transport, toxicity, and carbon catabolite repression. J Bacteriol. 2010;192: 2434–2444. doi:10.1128/JB.01624-09
19. Homer KA, Patel R, Beighton D. Effects of N-acetylglucosamine on carbohydrate fermentation by Streptococcus mutans NCTC 10449 and Streptococcus sobrinus SL-1. Infect Immun. 1993;61: 295–302.
20. Ajdić D, McShan WM, McLaughlin RE, Savić G, Chang J, Carson MB, et al. Genome sequence of Streptococcus mutans UA159, a cariogenic dental pathogen. Proc Natl Acad Sci U S A. 2002;99: 14434–14439. doi:10.1073/pnas.172501299
21. King SJ. Pneumococcal modification of host sugars: a major contributor to colonization of the human airway? Mol Oral Microbiol. 2010;25: 15–24. doi:10.1111/j.2041-1014.2009.00564.x
22. Burnaugh AM, Frantz LJ, King SJ. Growth of Streptococcus pneumoniae on human glycoconjugates is dependent upon the sequential activity of bacterial exoglycosidases. J Bacteriol. 2008;190: 221–230. doi:10.1128/JB.01251-07
23. Marion C, Stewart JM, Tazi MF, Burnaugh AM, Linke CM, Woodiga SA, et al. Streptococcus pneumoniae can utilize multiple sources of hyaluronic acid for growth. Infect Immun. 2012;80: 1390–1398. doi:10.1128/IAI.05756-11
24. Yesilkaya H, Manco S, Kadioglu A, Terra VS, Andrew PW. The ability to utilize mucin affects the regulation of virulence gene expression in Streptococcus pneumoniae. FEMS Microbiol Lett. 2008;278: 231–235. doi:10.1111/j.1574-6968.2007.01003.x
25. Corfield AP, Wagner SA, Clamp JR, Kriaris MS, Hoskins LC. Mucin degradation in the human colon: production of sialidase, sialate O-acetylesterase, N-acetylneuraminate lyase, arylesterase, and glycosulfatase activities by strains of fecal bacteria. Infect Immun. 1992;60: 3971–3978.
26. King SJ, Hippe KR, Weiser JN. Deglycosylation of human glycoconjugates by the sequential activities of exoglycosidases expressed by Streptococcus pneumoniae. Mol Microbiol. 2006;59: 961–974. doi:10.1111/j.1365-2958.2005.04984.x
27. Liu M, Durfee T, Cabrera JE, Zhao K, Jin DJ, Blattner FR. Global transcriptional programs reveal a carbon source foraging strategy by Escherichia coli. J Biol Chem. 2005;280: 15921–15927. doi:10.1074/jbc.M414050200
28. Higgins MA, Suits MD, Marsters C, Boraston AB. Structural and functional analysis of fucose-processing enzymes from Streptococcus pneumoniae. J Mol Biol. 2014;426: 1469–1482. doi:10.1016/j.jmb.2013.12.006
29. Chan PF, O’Dwyer KM, Palmer LM, Ambrad JD, Ingraham KA, So C, et al. Characterization of a novel fucose-regulated promoter (PfcsK) suitable for gene essentiality and antibacterial mode-of-action studies in Streptococcus pneumoniae. J Bacteriol. 2003;185: 2051–2058. doi:10.1128/JB.185.6.2051-2058.2003
30. Bidossi A, Mulas L, Decorosi F, Colomba L, Ricci S, Pozzi G, et al. A functional genomics approach to establish the complement of carbohydrate transporters in
Overview and concluding remarks
283
Streptococcus pneumoniae. Miyaji EN, editor. PLoS ONE. 2012;7: e33320. doi:10.1371/journal.pone.0033320
31. Gualdi L, Hayre J, Gerlini A, Bidossi A, Colomba L, Trappetti C, et al. Regulation of neuraminidase expression in Streptococcus pneumoniae. BMC Microbiol. 2012;12: 200. doi:10.1186/1471-2180-12-200
32. Trappetti C, Kadioglu A, Carter M, Hayre J, Iannelli F, Pozzi G, et al. Sialic acid: a preventable signal for pneumococcal biofilm formation, colonization, and invasion of the host. J Infect Dis. 2009;199: 1497–1505. doi:10.1086/598483
33. Marion C, Burnaugh AM, Woodiga SA, King SJ. Sialic acid transport contributes to pneumococcal colonization. Infect Immun. 2011;79: 1262–1269. doi:10.1128/IAI.00832-10
34. Parker D, Soong G, Planet P, Brower J, Ratner AJ, Prince A. The NanA neuraminidase of Streptococcus pneumoniae is involved in biofilm formation. Infect Immun. 2009;77: 3722–3730. doi:10.1128/IAI.00228-09
35. Carvalho SM, Kloosterman TG, Kuipers OP, Neves AR. CcpA ensures optimal metabolic fitness of Streptococcus pneumoniae. Horsburgh MJ, editor. PLoS ONE. 2011;6: e26707. doi:10.1371/journal.pone.0026707
36. Yesilkaya H, Spissu F, Carvalho SM, Terra VS, Homer KA, Benisty R, et al. Pyruvate formate lyase is required for pneumococcal fermentative metabolism and virulence. Infect Immun. 2009;77: 5418–5427. doi:10.1128/IAI.00178-09
37. Cai J, Tong H, Qi F, Dong X. CcpA-dependent carbohydrate catabolite repression regulates galactose metabolism in Streptococcus oligofermentans. J Bacteriol. 2012;194: 3824–3832. doi:10.1128/JB.00156-12
38. Zeng L, Martino NC, Burne RA. Two gene clusters coordinate galactose and lactose metabolism in Streptococcus gordonii. Appl Env Microbiol. 2012;78: 5597–5605. doi:10.1128/AEM.01393-12
39. Neves AR, Pool WA, Solopova A, Kok J, Santos H, Kuipers OP. Towards enhanced galactose utilization by Lactococcus lactis. Appl Env Microbiol. 2010;76: 7048–7060. doi:10.1128/AEM.01195-10
40. Kaufman GE, Yother J. CcpA-dependent and -independent control of beta-galactosidase expression in Streptococcus pneumoniae occurs via regulation of an upstream phosphotransferase system-encoding operon. J Bacteriol. 2007;189: 5183–5192. doi:10.1128/JB.00449-07
41. Zeng L, Xue P, Stanhope MJ, Burne RA. A galactose-specific sugar: phosphotransferase permease is prevalent in the non-core genome of Streptococcus mutans. Mol Oral Microbiol. 2013;28: 292–301. doi:10.1111/omi.12025
42. Tettelin H, Nelson KE, Paulsen IT, Eisen JA, Read TD, Peterson S, et al. Complete genome sequence of a virulent isolate of Streptococcus pneumoniae. Science. 2001;293: 498–506. doi:10.1126/science.1061217
43. Görke B, Stülke J. Carbon catabolite repression in bacteria: many ways to make the most out of nutrients. Nat Rev Microbiol. 2008;6: 613–624. doi:10.1038/nrmicro1932
44. Shelburne SA, Davenport MT, Keith DB, Musser JM. The role of complex carbohydrate catabolism in the pathogenesis of invasive streptococci. Trends Microbiol. 2008;16: 318–325. doi:10.1016/j.tim.2008.04.002
45. Philips BJ, Meguer J-X, Redman J, Baker EH. Factors determining the appearance of glucose in upper and lower respiratory tract secretions. Intensive Care Med. 2003;29: 2204–2210. doi:10.1007/s00134-003-1961-2
Chapter 4
284
46. Hu Z, Patel IR, Mukherjee A. Genetic analysis of the roles of agaA, agaI, and agaS genes in the N-acetyl-D-galactosamine and D-galactosamine catabolic pathways in Escherichia coli strains O157:H7 and C. BMC Microbiol. 2013;13: 94. doi:10.1186/1471-2180-13-94
47. Leyn SA, Gao F, Yang C, Rodionov DA. N-Acetylgalactosamine utilization pathway and regulon in proteobacteria: genomic reconstruction and experimental characterization in Shewanella. J Biol Chem. 2012;287: 28047–28056. doi:10.1074/jbc.M112.382333
48. Bidart GN, Rodríguez-Díaz J, Monedero V, Yebra MJ. A unique gene cluster for the utilization of the mucosal and human milk-associated glycans galacto- N -biose and lacto- N -biose in L actobacillus casei: Galacto- and lacto- N -biose utilization in Lactobacillus. Mol Microbiol. 2014;93: 521–538. doi:10.1111/mmi.12678
49. Higgins MA, Whitworth GE, El Warry N, Randriantsoa M, Samain E, Burke RD, et al. Differential recognition and hydrolysis of host carbohydrate antigens by Streptococcus pneumoniae family 98 glycoside hydrolases. J Biol Chem. 2009;284: 26161–26173. doi:10.1074/jbc.M109.024067
50. Hava DL, Camilli A. Large-scale identification of serotype 4 Streptococcus pneumoniae virulence factors. Mol Microbiol. 2002;45: 1389–1406.
51. Embry A, Hinojosa E, Orihuela CJ. Regions of Diversity 8, 9 and 13 contribute to Streptococcus pneumoniae virulence. BMC Microbiol. 2007;7: 80. doi:10.1186/1471-2180-7-80
52. Carvalho SM, Kuipers OP, Neves AR. Environmental and nutritional factors that affect growth and metabolism of the pneumococcal serotype 2 strain D39 and its nonencapsulated derivative strain R6. Horsburgh MJ, editor. PLoS ONE. 2013;8: e58492. doi:10.1371/journal.pone.0058492
53. Thomas TD, Turner KW, Crow VL. Galactose fermentation by Streptococcus lactis and Streptococcus cremoris: pathways, products, and regulation. J Bacteriol. 1980;144: 672–682.
54. Garrigues C, Loubiere P, Lindley ND, Cocaign-Bousquet M. Control of the shift from homolactic acid to mixed-acid fermentation in Lactococcus lactis: predominant role of the NADH/NAD+ ratio. J Bacteriol. 1997;179: 5282–5287.
55. Deutscher J, Francke C, Postma PW. How phosphotransferase system-related protein phosphorylation regulates carbohydrate metabolism in bacteria. Microbiol Mol Biol Rev. 2006;70: 939–1031. doi:10.1128/MMBR.00024-06
56. Buckwalter CM, King SJ. Pneumococcal carbohydrate transport: food for thought. Trends Microbiol. 2012;20: 517–522. doi:10.1016/j.tim.2012.08.008
57. Rohmer L, Hocquet D, Miller SI. Are pathogenic bacteria just looking for food? Metabolism and microbial pathogenesis. Trends Microbiol. 2011;19: 341–348. doi:10.1016/j.tim.2011.04.003
58. Price CE, Zeyniyev A, Kuipers OP, Kok J. From meadows to milk to mucosa - adaptation of Streptococcus and Lactococcus species to their nutritional environments. FEMS Microbiol Rev. 2012; 36(5):949-71. doi:10.1111/j.1574-6976.2011.00323.x
59. Vaillancourt K, LeMay J-D, Lamoureux M, Frenette M, Moineau S, Vadeboncoeur C. Characterization of a galactokinase-positive recombinant strain of Streptococcus thermophilus. Appl Environ Microbiol. 2004;70: 4596–4603. doi:10.1128/AEM.70.8.4596-4603.2004
Overview and concluding remarks
285
60. Ajdic D, Pham VTT. Global transcriptional analysis of Streptococcus mutans sugar transporters using microarrays. J Bacteriol. 2007;189: 5049–5059. doi:10.1128/JB.00338-07
61. Grossiord B, Vaughan EE, Luesink E, de Vos WM. Genetics of galactose utilisation via the Leloir pathway in lactic acid bacteria. Le Lait. 1998;78: 77–84. doi:10.1051/lait:1998110
62. Afzal M, Shafeeq S, Kuipers OP. LacR is a repressor of lacABCD and LacT an activator of lacTFEG, constituting the lac-gene cluster in Streptococcus pneumoniae. Appl Environ Microbiol. 2014; doi:10.1128/AEM.01370-14
63. Abranches J, Chen Y-YM, Burne RA. Galactose metabolism by Streptococcus mutans. Appl Env Microbiol. 2004;70: 6047–6052. doi:10.1128/AEM.70.10.6047-6052.2004
64. De Vin F, Radstrom P, Herman L, De Vuyst L. Molecular and biochemical analysis of the galactose phenotype of dairy Streptococcus thermophilus strains reveals four different fermentation profiles. Appl Environ Microbiol. 2005;71: 3659–3667. doi:10.1128/AEM.71.7.3659-3667.2005
65. Vaillancourt K, Moineau S, Frenette M, Lessard C, Vadeboncoeur C. Galactose and lactose genes from the galactose-positive bacterium Streptococcus salivarius and the phylogenetically related galactose-negative bacterium Streptococcus thermophilus: organization, sequence, transcription, and activity of the gal gene products. J Bacteriol. 2002;184: 785–793. doi:10.1128/JB.184.3.785-793.2002
66. Ajdić D, Ferretti JJ. Transcriptional regulation of the Streptococcus mutans gal operon by the GalR repressor. J Bacteriol. 1998;180: 5727–5732.
67. Moye ZD, Burne RA, Zeng L. Uptake and metabolism of N-acetylglucosamine and glucosamine by Streptococcus mutans. Appl Env Microbiol. 2014; doi:10.1128/AEM.00820-14
68. Lanie JA, Ng W-L, Kazmierczak KM, Andrzejewski TM, Davidsen TM, Wayne KJ, et al. Genome sequence of Avery’s virulent serotype 2 strain D39 of Streptococcus pneumoniae and comparison with that of unencapsulated laboratory strain R6. J Bacteriol. 2007;189: 38–51. doi:10.1128/JB.01148-06
69. Andersen HW, Solem C, Hammer K, Jensen PR. Twofold reduction of phosphofructokinase activity in Lactococcus lactis results in strong decreases in growth rate and in glycolytic flux. J Bacteriol. 2001;183: 3458–3467. doi:10.1128/JB.183.11.3458-3467.2001
70. Vanderpool CK, Gottesman S. The novel transcription factor SgrR coordinates the response to glucose-phosphate stress. J Bacteriol. 2007;189: 2238–2248. doi:10.1128/JB.01689-06
71. Rodriguez JL, Dalia AB, Weiser JN. Increased chain length promotes pneumococcal adherence and colonization. Infect Immun. 2012;80: 3454–3459. doi:10.1128/IAI.00587-12
72. Dalia AB, Weiser JN. Minimization of bacterial size allows for complement evasion and is overcome by the agglutinating effect of antibody. Cell Host Microbe. 2011;10: 486–496. doi:10.1016/j.chom.2011.09.009
73. Pérez-Núñez D, Briandet R, David B, Gautier C, Renault P, Hallet B, et al. A new morphogenesis pathway in bacteria: unbalanced activity of cell wall synthesis machineries leads to coccus-to-rod transition and filamentation in ovococci:
Chapter 4
286
Filamentation of Lactococcus lactis. Mol Microbiol. 2011;79: 759–771. doi:10.1111/j.1365-2958.2010.07483.x
74. Young KD. The selective value of bacterial shape. Microbiol Mol Biol Rev MMBR. 2006;70: 660–703. doi:10.1128/MMBR.00001-06
75. Lerman JA, Hyduke DR, Latif H, Portnoy VA, Lewis NE, Orth JD, et al. In silico method for modelling metabolism and gene product expression at genome scale. Nat Commun. 2012;3: 929. doi:10.1038/ncomms1928
76. Ghaffari P, Mardinoglu A, Asplund A, Shoaie S, Kampf C, Uhlen M, et al. Identifying anti-growth factors for human cancer cell lines through genome-scale metabolic modeling. Sci Rep. 2015;5: 8183. doi:10.1038/srep08183

Overview and concluding remarks
287
Supporting Information_Chapter 4
Supporting Information

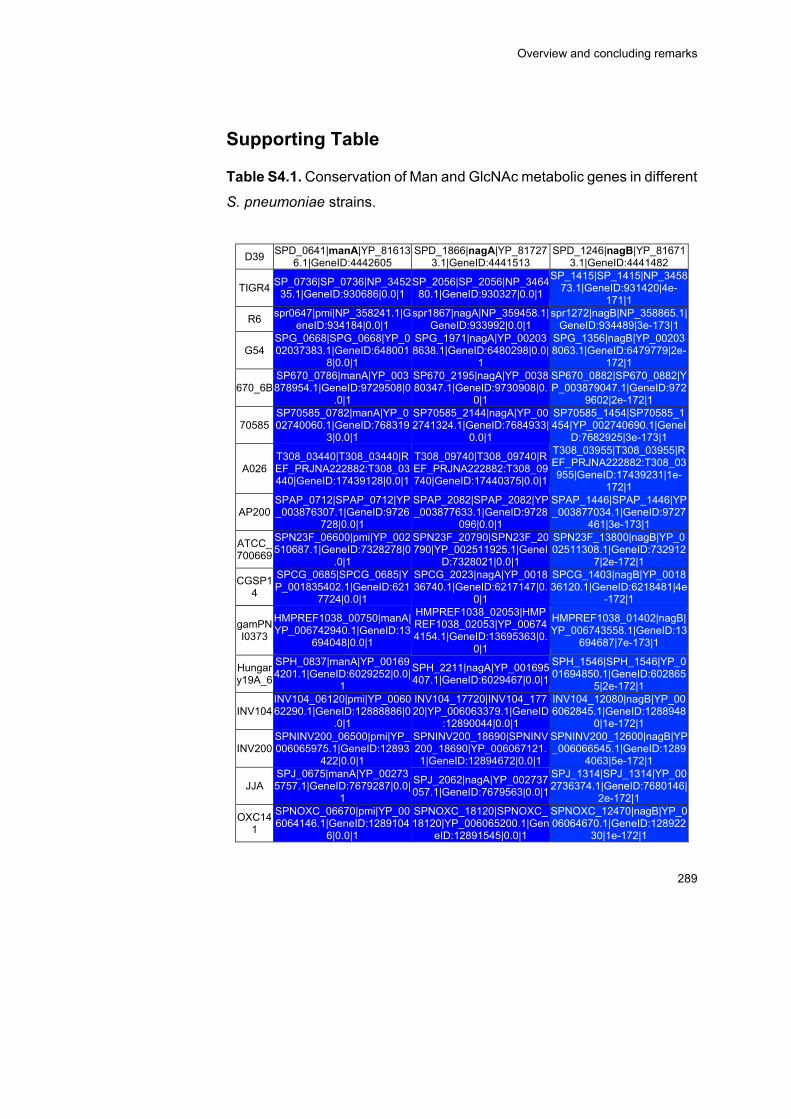
Overview and concluding remarks
289
Supporting Table
Table S4.1. Conservation of Man and GlcNAc metabolic genes in different
S. pneumoniae strains.
D39 SPD_0641|manA|YP_81613
6.1|GeneID:4442605 SPD_1866|nagA|YP_81727
3.1|GeneID:4441513 SPD_1246|nagB|YP_81671
3.1|GeneID:4441482
TIGR4 SP_0736|SP_0736|NP_3452
35.1|GeneID:930686|0.0|1 SP_2056|SP_2056|NP_3464
80.1|GeneID:930327|0.0|1
SP_1415|SP_1415|NP_345873.1|GeneID:931420|4e-
171|1
R6 spr0647|pmi|NP_358241.1|G
eneID:934184|0.0|1 spr1867|nagA|NP_359458.1|
GeneID:933992|0.0|1 spr1272|nagB|NP_358865.1|
GeneID:934489|3e-173|1
G54 SPG_0668|SPG_0668|YP_002037383.1|GeneID:648001
8|0.0|1
SPG_1971|nagA|YP_002038638.1|GeneID:6480298|0.0|
1
SPG_1356|nagB|YP_002038063.1|GeneID:6479779|2e-
172|1
670_6B SP670_0786|manA|YP_003878954.1|GeneID:9729508|0
.0|1
SP670_2195|nagA|YP_003880347.1|GeneID:9730908|0.
0|1
SP670_0882|SP670_0882|YP_003879047.1|GeneID:972
9602|2e-172|1
70585 SP70585_0782|manA|YP_002740060.1|GeneID:768319
3|0.0|1
SP70585_2144|nagA|YP_002741324.1|GeneID:7684933|
0.0|1
SP70585_1454|SP70585_1454|YP_002740690.1|GeneI
D:7682925|3e-173|1
A026 T308_03440|T308_03440|REF_PRJNA222882:T308_03440|GeneID:17439128|0.0|1
T308_09740|T308_09740|REF_PRJNA222882:T308_09740|GeneID:17440375|0.0|1
T308_03955|T308_03955|REF_PRJNA222882:T308_03955|GeneID:17439231|1e-
172|1
AP200 SPAP_0712|SPAP_0712|YP_003876307.1|GeneID:9726
728|0.0|1
SPAP_2082|SPAP_2082|YP_003877633.1|GeneID:9728
096|0.0|1
SPAP_1446|SPAP_1446|YP_003877034.1|GeneID:9727
461|3e-173|1
ATCC_700669
SPN23F_06600|pmi|YP_002510687.1|GeneID:7328278|0
.0|1
SPN23F_20790|SPN23F_20790|YP_002511925.1|GeneI
D:7328021|0.0|1
SPN23F_13800|nagB|YP_002511308.1|GeneID:732912
7|2e-172|1
CGSP14
SPCG_0685|SPCG_0685|YP_001835402.1|GeneID:621
7724|0.0|1
SPCG_2023|nagA|YP_001836740.1|GeneID:6217147|0.
0|1
SPCG_1403|nagB|YP_001836120.1|GeneID:6218481|4e
-172|1
gamPNI0373
HMPREF1038_00750|manA|YP_006742940.1|GeneID:13
694048|0.0|1
HMPREF1038_02053|HMPREF1038_02053|YP_006744154.1|GeneID:13695363|0.
0|1
HMPREF1038_01402|nagB|YP_006743558.1|GeneID:13
694687|7e-173|1
Hungary19A_6
SPH_0837|manA|YP_001694201.1|GeneID:6029252|0.0|
1
SPH_2211|nagA|YP_001695407.1|GeneID:6029467|0.0|1
SPH_1546|SPH_1546|YP_001694850.1|GeneID:602865
5|2e-172|1
INV104 INV104_06120|pmi|YP_006062290.1|GeneID:12888886|0
.0|1
INV104_17720|INV104_17720|YP_006063379.1|GeneID
:12890044|0.0|1
INV104_12080|nagB|YP_006062845.1|GeneID:1288948
0|1e-172|1
INV200 SPNINV200_06500|pmi|YP_006065975.1|GeneID:12893
422|0.0|1
SPNINV200_18690|SPNINV200_18690|YP_006067121.1|GeneID:12894672|0.0|1
SPNINV200_12600|nagB|YP_006066545.1|GeneID:1289
4063|5e-172|1
JJA SPJ_0675|manA|YP_002735757.1|GeneID:7679287|0.0|
1
SPJ_2062|nagA|YP_002737057.1|GeneID:7679563|0.0|1
SPJ_1314|SPJ_1314|YP_002736374.1|GeneID:7680146|
2e-172|1
OXC141
SPNOXC_06670|pmi|YP_006064146.1|GeneID:1289104
6|0.0|1
SPNOXC_18120|SPNOXC_18120|YP_006065200.1|Gen
eID:12891545|0.0|1
SPNOXC_12470|nagB|YP_006064670.1|GeneID:128922
30|1e-172|1
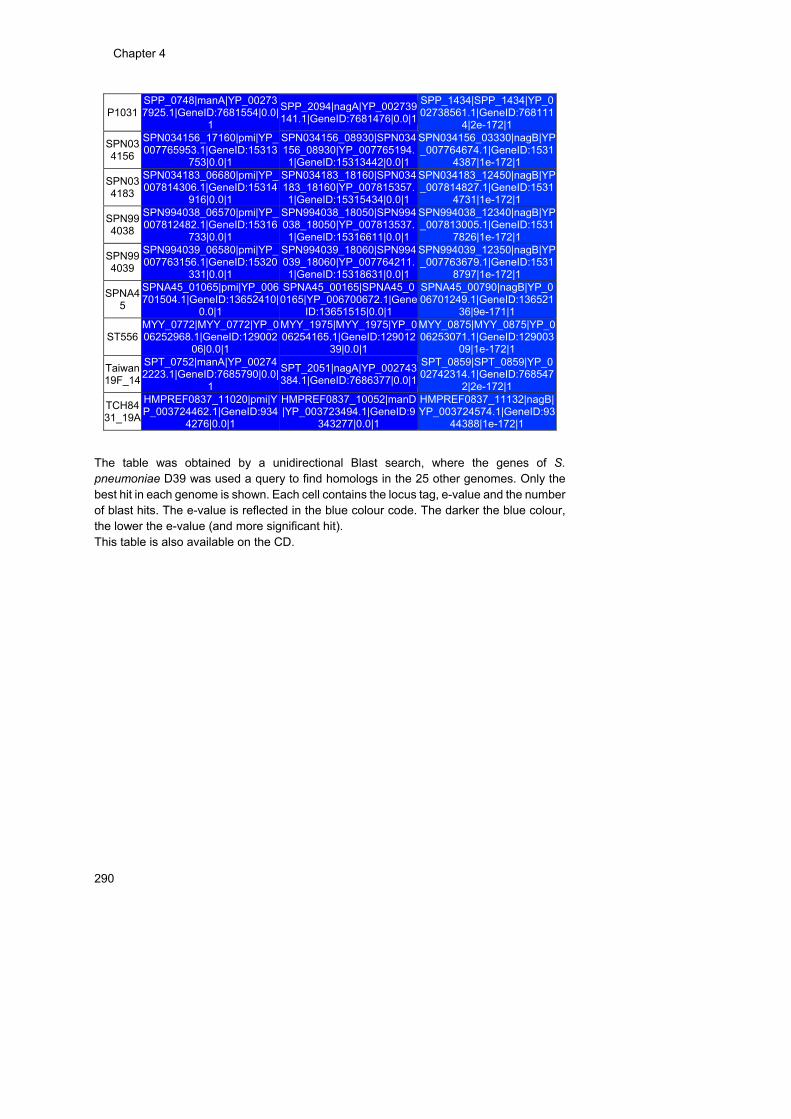
Chapter 4
290
P1031 SPP_0748|manA|YP_002737925.1|GeneID:7681554|0.0|
1
SPP_2094|nagA|YP_002739141.1|GeneID:7681476|0.0|1
SPP_1434|SPP_1434|YP_002738561.1|GeneID:768111
4|2e-172|1
SPN034156
SPN034156_17160|pmi|YP_007765953.1|GeneID:15313
753|0.0|1
SPN034156_08930|SPN034156_08930|YP_007765194.1|GeneID:15313442|0.0|1
SPN034156_03330|nagB|YP_007764674.1|GeneID:1531
4387|1e-172|1
SPN034183
SPN034183_06680|pmi|YP_007814306.1|GeneID:15314
916|0.0|1
SPN034183_18160|SPN034183_18160|YP_007815357.1|GeneID:15315434|0.0|1
SPN034183_12450|nagB|YP_007814827.1|GeneID:1531
4731|1e-172|1
SPN994038
SPN994038_06570|pmi|YP_007812482.1|GeneID:15316
733|0.0|1
SPN994038_18050|SPN994038_18050|YP_007813537.1|GeneID:15316611|0.0|1
SPN994038_12340|nagB|YP_007813005.1|GeneID:1531
7826|1e-172|1
SPN994039
SPN994039_06580|pmi|YP_007763156.1|GeneID:15320
331|0.0|1
SPN994039_18060|SPN994039_18060|YP_007764211.1|GeneID:15318631|0.0|1
SPN994039_12350|nagB|YP_007763679.1|GeneID:1531
8797|1e-172|1
SPNA45
SPNA45_01065|pmi|YP_006701504.1|GeneID:13652410|
0.0|1
SPNA45_00165|SPNA45_00165|YP_006700672.1|Gene
ID:13651515|0.0|1
SPNA45_00790|nagB|YP_006701249.1|GeneID:136521
36|9e-171|1
ST556 MYY_0772|MYY_0772|YP_006252968.1|GeneID:129002
06|0.0|1
MYY_1975|MYY_1975|YP_006254165.1|GeneID:129012
39|0.0|1
MYY_0875|MYY_0875|YP_006253071.1|GeneID:129003
09|1e-172|1
Taiwan19F_14
SPT_0752|manA|YP_002742223.1|GeneID:7685790|0.0|
1
SPT_2051|nagA|YP_002743384.1|GeneID:7686377|0.0|1
SPT_0859|SPT_0859|YP_002742314.1|GeneID:768547
2|2e-172|1
TCH8431_19A
HMPREF0837_11020|pmi|YP_003724462.1|GeneID:934
4276|0.0|1
HMPREF0837_10052|manD|YP_003723494.1|GeneID:9
343277|0.0|1
HMPREF0837_11132|nagB|YP_003724574.1|GeneID:93
44388|1e-172|1
The table was obtained by a unidirectional Blast search, where the genes of S. pneumoniae D39 was used a query to find homologs in the 25 other genomes. Only the best hit in each genome is shown. Each cell contains the locus tag, e-value and the number of blast hits. The e-value is reflected in the blue colour code. The darker the blue colour, the lower the e-value (and more significant hit). This table is also available on the CD.


![Leloir - libro[1].pdf](https://img.dokumen.tips/doc/110x75/557212a0497959fc0b909eda/leloir-libro1pdf.jpg)