Embed Size (px)
Citation preview

The Role of Anelasticity in High Stress Mechanical Response and Physical Properties of Glassy Polymers
L. DAVID,* R. QUINSON, C. GAUTHIER, and J. F'EREZ
Groupe d'Etude de Metallurgie Physique et de Physique cles Materiaux UMR CNRS 551 0, Institut National des Sciences Appliquees de Lyon
69621 Villeurbanne Cedex, France
Non-elastic deformation of amorphous polymers is studied from strain recovery tests. In particular, a strain recovery master curve is built. It allows one to estimate recovery times necessary to recover the whole non-elastic deformation. On such a curve, two non-elastic deformations, namely anelastic (nonlinear) and plastic de- formations, are distinguished by their range of recovery times. The evolution of these two components is followed during a constant strain rate test. This clearly shows the importance of the anelastic deformation for the understanding of the nonlinear response of glassy polymers. Moreover, the structural modifications induced by non-elastic strain of glassy polymers were studied by mechanical spec- troscopy, differential scanning calorimetry and density measurements. These mod- ifications appear to result from the anelastic part of the strain. Lastly, a consistent description of the mechanical response of amorphous solid polymers, and subse- quent recovery processes, is proposed. The polymers tested were poly(methy1 methacrylate), atactic polystyrene, and polycarbonate.
1. INTRODUCTION
hen a polymer is deformed in the glassy state, three components of its deformation are com-
monly distinguished: elastic, anelastic, and plastic de- formation. To determine the value of each, the sample must be unloaded; the elastic strain recovers instan- taneously, the anelastic recovers in a lapse of time and the plastic component is permanent. However, several studies (1-4) have shown that the so-called plastic deformation can recover in a short time by heating the polymer to or above T,. This total recovery also con- cerns the microstructural state since the sample re- covers its initial properties (5-7). In subsequent work, Nanzai (8) observed that in certain glassy polymers with a rigid structure such as polystyrene (PS), a real irreversible deformation can be observed. In any case, this deformation due to disentanglement remains very small and has only been observed in PS. More gener- ally, it is observed that amorphous glassy polymers subjected to large deformations (up to >50%) in the glassy state can recover their deformation at temper- ature above T,. This recovery leads to question the usual distinction of the two non-elastic deformations, namely anelastic and plastic.
Consequently, the aim of this work is (i) to investi- gate, a t a macroscopic scale, the different components
* L. David: To whom correspondence should be addressed
of non-elastic deformation of amorphous polymers by observing its recoveiy as a function of time and tem- perature and (ii) to study the structural modifications induced by such a deformation in order to specify if those modifications are related to a particular compo- nent of the strain.
2. MATERIALS AND EXPERIMENTAL TECHNIQUES
Poly(methy1 methacrylate), atactic polystyrene and polycarbonate (PMMA, PS, and PC), were provided by Elf-Atochem. DSC and GPC experiments were per- formed to determine the Tg. and their number average molecular weight, IM,: PMMA (T, = 120"C, M , = 3,000,000). PS (T, =: 98°C. M , = 124,700), PC (T, = 152°C. M, = 23,300). Before being tested, all samples were brought to a T :> Tg and then annealed for 12 h at T = Tg-30 K. Such treatment was performed to elimi- nate chain orientatiosn and to confer a precise thermal history.
Two mechanical 1:ests were carried out: uniaxial compression and plane strain compression. The un- iaxial compression was performed on cylinders with dimensions (L = 22 imm, 4 = 8 mm) in order to avoid buckling effects and to minimize the barreling effect (9). For the plane strain compression described else- where (101, the die breath was 3.5 mm and specimen width and thickness were 24 mm and 2 mm, respec- tively. These dimensions meet conditions to have the
POLYMER ENGINEERING AND SCIENCE, OCTOBER 1997, Vol. 37, NO. 10 1633

best plane strain state (10, 11). Besides, friction be- tween dies and sample becomes negligible with the application of a FTFE spray (Lubriflon).
During loading and after unloading, the strain is measured by means of a n extensometer fixed on the sample in the case of uniaxial compression. As for the plane strain compression test, the strain a t the load- ing stage is measured by means of a very accurate strain gauge system fixed on the dies. The residual strain after unloading is obtained by measuring the difference between the deformed and the undeformed part of the sample with an LVDT transducer. These devices have been developed and used in previous studies (12-14).
Both tests were carried out on an Instron 1185 equipped with a 100 kN cell. During loading, strain rate was 0.1 min-', which leads to an average loading time of 2 min. The unloading rate was 10 times faster than the loading rate.
Strain, F , and stress, (T, are derived from measure- ments according to:
E = ( 1 - l , , ) / l (T = F / [ S , (1 - VE)' ] in uniaxial compression
= F/S, in plane strain compression (the stressed section under the dies remains constant), where
I : sample length 2,. So: initial length and initial section of the
sample F. applied force 11: Poisson ratio taken a s 0.5 (constant
volume during non-elastic deformation)
After the plain strain compression tests, the de- formed part of the sample could be cut and further studied. Mechanical spectroscopy measurements were performed by means of a home made high reso- lution apparatus specially designed for the study of thin samples and fibers. This inverted pendulum, working in forced oscillation mode, provides the value of the complex rigidity K* = K' + iK". During heating, the geometry of the deformed sample is likely to change. Thus, it is not possible to know the value of the complex shear modulus with a high accuracy in the entire temperature range. Nevertheless, the value of Tan(cp1, as defined by the ratio K"/K' = G / G ' , does not depend on the sample geometry and can be con- sidered to be unaffected by the strain recovery process occurring during the experiment.
3. STRAIN RECOVERY EXPERIMENTS
Recovery as a Function of Time
Under fixed experimental conditions, several sam- ples were deformed up to different strain levels, and then unloaded and measured after a given recovery time. So, we can determine the residual strain after a given recovery time (tree) for different applied strain levels ( E J The stress and the residual strain are reported as a function of the applied strain on a dou- ble ordinate plot (Fig. 1) . The residual strain is re-
L. David et al.
1634 POLYMER ENGINEERING AND SCIENCE, OCTOBER 1997, Vol. 37, No. 10
fi
v
b
0 10 15 20
U
Fig. 1 . Dependence of residual strain, E,,, on recovery time, t,,, at a temperature Tree = T far from Tg. PC, uniaxial compression, de/dt = 2 X Left ordinate, u = f(E);
Right ordinate, E, = XEJ at T,, = 20°C for several recovery times, t,: 0: 10 min, B: 60 mfn, 0: 3600 min, 0: 50,000 min.
Tde, = 20°C.
ported for different recovery times. Obviously, for a given applied strain, the residual strain decreases a s the recovery time increases. Besides, the strain recov- ery kinetics depends on recovery temperature (Tree). Indeed, for T,, well below T,, the kinetics is slow, whereas, for Tree close to Tg, it becomes faster. The slow strain recovery kinetics for PC at 20°C (i.e. T/T,#0.7) and the fast one for PS at 90°C (i.e. T/Tg#0.95), which features a quasi total recovery after 200 h, illustrate this point as shown in Figs. 1 and 2, respectively. These curves show also that the value of the applied strain that corresponds to the residual deformation onset is independent on the recovery time in the stud- ied time range. Moreover, we observe that the associ- ated stress (yield stress) cannot be identified with the maximum of the stress/strain curve usually consid- ered as the yield stress. This last observation is in accordance with previous ones on PC allowing to check the yield criteria validity accurately (12-14) and on amorphous polyethylene terephthalate ( 15).
Recovery as a Function of Temperature
The temperature effect on strain recovery was in- vestigated by deforming a specimen at a fixed temper-
16
12
8
4
0
20
1s
20
5
0 0 5 10 1s 20
Fig. 2. Dependence of residual strain, E,,, on recovey time, t,,,, at a temperature T,, = Td./ close to Tq PS, uniaxial compression, dE/dt = 2 x s-', Tdei = 90°C. As inFlg. 1, E,, = f(EJ at T,, = 90°C for several recovery times, t,: e: 5 min, 0: 60 min. W: 900 min, 0: 6000 min.

The Role of Anelasticity
ature and by measuring the residual strain after a given recovery time at different temperatures. Figure 3 features the stress/strain curve of PMMA deformed in plane strain compression at 20°C and the residual strains measured after 15 h at different recovery tem- peratures. The recovery is quite regular up to 100°C after which it accelerates and becomes very large. Af- ter 15 h at 120°C the deformation fully disappears whatever the applied strain. Similar results were ob- served on PMMA deformed in uniaxial compression at -100°C (16).
Strain Recovery Master Curve
Thus, the thermal activation effect on recovery pro- cesses is beyond doubt. Accordingly, it may be possi- ble to build a strain recovery master curve by using a time-temperature equivalence principle ( 17). The strain recovery master curve was built from isother- mal recovery curves obtained at different tempera- tures after loading a test sample up to a fixed defor- mation. The isotherms were then shifted along the log time axis, so as to obtain the best superposition.
Two experimental procedures were used to obtain the isothermal recovery curves of PMMA samples strained up to 19% in uniaxial compression at 20°C (18). The results are summarized in Fig. 4, which ex- hibits the strain recovery master curve produced by shifting the relevant strain recovery segments with the relative shift factors (inset). The rightmost part of the master curve comes from the recovery segment at 115°C: such an acceleration of strain recovery has already been observed for PS at 90°C (Fig. 2).
4. NON-ELASTIC DEFORMATION AND STRUCTURAL MODIFICATIONS
Two Strain Recovery Stages and Master Curve for Recovery Process
By calculating the derivative of the master curve, one can estimate the characteristic strain recovery
30
24
18
12
6
0 0 5 10 15 20 25 30 35 40
E
Fg. 3. Dependence of residual strain, E,,, on recovery tem- perature, T,, at a given recovery time t,. PMMA, plane strain compression, dsldt = 2 X s-' , Tde, = 20°C. As in Fig. I , E, = f(sJ at t , = 15 H for several T,ec: 0: 20, 0: 40, 0: 60, W: 80, 0: 100, *: 11 0, A: 120°C.
20
15
10 -15
-20 2 s 3,
1 O O O f I (K ')
Fig. 4. Strain recovery rnaster curve at T,, = 20°C for PMMA deformed in uniaxial compression, E = 2 x s- ' , Tder = 20°C, st = 19%. The shift factors shown in the insert corre- spond to two equivalent experimental procedures ( 1 8) (0: pro- cedure 1 , 0: procedure 2).
time distribution of the whole non-elastic deforma- tion, and the presence of two non-elastic strain com- ponents, exhibiting distinct recovery time distribu- tions, is confirmed.
The first component (component 1) presents a dis- tribution covering at least 10 decades of time: at 20°C it extends from the beginning of the recovery experi- ment to times of -lO'os. We note that the unloading time employed (a few seconds) prevented us from fol- lowing the recovery kinetics at times shorter than 10 s. Consequently, the master curve obtained, only features the long time part of this characteristic time distribution. Using an Arrhenius treatment, shift fac- tors of Fig. 4 give information on apparent activation energy for the recovery processes associated with component 1. We can observe an increase in apparent activation energy with recovery temperature (or recov- ery time) from -220 to -650 kJ/mol.
The second component (component 2) presents a distribution covering about two decades of time: at 20°C the recovery times are about one billion years. It is impossible to estimate the apparent activation en- ergy of this component from these experiments. In- deed, all the associated deformation abruptly recovers during the single isothermal segment at 115°C.
As expected, recovery may be observed in shorter times by increasing ithe temperature. In fact, compo- nent 2 is completely recovered in a few hours for PS at 90°C. in a few minutes for PMMA at 115°C. It is to be noted that these temperatures are close to T, of the polymer: Tg-8" for PS and Tg-50 for PMMA.
Several authors ( 18-21) measure the non-elastic strain recovery during a linear increase of tempera- ture with time. They find E, =f(T,) curves similar to E,, = f(logt,) curves presented here (Fig. 4). This supports the time-I emperature equivalence proce- dure, as mentioned above. However, the temperature increase prevents those analyses from observing the fastest recovery processes occurring during unload- ing: this could explain the presence of the low temper-
POLYMER ENGINEERING AND SCIENCE, OCTOBER 1997, Vol. 37, No. 10 1635

L. David et al.
ature peak observed in dE,,/dT,, = f(Trec) plots. In agreement with our results on PMMA, Oleynik et al. (5 , 19, 22, 23) show the existence of two distinct compo- nents during strain recovery of several polymers strained at temperatures far below Tg. Because com- ponent 2 recovers only after very long times, whereas component 1 is mostly recovered after usual observa- tion times, those components can be conventionally called plastic ( E , ~ ) and anelastic (E,,) deformation, re- spectively. However, a t temperatures near Tgr the re- covery times relative to component 2 (spl) also become short, and neither is distinguishable anymore.
Anelastic and Plastic Strain Variation During a Mechanical Test
From our results and Oleynik's studies, it appears that a treatment of 1 h at T,-20° on a sample strained at T,,,far below T, allows the total recovery of E,,, while
remains in the sample. Indeed, from the shift fac- tors reported in Fig. 4, it is possible to estimate the time at 20°C equivalent to 1 h at T,-20°, i.e., corre- sponding to the arrow (A) in Fig. 4. It clearly falls before the plastic strain recovery times. Thus, by ap- plying the treatment of 1 h at Tq-20", since E, = spl after that treatment, we can determine E,,~ as a func- tion of the total deformation applied before unloading, q. Then we can determine the value reached by E,,
before unloading as E,, = st - - cP1, where E , ~ , the purely elastic deformation, is calculated from = E,, cr,, where E,, is the unrelaxed modulus measured at high frequency or a t low temperature and mt the stress value just before unloading.
Figure 5 , shows E , ~ , E,,, and sPl variations with the applied strain for PMMA strained at 20°C in plane strain compression. It can be observed that:
E,, onsets from the beginning of the test and keeps
ep1 onsets around the maximum stress point and growing even beyond the maximum stress.
then increases as the strain increases.
It must be emphasized that when the stress peak develops, E,,, is having a large increase while E , ~ is just setting in. Then, the strain rate around this peak is
200
I60
2 120 a 5 80
40
0
m h
8 v
0 5 10 15 20 25 30 35 40 E (%I
Fig. 5. Variation of E,, (01, E,, (W) and E,,, (0) during deforma- tion in PMMA inplane strain Compression, PMMA, de/dt = 2 X lo-" s-', Tder = 20°C.
mainly due to E,,. On a PS notched sample, a similar result was deduced from optical observations (24).
A constant cP1 rate is reached in the minimum stress zone only when E,, becomes constant. Consequently, this zone corresponds to a stationary regime of defor- mation, a s has been previously observed (8, 25, 26). Activation volume and activation energy associated to
ought to be calculated in this domain since the microstructure is time independent.
Properties and Nature of Non-Elastic Strain Components
To draw up a list of properties associated to the two non-elastic strain components, a further experimental study is required.
Effect of Non-Elastic Deformation on the Physical Properties of Glassy Polymers
To study the influence of non-elastic deformation on the structural and dynamic properties of PMMA, den- sity determinations, dynamic mechanical spectros- copy measurements and differential scanning calo- rimetry thermograms were performed a s a function of deformation. In all cases, the deformation occurred at 20°C at a strain rate of 2 X s-'. Moreover, the samples were maintained 2 h at 20°C before experi- mental characterization. Figure 6 shows the increase of density as a function of strain. The maximum ob- served increase in density is -0.35%. in agreement with the values deduced by Kung et al. in uniaxial compression tests (27) [with E close to 50% and Ad/ do = 0.4%). This increase is not related to the mechan- ical test type, as we observed similar changes in den- sity in tensile and compression modes for equivalent strains (28).
If the well-known free volume approach is applied to these results, then the increase in density, i.e., a de- crease of free volume, is expected to yield to a lower molecular mobility. Actually, the experimental dy- namic behavior is illustrated by Fig. 7 displaying the change of Tan(cp) as a function of temperature (dT/ dt = 1 K/min) a t a constant frequency cf = 1 Hz) for different applied strains. It can be observed that in the temperature domain from 310 K to T,, Tan(cp) in- creases with applied strain, thus revealing a smaller
1 1 8 5 1 ' ' ' ' " " ' ' " ' " ' 1 .& LO 20 30 40 50
Applied strain ("lo)
Fig. 6. Increase of density of PMMA with strain in plain strain compression tests.
1636 POLYMER ENGINEERING AND SCIENCE, OCTOBER 1997, Vol. 37, No. 10

The Role of Anelasticity
-7 'j
250 I
n / I ' I I I
250 270 290 310 330 350 370 390 410
Temperature (K)
Fig. 7. Euolution of Tan(q) = G / G ' as a function of tempera- ture and strain (plain strain compression tests). 0: = 0%: +: = 12%; 0: = 21%; V: = 43%; A: = 48%.
mechanical relaxation time for the a mechanical re- laxation process in the deformed state, in agreement with previous measurements (29-3 1 ). Consequently, the molecular mobility increases with deformation, in spite of the decrease of volume. Moreover, the values of Tan(cp) cannot be increased indefinitely, as all spec- tra are the same if strain exceeds 40%. This limit effect is also visible on the density evolution with strain, as density hardly can be increased above 1.1895 g/cm3. Additional microstructural information can be pro- vided by the evolution of DSC thermograms with ap- plied strain, a s shown by Fig. 8. Two exothermic pro- cesses can be observed. The first process appears in the temperature range from 50°C up to 120°C even for low values of the applied strain ( E = 18%). The ampli- tude of the first exothermic process reaches a con- stant value if the applied stress exceeds 29%. The second process appears between 120 and 140°C. but is clearly seen only in the case of high applied strains ( E close to 43%). Thus we assign the second exother- mic process to the recovery of plastic deformation (i.e. component 2 of anelastic deformation).
All properties studied here, namely density, me- chanical relaxation times, and enthalpy of the first exothermic process, level off for high strain values. This leads us to establish no direct relation between the observed physical properties with the plastic com-
h
3
3 LL
L - c
2
n 40
0 3 8
0 36
034 -
0 32
a 30
n 28
026 .
024.
0 22
20 40 60 so ion 120 140 160 180
Temperature (K)
Fig. 8. Changes of diJ7erential scanning calorimetry thermo- grams as a function of strain (plain strain compression tests). Solid line: E = 0%; Long dash: E = 18%; Short dash: E = 29%; Dots: = 43%.
ponent of deformation (component 2). as this compo- nent does not meet a finite limit as applied strain increases. On the contrary, the anelastic part of de- formation (component ll is more directly related to density, molecular mobility and enthalpy level, since the strain decomposition suggested in this work leads to a constant anelastic deformation for high applied strains.
TO go a step further, the effects of thermal treat- ments after deformation are investigated. As evi- denced in a preceding section, it is possible to anneal the material so as to induce the complete recovery of the anelastic deformation alone (component 1 ) with- out modifying the plastic component 2 because of the separation in time and temperature of the two differ- ent recovery processes of the deformation, a s pre- sented above. Thus, annealing at 100°C for 1 h results in erasing the anelastic component 1 , and maintain- ing the plastic component 2 unchanged. The effect in the observed properties is a return to the features of the undeformed material. As a n example, the densi- ties of the deformed and subsequent annealed PMMA samples do not exceed 1.1859 g/cm3, even for sam- ples retaining a strain component 2 close to 30%. Consequently, the change in dynamic and structural properties investigated here are to be associated mainly with the anelastic part of deformation.
Anelastic Deformation
It depends on the polymer. The value of the anelas- tic component in thie stationary regime depends on the polymer as E,, is close to 4%, 9% and 17% in PS, PC, and PMMA, respectively (18). It depends on temperature, diminishing as Tdef in- creases (18). and it is expected to become negligible when Tdef > T, (5). E,, is necessary to create cpl. Indeed, Oleynik (5) shows that a prestrained sample heated to T < Tg in order to eliminate E,, but still featuring epr. when deformed a second time requires a certain amount of E,, before creating further E ~ ~ .
E,, is associated with a slight densification (specific volume decrease), a t least in compression (271. From mechanical spectroscopy experiments below T, specifying previous observations (29, 311, a strained sample features a higher molecular mobil- ity than a non strained one. This extra mobility can be associated with E,, since a thermal treatment erasing E,, also erases this excess of mobility. During sample deformation, a large amount of en- ergy (AU) is stored in the sample and has been measured (5, 23, 32, 33). This energy increases from the very beginning of the deformation and lev- els off at a value of about 14 J / g for PMMA, 10 J / g for PS and 8 J/g for PC (34) at strains well above the maximum stress si rain. Up to large applied strains (-30%), this stored energy is released if the sample is heated to T < Tg (22, 35, 36), thus confirming its relation to sa,. Apparent activation energies deduced from our shift factors (insert, Fig. 4) are very close to those ob-
POLYMER ENGINEERING AND SCIENCE, OCTOBER 1997, Vol. 37, No. 10 1637
L. David et al.
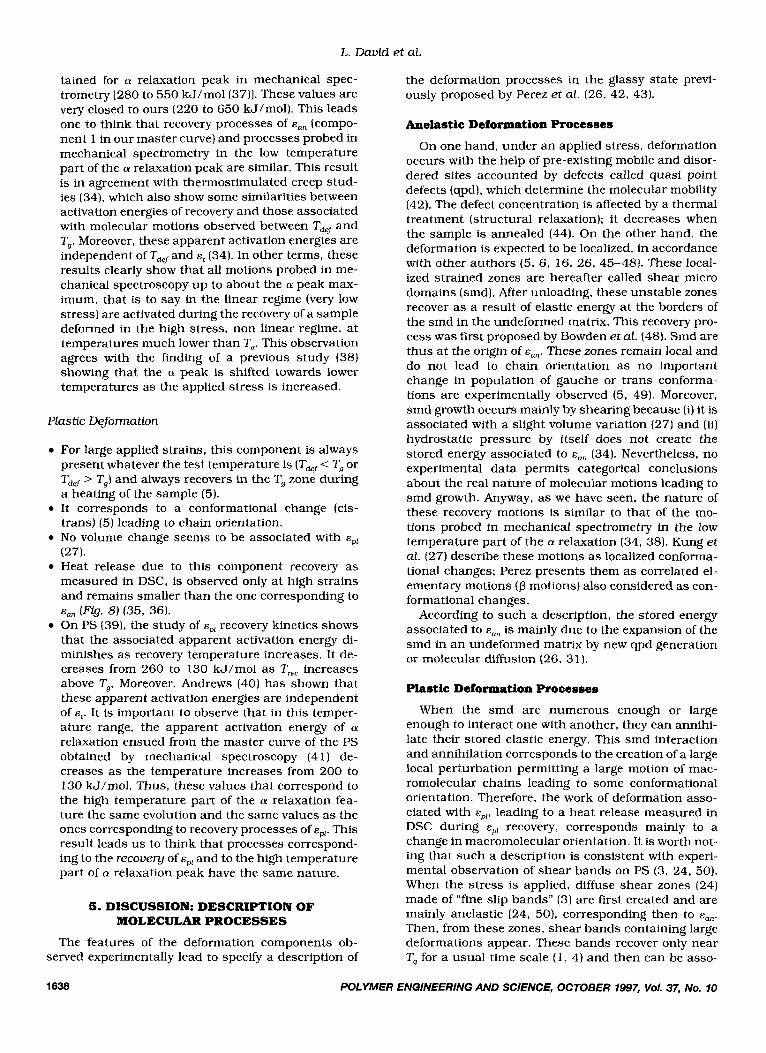
tained for a relaxation peak in mechanical spec- trometry [280 to 550 kJ/mol(37)]. These values are very closed to ours (220 to 650 kJ/mol). This leads one to think that recovery processes of E,, (compo-
the deformation processes in the glassy state previ- ously proposed by Perez et al. (26, 42, 43).
Anelastic Deformation Processes nent 1 in our master curve) and processes probed in mechanical spectrometry in the low temperature part of the a! relaxation peak are similar. This result is in agreement with thermostimulated creep stud- ies (34). which also show some similarities between activation energies of recovery and those associated with molecular motions observed between Tde, and T,. Moreover, these apparent activation energies are independent of TdG and ct (34). In other terms, these results clearly show that all motions probed in me- chanical spectroscopy up to about the a peak max- imum, that is to say in the linear regime (very low stress) are activated during the recovery of a sample deformed in the high stress, non linear regime, a t temperatures much lower than T,. This observation agrees with the finding of a previous study (38) showing that the (Y peak is shifted towards lower temperatures as the applied stress is increased.
Plastic Deformation
For large applied strains, this component is always present whatever the test temperature is (T&, < Tg or Tde, > TJ and always recovers in the Tg zone during a heating of the sample (5). It corresponds to a conformational change (cis- trans) (5) leading to chain orientation. No volume change seems to be associated with (27). Heat release due to this component recovery as measured in DSC, is observed only at high strains and remains smaller than the one corresponding to E,, (fig. 8) (35, 36). On PS (391, the study of cPI recovery kinetics shows that the associated apparent activation energy di- minishes as recovery temperature increases. It de- creases from 260 to 130 kJ/mol as T,, increases above T,. Moreover, Andrews (40) has shown that these apparent activation energies are independent of ct . It is important to observe that in this temper- ature range, the apparent activation energy of a relaxation ensued from the master curve of the PS obtained by mechanical spectroscopy (4 1) de- creases as the temperature increases from 200 to 130 kJ/mol. Thus, these values that correspond to the high temperature part of the a! relaxation fea- ture the same evolution and the same values as the ones corresponding to recovery processes of cpl. This result leads us to think that processes correspond- ing to the recovery of cpl and to the high temperature part of a relaxation peak have the same nature.
5. DISCUSSION: DESCRIPTION OF MOLECULARPROCESSES
The features of the deformation components ob- served experimentally lead to specify a description of
On one hand, under a n applied stress, deformation occurs with the help of pre-existing mobile and disor- dered sites accounted by defects called quasi point defects (qpd), which determine the molecular mobility (42). The defect concentration is affected by a thermal treatment (structural relaxation); it decreases when the sample is annealed (44). On the other hand, the deformation is expected to be localized, in accordance with other authors (5, 6, 16, 26, 45-48). These local- ized strained zones are hereafter called shear micro domains (smd). After unloading, these unstable zones recover a s a result of elastic energy a t the borders of the smd in the undeformed matrix. This recovery pro- cess was first proposed by Bowden et al. (48). Smd are thus at the origin of can. These zones remain local and do not lead to chain orientation a s no important change in population of gauche or trans conforma- tions are experimentally observed (5, 49). Moreover, smd growth occurs mainly by shearing because (i) it is associated with a slight volume variation (27) and (ii) hydrostatic pressure by itself does not create the stored energy associated to F,, (34). Nevertheless, no experimental data permits categorical conclusions about the real nature of molecular motions leading to smd growth. Anyway, as we have seen, the nature of these recovery motions is similar to that of the mo- tions probed in mechanical spectrometry in the low temperature part of the a relaxation (34, 38). Kung et al. (27) describe these motions as localized conforma- tional changes: Perez presents them as correlated el- ementary motions (p motions) also considered as con- formational changes.
According to such a description, the stored energy associated to E,, is mainly due to the expansion of the smd in an undeformed matrix by new qpd generation or molecular diffusion (26, 31).
Plastic Deformation Processes
When the smd are numerous enough or large enough to interact one with another, they can annihi- late their stored elastic energy. This smd interaction and annihilation corresponds to the creation of a large local perturbation permitting a large motion of mac- romolecular chains leading to some conformational orientation. Therefore, the work of deformation asso- ciated with cPl, leading to a heat release measured in DSC during cPI recovery, corresponds mainly to a change in macromolecular orientation. It is worth not- ing that such a description is consistent with experi- mental observation of shear bands on PS (3, 24, 50). When the stress is applied, diffuse shear zones (24) made of “fine slip bands” (3) are first created and are mainly anelastic (24, 50). corresponding then to can. Then, from these zones, shear bands containing large deformations appear. These bands recover only near Ts for a usual time scale ( 1 , 4) and then can be asso-
1638 POLYMER ENGINEERING AND SCIENCE, OCTOBER 1997, Vol. 37, No. 10

The Role of Anelasticity
ciated with .spr. Under stress, diffuse zones always sur- round these shear bands. Moreover, microscopic ob- servations after different type of creep /recovery tests (50) show that the shear band expansion needs a certain amount of E,,,.
Stationary Regime
During deformation, disorder increases and new qpd are mainly generated by anelastic deformation, i.e., because of smd nucleation and expansion. Their nature appears to be similar to pre-existing defects as the enthalpy relaxation kinetics associated to their relaxation appears to be the same but shifted to smaller times (51). There is then a competition be- tween defects creation due to anelastic deformation and defects annihilation due to structural relaxation. This competition leads to a defect population equilib- rium, independent of the initial microstructural state corresponding to the stationary regime (261, a t least in the case of homogeneous deformation (50).
Strain Recovery Processes
Confirming others’ results (27, 53). we have shown that the non-elastic strain recovery is a two stage process. Each stage corresponds to a particular non- elastic deformation component:
After unloading, most of the smd (E,,) recover quickly at the loading temperature (38). The more stable ones need longer times or a larger thermal en- ergy to recover. However, they always recover a t tem- peratures well below Tg. Besides, this strain recovery is accompanied by the associated energy release.
Plastic deformation corresponds to chain orienta- tion and leads to the appearance of a rubber elastic force (25,54), which tends to recover this deformation. However, new configurations due to chain orientation are rather stable because intermolecular forces a t T < Tg prevent macromolecular chains from coming back to their initial state. Consequently, for usual times, it is necessary to go up to T, to make macromolecular movements fast enough to permit oriented chains, subjected to an entropic force, to come back to their unoriented state.
6. CONCLUSION
From different strain recovery tests and from a strain recovery master curve, two distinct components of the non-elastic deformation are clearly identified when temperature is lower than -Tg-30°C:
(i) an anelastic component, E,,, which recovers over a large range of time (at least 10 decades) spanning from very short times to some 10” s in PMMA at 20°C.
(ii) a plastic component, E ~ ~ , which recovers over a range of time of about two decades, is about one bil- lion years for PMMA at 20°C. This component can recover in a few hours by bringing the polymer close to its Tg.
The non-elastic deformation induces structural modifications involving a decrease of volume, an in- crease of enthalpy and an increase of molecular mo-
bility. All these modifications are shown to be related with the anelastic component
On a stresslstrain curve the maximum stress is observed to occur while a large increase of anelastic deformation is still taking place. The strain increase is mainly anelastic a t this maximum and becomes fully plastic only around the minimum stress correspond- ing to the beginning of the stationary regime.
Through our expeirimental results and those of other authors, a description of deformation processes previously proposed by Perez et al. is specified. At a microscopic level, the anelastic deformation is seen to result from localized sheared microdomains. These smd formations and extensions correspond to a n in- crease in potential energy, so that after unloading, most of them recover quickly at Tdej. The plastic defor- mation results from smd coalescence and corre- sponds to a chain orientation that creates a rubber- like entropic force but corresponds to new stable macromolecular arrangements requiring a very long time or a high thermal energy (temperature close to TJ to return to the initial state.
This study emphasizes the importance of the anelastic deformation Indeed, it appears that this de- formation must not be neglected to understand and model the plastic behavior of polymers.
The proposed description is consistent with experi- mental observation, but still remains qualitative. In order to yield a more quantitative approach, an exten- sion of a previous model (26) has been performed so as to describe the strain recovery, and, more generally, all the macroscopic observations related to anelastic and plastic deformation. Thus, a numerical simula- tion of the mechanical response of amorphous poly- mers based upon the ]points presented above is possi- ble (28, 52), and provides calculated results in agreement with experimental data obtained through various mechanical tests (shear, compression, ten- sion, biaxial strain, creep, stress relaxation, and so on).
REFERENCES
1. A. S. Argon, R. D. Andrews, J. A. Godrick, and W. With-
2. W. Wu and P. L. Turner, J. Polym. Sci., Polym. Phys., 11.
3. J. B. C. Wu and J. C. M. Li, J. Mater. Sci., 11,434 (1976). 4. J. C. M. Li, Met. Trans., 9A. 1353 (1978). 5. E. Oleynik, Prog. Coi!loid Polyrn. Sci., 80, 140 (1989). 6. 0. A. Hassan, M. C. Boyce, X. S. Li, and S. Berko, J.
Polym. Sci., Polyrn. Phys., 31, 185 (1993). 7. C. C. Chau and J. C. M. Li, J. Mater. Sci., 17,652 (1982). 8. Y. Nanzai, Prog. Polym. Sci., 18, 437 (1993). 9. C. GSell, Plastic Dqfonnation of Amorphous and Semi-
crystalline Materials, p. 13, B. Escaig and C. G’Sell, eds., les Cditions physiqu’es, Les Ullis (1982).
10. J. G. Williams and H. Ford, J. Mech. Eng. Sci., 6. 405 (1964).
11. A. P. Green, Phil. Mag., 42, 900 (1951). 12. R. Bianchi and A. Testi, Thesis, Politecnico di Milano
(1991). 13. M. Rink, R. Frassine, and A. Pavan, Proc. International
Conf., Polymer Blen,ds--II, Polymat’94, p. 5 13, London I1 994).
ney, J. Appl. Phys., 39. 1899 (1968).
2 199 (1973).
POLYMER ENGINEERING AND SCIENCE, OCTOBER 1997, Vol. 37, No. 10 1639

L. David et al.
14. R. Quinson. J. Perez, M. Rink, and A. Pavan, to be pub-
15. D. G. Fotheringham and 8. W. Cherry, J. Mater. Sci., 13,
16. A. S. Argon and M. I . Bessonov, Polyrn. Eng. Sci., 17, 174
17. J. D. Ferry, Viscoelastic Properties of- Polymers, Wiley,
18. K. Quinson, J. Perez, M. Rink, and A. Pavan, accep. for
19. E. Oleynik, Polym. J., 19. 105 (1987). 20. T. Kato. J. Appl. PoIym. Sci.. 22. 1767 (1989). 21. G . W. Adams and R. J. Farris, Polymer, 60, 1829 (1989). 22. S. S. Sheiko. 0. B. Salamantina, S. N. Rudnev, a n d E . F.
23. E. Oleynik, High Performance Polymers, p. 60, E. Baer
24. E. J. Krdmer, J . Macromol. Sci.-Phys., B10, 191 (1974). 25. C. G’Sell and J. J . Jonas, J. Mater. Sci., 16, 1956 (1981). 26. M. B. M. Mangion, J. Y. Cavaille, and J. Perez, Phil. Mag.
27. T. M. Kung and J. C. M. Li, J. Mater. Sci., 22, 3620
28. R. Quinson, PhD thesis, INSA-Lyon (1995). 29. L. David and S. Etienne, Macromolecules, 26, 4302
30. S . Etienne, J. de Phys. IV, C2, 41 (1992). 31. C. G’Sell. H. El Bahri, J . Perez, J. Y. Cavaille, and G. P.
32. S. N. Rudnev. 0. B. Salamantina, V. V. Voenniy, and E.
33. G. W. Adams and R. J . Farris, Polymer, 60, 1825 (1989). 34. E. F. Oleynik, 0. B. Salamantina, S. N. Rudnev, a n d S . V.
lished J. Mater. Sci. (1996).
231 (1978).
(1977).
New York (1980).
pub. J. Maler. Sci.
Oleynik. Polym. Sci. U.S.S.R., 32, 1759 (1990).
and S. Moet, eds., Hanser Verlag, Munich (1990).
A , 66, 773 (1992).
(1987).
( 1992).
Johari, Mater. Sci. Eng., A110, 223 (1989).
F. Oleynik, Call. Polym. Sci., 269, 460 (1991).
Shenogin, Polyrn. Sci. U.S.S.R., 35, 1532 (1993).
35. 0. A. Hassan and M. C. Boyce, Polymer, 34,5085 (19931. 36. B. T. Chang and J. C. M. Li, Polym. Eng. Sci.. 28, 1198
37. E. Muzeau, PhD thesis, INSA-Lyon (1992). 38. R. Quinson, J. Perez, Y. Germain, and J . M. Murraciole,
39. B. T. A. Chang and J. C. M. Li, J. Mater. Sci., 16, 889
40. R. D. Andrews. J. Appl. Phys., 26, 1061 (1955). 41. J . Perez and J. Y. Cavaille, J. Non-Cryst. Sol., 172-174.
42. J. Perez, Physique et Mtkanique des Polyrnires Amor-
43. J. Y. Cavaille, J. Perez, and G. P. Johari, Phys. Reu. B,
44. G. Vigier and J . Tatibouet, Polymer. 34, 4257 (1993). 45. 0. A. Hassan and M. C. Boyce, Polym. Eng. Sci., 35.331
46. B. Escaig, Ann. Phys., 3. 207 (1978). 47. J. M. Lefebvre and B. Escaig, J. Mater. Sci., 20, 438
48. P. B. Bowden and S. Raha, Phil. Mag. , 29, 149 (1974). 49. V. A. Bershtein. V. M. Yegorov, L. G. Razgulyayeva, and
50. E. J. Kramer, J. Polyrn. Sci., Polym. Phys., 13, 509
51. W. M. Prest and F. J. Roberts, Ann. N.Y. Acad. Sci., 371,
52. L. L. Ladouce, PhD Thesis, INSA-Lyon (1995). 53. T. M. Kung and J. C. M. Li, J. Polyrn. Sci., Polyrn. Chern.,
54. S . S . Sternstein and F. A. Myers, J. Macrom. Sci.-Phys.,
(1988).
Polymer, 36, 743 (1995).
(1981).
1028 (1994).
phes, Lavoisier, Paris (1992).
39, 2411 (1989).
(1995).
(1985).
V. A. Stepanov, Potyrn. Sci. U.S.S.R.. 20, 2560 (1978).
(1975).
67 (19811.
24, 2433 (1986).
B8.539 (1973).
POLYMER ENGINEERING AND SCIENCE, OCTOBER 1997, Vol. 37, No. 10