Embed Size (px)
Citation preview
The author(s) shown below used Federal funds provided by the U.S. Department of Justice and prepared the following final report: Document Title: Determination of Unique Fracture Patterns in
Glass and Glassy Polymers
Author(s): Frederic A. Tulleners, John Thornton, Allison C. Baca
Document No.: 241445 Date Received: March 2013 Award Number: 2010-DN-BX-K219 This report has not been published by the U.S. Department of Justice. To provide better customer service, NCJRS has made this Federally-funded grant report available electronically.
Opinions or points of view expressed are those of the author(s) and do not necessarily reflect
the official position or policies of the U.S. Department of Justice.
1
Determination of Unique Fracture Patterns in Glass and Glassy Polymers
Award Number 2010-DN-BX-K219
Frederic A. Tulleners1, MA, P.I.
John Thornton1, D. Crim., Co-P.I.
Graduate Student Researcher
Allison C. Baca, BS1
University of California - Davis, Forensic Science Graduate Program,
1909 Galileo Ct., Suite B, Davis, CA 95618
Disclaimer
“This project was supported by Award No. 2010-DN-BX-K219 awarded by the National Institute of Justice, Office of Justice Programs, U.S. Department of Justice. The opinions, findings, and conclusions or recommendations expressed in this publication/program/exhibition are those of the author(s) and do not necessarily reflect those of the Department of Justice.”
This document is a research report submitted to the U.S. Department of Justice. This report has not been published by the Department. Opinions or points of view expressed are those of the author(s)
and do not necessarily reflect the official position or policies of the U.S. Department of Justice.
2
Abstract The study of fractures of glass, glassy type materials, and plastic has long been of interest to the
forensic community. The focus of this interest has been the use of glass and polymer fractures to
reconstruct past events and to associate items of evidence. One example of this association is the
matching of glass fragments from various locations where they can be shown to have come from
a common origin. In the materials science community, fractography is the means and methods
for characterization of fractured specimens or components in order to study or identify the
mechanism of such failures, which is the focus on most of the literature on the subject. The
ability to show that each and every fracture is, in fact, unique has not been a matter of
consequence or of interest to the engineering or scientific community. In contrast, the basic
premise that fractures are not likely to be reproducible is very relevant to the forensic science
community. The issue arises when a given fracture pattern is restored or component pieces are
physically fitted together and "matched" and the conclusion is drawn that this is unlikely to be
possible unless all the components were derived from the same part. Despite the importance of
this assumption, very limited research has actually been done to confirm that this is indeed the
case. This study documented the very controlled fracture patterns of 60 glass panes, 60 glass
bottles, and 60 plastic tail light lens covers. The pane and bottle specimens were fractured with
three different types of penetration tips: sharp tip, round tip, and blunt tip. Two basic methods
were used to initiate the fractures—dynamic impact from a dropping weight and static pressure
from an Instron® 4204 Tensile Tester. The fracture patterns were then documented in great
detail in such a manner that allowed the analyst to inter-compare the fracture patterns. This
subsequent comparison illustrated the uniqueness of all of the fracture patterns we observed in
This document is a research report submitted to the U.S. Department of Justice. This report has not been published by the Department. Opinions or points of view expressed are those of the author(s)
and do not necessarily reflect the official position or policies of the U.S. Department of Justice.
3
window glass, bottle glass, and plastic lens materials. Thus, we are substantiating the
individuality of glass and polymer fractures under closely controlled conditions.
KEY WORDS
Fractography, Physical Match, Glass Fracture, Instron® Tensile
This document is a research report submitted to the U.S. Department of Justice. This report has not been published by the Department. Opinions or points of view expressed are those of the author(s)
and do not necessarily reflect the official position or policies of the U.S. Department of Justice.

4
Table of Contents
Executive Summary..................................................................................................................... 6
Introduction................................................................................................................................. 15
Statement of the problem................................................................................................. 15
Literature citations and review........................................................................................ 17
Forensic Studies.................................................................................................. 17
Engineering Studies............................................................................................ 24
Statement of hypothesis.................................................................................................. 27
Materials and Methods............................................................................................................... 28
Glass Panes..................................................................................................................... 31
Dynamic Impact Procedure.........,...................................................................... 31
Static Pressure Procedure................................................................................... 33
Glass Bottles................................................................................................................... 36
Dynamic Impact Procedure................................................................................. 36
Static Pressure Procedure.................................................................................... 38
Plastic Lenses.................................................................................................................. 41
Dynamic Impact Procedure................................................................................. 41
Static Pressure Procedure.................................................................................... 43
Velocity Measurements................................................................................................... 45
Inter-comparison of Fracture Patterns............................................................................. 49
Results......................................................................................................................................... 50
Glass Panes...................................................................................................................... 50
Glass Bottles.................................................................................................................... 53
This document is a research report submitted to the U.S. Department of Justice. This report has not been published by the Department. Opinions or points of view expressed are those of the author(s)
and do not necessarily reflect the official position or policies of the U.S. Department of Justice.
5
Plastic Lenses.................................................................................................................. 57
Conclusions................................................................................................................................. 59
Discussion of findings..................................................................................................... 59
Implications for policies and practice.............................................................................. 61
Implications for future research....................................................................................... 62
References................................................................................................................................... 64
Dissemination of Research Findings........................................................................................... 66
Appendix A Fracture Images..................................................................................................... A-1
Appendix B High Speed Fracture Video................................................................................... B-1
Appendix C Testing Device Design........................................................................................... C-1
Appendix D Timing System....................................................................................................... D-1
This document is a research report submitted to the U.S. Department of Justice. This report has not been published by the Department. Opinions or points of view expressed are those of the author(s)
and do not necessarily reflect the official position or policies of the U.S. Department of Justice.
6
Determination of Unique Fracture Patterns in Glass and Glassy Polymers
EXECUTIVE SUMMARY
Synopsis
The study of fractures of glass, glassy type materials, and plastic has long been of interest to the
forensic community. The focus of fracture research was mainly driven by the need to determine
the various reasons for the failure of a brittle material. In the forensic science community, study
of glass fractures has focused on reconstruction of the fracture mechanism by observing the
presence of Wallner lines (arcing lines on the fracture surfaces) and Hackle marks (marks are
parallel with stair-step structures) as well as the overall fracture patterns defined by radial
(fractures radiating from the point of impact), concentric (fractures formed in a circular pattern
around the point of impact), and conchoidal patterns (fractures with a beveled edge illustrating
side of penetration). The forensic community currently relies on analytical techniques such as
density measurements, refractive index measurements, and various elemental analyses to
describe the chemical composition in an effort to determine if glass fragments share a common
origin. Currently, most of the engineering research articles that specialize in fractures, discuss
the formation of fractures and analytical observations postulate that all fractures are unique. The
focus of most of the engineering literature is the explanation and mechanism of fractures. The
ability to show that each and every fracture is, in fact, unique has not been a matter of
consequence or interest to the engineering or general scientific community. A review of the
forensic and engineering literature on glass fracture shows very little has been done that proves
that each and every glass or polymer fracture is unique. Most researchers postulate that due to
This document is a research report submitted to the U.S. Department of Justice. This report has not been published by the Department. Opinions or points of view expressed are those of the author(s)
and do not necessarily reflect the official position or policies of the U.S. Department of Justice.
7
matrix imperfections, fractures propagate randomly, but no significant research has been
published in this area. Some research that has been done looked at the fracture of glass rods and
glass microscope slides. However, these studies do not simulate forensic science case work
involving fracture pattern analysis of window pane glass and glass bottles.
For the forensic community, the ability to piece together glass fragments in order to show a
physical fit or a “Physical Match” is the strongest evidentiary finding of an association. The
usual statement is that "the evidence glass fragment was physically matched to another glass
establishing thus both share a common origin." The opinion is usually conclusive but lacks
objective criteria to determine the uniqueness of a fit. In the area of glassy polymers, which are
increasingly being used as glass substitutes, forensic reconstruction of polymer fracture has been
investigated to a much lesser extent than glass. Some research has focused on the production of
hackle marks and pseudo-conchoidal marks with high velocity projectile impacts. In essence,
little research exists that looks at replication of fracture patterns in an attempt to objectively
define uniqueness.
Purpose
The purpose of this research is to provide a first, objective scientific background that will
illustrate that repetitive fractures, under controlled conditions on target materials such as glass
window panes and glass bottles, are in fact different and unique. In this phase of our study, we
fractured glass window panes, glass bottles (clear wine bottles), and polymer tail light lens
covers. Each and every fracture was documented in detail for subsequent inter-comparison and
to illustrate the uniqueness of the fracture pattern.
This document is a research report submitted to the U.S. Department of Justice. This report has not been published by the Department. Opinions or points of view expressed are those of the author(s)
and do not necessarily reflect the official position or policies of the U.S. Department of Justice.
8
Research Design – Glass Fracture
We used 60 double strength glass (nominally 1/8" thick) window panes and 60 clear glass wine
bottles for the glass portion of the fracture. The window panes were cut into 8" x 8" sections
from a single sheet of double strength glass. Each pane was numbered as to its location on the
original sheet. The glass wine bottles were 750 ml clear, flint glass bottles donated by the Gallo
Wine Bottling Company in Modesto, CA. These bottles were manufactured in a two-step
molding process and were taken from the line of a single day's work to ensure that the bottles
were all manufactured from the same batch of glass. For the glass pane and glass bottle
component, this research used two methods for fracture initiation:
1. A dynamic impact that used a dropping weight
2. A static impact which used an Instron® 4204 Tensile Tester
Each of these fracture methods was done with three different types of tips to initiate the
fracture—a sharp tip, a round tip, and a blunt tip.
Dynamic Impact Experimental Design
The purpose of the dynamic impact was to have sufficient force to initiate a fracture and then
stop the falling weight from penetrating the glass and causing excessive destruction of the
window pane. In order to accomplish this, we designed a fracture device that allowed for a
weight to be dropped at various heights and also allowed for the positioning of the glass pane so
that the fracture tip only penetrated in a fraction of an inch, after which its further movement was
absorbed by the fracture device. The 8" x 8" glass panes were placed on a 2" thick foam block.
The flexibility of the foam was intended to allow for the formation of concentric fractures, as
well as radial fractures.
This document is a research report submitted to the U.S. Department of Justice. This report has not been published by the Department. Opinions or points of view expressed are those of the author(s)
and do not necessarily reflect the official position or policies of the U.S. Department of Justice.
9
The glass bottles were internally coated with RTV Urethane and allowed to set overnight. The
purpose of the coating was to maintain the bottle structure for subsequent documentation after
fracture. The bottles were aligned in a custom semi-circular stand, oriented by using the bottle
mold line to ensure a 12 o’clock position for the fracture tip. The bottle was then rotated so that
the bottle mold lines were at the 3 and 9 o’clock positions.
Static Impact Experimental Design
For the static tests, we used an Instron® 4204 Tensile Tester that can track force in both the
compression and extension directions. A custom indenter was attached to the Instron® 4204
Tensile Tester with a 50 kN load cell. The indenter tips were the same three interchangeable
fracture tips used for the dynamic impact experiments. These tips proved to be satisfactory in
initiating fractures for both the glass panes and bottles. The force applied by the Instron® was
documented as the maximum intender extension in mm versus load in kN (kiloNewtons). For
the glass panes, we initially tried using a foam backing but that technique caused problems with
the Instron® unit. Therefore, we placed the glass panes in frames with a ½” lip around all 4 sides
of the 8" x 8" section of glass window pane.
Fracture Documentation
After the glass panes were fractured, they were assembled and covered with clear tape for
subsequent documentation. The fracture patterns were then documented in the following
sequence:
Hand sketching using an acetate overlay over the glass pane
Scanning the glass at 600 dpi
This document is a research report submitted to the U.S. Department of Justice. This report has not been published by the Department. Opinions or points of view expressed are those of the author(s)
and do not necessarily reflect the official position or policies of the U.S. Department of Justice.
10
Translating the fracture on the glass panes by using a digitizer tablet which imported the
data to a CAD.DWG file.
For the glass bottles, the fracture pattern was likewise documented by hand sketching using an
acetate overlay, and the overlay was scanned at 600 dpi. The fractures on the glass bottle were
not amenable to direct scanning or use of a digitizing tablet.
Velocity Documentation of the Dropping Weights
We used two methods to determine the velocity of the dropping weights. Using a high speed
Phantom Video Camera (V 7.3), we were able to track the velocity of the weights using
MATLAB® software that was able to track the position of a high contrast black circle on a white
background (this circle was placed on the weight). The software provided the X, Y position of
the black circle, frame by frame, and from this data, the software routine calculated the velocity.
The second method for determining velocity of the weight involved the use of a series of specific
wavelength sensors and an accurate timing mechanism. The distance between the start and stop
sensor was measured to ± 1/16”. This distance was within one inch of the indenter travel.
Research Design – Polymer Fracture
For the polymer tail light lens cover, we used Bargman from CequentTM Electrical Products.
They are composed of an acrylonitrile butadiene styrene (ABS) plastic, amber in color, and part
number of 34-84-016. The lens covers are 5 5/8" x 4 1/4" and are used on trucks and motor
homes. They were selected because of their uniform size, availability, and suitable configuration
for fracture documentation.
This document is a research report submitted to the U.S. Department of Justice. This report has not been published by the Department. Opinions or points of view expressed are those of the author(s)
and do not necessarily reflect the official position or policies of the U.S. Department of Justice.
11
We initially intended to use the same fracture tips that had been used for fracturing the glass
panes and bottles. However, in the dynamic impact system, we could not obtain sufficient
velocity to break the polymer lenses. The tips that did penetrate left a round hole the size of the
fracture tip with minimal, if any, fracture lines. This also applied to static impact test with the
Instron® 4204 Tensile Tester series of tests. We changed the indenter mechanism to a 2”
diameter flat disc to conduct the static pressure tests. In reality, this may be more reflective of
tail light lens breaking in an actual vehicle accident environment. A total of 30 plastic lenses
were fractured using this method.
For the dynamic impact tests, we used a dropping pipe device set up at the California
Criminalistics Institute (CCI). This device is used to induce filament deformation in automotive
lamps. The 5 5/8" x 4 1/4" plastic lens was placed at the base of the CCI dropping pipe device.
The lens was left in its original plastic packaging so that the fragments would remain contained.
The pipe was raised to a predetermined height and released, striking the lens to initiate the
fracture. This process was repeated at three different drop heights (3, 6, and 9 ft.), fracturing 10
plastic lenses per height. A total of 30 plastic lenses were fractured using the dynamic impact
method.
Findings
Each fracture pattern was compared to that of every other fracture pattern within its category
(pane, bottle, or lens). This was performed by overlaying one fracture pattern on top of another,
in the same orientation for all patterns. This inter-comparison of fracture patterns was conducted
in order to determine if the overall fracture pattern was duplicated. The 60 glass panes required a
This document is a research report submitted to the U.S. Department of Justice. This report has not been published by the Department. Opinions or points of view expressed are those of the author(s)
and do not necessarily reflect the official position or policies of the U.S. Department of Justice.
12
total of 1,770 pairwise comparisons. Likewise, the 60 glass bottles required a total of 1,770
pairwise comparisons.
The plastics lenses were also subjected to two types of breaking routines. The analyses of the 60
fractures required total of 1,770 pairwise comparisons. The total number of comparisons that
were made for glass panes, glass bottles, and plastic lenses in this study were 5,310.
In producing the glass fractures on the glass panes and the glass bottles, it can be seen that the
blunt fracture tip required the highest velocity to initiate the fracture and the round fracture tip
required the least. The force required to initiate the fracture was also reflected in the appearance
of fracture pattern. The fracture patterns produced by the sharp tip had fewer fracture lines than
that of the either the round or blunt tips. The fracture pattern produced by the blunt tip had the
most fracture lines, and required the largest amount of load applied to the glass. Also noted was
that the blunt tip produced a star-shaped fracture pattern, completely unlike the patterns produced
by the sharp and round fracture tips.
Conclusions
No overall fracture patterns were duplicated in the glass window panes or the glass bottle
experiments. Some similarities were noted in a limited number of specific fracture lines;
however, the overall patterns were not duplicated.
The plastic lenses did exhibit some general similarities in fracture patterns, such as the center of
many of the lenses breaking completely out of the lens. They also had a tendency to fracture
along the mold lines of the lens. However, there were no duplicates of overall fracture patterns.
Thus, one must use caution in looking at plastics lens fracture since the breaking of plastic lens
This document is a research report submitted to the U.S. Department of Justice. This report has not been published by the Department. Opinions or points of view expressed are those of the author(s)
and do not necessarily reflect the official position or policies of the U.S. Department of Justice.
13
showed a tendency to fracture in specific areas, like along mold lines. More caution should be
exercised in evaluating the uniqueness of fracture in this type of material.
Implications for Policy and Practice
These results support the theory that coincidental duplicate fracture patterns are highly unlikely
to occur. This finding supports the reliability of physical match findings and fracture pattern
interpretation when dealing with broken glass and plastic objects. This research should aid the
practitioner in any court testimony involving the significance of fracture matching of broken
glass and polymers materials.
One other issue to consider in our research is that we documented with 2-dimensional fractured
images. In real time forensics fracture reconstruction, the analyst is generally working with a 3-
dimensional fragment. Thus, they will have more discriminating capabilities.
Dissemination
This research has been presented at the American Academy of Forensic Sciences and a UC
Davis graduate off-site seminar. Intentions are to present at a regional forensic science meeting
in the Southwest and a regional meeting in Northern California. The research will also be
condensed and submitted for publication in a suitable forensic science peer reviewed journal.
Future Research Suggestions
This study of 180 fractures (5,310 pairwise comparisons) was done by a graduate student
researcher (GSR) with little forensic experience. But during the 1.5 years of the project, the GSR
This document is a research report submitted to the U.S. Department of Justice. This report has not been published by the Department. Opinions or points of view expressed are those of the author(s)
and do not necessarily reflect the official position or policies of the U.S. Department of Justice.

14
gained extensive experience in documenting fractures. This study could be replicated by
forensic examiners trained in physical matching.
High speed video could be helpful in assessing fracture formation or propagation. In our
research, we saw some unusual fracture propagation in two glass bottles. Further research effort
needs to be made in the area of mathematical assessment and analysis of the fracture features. If
we can use mathematical techniques, we minimize possible bias or error caused by lack of
attention to detail by an analyst in this type of research. Several options are available for image
analysis using existing algorithms but would require some custom programming commands.
Mathematical software exists which allows one to perform various mathematical operations on
digital images. These routines enable one to extract significant information from a given fracture
image. Future research opportunities exist for areas using such digital image software on our
current fracture images. Some of the concepts that could be applied in order to explore match
quality are:
Document all the segments in a particular glass fracture and provide a pixel based
area count of each segment in the form of a histogram.
Document the glass segments by measuring its pixel circumference. When two
segments have the same circumference, use other mathematical routines to
evaluate the difference or similarity of segment shape.
Count the length of each fracture line until it ends or intersects and plot this as
histogram suitable for inter-comparison.
In conclusion, there remains a continuing need for more research effort in the area of physical
matching of glass/polymer fractures using larger databases and their reduction to a suitable form
of inter-comparison using mathematical algorithms.
This document is a research report submitted to the U.S. Department of Justice. This report has not been published by the Department. Opinions or points of view expressed are those of the author(s)
and do not necessarily reflect the official position or policies of the U.S. Department of Justice.

15
Introduction
Statement of the problem
Glass and polymers are ubiquitous in our environment, and as a consequence, fractured
glass and glassy polymers are encountered as evidence materials in both criminal and civil
investigations. We are surrounded by glass and glassy polymers – in architectural situations, in
automobile windows, in beverage bottles and other liquid containers, in incandescent light bulbs
– and any of these may break under certain conditions. Certainly from a forensic standpoint, the
presiding property of glass, and to a somewhat lesser text with glassy polymers, is it
susceptibility to breakage. The possibilities are legion. The glass may be broken purposefully,
as with the forced entry into a building through a window, or it may be inadvertent, or incidental
to a struggle. Within the forensic science community, glass fracture has been a consideration for
more than 80 years. The fracture of polymers, because of their later introduction, is somewhat
less researched.
From the very outset, it was appreciated that many torn or fractured materials could be
fitted back together, and that an intimate fit of broken pieces would provide strong evidence that
the pieces had at one time been joined. This was seen to apply to a fairly wide variety of
materials – wood, ceramics, fabrics, paper, metals, and certainly glass. When an object is
separated into two or more pieces with irregular margins and then reconstructed by fitting the
pieces back together, it is said that a physical match exists between the items. A complementary
and palpable physical match between separated items has historically been construed as proving
that the items had originally been joined. Unambiguous physical matches are commonly
considered to be the zenith of all forensic identifications.
This document is a research report submitted to the U.S. Department of Justice. This report has not been published by the Department. Opinions or points of view expressed are those of the author(s)
and do not necessarily reflect the official position or policies of the U.S. Department of Justice.
16
This does not mean that physical matches, of all types and descriptions, are unassailable
with respect to their validity. Physical matches of surface contours, particularly those of three
dimensions, have an established basis in common sense and everyday experience. Everyone
fitting a broken cracker back together is quickly convinced of the premise that the pieces were at
one time an intact whole. For many people, this process may have started at an early age,
perhaps with a broken toy.
But with few exceptions, the assumption of the significance of a physical match has not
been subjected to rigorous scientific testing. If a fractured surface is unique, then one may make
a reasonable posit that there exists a physical explanation for why it is unique. But the common
experience of fitting broken pieces back together, with the acceptance of uniqueness, has resulted
in a situation where any urgent necessity of proving fracture uniqueness by formal scientific
studies has not been recognized.
This is no longer the case, and this situation cannot endure. The National Academy of
Sciences Report – Strengthening Forensic Science in the United State [1] – has stressed the need
for research to establish a firm scientific basis for many aspects of physical evidence that
heretofore have been taken for granted. The uniqueness of fractured glass and polymers would
fall in this category. And the Daubert decision [2], which either governs, or at least influences,
the acceptance of scientific evidence in courts of law demands that scientific evidence be placed
on a solid footing.
Hence the need and justification for the present research. It is appropriate, however, to
first review the history of fractured glass and glassy polymers within the forensic science
domain, as the interpretation of fractures is driven by the manner in which forces are applied and
the manner in which the fractures are expressed, that is, their appearance. It is appropriate as
This document is a research report submitted to the U.S. Department of Justice. This report has not been published by the Department. Opinions or points of view expressed are those of the author(s)
and do not necessarily reflect the official position or policies of the U.S. Department of Justice.
17
well to consider the subject from the engineering standpoint, as it is within the engineering
discipline that fracture phenomena have been critically studied and described.
Literature citations and review
Forensic Studies
Early work within the forensic sciences was with respect to glass alone, and was directed
toward the development of an explanation for why glass fractures in the manner in which it does
rather than a detailed consideration of the appearance of the fractures themselves or the
assessment of whether two pieces of fractured glass constituted an acceptable physical match.
In the forensic science literature, one of the earliest recorded interest in glass fracture was
that reported by Preston [3]. The issue addressed by Preston was how flaws in glass were
created using stationary, rolling, and sliding spheres and glazier's diamonds and wheels. Here he
found that these flaws extend far below the surface irregularities. Further experiments by
Preston [4] focused on blunt contact cracks. He described that some fracture marks surrounded
an "explosion center." He goes on to say that he also observed "hackly features" surrounding a
semicircular area of "polished" fracture. Based on these features, Preston concluded that
explosion center was representative of a pre-existing flaw and the fracture spread over the small,
semicircular area. These features have become known as the fracture origin, hackle lines, and
fracture mirror, respectively [5].
Another early record of glass fracture interest was that reported by Matwejeff [6]. The
issue addressed by Matwejeff was whether a glass window was broken from the inside of a room
or from the outside. Matwejeff reported that he was unable to locate any previously published
work on this issue, and as a consequence performed his own experiments. His conclusions
remain valid to this date.
This document is a research report submitted to the U.S. Department of Justice. This report has not been published by the Department. Opinions or points of view expressed are those of the author(s)
and do not necessarily reflect the official position or policies of the U.S. Department of Justice.
18
Matwejeff noted the presence of arcing lines on the fracture surfaces of broken piece of
glass, the appearance of which bore a relationship to the side from which the force was applied to
the glass pane. (These lines are now referred to in both engineering literature and forensic
literature as Wallner Lines.) These lines, which are in relief, vary in the extent of their curvature.
They are nearly parallel to one edge of the broken glass, and nearly perpendicular to the other.
Matwejeff correctly understood that these lines were not due to some inherent property within
the glass itself, but rather were a manifestation of the fracture process. Matwejeff also noted that
fractures of window panes resulted in two discernibly different types of fractures. One type of
fracture radiated away from the point of application of force, and these were termed radial
fractures. Another type of fracture was concentric around the point of application of force, and
were termed concentric fractures. Concentric fractures were not invariably observed, but tended
to be seen with greater applications of force. Matwejeff recognized that the arcing lines (Wallner
Lines) show a different orientation with radial and with concentric fractures.
Matwejeff was also armed with the knowledge that the tensile strength of glass is much
lower than the compressive strength, i.e., that glass breaks under tension, not compression. To
explain the breaking of glass, Matwejeff then concluded:
As a force is applied to glass, the glass deforms elastically until the elastic limit
on the far side of the glass is exceeded. With the glass on the far side under
tension, the near surface is under compression.
The glass fails under tension, with the fracture initiating on the far side and
radiating out from the fracture origin.
If the force cannot be accommodated by radial fractures alone, the additional
force will push in on the radial fractures, causing tension on the near surface.
This document is a research report submitted to the U.S. Department of Justice. This report has not been published by the Department. Opinions or points of view expressed are those of the author(s)
and do not necessarily reflect the official position or policies of the U.S. Department of Justice.
19
The glass will then break again under tension, this time from the near side. The
fractures will then extend between the initial radial fractures, tending to form the
boundary of a circle concentric around the fracture origin.
The arcing lines (Wallner Lines) will indicate the direction of application of force
if the analyst knows whether it is a radial or a concentric fracture surface that is
being examined.
In 1936, the work of Matwejeff was confirmed by the FBI Laboratory [7]. (It should be
stressed that this work, as with the original work of Matwejeff, was directed toward determining
the direction of application of force to a broken window; the uniqueness of fracture surfaces was
not at issue). The FBI Laboratory reported that in over 200 glass fracture experiments, no
difficulty was encountered in determining the direction of application of force.
In the same year, Tryhorn [8] affirmed the work of Matwejeff, and elaborated on the
issue of radial and concentric fractures. Tryhorn described radial fractures as occurring when a
sharp pointed force was applied to the glass, while concentric fractures may be expected when
blunt objects are involved. Tryhorn noted that concentric fractures may be absent when the
original force is insufficient to break out pieces of glass. Tryhorn used the term conchoidal
(‘shell like’) fractures to describe the arcing lines on fracture surfaces, and described the reverse
relationship between the orientation of the lines on radial and concentric fractures. Tryhorn
reported on some anomalous conchoidal lines on some radial fractures, remote from the point of
impact. These anomalous lines were reversed from the typical radial/concentric orientation.
Tryhorn speculated that these anomalous lines were the result of the window being rigidly held
near supporting window frames.
This document is a research report submitted to the U.S. Department of Justice. This report has not been published by the Department. Opinions or points of view expressed are those of the author(s)
and do not necessarily reflect the official position or policies of the U.S. Department of Justice.
20
A year later, in 1937, Nicholls [9] offered another explanation for anomalous lines, that
in the fracture process, the glass may bend in a wave form with the reversal occurring at the
wave nodes. Nicholls concluded that only the fracture surfaces between the point of origin and
the first concentric fracture should be considered reliable for determining the direction of force.
Another fracture feature was described in the 1949 text by O’Hara and Osterberg [10]. In
this text, hackle marks are described as a series of parallel marks in relief on fracture surfaces.
The discussion of the interpretation of hackle marks in this work is no longer considered valid,
but hackle marks clearly contribute to the “fit” of a physical match between fracture surfaces.
In 1936, the FBI advanced the “3R” rule [11] to summarize the relationship of arcing
(conchoidal or Wallner Lines) to the direction of force applied to breaking glass, that a radial
fractures produces arcs at right angles (i.e., perpendicular) to the rear (i.e., far) surface of the
window.
Nelson discussed the value of hackle marks in the interpretation of direction of force
from an operational standpoint [12]. Hackle marks are parallel, and may be more easily
photographed than Wallner Lines, which are curved and do not provide a single angle from
which the lines may be illuminated to illustrate their entirety. As Thompson pointed out,
however, they are of themselves somewhat difficult to photograph [13]. Thompson considered
hackle marks in greater detail, noting that hackle marks often present themselves as varying
stair-step structures, with a shelf at the top (fracture edge) and base of the deeper marks. The
shelves at the top are parallel to each other, and the same may be said for the shelves at the
bottom of the hackle. But those at the top are typically at a different angle than those at the
bottom, causing one type or the other to be more prominent visually, but not both at the same
time.
This document is a research report submitted to the U.S. Department of Justice. This report has not been published by the Department. Opinions or points of view expressed are those of the author(s)
and do not necessarily reflect the official position or policies of the U.S. Department of Justice.
21
In 1973, the entire subject of glass fracture was reviewed by McJunkins and Thornton
[14]. In this review, the fracture-related properties of glass were developed, including processes
in glass formation, the atomic arrangement in glass structure, glass composition, and mechanical
and physical properties of glass. Fracture surface markings were discussed, including mirror,
mist or fine hackle, coarse hackle, and conchoidal or Wallner Lines. The relationship of stress
conditions to fracture surface properties was developed.
The subject was again approached in 1986 by Thornton and Cashman [15]. The principal
thrust of this work was to clarify the assumption and attitudes within the forensic science
community that the fracturing of glass centers around the tensile failure of the glass. Frequently
that was described as the “bending” of the glass, a holdover from Matwejeff. Thornton and
Cashman pointed out that while this is not conceptually incorrect, current developments within
the engineering community have shown that deflection of glass represents only one case of a
more universal phenomenon in which the tensile failure of glass does not necessarily involve
actual deflection. Tensile failure can result with either quasi-static or dynamic loading of the
glass. In quasi-static loading, tensile failure will be initiated at the weakest point. This weakest
point will be a so-called Griffith Crack. A Griffith crack is a hypothetical flaw, the sides of
which may be in optical contact with one another. With the conceptualization of a Griffith crack,
no actual deformation of the glass would be required before failure. (As developed by Thornton
and Cashman, dynamic loading will explain the “cratering” observed with moderate to high-
velocity projectile impact, an aspect of fracturing which is not relevant to the present work).
The interpretation of the physical aspects of glass was again reviewed by Thornton in
2001 [16]. Fracture-related surface features were discussed, but also the uniqueness of glass
This document is a research report submitted to the U.S. Department of Justice. This report has not been published by the Department. Opinions or points of view expressed are those of the author(s)
and do not necessarily reflect the official position or policies of the U.S. Department of Justice.
22
fracture was addressed. The rationale for the uniqueness of a glass fracture was summarized as
follows:
Glass is an amorphous solid, with no definite structure and with no favored
cleavage as determined by a crystalline lattice. A fracture is a rupture of atomic
bonds, but since the atoms in glass are arranged in no consistent order, the
fracture is therefore between atoms that are uniquely positioned in the glass. In
another sample of glass, the atoms will again be uniquely positioned, but there is
no mechanism advanced by chemical or physical phenomena that would suggest
that the positioning of the atoms in one sample would mimic the positioning in
another sample.
Other considerations of glass fracture have been addressed in the forensic literature, such
as thermal fractures and fractures resulting from the impact of high-velocity projectiles, or the
production of very small fragments of glass in a direction retrograde to the application of force,
that is, a “backward” cascade of very small particles if a window is broken. Tempered or
disannealed glass is entirely a separate area. With one exception, these issues are not relevant to
the present study and will not be discussed here. The one exception is that fractures, of whatever
sort, will not cross. A fracture that approaches another fracture will be immediately arrested and
will not extend beyond the first fracture. This is because the continuity of the material has been
disrupted by the first fracture, thus prohibiting the second fracture from continuing any further.
This has implication in establishing a temporal sequence to a series of fractures, but is also
relevant to the general appearance of a pattern of glass fractures.
Although glassy polymers are increasingly being used as glass substitutes, within the
forensic science discipline the fracture of glassy polymers has been investigated to a much lesser
This document is a research report submitted to the U.S. Department of Justice. This report has not been published by the Department. Opinions or points of view expressed are those of the author(s)
and do not necessarily reflect the official position or policies of the U.S. Department of Justice.
23
extent than glass. Rhodes and Thornton studied glassy polymers from the standpoint of high-
velocity impact, that is, projectile impact [17]. While high-velocity projectile impact is not
relevant to the present study with respect to glass, one observation developed in this study may
be relevant to glassy polymers. Rhodes and Thornton observed that pronounced, high curved
hackle marks may be observed on fracture surfaces. These have the potential of being mistaken
for conchoidal marks (Wallner Lines). If glass fracture considerations were projected onto the
glassy polymer fracture phenomena, a determination of the direction of force based on these
pseudo-conchoidal marks would be in error.
Katterwe [18] illustrates several examples of plastics and glass fractures and their
subsequent visual comparison. He describes a series of fractures on glass by using a Vickers
Hardness tester. The fractures were initiated using three different loads and were generated
under reproducible point sources. He was able to show that, under the same experimental
conditions, the fractures resulted in randomly distributed cracks: crack numbers, lengths,
propagations, directions, shapes, and orientations. However, the glass specimens he used were
microscope slides. The number of these samples was not specified in this paper but appear to be
at least 5 specimens. He stated that there is a close association between fracture origins and
surface flaws. These surface flaws are a result of the production process and are randomly
distributed from sample to sample. This random distribution of irregularities is the basis for the
randomly distributed cracks in the specimens. Sglavo [19] used cyclic loading with Vickers
indention on commercial soda-lime-silica glass bars to look at crack propagation and its
subsequent examination by fractography. He was able to correlate experimental results with
theoretical predictions. These predictions were obtained on the basis of indentation fracture
mechanics and a sub-critical crack propagation mechanism.
This document is a research report submitted to the U.S. Department of Justice. This report has not been published by the Department. Opinions or points of view expressed are those of the author(s)
and do not necessarily reflect the official position or policies of the U.S. Department of Justice.
24
Engineering Studies
From an engineering and materials science standpoint, the fracturing of glass has been the
subject of numerous studies. Conspicuous among these in terms of detail and appropriateness to
the issue of fracture uniqueness are those of Shinkai [20], Orr [21], Ropp [22], Mecholsky [23],
Kepple and Wasylyk [24], and Quinn [25]. It should be recognized, however, that the
engineering and materials science concerns are directed toward durability and manufacturing
considerations. While the fracturing of glass and the phenomena associated with it are important
concerns, the question of the uniqueness of fractures isn’t countenanced. Stated differently,
while engineers, material scientists, glass and ceramic chemists, and glass and polymer
manufacturers have actively pursued research into fracture mechanisms, they all have assumed
that fractures are unique and consequently have not directly addressed that issue. In a sense, they
have taken for granted that fractures are unique in the same manner that forensic scientists have
taken it for granted.
Engineering studies have developed considerable information that is germane to the
subject of glass fracture. Glass breaks under tension, not compression. (In somewhat imprecise
terms, but in terms that may be more meaningful to a lay jury or other users of forensic
information, when a piece of glass is pushed, it doesn’t break from the side that has been pushed,
but rather from the back side, which has been stretched. As stress is applied to the glass, the
tensile limit will invariably be reached before the compression limit. Glass may certainly break
under compression, but before it has an opportunity to do so, it has already broken under
tension).
Engineering studies have not in all respects resolved certain competing theories
concerning glass fracture. The Griffith Theory of fracture propagation [26] anticipates that a
This document is a research report submitted to the U.S. Department of Justice. This report has not been published by the Department. Opinions or points of view expressed are those of the author(s)
and do not necessarily reflect the official position or policies of the U.S. Department of Justice.
25
flaw or defect must be present before a fracture can be initiated. This defect may be so small as
to be undetected by any reasonable means. Griffith flaws are generally conceded to exist, but
evidence for them is largely indirect and their existence may be conceptual rather than actual.
Poncelet [27] has advanced a theory requiring only that the application of stress for a critical
amount of time. In the Poncelet Theory, there is a normal equilibrium rate of atomic bond
rupture and reformation. This rate is influenced by stress, and when the rate of bond rupture
exceeds the rate of bond formation, a fracture will be induced. There has not been an entirely
adequate resolution of these two theories, but both appear to have merit. In the practical
interpretation of glass fracture and fracture uniqueness, it is not essential that either of these
theories would need to be favored.
Features may be observed on the fracture edges that illustrate a relationship between
fracture behavior and the topology of the surface. These are mirror, mist, hackle, and Wallner
Lines. These are not chaotic, but have different characteristics that are capable of being
interpreted in terms of the fracture process. There is no universally accepted nomenclature, and
unfortunately there is some confusion in the engineering literature, where hackle is occasionally
seen as “striations,” and Wallner Lines as both “conchoidal marks” and “ripple”. An effort at
standardization is seen, however, in an ASTM Standard [28] on the subject of definitions related
to glass.
Mirror. Near the fracture origin, the propagation of the fracture is relatively slow. When
the fracture edge is observed, it will be flat and virtually featureless. This area may exist for only
a few millimeters with moderate impact, but for several centimeters with very low impact force.
Since the surface is flat and reflects light efficiently, it is termed mirror. Two pieces of glass of
the same thickness but from different fractures could conceivably be fitted together tightly, but
This document is a research report submitted to the U.S. Department of Justice. This report has not been published by the Department. Opinions or points of view expressed are those of the author(s)
and do not necessarily reflect the official position or policies of the U.S. Department of Justice.
26
only if a very small extent of the fracture were to be considered. Given the fact that mirror
operates over a very small domain, this is not a credible attack on the validity of a palpable
physical match.
Mist. As the fracture continues from the origin and picks up speed, the fracture tip
cannot dissipate the accumulated stress efficiently. As a consequence, the fracture edge will
increase its surface area in order to decrease its surface free energy. Very small cracks will
develop, but they are so small that even under magnification they are poorly resolved. Under
low magnification they appear as a “frosted” or “misty” area, and are termed “mist.” Although
mist areas do not provide much relief, there is not a definite relief aspect to the fracture edge.
The fracture edge now has a three dimensional character, and two pieces of glass of the same
thickness but from different fracture will not result in a palpable physical match.
Hackle. Hackle consists of rather coarse parallel marks, and the relief aspect is
significant. The processes leading to the formation of hackle are not altogether settled in the
engineering literature. It is unclear whether it is formed as a result of a further extension of the
phenomenon of reduction of surface free energy by an increase in surface area, or whether it is
formed on a fracture surface as a result of a localized realignment in an effort for the fracture
propagation to remain perpendicular to the tensile stress. In the consideration of the uniqueness
of glass fracture for forensic purposes, it isn’t necessary to chose between these competing
explanations. Hackle in which a particular mark extends outward from the fracture surface must
have a complementary area of depression in its fracture mate. Stated differently, wherever there
is a “zig” on one piece, there must be a “zag” in the other. Consequently, when hackle exists, it
contributes significantly to a palpable physical match.
This document is a research report submitted to the U.S. Department of Justice. This report has not been published by the Department. Opinions or points of view expressed are those of the author(s)
and do not necessarily reflect the official position or policies of the U.S. Department of Justice.

27
Wallner Lines. The conchoidal lines which are referred to in the engineering literature as
Wallner Lines are the most conspicuous of all fracture edge markings. The relief aspect of these
lines is considerable, and certainly greater than the fracture markings previously described. As
with hackle, an area on one fracture surface that extended away from the fracture margin would
required a complementary retreat from the fracture surface on its fracture mate.
The significance of these fracture surface markings is that a fracture is not solely a two-
dimensional affair, (although that is the principal focus of the present study). A broken piece of
glass may have an exclusive pattern of fracture, with irregular contours and an inimitable
arrangement of radial and concentric fracture. But in glass of any appreciable thickness, it will
also have a three-dimensional aspect which may be exploited to determine if two pieces had at
one time been joined. Both considerations are significant in the assessment of fracture
uniqueness.
Statement of hypothesis
In this research, it is hypothesized that every fracture forms a unique and non-
reproducible fracture pattern. Alternately, it may be that some fracture patterns may be
reproduced from time to time. If it is found that each fracture forms a unique and non-
reproducible fracture pattern, then this finding will support the theory that coincidental
duplication of fracture patterns cannot be attained. However, if duplicate fracture patterns are
found, this would falsify the null hypothesis and show that some fracture patterns may be
reproduced from time to time.
This document is a research report submitted to the U.S. Department of Justice. This report has not been published by the Department. Opinions or points of view expressed are those of the author(s)
and do not necessarily reflect the official position or policies of the U.S. Department of Justice.

28
Materials and Methods
The materials used in this study were 60 panes of double strength glass, 60 glass bottles,
and 60 polymer tail light lenses. Double strength glass is 1/8" thick, whereas single strength
glass is 3/16” thick. The glass panes were 1/8" thick and cut into 8" x 8" sections from a single
sheet of double strength glass, in order to maintain uniformity of the glass and were numbered as
to their location on the original sheet. The glass wine bottles were 750 ml clear, flint glass
bottles donated by the Gallo Wine Bottling Company in Modesto, CA. These bottles were
manufactured in a two-step molding process and were taken from the line of a single day's work
to ensure that the bottles were all manufactured from the same batch of glass. The molding
process began by melting the glass along with recycled cullet in the furnace. The molten glass
was then extracted from the bottom of the furnace as a molten glob and taken up by the assembly
line to fill the bottle mold. Air was blown into the molten glob to form the head, neck, and
shoulder of the bottle. The mold was then inverted and air was blown in to form the rest of the
bottle. The inversion of the mold caused some of the molten glass to settle toward the base of
the bottle. This is known as the "settle wave" and the glass here is usually thicker and looks
slightly distorted.
For the polymer tail light lenses, we used Bargman from CequentTM Electrical Products. They
were composed of an acrylonitrile butadiene styrene (ABS) plastic and amber in color with part
number 34-84-016.
Fractures were initiated using two methods: dynamic impact and static pressure. The materials
used for the dynamic impact method included a custom built fracture device with an adjustable
top to accommodate both the glass panes and bottles (Fig.1). This device sat at the bottom of a
12' polycarbonate tube which acted as a guide for the dropping weight. The dropping weight
This document is a research report submitted to the U.S. Department of Justice. This report has not been published by the Department. Opinions or points of view expressed are those of the author(s)
and do not necessarily reflect the official position or policies of the U.S. Department of Justice.
29
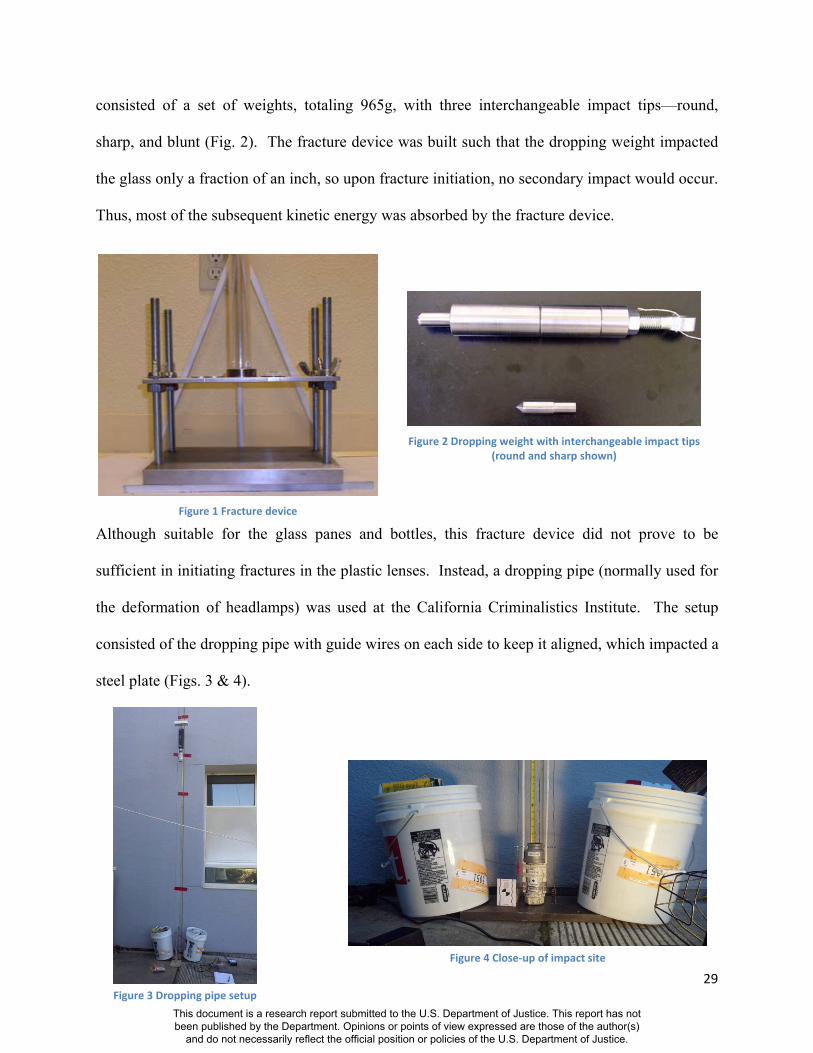
consisted of a set of weights, totaling 965g, with three interchangeable impact tips—round,
sharp, and blunt (Fig. 2). The fracture device was built such that the dropping weight impacted
the glass only a fraction of an inch, so upon fracture initiation, no secondary impact would occur.
Thus, most of the subsequent kinetic energy was absorbed by the fracture device.
Although suitable for the glass panes and bottles, this fracture device did not prove to be
sufficient in initiating fractures in the plastic lenses. Instead, a dropping pipe (normally used for
the deformation of headlamps) was used at the California Criminalistics Institute. The setup
consisted of the dropping pipe with guide wires on each side to keep it aligned, which impacted a
steel plate (Figs. 3 & 4).
Figure 1 Fracture device
Figure 2 Dropping weight with interchangeable impact tips (round and sharp shown)
Figure 3 Dropping pipe setup
Figure 4 Close‐up of impact site
This document is a research report submitted to the U.S. Department of Justice. This report has not been published by the Department. Opinions or points of view expressed are those of the author(s)
and do not necessarily reflect the official position or policies of the U.S. Department of Justice.
30
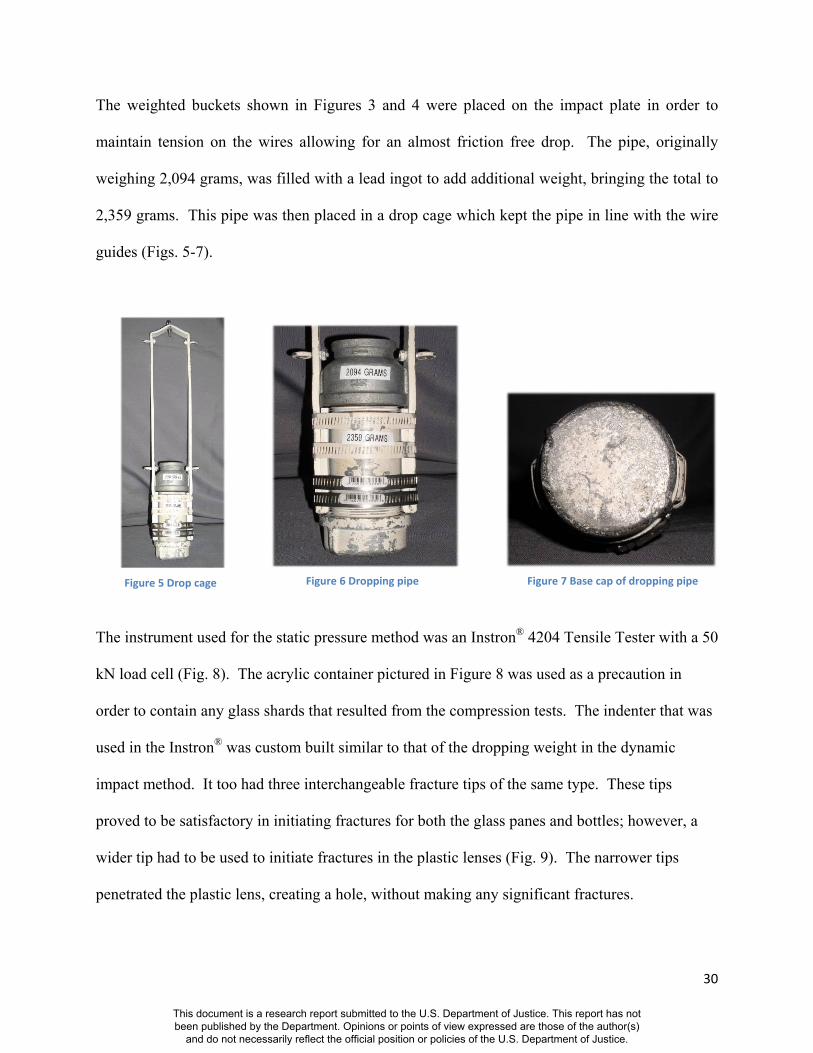
The weighted buckets shown in Figures 3 and 4 were placed on the impact plate in order to
maintain tension on the wires allowing for an almost friction free drop. The pipe, originally
weighing 2,094 grams, was filled with a lead ingot to add additional weight, bringing the total to
2,359 grams. This pipe was then placed in a drop cage which kept the pipe in line with the wire
guides (Figs. 5-7).
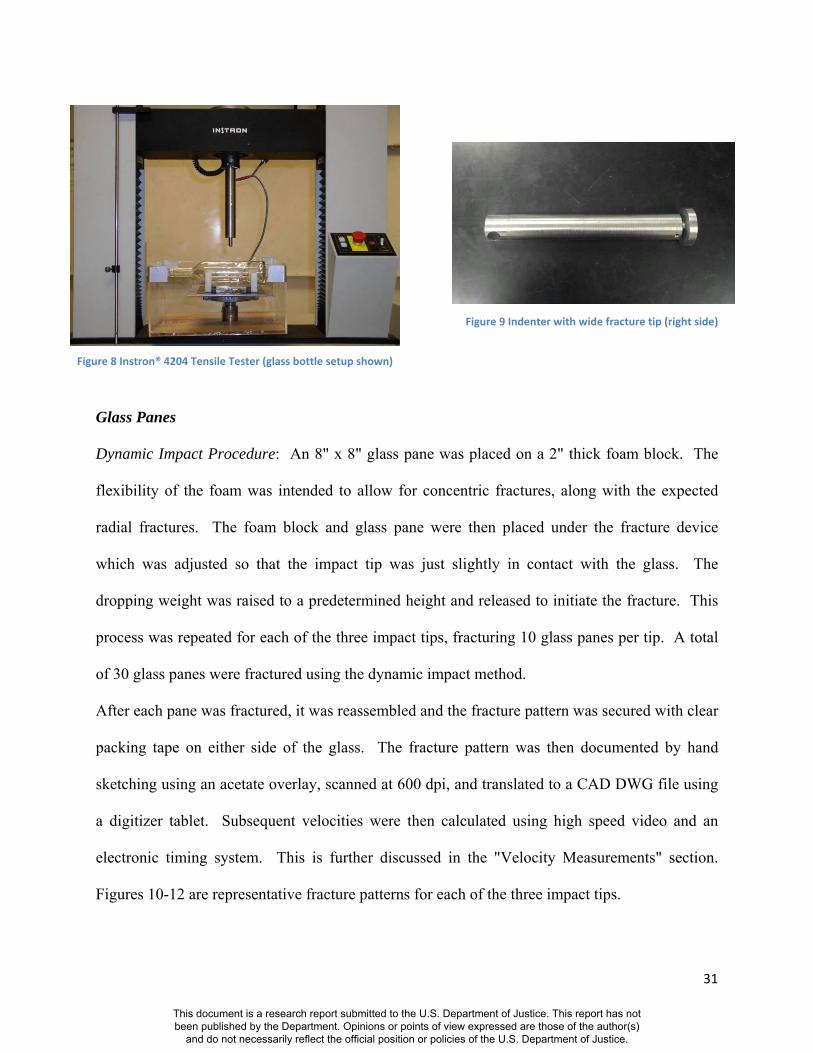
The instrument used for the static pressure method was an Instron® 4204 Tensile Tester with a 50
kN load cell (Fig. 8). The acrylic container pictured in Figure 8 was used as a precaution in
order to contain any glass shards that resulted from the compression tests. The indenter that was
used in the Instron® was custom built similar to that of the dropping weight in the dynamic
impact method. It too had three interchangeable fracture tips of the same type. These tips
proved to be satisfactory in initiating fractures for both the glass panes and bottles; however, a
wider tip had to be used to initiate fractures in the plastic lenses (Fig. 9). The narrower tips
penetrated the plastic lens, creating a hole, without making any significant fractures.
Figure 5 Drop cage Figure 6 Dropping pipe Figure 7 Base cap of dropping pipe
This document is a research report submitted to the U.S. Department of Justice. This report has not been published by the Department. Opinions or points of view expressed are those of the author(s)
and do not necessarily reflect the official position or policies of the U.S. Department of Justice.
31
Glass Panes
Dynamic Impact Procedure: An 8" x 8" glass pane was placed on a 2" thick foam block. The
flexibility of the foam was intended to allow for concentric fractures, along with the expected
radial fractures. The foam block and glass pane were then placed under the fracture device
which was adjusted so that the impact tip was just slightly in contact with the glass. The
dropping weight was raised to a predetermined height and released to initiate the fracture. This
process was repeated for each of the three impact tips, fracturing 10 glass panes per tip. A total
of 30 glass panes were fractured using the dynamic impact method.
After each pane was fractured, it was reassembled and the fracture pattern was secured with clear
packing tape on either side of the glass. The fracture pattern was then documented by hand
sketching using an acetate overlay, scanned at 600 dpi, and translated to a CAD DWG file using
a digitizer tablet. Subsequent velocities were then calculated using high speed video and an
electronic timing system. This is further discussed in the "Velocity Measurements" section.
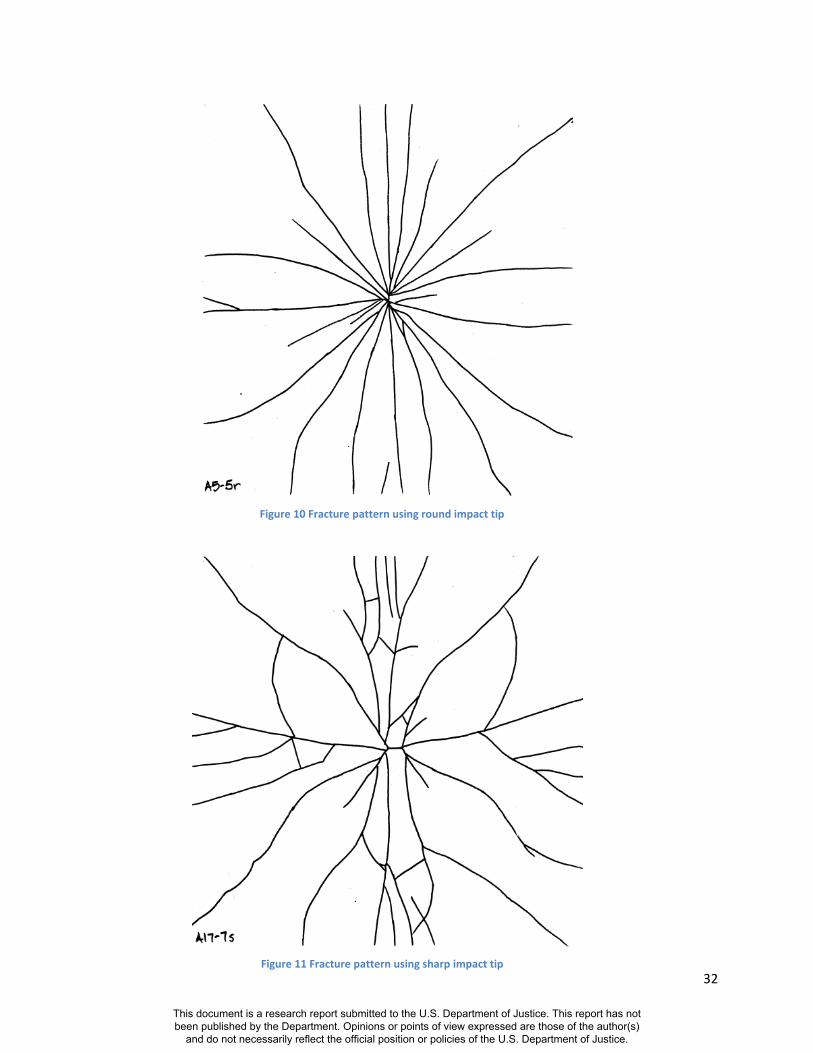
Figures 10-12 are representative fracture patterns for each of the three impact tips.
Figure 9 Indenter with wide fracture tip (right side)
Figure 8 Instron® 4204 Tensile Tester (glass bottle setup shown)
This document is a research report submitted to the U.S. Department of Justice. This report has not been published by the Department. Opinions or points of view expressed are those of the author(s)
and do not necessarily reflect the official position or policies of the U.S. Department of Justice.
32
Figure 10 Fracture pattern using round impact tip
Figure 11 Fracture pattern using sharp impact tip
This document is a research report submitted to the U.S. Department of Justice. This report has not been published by the Department. Opinions or points of view expressed are those of the author(s)
and do not necessarily reflect the official position or policies of the U.S. Department of Justice.

33
Static Pressure Procedure: An 8" x 8" glass pane was placed in a wood frame. The foam block
was not used for these experiments because it did not prove to be suitable and did not work with
the Instron® tester. The wood frame, however, allowed for the flexibility necessary to obtain
concentric fractures along with the expected radial fractures. Once the glass pane was placed in
the frame, it was placed under the indenter of the Instron®. An acrylic container was placed
around the glass to ensure that any shards were safely collected. The indenter crosshead speed
was set to 10 mm/min and would automatically stop compression when the fracture occurred.
As the indenter began to apply compression to the glass pane, the Instron® software recorded
load versus extension. Once the initial fracture occurred, the indenter stopped and the software
produced a load profile of the fracture. This process was repeated for each of the three fracture
Figure 12 Fracture pattern using blunt impact tip
This document is a research report submitted to the U.S. Department of Justice. This report has not been published by the Department. Opinions or points of view expressed are those of the author(s)
and do not necessarily reflect the official position or policies of the U.S. Department of Justice.
34
tips, fracturing 10 glass panes per tip. A total of 30 glass panes were fractured using the static
pressure method.
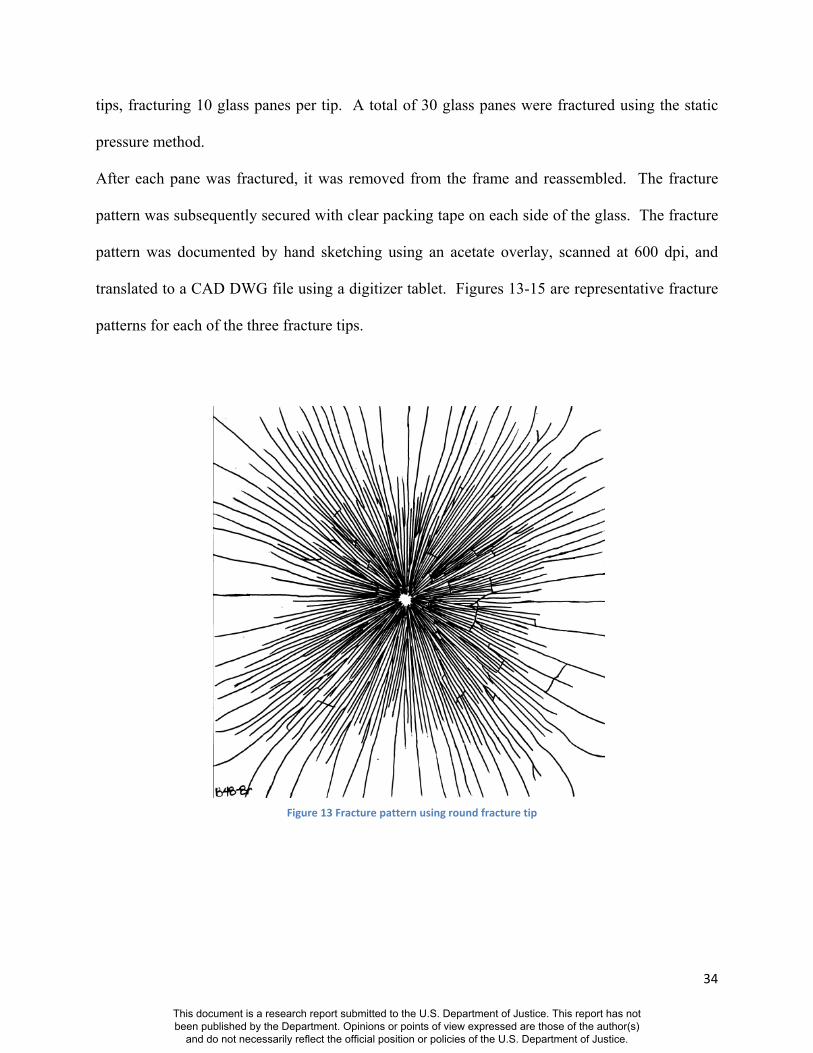
After each pane was fractured, it was removed from the frame and reassembled. The fracture
pattern was subsequently secured with clear packing tape on each side of the glass. The fracture
pattern was documented by hand sketching using an acetate overlay, scanned at 600 dpi, and
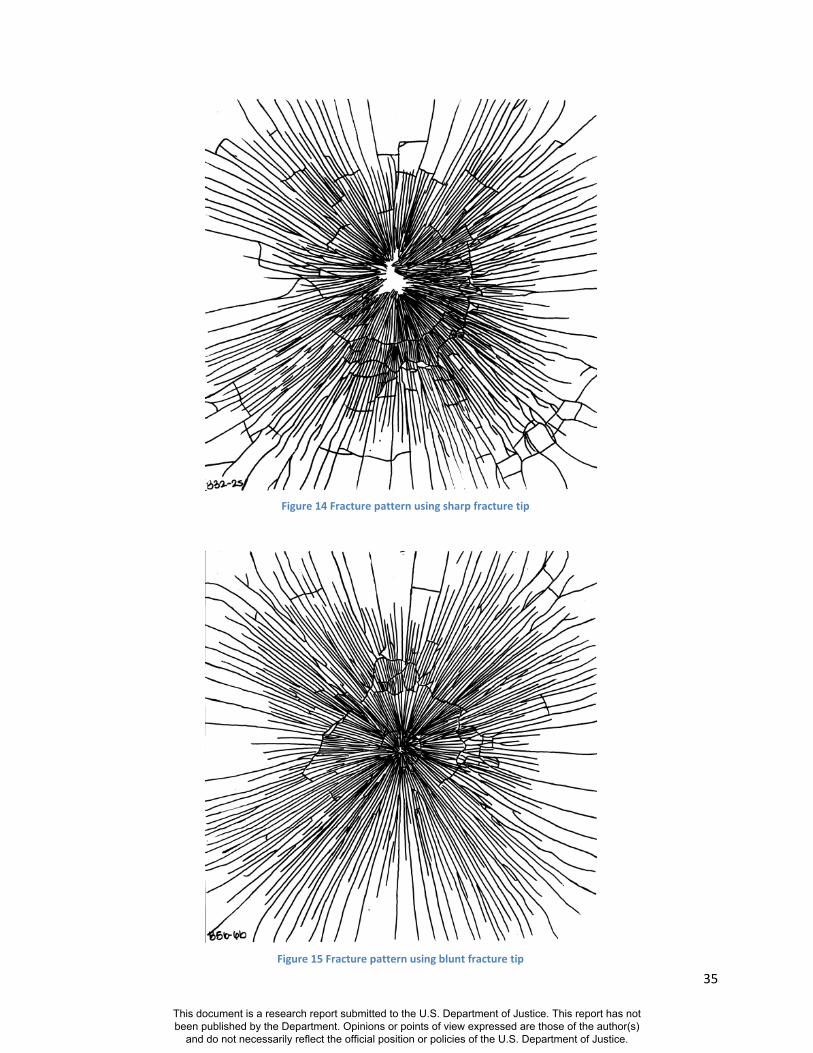
translated to a CAD DWG file using a digitizer tablet. Figures 13-15 are representative fracture
patterns for each of the three fracture tips.
Figure 13 Fracture pattern using round fracture tip
This document is a research report submitted to the U.S. Department of Justice. This report has not been published by the Department. Opinions or points of view expressed are those of the author(s)
and do not necessarily reflect the official position or policies of the U.S. Department of Justice.
35
Figure 14 Fracture pattern using sharp fracture tip
Figure 15 Fracture pattern using blunt fracture tip
This document is a research report submitted to the U.S. Department of Justice. This report has not been published by the Department. Opinions or points of view expressed are those of the author(s)
and do not necessarily reflect the official position or policies of the U.S. Department of Justice.
36
Glass Bottles
Dynamic Impact Procedure: Each glass bottle was internally coated with RTV Urethane and
allowed to set overnight. This coating was flexible enough that it did not impede the fracture,
yet strong enough that it retained the shape and fracture pattern of the bottle. Once the urethane
had set, the bottle was placed in a custom built bottle cradle that prevented the bottle from
shifting as the bottle was impacted. The bottle was initially placed in the cradle such that the
seam was at the 12 o'clock position. Here, the impact tip was lined up so that it just slightly
contacted the glass. Subsequently, the bottle was rotated 90° so that the seams were at the 3 and
9 o'clock positions. The dropping weight was raised to a predetermined height and released to
initiate the fracture. This process was repeated for each of the three impact tips, fracturing 10
glass bottles per tip. A total of 30 glass bottles was fractured using the dynamic impact method.
After each bottle was fractured, the fracture pattern was secured with clear packing tape. The
fracture pattern was then documented by hand sketching using an acetate overlay. Due to the
shape of the specimen, it did not lend itself to documentation by scanning or translating to CAD
files. Subsequent velocities were then calculated using high speed video and an electronic
timing system. This is further discussed in the "Velocity Measurements" section. Figures 16-18
are representative fracture patterns for each of the three impact tips.
This document is a research report submitted to the U.S. Department of Justice. This report has not been published by the Department. Opinions or points of view expressed are those of the author(s)
and do not necessarily reflect the official position or policies of the U.S. Department of Justice.

37
Figure 16 Fracture pattern using round impact tip
Figure 17 Fracture pattern using sharp impact tip
This document is a research report submitted to the U.S. Department of Justice. This report has not been published by the Department. Opinions or points of view expressed are those of the author(s)
and do not necessarily reflect the official position or policies of the U.S. Department of Justice.
38
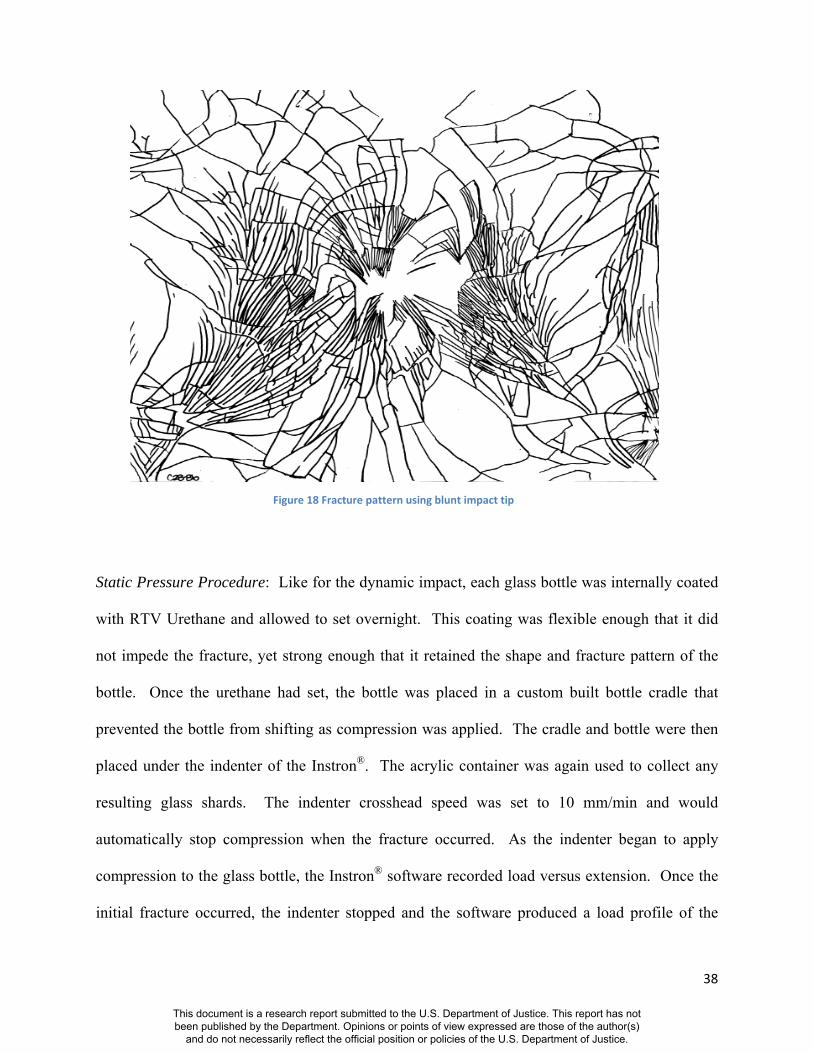
Static Pressure Procedure: Like for the dynamic impact, each glass bottle was internally coated
with RTV Urethane and allowed to set overnight. This coating was flexible enough that it did
not impede the fracture, yet strong enough that it retained the shape and fracture pattern of the
bottle. Once the urethane had set, the bottle was placed in a custom built bottle cradle that
prevented the bottle from shifting as compression was applied. The cradle and bottle were then
placed under the indenter of the Instron®. The acrylic container was again used to collect any
resulting glass shards. The indenter crosshead speed was set to 10 mm/min and would
automatically stop compression when the fracture occurred. As the indenter began to apply
compression to the glass bottle, the Instron® software recorded load versus extension. Once the
initial fracture occurred, the indenter stopped and the software produced a load profile of the
Figure 18 Fracture pattern using blunt impact tip
This document is a research report submitted to the U.S. Department of Justice. This report has not been published by the Department. Opinions or points of view expressed are those of the author(s)
and do not necessarily reflect the official position or policies of the U.S. Department of Justice.
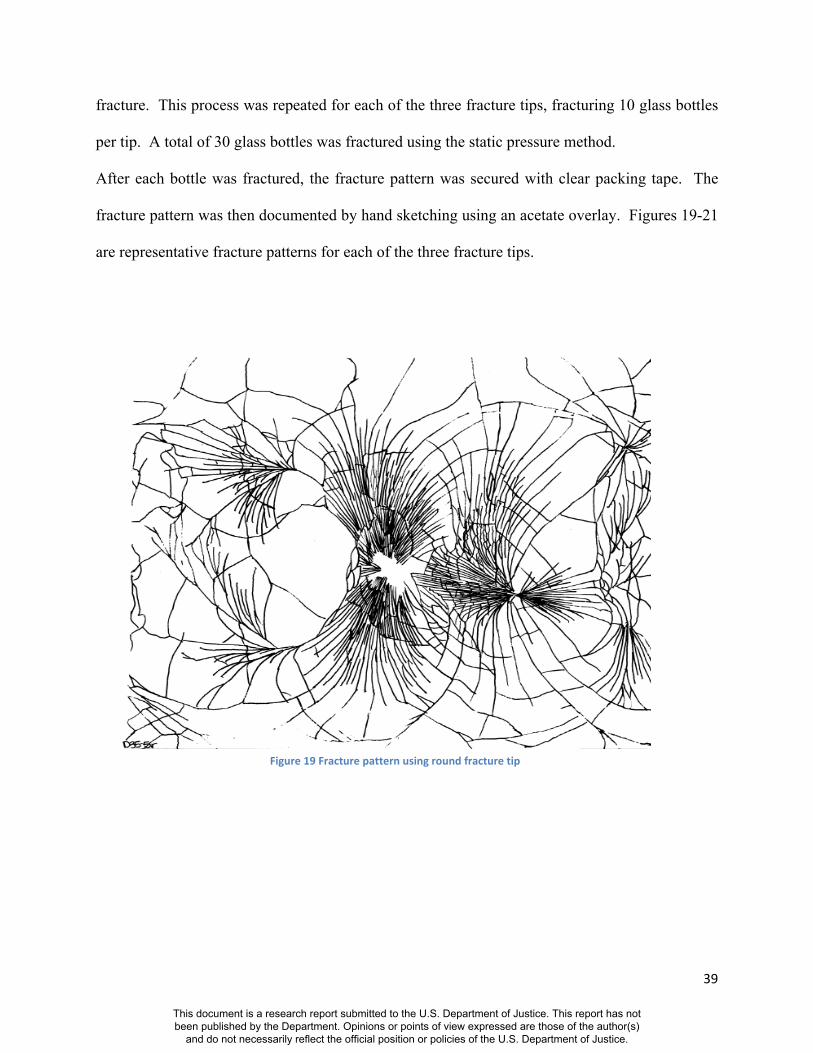
39
fracture. This process was repeated for each of the three fracture tips, fracturing 10 glass bottles
per tip. A total of 30 glass bottles was fractured using the static pressure method.
After each bottle was fractured, the fracture pattern was secured with clear packing tape. The
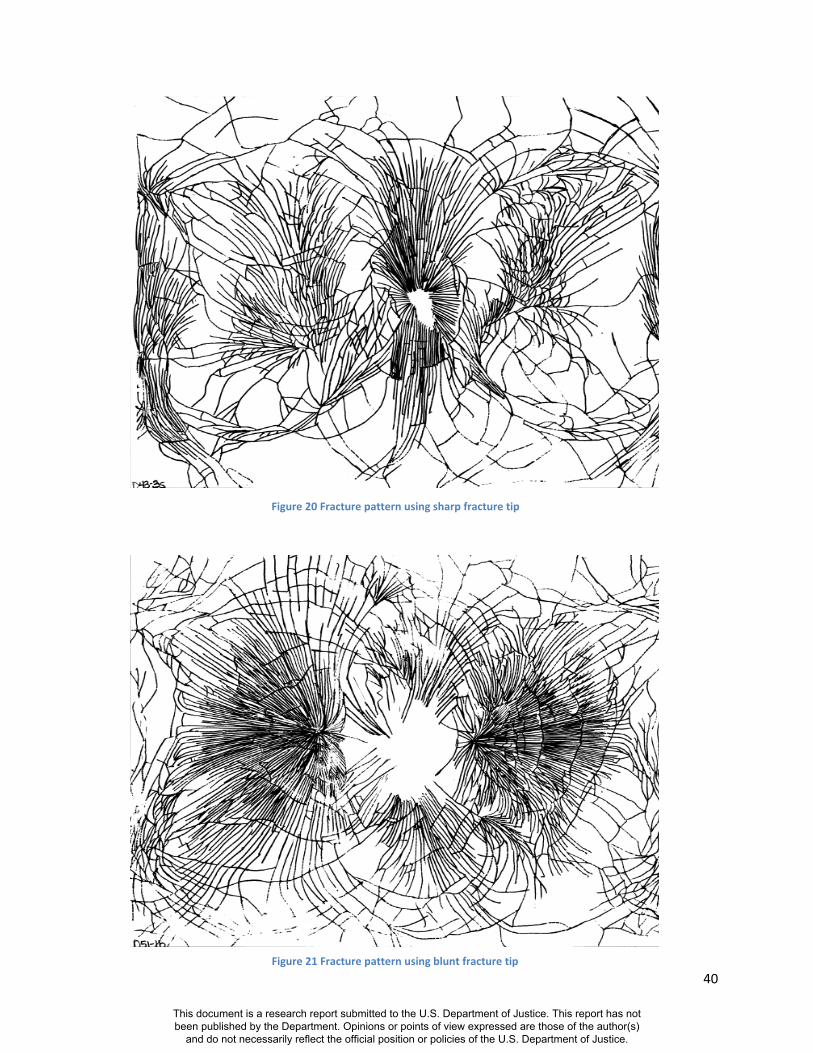
fracture pattern was then documented by hand sketching using an acetate overlay. Figures 19-21
are representative fracture patterns for each of the three fracture tips.
Figure 19 Fracture pattern using round fracture tip
This document is a research report submitted to the U.S. Department of Justice. This report has not been published by the Department. Opinions or points of view expressed are those of the author(s)
and do not necessarily reflect the official position or policies of the U.S. Department of Justice.
40
Figure 20 Fracture pattern using sharp fracture tip
Figure 21 Fracture pattern using blunt fracture tip
This document is a research report submitted to the U.S. Department of Justice. This report has not been published by the Department. Opinions or points of view expressed are those of the author(s)
and do not necessarily reflect the official position or policies of the U.S. Department of Justice.
41
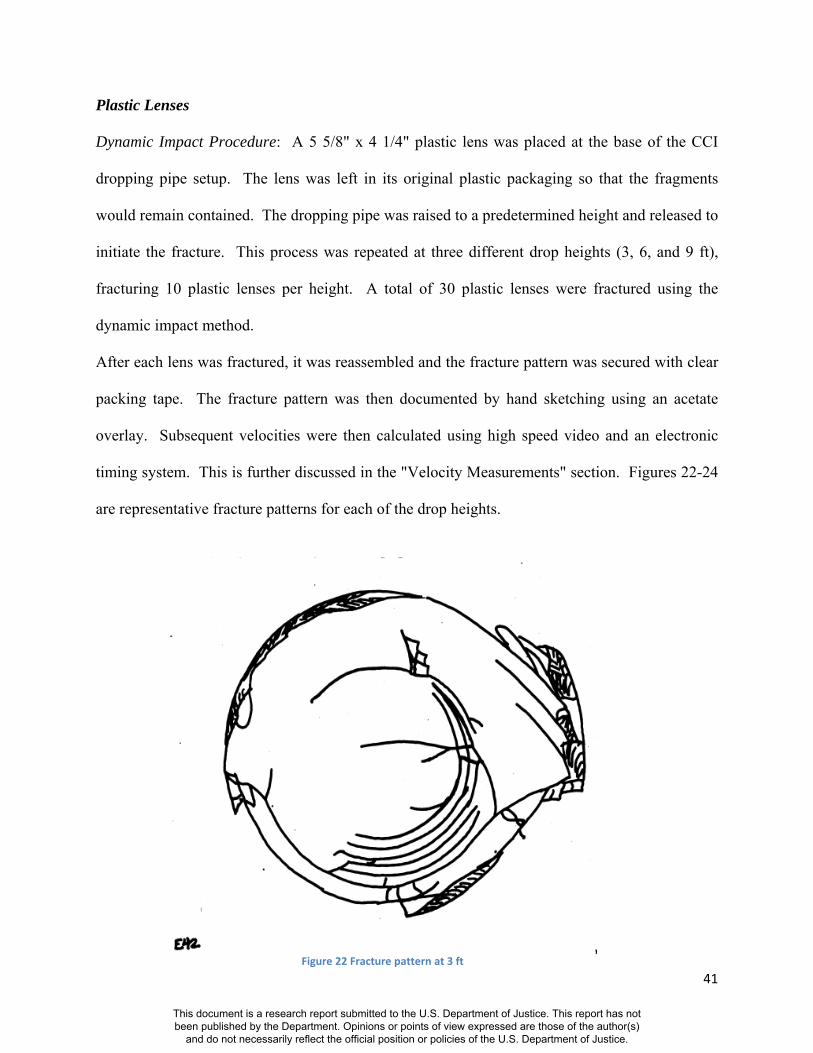
Plastic Lenses
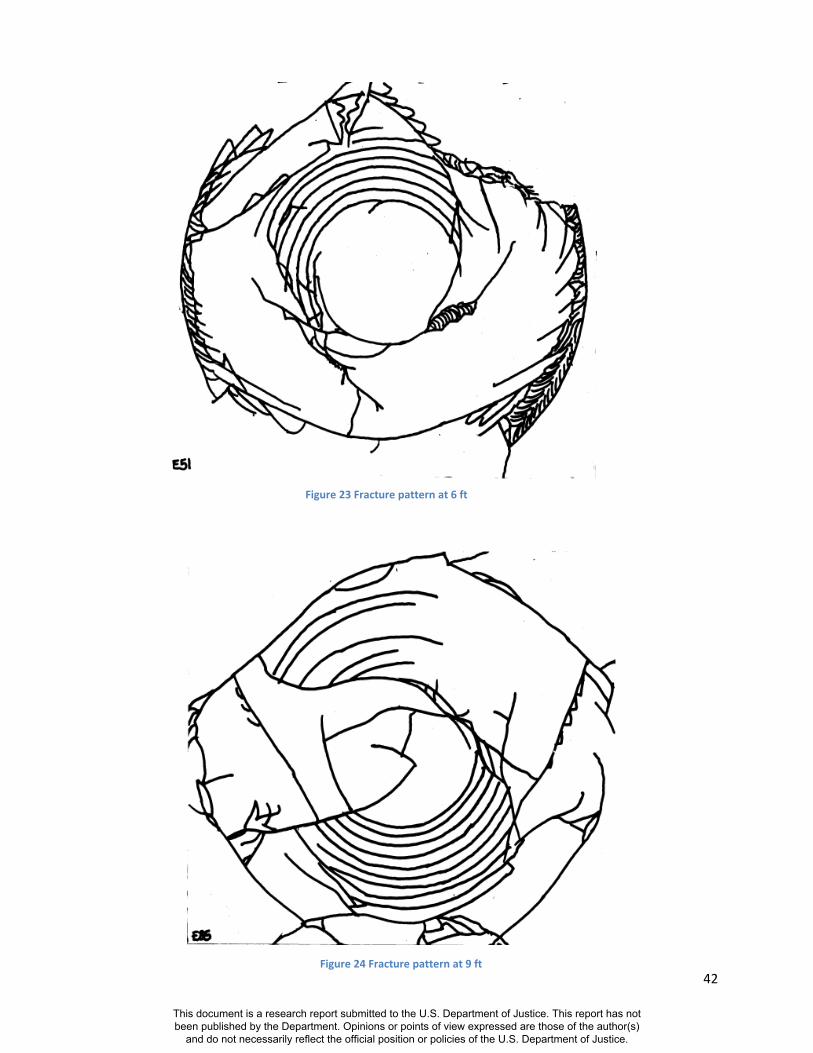
Dynamic Impact Procedure: A 5 5/8" x 4 1/4" plastic lens was placed at the base of the CCI
dropping pipe setup. The lens was left in its original plastic packaging so that the fragments
would remain contained. The dropping pipe was raised to a predetermined height and released to
initiate the fracture. This process was repeated at three different drop heights (3, 6, and 9 ft),
fracturing 10 plastic lenses per height. A total of 30 plastic lenses were fractured using the
dynamic impact method.
After each lens was fractured, it was reassembled and the fracture pattern was secured with clear
packing tape. The fracture pattern was then documented by hand sketching using an acetate
overlay. Subsequent velocities were then calculated using high speed video and an electronic
timing system. This is further discussed in the "Velocity Measurements" section. Figures 22-24
are representative fracture patterns for each of the drop heights.
Figure 22 Fracture pattern at 3 ft
This document is a research report submitted to the U.S. Department of Justice. This report has not been published by the Department. Opinions or points of view expressed are those of the author(s)
and do not necessarily reflect the official position or policies of the U.S. Department of Justice.
42
Figure 23 Fracture pattern at 6 ft
Figure 24 Fracture pattern at 9 ft
This document is a research report submitted to the U.S. Department of Justice. This report has not been published by the Department. Opinions or points of view expressed are those of the author(s)
and do not necessarily reflect the official position or policies of the U.S. Department of Justice.
43
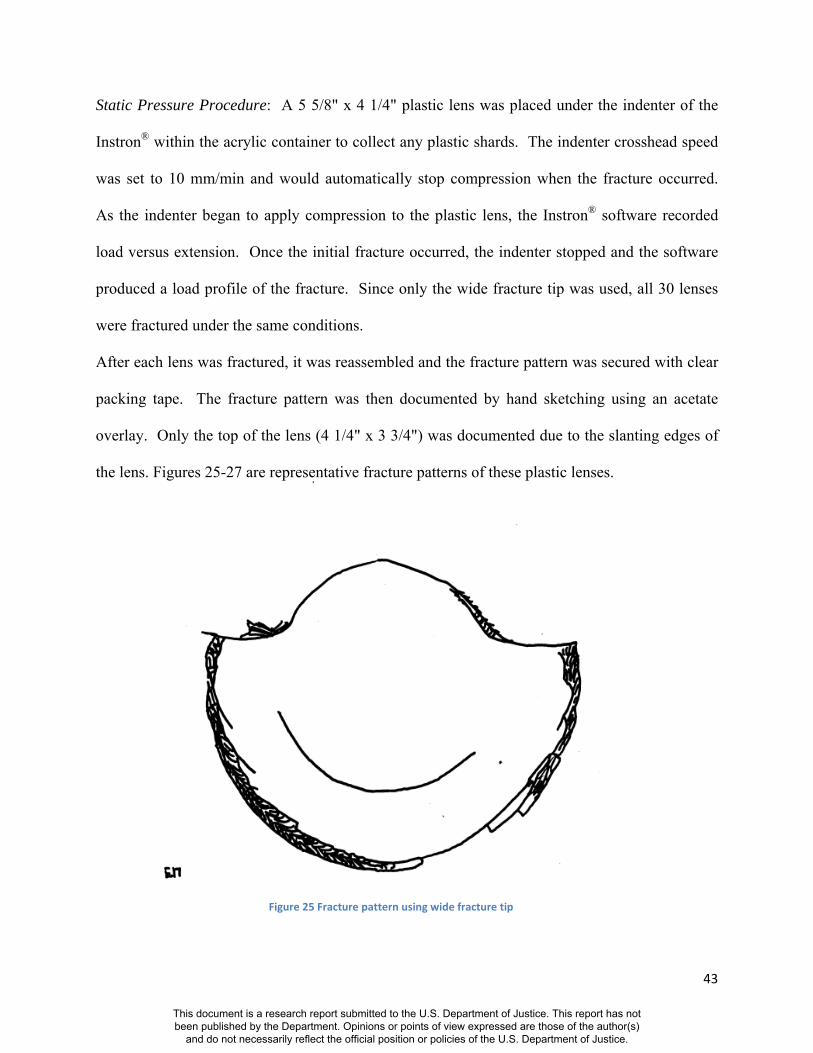
Static Pressure Procedure: A 5 5/8" x 4 1/4" plastic lens was placed under the indenter of the
Instron® within the acrylic container to collect any plastic shards. The indenter crosshead speed
was set to 10 mm/min and would automatically stop compression when the fracture occurred.
As the indenter began to apply compression to the plastic lens, the Instron® software recorded
load versus extension. Once the initial fracture occurred, the indenter stopped and the software
produced a load profile of the fracture. Since only the wide fracture tip was used, all 30 lenses
were fractured under the same conditions.
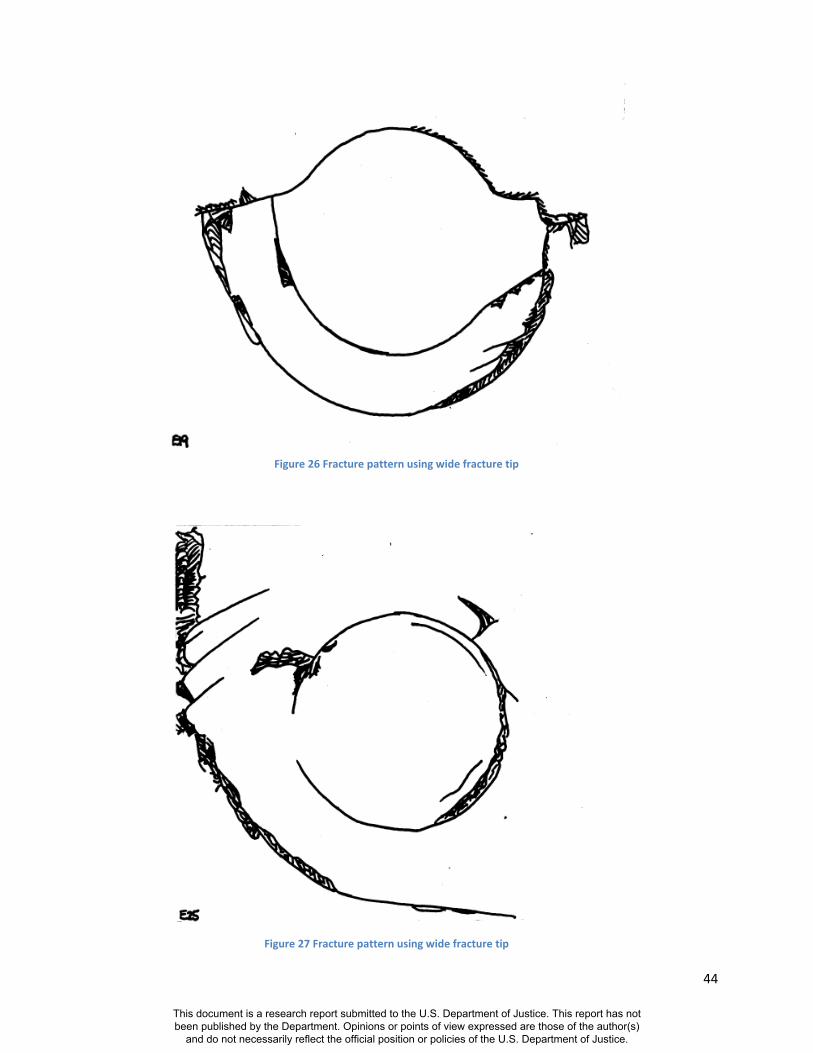
After each lens was fractured, it was reassembled and the fracture pattern was secured with clear
packing tape. The fracture pattern was then documented by hand sketching using an acetate
overlay. Only the top of the lens (4 1/4" x 3 3/4") was documented due to the slanting edges of
the lens. Figures 25-27 are representative fracture patterns of these plastic lenses.
Figure 25 Fracture pattern using wide fracture tip
This document is a research report submitted to the U.S. Department of Justice. This report has not been published by the Department. Opinions or points of view expressed are those of the author(s)
and do not necessarily reflect the official position or policies of the U.S. Department of Justice.
44
Figure 26 Fracture pattern using wide fracture tip
Figure 27 Fracture pattern using wide fracture tip
This document is a research report submitted to the U.S. Department of Justice. This report has not been published by the Department. Opinions or points of view expressed are those of the author(s)
and do not necessarily reflect the official position or policies of the U.S. Department of Justice.
45
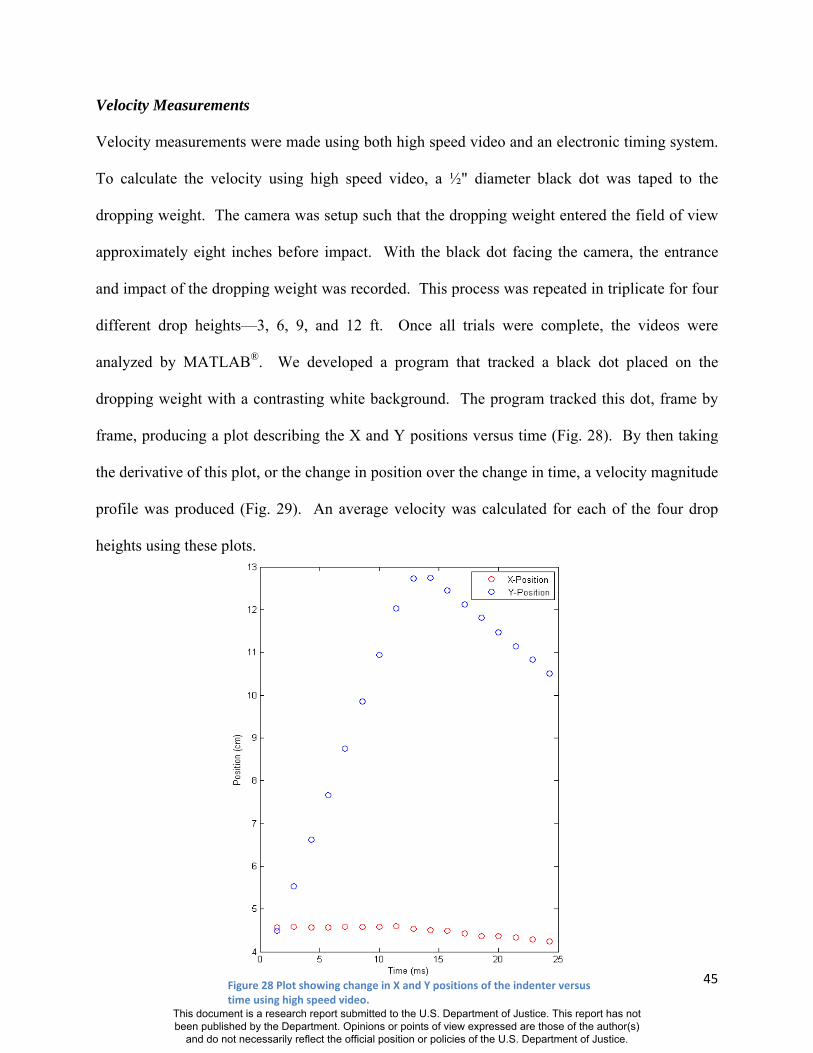
Velocity Measurements
Velocity measurements were made using both high speed video and an electronic timing system.
To calculate the velocity using high speed video, a ½" diameter black dot was taped to the
dropping weight. The camera was setup such that the dropping weight entered the field of view
approximately eight inches before impact. With the black dot facing the camera, the entrance
and impact of the dropping weight was recorded. This process was repeated in triplicate for four
different drop heights—3, 6, 9, and 12 ft. Once all trials were complete, the videos were
analyzed by MATLAB®. We developed a program that tracked a black dot placed on the
dropping weight with a contrasting white background. The program tracked this dot, frame by
frame, producing a plot describing the X and Y positions versus time (Fig. 28). By then taking
the derivative of this plot, or the change in position over the change in time, a velocity magnitude
profile was produced (Fig. 29). An average velocity was calculated for each of the four drop
heights using these plots.
Figure 28 Plot showing change in X and Y positions of the indenter versus time using high speed video.
This document is a research report submitted to the U.S. Department of Justice. This report has not been published by the Department. Opinions or points of view expressed are those of the author(s)
and do not necessarily reflect the official position or policies of the U.S. Department of Justice.
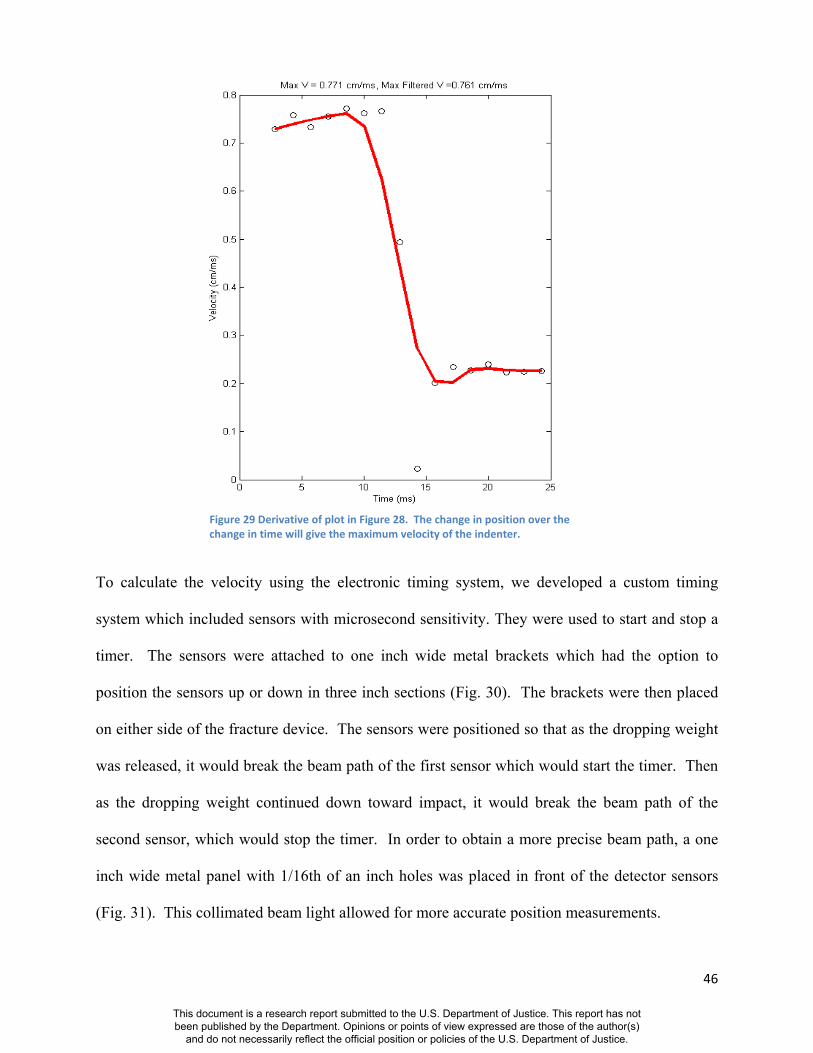
46
To calculate the velocity using the electronic timing system, we developed a custom timing
system which included sensors with microsecond sensitivity. They were used to start and stop a
timer. The sensors were attached to one inch wide metal brackets which had the option to
position the sensors up or down in three inch sections (Fig. 30). The brackets were then placed
on either side of the fracture device. The sensors were positioned so that as the dropping weight
was released, it would break the beam path of the first sensor which would start the timer. Then
as the dropping weight continued down toward impact, it would break the beam path of the
second sensor, which would stop the timer. In order to obtain a more precise beam path, a one
inch wide metal panel with 1/16th of an inch holes was placed in front of the detector sensors
(Fig. 31). This collimated beam light allowed for more accurate position measurements.
Figure 29 Derivative of plot in Figure 28. The change in position over the change in time will give the maximum velocity of the indenter.
This document is a research report submitted to the U.S. Department of Justice. This report has not been published by the Department. Opinions or points of view expressed are those of the author(s)
and do not necessarily reflect the official position or policies of the U.S. Department of Justice.
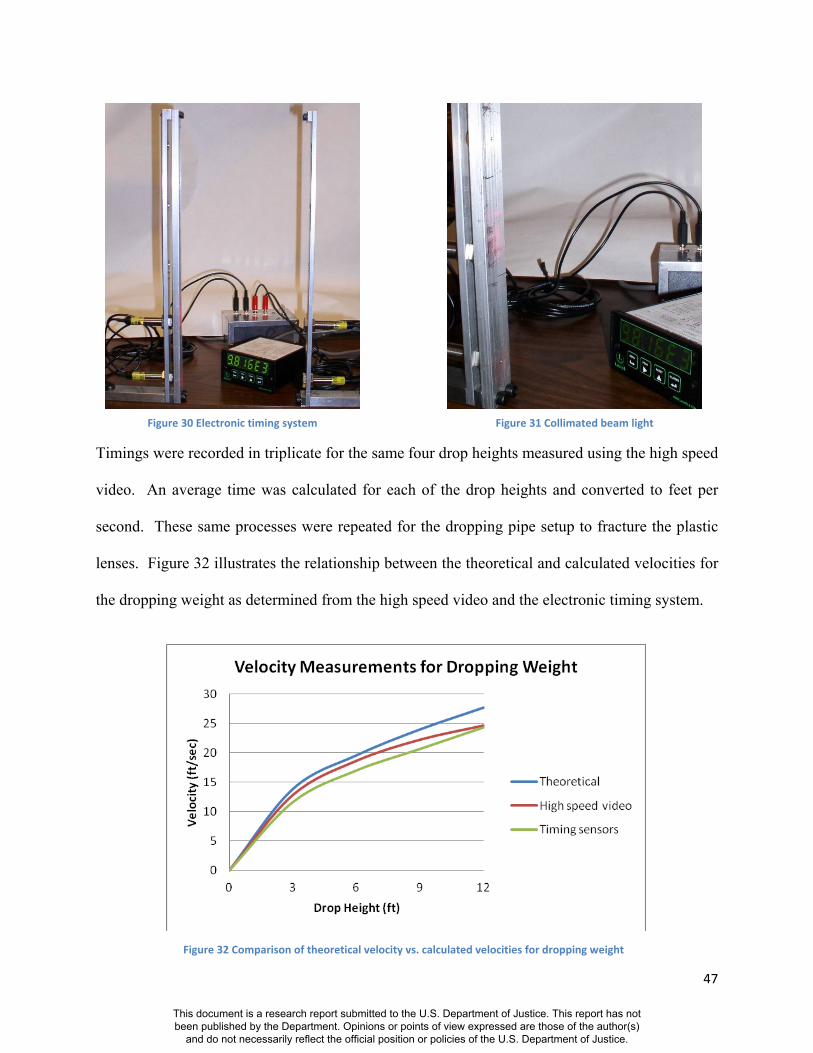
47
Timings were recorded in triplicate for the same four drop heights measured using the high speed
video. An average time was calculated for each of the drop heights and converted to feet per
second. These same processes were repeated for the dropping pipe setup to fracture the plastic
lenses. Figure 32 illustrates the relationship between the theoretical and calculated velocities for
the dropping weight as determined from the high speed video and the electronic timing system.
Figure 32 Comparison of theoretical velocity vs. calculated velocities
Figure 30 Electronic timing system Figure 31 Collimated beam light
Figure 32 Comparison of theoretical velocity vs. calculated velocities for dropping weight
This document is a research report submitted to the U.S. Department of Justice. This report has not been published by the Department. Opinions or points of view expressed are those of the author(s)
and do not necessarily reflect the official position or policies of the U.S. Department of Justice.

48
As can be seen in Figure 32, there is a divergence from the theoretical. This is due to the fact
that theoretical velocity values assume a vacuum, but the high speed video and timing sensor
trials were completed in a closed system. The dropping weight was inside a tube, which caused
a partial compressing of air, causing the values to diverge slightly. However, this was still a
reasonable estimation of the force required to initiate the fracture.
Figure 33 illustrates the relationship between the theoretical and calculated velocities for the
dropping pipe as determined from the high speed video and the electronic timing system.
Figure 33 Comparison of theoretical velocity vs. calculated velocities for dropping pipe
As can be seen in Figure 33, there is a divergence from the theoretical. This is due to the fact
that theoretical velocity values assume a vacuum, but the high speed video and timing sensor
trials were completed using guide wires with minimal friction. As the dropping pipe traveled
down these guide wires, some friction was produced causing the values to diverge slightly.
However, this was still a reasonable estimation of the force required to initiate the fracture.
This document is a research report submitted to the U.S. Department of Justice. This report has not been published by the Department. Opinions or points of view expressed are those of the author(s)
and do not necessarily reflect the official position or policies of the U.S. Department of Justice.

49
Figure 34 illustrates the relationship between the kinetic energy and the velocity of the dropping
pipe. Not all of the kinetic energy was transferred to the fracture. This was a partial elastic
collision because the pipe did rebound after impact.
Figure 34 Kinetic energy vs. velocity of dropping pipe
Inter-Comparison of Fracture Patterns
Once all the fracture experiments were complete, each fracture pattern was compared to that of
every other fracture pattern within its category (pane, bottle, or lens). This was done by
sketching each pattern using an acetate overlay then overlaying one fracture pattern on top of
another, in the same orientation for a one-to-one comparison (Fig. 35) for all 60 patterns. For
example, fracture pattern 1 for the glass panes was compared to fracture patterns 2-60,
individually. Fracture pattern 2 was then compared to patterns 3-60, individually until
comparisons were completed for all 60 patterns.
This document is a research report submitted to the U.S. Department of Justice. This report has not been published by the Department. Opinions or points of view expressed are those of the author(s)
and do not necessarily reflect the official position or policies of the U.S. Department of Justice.
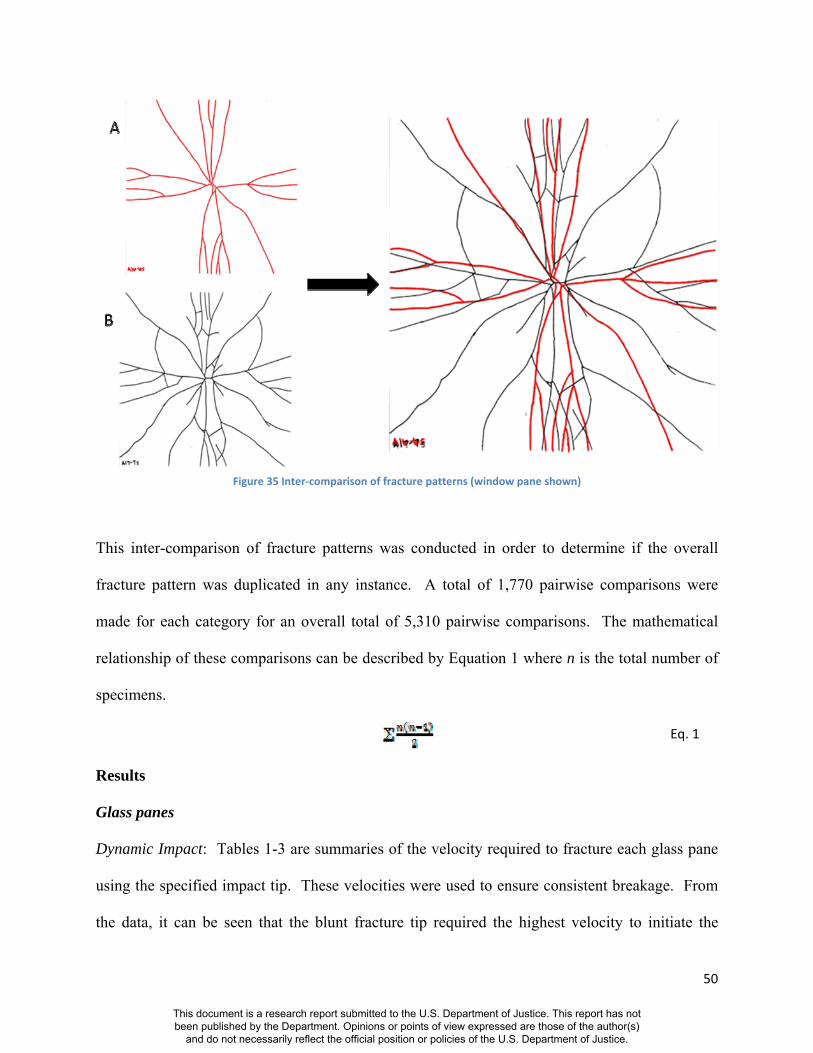
50
Figure 35 Inter‐comparison of fracture patterns (window pane shown)
This inter-comparison of fracture patterns was conducted in order to determine if the overall
fracture pattern was duplicated in any instance. A total of 1,770 pairwise comparisons were
made for each category for an overall total of 5,310 pairwise comparisons. The mathematical
relationship of these comparisons can be described by Equation 1 where n is the total number of
specimens.
Eq. 1
Results
Glass panes
Dynamic Impact: Tables 1-3 are summaries of the velocity required to fracture each glass pane
using the specified impact tip. These velocities were used to ensure consistent breakage. From
the data, it can be seen that the blunt fracture tip required the highest velocity to initiate the
This document is a research report submitted to the U.S. Department of Justice. This report has not been published by the Department. Opinions or points of view expressed are those of the author(s)
and do not necessarily reflect the official position or policies of the U.S. Department of Justice.
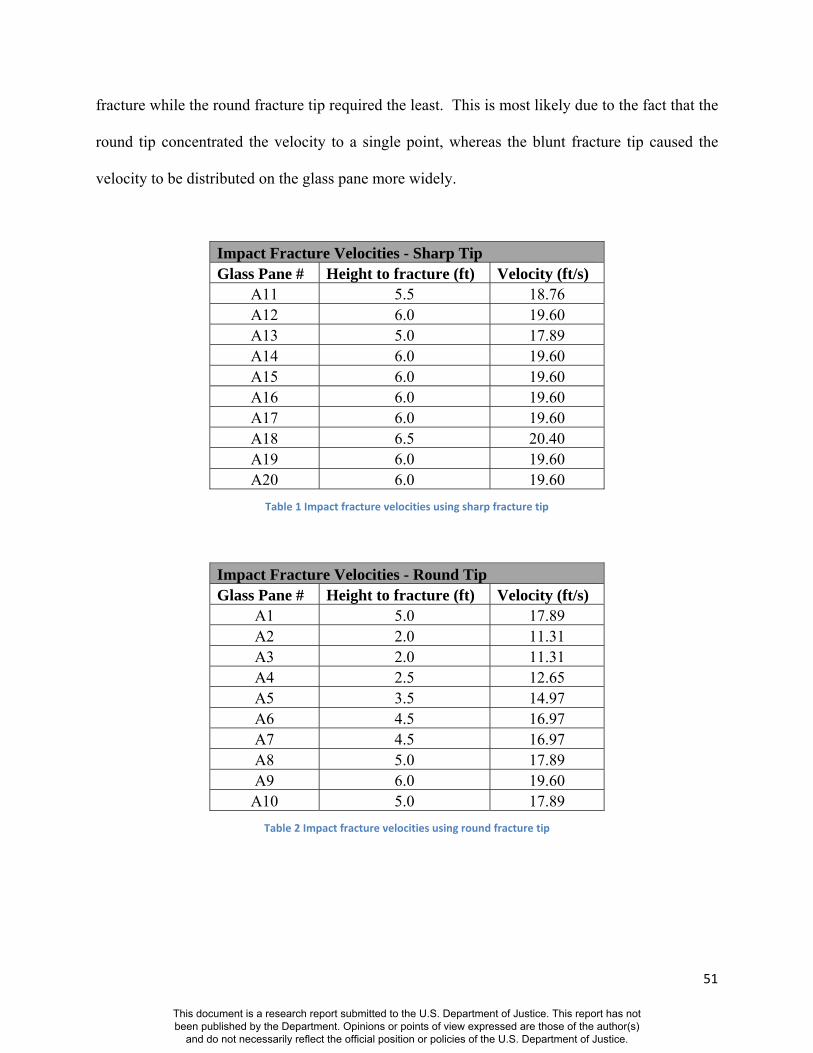
51
fracture while the round fracture tip required the least. This is most likely due to the fact that the
round tip concentrated the velocity to a single point, whereas the blunt fracture tip caused the
velocity to be distributed on the glass pane more widely.
Impact Fracture Velocities - Sharp Tip Glass Pane # Height to fracture (ft) Velocity (ft/s)
A11 5.5 18.76 A12 6.0 19.60 A13 5.0 17.89 A14 6.0 19.60 A15 6.0 19.60 A16 6.0 19.60 A17 6.0 19.60 A18 6.5 20.40 A19 6.0 19.60 A20 6.0 19.60
Table 1 Impact fracture velocities using sharp fracture tip
Impact Fracture Velocities - Round Tip Glass Pane # Height to fracture (ft) Velocity (ft/s)
A1 5.0 17.89 A2 2.0 11.31 A3 2.0 11.31 A4 2.5 12.65 A5 3.5 14.97 A6 4.5 16.97 A7 4.5 16.97 A8 5.0 17.89 A9 6.0 19.60
A10 5.0 17.89
Table 2 Impact fracture velocities using round fracture tip
This document is a research report submitted to the U.S. Department of Justice. This report has not been published by the Department. Opinions or points of view expressed are those of the author(s)
and do not necessarily reflect the official position or policies of the U.S. Department of Justice.
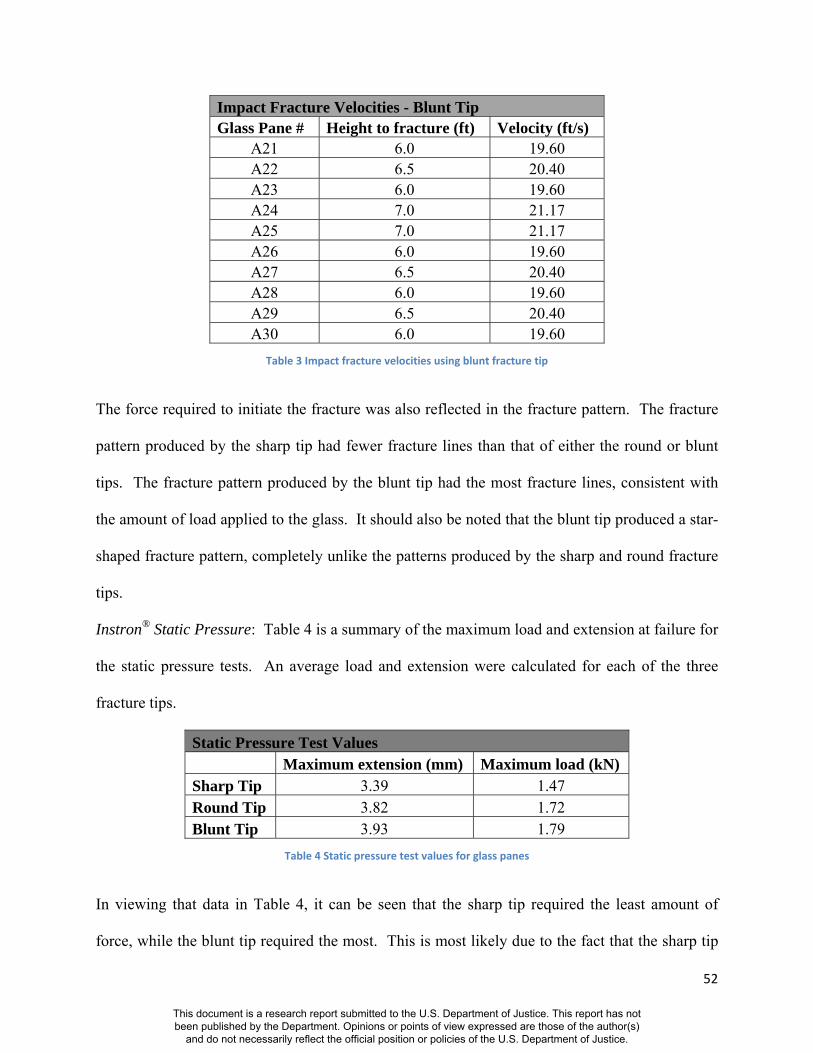
52
Impact Fracture Velocities - Blunt Tip Glass Pane # Height to fracture (ft) Velocity (ft/s)
A21 6.0 19.60 A22 6.5 20.40 A23 6.0 19.60 A24 7.0 21.17 A25 7.0 21.17 A26 6.0 19.60 A27 6.5 20.40 A28 6.0 19.60 A29 6.5 20.40 A30 6.0 19.60
Table 3 Impact fracture velocities using blunt fracture tip
The force required to initiate the fracture was also reflected in the fracture pattern. The fracture
pattern produced by the sharp tip had fewer fracture lines than that of either the round or blunt
tips. The fracture pattern produced by the blunt tip had the most fracture lines, consistent with
the amount of load applied to the glass. It should also be noted that the blunt tip produced a star-
shaped fracture pattern, completely unlike the patterns produced by the sharp and round fracture
tips.
Instron® Static Pressure: Table 4 is a summary of the maximum load and extension at failure for
the static pressure tests. An average load and extension were calculated for each of the three
fracture tips.
Static Pressure Test Values Maximum extension (mm) Maximum load (kN) Sharp Tip 3.39 1.47 Round Tip 3.82 1.72 Blunt Tip 3.93 1.79
Table 4 Static pressure test values for glass panes
In viewing that data in Table 4, it can be seen that the sharp tip required the least amount of
force, while the blunt tip required the most. This is most likely due to the fact that the sharp tip
This document is a research report submitted to the U.S. Department of Justice. This report has not been published by the Department. Opinions or points of view expressed are those of the author(s)
and do not necessarily reflect the official position or policies of the U.S. Department of Justice.
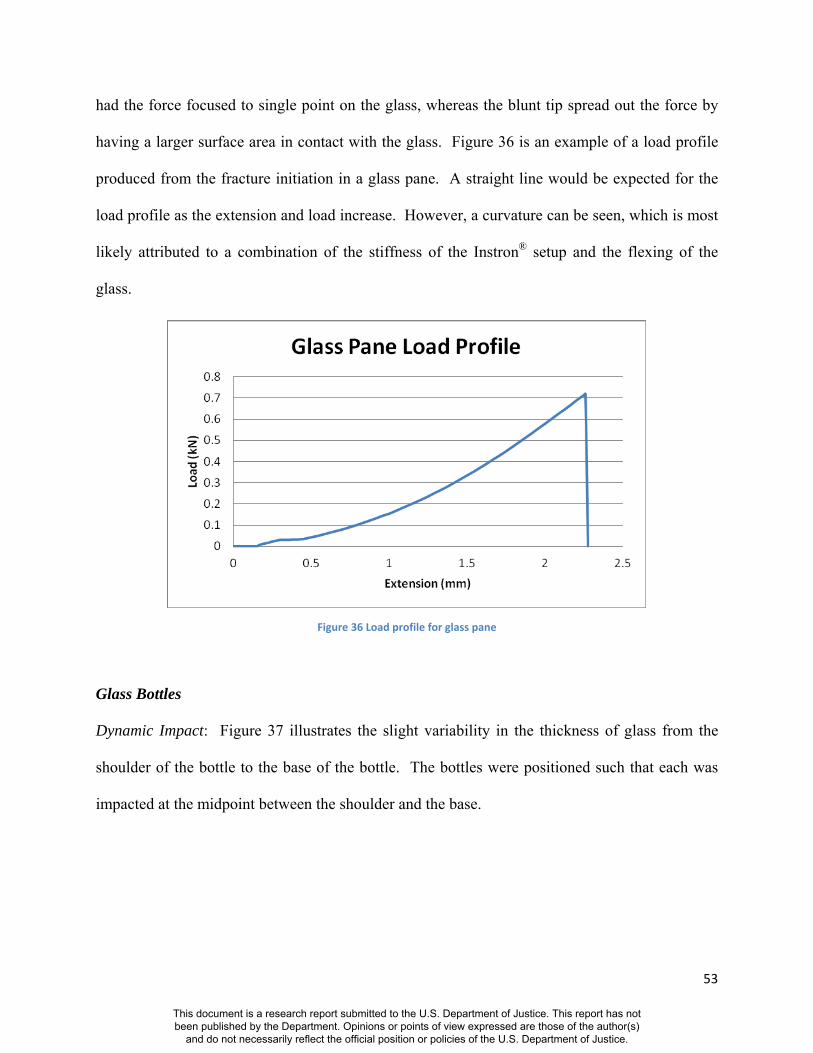
53
had the force focused to single point on the glass, whereas the blunt tip spread out the force by
having a larger surface area in contact with the glass. Figure 36 is an example of a load profile
produced from the fracture initiation in a glass pane. A straight line would be expected for the
load profile as the extension and load increase. However, a curvature can be seen, which is most
likely attributed to a combination of the stiffness of the Instron® setup and the flexing of the
glass.
Figure 36 Load profile for glass pane
Glass Bottles
Dynamic Impact: Figure 37 illustrates the slight variability in the thickness of glass from the
shoulder of the bottle to the base of the bottle. The bottles were positioned such that each was
impacted at the midpoint between the shoulder and the base.
This document is a research report submitted to the U.S. Department of Justice. This report has not been published by the Department. Opinions or points of view expressed are those of the author(s)
and do not necessarily reflect the official position or policies of the U.S. Department of Justice.
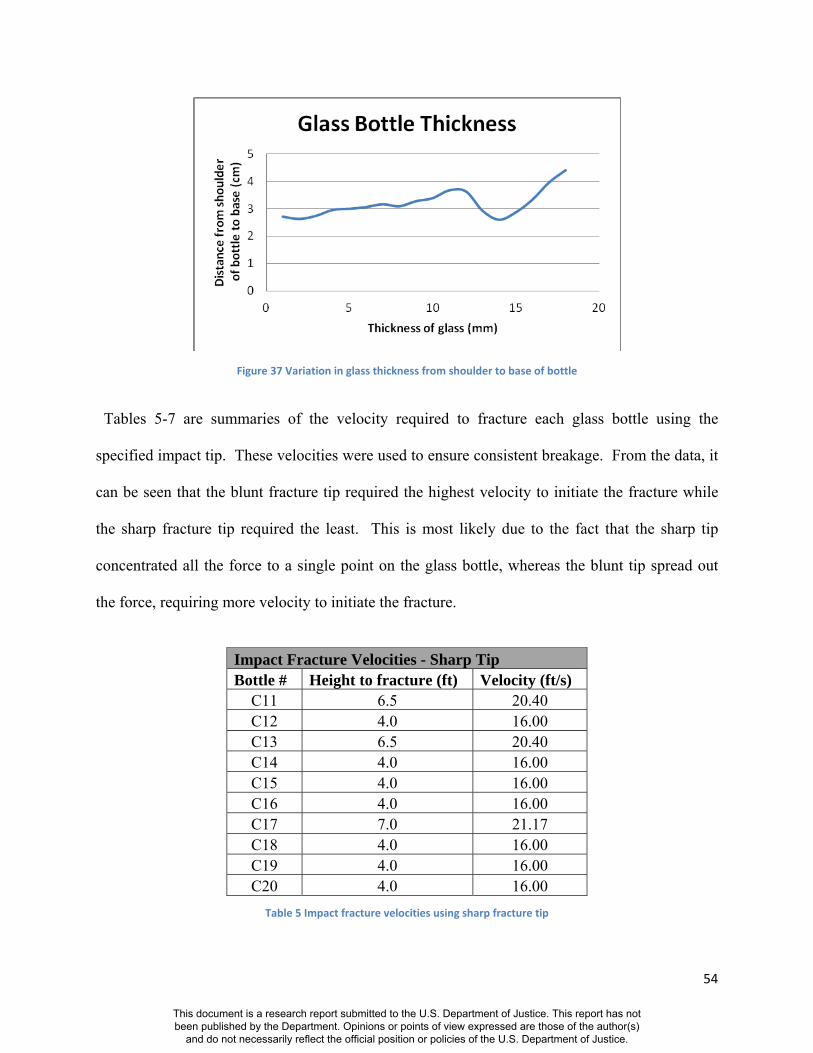
54
Figure 37 Variation in glass thickness from shoulder to base of bottle
Tables 5-7 are summaries of the velocity required to fracture each glass bottle using the
specified impact tip. These velocities were used to ensure consistent breakage. From the data, it
can be seen that the blunt fracture tip required the highest velocity to initiate the fracture while
the sharp fracture tip required the least. This is most likely due to the fact that the sharp tip
concentrated all the force to a single point on the glass bottle, whereas the blunt tip spread out
the force, requiring more velocity to initiate the fracture.
Impact Fracture Velocities - Sharp Tip Bottle # Height to fracture (ft) Velocity (ft/s)
C11 6.5 20.40 C12 4.0 16.00 C13 6.5 20.40 C14 4.0 16.00 C15 4.0 16.00 C16 4.0 16.00 C17 7.0 21.17 C18 4.0 16.00 C19 4.0 16.00 C20 4.0 16.00
Table 5 Impact fracture velocities using sharp fracture tip
This document is a research report submitted to the U.S. Department of Justice. This report has not been published by the Department. Opinions or points of view expressed are those of the author(s)
and do not necessarily reflect the official position or policies of the U.S. Department of Justice.

55
Impact Fracture Velocities - Round Tip Bottle # Height to fracture (ft) Velocity (ft/s)
C1 7.0 21.17 C2 5.0 17.89 C3 6.0 19.60 C4 5.0 17.89 C5 5.0 17.89 C6 6.0 19.60 C7 5.5 18.76 C8 5.0 17.89 C9 5.5 18.76
C10 5.0 17.89
Table 6 Impact fracture velocities using round fracture tip
Impact Fracture Velocities - Blunt Tip Bottle # Height to fracture (ft) Velocity (ft/s)
C21 10.0 25.30 C22 9.0 24.00 C23 10.0 25.30 C24 10.0 25.30 C25 10.0 25.30 C26 10.0 25.30 C27 10.5 25.92 C28 10.5 25.92 C29 10.0 25.30 C30 10.0 25.30
Table 7 Impact fracture velocities using blunt fracture tip
The force required to initiate the fracture was also reflected in the fracture pattern. The fracture
pattern produced by the sharp tip had fewer fracture lines than that of the either the round or
blunt tips, whereas the fracture pattern produced by the blunt tip had the most fracture lines,
consistent with the amount of load applied to the glass. The fracture lines produced using the
blunt tip, were much more concentrated that the fracture lines of either the sharp or round tips.
Instron® Static Pressure: Table 8 is a summary of the average maximum extension and load at
failure produced by each of the three fracture tips in the static pressure tests.
This document is a research report submitted to the U.S. Department of Justice. This report has not been published by the Department. Opinions or points of view expressed are those of the author(s)
and do not necessarily reflect the official position or policies of the U.S. Department of Justice.
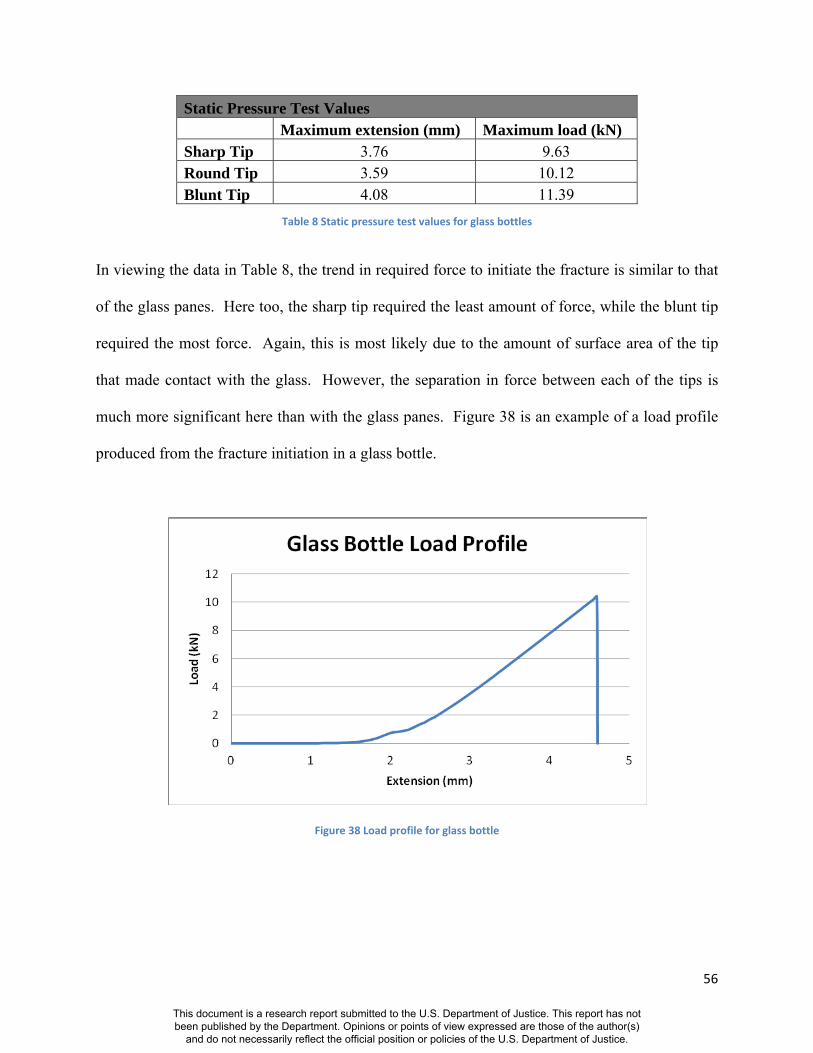
56
Static Pressure Test Values Maximum extension (mm) Maximum load (kN) Sharp Tip 3.76 9.63 Round Tip 3.59 10.12 Blunt Tip 4.08 11.39
Table 8 Static pressure test values for glass bottles
In viewing the data in Table 8, the trend in required force to initiate the fracture is similar to that
of the glass panes. Here too, the sharp tip required the least amount of force, while the blunt tip
required the most force. Again, this is most likely due to the amount of surface area of the tip
that made contact with the glass. However, the separation in force between each of the tips is
much more significant here than with the glass panes. Figure 38 is an example of a load profile
produced from the fracture initiation in a glass bottle.
Figure 38 Load profile for glass bottle
This document is a research report submitted to the U.S. Department of Justice. This report has not been published by the Department. Opinions or points of view expressed are those of the author(s)
and do not necessarily reflect the official position or policies of the U.S. Department of Justice.
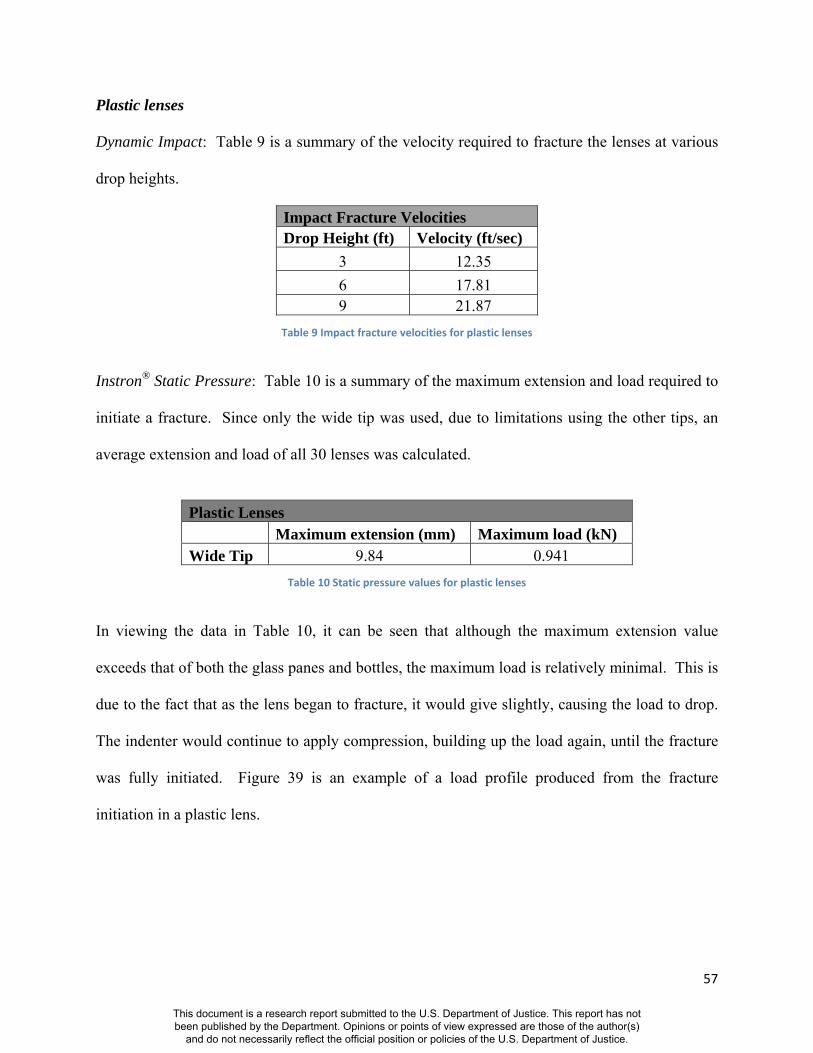
57
Plastic lenses
Dynamic Impact: Table 9 is a summary of the velocity required to fracture the lenses at various
drop heights.
Impact Fracture Velocities Drop Height (ft) Velocity (ft/sec)
3 12.35
6 17.81 9 21.87
Table 9 Impact fracture velocities for plastic lenses
Instron® Static Pressure: Table 10 is a summary of the maximum extension and load required to
initiate a fracture. Since only the wide tip was used, due to limitations using the other tips, an
average extension and load of all 30 lenses was calculated.
Plastic Lenses Maximum extension (mm) Maximum load (kN) Wide Tip 9.84 0.941
Table 10 Static pressure values for plastic lenses
In viewing the data in Table 10, it can be seen that although the maximum extension value
exceeds that of both the glass panes and bottles, the maximum load is relatively minimal. This is
due to the fact that as the lens began to fracture, it would give slightly, causing the load to drop.
The indenter would continue to apply compression, building up the load again, until the fracture
was fully initiated. Figure 39 is an example of a load profile produced from the fracture
initiation in a plastic lens.
This document is a research report submitted to the U.S. Department of Justice. This report has not been published by the Department. Opinions or points of view expressed are those of the author(s)
and do not necessarily reflect the official position or policies of the U.S. Department of Justice.
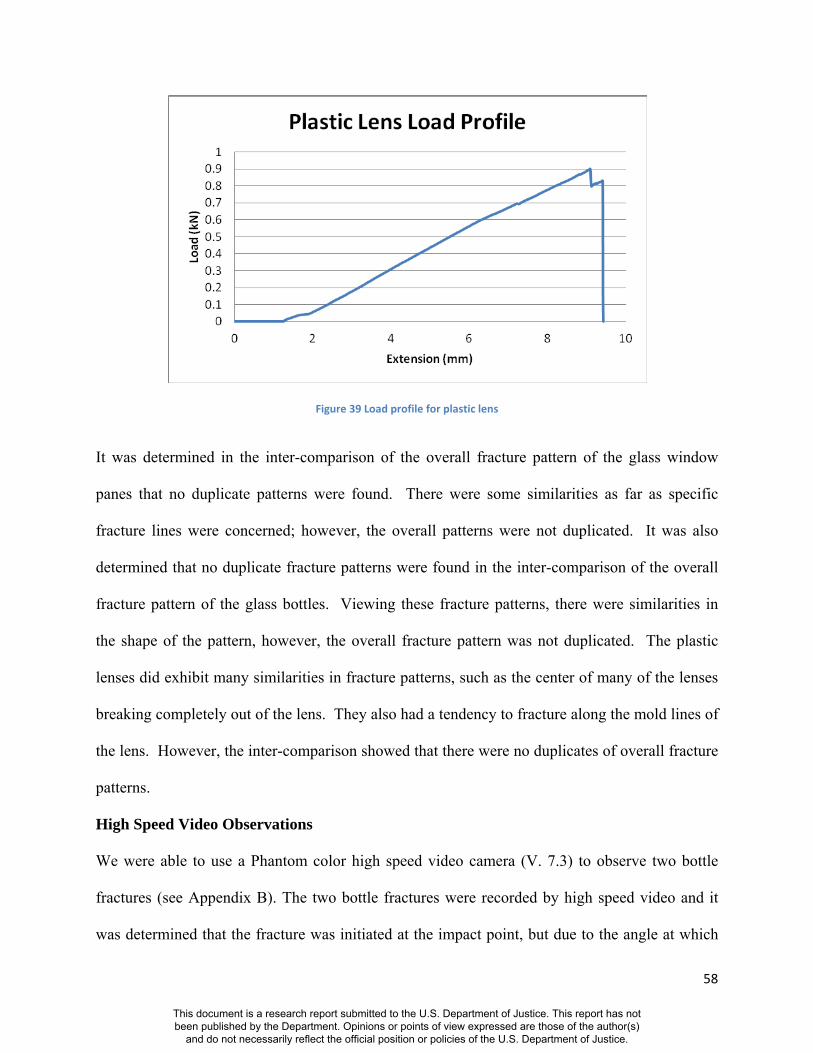
58
Figure 39 Load profile for plastic lens
It was determined in the inter-comparison of the overall fracture pattern of the glass window
panes that no duplicate patterns were found. There were some similarities as far as specific
fracture lines were concerned; however, the overall patterns were not duplicated. It was also
determined that no duplicate fracture patterns were found in the inter-comparison of the overall
fracture pattern of the glass bottles. Viewing these fracture patterns, there were similarities in
the shape of the pattern, however, the overall fracture pattern was not duplicated. The plastic
lenses did exhibit many similarities in fracture patterns, such as the center of many of the lenses
breaking completely out of the lens. They also had a tendency to fracture along the mold lines of
the lens. However, the inter-comparison showed that there were no duplicates of overall fracture
patterns.
High Speed Video Observations
We were able to use a Phantom color high speed video camera (V. 7.3) to observe two bottle
fractures (see Appendix B). The two bottle fractures were recorded by high speed video and it
was determined that the fracture was initiated at the impact point, but due to the angle at which
This document is a research report submitted to the U.S. Department of Justice. This report has not been published by the Department. Opinions or points of view expressed are those of the author(s)
and do not necessarily reflect the official position or policies of the U.S. Department of Justice.
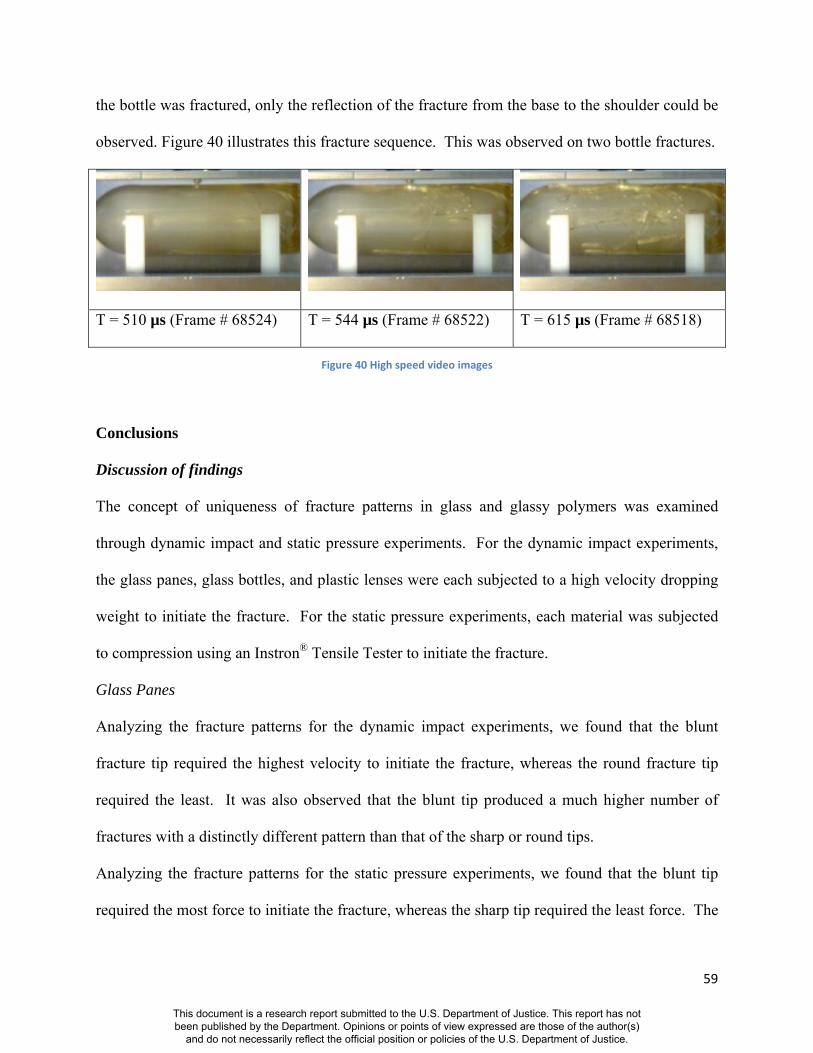
59
the bottle was fractured, only the reflection of the fracture from the base to the shoulder could be
observed. Figure 40 illustrates this fracture sequence. This was observed on two bottle fractures.
T = 510 µs (Frame # 68524) T = 544 µs (Frame # 68522) T = 615 µs (Frame # 68518)
Figure 40 High speed video images
Conclusions
Discussion of findings
The concept of uniqueness of fracture patterns in glass and glassy polymers was examined
through dynamic impact and static pressure experiments. For the dynamic impact experiments,
the glass panes, glass bottles, and plastic lenses were each subjected to a high velocity dropping
weight to initiate the fracture. For the static pressure experiments, each material was subjected
to compression using an Instron® Tensile Tester to initiate the fracture.
Glass Panes
Analyzing the fracture patterns for the dynamic impact experiments, we found that the blunt
fracture tip required the highest velocity to initiate the fracture, whereas the round fracture tip
required the least. It was also observed that the blunt tip produced a much higher number of
fractures with a distinctly different pattern than that of the sharp or round tips.
Analyzing the fracture patterns for the static pressure experiments, we found that the blunt tip
required the most force to initiate the fracture, whereas the sharp tip required the least force. The
This document is a research report submitted to the U.S. Department of Justice. This report has not been published by the Department. Opinions or points of view expressed are those of the author(s)
and do not necessarily reflect the official position or policies of the U.S. Department of Justice.
60
blunt tip produced a higher number of both radial and concentric fractures than either the sharp
or round tips produced.
The fracture patterns produced using dynamic impact were much simpler than the fracture
patterns produced using static pressure. The static pressure fracture patterns had more radial
fractures and almost all contained concentric fractures, whereas the dynamic impact patterns
contained significantly less radial and concentric fractures. This is because the stress field is
being modified rather than simply depleting as it does in the impact case.
Glass Bottles
Analyzing the fracture patterns for the dynamic impact experiments, we found that the blunt
fracture tip required the highest velocity to initiate the fracture, whereas the sharp fracture tip
required the least. The blunt tip produced a significantly higher number of fractures than that of
the sharp or round tips. Also, due to the greater velocity, the blunt tip caused much more of the
glass at the impact site to be blown out when compared to the impact sites of the bottles fractured
using the sharp and round tips.
Analyzing the fracture patterns for the static pressure experiments, we found that the blunt tip
required the most force to initiate the fracture, whereas the sharp tip required the least force. The
number of fractures produced by each of the three impact tips was more evenly distributed,
however, it appears that the blunt and round tips produced a larger number of fractures than that
of the sharp tip.
The fracture patterns produced using dynamic impact are somewhat similar to the fracture
patterns produced using static pressure. The patterns of the two fracture methods did not differ
as greatly as the glass pane patterns. However, overall, the static pressure fracture patterns had a
larger number of fractures than the dynamic impact patterns.
This document is a research report submitted to the U.S. Department of Justice. This report has not been published by the Department. Opinions or points of view expressed are those of the author(s)
and do not necessarily reflect the official position or policies of the U.S. Department of Justice.
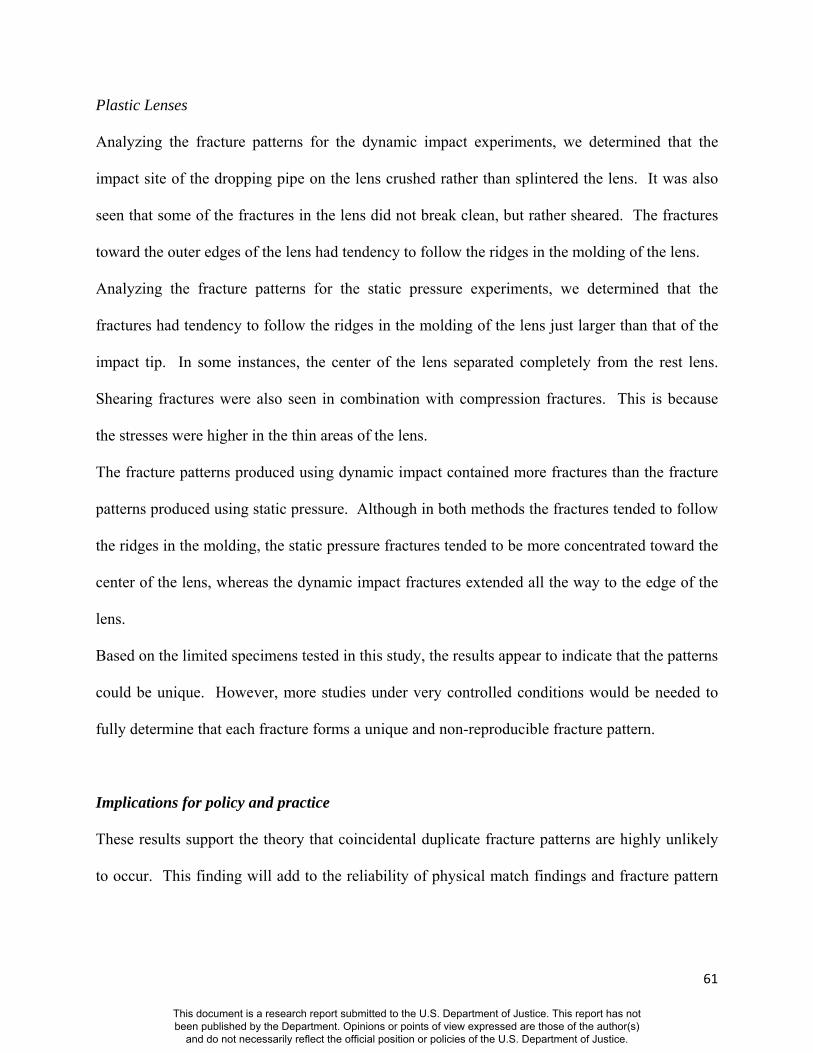
61
Plastic Lenses
Analyzing the fracture patterns for the dynamic impact experiments, we determined that the
impact site of the dropping pipe on the lens crushed rather than splintered the lens. It was also
seen that some of the fractures in the lens did not break clean, but rather sheared. The fractures
toward the outer edges of the lens had tendency to follow the ridges in the molding of the lens.
Analyzing the fracture patterns for the static pressure experiments, we determined that the
fractures had tendency to follow the ridges in the molding of the lens just larger than that of the
impact tip. In some instances, the center of the lens separated completely from the rest lens.
Shearing fractures were also seen in combination with compression fractures. This is because
the stresses were higher in the thin areas of the lens.
The fracture patterns produced using dynamic impact contained more fractures than the fracture
patterns produced using static pressure. Although in both methods the fractures tended to follow
the ridges in the molding, the static pressure fractures tended to be more concentrated toward the
center of the lens, whereas the dynamic impact fractures extended all the way to the edge of the
lens.
Based on the limited specimens tested in this study, the results appear to indicate that the patterns
could be unique. However, more studies under very controlled conditions would be needed to
fully determine that each fracture forms a unique and non-reproducible fracture pattern.
Implications for policy and practice
These results support the theory that coincidental duplicate fracture patterns are highly unlikely
to occur. This finding will add to the reliability of physical match findings and fracture pattern
This document is a research report submitted to the U.S. Department of Justice. This report has not been published by the Department. Opinions or points of view expressed are those of the author(s)
and do not necessarily reflect the official position or policies of the U.S. Department of Justice.
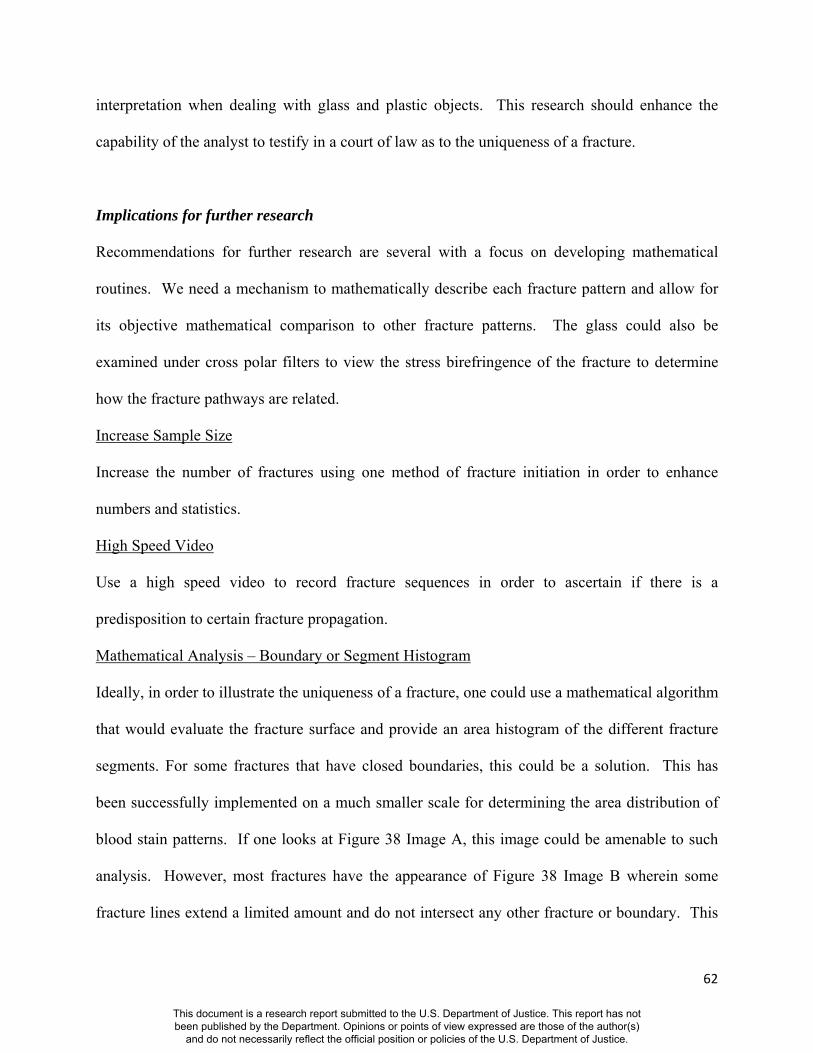
62
interpretation when dealing with glass and plastic objects. This research should enhance the
capability of the analyst to testify in a court of law as to the uniqueness of a fracture.
Implications for further research
Recommendations for further research are several with a focus on developing mathematical
routines. We need a mechanism to mathematically describe each fracture pattern and allow for
its objective mathematical comparison to other fracture patterns. The glass could also be
examined under cross polar filters to view the stress birefringence of the fracture to determine
how the fracture pathways are related.
Increase Sample Size
Increase the number of fractures using one method of fracture initiation in order to enhance
numbers and statistics.
High Speed Video
Use a high speed video to record fracture sequences in order to ascertain if there is a
predisposition to certain fracture propagation.
Mathematical Analysis – Boundary or Segment Histogram
Ideally, in order to illustrate the uniqueness of a fracture, one could use a mathematical algorithm
that would evaluate the fracture surface and provide an area histogram of the different fracture
segments. For some fractures that have closed boundaries, this could be a solution. This has
been successfully implemented on a much smaller scale for determining the area distribution of
blood stain patterns. If one looks at Figure 38 Image A, this image could be amenable to such
analysis. However, most fractures have the appearance of Figure 38 Image B wherein some
fracture lines extend a limited amount and do not intersect any other fracture or boundary. This
This document is a research report submitted to the U.S. Department of Justice. This report has not been published by the Department. Opinions or points of view expressed are those of the author(s)
and do not necessarily reflect the official position or policies of the U.S. Department of Justice.
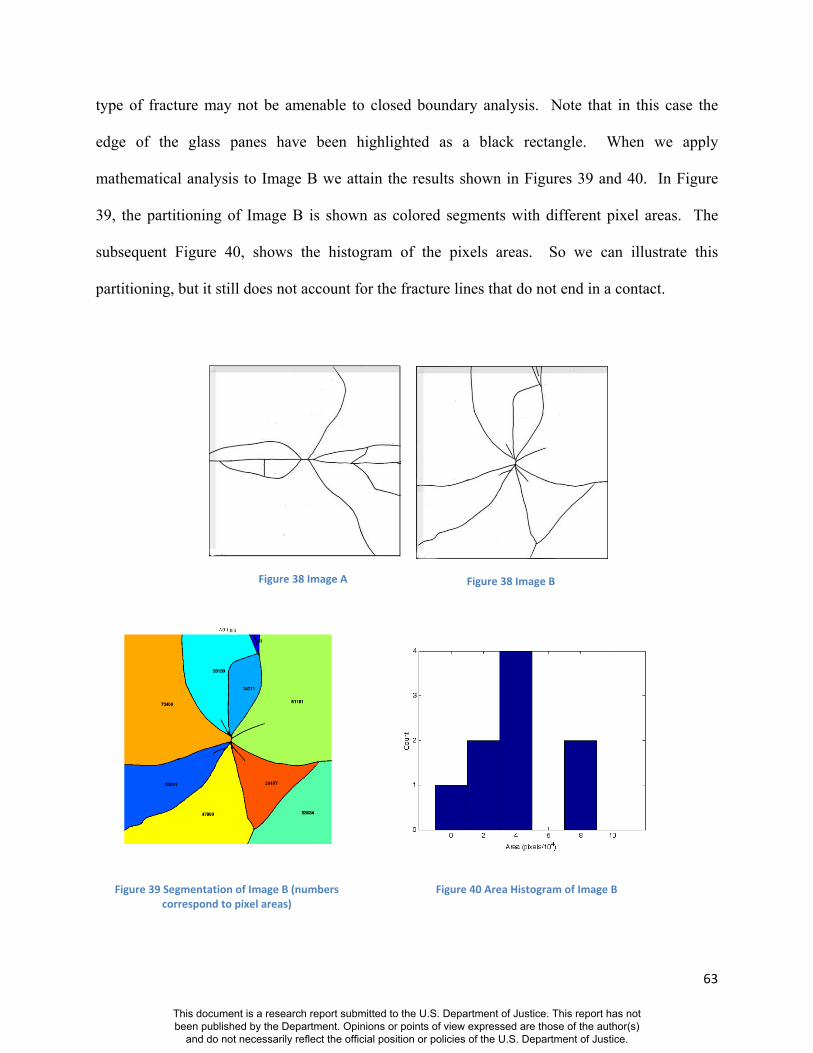
63
type of fracture may not be amenable to closed boundary analysis. Note that in this case the
edge of the glass panes have been highlighted as a black rectangle. When we apply
mathematical analysis to Image B we attain the results shown in Figures 39 and 40. In Figure
39, the partitioning of Image B is shown as colored segments with different pixel areas. The
subsequent Figure 40, shows the histogram of the pixels areas. So we can illustrate this
partitioning, but it still does not account for the fracture lines that do not end in a contact.
Figure 38 Image A
Figure 38 Image B
Figure 39 Segmentation of Image B (numbers correspond to pixel areas)
Figure 40 Area Histogram of Image B
This document is a research report submitted to the U.S. Department of Justice. This report has not been published by the Department. Opinions or points of view expressed are those of the author(s)
and do not necessarily reflect the official position or policies of the U.S. Department of Justice.
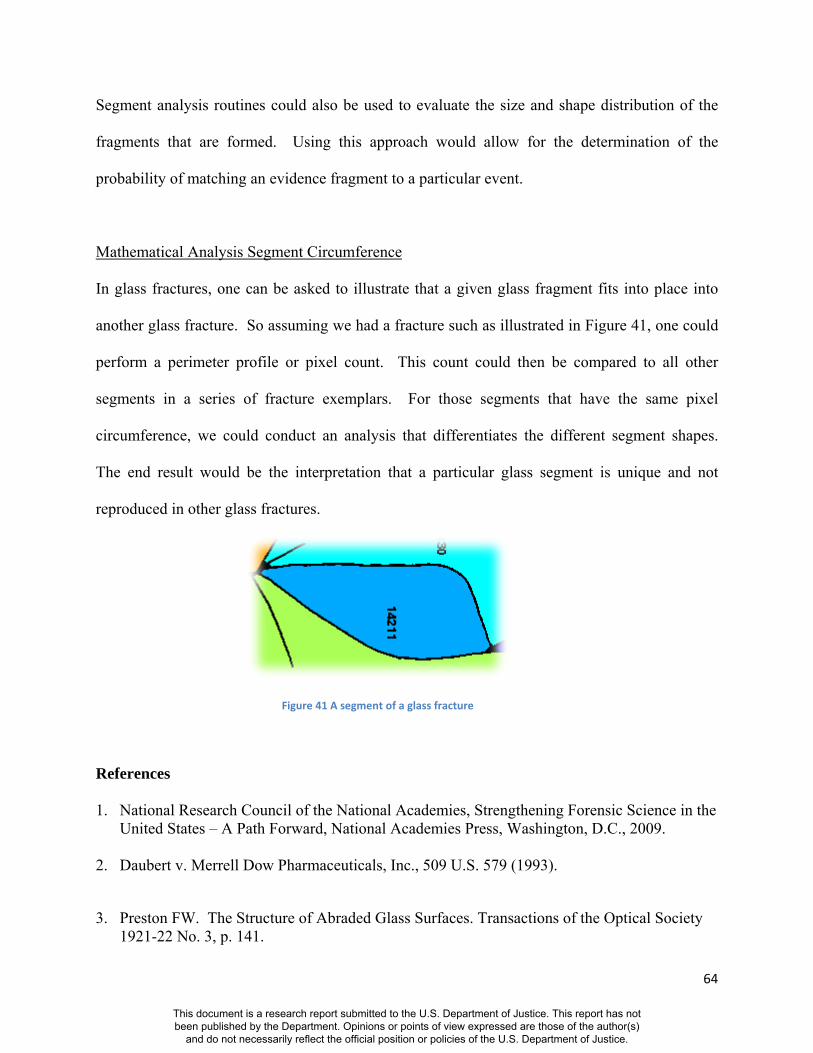
64
Segment analysis routines could also be used to evaluate the size and shape distribution of the
fragments that are formed. Using this approach would allow for the determination of the
probability of matching an evidence fragment to a particular event.
Mathematical Analysis Segment Circumference
In glass fractures, one can be asked to illustrate that a given glass fragment fits into place into
another glass fracture. So assuming we had a fracture such as illustrated in Figure 41, one could
perform a perimeter profile or pixel count. This count could then be compared to all other
segments in a series of fracture exemplars. For those segments that have the same pixel
circumference, we could conduct an analysis that differentiates the different segment shapes.
The end result would be the interpretation that a particular glass segment is unique and not
reproduced in other glass fractures.
Figure 41 A segment of a glass fracture
References
1. National Research Council of the National Academies, Strengthening Forensic Science in the United States – A Path Forward, National Academies Press, Washington, D.C., 2009.
2. Daubert v. Merrell Dow Pharmaceuticals, Inc., 509 U.S. 579 (1993).
3. Preston FW. The Structure of Abraded Glass Surfaces. Transactions of the Optical Society 1921-22 No. 3, p. 141.
This document is a research report submitted to the U.S. Department of Justice. This report has not been published by the Department. Opinions or points of view expressed are those of the author(s)
and do not necessarily reflect the official position or policies of the U.S. Department of Justice.
65
4. Preston FW. A Study of the Rupture of Glass. J. Soc. Glass Techn. 1926 Vol. 10, p. 234.
5. Quinn GD. A History of the Fractography of Brittle Materials. Key Engineering Materials 2009 Vol. 409, p. 4.
6. Matwejeff SN. Criminal Investigation of Broken Window Panes. Amer. J. Police Sci 1931; 2:148.
7. Federal Bureau of Investigation, Evidence of Fractured Glass in Criminal Investigations, FBI Law Enforcement Bulletin, October 1936, p. 2.
8. Tryhorn FC. The Fracture of Glass. Forensic Science Circular 1936 No. 2, p. 1.
9. Nicholls LC. Anomalous Fracture in Glass. Forensic Science Circular 1937 No. 3, p. 7.
10. O’Hara CE, Osterberg, JW. An Introduction to Criminalistics. MacMillan, New York, 1949., p. 239.
11. Federal Bureau of Investigation, Glass Fracture Examinations Aid the Investigator, FBI Law Enforcement Bulletin, October 1936, p. 2.
12. Nelson DF. Illustrating the Fit of Glass Fragments. J. Crim. Law, Criminol. Police Sci 1959; 50:312.
13. Thompson JW. The Structure of Hackle Lines on Glass. Intern. Crim. Police Rev March 1969; p. 62.
14. McJunkins SP, Thornton JI. Glass Fracture Analysis – A Review. Forensic Science 1973; 2:1-27.
15. Thornton JI, and Cashman PJ. Glass Fracture Mechanism – A Rethinking. J. Forensic Sciences 1986; 31:818-824.
16. Thornton JI. “Physical Examination of Glass Evidence”, in Forensic Examination of Glass and Paint, ed. B. Caddy, Taylor & Francis, London, 2001, p. 97-121.
17. Rhodes EF, Thornton JI. The Interpretation of Impact Fractures in Glassy Polymers, J. Forensic Sci 1975; 20:274-282.
18. Katterwe HW. Fracture Matching and Repetitive Experiments: A Contribution of Validation, AFTE Journal 2005; 37(33):229-241.
19. Sglavo VM, Gadotti M, Micheletti T. Cyclic Loading Behavior of Soda- Lime Silicate Glass
using Indentation Cracks, Fatique Fract. Engng. Mater. Struct 1997; 20(8):1225-1234.
This document is a research report submitted to the U.S. Department of Justice. This report has not been published by the Department. Opinions or points of view expressed are those of the author(s)
and do not necessarily reflect the official position or policies of the U.S. Department of Justice.

66
20. Shinkai N. “Fracture and Fractography of Flat Glass,” in Fractography of Glass, ed. R.
Brandt and R. Tressler. Plenum, New York, 1995.
21. Orr L. Practical Analysis of Fractures in Glass Windows. Materials Research and Standards 1998; 12:21-23, 47-48.
22. Ropp RC. Handbook of Glass Fractography. Author House, Bloomington, IN, 2008.
23. Mecholsky J. "Fracture Analysis of Glass Surfaces,” in Strength of Inorganic Glass, ed. C. Kurkjian, Plenum, New York, 1986.
24. Kepple J, Wasylyk J. “The Fracture of Glass Containers,” in Fractography of Glass, ed. R. Brandt and R. Tressler, Plenum, New York, 1995.
25. Quinn GD. Fractography of Ceramics and Glasses, Special Publication 960-16, National Institute of Standards and Technology, U.S. Government Printing Office, 2007.
26. Griffith A. Phenomena of Rupture and Flow in Solids. Philosophical Transactions of the Royal Society of London, 221, Series A:163-204 (1920).
27. Poncelet E. The Markings of Fracture Surfaces. Journal of the Society of Glass Technology 1958; 42:279-288.
28. ASTM Method C162-85a, Vol. 15.02, “Standard Definitions of Terms Relating to Glass and Glass Products”. American Society for Testing and Materials, Philadelphia, 1985.
Dissemination of Research Findings We intend to disseminate this research by presentation talks at various seminars and by
submission a technical peer reviewed article to the Journal of Forensic Sciences (JFS). The JFS
article will be an abridged version and will be submitted by GSR A. Baca as part of her thesis
requirement. Once an article is reviewed and approved by the Journal of Forensic Sciences, it
may take 1.5 years before the results are in print.
So far we have presented this research in the following locations/seminars:
This document is a research report submitted to the U.S. Department of Justice. This report has not been published by the Department. Opinions or points of view expressed are those of the author(s)
and do not necessarily reflect the official position or policies of the U.S. Department of Justice.
67
American Academy of Forensic Sciences 64th Annual Meeting, February 25, 2012
Abstract A196. “Determination of Unique Fracture Patterns in Glass and Glassy
Polymers” by Allison Baca
UC Davis off-site seminar, Granlibakken, Lake Tahoe, May 6, 2012 Determination of
Unique Fracture Patterns in Glass and Glassy Polymers” by Allison Baca
Future location for proposed oral presentations:
o California Association of Criminalists Semi-Annual Seminar, San Jose, CA
November 2012
o Southwest Association of Forensic Scientists (SWAS) Scottsdale, AZ.
October 2012
This document is a research report submitted to the U.S. Department of Justice. This report has not been published by the Department. Opinions or points of view expressed are those of the author(s)
and do not necessarily reflect the official position or policies of the U.S. Department of Justice.
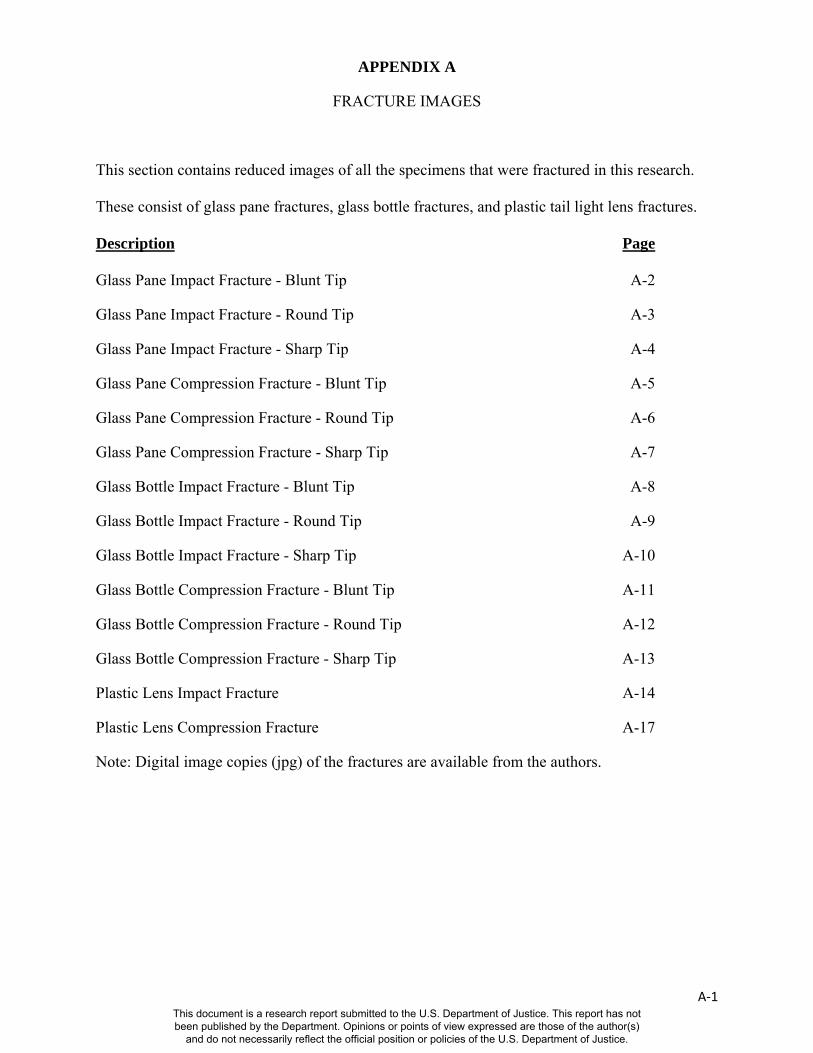
A‐1
APPENDIX A
FRACTURE IMAGES
This section contains reduced images of all the specimens that were fractured in this research.
These consist of glass pane fractures, glass bottle fractures, and plastic tail light lens fractures.
Description Page
Glass Pane Impact Fracture - Blunt Tip A-2
Glass Pane Impact Fracture - Round Tip A-3
Glass Pane Impact Fracture - Sharp Tip A-4
Glass Pane Compression Fracture - Blunt Tip A-5
Glass Pane Compression Fracture - Round Tip A-6
Glass Pane Compression Fracture - Sharp Tip A-7
Glass Bottle Impact Fracture - Blunt Tip A-8
Glass Bottle Impact Fracture - Round Tip A-9
Glass Bottle Impact Fracture - Sharp Tip A-10
Glass Bottle Compression Fracture - Blunt Tip A-11
Glass Bottle Compression Fracture - Round Tip A-12
Glass Bottle Compression Fracture - Sharp Tip A-13
Plastic Lens Impact Fracture A-14
Plastic Lens Compression Fracture A-17
Note: Digital image copies (jpg) of the fractures are available from the authors.
This document is a research report submitted to the U.S. Department of Justice. This report has not been published by the Department. Opinions or points of view expressed are those of the author(s)
and do not necessarily reflect the official position or policies of the U.S. Department of Justice.
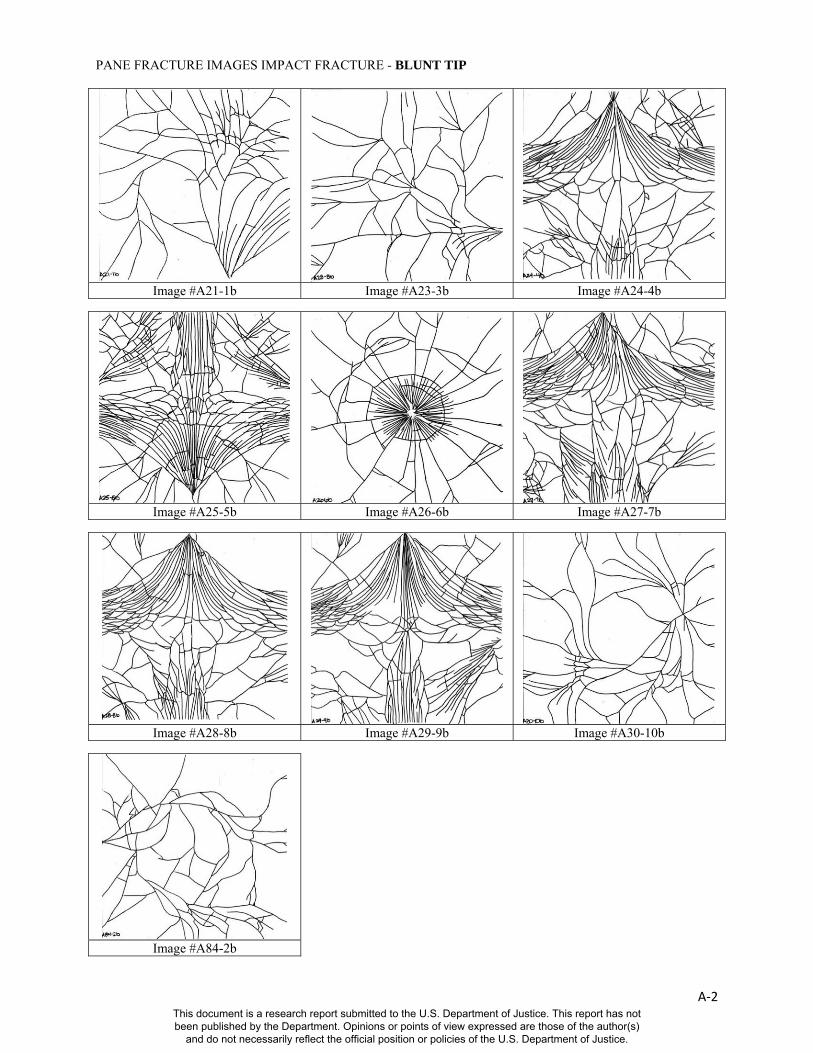
A‐2
PANE FRACTURE IMAGES IMPACT FRACTURE - BLUNT TIP
Image #A21-1b Image #A23-3b Image #A24-4b
Image #A25-5b Image #A26-6b Image #A27-7b
Image #A28-8b Image #A29-9b Image #A30-10b
Image #A84-2b
This document is a research report submitted to the U.S. Department of Justice. This report has not been published by the Department. Opinions or points of view expressed are those of the author(s)
and do not necessarily reflect the official position or policies of the U.S. Department of Justice.
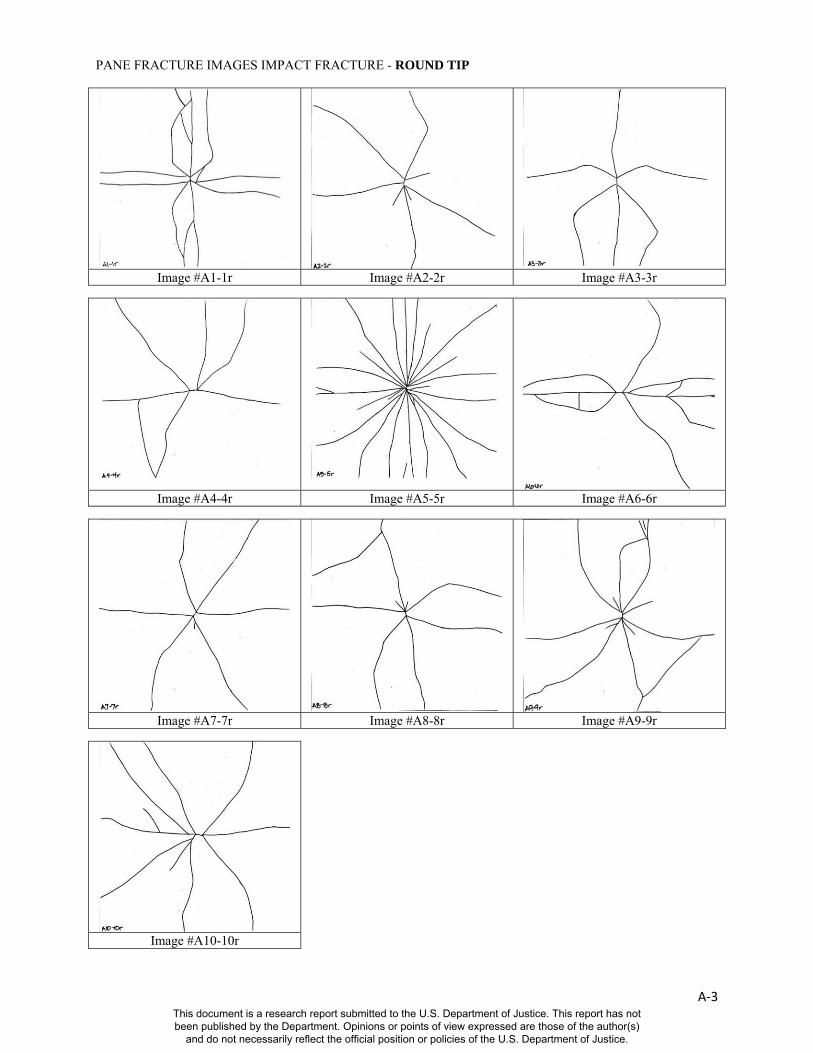
A‐3
PANE FRACTURE IMAGES IMPACT FRACTURE - ROUND TIP
Image #A1-1r Image #A2-2r Image #A3-3r
Image #A4-4r Image #A5-5r Image #A6-6r
Image #A7-7r Image #A8-8r Image #A9-9r
Image #A10-10r
This document is a research report submitted to the U.S. Department of Justice. This report has not been published by the Department. Opinions or points of view expressed are those of the author(s)
and do not necessarily reflect the official position or policies of the U.S. Department of Justice.
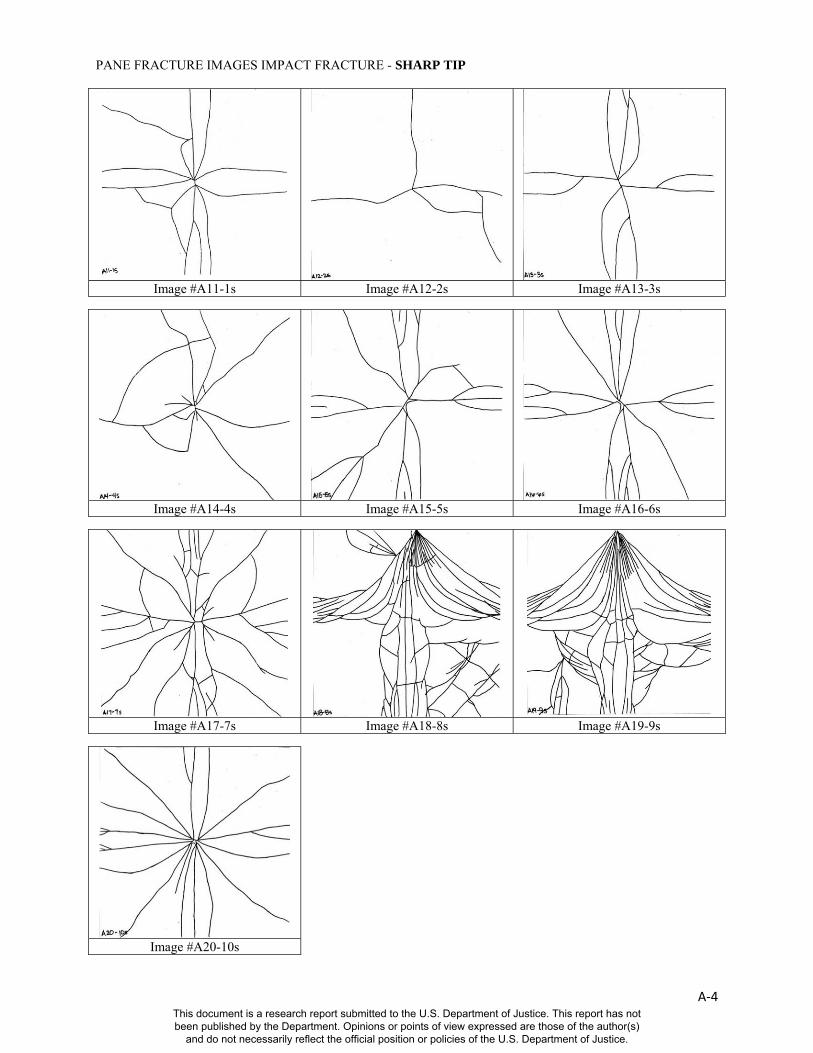
A‐4
PANE FRACTURE IMAGES IMPACT FRACTURE - SHARP TIP
Image #A11-1s Image #A12-2s Image #A13-3s
Image #A14-4s Image #A15-5s Image #A16-6s
Image #A17-7s Image #A18-8s Image #A19-9s
Image #A20-10s
This document is a research report submitted to the U.S. Department of Justice. This report has not been published by the Department. Opinions or points of view expressed are those of the author(s)
and do not necessarily reflect the official position or policies of the U.S. Department of Justice.
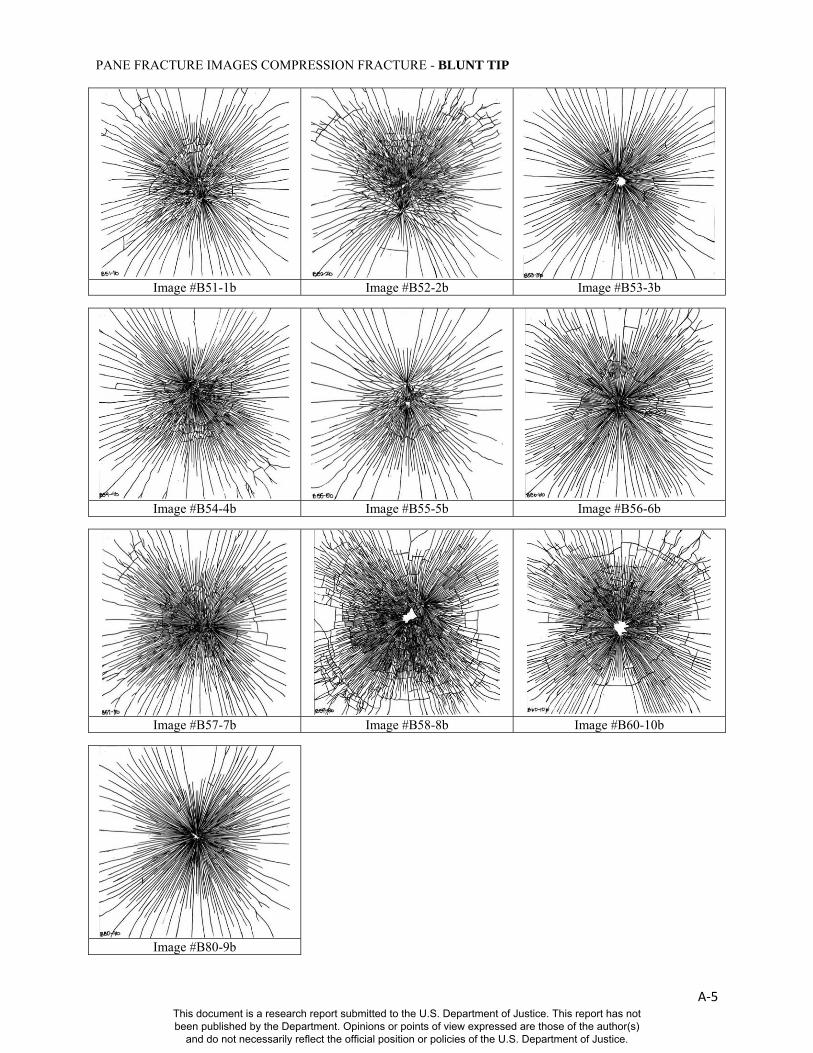
A‐5
PANE FRACTURE IMAGES COMPRESSION FRACTURE - BLUNT TIP
Image #B51-1b Image #B52-2b Image #B53-3b
Image #B54-4b Image #B55-5b Image #B56-6b
Image #B57-7b Image #B58-8b Image #B60-10b
Image #B80-9b
This document is a research report submitted to the U.S. Department of Justice. This report has not been published by the Department. Opinions or points of view expressed are those of the author(s)
and do not necessarily reflect the official position or policies of the U.S. Department of Justice.
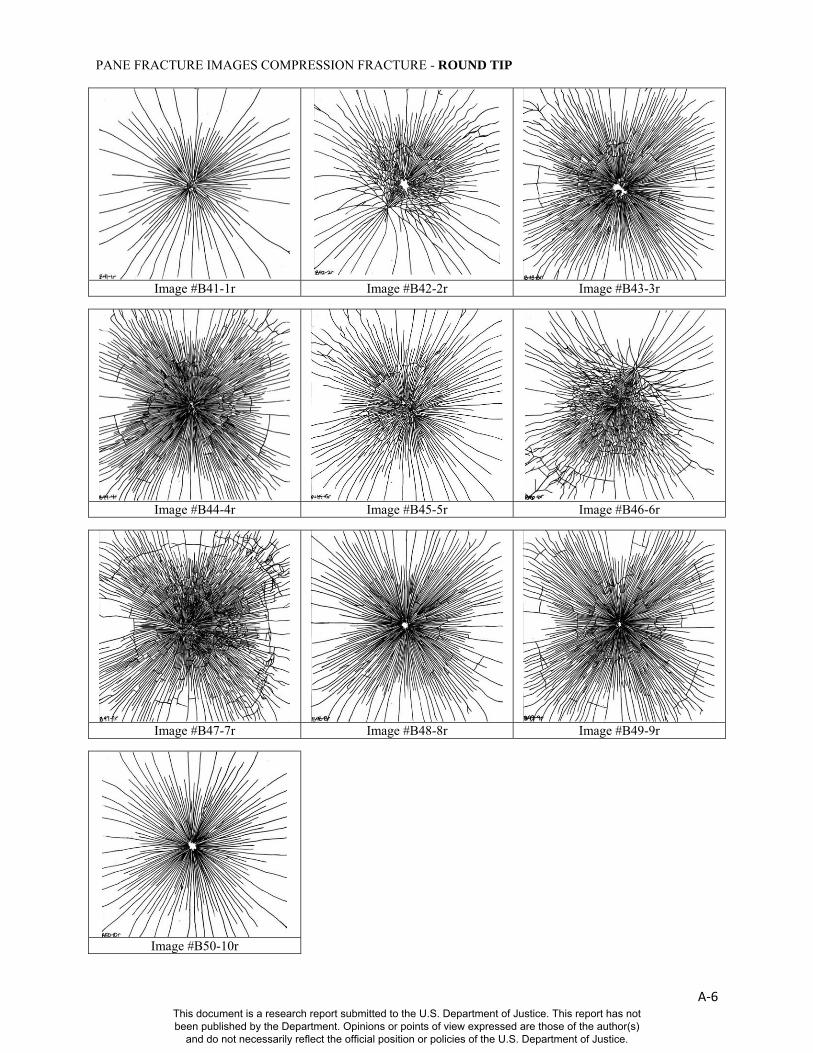
A‐6
PANE FRACTURE IMAGES COMPRESSION FRACTURE - ROUND TIP
Image #B41-1r Image #B42-2r Image #B43-3r
Image #B44-4r Image #B45-5r Image #B46-6r
Image #B47-7r Image #B48-8r Image #B49-9r
Image #B50-10r
This document is a research report submitted to the U.S. Department of Justice. This report has not been published by the Department. Opinions or points of view expressed are those of the author(s)
and do not necessarily reflect the official position or policies of the U.S. Department of Justice.
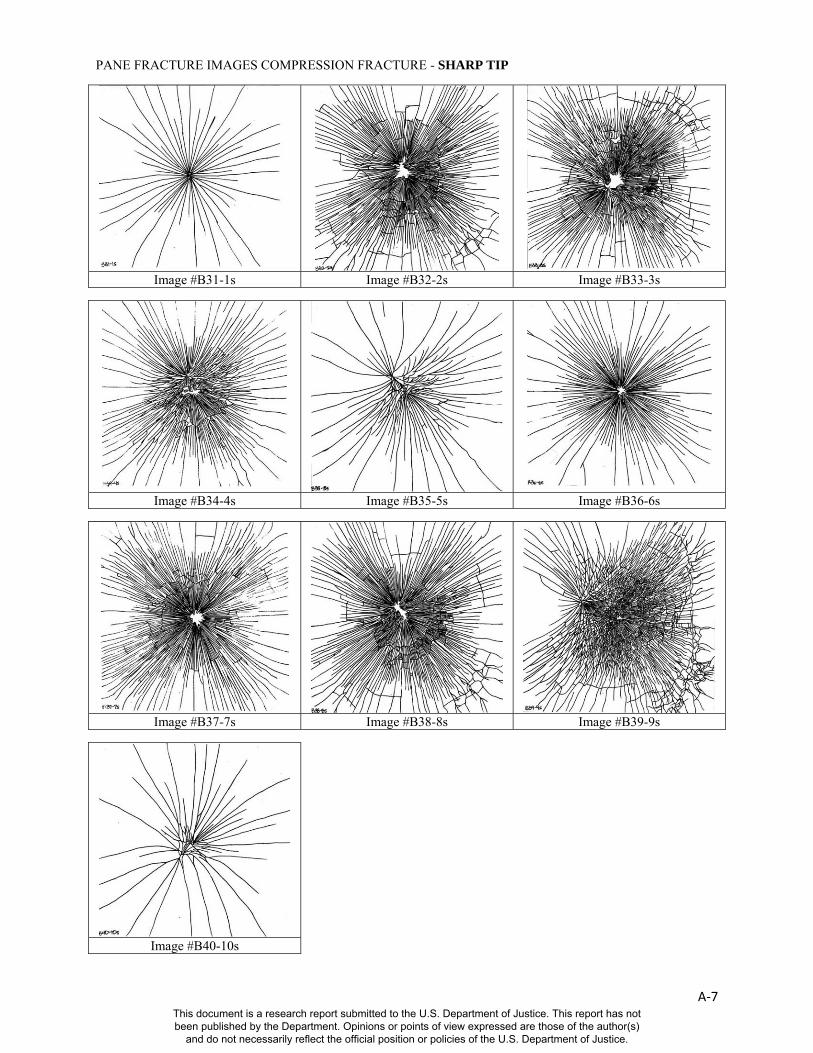
A‐7
PANE FRACTURE IMAGES COMPRESSION FRACTURE - SHARP TIP
Image #B31-1s Image #B32-2s Image #B33-3s
Image #B34-4s Image #B35-5s Image #B36-6s
Image #B37-7s Image #B38-8s Image #B39-9s
Image #B40-10s
This document is a research report submitted to the U.S. Department of Justice. This report has not been published by the Department. Opinions or points of view expressed are those of the author(s)
and do not necessarily reflect the official position or policies of the U.S. Department of Justice.
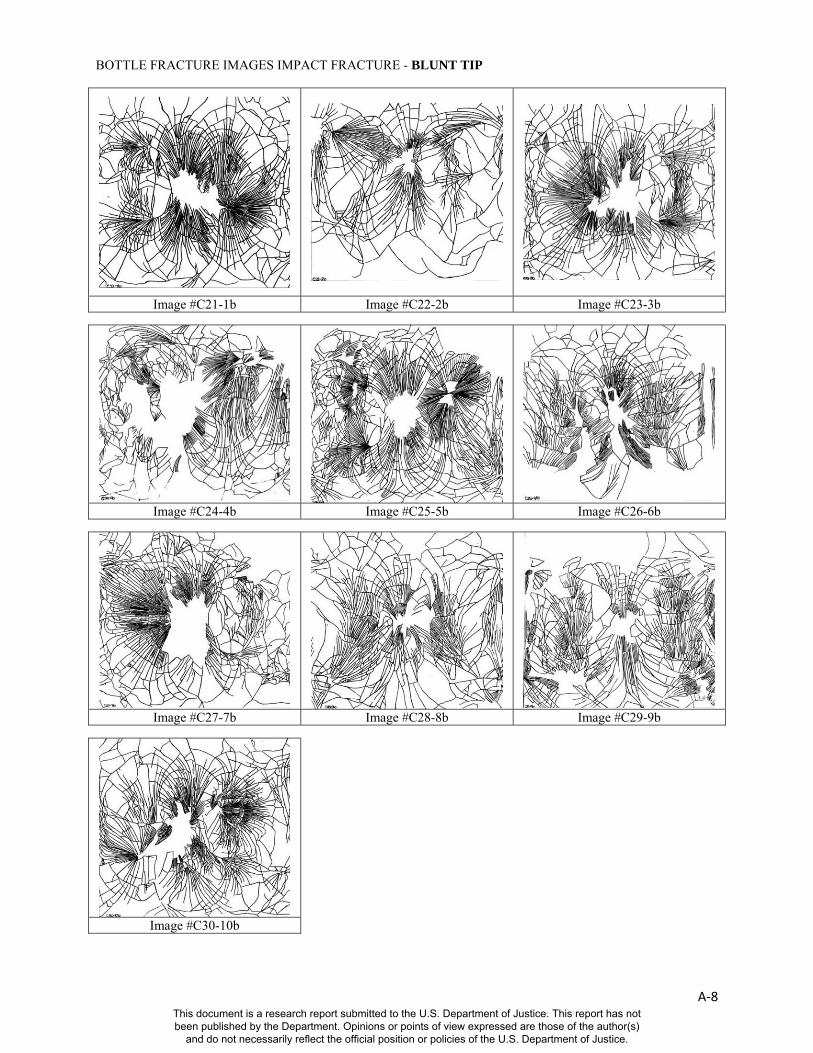
A‐8
BOTTLE FRACTURE IMAGES IMPACT FRACTURE - BLUNT TIP
Image #C21-1b Image #C22-2b Image #C23-3b
Image #C24-4b Image #C25-5b Image #C26-6b
Image #C27-7b Image #C28-8b Image #C29-9b
Image #C30-10b
This document is a research report submitted to the U.S. Department of Justice. This report has not been published by the Department. Opinions or points of view expressed are those of the author(s)
and do not necessarily reflect the official position or policies of the U.S. Department of Justice.
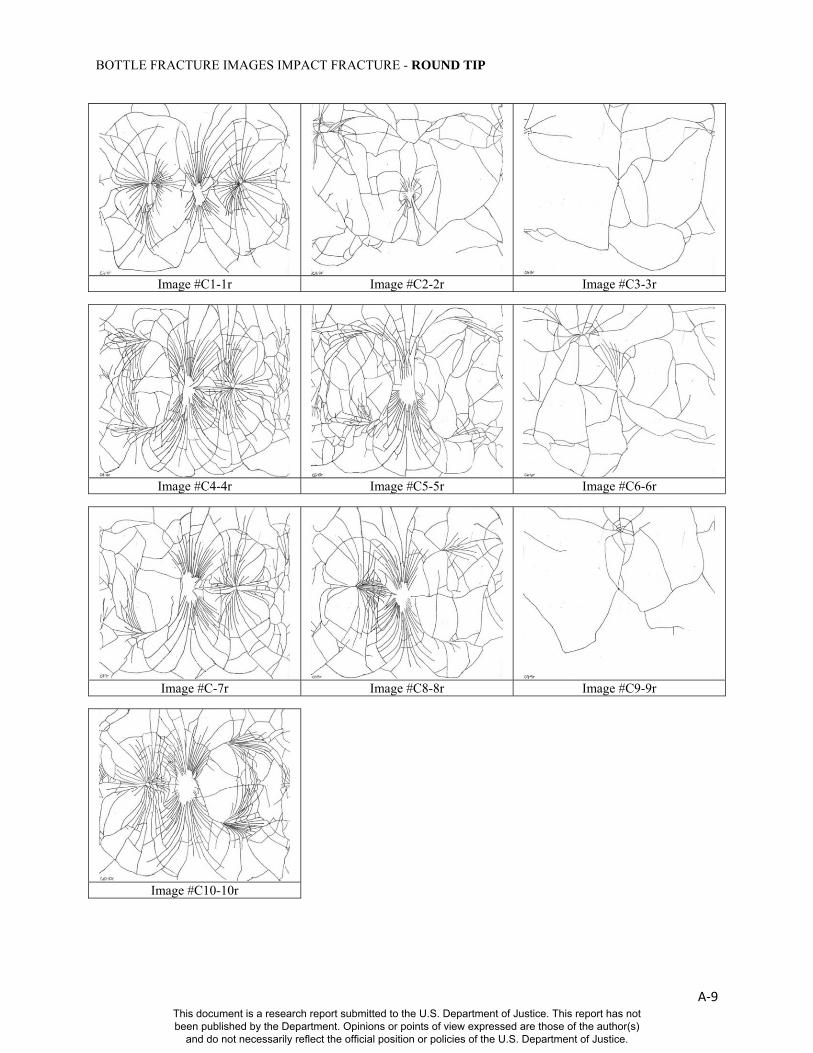
A‐9
BOTTLE FRACTURE IMAGES IMPACT FRACTURE - ROUND TIP
Image #C1-1r Image #C2-2r Image #C3-3r
Image #C4-4r Image #C5-5r Image #C6-6r
Image #C-7r Image #C8-8r Image #C9-9r
Image #C10-10r
This document is a research report submitted to the U.S. Department of Justice. This report has not been published by the Department. Opinions or points of view expressed are those of the author(s)
and do not necessarily reflect the official position or policies of the U.S. Department of Justice.
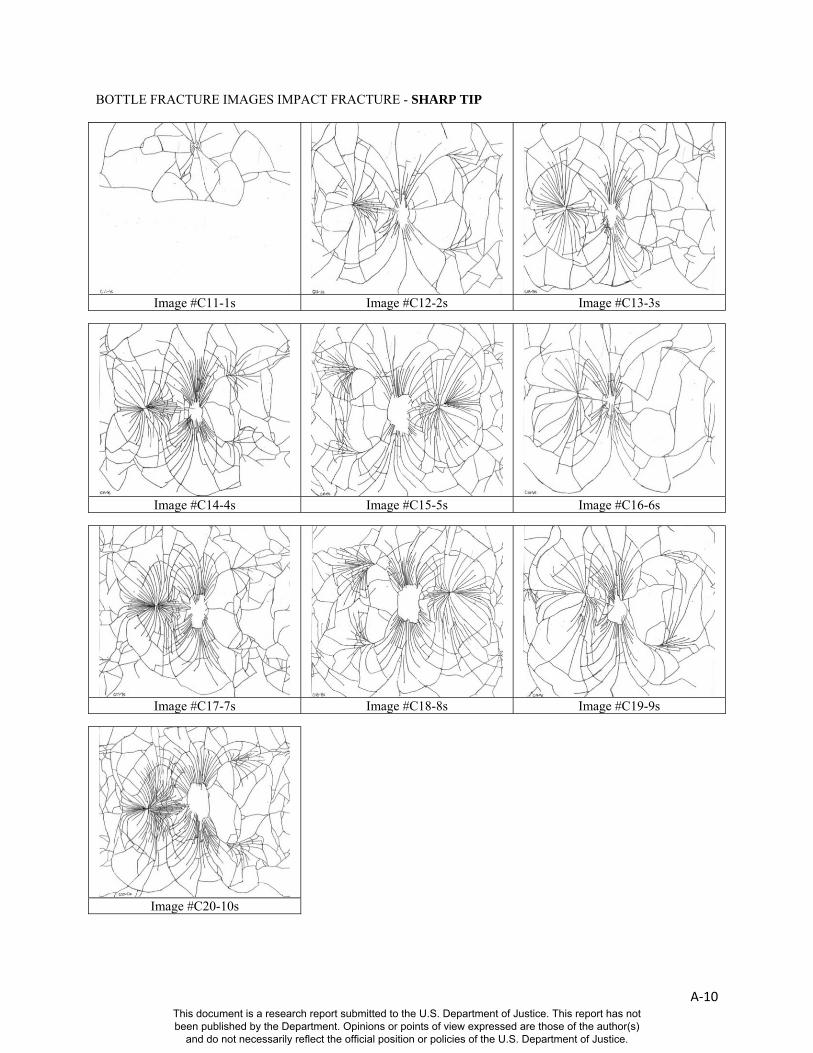
A‐10
BOTTLE FRACTURE IMAGES IMPACT FRACTURE - SHARP TIP
Image #C11-1s Image #C12-2s Image #C13-3s
Image #C14-4s Image #C15-5s Image #C16-6s
Image #C17-7s Image #C18-8s Image #C19-9s
Image #C20-10s
This document is a research report submitted to the U.S. Department of Justice. This report has not been published by the Department. Opinions or points of view expressed are those of the author(s)
and do not necessarily reflect the official position or policies of the U.S. Department of Justice.

A‐11
BOTTLE FRACTURE IMAGES COMPRESSION FRACTURE - BLUNT TIP
Image #D51-1b Image #D52-2b Image #D53-3b
Image #D54-4b Image #D55-5b Image #D56-6b
Image #D57-7b Image #D58-8b Image #D59-9b
Image #D60-10b
This document is a research report submitted to the U.S. Department of Justice. This report has not been published by the Department. Opinions or points of view expressed are those of the author(s)
and do not necessarily reflect the official position or policies of the U.S. Department of Justice.
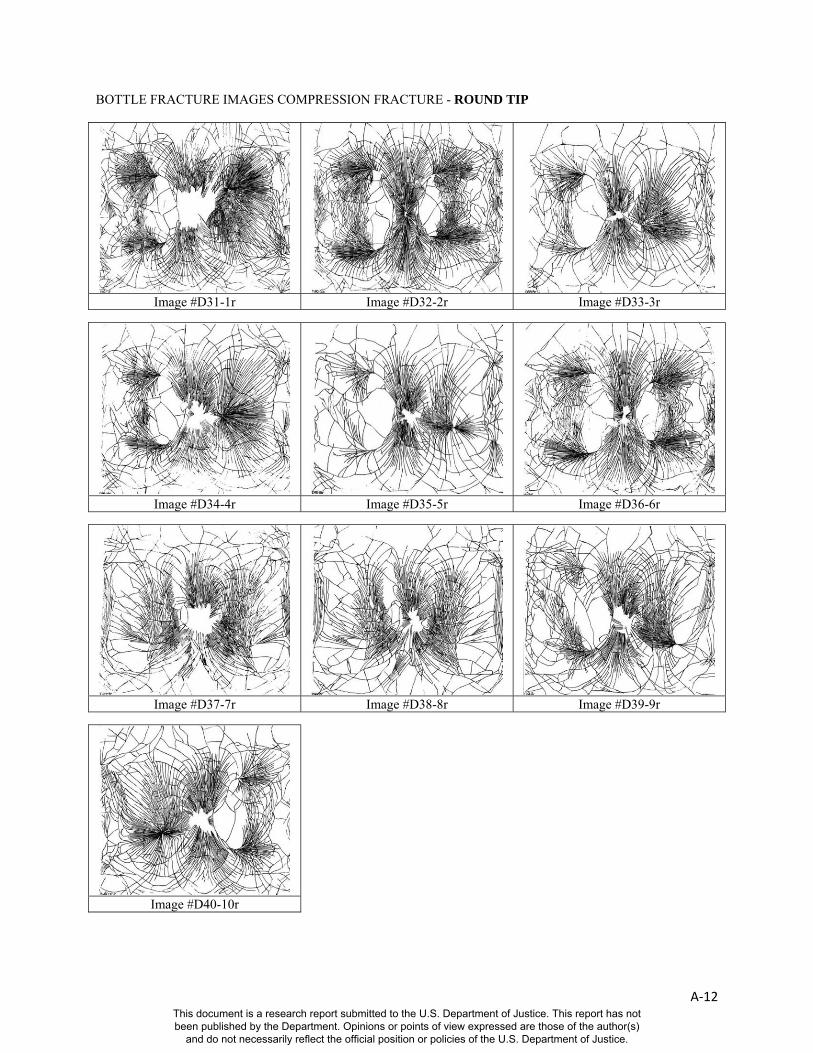
A‐12
BOTTLE FRACTURE IMAGES COMPRESSION FRACTURE - ROUND TIP
Image #D31-1r Image #D32-2r Image #D33-3r
Image #D34-4r Image #D35-5r Image #D36-6r
Image #D37-7r Image #D38-8r Image #D39-9r
Image #D40-10r
This document is a research report submitted to the U.S. Department of Justice. This report has not been published by the Department. Opinions or points of view expressed are those of the author(s)
and do not necessarily reflect the official position or policies of the U.S. Department of Justice.
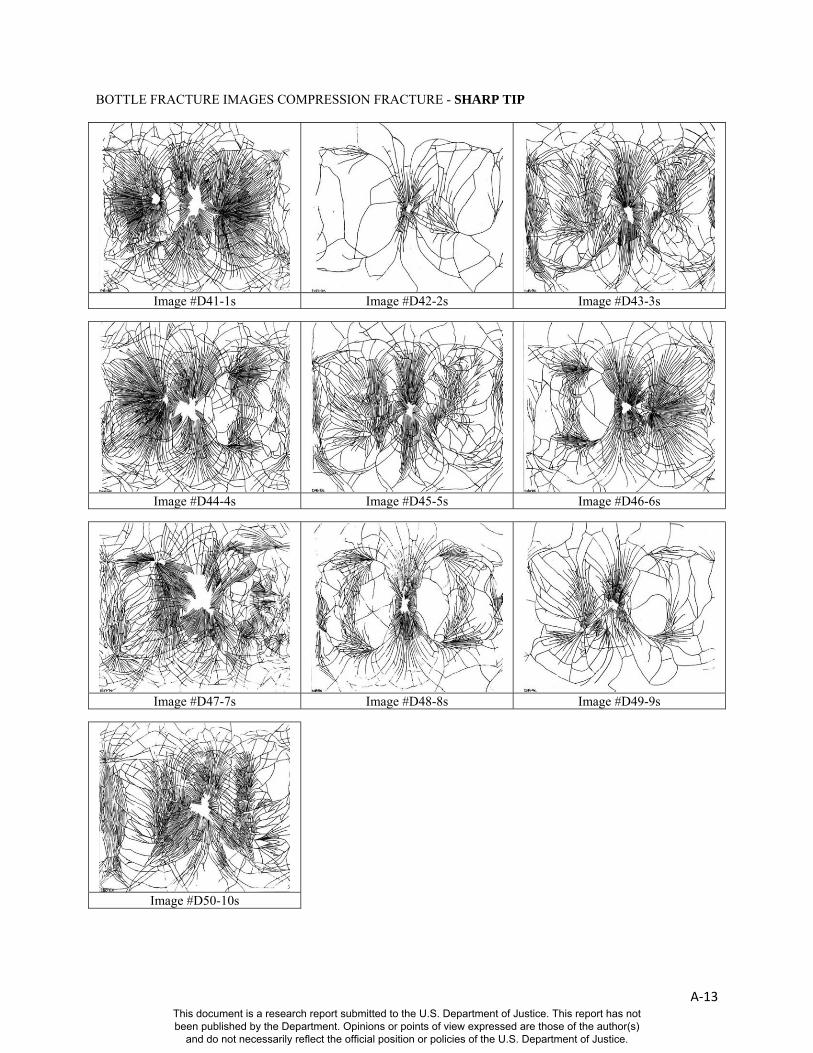
A‐13
BOTTLE FRACTURE IMAGES COMPRESSION FRACTURE - SHARP TIP
Image #D41-1s Image #D42-2s Image #D43-3s
Image #D44-4s Image #D45-5s Image #D46-6s
Image #D47-7s Image #D48-8s Image #D49-9s
Image #D50-10s
This document is a research report submitted to the U.S. Department of Justice. This report has not been published by the Department. Opinions or points of view expressed are those of the author(s)
and do not necessarily reflect the official position or policies of the U.S. Department of Justice.

A‐14
PLASTIC LENS FRACTURE IMAGES - IMPACT FRACTURE
Image #E31 Image #E32 Image #E33
Image #E34 Image #E35 Image #E36
Image #E37 Image #E38 Image #E39
Image #E40 Image #E41 Image #E42
This document is a research report submitted to the U.S. Department of Justice. This report has not been published by the Department. Opinions or points of view expressed are those of the author(s)
and do not necessarily reflect the official position or policies of the U.S. Department of Justice.
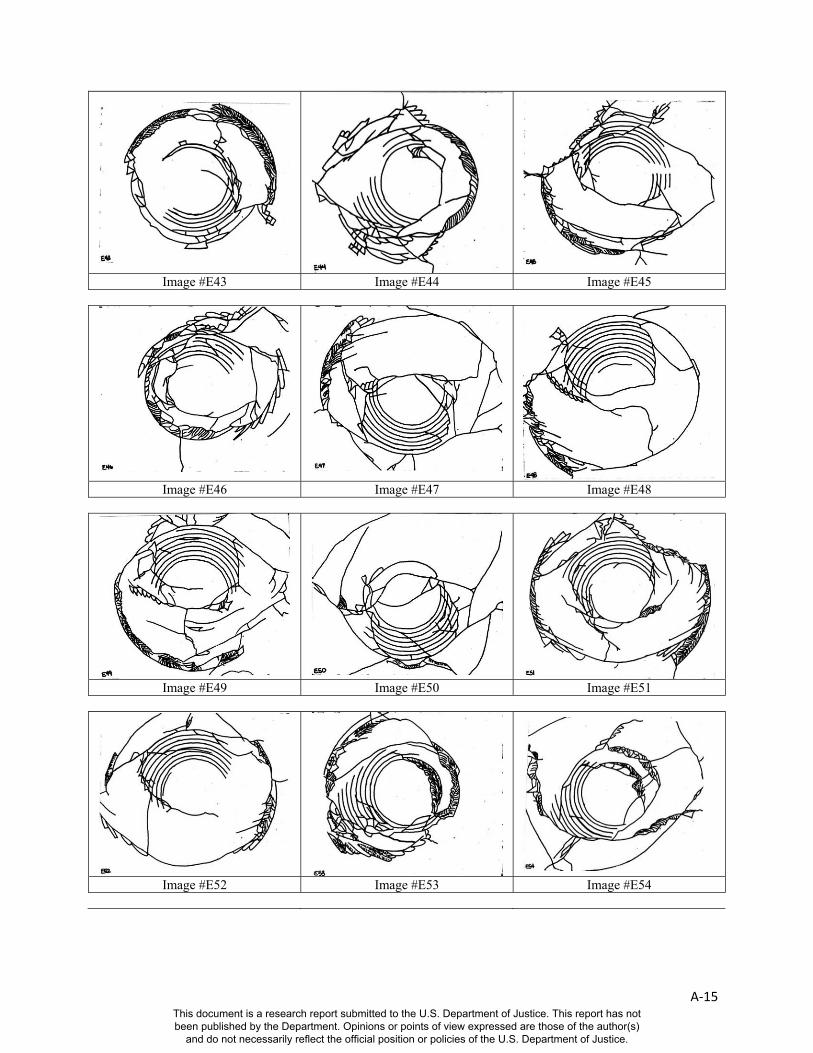
A‐15
Image #E43 Image #E44 Image #E45
Image #E46 Image #E47 Image #E48
Image #E49 Image #E50 Image #E51
Image #E52 Image #E53 Image #E54
This document is a research report submitted to the U.S. Department of Justice. This report has not been published by the Department. Opinions or points of view expressed are those of the author(s)
and do not necessarily reflect the official position or policies of the U.S. Department of Justice.
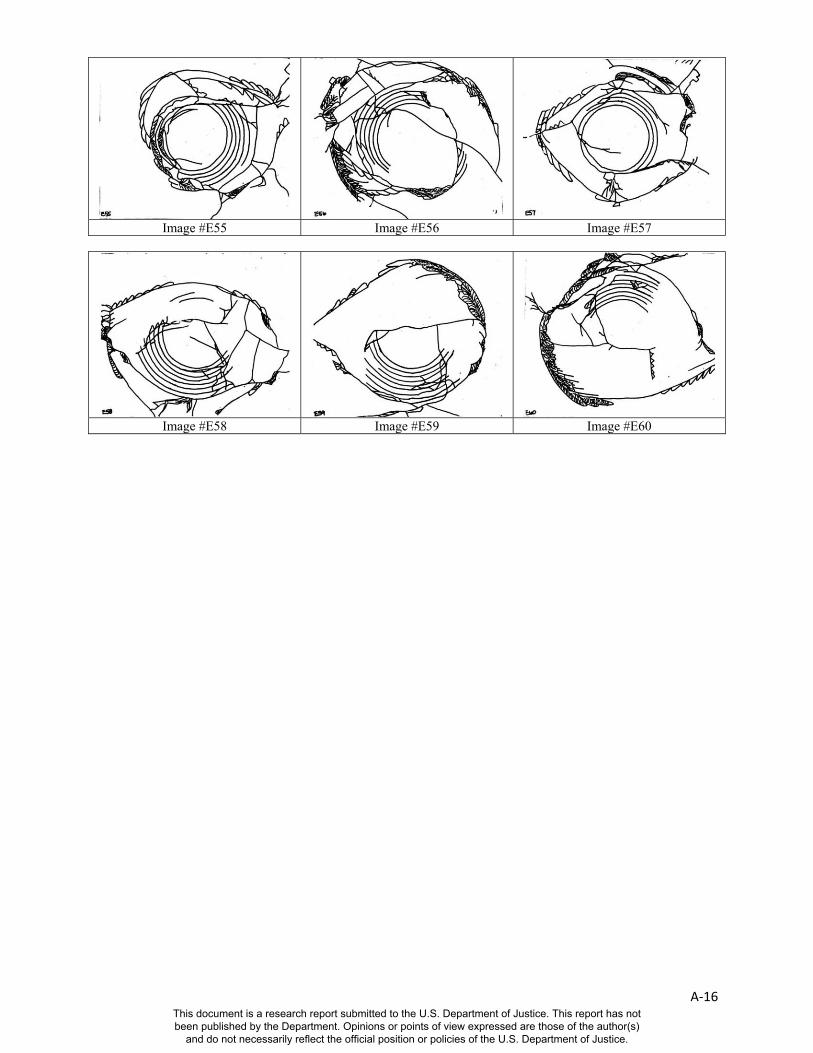
A‐16
Image #E55 Image #E56 Image #E57
Image #E58 Image #E59 Image #E60
This document is a research report submitted to the U.S. Department of Justice. This report has not been published by the Department. Opinions or points of view expressed are those of the author(s)
and do not necessarily reflect the official position or policies of the U.S. Department of Justice.
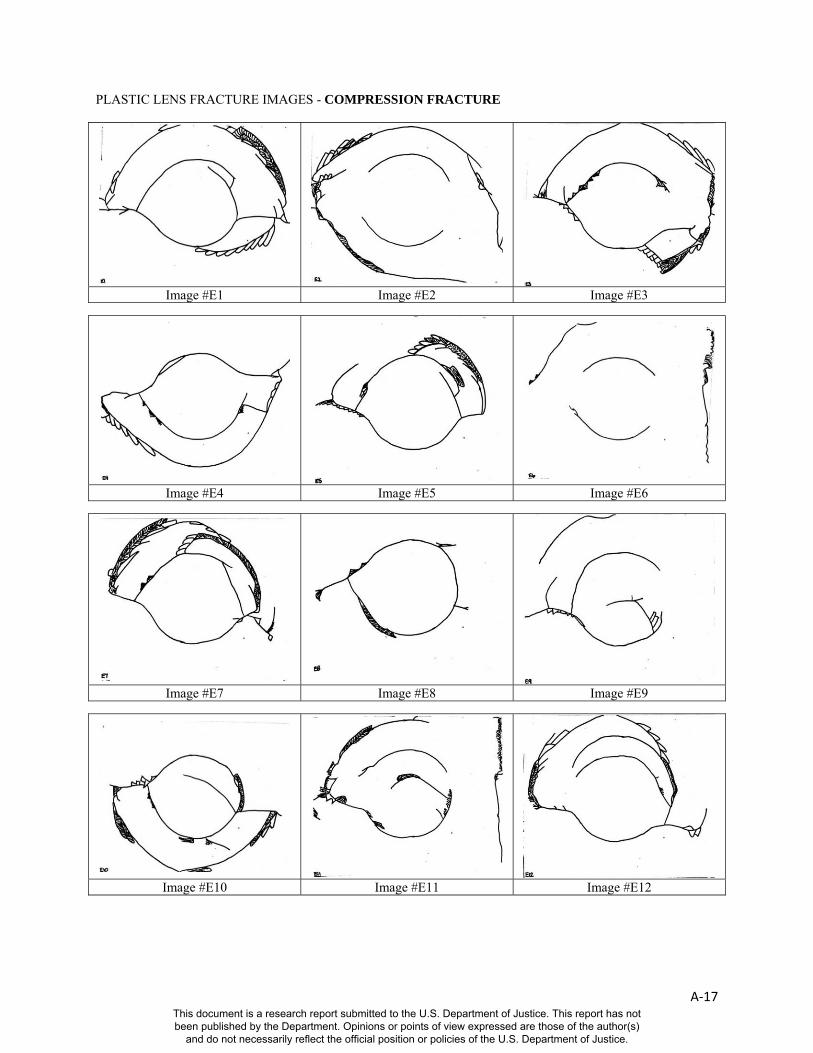
A‐17
PLASTIC LENS FRACTURE IMAGES - COMPRESSION FRACTURE
Image #E1 Image #E2 Image #E3
Image #E4 Image #E5 Image #E6
Image #E7 Image #E8 Image #E9
Image #E10 Image #E11 Image #E12
This document is a research report submitted to the U.S. Department of Justice. This report has not been published by the Department. Opinions or points of view expressed are those of the author(s)
and do not necessarily reflect the official position or policies of the U.S. Department of Justice.
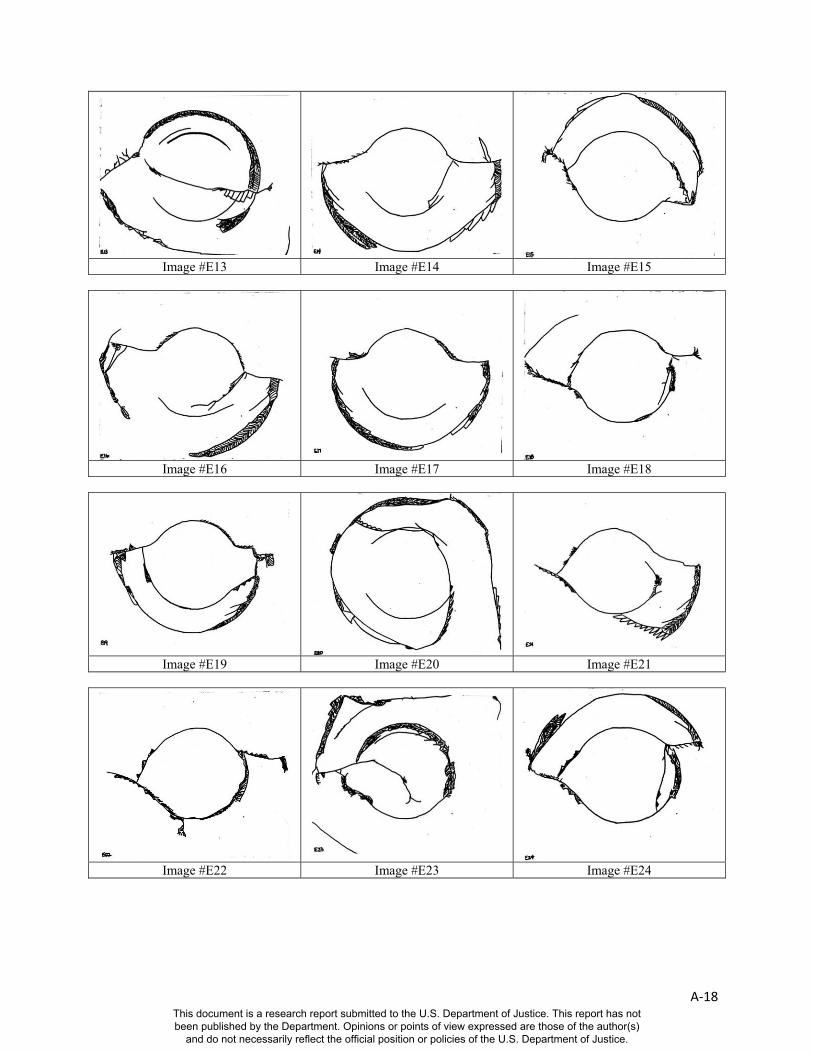
A‐18
Image #E13 Image #E14 Image #E15
Image #E16 Image #E17 Image #E18
Image #E19 Image #E20 Image #E21
Image #E22 Image #E23 Image #E24
This document is a research report submitted to the U.S. Department of Justice. This report has not been published by the Department. Opinions or points of view expressed are those of the author(s)
and do not necessarily reflect the official position or policies of the U.S. Department of Justice.
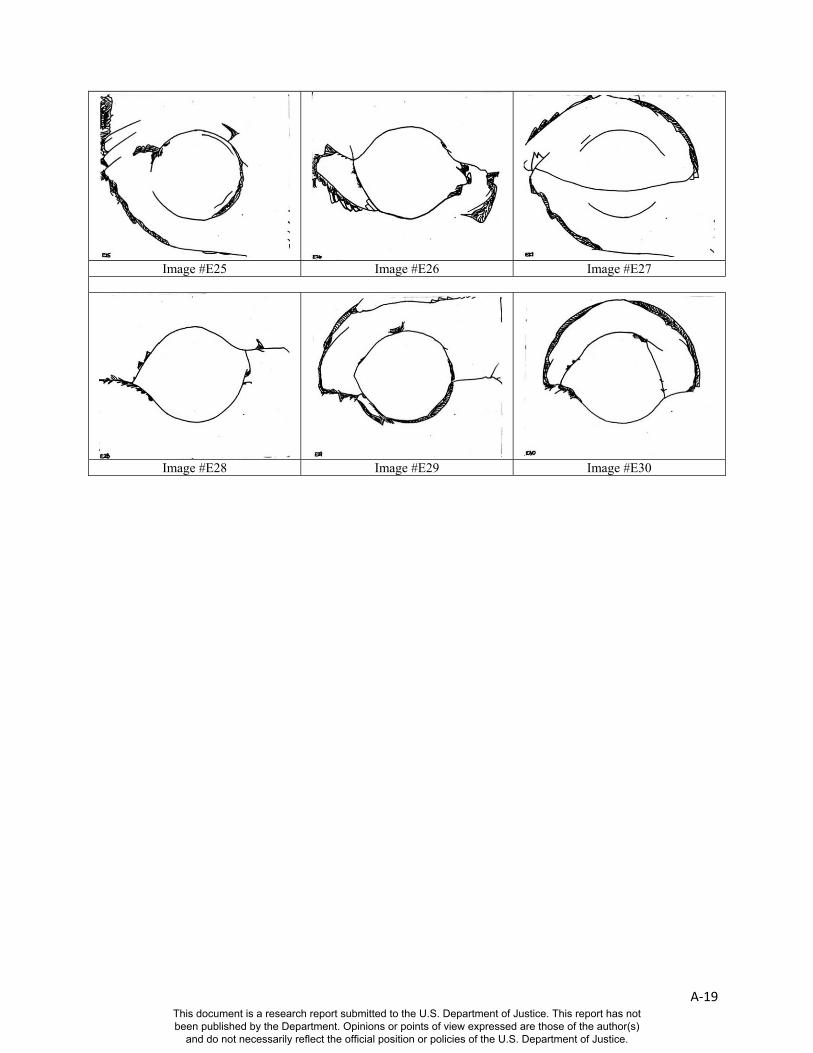
A‐19
Image #E25 Image #E26 Image #E27
Image #E28 Image #E29 Image #E30
This document is a research report submitted to the U.S. Department of Justice. This report has not been published by the Department. Opinions or points of view expressed are those of the author(s)
and do not necessarily reflect the official position or policies of the U.S. Department of Justice.
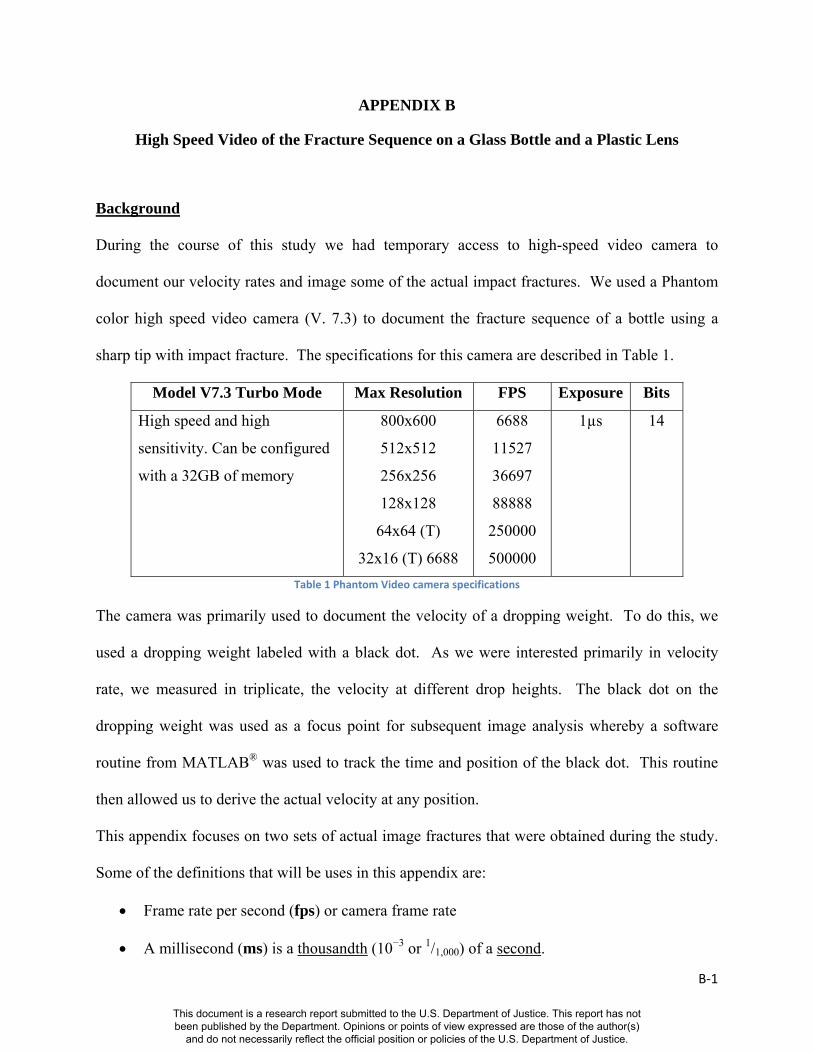
B‐1
APPENDIX B
High Speed Video of the Fracture Sequence on a Glass Bottle and a Plastic Lens
Background
During the course of this study we had temporary access to high-speed video camera to
document our velocity rates and image some of the actual impact fractures. We used a Phantom
color high speed video camera (V. 7.3) to document the fracture sequence of a bottle using a
sharp tip with impact fracture. The specifications for this camera are described in Table 1.
Model V7.3 Turbo Mode Max Resolution FPS Exposure Bits
High speed and high
sensitivity. Can be configured
with a 32GB of memory
800x600
512x512
256x256
128x128
64x64 (T)
32x16 (T) 6688
6688
11527
36697
88888
250000
500000
1µs 14
Table 1 Phantom Video camera specifications
The camera was primarily used to document the velocity of a dropping weight. To do this, we
used a dropping weight labeled with a black dot. As we were interested primarily in velocity
rate, we measured in triplicate, the velocity at different drop heights. The black dot on the
dropping weight was used as a focus point for subsequent image analysis whereby a software
routine from MATLAB® was used to track the time and position of the black dot. This routine
then allowed us to derive the actual velocity at any position.
This appendix focuses on two sets of actual image fractures that were obtained during the study.
Some of the definitions that will be uses in this appendix are:
Frame rate per second (fps) or camera frame rate
A millisecond (ms) is a thousandth (10−3 or 1/1,000) of a second.
This document is a research report submitted to the U.S. Department of Justice. This report has not been published by the Department. Opinions or points of view expressed are those of the author(s)
and do not necessarily reflect the official position or policies of the U.S. Department of Justice.

B‐2
A microsecond (µs) is equal to one millionth (10−6 or 1/1,000,000) of a second.
A nanosecond (ns) is one billionth (10−9 or 1/1,000,000,000) of a second.
Bottle Fracture Video
The conditions for this test were:
Frame rate: 60,085 fps
Seconds per frame: 1.664 x 10⁻⁵
Micro seconds per frame: 17 µs per frame
Bottle length base to beginning of the shoulder: 20.3 cm
We were interested in looking at the crack propagation rate of a fracture on a glass bottle. We
recorded two bottles undergoing such a dynamic fracture. The first bottle used a frame rate of ~
31,007 fps. This rate proved to be insufficient to look at fracture propagation. Thus we
increased the frame rate to 60,085 fps. The tradeoff for this increase is a reduction in image
resolution. Both drops were made from a 3.66 meter height.
We used a sharp tip to break the bottle illustrated in Figure 1. We listed T = 0 as the point when
we observed the tip touching the surface of the bottle. Due to the apparatus, we could not image
the actual point of contact on the bottle from the top and had to settle for a side image. It is
interesting to note that in both cases the point of impact is near the center of the bottle on the top
surface; however, the first visible fracture we could observe was at the base at T = 476 µs.
This fracture appears to propagate in a circular manner from the right side of the base of the
bottle. The bottle is in a Teflon™ milled, semi-circular cradle which is designed to only hold the
bottle in place. The bottom of the bottle is in actual contact with the aluminum base plate.
This document is a research report submitted to the U.S. Department of Justice. This report has not been published by the Department. Opinions or points of view expressed are those of the author(s)
and do not necessarily reflect the official position or policies of the U.S. Department of Justice.
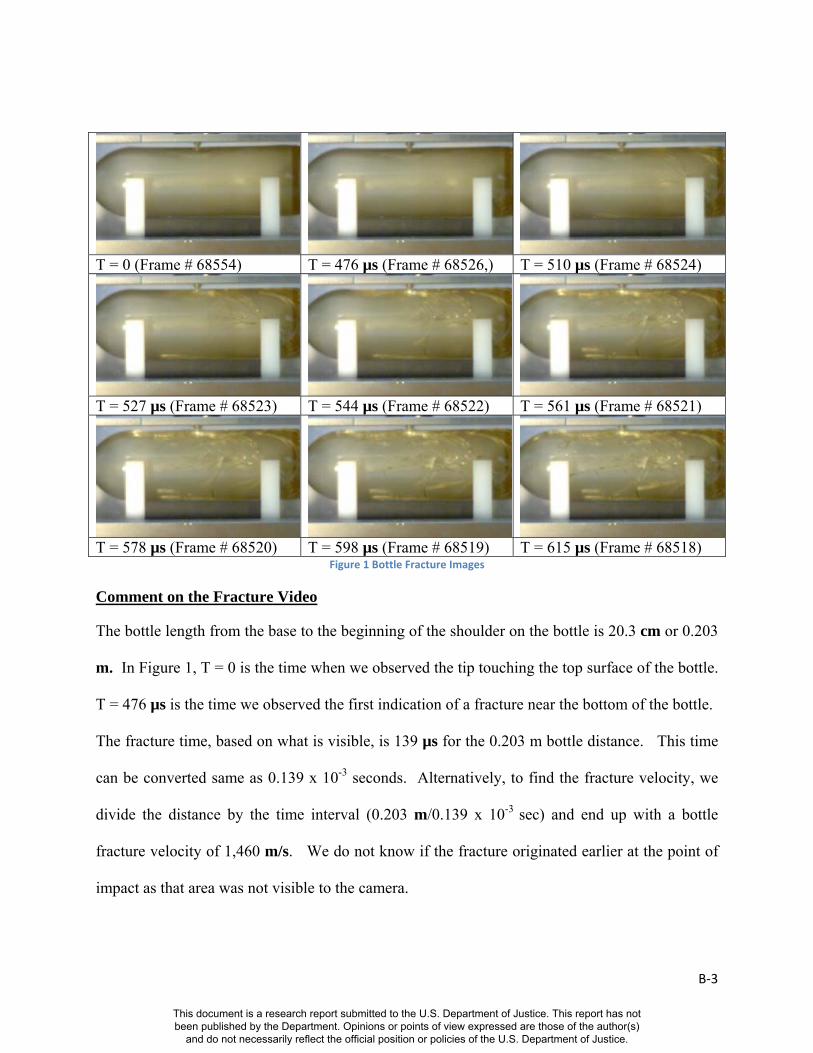
B‐3
T = 0 (Frame # 68554) T = 476 µs (Frame # 68526,) T = 510 µs (Frame # 68524)
T = 527 µs (Frame # 68523) T = 544 µs (Frame # 68522) T = 561 µs (Frame # 68521)
T = 578 µs (Frame # 68520) T = 598 µs (Frame # 68519) T = 615 µs (Frame # 68518)
Figure 1 Bottle Fracture Images
Comment on the Fracture Video
The bottle length from the base to the beginning of the shoulder on the bottle is 20.3 cm or 0.203
m. In Figure 1, T = 0 is the time when we observed the tip touching the top surface of the bottle.
T = 476 µs is the time we observed the first indication of a fracture near the bottom of the bottle.
The fracture time, based on what is visible, is 139 µs for the 0.203 m bottle distance. This time
can be converted same as 0.139 x 10⁻³ seconds. Alternatively, to find the fracture velocity, we
divide the distance by the time interval (0.203 m/0.139 x 10-3 sec) and end up with a bottle
fracture velocity of 1,460 m/s. We do not know if the fracture originated earlier at the point of
impact as that area was not visible to the camera.
This document is a research report submitted to the U.S. Department of Justice. This report has not been published by the Department. Opinions or points of view expressed are those of the author(s)
and do not necessarily reflect the official position or policies of the U.S. Department of Justice.
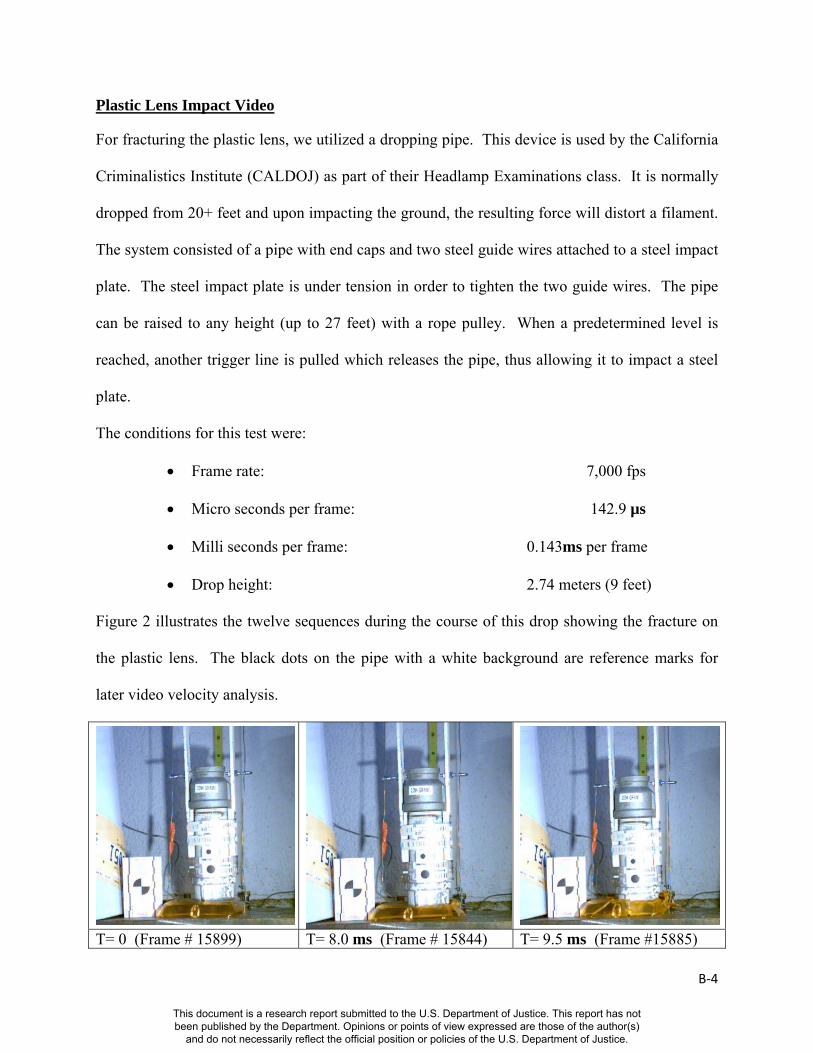
B‐4
Plastic Lens Impact Video
For fracturing the plastic lens, we utilized a dropping pipe. This device is used by the California
Criminalistics Institute (CALDOJ) as part of their Headlamp Examinations class. It is normally
dropped from 20+ feet and upon impacting the ground, the resulting force will distort a filament.
The system consisted of a pipe with end caps and two steel guide wires attached to a steel impact
plate. The steel impact plate is under tension in order to tighten the two guide wires. The pipe
can be raised to any height (up to 27 feet) with a rope pulley. When a predetermined level is
reached, another trigger line is pulled which releases the pipe, thus allowing it to impact a steel
plate.
The conditions for this test were:
Frame rate: 7,000 fps
Micro seconds per frame: 142.9 µs
Milli seconds per frame: 0.143ms per frame
Drop height: 2.74 meters (9 feet)
Figure 2 illustrates the twelve sequences during the course of this drop showing the fracture on
the plastic lens. The black dots on the pipe with a white background are reference marks for
later video velocity analysis.
T= 0 (Frame # 15899) T= 8.0 ms (Frame # 15844) T= 9.5 ms (Frame #15885)
This document is a research report submitted to the U.S. Department of Justice. This report has not been published by the Department. Opinions or points of view expressed are those of the author(s)
and do not necessarily reflect the official position or policies of the U.S. Department of Justice.
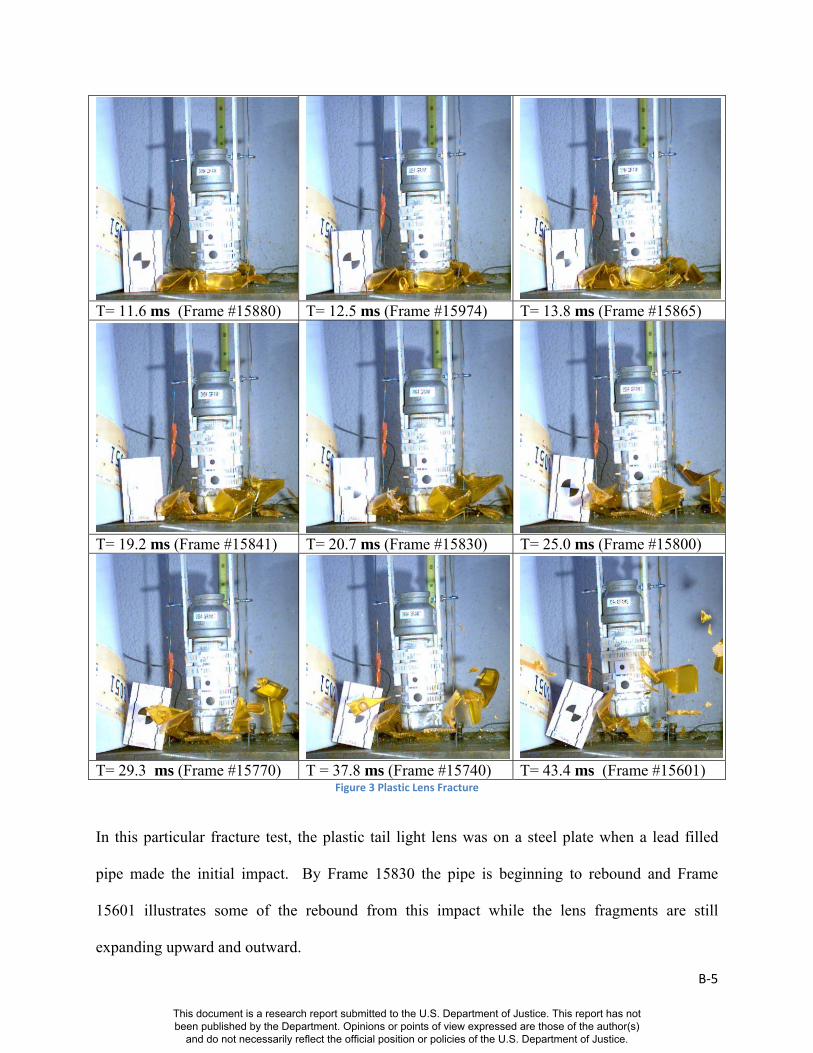
B‐5
T= 11.6 ms (Frame #15880) T= 12.5 ms (Frame #15974) T= 13.8 ms (Frame #15865)
T= 19.2 ms (Frame #15841) T= 20.7 ms (Frame #15830) T= 25.0 ms (Frame #15800)
T= 29.3 ms (Frame #15770) T = 37.8 ms (Frame #15740) T= 43.4 ms (Frame #15601) Figure 3 Plastic Lens Fracture
In this particular fracture test, the plastic tail light lens was on a steel plate when a lead filled
pipe made the initial impact. By Frame 15830 the pipe is beginning to rebound and Frame
15601 illustrates some of the rebound from this impact while the lens fragments are still
expanding upward and outward.
This document is a research report submitted to the U.S. Department of Justice. This report has not been published by the Department. Opinions or points of view expressed are those of the author(s)
and do not necessarily reflect the official position or policies of the U.S. Department of Justice.
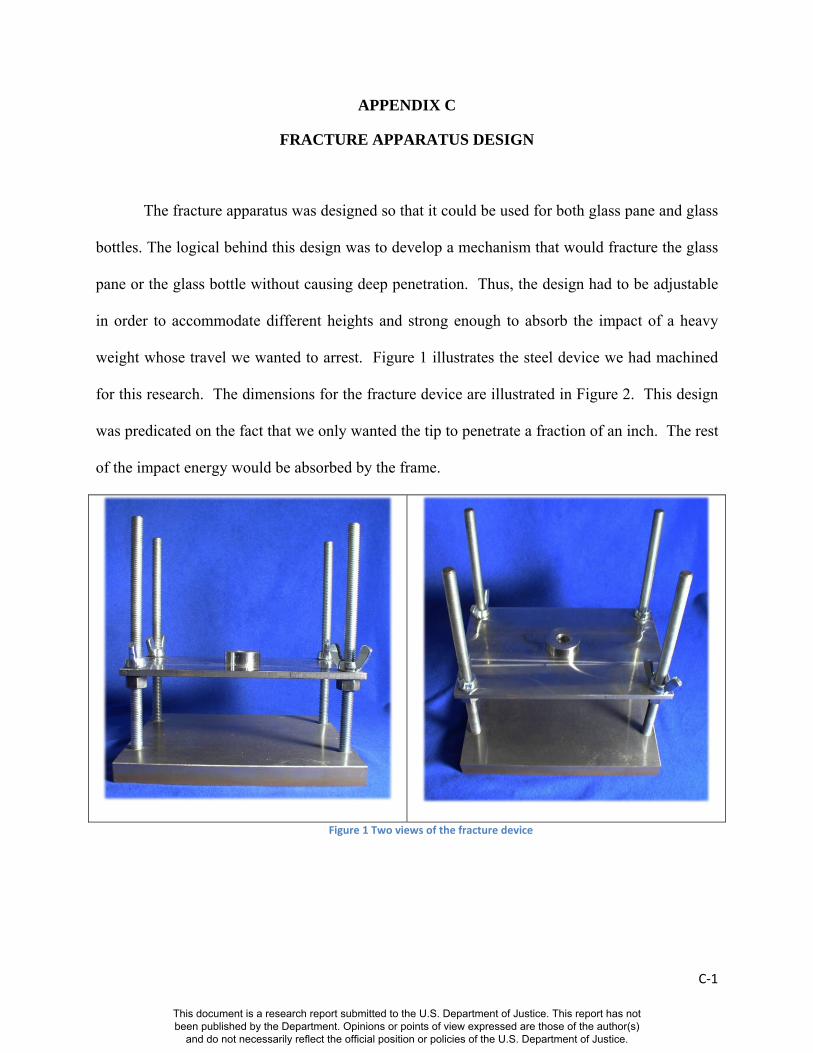
C‐1
APPENDIX C
FRACTURE APPARATUS DESIGN
The fracture apparatus was designed so that it could be used for both glass pane and glass
bottles. The logical behind this design was to develop a mechanism that would fracture the glass
pane or the glass bottle without causing deep penetration. Thus, the design had to be adjustable
in order to accommodate different heights and strong enough to absorb the impact of a heavy
weight whose travel we wanted to arrest. Figure 1 illustrates the steel device we had machined
for this research. The dimensions for the fracture device are illustrated in Figure 2. This design
was predicated on the fact that we only wanted the tip to penetrate a fraction of an inch. The rest
of the impact energy would be absorbed by the frame.
Figure 1 Two views of the fracture device
This document is a research report submitted to the U.S. Department of Justice. This report has not been published by the Department. Opinions or points of view expressed are those of the author(s)
and do not necessarily reflect the official position or policies of the U.S. Department of Justice.
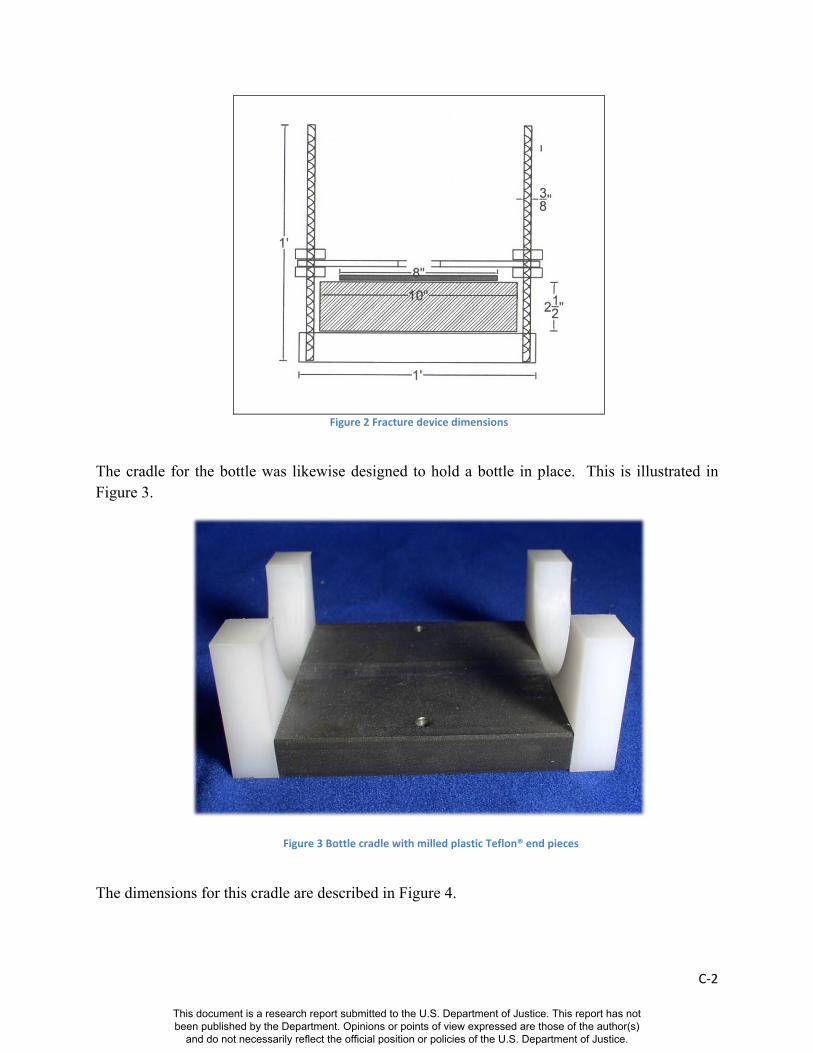
C‐2
Figure 2 Fracture device dimensions
The cradle for the bottle was likewise designed to hold a bottle in place. This is illustrated in Figure 3.
Figure 3 Bottle cradle with milled plastic Teflon® end pieces
The dimensions for this cradle are described in Figure 4.
This document is a research report submitted to the U.S. Department of Justice. This report has not been published by the Department. Opinions or points of view expressed are those of the author(s)
and do not necessarily reflect the official position or policies of the U.S. Department of Justice.
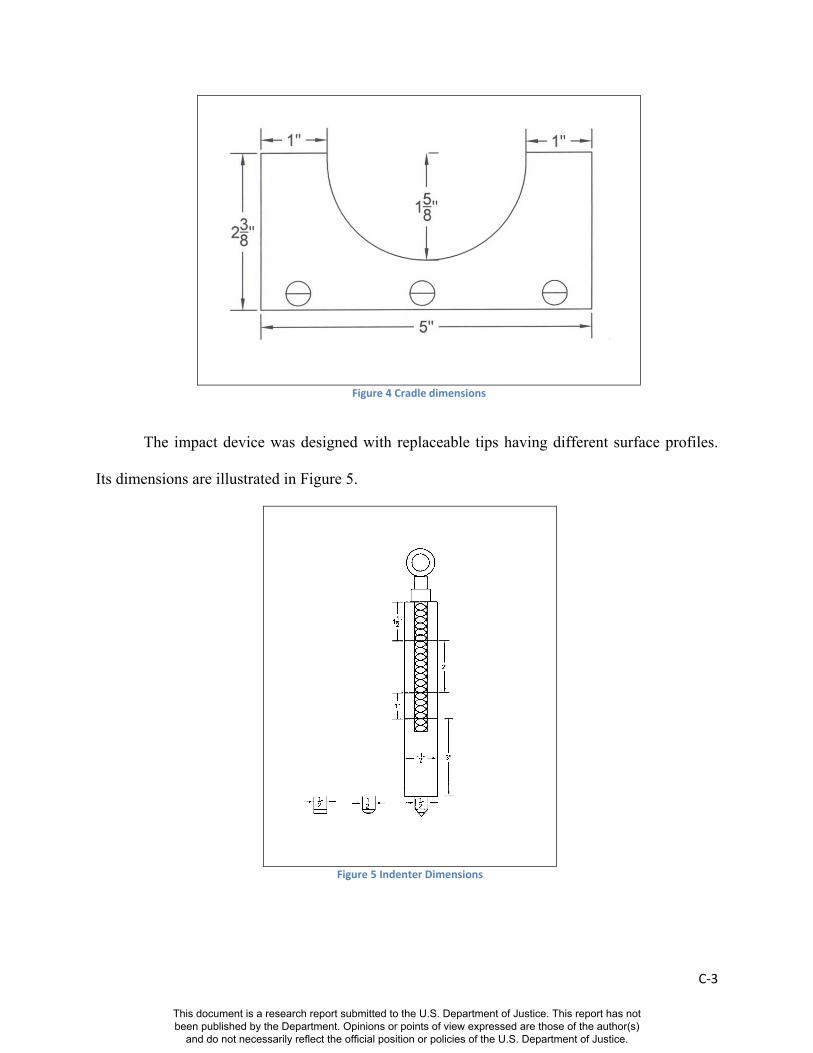
C‐3
Figure 4 Cradle dimensions
The impact device was designed with replaceable tips having different surface profiles.
Its dimensions are illustrated in Figure 5.
Figure 5 Indenter Dimensions
This document is a research report submitted to the U.S. Department of Justice. This report has not been published by the Department. Opinions or points of view expressed are those of the author(s)
and do not necessarily reflect the official position or policies of the U.S. Department of Justice.
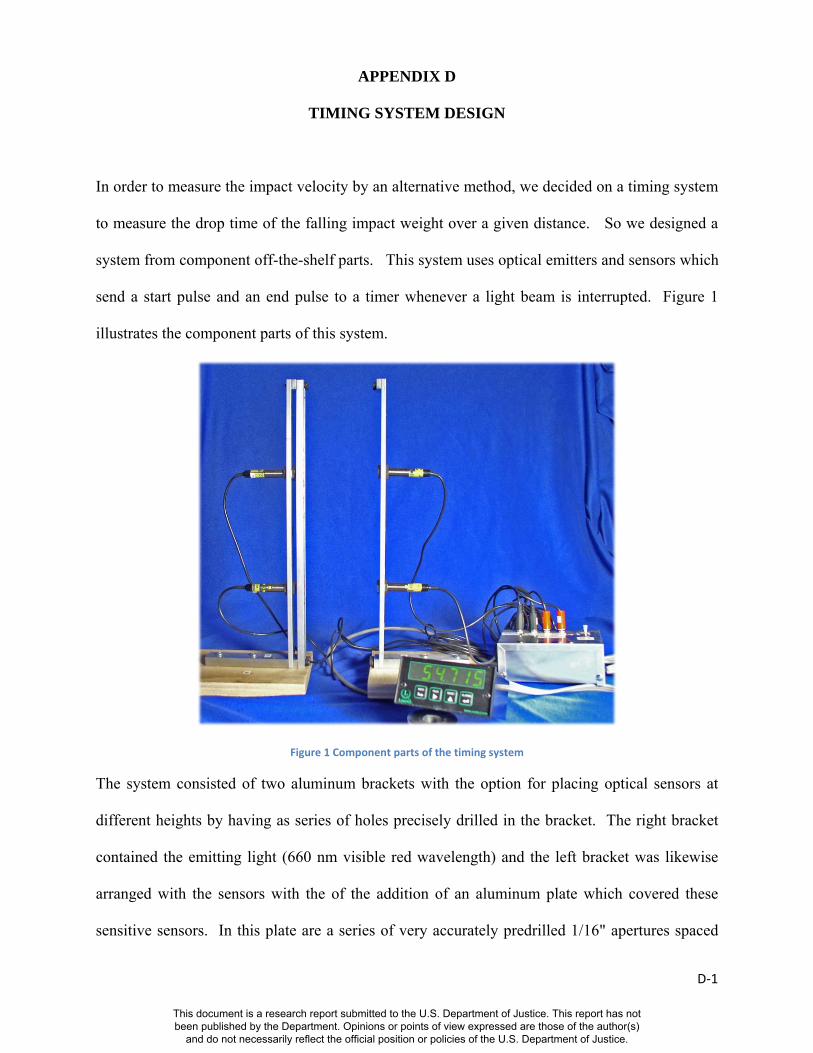
D‐1
APPENDIX D
TIMING SYSTEM DESIGN
In order to measure the impact velocity by an alternative method, we decided on a timing system
to measure the drop time of the falling impact weight over a given distance. So we designed a
system from component off-the-shelf parts. This system uses optical emitters and sensors which
send a start pulse and an end pulse to a timer whenever a light beam is interrupted. Figure 1
illustrates the component parts of this system.
Figure 1 Component parts of the timing system
The system consisted of two aluminum brackets with the option for placing optical sensors at
different heights by having as series of holes precisely drilled in the bracket. The right bracket
contained the emitting light (660 nm visible red wavelength) and the left bracket was likewise
arranged with the sensors with the of the addition of an aluminum plate which covered these
sensitive sensors. In this plate are a series of very accurately predrilled 1/16" apertures spaced
This document is a research report submitted to the U.S. Department of Justice. This report has not been published by the Department. Opinions or points of view expressed are those of the author(s)
and do not necessarily reflect the official position or policies of the U.S. Department of Justice.
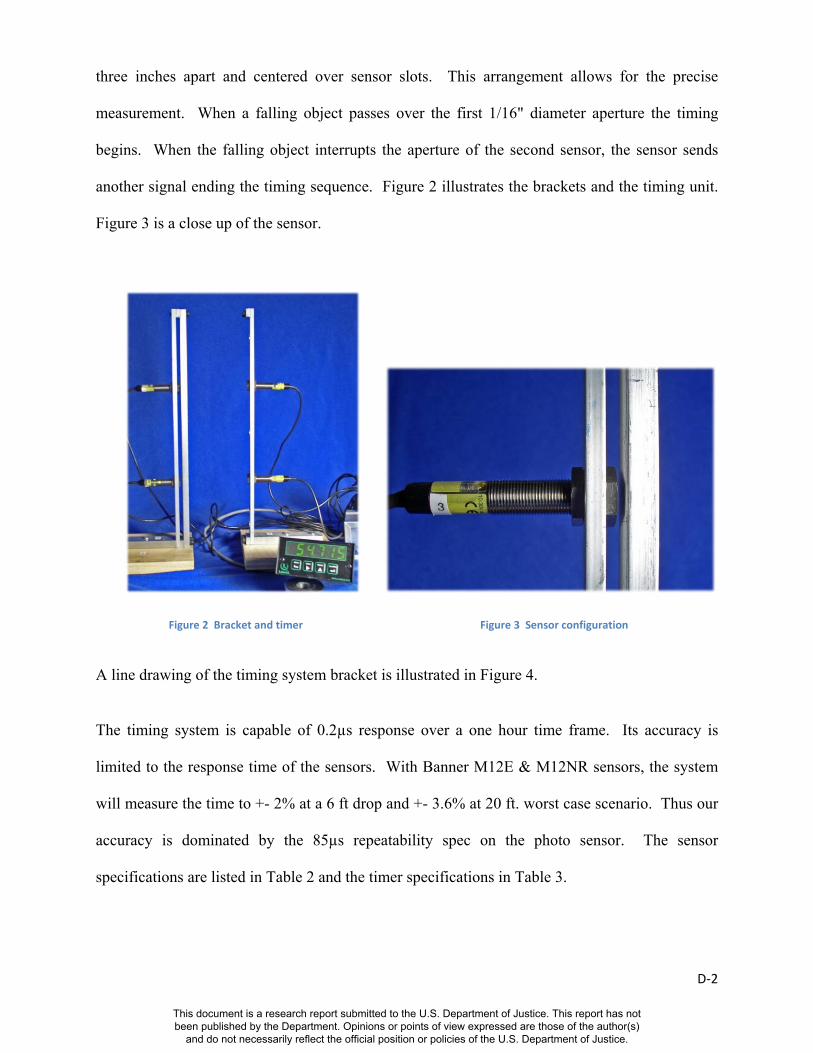
D‐2
three inches apart and centered over sensor slots. This arrangement allows for the precise
measurement. When a falling object passes over the first 1/16" diameter aperture the timing
begins. When the falling object interrupts the aperture of the second sensor, the sensor sends
another signal ending the timing sequence. Figure 2 illustrates the brackets and the timing unit.
Figure 3 is a close up of the sensor.
Figure 2 Bracket and timer Figure 3 Sensor configuration
A line drawing of the timing system bracket is illustrated in Figure 4.
The timing system is capable of 0.2µs response over a one hour time frame. Its accuracy is
limited to the response time of the sensors. With Banner M12E & M12NR sensors, the system
will measure the time to +- 2% at a 6 ft drop and +- 3.6% at 20 ft. worst case scenario. Thus our
accuracy is dominated by the 85µs repeatability spec on the photo sensor. The sensor
specifications are listed in Table 2 and the timer specifications in Table 3.
This document is a research report submitted to the U.S. Department of Justice. This report has not been published by the Department. Opinions or points of view expressed are those of the author(s)
and do not necessarily reflect the official position or policies of the U.S. Department of Justice.
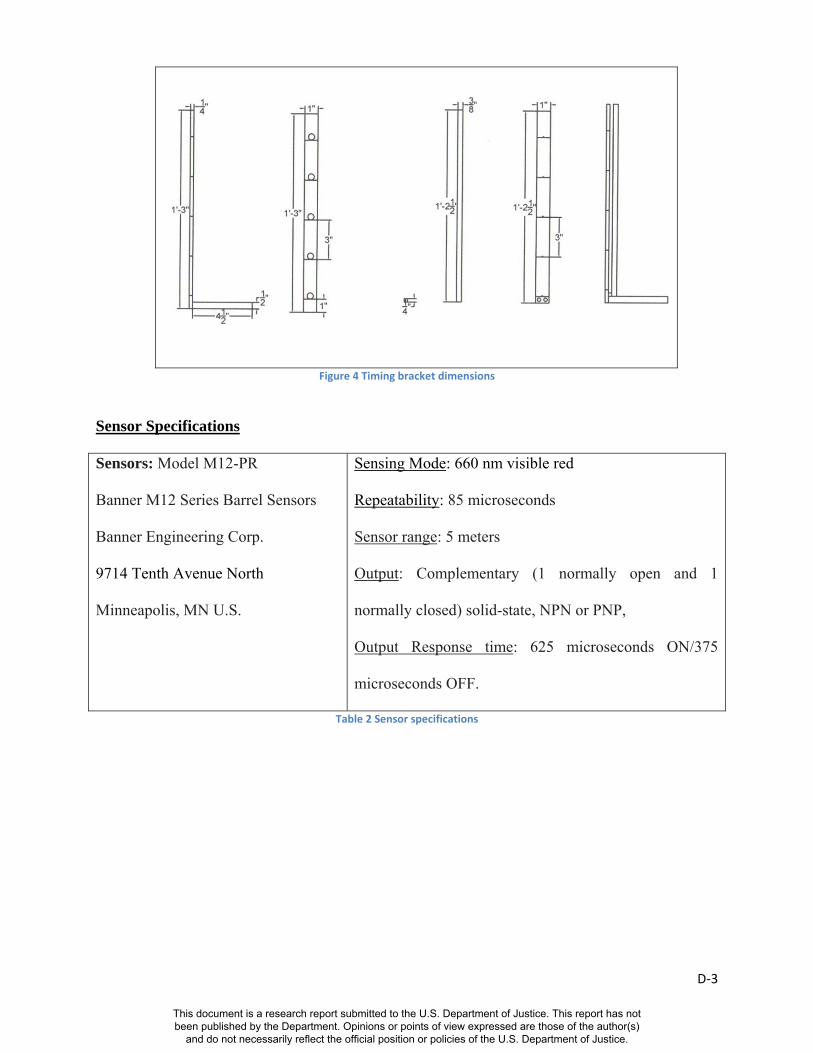
D‐3
Figure 4 Timing bracket dimensions
Sensor Specifications
Sensors: Model M12-PR
Banner M12 Series Barrel Sensors
Banner Engineering Corp.
9714 Tenth Avenue North
Minneapolis, MN U.S.
Sensing Mode: 660 nm visible red
Repeatability: 85 microseconds
Sensor range: 5 meters
Output: Complementary (1 normally open and 1
normally closed) solid-state, NPN or PNP,
Output Response time: 625 microseconds ON/375
microseconds OFF.
Table 2 Sensor specifications
This document is a research report submitted to the U.S. Department of Justice. This report has not been published by the Department. Opinions or points of view expressed are those of the author(s)
and do not necessarily reflect the official position or policies of the U.S. Department of Justice.
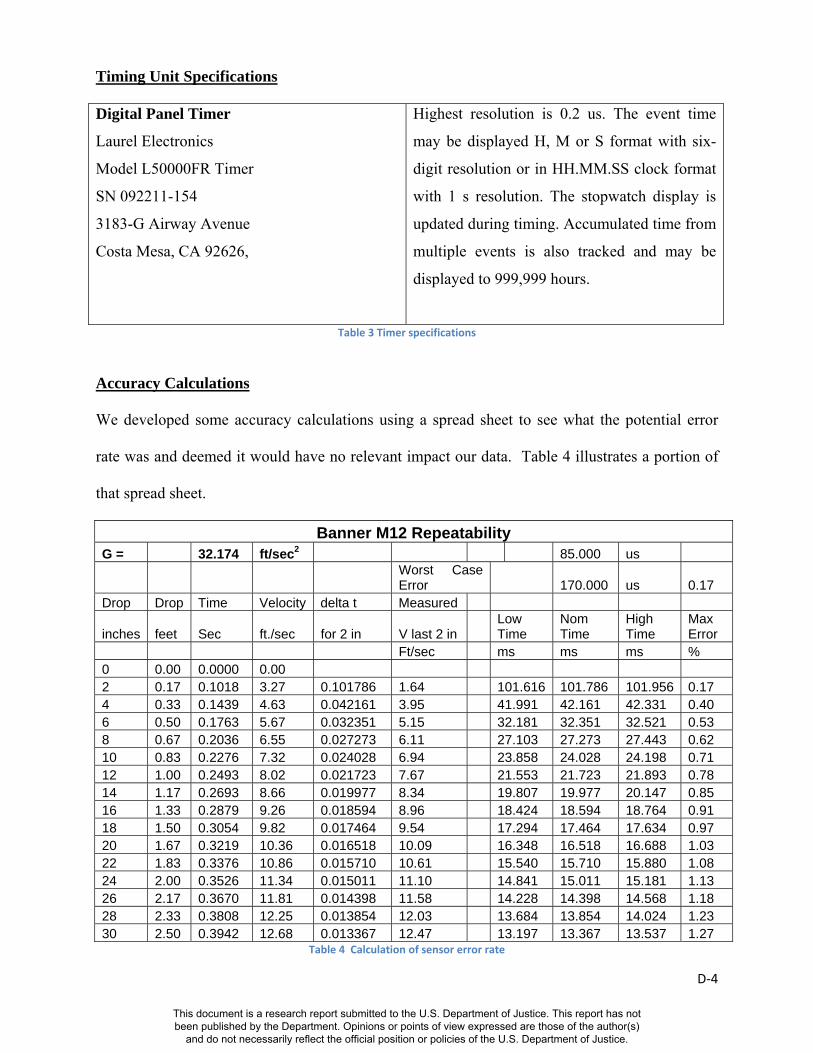
D‐4
Timing Unit Specifications
Digital Panel Timer
Laurel Electronics
Model L50000FR Timer
SN 092211-154
3183-G Airway Avenue
Costa Mesa, CA 92626,
Highest resolution is 0.2 us. The event time
may be displayed H, M or S format with six-
digit resolution or in HH.MM.SS clock format
with 1 s resolution. The stopwatch display is
updated during timing. Accumulated time from
multiple events is also tracked and may be
displayed to 999,999 hours.
Table 3 Timer specifications
Accuracy Calculations
We developed some accuracy calculations using a spread sheet to see what the potential error
rate was and deemed it would have no relevant impact our data. Table 4 illustrates a portion of
that spread sheet.
Banner M12 Repeatability
G = 32.174 ft/sec2 85.000 us Worst Case Error 170.000 us 0.17
Drop Drop Time Velocity delta t Measured
inches feet Sec ft./sec for 2 in V last 2 in Low Time
Nom Time
High Time
Max Error
Ft/sec ms ms ms % 0 0.00 0.0000 0.00 2 0.17 0.1018 3.27 0.101786 1.64 101.616 101.786 101.956 0.17 4 0.33 0.1439 4.63 0.042161 3.95 41.991 42.161 42.331 0.40 6 0.50 0.1763 5.67 0.032351 5.15 32.181 32.351 32.521 0.53 8 0.67 0.2036 6.55 0.027273 6.11 27.103 27.273 27.443 0.62 10 0.83 0.2276 7.32 0.024028 6.94 23.858 24.028 24.198 0.71 12 1.00 0.2493 8.02 0.021723 7.67 21.553 21.723 21.893 0.78 14 1.17 0.2693 8.66 0.019977 8.34 19.807 19.977 20.147 0.85 16 1.33 0.2879 9.26 0.018594 8.96 18.424 18.594 18.764 0.91 18 1.50 0.3054 9.82 0.017464 9.54 17.294 17.464 17.634 0.97 20 1.67 0.3219 10.36 0.016518 10.09 16.348 16.518 16.688 1.03 22 1.83 0.3376 10.86 0.015710 10.61 15.540 15.710 15.880 1.08 24 2.00 0.3526 11.34 0.015011 11.10 14.841 15.011 15.181 1.13 26 2.17 0.3670 11.81 0.014398 11.58 14.228 14.398 14.568 1.18 28 2.33 0.3808 12.25 0.013854 12.03 13.684 13.854 14.024 1.23 30 2.50 0.3942 12.68 0.013367 12.47 13.197 13.367 13.537 1.27
Table 4 Calculation of sensor error rate
This document is a research report submitted to the U.S. Department of Justice. This report has not been published by the Department. Opinions or points of view expressed are those of the author(s)
and do not necessarily reflect the official position or policies of the U.S. Department of Justice.