Embed Size (px)
Citation preview


Chorfa A., Madjoubi M. A., Hamidouche M., Bouras N., Rubio J., Rubio F.
226 Ceramics – Silikáty 54 (3) 225-234 (2010)
O&P analysis [13]. Even though the pile up effect is well described and predicted by finite element analysis [14, 15], we still rely on adequate imprints observation (AFM or SEM) to account for it [16-18]. Newly developed methods based on the deformation energies which do not rely on the displacement mea-surement [19-21] can be a solution for avoiding the pile-up effect. However, these methods need to be vali- dated experimentally to get recognition. Oliver and Pharr method with the necessary recommended cali-bration procedures (thermal drift, initial contact depth, instrument compliance and indenter geometry) and two methods based on deformation energies [19,20] are presented in the following.
Oliver and Pharr method
A typical load-displacement curve with principal parameters used in Oliver and Pharr’s analysis is re-presented in Figure 1. The definition of the indentation hardness HIT and the indentation modulus EIT using the notation specified in the Standard issued for instrumented indentation [21] are given below.
HIT = Fmax/Ap (1)
where Fmax is the peak load and Ap is the projected contact area at that load, defined as a function of the displacement hc, representing the indenter contact depth:
Ap = F(hc) (2)
with
hc = hmax - ε Fmax /S (3)
where S is the contact stiffness (S = dF/dh) corresponding to the slope of the upper portion of the unloading curve and ε is a constant depending on the indenter geometry whose value is 0.75 for most used indenters assimilated to a paraboloid of revolution.
Taking into account the non rigidity of the indenter, the reduced modulus Er, is related to the contact compliance C = dh/dF (inverse of the contact stiffness S) and the projected contact area Ap through the following relation:
(4)
The dimensionless parameter β is introduced to correct the lack of axial symmetry of pyramidal indenters (deviation of pyramidal indenters from the conical shape). It is usually taken as 1.034 for a Berkovich indenter [22]. In their revised analysis [11] O&P consider that a value of 1.05 is an acceptable choice. The indentation modulus EIT of the specimen material is related to the reduced elastic modulus Er and the indenter modulus Ei through the relation:
(5)
where νi and νs represent the Poisson coefficient for respectively the indenter and the specimen. The equation (4), derived for elastic contact can be used in elastic-plastic contact for any axisymmetric indenter.
Calibration procedures
Thermal drift
The thermal drift corresponds to changes in the instrument dimensions (expansion or contraction) cau- sed by the surrounding temperature variations. Even if the instrumented indentation equipments are usually well isolated thermally from the environment, small tem-perature fluctuations can result into errors on the mea-sured indenter displacements, particularly when working at a submicron scale. The thermal drift calibration is usually incorporated in the indentation test procedure. It consists on monitoring the displacement while holding constant the applied load at 10% of the peak load before complete unloading during a short period (~1mn) [10]. The rate of displacement “τ” obtained by linear regression, supposed constant during indentations tests, is used to correct the measured displacement data according to their instant of acquisition. The choice of a small load (10%of the peak load) enables to avoid or reduce any creep effect that can mask the drift effect.
Initial penetration depth
With the smallest load allowed by the used inden-tation instrument according to its resolution limit, a con-tact between the intender and the sample is established previously to any subsequent tests. This contact induces an initial penetration depth hi that should be added to the measured displacements.
Figure 1. Typical indentation load-displacement curve with principal parameters (from ISO/DIS 14577 norm).

Glass hardness and elastic modulus determination by nanoindentation using displacement and energy methods
Ceramics – Silikáty 54 (3) 225-234 (2010) 227
For static loading systems, The ISO/DIS 14577-1 draft standard recommends a polynomial fitting of the data up to 10% of the maximal indentation depth during the loading half cycle considering an elastic-plastic contact. The initial depth could therefore be estimated by extrapolation to zero load [13]. On the other hand, if we consider that the response of the material is elastic during the initial loading (smallest first loading points) with a blunted Berkovich indenter, we can use the following relation:
h = k(Fp - Fip) (6)
The constant k is also related to the indenter shape and Fi is the initial contact applied load. The determination of p and k enables to evaluate hi as (k Fi
p).
Instrument compliance
The instrument (loading frame) compliance can have an important influence on the measured displacement or the measured compliance, particularly at large depths. The instrument compliance should be established by the manufacturer [23]. However, considering eventual changes in the loading frame components, a simple calibration method is proposed using a reference material (fused silica) [11]. The total measured compliance (C = dh/dF) is the sum of the sample compliance 1/S and the instrument compliance. Using equation (4) for defining the sample compliance, the measured compliance is:
(7)
Introducing for the case of an ideal Berkovich indenter surface area (Ap = 24.5hc
2), which is acceptable only for large depth values, the measured compliance becomes:
(8)
From this equation, we can see that the plot of C versus 1/hc corresponds to a line whose intercept is the instrument compliance Cf. This equation can also be rewritten in terms of the peak load Fmax instead of the contact load hc by replacing Ap by (Fmax / HIT) using equation 1 as:
(9)
where Cf is the intercept of the linear plot of C versus1/(Fmax)1/2. In deriving the loading frame compliance by either the equation 8 or 9, it is recommended to discard the low values of hc where the indenter geometry can have an
influence on the constancy of the specimen properties Er and HIT and therefore induce errors on the linear regression [13,24]. It is also important to recall that there is a measurable experimental parameter F/S2 (peak load divided by the stiffness squared) of the tested material that is independent of the penetration depth. It is related to the ratio HIT/Er
2 according to the following expression
deduced from the equations (1) and (4):
(10)
This parameter, whose value should be constant at high depths where there is no influence of the indenter geometry, is useful in the determination or the verification of the instrument compliance [11].
Indenter geometry
The indenter area function Ap = F(hc) characterizes the variation of the projected surface area to account for deviation of the indenter geometry from the ideal geometry (the ideal surface area Ap for a Berkovich indenter is 24.5hc
2). This deviation is particularly important at small depths (near the indenter tip) when a blunted or imperfectly machined indenter is used. The area function can be obtained from equation (4) on a reference material (fused silica) knowing its corresponding value Er [10].
Methods based on the energy of deformation
The elastic, plastic and total indentation work energy can be derived from the load- displacement integrated areas represented in Figure 2.
Figure 2. Elastic and plastic indentation work (from ISO/DIS 14577 norm).

Chorfa A., Madjoubi M. A., Hamidouche M., Bouras N., Rubio J., Rubio F.
228 Ceramics – Silikáty 54 (3) 225-234 (2010)
Method of Cheng & Cheng
On the basis of a scaling analysis and finite element simulations, Cheng and Cheng (C&C) [19] established a linear correlation between the ratio of the irreversible work to the total work (Wt – We)/Wt and the ratio HIT/Er which leads to the following expression in terms of the elastic work over the total work We /Wt :
We /Wt = λ HIT/Er (11)
where λ is a constant that depends on the indenter geometry. For a Berkovich indenter (α = 70.3°), different values of λ were proposed in literature [25-28]. The use of relation (11) with the relation (10) defining the parameter F/S2 enables to determine separately the properties HIT and Er. Such a method which exempts us from the displacement measurements and all the necessary corresponding corrections is surely attractive because the indentation total and elastic works can be more accurately evaluated than the contact depth. It is particularly an interesting way to avoid the problem of an eventual pile up effect.
Method of Chen & Bull
J. Chen and S. J. Bull [20] questioned the linear relationship between We /Wt and HIT/Er observing that λ depends on the indenter geometry and also on the tested material. They developed a new relation between We/Wt and HIT/Er that is non linear and in which intervene the work hardening exponent n:
(12)
Comparing their relation with other developed relations [15,30,31,32], the authors noticed a better agreement with data. Using relations (1) and (4), they expressed separately the properties Er and HIT as:
(13)
(14)
Similarly to the C&C method, the evaluations of the elastic modulus Er and the indentation hardness HIT through equations (13) and (14) do not require any displacement or surface area measurement.
The main objective of this study is to compare the use of displacement O§P method with the two presented energy methods (C&C and C&B methods) in evaluating the mechanical properties HIT and Er of a soda lime glass and a borosilicate glass on a Micro Materials Nano Test. The properties values obtained by conventional means are taken as reference in this comparison. We begin by examining the relative effects of the different experimental sources of errors (initial depth, thermal drift, instrument compliance and indenter geometry) on the derived properties using O&P analysis according to the corresponding implemented calibrations.
EXPERIMENTAL
A soda lime glass (SLG) and a Pyrex borosilicate glass (BSG) with known properties were tested using a Micro Materials Ltd Nano Test equipment (MML NanoTest). The SLG and BSG samples of dimensions 10×10 mm2 were prepared from glass sheets of respec-tively 5 mm and 1.1 mm thickness. In order to eliminate any residual stresses on their initial polished surface state, the samples were submitted to an annealing treatment during two hours at 580°C. The chemical compositions of the two glasses, characterized by the X fluorescence and the bolometric methods, are presented on Table 1. Their main characteristics are given in Table 2. The MML Nano Test equipment used is a static system that functions with a horizontal loading mecha- nism. It is characterized by a loading range (0-500 mN) with a force and a displacement resolutions of respectively 0.1 mN and 0.1 nm. The equipment is well protected against significant thermal drift, ambient air flow and acoustic disturbance. It is equipped with a Nano-K bench top vibration isolation platform. The nanoindentations tests were done using a Berkovich indenter with an apex semi-angle (Θ = 65.27°) and effective cone angle (α = 70.3°). The projected contact area at a contact depth hc with a Berkovich indenter corresponds to 24.5 hc
2.
Table 1. Glass samples chemical composition.
Components (%) SiO2 Al2O3 Na2O K2O CaO MgO Fe2O3 MnO B2O3 TiO2 P2O5 ZrO2 Cr2O3
SLG 72.4 1.26 13.4 0.24 8.53 3.95 0.16 – – 0,063 0.018 0.05 //BSG 80.5 2.49 3.60 0.66 0.21 0.14 0.20 0.002 12.1 0.025 0.016 0.077 0.008
Table 2. Glass samples characteristics determined conventio-nally.
Hardness Elastic modulus Poisson Refractive Density (GPa) (GPa) coefficient index (g/cm3)
SLG 5.5 74 0.23 1.517 2.46BSG 6.4 63 0.17 1.473 2.23
Glass hardness and elastic modulus determination by nanoindentation using displacement and energy methods
Ceramics – Silikáty 54 (3) 225-234 (2010) 229
RESULTS AND DISCUSSION
Prior to the presentation of the experimental results corresponding to the different methods, typical load displacement curves obtained on SLG and BSG samples using multiloading indentations are shown in Figure 3. These reveal continuity on the loading cycles. The dwell times at peak load and at 10 % of the peak load, for respectively the creep and thermal drift effects, are apparent on these curves.
Oliver and Pharr method tests
Initial depth determination
Considering that the contact is elastic for the initial six loading points, we determined the constant k and p from equation (6) written in logarithm form as:
log h = log k + A log (Fp - Fip) (15)
We used for that purpose an iterative procedure starting with the hertzian contact value 2/3 for p [13] and with the initial used load (Fi = 0.03 mN). Figure 4
represents the plot of two curves obtained on the two glasses after convergence where the slope A approaches unity for a value of p = 0.68. The corresponding constant k value appears to be different for the glasses (63.87 and 54.00) for the SLG and BSG respectively). Using the relation (hi = k Fi
p), the initial obtained depths hi are respectively 5.88 nm and 4.97 nm, values to be added to the experimental depths. These initial depths were found to have a limited influence on the determined properties HIT and Er. A variation of less than 1 % and 0.5 % was observed on HIT and Er in general.
Effect of thermal drift
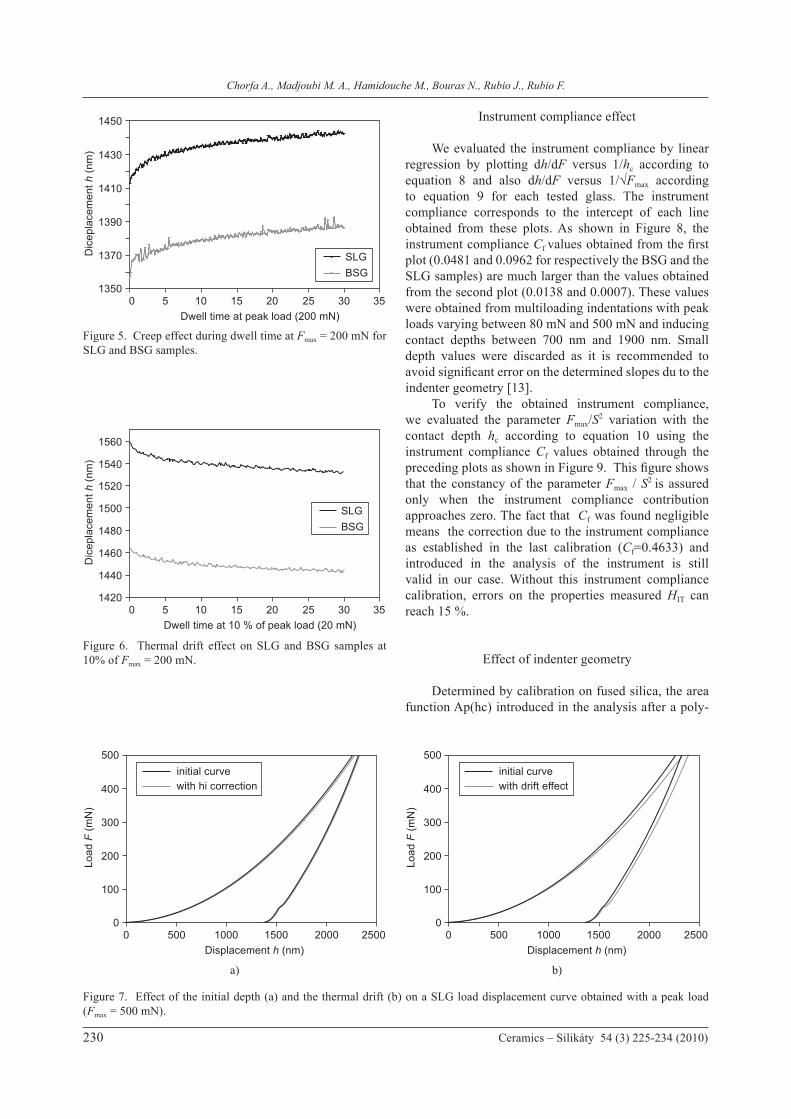
Before considering the thermal drift effect on the determined experimental depths, we remind that the peak load is retained for a period during 30 seconds before unloading in every test in order to reduce significantly the creep effect on the unloading process. The creep value CIT for both glasses, corresponding to the relative change of the indentation depth as a percentage obtained from Figure 5, does not exceed 2.5%. Examples of thermal drift curve for both glass samples are shown on Figure 6. They were obtained from a 60 seconds dwell at 10% of the peak load during the unloading half cycle. The thermal drift rate obtained on the linear part (last 40 seconds) corresponds to (τ = -0.145 nm/s). The experimental depths obtained should be corrected according to their acquisition time t by adding (τt). These corrections revealed their relative importance at large depths as we can observe from the changes on a typical curve obtained on a SLG sample using a peak load of 500 mN on Figure 7 representing the separate effect of the the thermal drift. Even though, the thermal drift effect seems more important than the initial depth effect, the variations caused by it do not exceed 2 % and 1 % respectively on the measured HIT and Er properties at large depths.
Figure 4. Plots of h versus (Fp - Fip) for the two glass samples
used for determining the initial depth.
Figure 3. Examples of multiloading indentation curves on glass samples.
a) BSG
b) SLG

Chorfa A., Madjoubi M. A., Hamidouche M., Bouras N., Rubio J., Rubio F.
230 Ceramics – Silikáty 54 (3) 225-234 (2010)
Instrument compliance effect
We evaluated the instrument compliance by linear regression by plotting dh/dF versus 1/hc according to equation 8 and also dh/dF versus 1/√Fmax according to equation 9 for each tested glass. The instrument compliance corresponds to the intercept of each line obtained from these plots. As shown in Figure 8, the instrument compliance Cf values obtained from the first plot (0.0481 and 0.0962 for respectively the BSG and the SLG samples) are much larger than the values obtained from the second plot (0.0138 and 0.0007). These values were obtained from multiloading indentations with peak loads varying between 80 mN and 500 mN and inducing contact depths between 700 nm and 1900 nm. Small depth values were discarded as it is recommended to avoid significant error on the determined slopes du to the indenter geometry [13]. To verify the obtained instrument compliance, we evaluated the parameter Fmax/S2 variation with the contact depth hc according to equation 10 using the instrument compliance Cf values obtained through the preceding plots as shown in Figure 9. This figure shows that the constancy of the parameter Fmax / S2 is assured only when the instrument compliance contribution approaches zero. The fact that Cf was found negligible means the correction due to the instrument compliance as established in the last calibration (Cf=0.4633) and introduced in the analysis of the instrument is still valid in our case. Without this instrument compliance calibration, errors on the properties measured HIT can reach 15 %.
Effect of indenter geometry
Determined by calibration on fused silica, the area function Ap(hc) introduced in the analysis after a poly-
Figure 6. Thermal drift effect on SLG and BSG samples at 10% of Fmax = 200 mN.
Figure 5. Creep effect during dwell time at Fmax = 200 mN for SLG and BSG samples.
Figure 7. Effect of the initial depth (a) and the thermal drift (b) on a SLG load displacement curve obtained with a peak load (Fmax = 500 mN).
b)a)

Glass hardness and elastic modulus determination by nanoindentation using displacement and energy methods
Ceramics – Silikáty 54 (3) 225-234 (2010) 231
nomial fitting was (23.067464 hc2 + 1912.181708 hc + 40392.994925). In comparison with the ideal surface area for a Berkovich indenter (24.5 hc2), this correction has an important effect particularly on the hardness property at the smallest depths as shown in Figure 10. We notice that the apparent ISE effect is considerably reduced on both glasses.
Energy methods tests
The obtained variation of the elastic, plastic and total work with the indentation peak load for the two tested materials is presented in Figure 11. We can notice that the elastic work values are greater than those of the plastic work for the BSG whereas the opposite occurs for the SLG. The elastic recovery is more important on the BSG sample.
Tests based on linear energy method(Cheng & Cheng method)
We tested the effect of the constant λ on the derived properties HIT and Er using the equations 11 and 10 for the two glass samples. Among the different values proposed in literature [25-28] for a Berkovich indenter, we chose three values (λ = 5.33, 5.17 and 4.678). The results of the influence of the constant λ on the derived properties for each glass sample are shown in Figures 12 and 13. In comparing with what is expected for the two materials (properties derived by conventional means in Table 2), the results obtained using (λ = 5.33) can be considered as acceptable for the SLG sample (Figure 12). This is not the case, however, for the BSG sample. The lower values (λ = 5.17) and (λ = 4.678) are more appropriate for respectively the indentation hardness and the reduced modulus of the BSG sample (Figure 13). It seems that there is no easy choice for a common λ value that would work for both glasses.
Figure 8. Instrument compliance determination, (a) using dh/dp vs 1/hp plot, (b) using dh/dp vs 1/Fmax½.
Figure 9. Variation of the parameter Fmax/S2 with the contact depth hc for Cf = 0.01.
b)
b) SLG
a)
a) BSG

Chorfa A., Madjoubi M. A., Hamidouche M., Bouras N., Rubio J., Rubio F.
232 Ceramics – Silikáty 54 (3) 225-234 (2010)
Figure 10. Effect of the calibrated surface area on the indentation hardness.
Figure 11. Variation the elastic, plastic and total indentation energy with peak load Fmax.
b) BSG
b) SLG
a) SLG
a) BSG
Figure 12. Influence of the constant λ on Er (a) and HIT (b) obtained by Cheng and Cheng method [19] on SLG.
b)a)

Glass hardness and elastic modulus determination by nanoindentation using displacement and energy methods
Ceramics – Silikáty 54 (3) 225-234 (2010) 233
Figure 13. Influence of the constant λ on Er (a) and HIT (b)obtained by Cheng & Cheng method [19] on BSG.
Figure 14. Comparison of variation of HIT for BSG (a) and for SLG (b) obtained using energy methods (Cheng & Cheng, Chen & Bull) and Oliver & Pharr method [19,20,10].
b)
b) SLG
a)
a) BSG
Figure 15. Comparison of variation of Er for BSG (a) and for SLG (b) obtained using the energy methods (Cheng & Cheng, Chen & Bull) and Oliver & Pharr method [19,20,10].
b) SLGa) BSG

Chorfa A., Madjoubi M. A., Hamidouche M., Bouras N., Rubio J., Rubio F.
234 Ceramics – Silikáty 54 (3) 225-234 (2010)
Comparison of Energy methodswith Oliver and Pharr method
We also derived the two glasses properties (HIT
and Er) according to the nonlinear C&B energy method using the relations 13 and 14. The work hardening exponent n is null in our case and the others constants were taken as defined previously (ε = 0.75, β = 1.05 and α = 70.3°). Comparison of HIT and Er variations obtai-ned by this method and those obtained by the linear (C&C) energy method revealed that they are close when λ = 5.3, particularly for the borosilicate glass, as shown in Figures 14 and 15. On the other hand, if we compare the reference properties (Table 2) with the results from the three methods at large depths, we can see that for the soda lime glass, they are close to those obtained by the energy methods whereas for the borosilicate glass, they are rather comparable to those obtained by O&P analysis.
CONCLUSION
The comparison made between the displacement O&P method with those based on the indentation energy in determining the hardness and the elastic modulus of two glasses (soda lime glass and borosilicate glass) revealed the following observations: The qualitative assessment of the properties HIT and Er obtained by O&P method depends on the calibrations performed for correcting different error sources. The loading frame compliance has an important influence on the evaluated properties. Its implementation in the analysis was verified by linear regression of the variation of the measured compliance in terms of peak load Fmax and also by examining the constancy of the parameter Fmax/S2 at large depths. The calibrated surface area obtained on fused silica led to a significant reduction in the apparent hardness ISE effect at small depths. The effects of the initial depth and the thermal drift are relatively less important in our case. The application of the energy methods based on a linear relationship between We/Wt and HIT/Er showed a dependency of the constant λ on the tested material. For a value of λ = 5.3, the results obtained by this method are close to those obtained by the non linear method proposed by Chen and Bull. The comparison with the reference values obtained by conventional means revealed that these energy methods gave acceptable results for the soda lime glass. The borosilicate glass reference properties are rather close to those obtained by Oliver and Pharr method.
References
1. Wolf B., Paufler P.: Phys. Stat. Sol. A, 341 (1999). 2. Pharr G. M.: Mater. Sci. Eng. 253, 151 (1998).3. Tabor D.: Phil. Mag. A 74, 1207 (1996).
4. Nix W. D., Gao H.: J. Mech. Phys. Solids 46, 411 (1998).
5. Ma Q., Clarke D. R: J. Mater. Res. 10, 853 (1995).6. Swadener J. G., Taljat B., Pharr G. M.: J. Mater. Res.
6, 2091 (2001). 7. Pethica J.B., Hutchings R., Oliver W.C.: Phil. Mag. A
48, 593 (1983). 8. Tabor D.: Proc. R. Soc. Lond. A 192, 247 (1948).9. Bulychev S. I., Alekhin V. P., Shorshorov M. K.,
Ternorskii P.: Zavod. Lab. 41, 11137 (1975).10. Oliver W. C., Pharr G. M.: J. Mater. Res 7, 1564
(1992). 11. Oliver W. C., Pharr G. M.: J. Mater. Res. 19, 3 (2004). 12. Bhushan B.: Handbook of micro/nanotribology, 2nd ed.,
CRC Press, Boca Raton (FL) 1999.13. Fischer-Cripps A. C.: Nanoindentation, 2nd ed, Sprin-
ger, New York 2004.14. Bolshakov A., Pharr G. M.: J. Mater. Res. 13, 1049
(1998).15. Hay J. C., Bolshakov A., Pharr G. M.: J. Mater. Res.
14, 2296 (1999).16. Randall NX, Julia-Schmutz C., Soro J. M.: Surf.
Coat.Tech. 108, 489 (1998).17. Mcelhaney K., Vlasaak J., Nix W.: J. Mater. Res. 13,
1300 (1998).18. Hay J. L., Pharr G. M.: Instrumented indentation
testing, ASM Handbook, Vol 8, Mechanical testing and evaluation,10 ed, p.232-243, Materials Park, OH 2000.
19. Cheng Y. T., Cheng C. M.: Mat. Sci.Eng. R 44, 91 (2004).
20. Chen J., Bull S. J.: J. Mater. Res. 24, 590 (2009).21. ISO 14577, Metallic materials-Instrumented indenta-
tion test for hardness and materials parameters. ISO Central Secretariat, 1 rue de Varembé, 1211 Geneva 20 Switzerland
22. King R. B.: Int. J. Sol. Str. 2, 1657 (1987).23. Hay J. L., Pharr G. M.: Instrumented indentation
testing, The university of Tennesse and Oak Ridge national laboratory.
24. Meza J. M., Franco E. E., Buiochi F., Farias C. M., Souza R. M. et al.: Rev. Metal. Madrid. 44, 52 (2007).
25. Cheng Y. T., Li Z., Cheng C. M.: Phil. Mag. A 82 (2002).
26. Cheng Y. T., Cheng C. M.: Appl. Phys. Lett. 73, 614 (1997).
27. Giannakopoulos A.E., Suresh S.: Scr. Mater. 40, 1191 (1999).
28. Ma D., Chung W., Liu J., He J.: Sci. China. Ser. E 47, 398 (2004).
29. Alkorta J., Marttinez-Esnaola J. M., Sevillano J. G.: J. Mater. Res. 21, 302 (2006).
30. Malzbender J.: J. Mater. Res. 20, 1090 (2005).31. Venkatesh T. A., Van Vleit K. J., Ginnakopoulos A.
E., Suresh S.: Scri. Mater. 42, 833 (2000).32. Malzbender J., G de With: J. Mater. Res 17, 502
(2002).