Embed Size (px)
Citation preview

Which? works for you December 2012
A!ordableEnergy Campaign
The Retail Market

Xxxxxxxxxxxxxxxxxxxx00
3 Executive summary
7 Chapter 1 Background to the marketGiving power to the people
10 Chapter 2 Indicators of competitionGetting the measure of the market
16 Chapter 3 The paradoxWorried but disengaged consumers
20 Chapter 4 What’s gone wrongCauses of consumer disengagment
27 Chapter 5 Conclusions and recommendationsFixing the broken market
Which? exists to make individuals as powerful as the organisations they have to deal with in their daily lives
Contents
0503The imbalance of power The retail market
The full liberalisation of the energy market in Britain was an international first. This experiment in competition placed consumers in the driving seat. Competitive prices would be achieved through individuals choosing the best products, and so keeping wholesale and retail prices in check. The government of the time expected ‘everyone to benefit from competition’ including ‘poorer consumers’.
Almost fifteen years on, and in stark contrast to that aim, the current regime of competition in energy is failing consumers. Despite energy prices consistently being their number-one financial concern, around three quarters of consumers are paying more than they need on expensive standard tariffs – a collective overpayment Which? estimates to be some £4bn annually.
It is vital that a critical mass of consumers successfully switches – or at least, threatens to switch – to a genuinely better deal if energy prices are to be kept in check. Yet the regulator’s own research shows that the vast majority – up to 90% - do not engage with the market.
The limited competition that does exist is played out in a small segment of the market – made up of as few as 5 to 10% of all consumers - where the six major suppliers and a few of the new entrants vie for the most determined, engaged and usually more affluent consumers with attractive fixed-term deals. In effect, the energy ‘market’ is an oligopoly of six, large, vertically-integrated suppliers that do not face genuine competition for the vast majority of their customers.
In theory, competition could work effectively in energy. The products are homogenous and price is the only point of difference that matters to most people. Unfortunately, for too long policymakers seem to have subscribed to the belief that consumers will do whatever is required to find out price information, no matter how complex and time-consuming the task. As a result, market conditions have been allowed to emerge that make it almost impossible for consumers to see and understand the price they are currently paying or that competitors would charge them. With price obfuscation endemic, there is no chance that consumers can successfully play their allocated role as the engine of competition.
Radical reforms are needed if competition in energy is to work – reforms that build on, but must go beyond, those currently proposed by Ofgem in its Retail Market Review, even when combined with the recent ‘lowest tariff’ commitment from the Prime Minister.
Executive summary
The intense financial pressure that persistently rising energy prices are putting on already hard-pressed consumers demands visible action.

04 The imbalance of power The retail market
Executive summary
Action is needed now, and with a tight timetable for review – no later than 2015 - to ensure that the reforms are having an impact. Without significant improvement the whole concept, and associated costs, of a liberalised market for energy should be fully reviewed against other options, including the introduction of stronger consumer protections on price. In summary, our proposals are as follows:
1 Introduce unit pricing – deliver ‘at a glance’ comparability by charging the same price for each unit of energyCompetition cannot begin to work until prices are displayed in a consistent form that makes it easy to identify the cheapest tariff ‘at a glance’. This means moving to a single price per unit of energy. This can be achieved by:
Abolishing standing charges, tiered rates and complex discounts which have served to obscure prices;
Setting the unit price for direct debit payment, with surcharges for other payment methods applied separately in pounds and pence;
Requiring dual fuel and online account management discounts also to be presented as a universal amount priced in pounds and pence and available on all tariffs offered by a supplier; and
Presenting the key features of the tariff in its name (eg fixed or variable price, fixed-term or open-ended etc).
These measures would bring full comparability to all single-rate tariffs - that’s about 80% of current tariffs. Economy 7 tariffs could be given an indicative ‘weighted’ unit rate, calculated using the average split between day-time and night-time use.
2 Limit segmentation – allow one default tariff and make all tariffs available for all payment methods Suppliers currently segment the market, effectively restricting the availability of the most attractive products to a minority of customer groups. This can be addressed in conjunction with the unit price proposals by:
Restricting suppliers to one open-ended variable rate ‘default’ tariff per fuel;
All other tariffs to be fixed-term and either fixed price or clearly linked to a transparent wholesale market index (assuming one develops) that suppliers have no direct influence over;
Ensuring that every tariff is available for all payment and account management methods, with surcharges and discounts applied set out in the unit pricing recommendation above; and
Ensuring that all tariffs are available through all sales channels.
3 Ofgem to review the case for national pricingNational pricing could make the pricing policies we have proposed even simpler and more visible, driving competition harder by enabling prices to appear in advertising and best buy tables which tend to operate nationally. Ofgem should undertake a review of the case for national pricing, including full cost-benefit analysis, reporting no later than Autumn 2013.
Which? believes that the solutions outlined here would finally give competition in the retail energy market a chance to succeed. This is essential for two reasons. The intense financial pressure that persistently rising energy prices are putting on already hard-pressed consumers demands visible action. Action is also needed to convince consumers to play their part in meeting the challenges of decarbonisation and renewing Britain’s energy infrastructure. They are expected to pick up bills anticipated to total well over £100 billion, as well as significantly change their energy use. If people continue to believe that the retail energy market is unfairly balanced in favour of energy suppliers and their shareholders, they are unlikely to accept these demands.

0505The imbalance of power The retail market
Executive summary
4 Switching sites and the switching process must be improvedSwitching sites would still be able to offer a useful service to consumers even after the introduction of unit pricing, but the calculations and switching process must be improved. In particular:
Calculators should take exit fees and seasonality of consumption into account. They should also apply price changes only from the date they begin. These changes would give consumers a more accurate impression of any potential savings;
To enable exit fees to be incorporated into the calculations, suppliers should be required to use exit fees that only expire on a set date for everyone;
To reduce errors and hassle, energy suppliers should also implement ‘no bill switch’ technology to provide key tariff and consumption data direct to switching sites;
And the time it takes to switch should be reduced to three weeks (including the cooling-off period), bringing Britain in line with the EU Third Energy Package.
5 Ensure that market conditions – in the retail and wholesale markets - enable new entrants to thrive The Retail Market Review proposals plus the Which? recommended measures should make it possible for consumers to compare prices, and will also limit the scope for suppliers to segment the market. With prices for all customer groups more visible, the possibility of incumbents using sticky customers to cross-subsidise offers that independents find difficult to match will be restricted.
However, while these measures should make the retail market a more attractive place for new players, they will not on their own bring about the more accessible playing field that is required. There remain a number of structural issues in the wholesale market that present a more fundamental barrier to entry. We will look at these issues more closely in our forthcoming Wholesale Markets report.
Action is also needed to convince consumers to play their part in meeting the challenges of decarbonisation
06 The imbalance of power The retail market
Executive summary
7 Government should reserve the right to introduce a fair price guaranteeWhich? considers that the proposals set out above offer the best chance to make competition work effectively. Competition driven by engaged and well informed consumers is often the most effective mechanism to drive efficient prices and innovation.
However, if the proposals that we recommend in this report are introduced, and consumer outcomes have still not improved by 2015 then the wider structure of the market should be fully reviewed. This should include consideration of a fair price guarantee.
A fair price guarantee does not equate to a return to a full price cap model for all tariffs. There are energy markets such as in the State of Illinois and the Northern Ireland market where both regulated and competitive tariffs exist. These hybrid models can enhance rather than hamper competition, while ensuring the interests of consumers are protected. The regulated tariff acts as a price to beat for competitors, delivering choice for those that want it while ensuring fair prices for those who do not engage.
The government has committed to amending the Energy Bill, due to be enacted in 2013, so that consumers are put on their supplier’s ‘lowest tariff’. This legislative opportunity should also be used to put in place backstop powers that would enable the regulator to introduce a fair price guarantee for the default open-ended variable rate tariff. By introducing these powers, the government would send a clear message that every effort must be made now to increase engagement and improve outcomes for consumers. If effective competition that delivers efficient energy prices and protects the welfare of consumers does not develop, then the government will have the necessary powers to intervene swiftly.
6 Ofgem’s proposals on communications, complaints and market monitoring should be implemented at the earliest opportunityWhich? supports Ofgem’s Retail Market Review proposals on supplier communications, complaints reporting and market monitoring. In some areas the proposals should be strengthened further, as we set out in Chapter 5.
Ofgem should also review the multistage complaints processes used in the energy sector to assess if they are being misused, building on the FSA’s recent determination that complaints processes with a number of stages are ‘inherently prone to misuse’.
And rather than waiting until 2017 to publish its next review, Ofgem should commit to publishing six-monthly updates on how the market is performing against its proposed wider range of competition indicators.
The full liberalisation of the British energy market was an international first. But it was an experiment in competition that the Government of the time said it expected ‘everyone to benefit from’ including ‘poorer consumers’

0507The imbalance of power The retail market
Chapter 1 Background to the market
Giving power to the people
Consumers were meant to be the engine of competition, making choices that would ensure competitive prices, and feeling empowered and in control
It was not obvious at the time that the privatisation of British Gas and the 14 regional electricity boards in the 1980s would eventually lead to the competitive market we have for gas and electricity today. It was much later that the decision was made not to settle for privatised, regulated monopolies, such as those found in the water and rail sectors, but instead to pursue the development of a liberalised model in the mould of the fixed line telecoms market. Although the idea of liberalisation had been mooted some years earlier and trials had taken place in some parts of the country, it wasn’t until the late 1990s that competition was actually introduced. In a 1997 report on the energy sector entitled Shaping Change, the newly elected Labour government affirmed the principles of the previous government’s energy policy, declaring: ‘We fully support the introduction of competition – we want it to happen for everyone and soon’. 1
As in other markets, the introduction of competition in gas and electricity was intended to protect the interests of consumers by putting them in the driving seat.2 With consumers allowed to choose their energy supplier, former state-run monopolies would face strong incentives to transform themselves into dynamic, modern companies. Customers would not only be offered a choice of appealing, innovative, good-value products, but also great customer service. Consumers would be the engine of competition, with individual choices of the best products ensuring efficient and competitive prices by driving down both wholesale and retail costs. Thus consumers – who have no choice but to buy energy – would feel empowered and in control. The Shaping Change report also stated that, while the government expected ‘everyone to benefit from
competition’, it also needed to be sure that ‘poorer consumers share that benefit’.3
The competitive model that followed involved ‘unbundling’ the industry into four distinct parts. The transmission and distribution networks remained regulated monopolies on the basis that it would make no sense having more than one set of competing pipes and wires taking gas and electricity around the country and into homes and businesses. The other parts of the system - the ‘upstream’ or ‘wholesale’ activities of electricity generation and gas production, and ‘downstream’ retail functions (essentially buying gas and electricity from the wholesale market and selling it to consumers) were opened up to competition. Together, the wholesale and supply costs of the system make up around 70% of our gas bills and around 60% of our electricity bills. 4
In electricity there were significant changes to the structure of the industry. The Central Electricity Generating Board was split into three competing generation companies and a transmission company (National Grid), while the 14 regional electricity ‘boards’ were separated from their distribution businesses and became retailers. Although they initially served only their old monopoly territories, the incumbent electricity suppliers quickly expanded into other regions where they were joined by new electricity suppliers, most notably the national gas incumbent, British Gas. All of the electricity incumbents also entered the gas market, competing for the 22 million households connected to both the gas and electricity networks.
From privatisation to liberalisation
1 The Energy Report: Shaping Change, Department of Trade and Industry, 1997, p 3. 2 Utilities Act 2000, chapter 27, part 2. 3 The Energy Report: Shaping Change, p 4.4 Updated household energy bills explained, Ofgem, May 2012. Based on “wholesale energy, supply costs and profit margin” and “other costs” components. 5 Rounded up from 21.72 gas accounts in GB (based on back calculation of 12.6m being 58% of the market) and 25.96m electricity customers (based on back calculation of 16.1m being 62% of the market) from DECC Quarterly Energy Prices, September 2012.

08 The imbalance of power The retail market
Chapter 1 Background to the market
Figure 1: Consolidation of GB energy suppliers
Ofgem, Energy Supply Probe - initial findings report 2008
East MidlandsEasternNorwebLondonSWEBSeeboardMidlandsYorkshireNorthernScot PowerManwebSouthernScot HydroSwalecBritish Gas
Virgin HomeEnergy
Atlantic Electricity and Gas
E.ON UK E.ON
EDF EnergyEDF Energy
RWE NPowerNpower
1998 1999 2000 2001 2002 2003 2004 2005 2006 2007 2008
ScottishPower ScottishPower
SSE Atlantic Scottish Hydro, Southern Electric, SWALEC
Centrica British Gas, Nwy Prydain, Scottish Gas
TXU Energi
6 The Retail Market Review: Updated domestic proposals, Ofgem, October 2012, para 2.4.1. 7 Good Energy, Ecotricity, First:Utility, Ovo Energy, Utilita, Co-operative Energy. 8 In 2001 compulsory electricity pool was replaced by bilateral trading arrangement – the New Electricity Trading Arrangements (NETA) - and financial penalties associated with being out of balance (under ‘cash out’). In 2005 NETA was replaced with the British Electricity Trading and Transmission Arrangements (BETTA), which resulted in a single British electricity market. In 2001, the market was immature with only a few generators and contract negotiations between generators and suppliers were often fraught. In this context, and with utility investors expecting a steady and predictable rate of return, vertical integration became the logical business model for managing the increased risks. 9 Professor Steve Thomas is a researcher in energy policy with more than 30 years’ experience. His work is international in scope and the main areas of research are on economics and policy towards nuclear power; liberalisation and privatisation of the electricity and gas industries; and trade policy on network energy industries. The Future of Energy: are Competitive Markets and Nuclear Power the Answer?, Professor Steve Thomas, Inaugural Lecture, University of Greenwich, 4th February 2010, accessed at www.psiru.org/sites/default/files/2010-02-E-future.pdf, p 12.
As Figure 1 (above) shows, mergers and acquisitions have reduced the original 14 incumbent electricity suppliers to five companies. Together with British Gas, these companies make up the six major suppliers and collectively serve more than 98% 6 of British households. Four are owned by pan-European mega-utilities, Ibredrola (using the ScottishPower brand), RWE (Npower), E.ON and EDF Energy, while Centrica (British Gas) and SSE (Southern Electric, Scottish Hydro, Swalec and Atlantic) remain UK-owned. Of the 16 new suppliers who have entered the market under their own licence since it opened, only six 7 remain and none has succeeded in building a business comparable in scale to that of the six major suppliers.
The six major suppliers (and some of the smaller ones) do not just sell energy to customers. They are part of larger companies that also generate electricity, produce gas, and trade. So they produce the gas or they generate the electricity that is supplied to domestic customers. Some of the energy they sell to their customers will come directly from their generating businesses, with the rest sold onto and bought from the open market as required. This vertical integration occurred as a commercial response to risk and the opportunities that were presented by changes to the supply and trading arrangements in 2001. 8
of British households are served by the six
major suppliers
98%

0509The imbalance of power The retail market
Chapter 1 Background to the market
A leap into the unknown
Despite having potential benefits in theory, the full liberalisation of the domestic energy sector was in essence a leap of faith. As one expert on energy deregulation has pointed out, apart from some limited reforms in Chile (in a very different context), ‘the model introduced in Britain was new and untested and based on no hard evidence that the introduction of competition would improve the service and the particular problems it had to solve’. 9 Other countries have been much more cautious about introducing competition. While consumers have a choice of energy supplier in most EU member states, regulated electricity prices remain in 16 of the 27 countries and gas prices are regulated in 12 of the 24 countries with open gas markets.10 In addition, public ownership and heavily regulated monopolies remain key features of energy retail markets in many US states.
Because the benefits of competition were unproven and British consumers were unaccustomed to choice in the energy sector, price controls that fixed the maximum price that the old monopoly suppliers could charge customers remained in place post-liberalisation. These were removed in stages from 2000 onwards. By 2002, Ofgem had decided that competition had developed well enough to abolish all remaining price controls. It is clear that prices fell substantially between market opening and the removal of these controls.11 However, what is less obvious is how much
of a factor competition was in driving the exceptionally low prices seen during that period. Figures from the International Energy Agency (IEA) show that these were years of excess energy supplies worldwide. For example, experts have pointed out that in Britain privatisation and liberalisation led to ‘a massive over-production of gas in the earlier part of this period and massive over-capacity in electricity generation in the latter part’. 12 Further, it has been generally accepted that ‘asset-sweating’ of transmission and distribution infrastructure as well as generation capacity was also a key factor in the fall in prices around this time. 13 However, this benefit would always have been temporary and there is now an urgent need for the renewal and expansion of the network, the estimated £110 billion14 cost of which will inevitably be passed through to consumers’ bills.
The outcome is that energy consumers today operate in an open market environment. This means consumers, rather than regulation, are relied upon to keep prices in check by switching – or at least threatening to switch – to the best deals. This report examines how successful this fundamental change in the role of consumers from mere ‘end users’ to key stakeholders and participants in the energy ‘system’ has been, and makes recommendations to ensure that the benefits originally envisaged are delivered to all consumers.
10 Energy Markets in the European Union in 2011, European Commission staff working document, November 2012, accessed at ec.europa.eu/energy/gas_electricity/doc/20121121_iem_swd_0368_part2_en.pdf.http://ec.europa.eu/energy/gas_electricity/doc/20121121_iem_swd_0368_part2_en.pdf. 11 Domestic Energy Fact File, DECC, 2008, figure 3.s. 12 Why the Re-Introduction of Price Control Regulation is the Only Remedy Which Will Work for Domestic Energy Consumers, Philip Wright and Ian Rutledge, Evidence to the BERR Commiteee, March 2008, section 3. 13 Energy Briefing, Institute of Civil Engineers, May 2010, accessed at http://www.ice.org.uk/getattachment/d7fdef59-20ad-4a7d-8063-b69f681a0087/Energy-Briefing---May-2010.aspx. 14 Annual Energy Statement, DECC, November 2012.
There is now an urgent need for renewal of the energy
system the cost of which will inevitably be passed
to consumers
£110 billion

10 The imbalance of power The retail market
Chapter 2 Indicators of competition
Getting the measure of the energy marketThe energy market could be highly competitive
Consumers have no choice but to buy energy. Although there is some discretionary use, its primary purpose is to provide heat and light. Switching between the different forms of energy that could be used to provide these essential services is, in practical terms, impossible. For example, if electricity suddenly fell in price, consumers would not be able to respond - except in the very long term - by replacing gas central heating systems for equivalent electrical systems. Further, while electricity can generally substitute for gas in the long-term, gas cannot completely substitute for electricity as most appliances can only run on electricity. 15 Renewable and low-carbon technologies such as solar panels, biomass boilers and heat pumps may offer a partial alternative, but these involve substantial upfront costs and are inherently unsuitable for certain types of property. As such, consumers cannot ‘opt out’ of buying mains electricity and, practically speaking, nor can households with gas heating avoid buying gas.16 This means that the market cannot be considered ‘free’ in the sense of a place where willing buyers meet willing sellers and agree a price based on supply and demand.
However, despite the energy market having an essentially captive customer base, it could, in theory,
be highly price competitive. This is because the gas and electricity from one supplier is exactly the same as that from another, while the ‘customer service’ functions of meter reading and billing should be entirely routine. Reflecting this, the vast majority of consumers cite price as the main trigger for switching their energy tariff or supplier (Figure 2).
Just 5% of people say that their main reason for switching was to get better customer service. In this respect, the energy market is very different from other markets, such as groceries, white goods or mobile telecoms, where greater scope for companies to differentiate their products means consumers can be motivated to switch by factors other than price.
Underpinning the theory that the energy market could be highly price competitive is the assumption that, in any market, private companies face strong incentives to drive their costs down to the lowest level. Energy suppliers ought to face particular pressure to pass these savings on to customers in full because consumers in that market are generally only interested in price. Thus any supplier raising its prices above those of its competitors should rapidly lose customers as they switch to a rival offering an identical product and service at a lower price.
15 Electricity supply competition: An Ofgem occasional paper, Ofgem, December 2002, p 18. 16Although there have been significant advances in microgeneration technologies, such as solar, biomass and heat pumps, these systems remain out of reach for the vast majority of consumers. This is due to a combination of high capital costs and the fact that many properties are inherently unsuited to alternative technologies.

0511The imbalance of power The retail market
Chapter 2 Indicators of competition
Commonly-used measures of competition are inadequate
In order to determine whether the reality of the market accords with the theory, the effectiveness of competition must be measured. Consumers are frequently told that the British energy market is among the most competitive in the world. 17 However, Which? believes that the indicators that are typically used to demonstrate this – the number and variety of offers, the number of consumers switching and how prices compare to other countries – are insufficient. In this section we explain why, and then set out a range of more appropriate and robust indicators.
A large choice of tariffsOfgem defines its mission as ‘promoting choice and value for all gas and electricity customers’. Similarly, the Office of Fair Trading (OFT) recognises that ‘greater choice’ is, alongside lower prices and better quality goods and services, one of the significant benefits of competitive markets, 18 while many suppliers regularly emphasise the importance of providing choice and variety to their customers. 19 However, as insights from behavioural economics have confirmed, more options can actually result in greater disengagement and fewer people making
decisions than when they are presented with fewer choices. 20 And, as we set out in Chapter 4, excessive choice when combined with complexity and price obfuscation can create even greater disengagement.
It is essential for consumers to have a choice of suppliers in a competitive energy market. However, the benefits of those suppliers offering a large number of tariffs are less clear cut. Choice only has value if consumers can meaningfully differentiate between the offers available and move to the one that’s best for them. If they cannot, companies may be able to segment the market and focus their most competitive offers on a small group of more active consumers, while extracting higher returns from those who are not engaging with the market. This is a particular risk in markets like energy that supply a service that consumers have no choice but to buy. So measuring only the number of offers available without also measuring how many consumers are taking up the best ones is not a sufficient measure of effective competition.
A number of suppliers have recognised the negative impact of tariff proliferation - some have only ever offered a limited number of tariffs and others have recently announced a reduction in the number they offer. 21
80%believed new
supplier to be cheaper
5%wanted to switch
to a dual fuel package
5%believed new
supplier offered better customer
service
3%moved home
2%believed new supplier offered better benefits
2%wanted a fixed
price deal
0%wanted an
online tariff
0%wanted a
greener tariff
0%written communication
from supplier
3%other
Figure 2: Consumers’ reasons for switching Reasons for switching on last occasion Ipsos MORI for Ofgem, Customer Engagement with the Energy market - Tracking survey 2012
17 For example in the Consumer Engagement evidence session held by the Energy and Climate Change Select Committee, September 2012, representatives from each of the major suppliers stated that the retail market was competitive, for example Phil Bentley said the UK had “the lowest gas prices in Europe” and “We give choice, there’s lots of switching”. While SSE stated that the GB energy supply market is competitive, and that this competition continues to be the most effective means of protecting consumers. 18 Competition and Growth, Office of Fair Trading, November 2011, p 4. 19 We reviewed responses to Ofgem’s March 2011 Retail Market Review consultation from British Gas, EDF Energy, E.ON, Npower, ScottishPower and SSE. All cited the importance of providing choice to their customers through offering a range of tariffs. 20 When choice is demotivating: can one desire too much of a good thing?, S. Iyengar and M. Lepper, 2000, Journal of Personality and Social Psychology, pp 995-1006.

12 The imbalance of power The retail market
Number of consumers switchingAlthough switching figures are commonly held up as an indicator of the competitiveness of the market, in their current form they are not a useful measure of competition. Switching is a means to an end not an end in itself, so as well as measuring numbers of switches we should also be interested in whether the ‘switchers’ are benefiting from lower prices, and whether their switching has any wider ‘ripple’ effect on the prices paid by all consumers. Unfortunately, the official industry switching figures report only the volume of switches and fail to take account of their outcome.
As analysis produced for the Financial Services Authority (FSA) has also noted, a high switching rate may not necessarily be an indication of intense competition. In markets with a high degree of intermediation (such as insurance), high switching rates may be associated with price comparison intermediaries encouraging consumers to switch products in order to generate higher commission income for themselves. 22
For switching figures to have any real value they should also set out whether switchers achieved their aim, eg are price-driven consumers saving money by switching? There is evidence that this may not always be the case in the energy sector. Analysis of actual switching behaviour by Ofgem in 2008 found that, on average, just 60% of consumers benefited financially from switching, implying that 40% did not make a saving.23 This finding reinforced earlier research by the Centre for Competition Policy (CCP) that found that around a third of consumers switched to a more expensive supplier. 24 More recent survey-based research has found that over a quarter of consumers who said they’d switched to save money did not believe they had or were unable to say. 25
International price comparisonsA commonly heard argument in favour of the ‘British model’ of energy market competition is that prices paid by British consumers compare favourably with those paid by consumers elsewhere in Europe. Figures published by Eurostat (the EU’s statistical service) every six months are frequently invoked to support this point.
However, there are a number of reasons why Ofgem and the government should not take solace in statistics that currently place the UK (the figures include Northern Ireland, although the impact of this will be marginal given the size of that market) second cheapest for gas and sixth cheapest for electricity (see Figures 3a and 3b). Fundamentally, as we set out in Box 1, the figures cannot be compared on a like-for-like basis, in particular because of the way policy costs or taxation are incorporated, or not, into the prices. And even if a true like-for-like comparison were achieved and the UK market did stand comparison with a host of what may be deeply uncompetitive markets, this does not in itself mean it is competitive enough.
21 For example Ebico only offer a single tariff, structured as a single unit rate, and SSE recently has reduced their tariff number from 68 to four core tariffs www.sse.com/PressReleases/2012/SSE_SimplifiesTariffRange/ 22 Retail Distribution Review proposals: Impact on market structure and competition, Oxera for FSA, June 2009, p 17. 23 Energy Supply Probe - Initial Findings Report, Ofgem, October 2008, pp 50-51. 24 Irrationality in Consumers’ Switching Decisions: When More Firms may Mean Less Benefit, Chris Wilson and Catherine Waddams Price, CCP Working Paper 05-4, October 2005, and Do Consumers Switch to the Best Supplier?, Chris M. Wilson and Catherine Waddams Price, CCP Working Paper 07-6, July 2007. 25 Customer Engagement with the Energy Market - Tracking Survey 2012, Ipsos MORI for Ofgem, April 2012, p 33.
Chapter 2 Indicators of competition

0513The imbalance of power The retail market
0.0500
0.1000
0.1500
0.2000
0.2500
0.3000
0.0000
EU (2
7 co
untri
es)
Euro
area
Luxe
mbour
g
Nethe
rland
sIta
ly
Roman
ia
Bulga
ria
Austr
ia
Swed
en
Hunga
ry
Denmar
k UK
Fran
ce
Slova
kia
Belgi
um
Czec
h Re
publi
c
German
y
Finlan
d
Polan
d
Greec
eSp
ain
Esto
nia
Slove
nia
Irelan
d
Figure 3b: Change in European Union electricity prices
Portu
gal
Lithu
ania
Cypr
usMalt
a
Figure 3a: Change in European Union gas prices
Latv
ia
Winter - Spring 2008Winter - Spring 2012
0.0200
0.0400
0.0600
0.0800
0.1000
0.1200
0.0000
EU (2
7 co
untri
es)
Euro
area
Roman
ia
Denmar
k
German
y
Luxe
mbour
g
Nethe
rland
s
Slova
kia
Belgi
um
Swed
enSp
ain Italy
Portu
gal
Fran
ce
Irelan
d
Austr
ia
Bulga
ria UK
Polan
d
Slove
nia
Esto
nia
Czec
h Re
publi
c
Hunga
ry
Lithu
ania
Latv
ia
Winter - Spring 2008Winter - Spring 2012
Chapter 2 Indicators of competition
Which? analysis of Eurostat data

14 The imbalance of power The retail market
Box 1 International price comparisons – a word of warning
26 Gas and Electricity Market Statistics, Eurostat, 2007, p 64. 27 Updated household energy bills explained, Ofgem, May 2012.28 Digest of United Kingdom Energy Statistics 2012, DECC, 2012, p 97.
Which? has found that figures comparing energy prices paid by consumers in the UK with those paid elsewhere in Europe should not be taken at face value.
A major issue is that EU member states add the costs of government policies to consumers’ bills in different ways. In theory, stripping out the costs of government taxes and levies ought to provide a good indication of the efficiency and – where liberalisation has happened - competitiveness of the wholesale and retail markets in each country. However, it is difficult to make like-for-like comparisons between countries where policies are ‘output-based’ (ie structured as obligations on suppliers – for example, achieving a certain amount of carbon savings) and countries where they are ‘input-based’ (ie suppliers are simply required to collect a monetary amount on behalf of the government). According to Eurostat, VAT and additional government taxes and levies make up around half of the gas and electricity price paid by Danish consumers.26 In the UK, by contrast, the only ‘official’ tax added to bills is VAT at 5%. However, there are a number of other costs recovered through bills that are taxes in all but name. Ofgem estimates that VAT and ‘environmental charges’ combined make up 9% of gas bills and 15% of electricity bills.27
As well as current prices, it is important to consider how current prices have changed over time. In the EU as a whole, gas prices in the first semester of 2012 (covering the winter and spring, when consumption is highest) were 16% higher than they were at the same point in 2008. For electricity, the increase was 13%. However, the increase in UK gas prices was 32% during this period – the 8th highest increase of the 23 states with a residential gas market. UK electricity prices rose by 16% - the 18th biggest increase (out of 27 countries), but still above the EU average.
Having large offshore gas reserves has been a major factor in Britain’s low gas prices, and these have also driven low electricity prices due to around 40% of our generation capacity being gas-fired. However, since 2004 Britain has been a net importer of gas, and in 2011 imports accounted for around 40% of the total amount of gas used in the country. 28 In other words, the large increase in our gas and electricity prices has coincided with an increasing dependence on imported gas. This would appear to suggest that Britain’s supposedly ‘competitive’ prices may be more down to geology than its market, as well as the asset sweating described in the previous chapter, and that this will become increasingly apparent in future years.
the proportion of gas imported by Britain in 2011
40%
Chapter 2 Indicators of competition

0515The imbalance of power The retail market
The right measures of energy market competition
There are three interlinked indicators that together Which? considers to be the most appropriate measures of competition. At its introduction, competition in the energy market was intended to be primarily price-focused, with additional customer service benefits stemming from it. Consumers were to be the engine of competition, choosing the cheapest offers without compromising on service.
Proportion of consumers on the cheapest tariffsThe energy market is clearly unlike markets where products and services can differ in a number of ways that can affect the price that consumers are prepared to pay – such as quality, convenience, speed of service and brand image. The main driver of engagement with the market is the opportunity to get a lower price.
On this basis, an essential question about the effectiveness of competition is whether large numbers of consumers are paying significantly more than others for what is essentially the same thing. In a competitive market selling a commodity, we would not expect to see the majority of consumers apparently tolerating substantially higher prices when lower ones are available. Key measures of this would be large differences both between different suppliers’ offers and within each supplier’s own tariff range and whether there is a sufficient ‘critical mass’ of consumers seeking out better price savings to keep prices in check overall. It is also important to ascertain the level of concern about energy prices among consumers who appear to be overpaying, and what the likelihood is of their switching to a different supplier and/or tariff in future.
If the majority of consumers are concerned about energy prices but appear to be doing little to address this by switching to substantially cheaper deals, then serious questions must be asked about the effectiveness of the market. We believe that this is the most crucial measure of competition in energy. If consumers are not behaving in this way, then there is no chance that the market can work.
Ability of new companies to enter the market and thriveConsumers switching to the cheapest tariffs are unlikely to drive prices to competitive levels unless there are barriers to suppliers adopting collusive – tacit or otherwise – pricing strategies that are likely to drive prices up.
The first regulator of the energy industry, Professor Stephen Littlechild, recognised that a major problem facing the development of a competitive retail market was the power of the incumbent suppliers present at the point the market was opened up, and that new entry by independent suppliers would most likely be required to ensure competition was effective. Ofgem agrees, setting out in its Retail Market Review the importance of independents in constraining the ‘herd-like’ behaviour of dominant companies in markets with features or characteristics that may encourage collusive pricing strategies.29
While Which? generally supports this assessment, it is essential to have confidence that new entry – or the threat of new entry – actually does result in the market remaining competitive over time. The conditions must therefore be right not only for new companies to enter the market but also to remain there and thrive. This means ensuring that consumers are able to engage with the market by easily comparing offers from all suppliers and switching to the best ones, as well as reducing any advantages that incumbents may have over entrants in both the retail and wholesale markets.
Improving customer service and innovation The third indicator of an effective market is improving customer service and evidence of innovation. We would expect that companies in a truly competitive market would face strong incentives to treat their customers well or risk losing them. Although we would expect the focus of competition to be price, an intensification of price-based competition should ultimately lead to improved service too, as suppliers compete to offer additional value on top of low prices.
Chapters 3 and 4 set out an analysis of the retail energy market against these measures.
29 The Retail Market Review – Updated domestic proposals, Ofgem, October 2012, p 55.
Chapter 2 Indicators of competition

Chapter 3 The paradox
16 The imbalance of power The retail market
Worried but disengaged consumersDespite high levels of concern over energy prices, consumers are not switching to the cheapest tariffs
There are significant price differences within most suppliers’ tariff ranges. Yet around three quarters of consumers are on what are typically the most expensive offers in that range – their supplier’s standard tariff. 30 Meanwhile, up to 60% say they have never switched and appear unlikely to do so in future, at least not proactively. A further 30% claim to have switched but say they probably won’t again.31 Which? has estimated that, collectively, households miss out on savings of some £4bn 32 a year by not being on the cheapest tariff for their payment and account management method. The average price difference between standard tariffs with standard credit payment versus fixed-term deals paid for by direct debit is £165 a year. However, consumers could save as much as £280 by switching from the most expensive to the cheapest. Even those already paying by direct debit could save around £150 by moving to the most competitive fixed-term tariff. 33
Yet consumers are deeply worried about the price of energy. Which?’s regular Consumer Insight Tracker has consistently found that the cost of energy, along with the cost of petrol, is consumers’ top financial concern.34 This is hardly surprising against a backdrop of a 25% increase in
electricity prices and a 40% increase in gas prices since 2007 (Figures 4a and 4b) and unanimity among experts that prices will continue to rise. 35 It leaves the question of why, with both concern and prices at record levels, so many people do not engage with the market and reduce their bills substantially. We believe that this paradox is the clearest manifestation of a failing energy market.
Naturally, there is a risk that suppliers may respond to an increase in consumers switching to the most competitive offers by putting up the price of those tariffs to avoid the loss of revenues from customers previously on more expensive tariffs. As a result, the notional savings described above would reduce as the cheapest deals rise in price. However, as Ofgem points out in the Retail Market Review, this is likely only to be a short term consequence and would not be long lived unless there was collusion among suppliers. As long as consumers are able to search the market easily and switch to better deals, and suppliers face strong incentives not to collude – the ability for independents to enter and thrive in the market being particularly important in this regard - any gains from such an approach would be temporary at best.
30 Variation in Tariff Types and Energy Bills, DECC, March 2010, p 48. 31 The Retail Market Review - Findings and initial proposals, Ofgem, March 2011, p. 5. 32 Which? wanted to see how much money consumers have collectively missed out on by not switching to the cheapest available deals since the start of the recession in 2008. To do that, we estimated how much people have been paying and compared that to how much they would have paid if they were on the cheapest deals. We used monthly regional price trend data from Consumer Focus for standard and online tariffs and combined that with OFGEM market share data for the six major suppliers energy companies and market splits for dual-fuel vs. not; direct debit vs. credit; and online vs. offline accounts. Putting all that through our statistics team, we were able to calculate regional estimates for both scenarios and then look at the difference. To turn that into a national figure, we took ONS and DECC data and estimated the number of households in each energy region. The final figure is £16billion over four years.
60%of consumers say they have
never switched
30%claim to have
switched but say they probably won’t again
£4bn of savingsThe collective amount households miss out
each year by not being on the cheapest tariff for their payment and account management method

05
Chapter 3 The paradox
17The imbalance of power The retail market
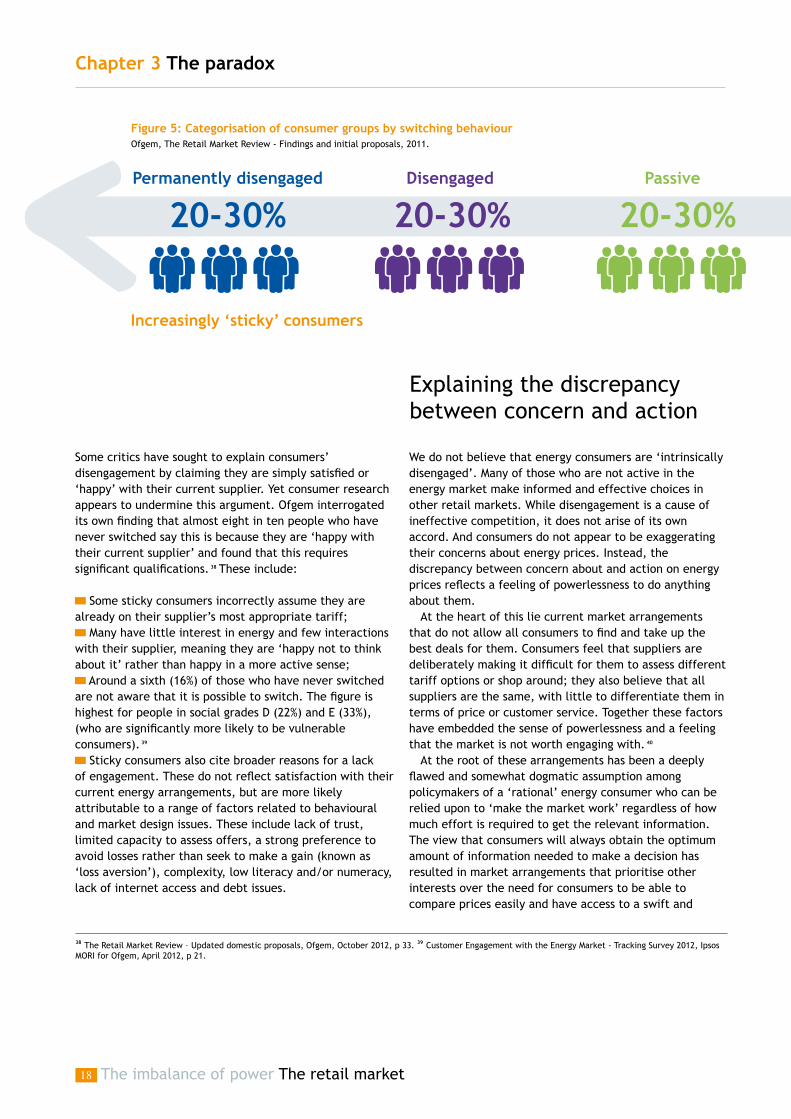
A categorisation of consumer ‘types’ carried out by Ofgem for the Retail Market Review (see Figure 5) concluded that 40-60% of consumers are ‘disengaged’ from the market in some way. These are known as ‘sticky’ consumers due to their tendency to stick with the same deal. Half of this group are classified as ‘permanently unengaged’, saying they have never switched and are unlikely to do so in the future. The other half are just ‘unengaged’, meaning they have little knowledge of (and in some cases little interest in) the energy market and they report never having switched. They do not rule out switching in the future, but they acknowledge that it would take a significant intervention of some type to prompt this: particularly poor service, for example, or as a result of pressure from a sales agent. 36
Ofgem classifies a further 20-30% of consumers as ‘passive’. They have switched at some point in the past – most likely to a dual fuel energy tariff with one of the suppliers they were with before liberalisation (either British Gas or the regional electricity incumbent) – but say they are unlikely to switch again.
This leaves just 10-20% of consumers who can be considered ‘active’ in the market through frequently switching supplier. Half are ‘reactive’, which means they do not regularly search the market or plan to switch but may do so if they come into contact with a supplier’s sales agent. However Ofgem’s Energy Supply Probe analysis found that face to face door step sales resulted in nearly 50% of consumers being missold. 37 The rest are ‘proactive’, researching alternative offers themselves and switching without being prompted.33 Based on Consumer Focus price data from 11 October 2012 (not including most recent round of price increases). National averages calculated based on six major suppliers’ prices in all 14 regions for a ‘medium’ consumer using 3,300kWh of electricity and 16,500kWh of gas a year. 34 Populus conducted online survey for Which? of 2,100 UK adults between 26th and 28th October 2012. Data has been weighted to be representative of UK population. 35 Annual Energy Statement, DECC, November 2012. 36 The Retail Market Review - Findings and initial proposals, Ofgem, March 2011, p. 6. 37 Energy Supply Probe - Initial Findings Report, Ofgem, October 2008, p 51.
Are consumers disengaged or just happy?
Figure 4a: Increase in average electricity prices
Aver
age
annu
al b
ill (
£)
Figure 4b: Increase in average gas prices
2007
2008
2009
2010
2011
300
320
340
360
380
400
420
440
460
480
500
S/CDDPPM
Aver
age
annu
al b
ill (
£)
2007
2008
2009
2010
2011
400
450
500
550
600
650
700
750
800
S/CDDPPM
40%increase in gas
prices since 2007
25%increase in electricity
prices since 2007
Based on cash increases in gas and electricity prices from DECC Quarterly Energy prices, September 2012.Figures were weighted according to the English, Welsh and Scottish population.
Chapter 3 The paradox
The imbalance of power The retail market18
We do not believe that energy consumers are ‘intrinsically disengaged’. Many of those who are not active in the energy market make informed and effective choices in other retail markets. While disengagement is a cause of ineffective competition, it does not arise of its own accord. And consumers do not appear to be exaggerating their concerns about energy prices. Instead, the discrepancy between concern about and action on energy prices reflects a feeling of powerlessness to do anything about them.
At the heart of this lie current market arrangements that do not allow all consumers to find and take up the best deals for them. Consumers feel that suppliers are deliberately making it difficult for them to assess different tariff options or shop around; they also believe that all suppliers are the same, with little to differentiate them in terms of price or customer service. Together these factors have embedded the sense of powerlessness and a feeling that the market is not worth engaging with. 40
At the root of these arrangements has been a deeply flawed and somewhat dogmatic assumption among policymakers of a ‘rational’ energy consumer who can be relied upon to ‘make the market work’ regardless of how much effort is required to get the relevant information. The view that consumers will always obtain the optimum amount of information needed to make a decision has resulted in market arrangements that prioritise other interests over the need for consumers to be able to compare prices easily and have access to a swift and
Some critics have sought to explain consumers’ disengagement by claiming they are simply satisfied or ‘happy’ with their current supplier. Yet consumer research appears to undermine this argument. Ofgem interrogated its own finding that almost eight in ten people who have never switched say this is because they are ‘happy with their current supplier’ and found that this requires significant qualifications. 38 These include:
Some sticky consumers incorrectly assume they are already on their supplier’s most appropriate tariff;
Many have little interest in energy and few interactions with their supplier, meaning they are ‘happy not to think about it’ rather than happy in a more active sense;
Around a sixth (16%) of those who have never switched are not aware that it is possible to switch. The figure is highest for people in social grades D (22%) and E (33%), (who are significantly more likely to be vulnerable consumers). 39
Sticky consumers also cite broader reasons for a lack of engagement. These do not reflect satisfaction with their current energy arrangements, but are more likely attributable to a range of factors related to behavioural and market design issues. These include lack of trust, limited capacity to assess offers, a strong preference to avoid losses rather than seek to make a gain (known as ‘loss aversion’), complexity, low literacy and/or numeracy, lack of internet access and debt issues.
Figure 5: Categorisation of consumer groups by switching behaviour
Increasingly ‘sticky’ consumers
Permanently disengaged Disengaged Passive
20-30%Reactive
20-30% 20-30%
38 The Retail Market Review – Updated domestic proposals, Ofgem, October 2012, p 33. 39 Customer Engagement with the Energy Market - Tracking Survey 2012, Ipsos MORI for Ofgem, April 2012, p 21.
Explaining the discrepancy between concern and action
Ofgem, The Retail Market Review - Findings and initial proposals, 2011.

05
Chapter 3 The paradox
19The imbalance of power The retail market
The strategy of maximising revenue by offering more competitive deals for consumers who regularly search the market and worse ones for those who don’t – is a widely recognised phenomenon. Across markets, products and services designed for ‘brand new customers only’ frustrate existing customers who believe they should be rewarded, not exploited, for their loyalty. From a company’s perspective, on the other hand, it is entirely logical – why, for example, offer a better price to a customer who is likely to stay with me anyway?
In markets for essential services, incentives to overcharge those who don’t switch are likely to be particularly strong as almost all consumers have to buy the product or service whether they like it or not. Firms who are established in their markets have responded to consumers’ differing inclination and ability to engage by developing certain practices. On one hand, these practices tend to be designed to reduce the ability of consumers to engage with the market and so drive competition by increasing the ‘hassle’ involved with searching a market and switching between competing companies. On the other hand, they allow them to react to any threat from independent (or, in some cases, regulatory pressure to demonstrate evidence of a willingness to compete) by creating products specifically for those with the determination and wherewithal to engage with the market. This behaviour can clearly be seen in the energy market.
Box 2 A divided market – segmentation explainedProactiveReactive
5-10% 5-10%
straightforward switching process. 41 As a result (see Box 2), since liberalisation suppliers
have been able to ‘segment’ the market in a way that allows them to maximise revenue from disempowered ‘sticky’ customers and offer competitive deals to the minority of consumers who are able to engage with the market. As we explain in Chapters 4 and 5, segmentation may have particularly harmful effects in the energy sector as ‘sticky’ energy consumers are far more likely to be from low income and vulnerable groups.
Which? considers that competition driven by engaged and well informed consumers is often the most effective mechanism to drive efficient prices and innovation. In Britain’s liberalised energy market, consumers are relied upon to keep prices in check by switching – or threatening to switch – to the best tariffs, but they do not. As Ofgem’s categorisation shows, at present up to 90% of consumers fail to behave in a way that is needed to drive an effective market.
Instead of paying lip service to the objective of protecting the interests of consumers through effective competition, the market must actually be designed in a way that takes account of the way people behave and the different circumstances of different groups of consumers. Before we look at how this can be done, we examine the various reasons why the vision of a highly competitive market with engaged consumers driving down prices has become a reality of little effective competition and the vast majority of consumers on expensive tariffs.
40 Ofgem research for The Retail Market Review – Updated domestic proposals found consumers feel that suppliers are deliberately making it difficult for consumers to assess different tariff options (para 2.8) or shop around (2.28); that consumers think all suppliers are the same, with little to differentiate them in terms of price and customer service (2.25); and consumers also do not believe the information suppliers provide them with and suspect they may be misled into buying a product that is not any improvement on their current one or may leave them worse off (2.25). As a result consumers’ poor experiences, combined with a belief that suppliers are all the same embeds a sense of powerlessness (2.31). 41 The OFT has defined the rational consumer as one who “will gather information up to the point where the cost of obtaining and processing more information is equal to the benefits from possessing this information.” Consumer Detriment under Conditions of Imperfect Information, prepared for the OFT by London Economics, August 1997, p 6.

Chapter 4 What’s gone wrong
20 The imbalance of power The retail market
Causes of consumer disengagmentDisengagement has resulted from a range of anti-consumer practices and market features
When former energy secretary of state Chris Huhne chastised consumers for spending more time ‘shopping around for a £25 toaster’ than an energy tariff he joined the ranks of politicians and policymakers who fail to see that ‘shopping’ is a poor metaphor for engagement with the energy market.
Improving competition in the retail energy market means identifying the features of the market that lead to consumer disengagement, and designing intelligent and proportionate remedies to address them and enable consumers to stimulate genuine, effective competition among suppliers. Ultimately, that is the purpose of this report.
In this chapter we set out in detail those market features and industry practices which have resulted in mass consumer disengagement and restricted the development of effective competition. These are
described in detail below, but can be summarised as follows:
Unnecessarily complex tariffs make it virtually impossible for consumers to compare prices for this basic utility at a glance (or even with a calculator) and make mis-selling more likely;
Standing charges not only obscure prices, they may also be used in ways that soften competition;
Prices are ‘invisible’ to the extent that consumers never see price information in marketing or advertising, and information about price changes is likely to mislead;
A large number of consumers, many of whom are likely to be in low-income or vulnerable groups, are effectively excluded from the most competitive offers;
Price comparisons are only possible through the use of intermediaries (‘switching sites’), causing consumers to incur considerable hassle without any guarantee that they will receive accurate or complete information – a situation made worse by lengthy and opaque switching processes that offer no clarity over timings;
Anti-consumer practices in sales and marketing, tariff discounts, bills and other key communications, and complaints handling and redress deter consumers from engaging with the market; and
‘Herd-like’ pricing behaviour among dominant suppliers undermines incentives to switch and is facilitated by a persistent failure by independents to gain more than the most minimal foothold in the market.
Many of these features have been recognised by Ofgem, the government and to some extent the suppliers. Whilst Ofgem and government have put forward remedies and some suppliers have made changes to their practices, these do not yet go far enough.
42 OFT references P. Klemperer, October 1995, Competition when Consumers have Switching Costs: An overview with Applications to Industrial Organization, Macroeconomics, and International Trade, Rev Econ. Studies, and A. Banerjee and L. Summers, September 1987, On frequent flyer programs and other loyalty-inducing arrangements, Harvard Institute of Economic Research, Discussion Paper 1337. 43 What does Behavioural Economics mean for Competition Policy?, Office of Fair Trading, March 2010, p 15.

05The imbalance of power The retail market
Chapter 4 What’s gone wrong
21
Complex and confusing tariffs undermine competition
The OFT acknowledges that it is a common assumption in the standard economic literature 42 that established firms may face strong incentives to design complex products and/or obfuscate prices in order to increase the hassle faced by consumers in searching the market and switching to competitors.43
For example, in retail banking – a sector where companies are similarly indistinguishable in terms of the services they provide – banks have been publicly advised by the global management consultancy Simon-Kucher & Partners not to make use of price structures that make it easy for consumers to compare offers as this could lead to a price war and lower profits. Instead, they are advised to ‘create price structures that are clearly distinguishable from their rivals’, with ‘complex price systems such as two-part pricing, multidimensional pricing or loyalty programs for selected products or services’ said to be particularly effective strategies. 44
Using the OFT’s ‘access, assess and act’ framework for determining consumers’ ability to drive effective competition, Table 1 provides some examples of what such ‘manufactured complexity’ might look like.
Similar practices are widespread in the energy market. If consumers are to drive competition by switching to the best-priced tariffs in the market, it is essential that they are able to understand prices. However, suppliers have designed tariffs that are impossible for most consumers – who, as studies from behavioural economics have found, are limited in their ability to make sense of complicated information (see Box 3) – to compare at all, never mind being able to spot the cheapest ‘at a glance’. In a recent investigation, Which? found that just 8% of people were able to identify the cheapest tariff when we presented
OFT, What does Behavioural Economics mean for Competition policy? March 2010
Accessing information Firms can make it more difficult for consumers to perform optimal search. For example, behavioural economics shows that consumers do not tend to look at pricing terms that are not provided upfront. Firms may exploit this by putting more of the price into add-on services; restructuring their tariffs , adding clauses within the terms and conditions; or making price searching harder (for example, by drip pricing only revealing the true price after the customer has spent some time choosing).
Assessing offers Firms can make it more difficult for consumers to assess the best deal. Because behavioural economics indicates that consumers have difficulties comparing across differently structured offers, firms may exploit this by obfuscating their prices or increasing choice or complexity. They may also use price promotions and framing to distract and distort decision-making.
Acting on information and analysis Firms can make it more difficult for consumers to act to get the best deals. Behavioural economics indicates that consumers may display more inertia than traditionally suggested, perhaps due to overconfidence in their capacity to improve things at a later time. Firms, knowing that consumers display this inertia, can increase switching costs (for example, making consumers use registered post to cancel). They can also use defaults and automatic enrolments, or use time limited offers to inhibit switching.
44 Strategies against Price Wars in the Financial Service Industry, Georg Wuebker and Jens Baumgarten, Simon-Kucher and Partners, 2004, p 5. 45 Energy Tariffs Investigation, Which?, November 2012. 46 Including White Label offerings and those offered by small suppliers. The Retail Market Review – Updated domestic proposals, Ofgem, October 2012, p 24.
them with the various elements that made up the price. 45 The option to ‘manufacture complexity’ has resulted in multi-part tariff structures that vary considerably, not only between different energy companies, but in some cases also within individual suppliers’ own product portfolios. It has also resulted in a proliferation of tariffs available. At the end of August 2012 there were around 900 ‘live’ tariffs in the market, according to Ofgem. 46
Table 1 How companies’ pricing undermines effective competition

22 The imbalance of power The retail market
Box 3 Limited Capacity A relevant insight from behavioural economics is that consumers have ‘limited capacity’ when it comes to the amount of information they have to process in order to make a choice. All consumers will have some limit to their ability to use available information. Some deal with their limited capacity by engaging in markets only when it is simple to do so. Other consumers will engage when choices are complex, but use their own ways to simplify the choice. Some might adopt ‘rules of thumb’ for assessing information, such as considering only the products shown to them by a salesperson. Consumers might also be overly influenced by a ‘reference point’. For example, they may stop searching when they find an offer that is slightly cheaper than their current one, instead of exploring fully whether there is a much cheaper option.47 This is likely to reduce engagement and increase the likelihood of poor switching decisions – neither of which will bring competitive pressure to bear on suppliers. It is unacceptable that over a quarter of consumers who’ve switched say they believe they haven’t saved money or don’t know if they have.48
Searching the energy market is not a simple case of consumers comparing the price charged by one supplier for a kilowatt hour of gas or electricity against the price charged by other suppliers (in the way that consumers can compare, say, the price of a litre of petrol at different forecourts). Some tariffs have a daily standing charge (p/day), ostensibly to recover the fixed costs of supply (eg billing, meter reading, certain distribution costs) and a unit rate (p/kWh) for the energy used. Other tariffs are ‘no standing charge’ – but an initial tier of higher price units has the same effect as a standing charge.
On top of these structures, suppliers offer discounts for paying by direct debit, managing your account online and taking both gas and electricity from them. Discounts may be expressed as a lump sum or a percentage, applied either to the whole bill or just part of it (eg the standing charge or the unit rate), and credited in a range of ways – some of which, as we explain later on, may not work in the customer’s favour. Other energy tariff features include a range of non-price benefits, such as energy-saving products or loyalty points.
Which? has investigated a number of times how complex tariffs affect consumers’ ability to search the energy market. In 2011 we asked 36 consumers to work out what they would pay on standard tariffs from E.ON, SSE and
47 What can behavioural economics say about GB energy consumers?, Ofgem, March 2011, p 6. 48 Customer Engagement with the Energy Market - Tracking Survey 2012, Ipsos MORI for Ofgem, April 2012, p 33. 49 ‘Even accountants can’t calculate the cost of energy tariffs’, Which? Conversation, 26th September 2011, accessed at conversation.which.co.uk/energy-home/energy-bills-and-tariffs-too-complex-to-calculate/ 50 Energy Tariffs Investigation, Which?, November 2012.
British Gas. They had to use the companies’ own websites to find the rates and tariff details, and were allowed to use spreadsheets, calculators and a pen and paper to calculate the answers. We discovered that only one of the 36 – a company director – could do it. And a maths expert we consulted informed us that even A-Level maths students would struggle to work it out.49 In a similar, more recent investigation published in Which? in 2012, we asked 1,029 members of the public to select the cheapest out of six current tariffs consisting of various elements, such as standing charges, tiers and unit rates, and then to do the same from six simplified tariffs presented as just a unit rate. We found that just 8% of people were able to identify the cheapest current tariff, whereas 89% picked the cheapest simplified tariff.50
The variation in tariff structures between suppliers is not due to the metering technology found in most peoples’ homes, which is extremely basic and cannot support sophisticated or complex ways of pricing energy. With the exception of a handful of new smart meters,51 there are only two types of energy meter currently in use in UK homes – single rate or Economy 7. Around 80% of households have a single-rate electricity meter that means they can only be charged one rate for a unit of electricity regardless of when they use it.52 The remainder have an Economy 7 meter, which has one rate for electricity used during the day and another cheaper rate for usage at night. All gas meters are of the single-rate type.
These meters only register consumption – features such as standing charges or tiered rates and discounts are a result of the way that suppliers choose to recover the cost of that consumption and are, therefore, entirely artificial. One outcome of this is that consumers wishing to use clip-on energy monitors must calculate a ‘blended’ unit price first incorporating fixed and variable charges and discounts as these devices are unable to handle these elements separately.
The resulting ‘invisibility’ of prices further hampers competition As well as consumers being able to understand and compare prices easily, effective competition also requires that prices are visible – ie in companies’ marketing and advertising and through other media such as best buy tables. In the energy market this is not the case. Complex tariff structures prevent clear price communication and are inherently unsuitable for advertisements or best buy tables.
Chapter 4 What’s gone wrong

0523The imbalance of power The retail market
The media tend to fall back on messages about the annual cost of ‘the cheapest tariff’, ignoring the fact that there is rarely a single ‘best deal’ for all consumers and on the rare occasions there is, it will certainly charge a huge variety of annual prices depending on usage. Further variations in price for each of the 14 different supply regions, and often by meter type as well, add to the difficulties of communicating clear price information. For a basic dual fuel tariff there are a minimum of 98 different prices before any discounts or exit fees are taken into account.
Unsurprisingly, suppliers don’t put these prices in their
advertising, instead tending to claim only that their prices are cheaper than a competitor’s, or that they will save you a certain amount. Adverts often refer only to ‘standard tariffs’, ignoring cheaper fixed term deals. A recent Which? investigation into energy adverts found three companies effectively claiming to have the cheapest standard tariff on the market at the same time (see Box 4). 53 As standard tariffs are some of the most expensive on the market, this amounts to saying that one expensive tariff is cheaper than another expensive tariff, a bizarre outcome that could not arise were prices more visible and easier to compare.
51 Smart meters are smarter versions of current gas and electricity meters. Their smartness comes from the ability of the meters to communicate to devices and servers either within or out with the home. They are able to record and transmit consumption figures for use at different time points- for example, smart meters would be able to record how much electricity was used between 5 and 6pm. This technology is expected to underpin the development of smart or time of use tariffs, where consumers will be charged different rates depending upon when they use their energy. 52 ‘Sub-national electricity consumption statistics and household energy distribution analysis for 2010’ in Energy Trends, DECC, March 2012, 53 Be wary of energy ad special offers, Which? January 2013
Chapter 4 What’s gone wrong

24 The imbalance of power The retail market
Similarly, ‘average’ figures communicated by suppliers to describe price changes can be highly misleading. Prices can be adjusted in many different ways, including changes to the tariff tiers or standing charges, to gas versus electricity rates, with different percentage changes applied across regions and/or to the different payment methods. This can lead to significantly different price changes across customer groups. Which? analysis of the most recent round of price rises for standard tariffs 54 has found: 55
Tier changes: Npower direct debit customers saw the first tier of electricity units increase by 13% and the second tier increased by 7%; while the first gas tier reduced by 9% but second increased by 27%
Standing charges (including discounts): Most of the suppliers reduced their standing charges, with the reduction in the gas standing charge ranging from £11 to £55. Reduction in electricity standing charges were closer, ranging from £3 to £9 depending on supplier, although EDF Energy increased their electricity standing charge by £14.
Gas versus electricity: Standard credit customers with ScottishPower will see their gas increase between 9% and 12%, while their electricity will increase between 0% and 3% depending on consumption
Direct debit versus standard credit: SSE Direct debit customers who are low users will have a 7% increase, whereas the equivalent user who pays by standard credit will have a 13% increase. For high users the increase is the same (8%) regardless of payment option.
On top of these variations, there may be changes to the level of discounts, as well as regional differences. For example, Npower’s ‘headline’ increase of 8.9% could be 6% for a low user and 11% for a high user on the same tariff, while its 9% ‘average’ hike in gas bills masks rises of 13% and 4% for low users and high users respectively (see Table 2).
Yet, because the price rises are presented as an average, many of those hit by above average price rises may not respond to this by seeking alternative tariffs because they are unaware of the degree to which their own bills will rise.
Complex and invisible Pricing facilitates mis-selling
A lack of transparency in pricing prevents consumers from understanding and comparing the prices of different tariffs, which can result in mis-buying and mis-selling.
54 British Gas, www.centrica.com/index.asp?pageid=29&newsid=2588; Npower, www.npowermediacentre.com/Press-Releases/npower-announces-changes-to-gas-and-electricity-prices-11b5.aspx; SSE, www.sse.com/PressReleases/2012/EnergyPricesOct2012/; ScottishPower, www.scottishpower.com/PressReleases_2413.htm; EDF Energy, www.edfenergy.com/media-centre/press-news/EDF_Energy_announce_price_change_for_residential_customers.pdf; E.ON, pressreleases.eon-uk.com/blogs/eonukpressreleases/archive/2012/12/10/1899.aspx. 55 Using Ofgem’s 2011 typical domestic energy consumption figures for low, medium and high users, Which? examined the average % price rise in annual bills across regions on Standard tariffs for gas, electricity and dual fuel (weighted to take into account the composition of gas and electricity) by payment method. This included a break down of fixed charges, unit prices and an assessment of changes to different tiers.
The more complex tariff structures are, the more difficult it is to compare prices and, the easier it is to mis-buy or mis-sell tariffs. There has been a high incidence of mis-selling in the energy market, particularly through doorstep sales (see Box 5) and in 2008 Ofgem found that consumers switching through direct sales routes were less likely to save money than those who switched as a result of their own enquiries. 56
In response to a series of Ofgem investigations and mounting public pressure, 57 the six major suppliers have now withdrawn from doorstep sales. However some suppliers have publicly stated that they will either maintain or increase their sales activities in supermarkets, shopping centres and other public places. In some cases, this will be under affiliated brands or ‘white labels’. A 2012 Which? investigation has already found serious cause for concern in this area, with a number of problems again attributable to complex pricing and tariff proliferation. Tariffs were being sold in potentially misleading ways with quotes provided only on rough estimates of consumption and spend. This could have resulted in those who switched being left up to £311 worse off, despite the promise of savings. 58
Which? research found that 60% of consumers 59 were aware of mis-selling by energy suppliers and Ofgem’s research has also found that news of mis-selling filters through to consumers, deepening mistrust in the industry and embedding a feeling of powerlessness. 60
Standing charge structures create complexity – and may be being misusedThe presence of fixed charges on tariffs – either a daily standing charge or an initial tier of higher priced units – is a considerable barrier to clear and comparable pricing. A particular issue is the use of standing charges (and tiered rates, which function in the same way) in ways that appear to be at odds with suppliers’ claims (accepted by Ofgem) that these are needed to recover fixed costs. Figure 6 shows the variation between different suppliers’ standing charges, as well as how standing charges vary between tariffs offered by the same supplier. While different suppliers may face different fixed costs, we would not expect fixed costs to vary substantially between products from the same supplier.
Chapter 4 What’s gone wrong

0525The imbalance of power The retail market
Box 5 Mis-selling
Ofgem has investigated mis-selling by energy suppliers on a number of occasions. In 2002 London Electricity61 was fined £2m and Npower £1.8m for mis-selling and providing misleading information to vulnerable consumers. In September 2010, Ofgem launched investigations into EDF Energy, Npower, ScottishPower and Scottish and Southern Energy (SSE) to determine whether they were complying with new obligations introduced to prevent mis-selling. As compensation for breaches of a number of licence conditions, including one covering sales, EDF Energy agreed to make payments totalling £4.5m to vulnerable customers. Investigations into the other suppliers are still ongoing.62 In May 2011, SSE was successfully taken to court by Surrey Trading Standards and found guilty of mis-selling on the doorstep. As a result it received a fine of £1.25m in May this year. All of the six major suppliers have since suspended their doorstep sales activities.63
Box 4 Be wary of energy ad special offers Which? January 2013
Which? monitored and analysed energy supplier adverts for over a year. Seven representative adverts were shown to 1,075 members of the public and the vast majority of respondents found the claims made to be misleading. In most cases the adverts made deals and offers sound more tempting than they actually were and some of the advertised deals could actually lead to customers paying more for their gas and electricity. Much of the confusion came from the definition of a ‘standard’ energy tariff and claims were often only benchmarked against other major firms, ignoring cheaper deals offered by smaller suppliers.
For example, 75% of consumers believed that an advert from EDF Energy in January 2012, which proclaimed ‘Other major energy suppliers have now announced price cuts. We’re still the cheapest for standard dual fuel’, implied that EDF Energy was cheaper than the other major energy suppliers. In fact, this claim was only based on ‘standard’ tariffs and was £99 more expensive than the cheaper dual fuel deals on the market at the time. 77% of people said that would feel misled by this advert.
56 Energy Supply Probe – Initial Findings Report, Ofgem, October 2008, p 51. 57 In July 2011 Consumer Focus launched a campaign calling an end to cold-calling doorstep sales. 58 Supermarket Sales Investigation, Which?, February 2012. 59 Populus conducted telephone interviews for Which? with 2,009 UK adults between 24th November and 2nd December 2012. Data has been weighted to be representative of UK population. Figures given are the responses of UK bill payers. 60 Retail Market Review- Updated Domestic Proposals, Ofgem, October 2012, paragraphs 2.4-2.31. 61 Now part of EDF Energy. 62 www.ofgem.gov.uk/About%20us/enforcement/Investigations/Pages/Invstigtions.aspx 63 ‘Energy firm SSE fined £1.25m for mis-selling’, BBC news website, 4th May 2012, accessed at www.bbc.co.uk/news/business-17960877.
% Price Rise
DD % Rise Combined
DD % Rise Gas
DD % Rise Electricity
Cash % Rise Combined
Cash % Rise Gas
Cash % Rise Electricity
British Gas
NPower
SSE
ScottishPower
EDF Energy
E.ON
6 6 6 5 6 8 4 6 8 6 7 7 5 6 8 4 6 8 5 7 7
8.9 9 9 6 9 11 4 9 13 11 10 9 6 9 11 3 9 12 10 9 8
9 9 9 6 9 11 5 9 12 7 8 8 10 10 9 8 9 10 13 10 8
7 7 7 7 9 10 7 8 10 8 9 10 5 7 8 9 11 12 0 2 3
10.8 11 11 11 11 10 11 11 11 12 11 10 6 5 5 6 5 5 7 6 5
8.7 9.4 7.7 6 9 10 7 9 11 6 8 9 6 9 10 7 9 11 6 8 9
L M H L M H L M H L M H L M H L M HAv. Gas Elec
Table 2: Which? Analysis of standard tariff price increases
Chapter 4 What’s gone wrong
Based on Ofgem’s 2011 typical domestic energy consumption figures for low, medium and high users, Which? examined the average % price rise in annual bills across regions on Standard tariffs for gas, electricity and dual fuel (weighted to take into account the composition of gas and electricity) by pay-ment method. This included a break down of fixed charges, unit prices and an assessment of changes to different tiers.

26 The imbalance of power The retail market
This suggests that standing charges may be used for other purposes. For example, recent research by the Centre for Competition (CCP) was unable to attribute the amount of variation in suppliers’ tariff structures to their having different fixed costs.64 Instead, CCP suggested that individual suppliers used different tariff structures as part of a ‘deliberate and systematic strategy’ designed to segment the market according to consumers’ usage and soften competition.65
As we set out later in this report (see Chapter 5), energy prices do not have to be complex. For example, in the
energy markets in Northern Ireland and the State of Illinois, consumers are able to compare prices at a glance without needing a price comparison service or other tool to perform the calculation. One thing that these two markets have in common is that they were liberalised with a single monopoly supplier which had 100% of the market when it was opened to competition. For entrants to gain any kind of market share, they have had to be able to demonstrate clearly to substantial numbers of the incumbent’s customers that they can offer them a better price.
Figure 6: Which? analysis of standing charges
Ann
ual S
tand
ing
£50
£100
£150
£200
£250
£300
MaxMin
Range
£117£52£65
£141£80£61
£107£51£53
£142£104£38
£98£48£50
£92£52£40
£102£55£47
£215£69£147
£192£24£168
£294£78£216
£80£80£0
£80£80£0
£64£40£24
£119£57£62
£190£64£126
£202£84£118
£44£40£4
£168£154£14
£61£60£1
£61£60£1
£35£35£0
£73£73£0
British Gas
E.ON EDF Energy
first utility
npower OVO Energy
Scottish & Southern Energy
Scottish Power
Spark Energy
The Co-operative
Energy
The Utility
Warehouse
Electricity
Gas
64 By ‘tariff structure’ we mean the relationship between the standing charge (fixed price) and the unit rate (marginal price). 65 Non linear Pricing and Tariff Differentiation, Stephen Davies, Catherine Waddams Price and Chris Wilson, CCP Working Paper 12-2, April 2012, p 20. 66 Energy Supply Probe – Initial Findings Report, Ofgem 2008, p 82. 67 Retail Energy Markets: Does competition offer enough protection?, Catherine Waddams Price, CCP Research Bulletin, Autumn 2012, pp 2-4. 68
Guidelines on Cost Reflectivity between Payment Methods and the Prohibition of Undue Discrimination in Domestic Gas and Electricity Supply Contracts, Ofgem, August 2009: 4.2 Ofgem will first consider whether any differences in transaction terms and conditions offered to two or more groups of customers reflect differences in those customers’ circumstances; or whether any relevant similarities in customers’ circumstances are reflected in transaction terms and conditions offered. 4.6: Subsection: (iii) Initial offers. As such if a Supplier were able to demonstrate that a particular price differential or any additional bonus or incentive was being offered on a time-limited basis only (for example, to assist that Supplier in the acquisition of new customers, to penetrate a market in a particular region or to meet a competitor’s offer) Ofgem would likely consider any such ‘initial’ price differential to be objectively justified.
Chapter 4 What’s gone wrong
To compare all tariff fixed components equally, Which? estimated the standing charge of all two-tier tariffs by calculating the excess charges imposed by the first-tier compared to the second-tier. Using the published standing charges for one-tier tariffs, and our estimated version for the two-tier tariffs, we then calculated how much each tariff was charging in fixed costs over a year. The data shown is for Dual Fuel tariffs on a standard meter paying by direct debit in the midlands region. Where the first tier of units are charging up to a relatively high usage, this can inflate the level of cost. Only tariffs launch between 1 Jan 2011 and 20 Nov 2012 are shown.

0527The imbalance of power The retail market
Box 6 Unintended consequences Ofgem’s non-discrimination rulesIn its 2008 Energy Supply Probe Ofgem established that, 10 years after the market was opened (and six years after price controls were lifted), incumbent electricity suppliers appeared able to charge around 10% more66 in regions where they were previously the monopoly supplier than in regions where they were trying to attract customers away from other incumbents.67
Concerned that higher prices were being charged to consumers who hadn’t switched, particularly because non-switchers were more likely to be vulnerable or in lower socioeconomic groups, Ofgem introduced regulations that prevented differential pricing between regions. However, this attempt to force prices charged by suppliers to their active and their ‘sticky’ customers closer together did not bring prices down for the latter. As analysis by the CCP explains, the fact that each incumbent supplier has the majority of their customers and profits in their home areas, meant that bringing prices closer together by lowering bills for these customers would have lost them more money than simply raising prices for more active customers acquired elsewhere. As such, a significant increase in average bills occurred at the time the regulation was introduced, as well as an increase in supplier margins and a drop-off in the number of people switching.
Furthermore, following lobbying from the industry, Ofgem allowed suppliers to develop special deals as alternatives to standard tariffs. The price of these tariffs did not have to be ‘objectively justified’ in terms of their underlying costs,68 with the only condition being that they could only be offered on a fixed term basis. This essentially allowed suppliers to replace one form of market segmentation with another. Instead of pricing the same tariff differently in different regions, suppliers simply introduced a range of differently priced tariffs. And because the best offers tended to be targeted at direct debit customers, discrimination against low income and vulnerable consumers, who are less likely to use this payment method, continues. Furthermore, recent evidence published by the Institute for Public Policy Research (IPPR) claims that these ‘special deals’ may also be offered at, or even below, cost and cross-subsidised by those who don’t switch.69
Regional pricing strategies present a further barrier to an effective market because they make it more difficult to communicate meaningful information about prices to consumers. Britain is a densely populated, relatively small country geographically and most online, broadcast and print media – and therefore advertising – has a national focus. At the same time, circulation of local and regional newspapers is in freefall.70 As we have already pointed out, in the rare instances where suppliers’ advertising mentions price, the information conveyed is at best vague and in some cases may be misleading. ‘Best buy’ tables for financial services like loans and credit cards are a regular feature in the national press because the terms and conditions of those products are not set regionally. However, with regional pricing, a table for the purpose of comparing just standard electricity tariffs from the 17 currently-active suppliers would be 18 rows long and 15 columns across.71
Suppliers price regionally for two main reasons. One is ‘technical’ and relates to differences in network costs in different parts of the country. The other has more to do with the historical geographical distribution of the incumbent suppliers’ customers and the growth strategies of small suppliers.
The prospect of making greater returns from sticky customers led incumbent suppliers to charge higher prices in their ‘home’ regions than in their ‘away’ regions where attracting more active, price sensitive customers required them to beat the incumbent’s price. Consequently, when Ofgem demanded that regional prices were brought closer together, rather than cutting prices in markets where they were incumbents and had very loyal consumers and high profit margins, suppliers responded by simply raising prices in regions where they were entrants and their customers displayed little loyalty and generated lower profit margins (see Box 6).
A risk of moving to national pricing is that all incumbents may respond in a similar way if required to price nationally and offer the same terms to all customers, whether sticky or not.
On the other hand, with national pricing both incumbents and independents would be able to reach greater numbers of consumers at lower cost through more effective marketing and advertising campaigns. ‘Best buy’ tables would be easier to produce, helping create the price visibility that will put pressure on suppliers to keep prices competitive or risk losing customers. Interestingly, in our analysis of the latest round of price rises (described above) we found that for standard tariff customers, both direct debit and standard credit, British Gas essentially already has national pricing. The regional differences range from 0.02% to 0.07% across the different consumption levels.72 EDF Energy also has a very small regional difference of between 1.2% and 1.5% across their standard tariffs, for both direct debit and standard credit customers.
National Pricing – eliminating a further barrier to effective competition?
Chapter 4 What’s gone wrong
69 The True Cost of Energy, Reg Platt for Institute of Public Policy Research, April 2012, p 11. 70 Can local newspapers survive in the internet age?, BBC news website, 11th May 2012, accessed at www.bbc.co.uk/news/uk-england-18032555. 71 Consumer Focus response to Ofgem Retail Market Review, February 2012. 72 Which? examined regional differences, in %, on the annual Standard tariff bill for gas, electricity and dual fuel (weighted to take into account the composition of gas and electricity) by payment method, using Ofgem’s 2011 typical domestic energy consumption figures for low, medium and high users.

28 The imbalance of power The retail market
While some consumers remain on standard tariffs because they find the market too complicated and difficult to engage with, there are a substantial number of consumers for whom the market offers few or no practical alternatives. Many of those who are effectively shut out of the market are in low income and/or vulnerable groups.
Many of the most competitive offers are restricted to those who pay by direct debit and, to a lesser extent, who manage their accounts online and have gas as well as electricity. This is a highly regressive way to deliver an essential utility like energy.
At the time of publication, of the ten cheapest tariffs in the London region for direct debit customers, just four are also available to standard credit customers.73 Three of these were at a significantly higher price, with just one offering direct debit and standard credit customers the same price.74 Six require online account management. The average price of the ten cheapest direct debit tariffs is £1,151 a year; the ten cheapest standard credit tariffs average £1,260 – a difference of £118.
According to Ofgem’s estimates, the annual costs to a typical supplier of serving a direct debit dual fuel customer (£60) are just £26 lower than those to serve an equivalent standard credit customer (£86). Online account management is estimated to save suppliers around £10 a year.75 On the basis of these figures it is difficult to explain why direct debit customers are able to benefit from such significantly lower prices. Why, for example, are some tariffs only available to direct debit customers when they could be offered to standard credit customers at a relatively low additional cost?
One possible answer that has recently been the subject of much speculation is that highly competitive direct debit tariffs may be ‘loss leaders’ and cross-subsidised by customers on other, more expensive contracts, including those who are unable to access the best deals. This was the conclusion of a recent report on energy pricing by the Institute for Public Policy Research (IPPR). As part of its research, IPPR also interviewed four independent suppliers, all of whom stated that a significant barrier to their growth was major suppliers who were using their sticky customers to cross-subsidise loss leading tariffs that they were unable to compete with.76
Because there is little public information on the retailing costs of individual suppliers – a fact that IPPR acknowledges in its report – it is difficult for Which? to independently verify these claims. However, what is clear to us is that, while some consumers may simply prefer to pay by standard credit or by prepayment and are happy to incur the existing premium for doing so, for others the choice is less ‘free’. Consumers on
Some consumers are excluded from the best dealslower incomes are more likely to pay by standard credit or have prepayment meters than to use direct debit.77 There is also the 4% of households that are excluded from direct debit entirely through not having a transactional bank account.78 Similarly, with regard to consumers’ ability to access tariffs requiring online account management, almost a fifth of households do not have some form of internet access,79 with lower socioeconomic groups less likely to be online at home.80
There is also potential for households who do not have a gas supply to be unfairly discriminated against on their electricity prices compared with customers who get their electricity as part of a dual fuel package. This also penalises low income and/or vulnerable groups who are more likely to be ‘off-grid’ (not connected to the gas network).81 For example, some of the most competitive dual fuel offers on the market are not available on an electricity-only basis. Even without the dual fuel discount, the electricity part of the bill for a typical user paying by direct debit on one of these tariffs is around £30 (6%) cheaper a year than the same supplier’s only variable price electricity-only tariff.82
It should be recognised that suppliers do provide help to low-income and vulnerable consumers, who, due to their circumstances, may also be unable to take up the best deals. This help is delivered primarily through statutory schemes, such as the Warm Home Discount (WHD), the Carbon Emissions Reduction Target (CERT) and the Community Energy Saving Programme (CESP). Suppliers may also provide further support that goes beyond government obligations. For example:
For its most vulnerable elderly customers, EDF Energy automatically applies its cheapest tariff rate at any given time, as well as all direct debit discounts regardless of how they pay;83
SSE recently announced that it would make its cheapest tariff available to new prepayment customers;84
E.ON is creating a hardship fund to help those customers in debt or struggling with their payments and looking at Energy Help Checks for its most vulnerable customers, covering energy efficiency advice, measures, income support and tariff checks;85
ScottishPower has written to a group of its most vulnerable customers with debt problems to advise them it will not be collecting any debt repayments over the winter months;86
British Gas operates the broadest eligibility criteria for the WHD, with anyone receiving means tested benefits or a low-income qualifying for help and no cap on the number of eligible households.87
Npower’s Health Through Warmth Scheme supports the
73 Analysis was done on 17th December 2012 using a London post code, average consumption for gas and electricity, comparing direct debit and standard credit tariffs 74 ‘Pioneer’ from Co-operative Energy. 75 Energy Supply Probe - Initial Findings Report, Ofgem, October 2008, p 90. 76 The True Cost of Energy, Reg Platt for Institute of Public Policy Research, April 2012, p 11. 77 Report on direct debit energy payments., Financial Inclusion Taskforce, December 2008, shows that ABs and ABC1s are most likely to pay by direct debit, C2, D and E are most likely to pay by standard credit and D and E are most likely to use pre-payment. Supporting this, Annual Report on Fuel Poverty Statistics 2012, DECC, May 2012, finds that the average income of households paying by direct debit is £31,600pa, quarterly is £26,100pa and pre-payment is £19,000pa. 78 According to the Family Resource Survey 2010/2011, Department for Work and Pensions, 4% of UK households have no access to a bank account with the facility to pay direct debits (table 4.1). Lower income groups are significantly less likely to have access (table 4.8). 79 Statistical bulletin: Internet Access - Households and Individuals, Office of National Statistics, August 2012. 80 One in seven (15%) UK adults do not have the internet at home and do not intend to get access in the next 12 months. This proportion has decreased since 2010, from 19%. Close to half of all non-users are aged 65 and over, or are in DE households. Adults media use and attitudes report, Ofcom, March 2012, p 131. 81 Off-gas consumers: Information on households without mains gas heating, Consumer Focus, September 2011, pp 6-7.
82 Analysis was done on 18th December 2012 using a London postcode, average electricity consumption and a comparison between Sainsbury’s Price Check January 2014
Chapter 4 What’s gone wrong

0529The imbalance of power The retail market
consumers should be additional to a market that works for all consumers, not a substitute for it. In its 2011 Annual Report, the Fuel Poverty Advisory Group noted that the cash value of the WHD was “approximately equivalent to the increases in average annual energy bills resulting from higher charges taking effect from autumn 2011”.89 This means that the WHD simply cancelled out the effect of the price rises and delivered no net benefit. However, if low-income and vulnerable consumers also had access to the most competitive tariffs on the market then it is likely that they would benefit more from such schemes.
Box 7 Social support schemes are not enoughSince 2011, all suppliers with more than 250,000 customers have been required to provide financial support through the Warm Home Discount (WHD) to households in or at risk of fuel poverty, with eligible households currently receiving a £130 credit on their bills. Although not originally intended to be a fuel poverty programme, the Carbon Emissions Reduction Target (CERT) scheme now requires that a large proportion of each supplier’s obligation must be met by providing energy efficiency measures to low-income and vulnerable consumers. The Community Energy Saving Programme (CESP), by contrast, is an energy efficiency scheme targeted directly at the fuel poor. Unlike CERT, which targets individual properties, it provides energy efficiency measures on a street-by-street basis in low-income communities, avoiding the expensive CERT process of energy suppliers having to identify fuel poor households.
While the objectives of these schemes are undeniably positive, there are a number of issues with how they are designed and delivered. This means that the full benefits may not be realised.
First, the costs of these programmes fall on suppliers according to the number of customers they have (as opposed to the volume of energy they supply). We therefore assume that they are recovered as a fixed charge that is the same for every customer, rather than each consumer’s contribution being directly linked to the amount of energy they use. This is a very regressive way to fund social programmes as low-income consumers spend a much higher proportion of their income on their energy bills. Funding these programmes through taxation would be the most progressive approach as it would allow contributions to be linked directly to income. However, if costs have to be recovered through bills then doing this on a per-unit (consumption) basis would be more equitable given the broadly positive correlation between income and energy usage. We are pleased to note that the successor
scheme to CERT and CESP, the Energy Company Obligation (ECO), has been designed in a way that should encourage (although not categorically require) suppliers to recover its costs in line with their customers’ consumption.
Second, as noted above, requiring energy suppliers to identify low-income and vulnerable consumers in need of support is a potentially expensive and inefficient way to deliver social policy. At present, the only group that receives help without having to apply for it are pensioners getting the Guarantee Credit element of Pension Credit90 who automatically receive the WHD. Eligibility for criteria for other low-income and vulnerable groups are set by suppliers (with Ofgem’s approval) and it is then the responsibility of suppliers to identify customers who meet those criteria and encourage them to apply. This creates a number of problems.
As noted by the Fuel Poverty Advisory Group in its annual report – suppliers setting their own criteria for the WHD creates inequity and uncertainty for consumers who may be put off from switching to a different, cheaper supplier if they fear that they might not qualify with the new one.91
The rate of benefit underclaim – estimated at up to £11.77 million in 2008-0992 - means that even if suppliers are successful in identifying eligible customers, those customers may not apply for the help they are entitled to. It is a recognised issue in the energy sector that response rates to supplier communications are disproportionately low among low-income and vulnerable consumers.93
There are indications that suppliers have had difficulty identifying consumers needing help. For example, earlier this year it was reported that in order to meet its target under CERT one supplier was offering cash payments of £50 for every successful referral to a vulnerable consumer needing insulation.94
installation of heating and insulation measures for vulnerable people living in cold and damp homes.88
While discretionary ‘corporate responsibility’ spending by suppliers is welcome, we do not believe it should be relied upon to promote social welfare in the event that government schemes do not deliver. As such, Which? is more concerned with the effectiveness of statutory schemes, such as the WHD, CERT and CESP, which are all government policies but are paid for through energy bills rather than general taxation. We discuss these programmes further in Box 7 (below).
More fundamentally, however, we believe that government and industry policies to help low-income and vulnerable
Chapter 4 What’s gone wrong
Dual Fuel and Sainsbury’s Clear and Simple. 83 Any difference between this and their actual bill is rebated (see www.edfenergy.com/media-centre/press-news/26-03-12-customer-commitments.pdf). 84 In December 2012 SSE offers its cheapest tariff (Discounted Energy April 2015 – a 2% discount off the standard variable rate for a fixed term) available to prepayment meter customers, www.sse.com/PressReleases/2012/SSE_OpensUpCheapestTariff/ 85 www.ofgem.gov.uk/Markets/RetMkts/rmr/Documents1/E.ON%20Consumer%20Initiatives.pdf 86 www.scottishpower.co.uk/your-home/our-winter-commitments. 87 www.ofgem.gov.uk/Markets/RetMkts/rmr/Documents1/British%20Gas%20Consumer%20Initiatives.pdf. 88 www.npower.com/rwenpowercr/3_our_customers/3_3_vulnerable_customers/ 89 Ninth Annual Report, Fuel Poverty Advisory Group, 2010, p 16. 90 This is due to a data-matching exercise between the Department for Work and Pensions (DWP) and energy suppliers records. 91 Ninth Annual Report, Fuel Poverty Advisory Group, 2010, p 16. 92 Income Related Benefits: Estimates of Take-up in 2009-10, Department for Work and Pensions, February 2012, p ii. 93 Conversations between Which? and FPAG. 94 ‘British Gas offers £50 insulation incentive’, The Guardian, 21st February 2012.

30 The imbalance of power The retail market
95 Using the more accepted industry DECC figure of 4.2m annual switches (www.decc.gov.uk/assets/decc/statistics/source/prices/qep271.xls) and Ofgem’s 2012 Tracking Survey, which sets out that 16% of energy customers completed their last switch directly through an online price comparison service, we consider it likely that those switching more regularly will be higher users of comparison sites, so the 16% is an underestimate. The majority of switches though take place either by phoning the supplier (28%) or doorstep (28%).Using the 16%, means approximately 673k customers switch via a switching site in 2011. This equates to 2.5% of all households (based on 26.8 million households in the UK). 96 ‘The Code of Confidence’ is a voluntary code of practice for online domestic price comparison services run by Consumer Focus. 97 Domestic gas consumption in Q1 and Q3, 2009-2011. DECC Quarterly Tables: ‘Energy Trends’, September 2012, table 4.1.
Switching processes are lengthy and opaqueAs discussed in the previous section, tariff complexity makes it impossible for consumers to make like-for-like comparisons between energy prices in the same way that they would for toasters or other consumer products. To understand whether one tariff is cheaper than another, or ideally what the cheapest product on the market for them is, consumers must use a switching site or phoneline, or at least a supplier’s equivalent for its own tariffs - and few are prepared to do so.
Even when individuals are prepared to search the market and switch to a new tariff, there are further problems. For all except those entering annual actual consumption data, the accuracy of switching site (and supplier) calculations is a matter of luck and potentially misleading. The switching process that follows, whether people switch via a switching site or direct with a supplier, is lengthy, unclear and expensive for those who are forced onto expensive standard tariffs for an indeterminate period of time.
Switching sites are not a silver bulletPrice comparison services (switching sites) offer the only way for consumers to overcome complex pricing and compare offers across the market. However, they are not the panacea they are often made out to be. They do not guarantee that users will find the best deal or be able to understand all of the features of the offers they are presented with. This is partly due to barriers to getting the relevant data, and partly due to inbuilt errors in some of the calculations and unhelpful presentation of results.
While around 20% of switchers used a price comparison service to find out about the tariffs on offer last time they switched, just 4% of all consumers have ever used one and even fewer have switched this way.95 In order to use a price comparison service effectively, consumers need to provide a considerable amount of information, such as their tariff name and ideally their annual actual usage, which they are unlikely to know automatically or have to hand. This information has to be obtained direct from the supplier or by looking at their bills or annual statement, where it may not be clear.
The Big Switch, a collective switch initiative run by Which? earlier this year, highlighted several common errors that people make when they are asked to input energy consumption data, for example entering their meter reading instead of their usage. Even if people find the right data, there is no guarantee that it will be accurate as many bills are estimated. And previous consumption may not be a good indicator of future consumption as a consumer’s usage may
vary from year to year due to changes in the weather, the number of people in their household or the physical features of the property.
Switching sites also allow users to approximate usage on the basis of how much they spend annually or quarterly, entering a single quarter’s usage or by filling out a crude ‘ready reckoner’. Unfortunately, the calculations mandated in the Code of Confidence96 for switching sites – a scheme that Which?’s own Which? Switch service is affiliated to – do not take into account how a household’s energy use varies throughout the year. When quarterly usage or spend is entered, it is simply multiplied by four to get an annual figure. As over 40% of gas usage occurs in winter and under 10% in summer on average,97 this can significantly overstate or understate savings depending on which quarter’s consumption is entered. Because the variation in tariff structures means that the relationship between usage and price is not linear, it also adds to the risk of a more expensive tariff being shown as the cheapest for an individual user. And it can affect the estimated annual price for the tariffs where consumers are required to use a certain amount of energy each quarter to qualify for the maximum discount available.
The situation is further complicated by what happens when suppliers make across-the-board price changes for all their variable rate tariffs. Those new rates become the rate for the tariffs in the switching sites’ databases, and the previous prices disappear. So, if a user enters a quarterly or annual ‘amount spent’, the site uses the new rate information to convert it to an annual usage estimate, incorrectly assuming that the consumer has been paying the new price historically. If the new price is higher, then the usage estimate will be either too high; if lower, the estimate will be too low.
Many consumers may also be unaware that the switching site calculations do not take into account any exit fee applying to their current tariff. Suppliers make incorporating this information difficult as they apply exit fees in various ways, including a set end-date for all customers and variable end-dates determined by the amount of time a customer has been on the tariff. However, the sites could do more to flag to users that they should take such fees into account in their decision.
Consumers are generally oblivious to the flaws in switching site calculations. They are also largely unaware of the other risks to data accuracy that can result from using sites incorrectly. However, there does seem to be an understanding of the outcome, expressed as a view that you are unlikely to achieve the promised savings. This is likely to stem from a combination of personal experience, ambitious marketing claims by switching sites, ‘case studies’ in the media where
Chapter 4 What’s gone wrong

0531The imbalance of power The retail market
98 Although the Third Energy Package has set out a maximum of three weeks for a switch. This has been accommodated in GB by setting out a two week cooling off period, at the end of which the three week switching period starts. 99 What can behavioural economics say about GB energy consumers?, Ofgem, March 2011, p 1. 100 DECC, January 2011, accessed at www.decc.gov.uk/assets/decc/consultations/eu-third-package/1156-ia-third-package-fuel-switching.pdf. 101 Electricity and Gas Retail market design, with a focus on supplier switching and billing: Guidelines of Good Practice, CEER, January 2012, p 17. 102 Final Report Recommendations, Independent Commission on Banking, September 2011, p 17.
the savings haven’t materialised, and price rises/falls changing the situation for variable rate tariff customers.
Together with the time it takes to find all the necessary information, this will deter many from using a price comparison service, particularly because a general lack of price visibility means many consumers are unconvinced of the benefits before they even make a decision to search.
Those who persevere will encounter further problems at the results stage of the process. Switching sites do not have access to the full market, nor can they guarantee that they are able to switch people to all the tariffs listed, as this depends on whether the service has a commercial relationship with the respective supplier. So a tariff may be listed, but the consumer then has to take the further step of contacting the supplier direct. This often involves going to the additional trouble of re-providing much of the information already given to the switching site.
For those tariffs that are available, little is done to make consumers aware of the terms and conditions of discounts and exit fees. Of particular concern are temporary introductory discounts used by suppliers to gain a high placing in price comparison tables, which can give a false impression of savings. Communication of the terms and conditions attached to exit fees – such as the right to cancel a contract for a variable price product without paying an exit fee if the price increases during the contract term - is also poor. There is inconsistent highlighting of which tariffs are variable rate and which are fixed rate.
Overall, the operation of switching sites too often compounds the problems created by suppliers’ obfuscation of prices.
Switching times are unacceptably longThose who go ahead with a switch find that the switching process is protracted (taking between five and six weeks on average98), with little information provided to the customer during this time.
This means that the gains from switching do not benefit household budgets immediately in the way that, for example, shopping at a cheaper supermarket the day after shopping at an expensive one would. For consumers, who are generally believed to be ‘time inconsistent’ – meaning a preference for immediate gains sees them place too much weight on costs incurred now compared to future savings – this is likely to make starting the process less appealing, and increase the risk of drop out.99
The reduction in switching times to three weeks required by the EU’s ‘Third Package’ of energy market legislation may
have little impact on the time taken to switch. DECC has proposed a two week ‘cooling off’ period before the three week switching period commences, meaning that it will still take up to five weeks from the point a consumer chooses their new supplier to the date they take over their supply.100 However, in other similarly economically developed countries, consumers are able to switch their energy supplier in as little as a week. According to the Council of European Energy Regulators (CEER), in Ireland and Norway consumers can switch in a week, while in Finland, France, Portugal, Spain and Sweden it takes around two weeks.101
For active switchers who move from one ‘best value’ fixed-term tariff to another, there is another disadvantage, this time financial. With exit fees applying to most fixed-term tariffs, it is unlikely to make financial sense to start the switch until the exit fee expires. This is almost always at the end of the deal term, meaning that these engaged customers are forced to move temporarily to expensive standard rates for an indeterminate period beyond their control while the switch goes through at the suppliers’ convenience.
The Vickers Report on banking – a sector similarly afflicted by low consumer engagement – identifies the importance of easier and quicker switching (alongside greater product transparency) in driving more effective competition and, on this basis, recommended that personal and business accounts should be transferable within seven working days.102 This is due to be achieved by September 2013. If this can be achieved for complex products such as current accounts, it seems unbelievable that more could not be done in the energy sector to deliver a swift process with no added costs.
40%of gas usage occurs in the winter
10%of gas usage occurs in the summer

32 The imbalance of power The retail market
Suppliers are not always upfront about their best dealsHaving ceased doorstep sales, suppliers are now targeting opportunities for face-to-face sales in supermarkets and shopping centres. In late 2011, a Which? investigation into this method of selling energy found that suppliers did not always offer their full range of tariffs, with the cheapest deals often excluded.105 Similar practices exist in outbound telesales, another major sales channel for suppliers. Before the end of doorstep sales, consumers were as likely to have unsolicited contact with an energy supplier sales representative by phone as on the doorstep.106
The same research found that many consumers find these unsolicited-approach sales channels intimidating, with 63% of people - the same as for doorstep sales - who received an unsolicited call at home saying they felt under pressure to make a purchase.
Which? has also investigated consumer-initiated (inbound) telesales in 2011107 and 2012108, In both investigations the major suppliers were called and asked for their cheapest deal. The follow-up investigation showed a welcome improvement by many suppliers compared with the first, but we were still not always told of the cheapest tariff and any associated exit fees.
Even if consumers manage to get themselves a competitive tariff, there is no guarantee that their prices will remain that way. In 2010, Which? found that
103 The Retail Market Review – Updated domestic proposals, Ofgem, October 2012, p 42. 104 Energy Supply Probe - Proposed Retail Market Remedies, Ofgem, August 2009. p. 29 105 The research was undertaken in November 2011, published in Supermarket Energy Deals Exposed, Which? Magazine, March 2012. 106 Which? online survey of 2,003 UK adults aged 16+ who are responsible for energy bills between 20th April and 3rd May 2011. Data has been weighted to be representative of the UK adult population. 107 Kept in the dark, Which? Magazine, November 2011. 108 Home Energy Telesales Deals, Which? Magazine, March 2012. 109 The Great Energy Tariff Lottery, Which? Magazine, October 2010.
customers were being automatically ‘rolled over’ by some suppliers onto new fixed price, fixed-term tariffs once their old one had expired and then faced substantial exit fees if they found that a better deal was available elsewhere and wanted to get out of the contract. Suppliers that didn’t move people to new fixed-term deals tended to move customers onto their standard tariff with no exit fees – although, again, this is unlikely to be a competitive offer.109
Some discounts are not what they seemLarge numbers of consumers receive a discount of some kind on their energy bill in return for taking gas and electricity from the same supplier, paying by direct debit, or for managing their account online. Discounts are commonly used to encourage consumers to use these more efficient payment and account management methods that save suppliers money. They can also form part of the product structure, for example on ‘capped’ discount tariffs where the discount is part of the published rates. However, while the concept of a discount is attractive to consumers, the value of some discounts is unclear, and some in fact may not really be discounts at all.
So-called ‘capped’ discounts are a particular issue. Here there is a guaranteed ‘minimum’ discount (eg 2% off standard tariff rates). However, this may be significantly less than the ‘maximum’ discount applied when the tariff
Poor supplier conduct further undermines engagementFurther deterrents to engaging with the energy market stem from a range of anti-consumer sales and customer service practices across the industry. ‘Better the devil you know’ is a common refrain when consumers are asked about changing their tariff or supplier.
The failings have been many and varied. As described earlier, poor sales and marketing practices have led to consumers being misled and mis-sold tariffs, with doorstep sales proving particularly detrimental. Ultimately public pressure has forced most suppliers to abandon this potentially useful sales channel altogether. However, as also set out previously in this report, this does not appear to have stopped poor sales practices or misleading discounts. In addition, confusing bills often leave consumers without a basic understanding of their energy consumption and costs, undermining their ability to make sense of other offers in the market. Meanwhile, dissatisfaction with companies’ complaints processes is widespread, and information about complaints resolution is not used effectively to deliver improvements.
The fact that these issues have not been confined to a minority of suppliers but have been endemic across the
market implies that the commercial risks from poor conduct are minimal. Tellingly, aspirations to make improvements to service often appear to come not from the possibility of losing customers to other suppliers, but from the threat of greater regulation. Over the last 18 months a number of suppliers have launched ‘trust’-driven customer service initiatives. Improvements are always welcome but have come in the wake of Ofgem’s Retail Market Review and increased interested from Government. Ofgem’s view is that efforts by suppliers to rebuild trust are ‘being driven less by intense competition than by the attention that Ofgem and others are placing on these issues and the strong evidence that is emerging about consumers’ lack of trust’.103
Using regulation to improve customer service is not a hallmark of a market that is functioning properly. It also represents a significant change of direction for Ofgem. In the 2008 Energy Supply Probe, it attempted to ‘encourage’ improvements with non-enforceable standards of conduct that provided minimum expectations of how to treat customers. This approach failed, and Ofgem has now proposed to put variations of the standards into licence conditions.104
Chapter 4 What’s gone wrong

0533The imbalance of power The retail market
is launched. Such tariffs have the potential to seriously mislead consumers, who are likely to assume that the discount they receive when they sign up is equivalent to the stated minimum discount. Anyone signing up for such a tariff under this assumption could see their energy costs rise significantly if the supplier subsequently exercised its right under the terms and conditions of the offer to increase its prices. A failure to properly communicate how capped discounts work is likely to undermine confidence in the market for consumers who have seen an apparently good deal turn into something much less competitive.
Some suppliers also advertise ‘discounts’ (ie on top of the published unit rate) on some tariffs for paying by direct debit or being a dual fuel customer even when the product is not available with any other payment method or on a single fuel basis. These are not really discounts in the sense that they reflect an option that consumers can ‘take or leave’. On the contrary, they are part of the core product. Dual fuel discounts are generally very small these days, yet their prevalence and visibility make it less likely that people will identify the cheapest gas and cheapest electricity on the market, whether this is from one company, or two separate suppliers.
Another problem is the inequitable way some discounts are applied. In the case of discounts for paying by direct debit, suppliers benefit from day one because direct debits boost working capital and reduce bad debt risks. But with one major supplier (Npower) the customer typically receives the benefit of their direct debit discount only once they have been with the supplier for a certain amount of time, usually a year. They do not receive the discount at all if they switch away before each year end.
Where discounts are held back until the end of a contract, they function as a hidden exit fee. While there are regulations in place that protect consumers from cancellation charges if they wish to switch following a change to their prices, it does not appear that these delayed discounts – cancellation charges in all but name – are covered by this protection.
Chapter 4 What’s gone wrong
Bills and other communications are too often not fit for purposeBills are essential, functional documents that should provide the information needed to understand energy use and how this translates to costs. Bills should also give consumers the information they need to be able to compare alternative tariffs and/or suppliers. Suppliers claim that the design of their bills is an important source of innovation and competitive advantage and have adopted a self-regulatory Code of Practice for Accurate Bills, which sets criteria for accuracy but not usability.
The value of this approach is questionable, as one in
three consumers say they do not understand their bills.110 Analysis by Which? in 2012 supports this conclusion, finding that bills from some suppliers failed to communicate key information – including energy costs – on the front page. Annual statements were similarly lacking – several were unclear about the purpose of the document and didn’t provide important information about terms and conditions, such as contract end dates and exit fees.111
There has been recognition of this failing by Ofgem and the suppliers, a number of whom have now redesigned their bills.
Complaints handling and redress processes fall shortLast year consumers made four million complaints112 to the major energy suppliers. Ofgem research has found that around two fifths of customers say they are dissatisfied with their supplier’s complaints handling processes, and of these, the majority are ‘very dissatisfied’ – although some suppliers have lower levels of dissatisfaction than others.113 Which?’s analysis of supplier processes against best practice also presents a mixed picture. Three of the major suppliers have effective systems for dealing with complaints and reporting performance, while the other three fall short.114
Key reasons for dissatisfaction include failure to adhere to some very basic customer service principles, including calling customers back when promised, providing contact details and ensuring customers speak to somebody who has the ability to make decisions there and then.115
Furthermore, two in five complaints considered resolved by suppliers are considered unresolved by the consumer making the complaint. This illustrates a need for suppliers to develop processes to ensure that consumers are genuinely satisfied with the outcome of their complaint.116
It took more than a decade after the liberalisation of the market for the current complaint handling arrangements to be implemented. These included establishing the independent dispute resolution scheme provided by the Energy Ombudsman. While the Ombudsman’s performance has not been independently reviewed by Ofgem since 2010, early problems with managing workload and finance appear to be being addressed effectively.117
So far, unlike regulators of other sectors including financial services, and communications, Ofgem has not used complaints data in a way designed to help drive improvements in complaints handling. A major problem is the continued exclusion of complaints made directly to suppliers from the league tables that detail company performance published by Consumer Focus. Overall there is a considerable opportunity for improvement in both supplier and regulatory practices regarding complaints.
110 ‘35% of consumers did not understand their energy bills”, Consumer Focus online survey conducted by ICM on smart meters and energy billing. 2,048 consumers aged over 18 years took part in March 2010. Informing choices – Consumer Views of Energy Bills, Consumer Focus, March 2011, p 4. 111 News Section, Which? Money, August 2012. 112 Energy Complaints How satisfied are you? Which?, February 2012. 113 Customer Complaints Handling Research, Harris Interactive for Ofgem, March 2012, p 2. 114 Gas and electricity companies rated on their complaints process, Which? June 2012. 115 Customer Complaints Handling Research, Harris Interactive for Ofgem, March 2012, p 4. 116 Customer Complaints Handling Research, Harris Interactive for Ofgem, March 2012, pp 2-3. 117 Independent Review of the Energy Ombudsman, Sohn Associates report commissioned by Ofgem, April 2010.

34 The imbalance of power The retail market
Ecotricity
118 The Retail Market Review – Updated domestic proposals, Ofgem, October 2012, p 40. 119 Glossary of Industrial Organisation Economic and Competition Law, OECD: “whether or not conscious parallel behaviour constitutes an illegal action which is restrictive of competition is a subject of controversy in both competition law and economics. Price uniformity may be a normal outcome of rational economic behaviour in markets with few sellers and homogenous products.” 120 Suppliers may view it as costly to deviate from prevailing market behaviour. For example, if a supplier cuts its prices (or chooses not to increase them), it may increase its market share for a short period of time. However, competitors will probably react by matching the price cut, thus neutralising the gains made by the initial price cutter in the long term. The initial gain obtained by the firm could thus be outweighed by these long term sales at this new reduced price. It is therefore in a supplier’s interest to act in a similar way to competitors. 121 Towards Sustainable Energy Tariffs: a report to the National Consumer Council by the Centre for Sustainable Energy, William Baker and Vicki White, July 2008, p 10
Chapter 4 What’s gone wrong
Analysis published by Ofgem in the Retail Market Review (see Figure 7, right) shows that the six major suppliers not only price their tariffs similarly, they also tend to raise and lower their prices by similar amounts at similar times. Ofgem recognises that such behaviour can undermine engagement by embedding a feeling of helplessness among consumers who may see little benefit in switching in the face of similar pricing strategies.118
As convergence in prices can be a sign both of competition and collusion, it can be difficult to determine which of these forces is driving this behaviour. The six major suppliers having similar strategies may be entirely legal under competition law.119 However, there are a number of features of the energy market that would appear to lend themselves to ‘leader-follower’ or ‘risk minimisation’ strategies, An outcome of this may be that rather than engaging in aggressive price competition, which could make them all worse off in the long run120 - each supplier seeks only to be ‘no worse off’ than their competitors.
There is a high concentration of firms, all of whom have a substantial share of the market, interact repeatedly in the regional electricity markets and the national gas market and sell a homogenous product. Meanwhile, the regulatory requirement to publish tariff information provides information to firms about each other’s pricing behaviour. Importantly, prices can also be changed quickly in response to the pricing strategies of others.
The six major suppliers may also be disinclined to compete vigorously – at least in the short term – due to their vertically integrated nature. Having a customer base that is not ‘outsized’ relative to its generation portfolio reduces the significant financial risk of having to meet demand by buying energy on the ‘open market’ at unpredictable prices (and from competitors). Likewise, vertical integration also mitigates exposure to ‘balancing risk’ – the costs imposed by the energy (particularly electricity) trading systems for mismatching anticipated demand and supply.121
It is recognised that one major constraint on dominant companies colluding – tacitly or otherwise – to raise prices above competitive levels is the ability of other companies to enter the market and drive prices back to lower levels. The problem in the retail energy market is that there is little evidence that new entry can provide this constraint. Independent suppliers that have succeeded in attracting significant numbers of customers away from incumbents have been repeatedly bought out or acquired in other ways, effectively ‘returning’ those customers to the dominant suppliers (see Figure 8). Independent Energy was active
‘Herd-like’ pricing leads to a feeling of helplessness and is encouraged by a lack of credible independent suppliers

0535The imbalance of power The retail market
iSupplyEnergyCo-operative Energy
OvoFirst Utility Ltd
Spark EnergyTelecom Plus
Zest4 Electricity Utilita Ltd
Good EnergyGas West
Independent EnergyEnron Direct Ltd
Utility LinkCambridge Gas LtdAmerada Hess Ltd
Atlantic Electric and GasCountrywide
Ecotricity
1996
1997
1998
1999
2000
2001
2002
2003
2004
2005
2006
2007
2008
2009
2010
2011
2012
Figure 8: Non-incumbent entry and exit
2013
Chapter 4 What’s gone wrong
400
500
600
700
800
900
1000
1100
1200
1300
March
-04
March
-05
March
-06
March
-07
March
-08
March
-09
March
-10
March
-11
March
-12
421
363
305
247
189
131
73
15
£/Cu
stom
er/y
ear
Rang
e -
£/cu
stom
er/y
ear
British GasScottish PowerE.ON
SSERWE nPowerRange of savings
EDF Energy
Figure 7: Dual fuel, direct debit annual bills by supplier, March 2004 - October 2012
Ofgem, Energy Supply Probe - Initial indings Report, 2008
Ofgem, The Retail Market Review- Updated Domestic Proposals, 2012

36 The imbalance of power The retail market
122 ‘Independent Energy collapses with customers still owing £119m in bills’, The Independent, 9th September 2000. 123 Smaller Suppliers in the UK Domestic Electricity Market: Experience, Concerns and Policy Recommendations, Stephen Littlechild, EPRG, June 2005, p 10.
Figure 9: Average dual fuel offline direct debit vs best incumbent supplier and small supplier online deals
600
800
900
1000
1100
1200
1300
Jan-
08
Apr-0
8
Jul-0
8
Oct-0
8
Jan-
09
Apr-0
9
Jul-0
9
Oct-0
9
Jan-
10
Apr-1
0
Jul-1
0
Oct-1
0
Jan-
11
Apr-1
1
Jul-1
1
Oct-1
1
Jan-
12
Apr-1
2
Jul-1
2
Oct-1
2
£/cu
stom
er/y
ear
Small supplier best online tariffAverage major supplier Dual Fuel Offline DD
Range of major supplier best online tariff
Chapter 4 What’s gone wrong
between 1999 and 2000 before collapsing due to billing problems, after which its quarter of a million customers were distributed between Npower and E.ON.122 Atlantic Electric & Gas entered the market in 1998 and had 140,000 customers by the time it was bought by SSE in 2004, while another 1998 entrant, Amerada, sold its 90,000 customers to E.ON in 2002.123
Of the current crop of independent suppliers, just two – Ovo Energy and First:Utility – appear to be having a noticeable impact on the pricing decisions of the six major suppliers. Others, such as Good Energy, Ecotricity and Ebico, tend to target a very niche segment of environmentally and/or socially conscious consumers whose main motivation is not price. The effect of Co-operative Energy, the newest of the independent suppliers, remains unclear although, as we explain below, this may be due in part to its decision to target the slower-moving standard tariff segment of the market.
Furthermore, it is debatable how much impact Ovo Energy and First:Utility have had on the general competitiveness of the market. As Figure 9 (above) shows, incumbent suppliers have responded to the threat posed by price-focused independents not by cutting the price of
the standard tariffs that most of their customers are on, but by developing special, typically online-only, offers for more engaged customers who might otherwise be tempted to move to a smaller supplier. It is interesting to see that, following a narrowing of price differentials between the major suppliers’ standard and online tariffs between the winter and summer of 2009, these differentials suddenly widened substancially following the launch of a market leading tariff from an independant. The price of standard tariffs, on the other hand, remain largely unchanged until the price of the cheapest independent’s offer started to rise and there was a corresponding increase in the price of standard tariffs.
It should also be noted that, to date, Ovo Energy and First:Utility have restricted their offers to the direct debit segment of the market (with Ovo Energy also requiring customers to manage their accounts online). As such, they have had little impact in terms of impriving the competitiveness of the market for standard credit and prepayment customers, many of whom, as we set out earlier, have no real choice but to use those payment methods.
Ofgem, The Retail Market Review- Updated Domestic Proposals, 2012

0537The imbalance of power The retail market
Chapter 5 Conclusions and recommendations
Conclusions The evidence points to a clear conclusion: Britain’s retail energy market is broken The ‘market’ is essentially an oligopoly of six large, vertically-integrated suppliers that do not face genuine competition for the vast majority of their customers. In a market where consumers are supposed to be the engine of competition, seeking out the cheapest deals, it is unacceptable that people cannot understand and compare prices. It is therefore little wonder that three-quarters are on expensive standard tariffs.124 Yet, even if comparisons were possible, consumers would likely find themselves thwarted by an industry structure that – in the absence of independents’ ability to achieve serious scale – leads dominant companies to adopt strategies of comfortable co-existence rather than dynamic and aggressive rivalry.
The limited competition that exists is played out in a small segment of the market where the six major suppliers and a few of the independents vie for the most determined and engaged consumers with attractive fixed term deals. Yet this is little more than an illusion of a competitive market, propped up by the flawed measures of switching numbers, large numbers of tariffs and international price comparisons.
Furthermore, potentially large numbers of consumers are effectively excluded from the most competitive tariffs, while accusations of loss leading are a common complaint from those suppliers struggling to gain a foothold in the market (Box 8 below sets out a number of other factors impacting on small suppliers). A lack of robust information makes such allegations difficult to substantiate; however, the generally low level of engagement on the part of most consumers at least makes such practices a distinct possibility. What is clear is that those who tend to benefit from competitive prices are likely to be in higher
socioeconomic groups, while poorer and vulnerable consumers tend to languish on more expensive tariffs.125 As such, we do not believe that the promise that ‘everyone’ – including the poorest and most vulnerable consumers – ‘would benefit from competition’ has been delivered upon.
Consumers are disempowered and distrustingThis is all a far cry from the vision enshrined in Ofgem’s remit to protect consumers through promoting effective competition. The price of energy is people’s foremost financial concern but they appear powerless to take advantage of what limited competition the market does offer. For too long there has been a policy approach that has ignored the need for comparability, instead prioritising suppliers’ claims of a need for complex tariff structures to recover different types of costs and deliver ‘choice’ and ‘innovation’ – two areas where suppliers have delivered little that is beneficial.
124 Based on Consumer Focus price data from 11 October 2012 (not including most recent round of price increases). National averages calculated based on six major suppliers prices in all 14 regions. for a ‘medium’ consumer using 3,300kWh of electricity and 16,500kWh of gas a year. 125 According to Ofgem, the proportion of consumers who claim they have never switched is 10% higher among those in the lowest social groups than the average. Switching is highest for those in the highest social grades. 126 Other obligations such as the renewables obligation is placed on all suppliers regardless of their customer base, as will the arrangements around Contract for Difference in the Electricity Market Reform. These will be discussed in subsequent reports. 127 ‘Red Tape Slashed in Boost Small Energy Supplier’, DECC press release, 13th June 2011.
Sector Don’t trust
Car industry 59%
Gas and electricity companies 54%
Long-term financial products 50%
Banking 42%
Mobile phone services 31%
Train travel 31%
Trade services 29%
Airlines/holiday operators 27%
Broadband/home phone services 25%
Water 20%
Food/groceries 18%
Domestic appliances 11%
Technology 10%
Further to concerns of loss leading tariffs, and in addition to general challenges around economies of scales that smaller companies face in any markets, there are some specific challenges these companies face.
Energy suppliers are used as the vehicle to deliver environmental and social objectives, such as WHD and CERT (described in Box 7). The requirement to deliver many of these objectives is determined by the number of customers the supplier has.126 The threshold was set at
50,000 customers but recognising this could impede the ability of small suppliers to grow, in June 2011 this was increased to 250,000.127
The liquidity and accessibility - credit and collateral requirements - of the wholesale market are also important factors in the ability of suppliers to enter and grow. These issues will be addressed, along with wider wholesale market issues, in the next report.
Box 8 Hurdles facing small suppliers
Table 3 Consumer trust of different sectors
Populus conducted online interviews for Which? with 2,064 UK adults between 28th and 30th November 2012. Data has been weighted to be representative of UK population.

Chapter 5 Conclusions and recommendations
38 The imbalance of power The retail market
An opportunity to be seized
We accept that the regulator and the Government now recognise the problems of disengagement and market segmentation. Positively, a number of suppliers also appear to recognise that the current market arrangements are no longer sustainable, They are open about their desire to rebuild consumers’ trust and have made steps in the right direction including customer service initiatives and reducing the number of tariffs on offer. However, with trust levels falling rather than rising, and too many consumers still paying too much, more needs to be done.
With the Retail Market Review approaching its final stages, Ofgem has now been engaged in a review of the retail market’s problems for much of the last five years – a process that began with the Energy Supply Probe in 2008. However, it is notable that Ofgem’s approach has changed markedly in that time. Whereas the Probe attempted to ban discrimination between different groups of customers through the use of regulation (an intervention that, as we explained earlier in Box 6, may have actually made things worse),
the Retail Market Review – correctly, in our view – seeks to increase engagement and improve outcomes for consumers through more effective competition.
There is much to welcome in the latest Retail Market Review package.129 The focus on increasing wholesale market liquidity and transparency130 is of fundamental importance in ensuring independent suppliers and new entrants can mount a credible and sustainable challenge to the dominance of the six major suppliers. As we set out below, although long overdue, we support the proposals to simplify bills and other communications, improve the switching process, provide better reporting of complaints data and monitor the development of competition in a more sophisticated and meaningful way.
However, the combination of Ofgem’s Retail Market Review proposals and the Prime Minister’s recent announcement to ensure consumers get the ‘lowest tariff’131 still contain a serious risk of allowing competition to remain weak. The proposals will not materially improve the comparability of all energy tariffs. Thus prices that can’t be compared at a glance will remain, limiting competitive downward pressure on bills. Furthermore, segmentation based on payment method or online account management will still be possible, meaning any competitive pressure that there is cannot be guaranteed to deliver benefits across all consumer groups.
Yet by going a little further to reduce tariff complexity, Ofgem and the Government can not only remove some of the practical issues with the current proposals, they can deliver a framework that finally enables consumers to play their designated role and drive genuine, effective competition that keeps prices in check for everyone.
In the following section we set out a number of recommendations that are very much aligned with Ofgem and the Department of Energy and Climate Change’s direction of travel. They are designed to ensure that competition places real pressure on suppliers, and that every consumer pays a fair and competitive price for their energy.
The energy market provides an essential service to consumers, Competition can work but it demands a different approach to markets where consumers have a choice whether or not to participate in that market. Our recommendations reflect this.
Other approaches to energy market competitionThis section briefly describes two other liberalised markets
128 Populus conducted telephone interviews for Which? with 2,009 UK adults between 24th November and 2nd December. 2012. Data has been weighted to be representative of GB UK population. Figures given are the responses of UK bill payers. 129 Retail Market Review- Updated Domestic Proposals, Ofgem, September 2012: Limit each supplier to 4 tariffs per fuel, per meter and per payment type; Put an end to complicated multi-tier tariffs, requiring all tariffs to be set out in a simple standing charge and unit rate structure; Require suppliers to give consumers personalised information on their bill of the estimated savings they could make if they switch to their supplier’s cheapest deal; Introduce a Tariff Comparison Rate: a ‘common currency’ to allow customers to compare tariffs across the market; Require suppliers to give all customers a new, improved Annual Statement with the personalised information a consumer needs to engage in the market, and to provide other ‘calls to action’ on bills and in the letter notifying consumers of price increases; Introduce new licence conditions to require suppliers to treat their customers fairly and to embed this principle throughout their business. 130 Wholesale power market liquidity: consultation on a ‘Secure and Promote’ licence condition, Ofgem, December 2012. 131 Ofgem propose limiting suppliers to 4 ‘core tariffs’ per fuel, requiring that these tariffs contain one standard variable rate tariff and one fixed term fixed price tariff that are comparable like with like across the market, and prohibiting poor value ‘dead’ tariffs by transferring consumers to the cheapest tariff. Ensuring a better deal for energy consumers, DECC discussion document, November 2012.
This approach has been informed by a misplaced view that consumers will always act in a rational manner and seek out the information they need to make their choice, regardless of complexity and the effort involved. It has resulted in a segmented market that penalises those who do not – or cannot – engage. Those who do engage face a convoluted and overly-long switching process, while there is strong evidence that many switchers fail to save money or cannot judge if they have. These experiences are also likely to weaken incentives to engage with the market again in future. Not only have consumers withdrawn from the market, they have lost trust in it. There is a crisis of confidence in the energy sector. Just 32% of consumers say they trust energy suppliers to act in their best interests – a view driven by a perception that the industry prioritises profits over treating their customers well. Over half of consumers do not trust their supplier to provide them with energy at a fair price, while just a quarter believe that competition helps keep energy prices in check.128 Compared to other sectors, energy suppliers have now reached record levels of distrust with 54% of consumers saying they don’t trust them - in comparison, only 42% of consumers don’t trust high street banks. In fact, of the 15 sectors we test, only the car industry is trusted less, with supermarkets, trades and broadband providers all ranking considerably higher (see Table 3).

0539The imbalance of power The retail market
Chapter 5 Conclusions and recommendations
132 Formerly Northern Ireland Electricity (NIE) 133 2,034 customers in March 2011 had electricity from an alternate retail energy supplier - International Approaches to Energy Retail and What the Future Could Hold, a Baringa report for Which?, April 2012, pg 57. This has now reached 1.5million www.pluginillinois.org
– Northern Ireland and Illinois – that, for different reasons, are relevant to the recommendations that follow in the next section. We do not consider it a coincidence that, where energy suppliers are competing to gain market share, as in both of these markets, transparent pricing – whether driven by regulation or suppliers’ own business decisions – is the norm. But where suppliers are established and have an opportunity to extract excess revenue from consumers who are less inclined to switch, as in Britain, obfuscation appears to be the preferred strategy. This may be exacerbated by the fact that the dominant suppliers in the British market are all vertically integrated – a business model that can prioritise a balance betweena supplier’s retail base and its own generation capacity over the acquisition of more customers than it can supply. That is not to say that there are no suppliers with incentives to compete in the British market – smaller suppliers consistently state their desire to grow. However, although many have made a virtue of simplicity in terms of their tariff and customer service proposition, this will only have a limited effect unless all suppliers, particularly incumbents (who have the vast majority of customers), price their products in a standardised way.
Northern Ireland – transparent pricing The introduction of competition in the electricity market in Northern Ireland provides a useful counterpoint to the British experience. Some years before liberalisation, the Utility Regulator (Ofgem’s equivalent in Northern Ireland) banned monopoly suppliers from using standing charges on their tariffs in order to reduce bills for low users, who were also more likely to be at risk from fuel poverty. The ban on standing charges has remained in place post-liberalisation, although it applies only to the incumbent supplier, Power NI132, whose prices are also still regulated. However, despite entrants being free to have standing charges on their tariffs, none has decided to use them so far.
We believe the difference between the two markets is driven by a recognition by entrants that they will only succeed in the Northern Irish market if they can clearly demonstrate to the incumbent’s customers that they can offer a better price. A similar situation is found in the energy market in Illinois in the US (see below). By contrast, in Britain, competition has largely been between incumbents, all of whom had large customer bases when the market opened and have substantially increased these as a result of consolidation.
Illinois – regulated default tariff Consumers in the US State of Illinois have a choice of either one electricity supplier whose prices are regulated (known as ‘the utility’) and other suppliers whose prices are not regulated. In one area of the state there are more than 20 alternative suppliers competing with the utility. As in Britain, consumers can choose between fixed- and variable-price tariffs, as well as some green options. Those with a smart meter can also choose a ‘real-time’ pricing plan.
The utility is tasked with securing electricity in a competitive and cost-effective manner. As it makes a regulated return from its ownership and operation of the physical distribution network, there is no mark-up or profit on the price it charges. This creates a competitive benchmark price or ‘price to beat’ for alternative suppliers to aim for, while ensuring that customers who do not switch still receive a fair price.
The fair price is determined by an electricity procurement strategy set by the regulator. This means that it is not the price of the electricity itself that is regulated, but the process of buying it. The regulator establishes the amount of electricity required and how far in advance it should be bought. It then invites generators to submit sealed bids to meet demand, effectively obliging them to bid their best price.
Comparing prices is straightforward as one part of the price (covering distribution costs, metering, billing and tax) is set by the regulator and is the same whether the consumer buys their electricity from the utility or an alternative supplier. This means that consumers have to compare only the unit rates of the different suppliers to check whether they could save money by switching.
In March 2011, the Illinois regulator re-launched its consumer website to provide consumers with a price comparison table showing the unit price they would have to better, in order to save money by switching, as well as advice on how to choose an electricity tariff. Since the re-launch, the number of consumers switching away from the utility has increased from around 2,000 to more than 1.5 million, with much of this uplift driven by municipal collective switching initiatives.133

40 The imbalance of power The retail market
RecommendationsWhich? believes the proposals set out here offer the best chance to make competition work
Our recommendations are designed to maximise the number of consumers who can engage with the market by making it as simple as possible to do so. The actions of these consumers should drive real competition across the market, ensuring that the benefits of competition are shared by those who are unable to engage.
Delivering genuine competition through clear pricing should also help build the perception that the retail energy market is designed to work in consumers’ interests as well as energy companies’. This is vital, not only because it will enable consumers finally to play the ‘engine of competition’ role envisaged for them at liberalisation, but because it is also key to convincing people to buy-in to playing their part in meeting the challenge of renewal, by supporting the £110 billion bill134 and changing their energy use. If people continue to believe that the retail market is not fair and balanced, they are unlikely to be willing to accept the inevitable increases in bills to meet the costs, or explore ways they can shift or reduce their usage for the benefit of the system.
Which? considers that competition driven by engaged and well-informed consumers is often the most effective mechanism to drive efficient prices and innovation. A decade on from liberalisation, competition should be given a final chance to work. Ofgem and, where necessary, the government should use the Retail Market Review as an opportunity to implement our recommendations, also ensuring that a meaningful and consistent set of indicators are developed to monitor and measure their impact on competition.
If the proposals that we recommend in this report are introduced and consumer outcomes have still not improved by 2015 then the whole concept, and associated costs, of a liberalised market for energy should be fully reviewed against other options, including the introduction of stronger consumer protections on price. Such a review will be needed even earlier if the government and regulator are unwilling to take forward the proposals in this report, because Which? does not consider their currently proposed approach sufficient to deliver effective competition that protects the welfare of consumers.
These illustrative simplified energy tariffs are comparable at a glance. Figures shown are for representation only, not actual prices
134 Annual Energy Statement, DECC, November 2012.
Chapter 5 Conclusions and recommendations

0541The imbalance of power The retail market
Unit pricing – ‘at a glance’ comparability and the same price for each unit of energy To provide the straightforward comparability that will make it easy for consumers to compare offers and identify the best, a consistent system of unit pricing is required. This means standardising the structure of tariffs so that all consumers have to do is look at the unit price, whether expressed consistently in kilowatt hours, megawatt hours or any other unit of consumption. The stated purpose of competition is to keep the prices of this essential service in check. It is unacceptable that consumers have to go through such a complex, error-prone process in order to compare prices and not surprising that few even attempt it. Energy is not a bespoke product, it is a basic utility and should have clear prices that are highly visible across consumer media. This can be achieved through:
The abolition of standing charges and tiered rates which have served to obscure prices;
Requiring the unit price to reflect the costs of paying by direct debit (the most common and lowest cost payment method) with any surcharge a supplier chooses to levy for other payment methods presented as an annual amount priced in pounds and pence and chargeable on a daily basis. This surcharge must be ‘universal’, ie the same on all of a supplier’s tariffs;
Requiring dual fuel and online account management discounts also to be presented as a universal amount priced in pounds and pence and available on all tariffs offered by a supplier; and
Requiring the key features of each tariff to be reflected in its name (eg whether the tariff is fixed or variable price, fixed-term or open-ended etc).
These measures would instantly bring full comparability to all single-rate tariffs, which constitute around 80% of energy tariffs currently available. Customers with Economy 7 could be given an indicative ‘weighted’ unit rate for the purpose of comparison, calculated using the average ‘split’
between day-time and night-time use. With unit pricing, prices should become visible as
well as easily comparable. It should be easy to pick up a newspaper, go to a website or digital teletext or even ring around the different suppliers to find out quickly and conveniently what the cheapest deal on the market is. Information about a supplier’s cheapest tariff would also be simple to communicate on energy bills in this form, acting as a prompt for consumers to take action.
As well as making prices clear and visible, simple single unit price tariffs will pave the way for more effective collective switching initiatives because it will be possible to establish a single ‘best deal’ for all participants. Current tariff structures mean that a ‘winning tariff’ that is market-leading for a ‘typical’ customer will probably not be the cheapest for everyone.
Our proposals for the treatment of surcharges and discounts should also ensure that customers who do not – or cannot – pay by direct debit, manage their accounts online, or get a dual fuel tariff (because they don’t have mains gas) are treated fairly because the value of these surcharges and discounts will be transparent and easy for the regulator and consumer bodies to scrutinise. This should limit the scope for discrimination against certain groups of consumers, or for suppliers to use discounts or surcharges to distort the way prices are presented.
Finally, we also believe that unit pricing is a fairer way to price energy, given that the majority of the costs that make up a consumers’ bill depend on how much energy they use (see Box 9 overleaf). It should also place greater emphasis on the marginal costs of energy consumption, stopping the current situation of ‘the more you use, the less you pay per unit’ and providing consumers with greater financial incentives to invest in energy efficiency measures.
Unsurprisingly for a policy that seeks to deliver full price transparency, a number of objections to unit pricing have been raised in our discussions with energy suppliers and others. In Box 9, we set out our response to these, as well as examining the limitations of Ofgem’s proposed APR-style metric. It is also worth noting that EDF Energy Supports unit pricing and Ebico’s tariff already uses a single unit rate.
Recommendation 1
Chapter 5 Conclusions and recommendations

Chapter 5 Conclusions and recommendations
42 The imbalance of power The retail market
Ofgem’s Tariff Comparison Rate means unit pricing is unnecessary To get round the problem of prices being dependent on a consumer’s consumption, Ofgem has proposed a ‘common currency’ for energy tariffs, known as the Tariff Comparison Rate (TCR). However, Which? believes that this is a poor alternative to unit pricing and may confuse or mislead consumers for the following reasons:
The TCR will not show consumers the price that they will personally pay or whether it is definitely cheaper for them than another tariff. Instead, it will be a ‘blended price’ based on the national average annual price of a tariff at different consumption levels. If consumers fail to recognise – as we believe many will – that the TCR is merely a ‘prompt’ to search further and obtain a ‘personalised price’ from a switching site or supplier, then this creates a risk of mis-buying. It seems highly questionable whether, given historically low levels of engagement, a ‘prompt’ of this kind will deliver the serious competitive pressure that is needed.
Simply to make sense of the TCR, consumers will need to know their consumption – or at least whether they are a low, medium or high user. Evidence suggests that consumers do not have a sufficient understanding of their usage to do this, and using bills and annual statements to ‘educate’ consumers about which usage category they are in is likely to be ineffective given low engagement with these communications;
Furthermore, basing the TCR on a national average price adjusted for suppliers’ regional market shares is likely to misrepresent the price of tariffs from suppliers who have large numbers of customers in regions with high distribution costs.
Consumers are also likely to be confused by the relationship between their tariff’s TCR (expressed as p/kWh) and the unit rate that they see on their bills and, increasingly, on in-home display units.
Abolishing standing charges ignores suppliers’ need to recover fixed costsConsumers’ bills are broadly made up of five types of cost – the wholesale cost of energy, the cost of transmission and distribution, the cost of government environmental and social policies, tax and suppliers’ retail costs and margin. The majority of these costs are inherently variable and/or most appropriately recovered on a consumption basis.
The wholesale energy component is indisputably variable as it depends on the amount used, as does the VAT element. Analysis by Ofgem has also determined that the majority of electricity and gas transmission and distribution costs faced by suppliers are also related to the consumption of individual customers – technically there are no fixed gas distribution charges135 and, for electricity, there is only one fixed charge, amounting to £13 per household per year.136 The costs of government
environmental and social polices are fixed. The amount of carbon savings each supplier has to deliver through the CERT and the CESP are based on the number of customers it has, while the amount of financial support that suppliers must provide under the much smaller Warm Home Discount scheme is calculated in the same way. However, the ECO, which will replace CERT and CESP in 2013, will be treated as a variable cost as each supplier’s target will be set according to the amount of energy it supplies.137 As well as according with the ‘polluter pays’ principle, recovering policy costs in this way is, as set out below, more socially progressive due to the positive relationship between energy use and income.
We do not doubt that a large proportion of suppliers’ own retail costs are fixed. However, it is also the case that retailers in other sectors face fixed overheads but do not choose to recover them through price structures that include fixed charges. The provision of a petrol station, for example, entails a range of fixed costs – rent, staff, lighting, heating, security, processing payments and so on – but no forecourt operator charges an ‘entrance fee’ to cover these. Instead, these costs are recovered through unit prices.
Which? understands that unit pricing will probably result in suppliers being unable to recover all of the fixed costs associated with supplying some low users and those customers will become loss making as a result. However, this must be set against the fact that the price structures used by suppliers to ensure they can recover these costs have resulted in a market where consumers are unable to understand and compare prices and drive effective competition. It has also led to discrimination against many groups, including some of the most vulnerable.
One solution that has already been suggested is to set a regulated ‘universal’ standing charge for all suppliers so consumers are able to compare prices simply by looking at the residual unit rate. However, there are clear problems with the proposal to include costs that are within the control of the supplier in such a charge. First, Ofgem is likely to have difficulties establishing what the charge should be. Second, suppliers may have different fixed costs, meaning that their inclusion in a universal standing charge may result in over-recovery or under-recovery compared with the actual costs incurred. This may deliver advantages to suppliers with lower costs and potentially reduce their incentives to cut costs further.
On balance, therefore, Which? believe that a single unit price incorporating all fixed and variable costs is the most advantageous option. We accept that such a price structure may not be fully cost reflective. However, it would be wrong to assume that the way that energy is currently priced fully reflects costs. There are a number of clear cross-subsidies in the energy market that are not adequately addressed by current price structures. Some of these cross-subsidies are either extremely difficult or even impossible to quantify. These include the extent to which
135 ‘Technically fixed’ refers to the fact that one of the gas distribution charges is based on historical (from the previous year) rather than current consumption and, as such, may be treated as fixed by suppliers. However, the level of the charge does depend on the amount of energy used and there should be a close correlation between historical and current consumption. As such, we believe that this charge should be treated as a variable charge and recovered through the unit rate.
Box 9 Answering the objections to unit pricing

0543The imbalance of power The retail market
Chapter 5 Conclusions and recommendations
consumers differ in the demands they place on suppliers’ customer service functions, the pattern of their consumption (eg those who cook their dinner at 8pm, after the height of the evening peak, cross-subsidise those who cook their dinner at 6pm), and their location (eg within each distribution region there are higher-cost rural consumers and lower-cost urban consumers yet tariffs are not varied to reflect this with the costs of serving each incorrectly assumed to be the same).
More generally, it is a fact of business that not all customers will be profitable. The considerable overheads incurred by supermarkets, for example, are almost certainly not recovered from those who only spend a small amount on groceries, while credit card providers get little benefit from customers who pay their balance off in full at the end of every month.
Unit pricing will unfairly penalise high users, particularly those in low income groupsWhich? analysis suggests that our proposals are actually broadly socially progressive, given the generally positive relationship between energy usage and income. Low users, who are more likely to be in low income groups, currently lose out. We have modelled the impact of moving to unit pricing and calculated that, based on current average standard tariff prices low users would see their annual electricity bills fall by £23 (7%) and their gas bills by £32 (6%). High users would see a £34 (5%) increase for electricity and £37 (4%) increase for gas. However, it is important to note that our modelling is based on current prices and does not account for the increase in competition (and resulting downward pressure on prices) that we would expect in a market with clear and transparent pricing.
Rebalancing tariffs by spreading fixed costs across the whole customer base will also be beneficial from an environmental point of view as it will place greater emphasis on the cost of excessive energy consumption and strengthen incentives to invest in energy efficiency measures.
However, the persuasiveness of this case also depends on how negatively – in terms of their ability to pay – higher users will be affected. It may not be enough simply to state the fact that higher users tend to be in higher income groups, as there is a significant minority of ‘high use, low income’ consumers who are likely to see their bills rise under single unit rate pricing. According to analysis produced for Ofgem by the Centre for Sustainable Energy there are just fewer than 1.1m households with above average electricity consumption and around 530,000 households with above average gas consumption that are in ‘income poverty’ (defined as below 60% of median income).138 The analysis identifies four distinct high user groups for electricity and two distinct groups for gas. All of these groups will see their bills rise under unit pricing, with the size of the increase ranging from £14 to £34 for electricity and £10 to £37 for gas.
However, given the generally socially progressive nature of our proposals, we think that they are justified in terms of the benefits that should arise from a more transparent and therefore competitive market. We also believe that the impact on low income households with high usage should be alleviated in other ways. For example, ensuring that energy efficiency measures delivered through the ECO are targeted effectively at this group, introducing a differential rate for the Warm Home Discount based on energy usage, as well as recognising that some issues – such as health conditions that result in high demand for heat or hot water - are beyond the scope of consumer energy policy and should be addressed through social institutions, such as the welfare state.
Unit pricing will destroy innovationThis objection rests on an assumption that there has already been substantial beneficial innovation in the retail energy market. Which? does not agree with this view. Commonly cited ‘innovations’ such as offering consumers different payment methods and online account management options have, in fact, been rapidly ‘commoditised’ due to the ease of replication by all suppliers in the market. Nor is it the case that these services are unique to the energy market – they are found in many other consumer markets, including telecoms and financial services.
In our view, most ‘innovation’ in the energy market is largely a matter of price presentation. Tiered ‘no standing charge’ tariffs are regularly held up as a major example of innovation yet for the vast majority of consumers they function in exactly the same way as a tariff with a standing charge. This is because the first tier of units is set at a level well below the annual consumption of most households and is priced at a higher rate which reflects both the cost of energy consumed and any fixed charges (the second tier is priced at a lower rate, reflecting just the cost of the energy consumed). This arrangement is therefore little more than a marketing gimmick.
Smart metering technology does have the potential to deliver innovative tariffs that give consumers a choice of ways to change how they use and pay for energy, as well as reflecting different risk preferences. These include tariffs based on time-of-use pricing and ‘real-time’ products that are directly linked to wholesale market prices. These types of tariff should also help some consumers save money, but adding them into current tariff structures will create further barriers to consumers ever understanding the true price of one tariff against another. Starting from the basis of the single unit rate would make it easier to construct new tariff types that remain easy to compare.
Finally, we do not believe that unit pricing will prevent suppliers from offering energy-related ‘add-ons’, such as loyalty points, central heating servicing or remote heading controls. With the price of the tariff clear via the single unit rate, consumers will be better placed to judge the value of such ‘added’ benefits.
136 The Standardised Element of Standard Tariffs under the Retail Market Review, Ofgem, February 2012, pp 10-11. 137 Energy Companies Obligation (ECO) 2012 - 2015: Guidance for Suppliers, Ofgem E-Serve, November 2012, pp 28-30. 138 Understanding ‘High Use Low-income’ Energy Consumers, Centre for Sustainable Energy final report to Ofgem, November 2010, pp 11-18

44 The imbalance of power The retail market
Limiting segmentation – allow one default tariff and make all tariffs available for all payment methods Suppliers currently segment the market through practices that increase complexity and restrict availability of certain products to certain customer groups. This means that most consumers – including a disproportionate number of the vulnerable – are found in a part of the market that sees little benefit from competition. Which? believes that the following moves in addition to the single unit rate would start to address this:
Requiring suppliers to offer one open-ended variable rate ‘default’ tariff per fuel and no other variable rate products where the price is set entirely by the supplier;
Requiring that all other tariffs are fixed-term contracts and either fixed-price or (assuming a sufficiently robust one becomes available in the future) clearly linked to a transparent wholesale market index that suppliers have no direct influence over; and
Ensuring that all tariffs offered by a supplier are available for all payment methods with suppliers able to levy surcharges for non-direct debit customers (as set out in our unit pricing recommendation);
Ensuring that all tariffs are available through all sales channels and that consumers are clearly informed about the features of tariffs, including exit fees.
There are a number of advantages to limiting suppliers to one standard variable rate (SVR) tariff per fuel and requiring that all other offers are fixed term and fixed-price or independent market ‘tracker’ tariffs. Most importantly, it would ensure that competition for all consumers who do not want to lock themselves in to a fixed-price contract (which may have an early exit penalty) or be on a tracker product that exposes them to potentially volatile short-term wholesale market movements would be focused on just one tariff. As with Ofgem’s Retail Market Review proposals, ‘dead’ tariffs (open-ended contracts that are closed to new customers and may be uncompetitive) would also be eradicated as a result of this measure.
Our unit pricing recommendation would ensure that consumers could easily compare the price of SVR tariffs from all suppliers, bringing greater competition to this part of the market. Our recommendation that the payment methods other than direct debit should be treated as
Recommendation 2transparent surcharges on top of the direct debit price and that discounts for online and dual fuel options (the other key ‘dimensions’ of an energy tariff) are also applied as a universal amount across all of a supplier’s tariffs will prevent suppliers from segmenting their SVR customer base. This should mean that any price cut to the SVR tariff, for example to acquire new customers, would also be passed on to existing customers.
A single SVR tariff per supplier is also an essential feature of a market where suppliers offer fixed-term tariffs, as it provides a clear ‘default’ for consumers who have come to the end of a fixed-term contract and have not sought a further fixed-term offer.
These proposals should also curtail the regressive practice of offering only the cheapest tariffs to direct debit customers and/or customers who manage their accounts online. As set out in Chapter 4, using direct debit to pay bills and the internet to manage accounts are not typically characteristics of low-income consumers, a significant proportion of whom will be vulnerable. Social inequalities mean that consumers do not always have a free choice between payment and account management methods. However, Which? understands that the price of the energy supplied is largely determined by the cost of wholesale energy. We do not therefore believe that that part of the cost should be affected by payment or account management method. As such, these ‘service costs’ should be treated as additional costs of lesser or greater amounts on top of the wholesale cost. If suppliers have procured energy at a competitive rate, then this benefit should be available to all customers, with the difference in the total price paid by those with lower cost payment methods and those with higher cost payment methods reflecting only the actual cost difference between serving those customers.
In our view, this ‘rules based’ approach should address the problems of disengagement and segmentation. As a result, Ofgem’s proposal to cap the number of tariffs may not be necessary. The ‘rules based’ approach should overcome the consumer engagement hurdles that Ofgem’s cap was aiming to address.
In addition, with the ability to offer discounts for online account management and dual fuel, we see no reason why suppliers would need to offer more than one SVR tariff per fuel. However, if suppliers wished to offer more than three fixed-term tariffs they could; our proposals for the treatment of discounts would ensure that differentiation between those tariffs would be meaningful and not simply a strategy to segment the market. Finally, we do not believe these proposals will prevent suppliers from offering energy-related ‘add-ons’, such as loyalty points, central heating servicing or remote heating controls.
139 Based on Ofgem’s 2011 typical domestic energy consumption figures for low, medium and high users, Which? examined the average % price rise in annual bills across regions on Standard tariffs for gas, electricity and dual fuel (weighted to take into account the composition of gas and electricity) by payment method. This included a break down of fixed charges, unit prices and an assessment of changes to different tiers. 140 In September 2013 the Payments Council will launch a new switching service, this will include a seven day switch and hassle free service to transfer over all the payments that go through the current accounts. ‘One year to go: New faster, easier account switching to be ready for customers in September 2013’, Payments Council press release, 28th September 2012.
Chapter 5 Conclusions and recommendations

0545The imbalance of power The retail market
Ofgem to review the case for national pricing
Recommendation 3
Switching must be improved
Switching sitesUnit pricing need not spell the end for switching sites. Even if Ofgem limits tariffs to four per supplier, there could still be more than 50 to compare within a region or nationally if national pricing were introduced. In addition smart tariffs are likely to facilitate the development of more complex products, including time-of-use tariffs with multiple unit rates. We see it as inevitable that price comparison tools will be needed to match consumption patterns with tariffs that are priced according to when consumers use energy.
We therefore believe that switching sites can provide a useful service to consumers in future. However, there are a number of issues that must be resolved now:
The calculators used by switching services should take seasonality of household consumption into account in order to give consumers who enter quarterly data a more accurate impression of the price of a tariff;
Price changes should not be applied to the cost of consumers’ current usage before the date of the price change;
To enable exit fees to be incorporated into the calculations, suppliers should be required to use only exit fees that expire on a set date for everyone;
Recommendation 4
To reduce errors and hassle, energy suppliers should also implement ‘no bill switch’ technology to provide key tariff and consumption data direct to switching sites;
The results pages should display the cheapest prices for gas and electricity overall (ie the default should not be for dual fuel offers which may not offer the best value as a cheaper tariff for one or both of the fuels could be found from separate suppliers), and also ensure that exit fees and tariff types (e.g. fixed, tracker, green etc) are clearly displayed;
Ofgem should also consider requiring suppliers to put information on customers’ energy bills to inform them of where they can go to compare energy prices. Any service promoted on bills should be independent of suppliers, offer both telephone and online access and allow consumers to switch directly to any tariff on the market.
It is worth noting that individual switching sites should be able to implement the first, second and fifth changes but doing so would put them in breach of the Consumer Focus Code of Confidence, with suppliers then potentially withholding tariff data.
Switching processRegarding the switching process, we believe that a combination of the Retail Market Review proposals and our own tariff proposals will improve this major barrier to effective competition in a number of ways. First, Ofgem’s proposal to ban automatic rollovers to fixed term contracts will ensure that consumers are not locked into potentially uncompetitive contracts without their consent, while our proposal for a single SVR tariff will ensure that there is a clear ‘default’ for consumers who have not sought a new fixed term offer or switched to another supplier.
Second, for those that want to move to a new fixed term offer or a different supplier, we support the introduction of a ‘switching window’ that would start several weeks before the end of every fixed term contract with no early exit fees to pay if the transfer goes through early. We also welcome the related proposal that will see consumers who initiate a switch within 20 days of their fixed term contract coming to an end continue to pay their fixed term prices until their switch has completed. Together these measures will reduce the number of people who are unnecessarily transferred to their supplier’s (usually expensive) default tariff during the switching process. They should also help limit the financial losses people may incur as a result of the overly long time it takes to switch.
To complement this, two further changes should be made to the switching process. First, the time it takes to switch should be reduced from around five weeks to three weeks, including any cooling off period. This would bring the process in to line with the expectations set out in the Third Energy Package. Not only would this improve the gains and feedback from switching, it would also bring the retail energy market in line with the current account market, where making a switch is a considerably more complicated undertaking.140 Second, suppliers should write to all new customers within three days of the consumer initiating a switch outlining the process, including when the rates will be switched from the old tariff to the new one.
National pricing has a nuber of attractions given its potential to drive competition by making prices more visible. Ofgem should undertake a review of the benefits of national pricing no later than Autumn 2013.
We believe that the issue of network costs as a factor in regional price differences could be addressed with minimum impact on consumers and network operators through the introduction of a ‘clearing house’ to standardise these costs – which, in any case, generally vary only by a couple of percent between the regions with the highest and lowest costs139 – across the country. This idea has already been suggested by EDF Energy in its response to the Retail Market Review.
The introduction of national pricing should be seen in conjunction with a package of additional measures, including clear and transparent pricing and enabling exisiting independent and new entrant suppliers to compete successfully in the retail market. As such, national pricing should be subjected to a full cost-benefit analysis that also considers the implications for competition, particularly in light of suppliers’ responses to earlier regulations banning price discrimination between regions.
Chapter 5 Conclusions and recommendations

46 The imbalance of power The retail market
Ensure that market conditions – in the retail and wholesale markets - enable new entrants to thrive The Retail Market Review proposals plus the Which? recommended measures should make it possible for consumers to easily compare prices, and will also limit the scope for suppliers to segment the market. We believe that these will address two of the key barriers to independent suppliers gaining market share from incumbents – disengagement and heavily-discounted tariffs that may be loss leaders. With prices more visible, consumers will be more aware of the prices offered by independents, and any opportunity for incumbents to use their sticky customers to cross-subsidise offers that independents find it difficult to compete against will be restricted.
However, while these measures should make the retail market a more attractive place, they are not sufficient to create the more level playing field that is required. There remain a number of structural issues in the wholesale market. Independents need to be able to purchase the volumes of energy required, manage near and longer-term price risks by having access to sufficiently liquid markets and be able to trust that the prices charged are robust and fair.141 Without this, they have little chance of being able to compete with the strength of incumbents, whose vertically integrated structures significantly reduce their exposure to these pressures. We will look at these issues closely in our forthcoming wholesale markets report.
Recommendation 5Ofgem’s proposals on communications, complaints and market monitoring should be implemented Which? supports Ofgem’s Retail Market Review proposals on supplier communications, the switching process and complaints reporting and believe they are entirely compatible with our own conclusions about the problems in the market. We set out below where we agree with Ofgem’s approach and how, in some areas, it could be strengthened further.
Recommendation 6
Supplier communicationsOfgem’s proposals to ensure consumers receive bills containing information that is easy to access and understand are welcome. Which? has been calling for a standardised summary box on bills since 2008142 and we are pleased that this is included. The decision to prescribe both the content and format of annual statements is a positive move, and that engagement with annual statements and consumers’ trust in the information they provide would be enhanced through Ofgem ‘co-branding’. Requiring suppliers to provide price information notices that clearly set out a personalised assessment of the impact of price changes, together with a prominent switching reminder, should improve the effectiveness of these essential communications.
Complaints reporting
Ofgem has also proposed that it will take on the complaints reporting function currently performed by Consumer Focus from 2013. This will bring the energy regulator into line with the FSA and Ofcom. Ofgem should use this opportunity to make significant improvements to the current arrangements in order to bring real benefits to consumers by driving improvements in supplier performance.
First, the exclusion of complaints made directly to suppliers (as opposed to Citizens Advice, the Consumer Focus Extra Help Unit and the Energy Ombudsman) from the Consumer Focus reporting model is unacceptable. These represent the vast majority of complaints in the sector and Ofgem should include these when it begins to publish complaints data.
141 Independents may also face credit and collateral requirements that may also present further barriers to market entry. 142 Which? Consultation Response to Ofgem’s Energy Supply Probe – Initial Findings, Which?, December 2008 143 Consumer complaints: The ombudsman award limit and changes to complaints-handling rules, Financial Ombudsman Service & Financial Services Authority, Consultation Paper 11/10, May 2011, p 18.
Chapter 5 Conclusions and recommendations

0547The balance of power The retail market
Second, Ofgem should also commit to systematic monitoring of complaints handling practices by conducting consumer research every year. Ofgem’s research so far has already revealed a number of basic customer service issues concerning the way complaints are handled that should be addressed by suppliers immediately. These include failing to call customers back when promised, failing to provide contact details and failing to ensure customers speak to someone who has the ability to make decisions there and then. Suppliers should also put in place processes to ensure consumers are genuinely satisfied with the outcome of their complaint by ensuring that, when consumers are given an explanation of the outcome, they are always asked explicitly if they are happy for their complaint to be closed.
Third, the FSA has recently determined that complaints processes with a number of stages are “inherently prone to misuse” because they place the onus on consumers to come back to firms if they are dissatisfied with the first response they receive, making it less likely that firms will investigate complaints properly.143 While the FSA has since abolished multiple-stage complaints processes, they remain in the energy sector and should be reviewed by Ofgem to assess whether they are being misused.
Finally, we also support Ofgem’s request that the Energy Ombudsman starts to publish information about complaints received and their outcome at a company level rather than just aggregated figures for the whole industry. This is another area where this sector has lagged behind other regulated markets.
Market monitoring
As set out at the beginning of this report, switching rates alone are a poor indicator of energy market competition. It is therefore positive that Ofgem has proposed a wider range of competition indicators covering market structure and prices, level of consumer engagement, level of competition, supplier conduct and information asymmetry. Together these should provide a richer and more meaningful picture of the functioning of the retail market.
However, Which? disagrees with Ofgem’s decision to set a deadline of 2017 to publish its next review of the market and the impact of remedies taken forward from the Retail Market Review. Instead, Ofgem should commit to publishing six-monthly updates on how the market is performing.
Government should reserve the right to introduce a fair price guarantee
Which? considers that the proposals set out above offer the best chance to make competition work effectively. Competition driven by engaged and well informed consumers is often the most effective mechanism to drive efficient prices and innovation.
However, if the proposals that we recommend in this report are introduced, and consumer outcomes have still not improved by 2015 then the wider structure of the market should be fully reviewed. This should include consideration of a fair price guarantee.
A fair price guarantee does not equate to a return to a full price cap model for all tariffs. There are energy markets such as in the State of Illinois and Northern Ireland market where both regulated and competitive tariffs exist. These hybrid models can enhance rather than hamper competition, while ensuring the interests of consumers are protected. The regulated tariff acts as a price to beat for competitors, delivering choice for those that want it while ensuring fair prices for those who do not engage.
The government has committed to amending the Energy Bill, due to be enacted in 2013, so that consumers are put on their supplier’s ‘lowest tariff’. This legislative opportunity should also be used to put in place back stop powers that would enable the regulator to introduce a fair price guarantee for the default open-ended variable rate tariff. By introducing these powers, the government would send a clear message that every effort must be made now to increase engagement and improve outcomes for consumers. If effective competition that delivers efficient energy prices and protects the welfare of consumers does not develop, then the government will have the necessary powers to intervene swiftly.
Recommendation 7
The Government, regulator, energy suppliers and consumer groups all recognise the problems that exist with our broken energy market. Concerted action is now needed to grasp the opportunity that exists to deliver far reaching reform. A genuinely competitive energy market with clear energy prices and simple tariffs is possible and must be delivered. Without this, consumers simply won’t believe that they are getting a fair deal.
Chapter 5 Conclusions and recommendations

Key contactsFor more information, please contact the Which? External A!airs team on 020 7770 7000 or email [email protected]