Embed Size (px)
Citation preview

Retail Market StudyVan Dorn & Landmark Mall Corridor
Prepared for:
City of Alexandria, Virginia
Prepared by:
Gibbs Planning Group, Inc.
July 17, 2008
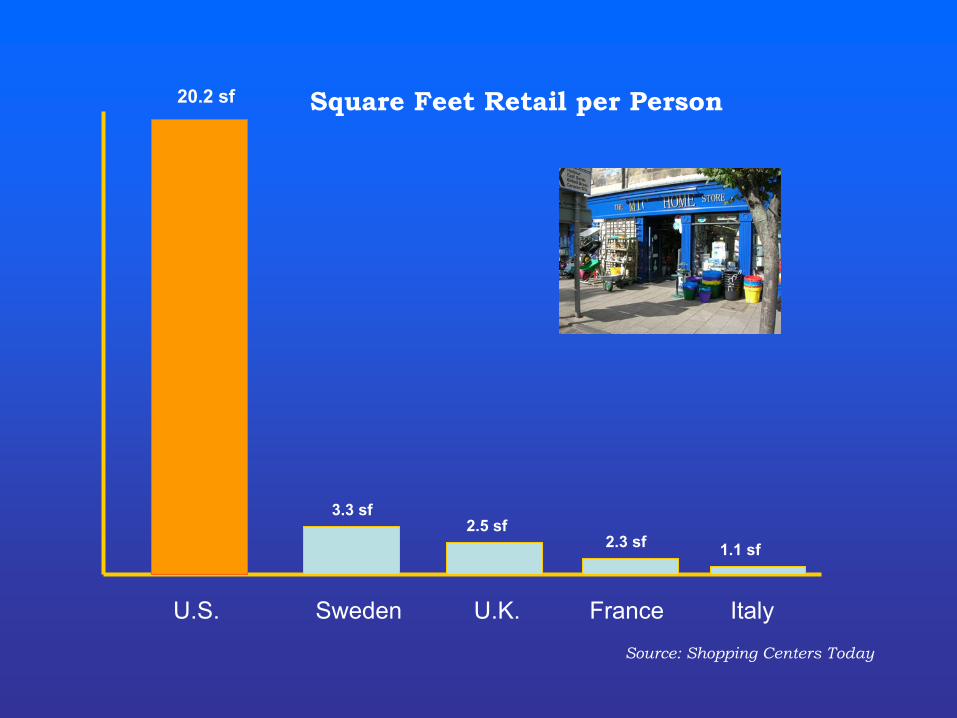
Source: Shopping Centers Today
Square Feet Retail per Person20.2 sf
U.S. Sweden U.K. France Italy
1.1 sf 2.3 sf
3.3 sf2.5 sf

Georgetown
Copyright Gibbs Planning Group, Inc. 2007

Source: Shopping Centers Today
Square Feet Retail per Person
20.2 sf
U.S. Sweden U.K. France Italy
1.1 sf 2.3 sf
3.3 sf2.5 sf
Washington DC Region 22.5 sf22.5 sf

Source: ICSC
5 Yr. Announced New Store Openings ( Number of Stores )
6300
Rite Aid CVS Family Dunkin Dollar Starbucks Subway Dollar Brands General
23,700
8200
6300
8100
15,000
5100

Source: ICSC
5 Yr. Announced Department Store Openings ( Number of Stores )
150
JC Penney Nordstorm’s Target Walmart Kohl’s
500410
157
300

32 % Housing
13% Food
18% Transportation
25% Other:Health, Pension, Insurance, Education
4% Apparel
5% Entertainment
Annual Expenditures Average U.S. Family 2006
Gibbs Planning GroupCopyright Gibbs Planning Group, Inc 2007
Gibbs Planning Group

Gibbs Planning Group
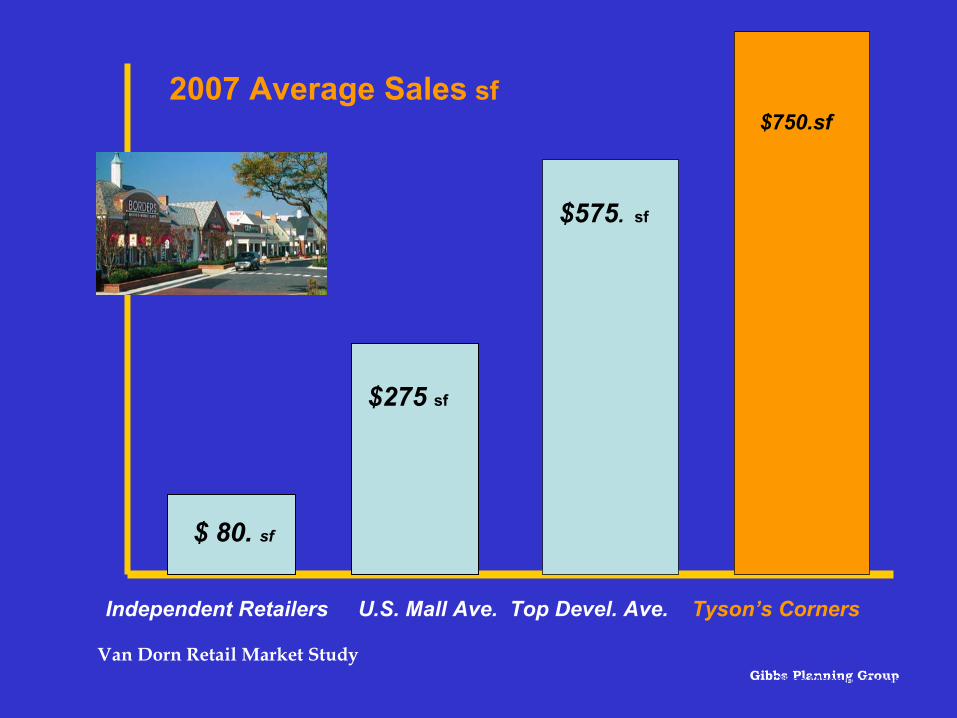
$575. sf
$275 sf
$ 80. sf
Independent Retailers U.S. Mall Ave. Top Devel. Ave. Tyson’s Corners
2007 Average Sales sf
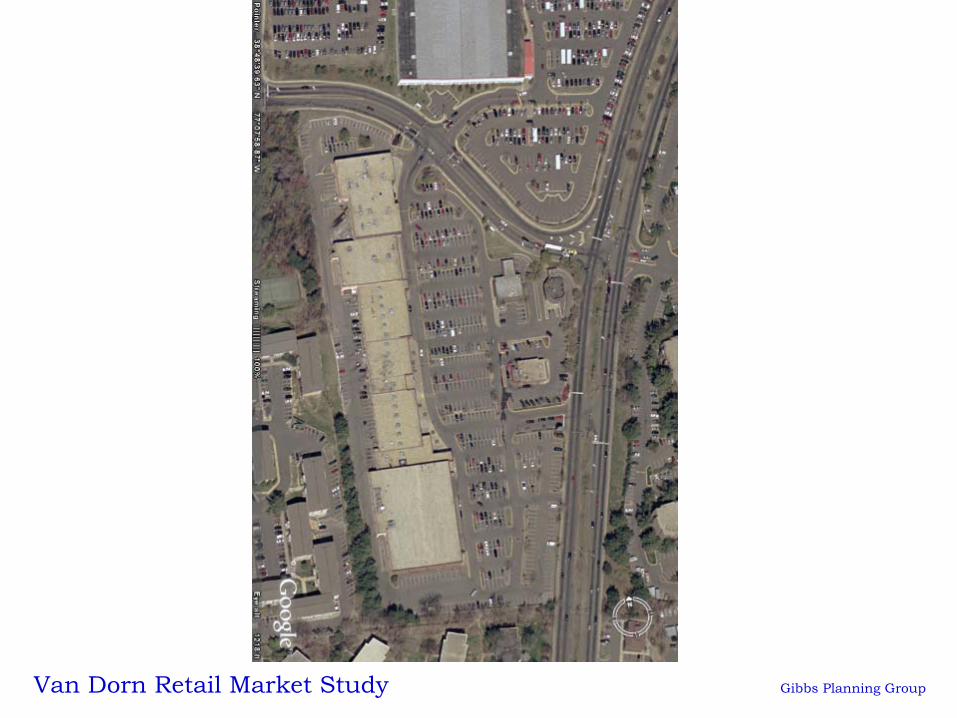
Van Dorn Retail Market StudyVan Dorn Retail Study Gibbs Planning Group
$750.sf
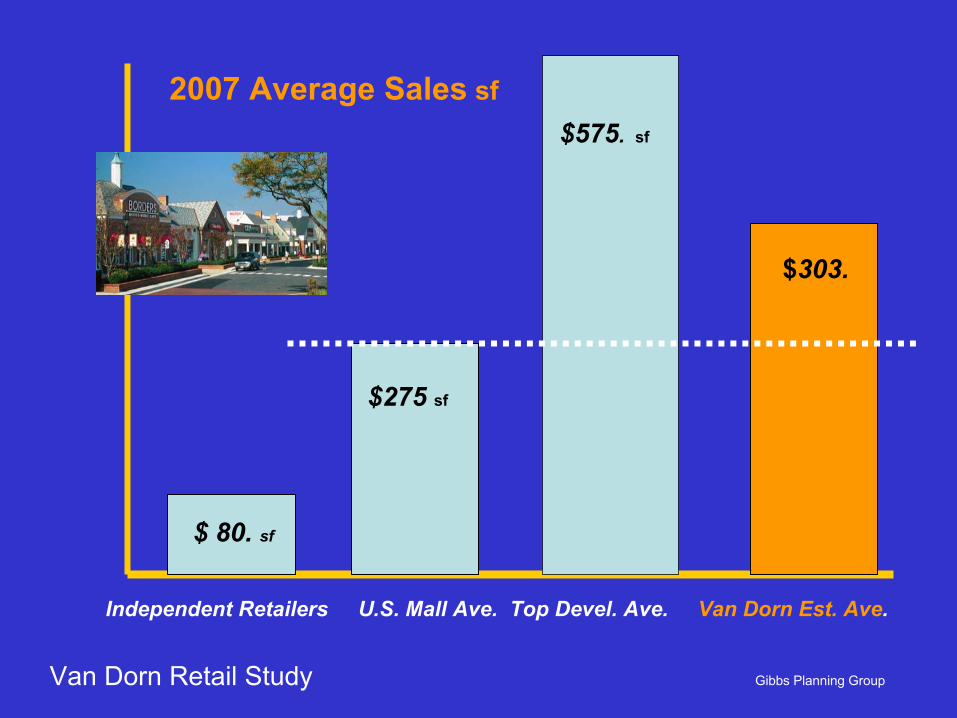
$575. sf
$275 sf
$ 80. sf
Independent Retailers U.S. Mall Ave. Top Devel. Ave. Van Dorn Est. Ave.
2007 Average Sales sf
$303.
Van Dorn Retail Study Gibbs Planning Group
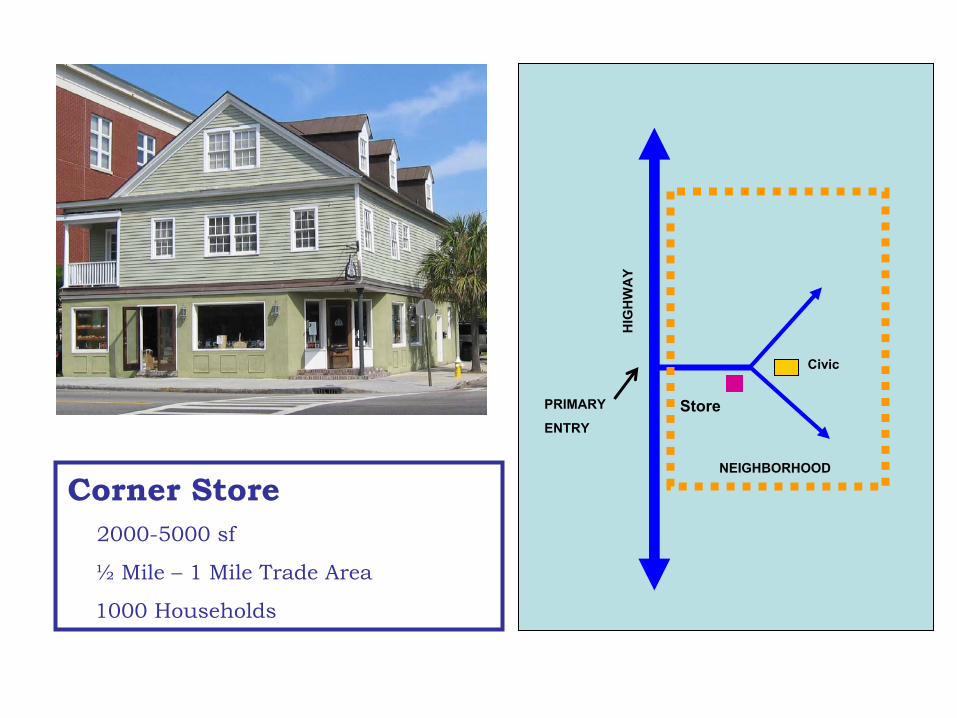
Corner Store2000-5000 sf
½ Mile – 1 Mile Trade Area
1000 Households
NEIGHBORHOOD
HIG
HW
AY
PRIMARY
ENTRY
Gibbs Planning Group
Store
Civic

Convenience Center
10,000-25,000 sf
1 Mile Trade Area
No Anchor
2500 HouseholdsBakery, Bank, Bike Shop, Carry-out Foods, Grocery, Hair Salons, Pharmacy, Wine-Liquor
Gibbs Planning Group Town
Country
NeighborhoodCenter
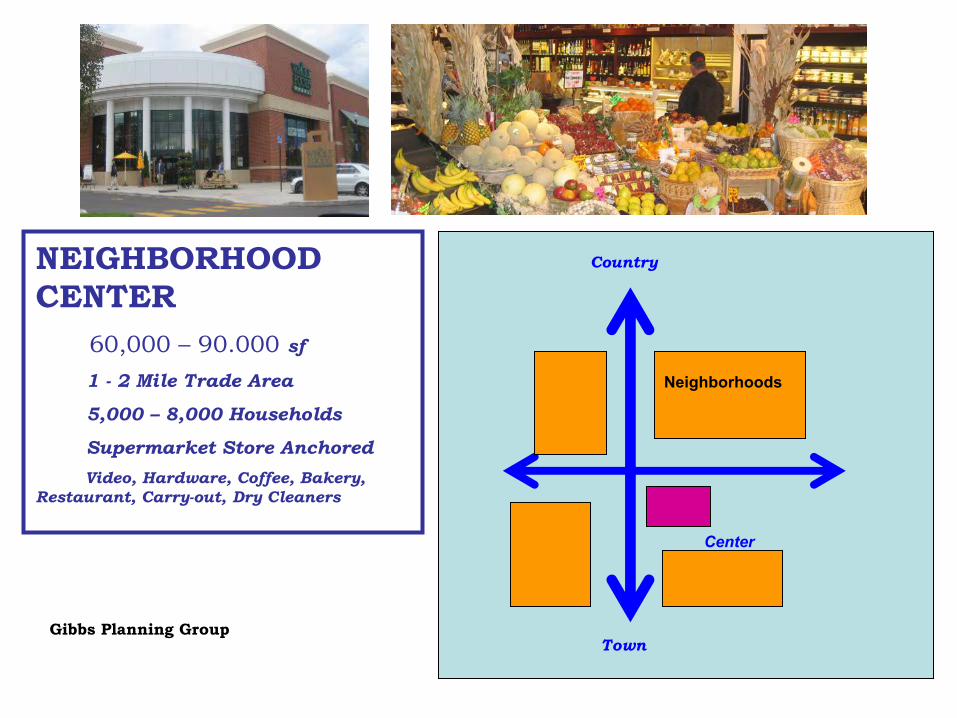
NEIGHBORHOOD CENTER
60,000 – 90.000 sf
1 - 2 Mile Trade Area
5,000 – 8,000 Households
Supermarket Store AnchoredVideo, Hardware, Coffee, Bakery,
Restaurant, Carry-out, Dry Cleaners
Gibbs Planning GroupTown
Country
Center
Neighborhoods

Gibbs Planning Group

COMMUNITY CENTER300,000 - 500,000 sf
5-7 Mile Trade Area
30,000-50,000 Households
Discount Dept. Store Anchored
Apparel, Crafts Books, Home Improvement, Office Supply, Restaurants, Pet Supply, Restaurants, Pet Supply, Sporting Goods.
Gibbs Planning Group
Town
Country
Center


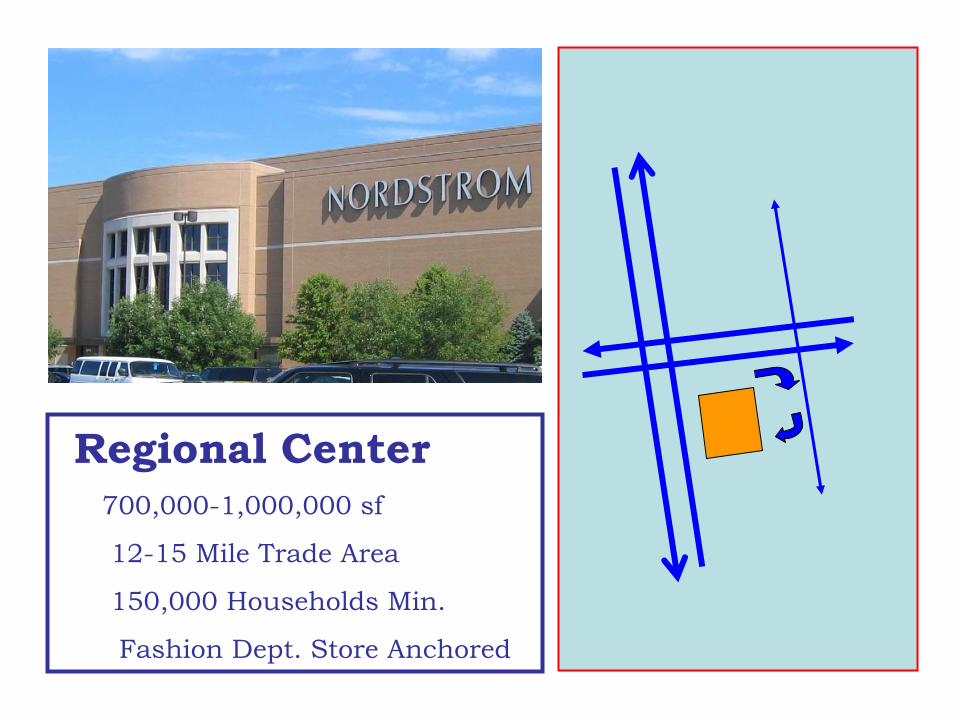
Regional Center700,000-1,000,000 sf
12-15 Mile Trade Area
150,000 Households Min.
Fashion Dept. Store Anchored


Gibbs Planning Group
Shops - GLA
Anchor
Anchor Wrap
Entry
Entry
Entry
GLA
Shops GLA
Street

Urban Anchor Stores Gibbs Planning Group

Portland
Charleston
Miami Beach

Lifestyle Center150,000-250,000 sf
8-12 Mile Trade Area
100,000 Households Min.
Fashion, Home, RestaurantsGibbs Planning Group

Gibbs Planning Group, Inc.
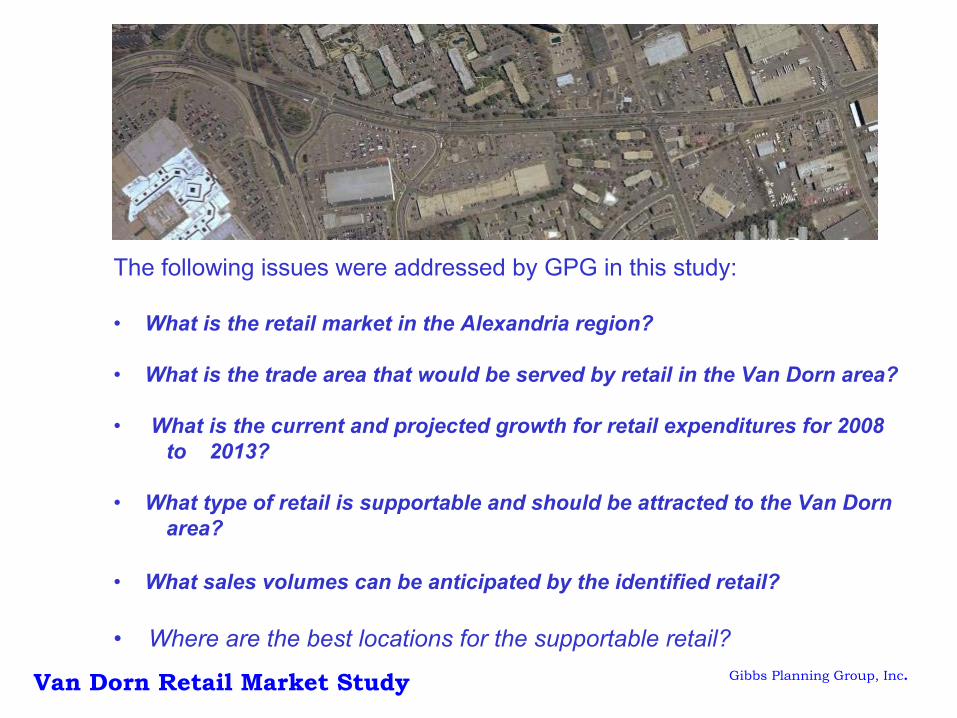
The following issues were addressed by GPG in this study:
• What is the retail market in the Alexandria region?
• What is the trade area that would be served by retail in the Van Dorn area?
• What is the current and projected growth for retail expenditures for 2008to 2013?
• What type of retail is supportable and should be attracted to the Van Dorn area?
• What sales volumes can be anticipated by the identified retail?
• Where are the best locations for the supportable retail?
Van Dorn Retail Market Study


Gibbs Planning Group, Inc.
Washington DC Suburban Office Market Conditions 2007
• 252.7 Million sf Inventory
• 9.96 % Vacancy Rate (13.5% Nat. Ave)
• 25.2 Million sf Vacancy
• 6.7 Million sf Ave. Annual Net Absorp. (2003-2006)
• 90 Million sf Total Under Construction (2007-2010)
• 4.2 Million sf Forecast Ave. Annual Net Absorp. (2007-2009)
Source: Integra Realty Resources

Gibbs Planning Group, Inc.
Wash. DC Region Retail Market Conditions 2007
• 109.7 Million sf Inventory
• 3.1 % Vacancy Rate (7.4% Nat. Ave)
• 3.4 Million sf Vacancy
• 6.0 % Average Mall Vacancy
• 770,700 sf Ave. Annual Absorp. (2003-2006)
• 596,300 sf Forecast Ave. Annual Net Absorp (2007-2010)
• 7.6 Million sf Total Under Construction (2007-2010)
• $ 16,800. Sales per Household
• 22.5 sf Retail per Capita (20.11 Nat. Ave)
Source: Integra Realty Resources

Van Dorn Competitive Regional Shopping Centers or Districts

Van Dorn Retail Market Study: Discount Dept. Stores Gibbs Planning Group

Van Dorn Retail Market Study: Discount Dept. Stores Gibbs Planning Group

Van Dorn Retail Market Study : Regional Shopping Centers Gibbs Planning Group

Van Dorn Retail Market Study : Estimated Total Trade Area Gibbs Planning Group

Van Dorn Retail Trade Area: Ave. Household Incomes – 2004 Gibbs Planning Group

Van Dorn Retail Trade Area: Ave. Household Incomes – 2004 Gibbs Planning Group
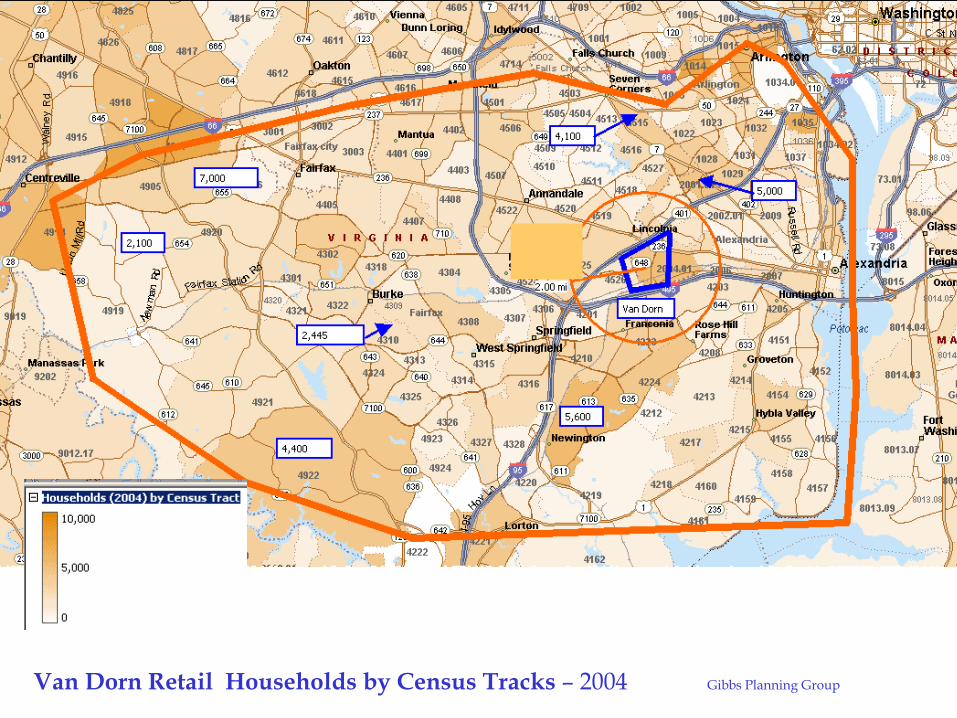
Van Dorn Retail Households by Census Tracks – 2004 Gibbs Planning Group

Van Dorn Retail Households by Census Tracks – 2004 Gibbs Planning Group

Households That Made Purchases at a Department, Toy, Clothing Store During a 3 Month Period in 2003

Gibbs Planning GroupU.S. Median Household Incomes (2006)
Black Hispanic White Asian All
$30,000.
$35,000.
$40,000.
$53k
$46
$45,000.
$33k
$29k
$44k
Poverty Line $19,000
Gibbs Planning Group
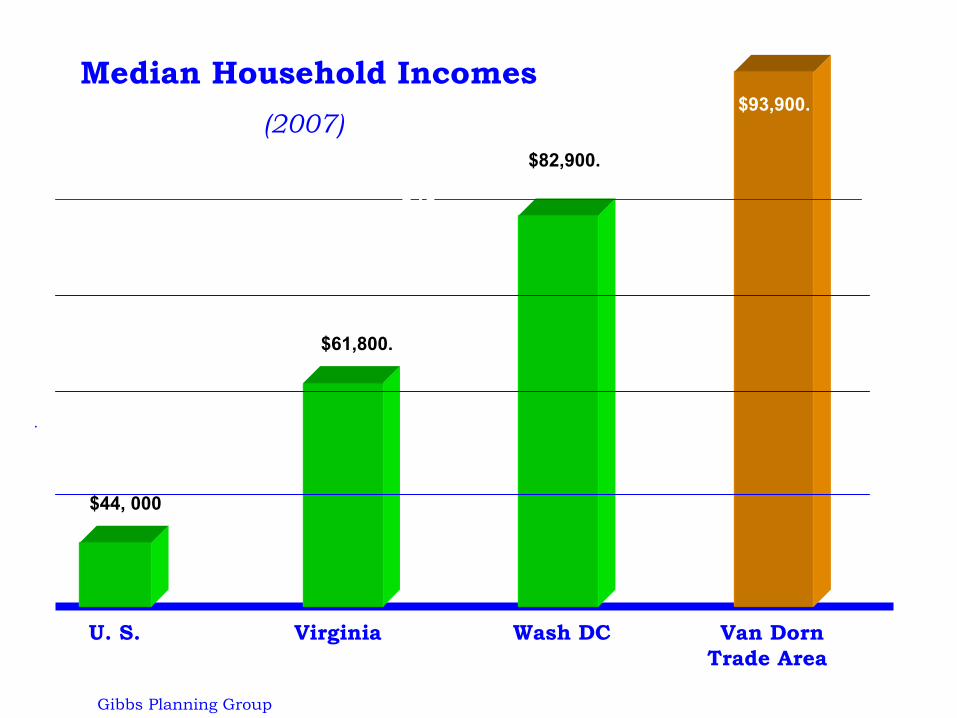
Median Household Incomes(2007)
U. S. Virginia Wash DC Van Dorn Trade Area
.
$53k
$46
$33k$29k
$93,900.
$82,900.
$61,800.
$44, 000

Van Dorn Retail Market Study: Demographics Gibbs Planning Group
63.9%73.6%74.2%% White-Collar Employed
37.636.637.7Median Age
4.7%12.1%19.8%% Hispanic Ethnicity
72.3%56.3%58.4%% White
39.5%56.3%63.6%% Households with incomes $75,000 or higher
$31,784$41,304$45,3152008 Per Capita Income
$61,817$82,846$93,8642008 Median Household Income
2.532.632.58Persons Per Household 2008
1.43%1.64%0.70%2008-2013 Projected Growth
8,480,9805,932,704849,1472013 Population
7,899,2055,469,330820,2242008 Population
VirginiaWashington D.C.TradeAreaCharacteristics

Van Dorn Retail Market Study Gibbs Planning Group
Enterprising Professionals
120,573 Population14.7% of Trade Area$71,018 Median HH Income
This fast-growing market is home to young, educated, working professionals, with a median age of 32.4 years. Single or married, they prefer newer neighborhoods with town homes or apartments. The median household income is $71,018.
This segment is ranked second of all the Community Tapestry markets for labor force participation, at 75 percent. Their lifestyle reflects their youth, mobility, and growing consumer clout.
Residents rely on cell phones and PCs to stay in touch. They use the Internet to find their next job or home, track their investments, and shop. They own the latest electronic gadgets. Leisure activities include yoga, playing Frisbee and football, jogging, going to the movies, and attending horse races and basketball games. These residents also travel frequently, both domestically and overseas.
Van Dorn Retail Market Study Gibbs Planning Group
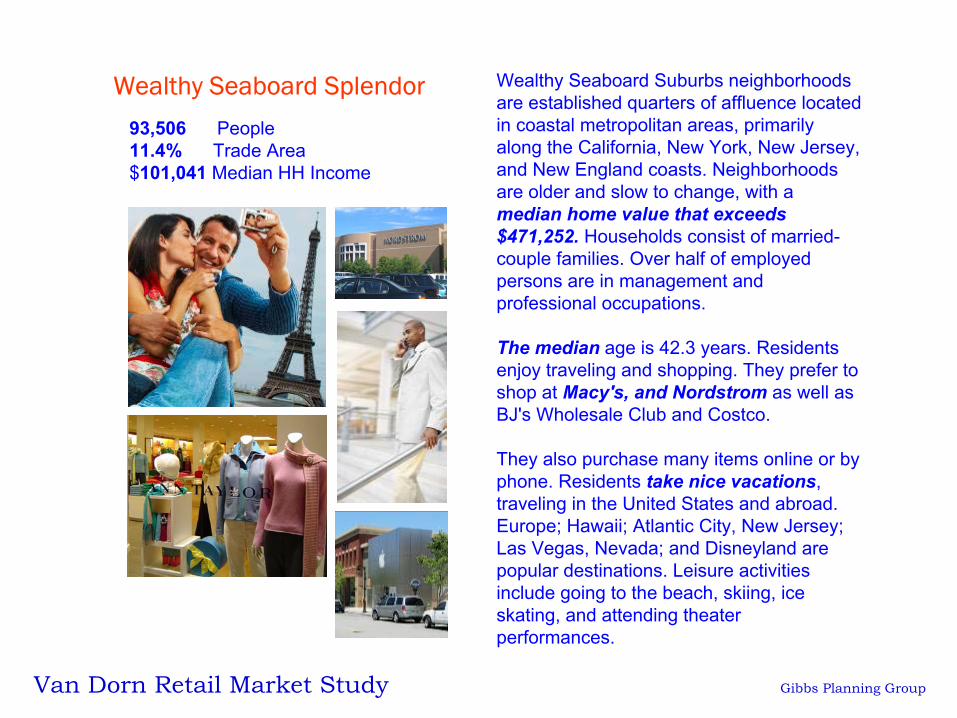
Wealthy Seaboard Splendor Wealthy Seaboard Suburbs neighborhoods are established quarters of affluence located in coastal metropolitan areas, primarily along the California, New York, New Jersey, and New England coasts. Neighborhoods are older and slow to change, with a median home value that exceeds $471,252. Households consist of married-couple families. Over half of employed persons are in management and professional occupations.
The median age is 42.3 years. Residents enjoy traveling and shopping. They prefer to shop at Macy's, and Nordstrom as well as BJ's Wholesale Club and Costco.
They also purchase many items online or by phone. Residents take nice vacations, traveling in the United States and abroad. Europe; Hawaii; Atlantic City, New Jersey; Las Vegas, Nevada; and Disneyland are popular destinations. Leisure activities include going to the beach, skiing, ice skating, and attending theater performances.
93,506 People11.4% Trade Area$101,041 Median HH Income
Van Dorn Retail Market Study Gibbs Planning Group
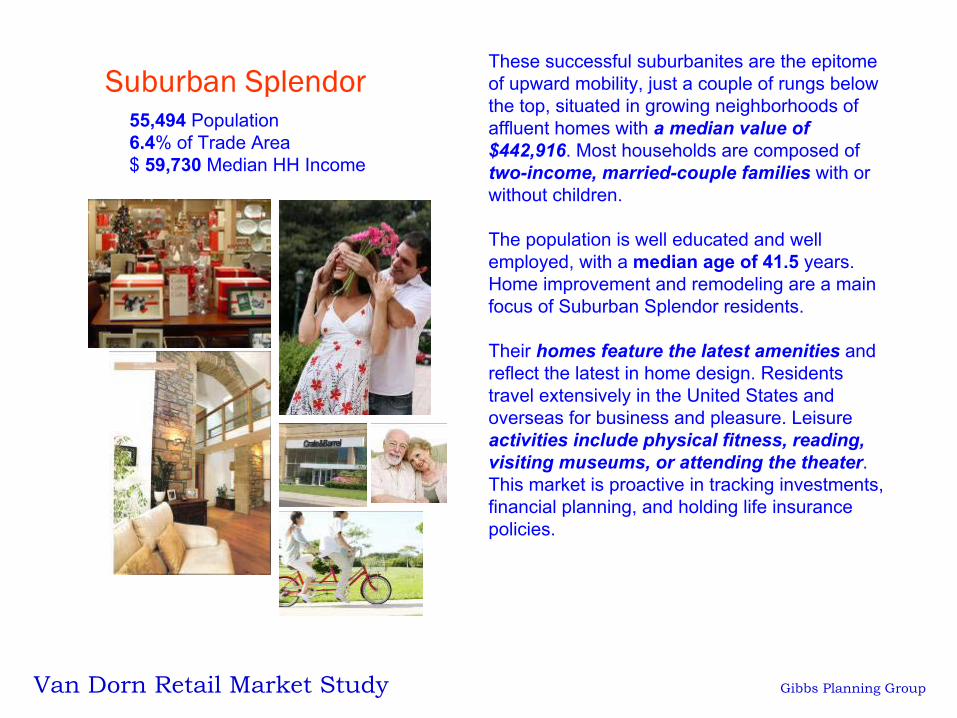
Suburban SplendorThese successful suburbanites are the epitome of upward mobility, just a couple of rungs below the top, situated in growing neighborhoods of affluent homes with a median value of $442,916. Most households are composed of two-income, married-couple families with or without children.
The population is well educated and well employed, with a median age of 41.5 years. Home improvement and remodeling are a main focus of Suburban Splendor residents.
Their homes feature the latest amenities and reflect the latest in home design. Residents travel extensively in the United States and overseas for business and pleasure. Leisure activities include physical fitness, reading, visiting museums, or attending the theater. This market is proactive in tracking investments, financial planning, and holding life insurance policies.
55,494 Population6.4% of Trade Area$ 59,730 Median HH Income

Van Dorn Retail Market Study Gibbs Planning Group
Metro Renters55,494 Population6.4% of Trade Area $59,730 Median HH Income
Metro Renters residents are young (approximately 30 percent are in their 20s), well-educated singles beginning their professional careers in some of the largest U.S. cities such as New York City, Chicago, and Los Angeles. The median age is 33.8 years; the median household income is $59,730.
As the name Metro Renters implies, most residents are renting apartments in high-rise buildings, living alone or with a roommate. Their interests include traveling, reading two or more daily newspapers, listening to classical music and public radio programs, and surfing the Internet.
For exercise, they work out regularly at clubs, play tennis and volleyball, practice yoga, ski, and jog. They enjoy dancing, attending rock concerts, going to museums or the movies, and throwing a Frisbee. Painting and drawing are favorite hobbies. Politically, this market is liberal.

Van Dorn Retail Market Study Gibbs Planning Group
In Style In Style residents live in affluent neighborhoods of metropolitan areas. More suburban than urban, they nevertheless embrace an urban lifestyle. Townhome ownership is more than double that of the national level; however, more than half of the households are traditional single-family homes.
Labor force participation is high, and professional couples predominate. The median household income is $72,326. Nearly one-third of these households include children. The median age is 40.3 years. In Style residents are computer savvy; they use the Internet daily to research information, track investments, or shop.
They own a diverse investment portfolio, contribute to retirement savings plans, and hold long-term care and life insurance policies. They enjoy going to the beach, snorkeling, playing golf, casino gambling, and domestic travel.
52,494 Population6.4% of Trade Area $72,326 Median HH Income

Van Dorn Retail Market Study Gibbs Planning Group
Tapestry Lifestyles Segmentation
Enterprising Professionals
Wealthy Seaboard Suburbs
Suburban Splendor
Metro RentersIn Style
Connoisseurs
International
Marketplace
Sophisticated Squires
Pleasant-Ville
Young and Restless
Other Categories
14.7 %
11.4 %
9.1 %
6.4 % 6.4 %

Gibbs Planning Group
Supportable Retail Development 2008 - 2013Van Dorn Study Area, Alexandria, Va
Business Type New Supportable Size Number of Stores Annual Sales
Apparel & Shoes 100,700 sf 20-30 stores $31.5 million
Bldg. Improvement 74,100 sf 2 – 3 stores $13 million
Discount Dept. Stores 120,000 sf 1 - 2 stores $23.6 million
Drug Stores 45,700 sf 4-5 stores $23.6 million
Electronics 26,500 sf 3 - 4 stores $12.7 million
Home Furnishings 50,400 sf 6 - 10 stores $13.3 million
Personal Services 29,500 sf 10 – 15 stores $9.8 million
Restaurants 108,700 sf 25 – 35 restaurants $34.8 million
Sporting Goods 23,000 sf 1 – 5 stores $6.1 million
Supermarkets 111,500 sf 3 - 4 stores $50.4 million
Warehouse Clubs 207,200 sf 3 – 4 stores $62.6 million

Gibbs Planning Group
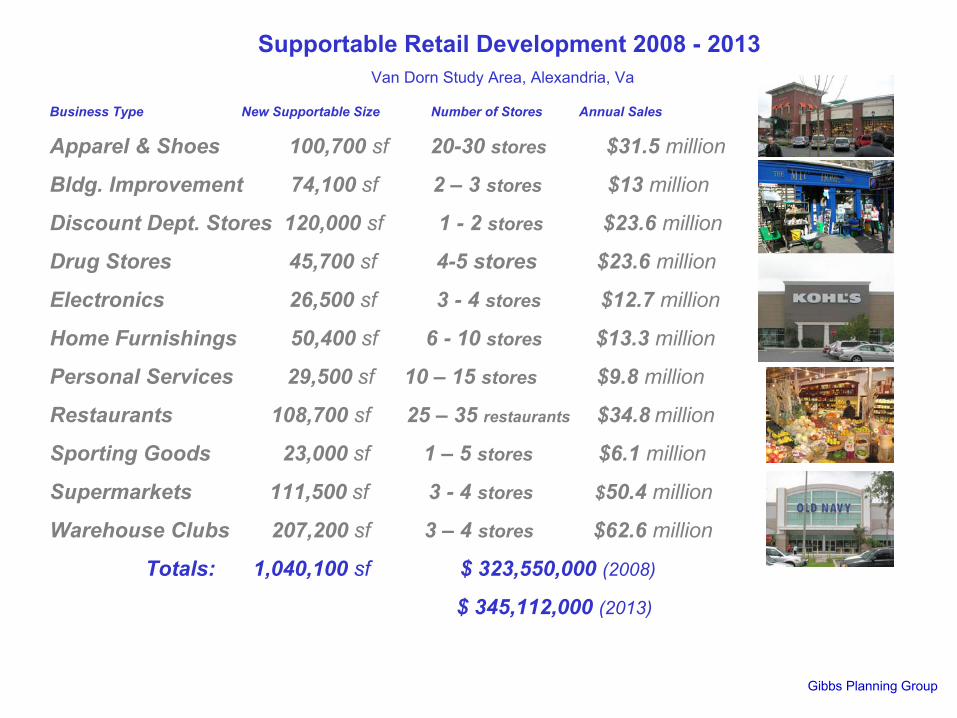
Supportable Retail Development 2008 - 2013Van Dorn Study Area, Alexandria, Va
Business Type New Supportable Size Number of Stores Annual Sales
Apparel & Shoes 100,700 sf 20-30 stores $31.5 million
Bldg. Improvement 74,100 sf 2 – 3 stores $13 million
Discount Dept. Stores 120,000 sf 1 - 2 stores $23.6 million
Drug Stores 45,700 sf 4-5 stores $23.6 million
Electronics 26,500 sf 3 - 4 stores $12.7 million
Home Furnishings 50,400 sf 6 - 10 stores $13.3 million
Personal Services 29,500 sf 10 – 15 stores $ 9.8 million
Restaurants 108,700 sf 25 – 35 restaurants $34.8 million
Sporting Goods 23,000 sf 1 – 5 stores $6.1 million
Supermarkets 111,500 sf 3 - 4 stores $50.4 million
Warehouse Clubs 207,200 sf 3 – 4 stores $62.6 million
Totals: 1,040,100 sf $ 323,550,000 (2008)

Gibbs Planning Group
Supportable Retail Development 2008 - 2013Van Dorn Study Area, Alexandria, Va
Business Type New Supportable Size Number of Stores Annual Sales
Apparel & Shoes 100,700 sf 20-30 stores $31.5 million
Bldg. Improvement 74,100 sf 2 – 3 stores $13 million
Discount Dept. Stores 120,000 sf 1 - 2 stores $23.6 million
Drug Stores 45,700 sf 4-5 stores $23.6 million
Electronics 26,500 sf 3 - 4 stores $12.7 million
Home Furnishings 50,400 sf 6 - 10 stores $13.3 million
Personal Services 29,500 sf 10 – 15 stores $9.8 million
Restaurants 108,700 sf 25 – 35 restaurants $34.8 million
Sporting Goods 23,000 sf 1 – 5 stores $6.1 million
Supermarkets 111,500 sf 3 - 4 stores $50.4 million
Warehouse Clubs 207,200 sf 3 – 4 stores $62.6 million
Totals: 1,040,100 sf $ 323,550,000 (2008)
$ 345,112,000 (2013)
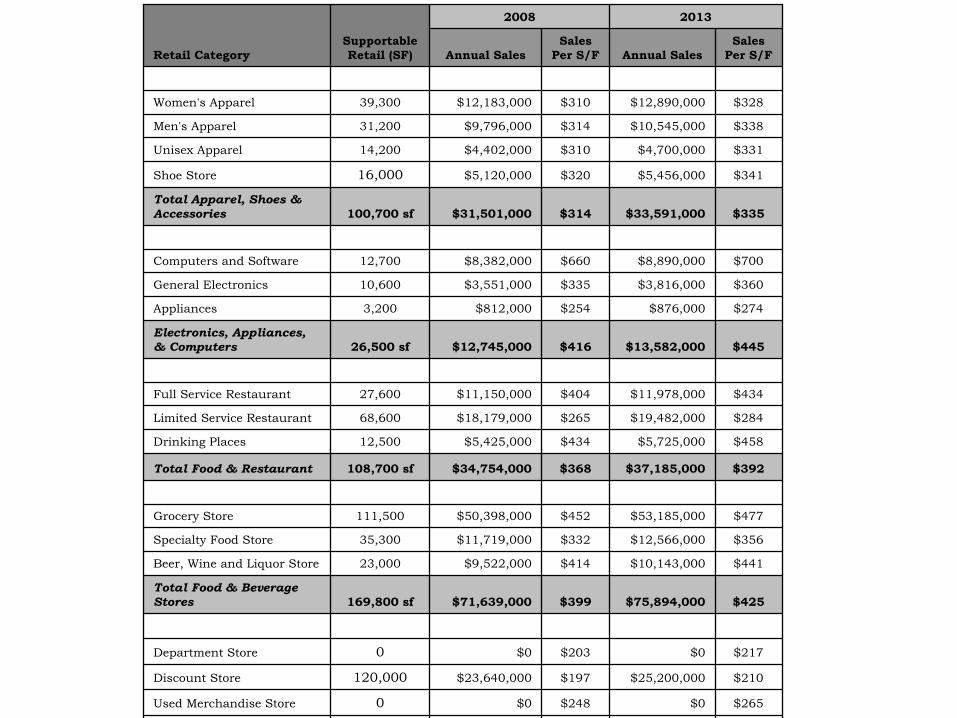
$265 $0 $248 $0 0Used Merchandise Store
$210 $25,200,000 $197 $23,640,000 120,000Discount Store
$217 $0 $203 $0 0Department Store
$425 $75,894,000$399 $71,639,000169,800 sfTotal Food & Beverage Stores
$441 $10,143,000 $414 $9,522,000 23,000Beer, Wine and Liquor Store
$356 $12,566,000 $332 $11,719,000 35,300Specialty Food Store
$477 $53,185,000 $452 $50,398,000 111,500Grocery Store
$392 $37,185,000$368 $34,754,000108,700 sfTotal Food & Restaurant
$458 $5,725,000 $434 $5,425,000 12,500Drinking Places
$284 $19,482,000 $265 $18,179,000 68,600Limited Service Restaurant
$434 $11,978,000 $404 $11,150,000 27,600Full Service Restaurant
$445 $13,582,000$416 $12,745,00026,500 sfElectronics, Appliances, & Computers
$274 $876,000 $254 $812,000 3,200Appliances
$360 $3,816,000 $335 $3,551,000 10,600General Electronics
$700 $8,890,000 $660 $8,382,000 12,700Computers and Software
$335 $33,591,000 $314 $31,501,000 100,700 sfTotal Apparel, Shoes & Accessories
$341 $5,456,000 $320 $5,120,000 16,000Shoe Store
$331 $4,700,000 $310 $4,402,000 14,200Unisex Apparel
$338 $10,545,000 $314 $9,796,000 31,200Men's Apparel
$328 $12,890,000 $310 $12,183,000 39,300Women's Apparel
Sales Per S/FAnnual Sales
Sales Per S/FAnnual Sales
20132008
Supportable Retail (SF)Retail Category

$324 $345,112,000 $303 $323,550,000 1,040,100 sfTotal Identified Retail Expenditure
$276 $7,455,000 $257 $6,950,000 28,600 sfTotal Miscellaneous Retailers
$235 $893,000 $220 $836,000 3,800Video/Entertainment
$386 $1,235,000 $362 $1,158,000 3,200Tobacco Shop
$242 $1,210,000 $228 $1,140,000 5,000Pet Supply Store
$268 $911,000 $252 $856,000 3,400Office Supplies, Stationary
$299 $956,000 $269 $860,000 3,200Florists
$225 $2,250,000 $210 $2,100,000 10,000Card/Gift Shop
$226 $11,108,000 $213 $10,461,000 44,100 sfSporting Goods, Hobby, Books, Music Stores
$186 $1,060,000 $175 $997,000 5,700Toy and Hobby Store
$282 $6,486,000 $266 $6,118,000 23,000Sporting Good Store
$159 $874,000 $150 $825,000 5,500Book & Music Stores
$228 $68,000 $216 $64,000 300Musical Instrument Store
$273 $2,620,000 $256 $2,457,000 9,600Art, Craft and Sewing Stores
$315 $2,530,000$297 $2,385,0007,500 sfTotal Jewelry, Luggage, and Leather Goods Stores
$242 $629,000 $226 $587,000 2,600Luggage & Leather Store
$388 $1,901,000 $367 $1,798,000 4,900Jewelry Store

Gibbs Planning Group
Van Dorn Additional Supportable Shopping Center Types
6 – 8 Corner Stores 1000 sf ¼ mile 1000 homes
3 – 5 Convenience Centers 25,000 sf 1 mile 1500 homes
2 – 3 Neighborhood Centers 80,000 sf 2-3 miles 8000 homes
2 – 3 Community Centers 300,000 sf 5-7 miles 30,000 homes
1 Lifestyle Center 200,000 sf 5-7 miles 100,000 homes
Number of Supportable Shopping Center Type Ave. Size of each Center Trade Radius Ave. No. of Homes Served per Center
Gibbs Planning Group

Brea Town Center, California Gibbs Planning Group

Winter Park, Town Center (Former Enclosed Mall) Gibbs Planning Group


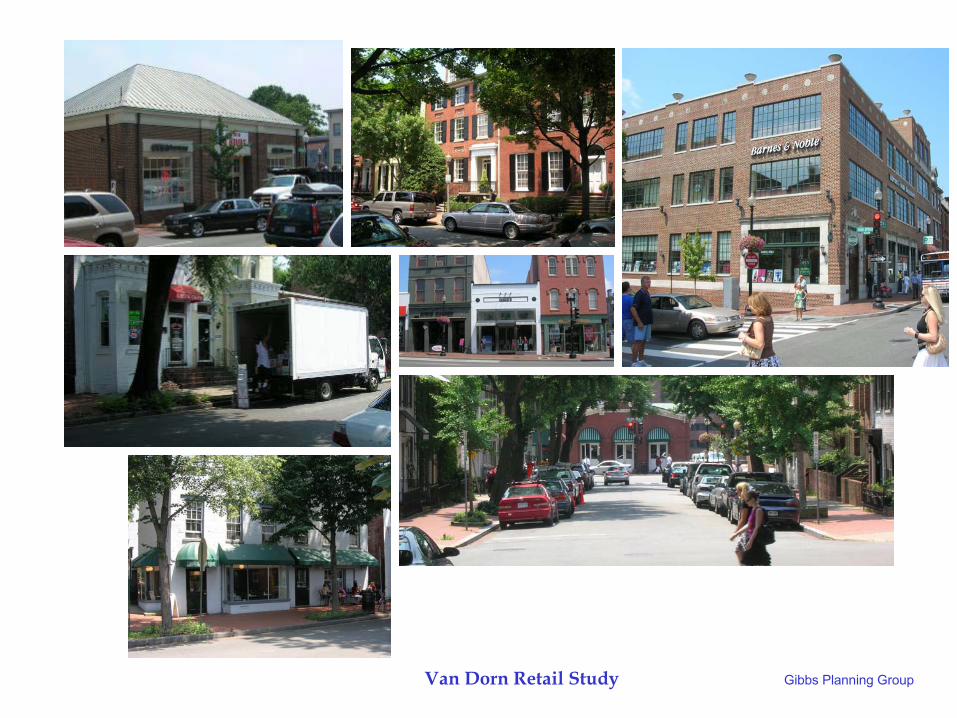
Van Dorn Retail Market Study Gibbs Planning Group


East Gate Mall Dover Kohl Partners


Van Dorn Retail Market Study Gibbs Planning Group

Study Assumptions:• No new shopping centers built within 5 miles of the subject site
• New Retail Centers will open with necessary critical mass & anchors.
• Economy will remain in normal ranges including: growth, employment & inflation
• Center will be planned, built and managed per the highest standards of:
The APA, AIA, CNU, ICSC & ULI
Van Dorn Retail Market Study Gibbs Planning Group

Van Dorn Retail Market Study Gibbs Planning Group
Van Dorn Retail Market Study Gibbs Planning Group
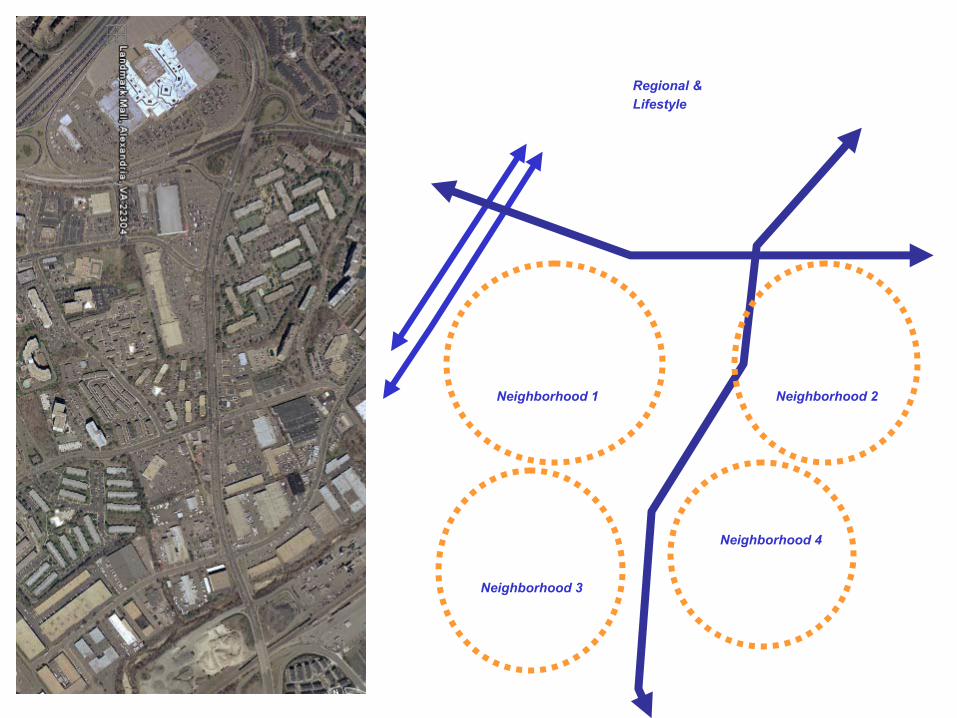
Regional & Lifestyle
Neighborhood 1 Neighborhood 2
Neighborhood 3
Neighborhood 4

Regional & Lifestyle
Neighborhood 2
Neighborhood 4
Neighborhood 1
Neighborhood 3
Traffic Calming Squares
Place Making Squares to Calm Traffic
Park Connections

Corner Store
Convenience Center
Neighborhood 1 Neighborhood 2
Neighborhood 3
Neighborhood 4
Corner Stores & Convenience Centers

Neighborhood Center
Community
Center A
Neighborhood Center
Community Center B
Corner Store
Convenience Center
Neighborhood 1 Neighborhood 2
Neighborhood 3
Neighborhood 4
Neighborhood & Community Centers

Neighborhood Center
Community
Center A
Neighborhood Center
Regional & Lifestyle
Community Center B
Corner Store
Convenience Center
Regional Center
Neighborhood 1 Neighborhood 2
Neighborhood 3
Neighborhood 4
Lifestyle & Regional CentersGibbs Planning Group
Gibbs Planning Group
Supportable Retail Development 2008 - 2013Van Dorn Study Area, Alexandria, Va
Business Type New Supportable Size Number of Stores Annual Sales
Apparel & Shoes 100,700 sf 20-30 stores $31.5 million
Bldg. Improvement 74,100 sf 2 – 3 stores $13 million
Discount Dept. Stores 120,000 sf 1 - 2 stores $23.6 million
Drug Stores 45,700 sf 4-5 stores $23.6 million
Electronics 26,500 sf 3 - 4 stores $12.7 million
Home Furnishings 50,400 sf 6 - 10 stores $13.3 million
Personal Services 29,500 sf 10 – 15 stores $9.8 million
Restaurants 108,700 sf 25 – 35 restaurants $34.8 million
Sporting Goods 23,000 sf 1 – 5 stores $6.1 million
Supermarkets 111,500 sf 3 - 4 stores $50.4 million
Warehouse Clubs 207,200 sf 3 – 4 stores $62.6 million
Totals: 1,040,100 sf $ 323,550,000 (2008)
$ 345,112,000 (2013)
Van Dorn Retail Study Gibbs Planning Group

Gibbs Planning Group
Van Dorn Additional Supportable Shopping Center Types
6 – 8 Corner Stores 1000 sf ¼ mile 1000 homes
3 – 5 Convenience Centers 25,000 sf 1 mile 1500 homes
2 – 3 Neighborhood Centers 80,000 sf 2-3 miles 8000 homes
2 – 3 Community Centers 300,000 sf 5-7 miles 30,000 homes
1 Lifestyle Center 200,000 sf 5-7 miles 100,000 homes
Number of Supportable Shopping Center Type Ave. Size of each Center Trade Radius Ave. No. of Homes Served per Center