Embed Size (px)
Citation preview
Retail Market Feasibility Study for Planned Retail Developments at Potomac Yard; Alexandria, Virginia RREEF, McCAFFERY INTERESTS, INC., AND MRP REALTY October 28, 2008
Potomac Yard Retail Market Analysis Page 1
04-12172 October 28, 2008
BACKGROUND AND OBJECTIVES The owners of existing and planned retail developments in the Potomac Yard Coordinated Development District (CDD) have retained RCLCO (Robert Charles Lesser & Co.) to conduct an independent third-party analysis of the market support for retail space contemplated for the Potomac Yard master-planned community. The purpose of this study is to assist the property owners and the City of Alexandria in confirming that the retail assumed for both the redeveloped Potomac Yard Retail Center and the planned Town Center can be supported by the future market demand, and that both centers are effectively differentiated so that they are complementary clusters of sustainable retail activity.
Background Potomac Yard is an urban, mixed-use, coordinated development with multiple owners. The Potomac Yard Retail Center was the first phase of Potomac Yard to be developed and has already become a thriving retail destination. The owners of the Potomac Yard Retail Center (RREEF) plan to redevelop their property (referred to as Land Bay F and the “Retail Center”) as an urban, transit-oriented development including retail, residential, office, and hotel uses. The intention is to create a mixed-use environment with a regional urban retail destination based on the Market Common brand developed by McCaffery Interests, with a focus on combining lifestyle retail with the existing base of big-and medium-box retail. Two adjacent land bays (referred to as Land Bays G and H/I and collectively as the “Town Center”) have Coordinated Development District Concept Plan approval (CDD 2008-0001) for mixed-use densities and the owner (MRP Realty) is working with the City on approval of Development Special Use Permits for the design of the Town Center. Approval of the first phase of the Town Center is expected in early 2009 with approval of the next phase following in 2009. The Town Center and the subsequent redevelopment of the Retail Center are intended to function as two distinct, but complementary districts. The City of Alexandria and the owners of the Retail Center and Town Center want both districts to thrive with successful retail contributing to the vitality of both locations. With this as background, the objectives of RCLCO’s involvement has been to conduct a retail market analysis in order to determine the depth of demand for retail space by merchandize category at the site under a build-out scenario. Key assumptions for this engagement have included the following:
• Retail demand must be supported by full build out of the planned projects.
Potomac Yard Retail Market Analysis Page 2
04-12172 October 28, 2008
• Buildout at the site is achieved in 2020.
• A new Potomac Yard Metrorail station will be operational at the Town Center under the buildout scenario.
Scope of Work The analytical tasks RCLCO undertook leading to the fulfillment of the above objectives included the following: A. Project Initiation
1. RCLCO participated in a kick-off meeting with City staff, property owners of Potomac Yard, and relevant project team members to obtain a debriefing about the project and any relevant information from prior work completed relative to the assignment, and to refine the goals and objectives of this analysis and scope of work to ensure that this engagement addressed the needs/desires of all interested parties.
B. Retail Market Analysis
1. RCLCO conducted a retail market analysis to determine the trade area and depth of demand for retail space, taking into account the planned residential, hotel and office development within the whole Potomac Yard CDD, and assuming that there will be a Metrorail station in this location.
a) RCLCO visited each of the subject properties and evaluated the development potential in light of each site’s location,
access, and visibility, current and/or proposed neighboring uses, topography, views, vegetation, other natural and/or man-made features, and other pertinent factors.
b) RCLCO obtained and analyzed secondary data relative to the historical and current performance of the relevant retail
market; and examined tenant types and mix, absorption, occupancy, rental rates and terms, and construction trends, as available, to gauge the health of the market.
Potomac Yard Retail Market Analysis Page 3
04-12172 October 28, 2008
2. RCLCO studied and compared competitive retail centers with Potomac Yard evaluating such metrics as vehicular accessibility, retail mix by merchandise category, trade area, and degree of success.
a) RCLCO compiled information on relevant existing retail developments in the competitive market area, relative to size,
quality, location, tenant types, lease rates, and trade area and market audiences served.
b) RCLCO conducted targeted interviews with brokers and managers representing comparable retail space in order to determine likely tenants and supportable rents for retail space, specific building requirements, and most likely range of store sizes that will be desirable.
c) RCLCO compiled and analyzed information on relevant planned and proposed retail properties in the competitive
market area, including location, size, configuration, construction timetable, anticipated tenant profiles, etc.; and assessed their potential influence on the subject property.
3. RCLCO used the market analysis to determine the total demand for retail space in Landbay G, Landbay H, and Landbay
F of Potomac Yard at buildout.
a) RCLCO compiled assumptions regarding the timing and amount of residential and commercial development planned for Potomac Yard from the owners and other knowledgeable sources as input into the demand analysis.
b) RCLCO compiled and analyzed relevant demographic and retail spending data for the trade area, forecast demand for
various retail categories in the trade area at buildout, and estimated the share of this demand that the project will be able to capture taking account of existing and planned competition.
The key findings and conclusions emanating from the scope of work outlined above are summarized in the Summary of Market Findings section of this report below.
Potomac Yard Retail Market Analysis Page 4
04-12172 October 28, 2008
SUMMARY OF MARKET FINDINGS Based upon an analysis of the economic and demographic underpinnings of demand for retail space, and an understanding of the current and likely future supply and character of space in the competitive market area of the Potomac Yard site, by 2020 there is sufficient market support for a significant retail concentration above and beyond what is currently being offered at the existing Potomac Yard Retail Center. The existing retail center on the site consists of approximately 590,000 square feet of retail space, with a concentration of big and medium box retail tenants, including a Target, Best Buy, Barnes & Noble, Petsmart, Staples Regal Cinemas, and Shoppers Food Warehouse grocery store. Our demand analysis has found support for significantly more retail space in a variety of retail categories by 2020:
• Approximately 495,000 square feet of Major Comparison Retailers in retail categories such as department and general merchandise stores, electronics stores, home furnishing Stores, and book stores. These types of big and medium box stores are that are currently in the existing retail center, although the physical form of these types of retailers need not be the same. These types of tenants are key anchors of a retail center serving a broader community, as they draw in demand from a wide geographic market area and in turn create consumer traffic that helps support other retailers.
• Approximately 230,000 square feet of In-line Comparison Retailers. These are the types of smaller tenants who typically
fill in the spaces between the larger anchor tenants. These tenants sell hard and soft comparison goods such as apparel and apparel accessories, jewelry, home goods and furniture, books and music, electronics, and other specialty goods.
• Approximately 325,000 square feet of Neighborhood Retailers. These include the wide variety of retailers serving
consumers everyday needs, most notably grocery stores, pharmacies, and other convenience and sundry retailers. Specifically, we have found support for approximately 175,000 square feet of grocery stores, which equates to three to four grocery stores of varying sizes and formats.
• Approximately 220,000 square feet of Food and Beverage, which includes full-service, sit-down restaurants (115,000
square feet); limited-service, take-out, fast-food, and fast-casual restaurants (90,000 square feet); and bars and clubs (15,000 square feet).
These demand projections support the conceptual programs for both the planned Town Center (Landbay G, Landbay H, and the northern portion of Landbay I) and the redeveloped Retail Center (Landbay F, where the existing Potomac Yard Retail Center now sits) as contemplated at build out in 2020. This includes support from current and future projected households and workers in defined market areas, as well as future residents and workers on the fully developed sites. Together, the two centers will
Potomac Yard Retail Market Analysis Page 5
04-12172 October 28, 2008
create a powerful and compelling retail and entertainment destination for both local and regional retail patrons. The two retail clusters will be competitive in many ways, but will compliment each other, and help drive more total traffic than each could do independently. They will also be significantly differentiated in the marketplace: the Retail Center combining big tenant, lifestyle and entertainment, and neighborhood-serving retail concepts into a regional-serving retail destination, with the Town Center focused more on the lifestyle and neighborhood retail concepts and serving more local residents and workers. Given the relative scarcity of retail offerings in this market area, and the future projected growth in the defined trade areas and on the site, multiple retail clusters serving similar but still distinct retail segments, are clearly supportable. Specifically, the market support for this significant retail concentration in two distinct but complimentary retail districts is justified by a number of locational, supply, and demand market findings:
• The Potomac Yard site is a large-scale, infill redevelopment opportunity that is unique within the regional context and can truly deliver a vibrant, mixed-use environment.
• The site is particularly well suited for the development of a mix of retail development concepts, given its superior access
and visibility, and its proximity to significant concentrations of current and future high median household incomes and quality office space.
• The site is already established as a thriving big box and entertainment retail destination that effectively competes in a
relatively large trade area, and future retail uses and types – specifically the incorporation of a lifestyle and restaurant component --- will be able to leverage this existing market momentum with both consumers and retailers.
• The addition of a broader mix of retail uses on the site – specifically a lifestyle component that offers a broader range of
in-line comparison retail tenants and restaurants – is the natural evolution of the existing retail destination and the currently planned town center for Landbay G.
• Upgraded neighborhood-serving retail space is needed in the market, both to capture current pent-up demand and future
demand growth, but also to replace existing but aging neighborhood retail options – specifically new and varied grocery store and specialty foods options.
• Future urban development at the site will demand, and drive, significant retail offerings, but is not a necessary component
to support a successful increase in retail at the site.
Potomac Yard Retail Market Analysis Page 6
04-12172 October 28, 2008
• The arrival of a Metrorail station adjacent to Landbay G will provide an additional catalyst for an urban, mixed-use development at the site.
• The retail projects at the site will fill a significant hole in the retail market, specifically the lack of new, larger-scale, urban
retail offerings in Alexandria and the surrounding areas. It could be unique for an urban site to offer popular retail anchors such as Target and Best Buy mixed in with a lifestyle retail concept. This unique concept will help the site draw from a broader area than just a smaller lifestyle retail cluster, and will also help the draw of the larger anchor tenants, as some share of consumers from the broader market area will drive by a closer store in order to shop at the same store in a more vibrant, pedestrian-oriented, active, mixed-use core with a wider variety of retail options.
• Future competitive market pressures, especially the continuing advancement of retail offerings in Arlington, the District of
Columbia, and Prince George’s County, as well as emerging urban cores in Alexandria, will present a limiting factor on the supportable size of the retail presence at Potomac Yard.
• However, the Potomac Yard site will continue to have strong access to a large concentration of under-served households
and employees in eastern Alexandria, and the ability to offer retail at the assumed scale will continue to be a unique competitive attribute in the surrounding urban markets, which will fully support the depth of retail currently assumed.
• Future on-site residents and workers will drive further demand, but by 2020 only accounts for approximately 15% of
projected demand.
• The planned retail development at Potomac Yard will allow the City of Alexandria to compete more effectively with neighboring jurisdictions for retail sales at a range of retailers. Specifically, it will help recapture sales currently leaking out of the City in retail store categories such as in-line comparison retail, restaurants, and neighborhood retail.
Discussion of Retail Concepts While there is some inherent overlap in the planned retail components of the two developments, as currently envisioned the Town Center and Retail Center will serve different roles and fulfill distinct retail needs in the evolving marketplace. Landbay F – the redeveloped Retail Center -- will serve as a retail destination for a broad market area. The collection of larger, anchor retailers -- such as Target, Best Buy, a movie theater, etc. -- will draw demand from a significant portion of a five-mile radius and beyond, especially since the retailers at the project are relatively unique in an urban setting. This key demand driver,
Potomac Yard Retail Market Analysis Page 7
04-12172 October 28, 2008
in addition to strong local demand and demand from future residents and workers on site, will support the lifestyle retail component, allowing this cluster of retail to support a broader variety of retail and restaurant types than would be possible in a retail cluster serving only local demand. The Retail Center cluster will also have a compelling market story as a neighborhood-serving cluster, including basic goods and services such as a grocery, pharmacy, convenience, banks, etc. The demand for this local-serving retail can be supported by households and workers in the immediate market area in the mid term, but over time the assumed numbers of households and workers on site will provide near complete support for a neighborhood-serving retail cluster. The assumed amount of retail at the planned Retail Center is appropriate given its market supply and demand context, and is comparable to other destination retail cores that have combined regional or community-serving, lifestyle, and neighborhood retail. Ballston (700,000 square feet anchored by the 580,000 square foot Ballston Common Mall), Pentagon (approximately 1.5 million square feet in Fashion Centre, Pentagon Centre, and Pentagon Row), and the emerging urban retail destination along 14h Street, NW in the District (approximately 750,000 square feet of retail anchored by the 540,000 square foot DC USA project) are but a few examples of multi-purpose retail cores of a comparable size and scale. The larger anchor tenants will be combined with a strong lifestyle retail concept – such is found in Market Common at Clarendon and Reston Town Center, among other notable lifestyle retail cores – that will provide smaller retailers, and restaurant and entertainment options. Finally, the neighborhood retail cluster will compete primarily with other local grocery, pharmacy, and convenience options, but will have the unique advantage of locating within a large retail cluster that serves a broader market. The multi-purpose concept is key – nearly 400,000 square feet of the assumed space at the Retail Center will be large and medium retail stores, which have proven market support in the current retail power center, and the approximately 155,000 square feet of in-line specialty/comparison retail space and 80,000 square feet of restaurant space is supportable given the presence of these large anchors. Due in part because of its smaller size and scale, the Town Center will likely fill primarily a neighborhood and lifestyle retail need -- basic goods and services, boutique and comparison retailers, and restaurant and entertainment – serving the needs of households and employment in the surrounding market areas, as well as residents and workers on site. The assumed scale of this development is in line with other neighborhood-serving and lifestyle urban retail cores in the region -- retail clusters in the 200,000 to 500,000 square foot range, with notable examples such as the Village at Shirlington, Market Common at Clarendon, and Pentagon Row (Arlington), Bethesda Row (Bethesda, MD), and Downtown Silver Spring (Silver Spring, MD). For these analogous retail clusters the concept of “neighborhood” is often broadly defined (as many of these clusters are destinations for many surrounding residential neighborhoods, often serving areas many miles from the center), and this will also be the case for the Town Center, which will be able to expand its market presence by leveraging traffic to the Retail Center, the mixed-use nature of the development, and the presence of Metrorail.
Potomac Yard Retail Market Analysis Page 8
04-12172 October 28, 2008
The Retail Center will be more directly linked to the larger retail concentration anchored by big- and medium-box tenants, while the Town Center’s lifestyle retail component will be primarily unanchored, and therefore these two retail clusters will look and feel different in many ways. Particularly, the Retail Center should have the opportunity to attract a broader range of retail tenants, particularly prominent national tenants who require, or at least strongly prefer, direct proximity to major retail anchors. However, the two lifestyle components of the Retail Center and Town Center will be similar in many ways, with both serving a broad range of consumers as well as local consumer needs, and both attracting national in-line tenants in a variety of retail categories (apparel and accessories, home goods, other comparison and specialty goods, and restaurants and entertainment). Therefore, these two retail clusters will be competitive, but we have found that significant support exists to support both and that there will be significant market differentiation between the two, as well as a complimentary relationship where consumer traffic to one helps support the other. The neighborhood-serving retail and services market likely offers another potential source for cannibalization between the two planned projects at Potomac Yard. However, even this potential source of direct competition will likely be muted given the nature of the planned projects, with the Retail Center project envisioning a larger neighborhood-serving concentration (with a larger grocery anchor of roughly 50,000 square feet) that can leverage the overall power of the retail destination, and the Town Center likely targeting a smaller grocer (30,000 to 35,000 square feet) that is more typical in an emerging location. Over time, the projected household and employment growth on and around the sites, in addition to current pent-up demand in the local market area, will support both neighborhood-serving cores as planned. The significant amount of planned residential, office, and hotel development planned for the sites will be a significant driver of retail demand, but the planned retail development will not depend on these uses to be viable in the mid term. Future demand from households and office workers in surrounding market areas will provide sufficient support for the planned retail scale and mix. Future development on the site will only further strengthen the retail opportunity at this location. We have assumed for the purposes of this analysis that Metrorail will be provided at its planned location, just east of Landbay G. Transit has historically been perceived to have less of an impact on larger retailers, due mostly to the belief that shoppers with bags would not find a train ride an acceptable mode of transportation, but there is emerging anecdotal evidence that in urban locations this is not as much of an absolute, especially as many urban consumers choose not to own a car. Even so, the greatest impact of a Metrorail station at the site will be that it connects the lifestyle and entertainment/restaurant components of the two projects with an expanded market area along the Metrorail system. In both the Retail Center and Town Center it is critical that the built environment follows well-tested urban retail best practices: These include:
Potomac Yard Retail Market Analysis Page 9
04-12172 October 28, 2008
• Active streetfronts with a variety of retail experiences -- this should include, large active windows, avoidance of large blocks of dead space, and where possible, restaurants with café seating in order to bring the retail experience onto the sidewalk;
• Two-sided retail streets are critical to creating a critical mass of retail activity;
• Small retail blocks that further establish the sense of a critical mass of activity – a small retail cluster typically should not
extend its retail core over more than a few blocks, although larger retail clusters can spread farther if key retail anchors are placed appropriately at the ends of the retail corridor;
• District or central parking is appropriate, as is shared parking, but the reality of parking needs cannot be ignored, even
with transit – on-street parking should also be provided as an option;
• Local, independent retailers can add a refreshing and authentic flavor, but policies should not over-prescribe local retailer presence, as developers depend on credit-worthy tenants to make often slim retail deals financially viable.
• The two retail concepts are not wholly dependent upon each other, and they can be successful without the benefit of the
other. However, both projects will benefit greatly by connections to and coordination with each other, preferably along a single “main street” anchored at each end by these retail clusters.
This engagement was conducted by Marc McCauley, Senior Principal and Charles Hewlett, Managing Director, of the
Washington, D.C., office of RCLCO. If you have any questions regarding the conclusions and recommendations included herein, or wish to learn about other RCLCO advisory services, please call (310) 914-1800.
Potomac Yard Retail Market Analysis Page 10
04-12172 October 28, 2008
SUBJECT SITE ASSESSMENT A description of the development program assumptions is provided in Exhibit 1. The existing Potomac Yard Retail Center (Land Bay F) comprises 590,000 square feet of retail space, primarily in big and medium box stores (including a multiplex theater). The planned redevelopment of the existing retail center will add approximately 260,000 square feet of retail space, primarily in specialty/comparison retail, a fitness center/spa, 60,000 square feet of restaurant space, and potentially another entertainment-oriented use. Much off the existing tenant base – most critically the Target store and the multiplex theater – will remain as future tenants, although very likely not in the same buildings. For the purposes of this study we have assumed that Town Center on Land Bays G, H and Part of I, will comprise 220,000 square feet of retail space in two phases, with the first phase delivering the vast majority (200,000 square feet) of retail space. The Town Center will potentially offer a mix of neighborhood-oriented good and services (58,500 square feet), specialty/comparison retail (68,500 square feet), restaurants (59,500 square feet), and a fitness center (33,5000 square fee). The Potomac Yard Retail Center is a proven retail destination, and there are a number of attractive characteristics that lead to the conclusion that the proposed retail developments will also be successful, including: Subject Property Competitive Advantages:
• Strategic regional location within close proximity to significant concentrations – and cores of growth -- of high-income households and office employment.
• Excellent multimodal transportation access and visibility with high traffic counts.
• Established retail destination with strong track record of high sales volumes.
• Plan for an urban, mixed-use environment that will support vibrant, multi-purpose retail environment.
• Lack of similar retail environment, either existing or planned, with superior or equal access to the key pools of retail
demand – including a majority of Alexandria households and employees -- that will drive retail sales at the Potomac Yard.
Potomac Yard Retail Market Analysis Page 11
04-12172 October 28, 2008
While the positive attributes of the sites for retail development as assumed far outweigh any potential negative characteristics, the sites do have some market challenges, including: Subject Property Market Challenges:
• As retail is established in emerging cores that have historically driven a significant share of demand at Potomac Yard, retail on the site may not benefit as much from retail expenditures leaking out of nearby jurisdictions.
• Adjacent land uses on the west of Route 1 are not consistent with the planned pedestrian-oriented, urban retail
development at Potomac Yard. The existing retail has not been negatively impacted by these adjacent uses.
Potomac Yard Retail Market Analysis Page 12
04-12172 October 28, 2008
COMPETITIVE MARKET ASSESSMENT The current and future competitive market area presents a strong opportunity to develop one or more new retail cores at Potomac Yard. In particular:
• The Crystal City submarket has enjoyed low retail vacancies, primarily due to the stability of the existing Potomac Yard Retail Center (Exhibits 5 and 6).
• The current power center is achieving very strong sales and is clearly benefiting from a wide market draw to the larger,
power center anchor tenants that drive traffic at the center. Specifically, the center is pulling demand from under-served market areas in the District of Columbia and Prince George’s County, as well as areas of closer-in Northern Virginia where access to large anchor tenants is also relatively limited.
• The current retail center is in a conventional, suburban format, and does not compete today as an urban lifestyle
retail/entertainment core (with the exception of movie theater demand).
• The closest current and emerging competitive cores are in Crystal City, Pentagon City, Rosslyn-Ballston Corridor, Shirlington, Old Town Alexandria, but only Crystal City is within two miles of the subject site. We expect that retail at the subject site will compete with retail in these locations, but will be able to capture some share of demand within the two-mile ring and beyond, due to a strong mix of tenants at the proposed development.
o Pentagon City offers an attractive mix of regional-serving retail with a small lifestyle component that is supported
primarily by traffic to the larger retail cluster and much localized demand.
o Crystal City is undergoing a process of reinvention, with the addition of some streetfront retail/restaurants, but the vast majority of space in Crystal City today is older and obsolete (and underground).
o The Rosslyn-Ballston corridor is also a competitive cluster with a mix of regional and smaller-scale urban lifestyle
retail; it is particularly a strong destination for nightlife and restaurants. Yet, this cluster is nearly five miles from the site, and does not offer the many of the big and medium box tenants that are significant consumer magnets and currently are on the Potomac Yard site.
Potomac Yard Retail Market Analysis Page 13
04-12172 October 28, 2008
o Shirlington is a smaller retail cluster serving primarily local households and workers. It will represent a competitive threat for households in this more local area, but is not a very strong threat regionally given its size and focus.
o The Landmark/Van Dorn area is a little less than 5 miles away, and while future growth/rejuvenation of that market
will be competitive in some regard, it is far enough away to draw from significantly different sources of demand.
o Old Town has its own unique competitive niche, as a boutique retail and restaurant entertainment destination for City residents and beyond. This retail cluster will continue to evolve as competition from larger lifestyle retail clusters are delivered in the competitive market area. It will represent a strong competitor for the Potomac Yard site for certain aspects of retail, but in many more ways the Old Town environment and the proposed environment at Potomac Yard are highly differentiated and will often cater to different consumer needs.
• There is relatively limited retail being offered in the areas of Prince George’s County and the District of Columbia that are
closest in proximity and access to the site. These are strong sources of demand for the existing retail center.
• Suburban retail cores with bigger box components will represent competitive threats to that component of the retail program at Potomac Yard, but the overall experience -- mixed use, more urban, lifestyle retail -- at Potomac Yard will be an attractive draw, and some share of consumers will in fact choose to drive by an existing store in a less vibrant suburban center to get to the same store in Potomac Yard.
• There are currently relatively few grocery options in the local market area of the subject site. A new Harris Teeter store
just to the north in Arlington represents competition, but the next closest grocery store is an older Giant that has very likely outlived its usefulness.
• The three mile radius from the subject site is relatively under-served with regard to health clubs/fitness centers –
especially relative to more urban – today – locations in Arlington and the District.
• The existing 16-screen multiplex theater at Potomac Yard Retail Center competes with a smaller, older theater in Shirlington and a 22-screen multiplex in the Hoffman area south of Old Town Alexandria. The current movie theater is reportedly performing quite well, and there are no known competitive threats that would change this success in the foreseeable future.
• The strength of the large-anchor draw at Potomac Yard will likely diminish somewhat in the foreseeable future, as some
new projects are delivered in under-served areas; DC USA on 14th Street, NW, in the District, for example, has already
Potomac Yard Retail Market Analysis Page 14
04-12172 October 28, 2008
provided a larger-scale retail alternative (including a Target store) to District residents, and the planned large-scale retail offerings at the redeveloped Skyland Mal in Southeast, Washington, D.C. will also recapture demand back into the District that is currently leaking into other areas, including Potomac Yard.
• However, the universe of potential projects/sites that could add new, large-scale retail options is limited, and the
Potomac Yard site will continue to be able to draw from a broad market area for these store types; the current superb performance of the current roster of anchor tenants at the Potomac Yard Retail Center is indicative of future demand.
Potomac Yard Retail Market Analysis Page 15
04-12172 October 28, 2008
DEMOGRAPHICS AND DEMAND The demographic and retail demand analyses show strong support for additional retail development at Potomac Yard. The following describes the methodology and findings associated with demand analysis:
• Exhibit 19 provides a map of the trade area for retail at the subject site. We drew multiple radii (1-mile, 2-mile, 3.5-mile, and 5-mile) and identified Zip Code Market Areas within those radii that would likely contribute to retail demand potential at the site. A detailed retail demand analysis should extend beyond mere radii, in that consumer behavior within a broad area can differ dramatically depending on access to competitive retail clusters/stores, transportation options, perceptions, etc. A more defined geographic area allows for more distinct assumptions with regard to potential capture of current and future retail demand.
• The demand analysis incorporated four primary sources of demand: 1) market area households; 2) market area
employees, distinguishing between office and non-office workers; 3) demand from these two previous sources of demand that originate from outside of the defined market areas; and, 4) future on-site residents and office workers on the two Potomac Yard development sites under study here. While there is a hotel component as part of the two redevelopment programs, demand from this source was not included, as it typically results in little demand relative to the other sources of demand.
• For the purposes of this analysis, we have assumed market area demand at 2020, which is the assumed build out date for
the two projects. We have also analyzed current market demand conditions in 2008, in order to get a base assessment of demand and supply conditions.
• All retail expenditure data and analysis is in 2008 dollars; no escalations of expenditures have been assumed.
• The closest, core market areas for retail at Potomac Yard are projected to experience significant household growth and
have strong average incomes (Exhibit 20). The identified market areas are build around zip codes, with zip codes being combined only when appropriate – areas with relatively similar, consistent access to the site and competitive cores. Within a 3.5-mile radius there are approximately 110,000 households.
• The demand analysis utilized MWCOG TAZ-level data as the primary source of household growth projections in the
market areas. MWCOG data is often criticized as conservative; however, we have found that current estimates of market
Potomac Yard Retail Market Analysis Page 16
04-12172 October 28, 2008
area households from MWCOG consistently are larger than household estimates from Claritas, Inc., which is a widely-use source of demographic data. Household growth projections from MWCOG still may not fully reflect growth potential in certain areas, and therefore may still be considered conservative when looking at 2020 demand.
• Exhibit 21 (pages 24 to 57 in the Exhibit packet at the back of this report), provides the data on household retail
expenditures. The 2008 retail expenditures were collected from Claritas, Inc., which translates data from the Consumer Expenditures Survey (CES), which is fielded by the Bureau of Labor Statistics in the Department of Labor, into store types. The translation of CES data into store types is an imperfect science, as many store types capture demand for a wide variety of consumer goods (and often the capture of these goods depends on the character and depth of the competitive market), but provides a good gauge of demand by store type across market areas.
• Since the total expenditures are likely low given a low household count (as described above), we calculated the prevailing
retail expenditure per household by store type for each market area. We then applied this per household figure to MWCOG numbers for 2008 to 2020 in order to calculate total retail expenditures by store type.
• Exhibit 21 also provides retail sales data by store type, as collected by Claritas, Inc (this data is summarized in Exhibit
28). The retail sales data is generally reliable for broad analyses, although it is based on survey information, and therefore can sometimes miss pockets of retail activity. It is a useful data set to compare expenditures to existing sales in a given market area across a broad spectrum of store types.
• We have not projected retail sales for this analysis, essentially assuming that no net new retail is built from 2008 to 2020
in any of the given market areas. While this is not likely to occur, we will reflect future competitive supply in our capture rates of available demand (see below).
• The retail expenditures by store type for each market area are summarized in Exhibits 22A and 22B. In 2008 Alexandria
households generates 1.68 billion dollars worth of retail expenditures, as compared to $2.57 billion in neighboring Arlington. Approximately $1.4 billion of retail expenditures fall in the 22305, 22301, 22302, 22202, and 22314 zip codes (which all fall primarily within the 2-mile radius).
• Retail expenditures in Alexandria are projected to grow 14% by 2020, in constant dollars, due to net new household
growth in the City. The Crystal City/Pentagon City and Old Town/Carlyle submarkets are expected to grow in excess of city-wide growth, given future development potential in those areas (including at Potomac Yard).
Potomac Yard Retail Market Analysis Page 17
04-12172 October 28, 2008
• Exhibits 23A and 23B provide the results of the household demand-supply gap analysis for the selected market areas, as well as the City of Alexandria and Arlington County. This analysis shows the degree to which areas have become retail clusters, and should not be associated with oversupply, as: 1) demand from other sources of demand – such as area employees and consumers from outside of the defined market area -- have not yet been factored in, and 2) retail markets are often built upon clustering, where small areas often capture retail sales far in excess of local household support.
• Exhibit 24 provides data on office and total employment in the select market areas and the City of Alexandria and
Arlington County. Workers are an important source of retail demand across a wide variety of store types, and are especially critical components of creating an 18-hour retail environment. The subject site offers tremendous access to large office employment concentrations in Old Town/Carlyle and Crystal City, as well as future office space on the Potomac yard site.
• Exhibits 25 and 26A & B provide the data and analysis of retail demand originating from market area employees. Based
upon data on expenditures from office workers from ICSC, we have calculated the per office worker expenditures by retail type, and distributed this demand potential into our retail store typologies based upon our experience with retail spending patterns of workers. We assumed that non-office workers would spend roughly half the amount on retail as do office workers. We have also assumed that only 60% of the retail spending could be theoretically captured, in order to avoid double counting among households that both live and work with the defined market areas. The 60% assumption was based on Census data that shows that roughly 60% of workers in the region work 25 minutes or more away from where they live.
• Exhibits 27A & B summarized the demand potential from households and employment for the market areas and the City
of Alexandria and Arlington County. We have also assumed a factor for demand that originates from outside of the defined market areas – 5% for neighborhood retail, 10% for comparison retailers, and 20% for food and beverage.
• Exhibits 29A & B provide the demand-supply gap analysis for total demand potential in 2008 and 2020. The City of
Alexandria in 2008 is a destination for some types of retail – particular general merchandize/department stores and home furnishing/home goods stores – but overall is leaking approximately $290 million in sales, including $178 million in food and beverage establishments and $156 million in neighborhood retail. The leakage volumes in Alexandria increase to $590 million by 2020 (once again, we have not assumed any increase in retail sales, so this assumes that no net new retail is built from 2008 to 2020).
• The Mount Vernon/Braddock and Crystal City/Pentagon City market areas capture more than $525 million in retail sales
over demand originated within the market area, and this number only decreases to just under $240 million in 2020. The
Potomac Yard Retail Market Analysis Page 18
04-12172 October 28, 2008
existing retail center at Potomac Yard is a key component of the retail destination that has been created in the Mount Vernon/Braddock market area. The big box tenants that are located in this center are able to draw demand from a larger market area.
• The demand-supply gap analysis is only one piece of the analysis that determines potential capture at the subject site.
Capture rates of demand potential in 2020, as shown in Exhibit 30A, also reflect an assessment of the character and quality of competitive retail clusters relative to the planned retail cluster at Potomac Yard (as discussed in the Competitive Market Analysis above). Our assumed capture rates are meant to reflect conservative estimates of demand – the theory being that support for a retail program using more conservative capture rates provides a greater margin of error for future success.
• Exhibit 30B summarizes the results of the capture rate analysis, while Exhibit 30C shows the distribution of 2020 demand
by market area. Exhibit 31A and B provides a map showing the geographical boundaries of the Primary, Secondary, and Tertiary Market Areas. Exhibit 32 calculates the retail support generated by future households and workers on the site. The summary of all capture retail demand expenditures and the translation of that demand into square feet is provided in Exhibit 33. We have found:
• The demand analysis indicates strong support for the variety of big- and medium-box retail anchors, which matches
the current reports on actual performance of stores at the Potomac Yard Retail Center.
• In addition, there is strong market support for in-line comparison retail space, driven in part by capture rates that assume traffic will be driven by highly successful anchor stores. There is also strong support for a significant restaurant cluster, which is a highly compatible with the traffic driven by the entertainment and comparison retail cluster.
• There is strong support for grocery anchor and related neighborhood retail uses; these uses are dependent in part
on future housing and office development on the site, with roughly 30% of the demand for a grocery store from this future source off demand. It is important to note that the full retail program is supportable even if this future housing and office development is slow to materialize as the demand analysis assumes fairly high threshold levels for sales per square foot ($850/sf). At a lower, but still acceptable threshold of $600/sf, there is ample demand to support the planned grocery and neighborhood retail space.
• The Primary Market Area for all retail, taking into account only market area residents and households, without
accounting for on-site residents, accounts for nearly 60% of all demand. The Primary Market Area consists
Potomac Yard Retail Market Analysis Page 19
04-12172 October 28, 2008
primarily of areas within a two-mile radius, as well as some areas to the north (Crystal City and Pentagon City) and south (Old Town and Carlyle) that are relatively underserved with regard to many of the retail options assumed at the two subject sites. For just Neighborhood Retail, the same Primary Market Area accounts for nearly 74% of all demand; neighborhood-serving retail generally draws from a smaller market area, although the broad draw of the large retail concentration as assumed will help draw in demand from a larger market area than just a typical, grocery-anchored center.
• Approximately 15% of future demand will derive from future housing and office development on the site, but the
success of the program is not dependent on this demand; although neighborhood retail will benefit greatly from some critical mass of housing on the site.
• We did not provide a statistical demand analysis for fitness center/spa or movie theater. Our analysis of competitive
market conditions strongly suggests that there is a significant hole in the market for a fitness center component of the retail market, and future household growth on and around the site will only increase this pent-up demand. There is an existing, successful movie theater on site, and this market support will not be threatened by any competitive supply.
Potomac Yard Retail Market Analysis Page 20
04-12172 October 28, 2008
CRITICAL ASSUMPTIONS
The conclusions and recommendations presented in this report are based on our analysis of the information available to us from our own sources and from the client as of the date of this report. We assume that the information is correct, complete, and reliable. Our conclusions and recommendations are based on certain assumptions about the future performance of the global, national, and/or local economy and real estate market, and on other factors similarly outside either our control or that of the client. We analyzed trends and the information available to us in drawing conclusions and making the appropriate recommendations. However, given the fluid and dynamic nature of the economy and real estate markets, it is critical to monitor the economy and markets continuously and to revisit the aforementioned conclusions and recommendations periodically to ensure that they stand the test of time. We assume that, in the future, the economy and real estate markets will grow at a stable and moderate rate. However, history tells us that stable and moderate growth patterns are not sustainable over extended periods of time. Indeed, we find that the economy is cyclical and that the real estate markets are typically highly sensitive to business cycles. Our analysis does not necessarily take into account the potential impact of major economic "shocks" on the national and/or local economy and does not necessarily account for the potential benefits from a major "boom." Similarly, the analysis does not necessarily reflect the residual impact on the real estate market and the competitive environment of such a shock or boom. The future is always difficult to predict, particularly given changing consumer and market psychology. Therefore, we recommend the close monitoring of the economy and the marketplace. The project and investment economics should be “stress tested” to ensure that potential fluctuations in the economy and real estate market conditions will not cause failure. In addition, we assume that economic, employment, and household growth will occur more or less in accordance with current expectations, along with other forecasts of trends and demographic and economic patterns. Along these lines, we are not taking into account any major shifts in the level of consumer confidence; in the cost of development and construction; in tax laws (i.e., property and income tax rates, deductibility of mortgage interest, and so forth); or in the availability and/or cost of capital and mortgage financing for real estate developers, owners, and buyers. Should any of the above change, this analysis should probably be updated, with the conclusions and recommendations summarized herein reviewed accordingly (and possibly revised).
Potomac Yard Retail Market Analysis Page 21
04-12172 October 28, 2008
We also assume that competitive projects will be developed as planned (active and future) and that a reasonable stream of supply offerings will satisfy real estate demand. Finally, we assume that major public works projects occur and are completed as planned.
GENERAL LIMITING CONDITIONS Reasonable efforts have been made to ensure that the data contained in this study reflect accurate and timely information and are believed to be reliable. This study is based on estimates, assumptions, and other information developed by RCLCO from its independent research effort, general knowledge of the industry, and consultations with the client and its representatives. No responsibility is assumed for inaccuracies in reporting by the client, its agent, and representatives or in any other data source used in preparing or presenting this study. This report is based on information that to our knowledge was current as of the date of this report, and RCLCO has not undertaken any update of its research effort since such date. Our report may contain prospective financial information, estimates, or opinions that represent our view of reasonable expectations at a particular time, but such information, estimates, or opinions are not offered as predictions or assurances that a particular level of income or profit will be achieved, that particular events will occur, or that a particular price will be offered or accepted. Actual results achieved during the period covered by our prospective financial analysis may vary from those described in our report, and the variations may be material. Therefore, no warranty or representation is made by RCLCO that any of the projected values or results contained in this study will be achieved. Possession of this study does not carry with it the right of publication thereof or to use the name of "Robert Charles Lesser & Co." or "RCLCO" in any manner without first obtaining the prior written consent of RCLCO. No abstracting, excerpting, or summarization of this study may be made without first obtaining the prior written consent of RCLCO. This report is not to be used in conjunction with any public or private offering of securities or other similar purpose where it may be relied upon to any degree by any person other than the client without first obtaining the prior written consent of RCLCO. This study may not be used for any purpose other than that for which it is prepared or for which prior written consent has first been obtained from RCLCO.
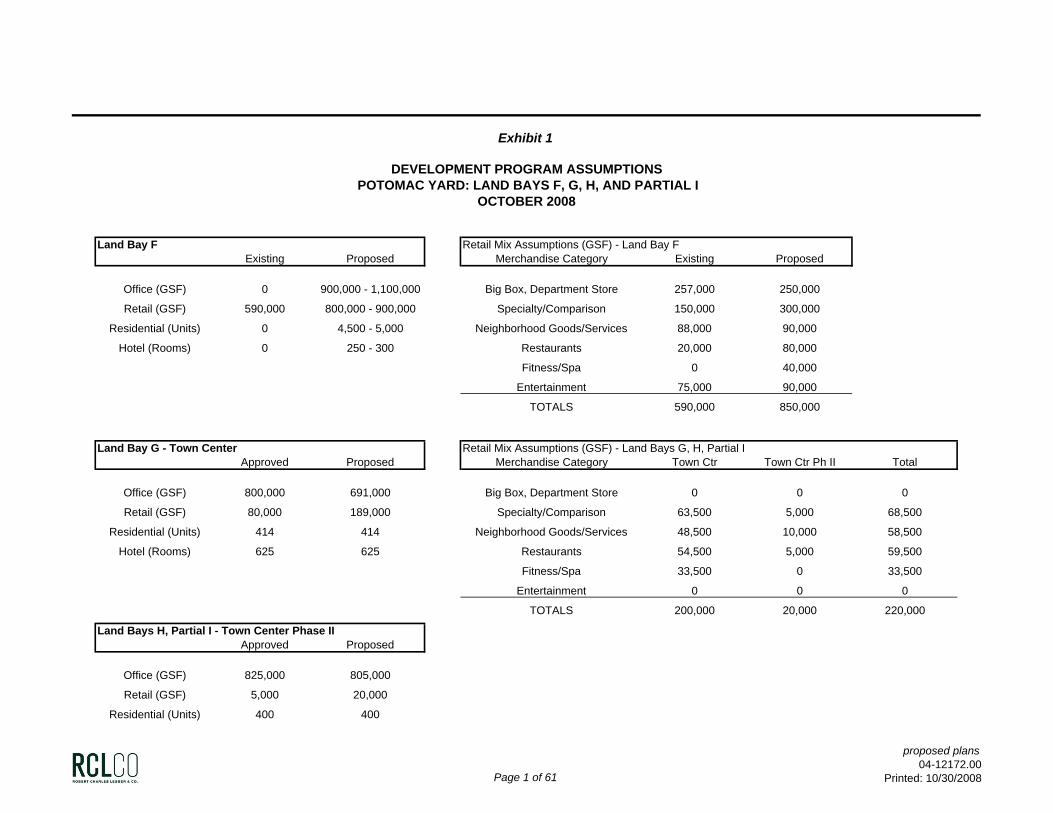
Exhibit 1
DEVELOPMENT PROGRAM ASSUMPTIONSPOTOMAC YARD: LAND BAYS F, G, H, AND PARTIAL I
OCTOBER 2008
Land Bay F Retail Mix Assumptions (GSF) - Land Bay FExisting Proposed Merchandise Category Existing Proposed
Office (GSF) 0 900,000 - 1,100,000 Big Box, Department Store 257,000 250,000
Retail (GSF) 590,000 800,000 - 900,000 Specialty/Comparison 150,000 300,000
Residential (Units) 0 4,500 - 5,000 Neighborhood Goods/Services 88,000 90,000
Hotel (Rooms) 0 250 - 300 Restaurants 20,000 80,000
Fitness/Spa 0 40,000
Entertainment 75,000 90,000
TOTALS 590,000 850,000
Land Bay G - Town Center Retail Mix Assumptions (GSF) - Land Bays G, H, Partial IApproved Proposed Merchandise Category Town Ctr Town Ctr Ph II Total
Office (GSF) 800,000 691,000 Big Box, Department Store 0 0 0
Retail (GSF) 80,000 189,000 Specialty/Comparison 63,500 5,000 68,500
Residential (Units) 414 414 Neighborhood Goods/Services 48,500 10,000 58,500
Hotel (Rooms) 625 625 Restaurants 54,500 5,000 59,500
Fitness/Spa 33,500 0 33,500
Entertainment 0 0 0
TOTALS 200,000 20,000 220,000
Land Bays H, Partial I - Town Center Phase IIApproved Proposed
Office (GSF) 825,000 805,000
Retail (GSF) 5,000 20,000
Residential (Units) 400 400
Page 1 of 61
proposed plans04-12172.00
Printed: 10/30/2008
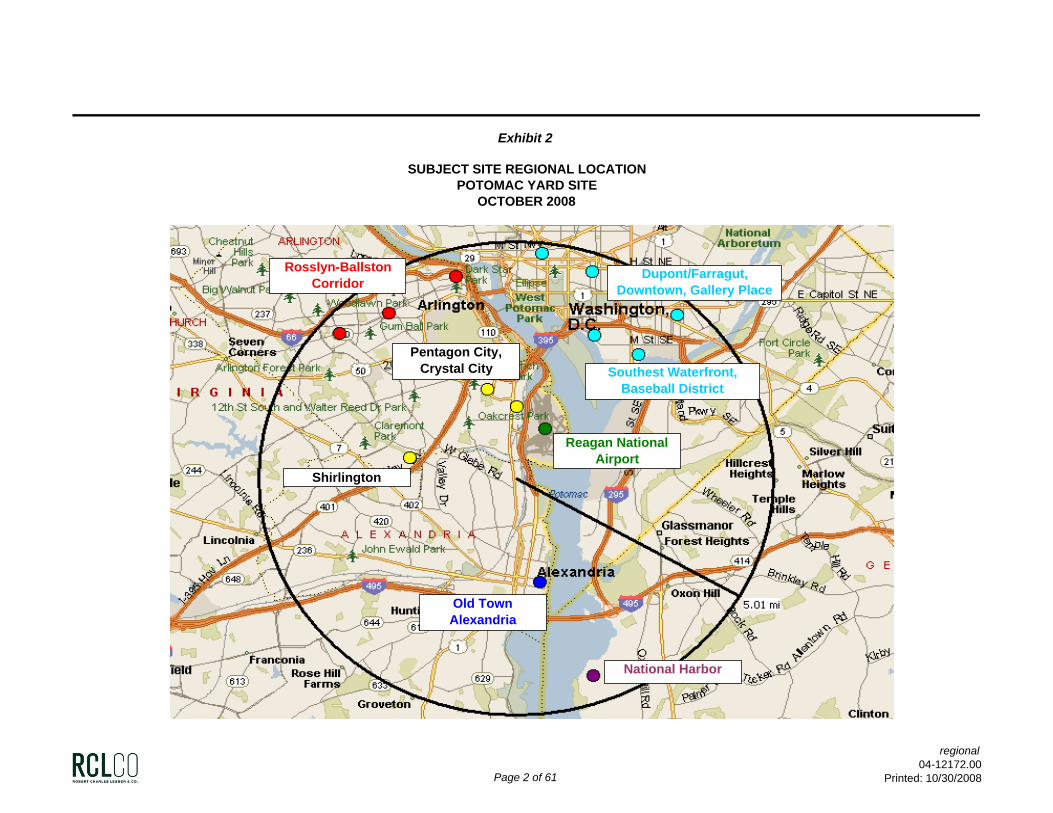
Exhibit 2
SUBJECT SITE REGIONAL LOCATIONPOTOMAC YARD SITE
OCTOBER 2008
Rosslyn-Ballston Corridor
National Harbor
Southest Waterfront, Baseball District
Dupont/Farragut, Downtown, Gallery Place
Old Town Alexandria
Pentagon City, Crystal City
Shirlington
Reagan National Airport
Page 2 of 61
regional04-12172.00
Printed: 10/30/2008
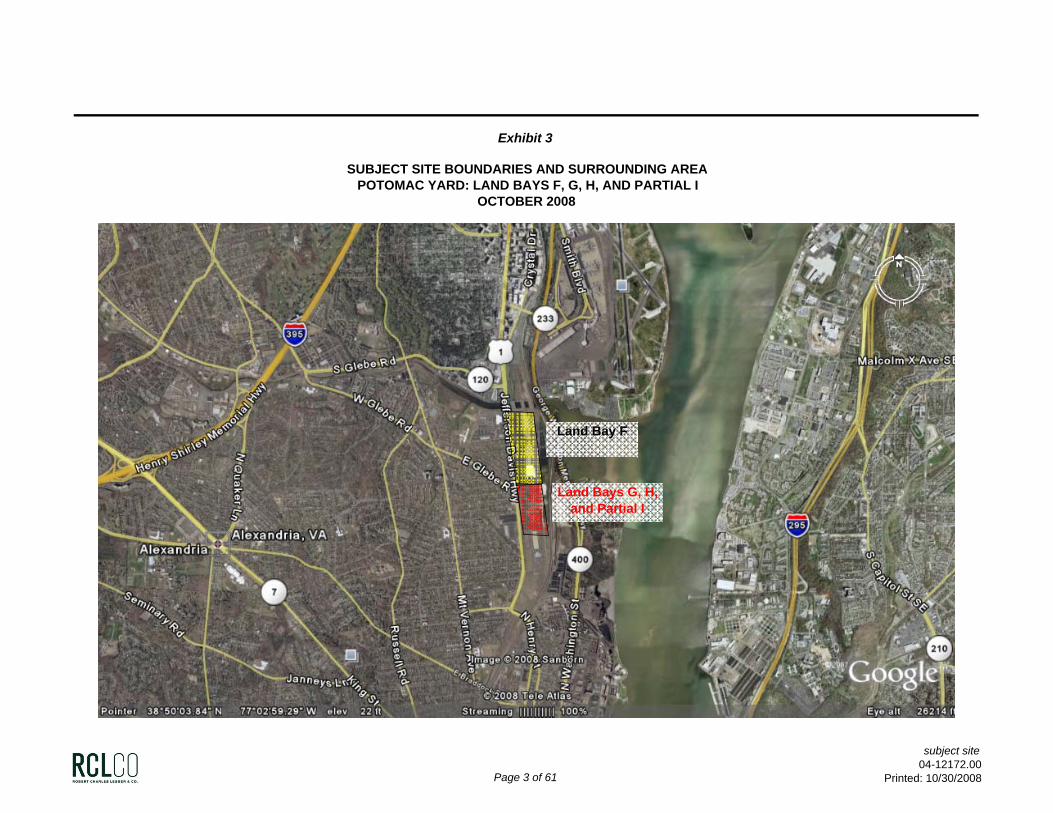
Exhibit 3
SUBJECT SITE BOUNDARIES AND SURROUNDING AREAPOTOMAC YARD: LAND BAYS F, G, H, AND PARTIAL I
OCTOBER 2008
Land Bay F
Land Bays G, H, and Partial I
Page 3 of 61
subject site04-12172.00
Printed: 10/30/2008
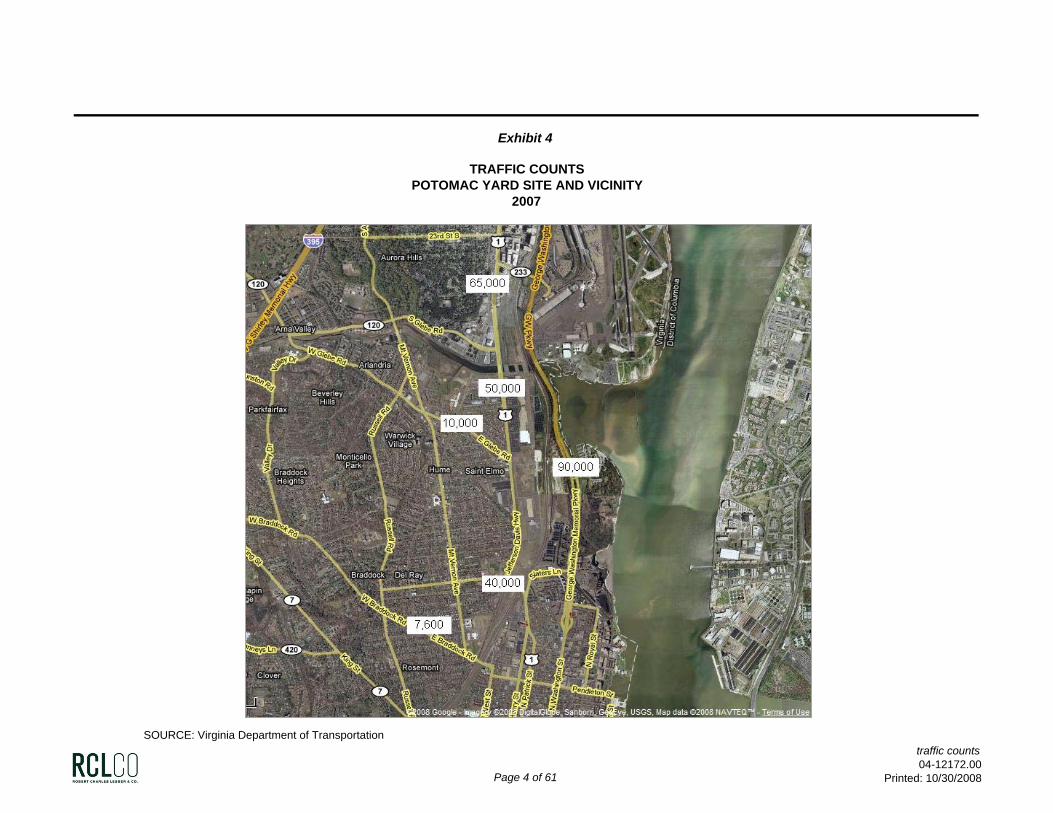
Exhibit 4
TRAFFIC COUNTSPOTOMAC YARD SITE AND VICINITY
2007
SOURCE: Virginia Department of Transportation
Page 4 of 61
traffic counts04-12172.00
Printed: 10/30/2008
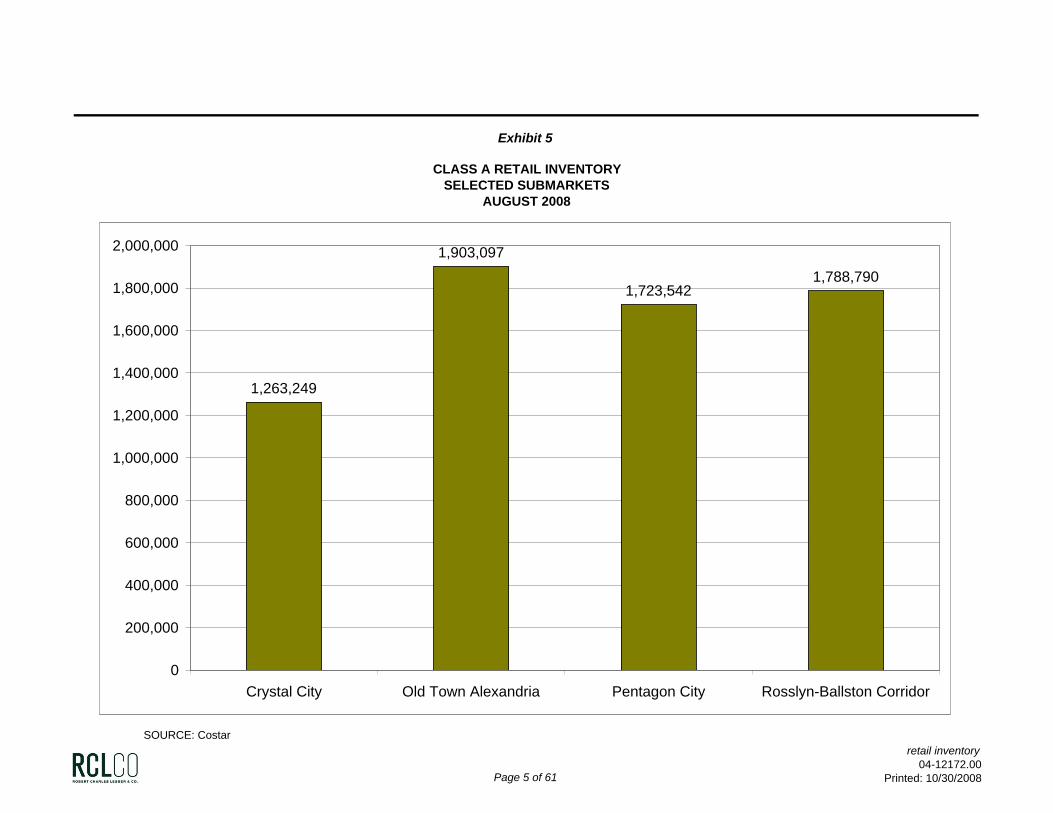
Exhibit 5
CLASS A RETAIL INVENTORYSELECTED SUBMARKETS
AUGUST 2008
SOURCE: Costar
1,263,249
1,903,097
1,723,5421,788,790
0
200,000
400,000
600,000
800,000
1,000,000
1,200,000
1,400,000
1,600,000
1,800,000
2,000,000
Crystal City Old Town Alexandria Pentagon City Rosslyn-Ballston Corridor
Page 5 of 61
retail inventory04-12172.00
Printed: 10/30/2008
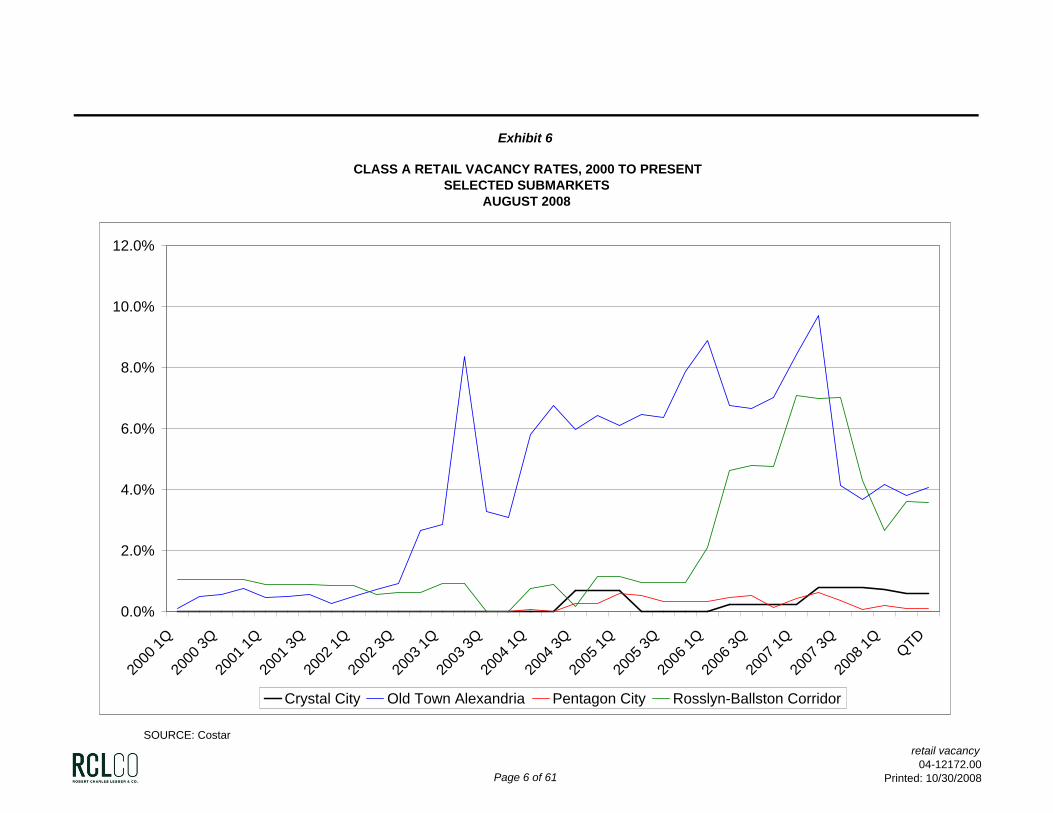
Exhibit 6
CLASS A RETAIL VACANCY RATES, 2000 TO PRESENTSELECTED SUBMARKETS
AUGUST 2008
SOURCE: Costar
0.0%
2.0%
4.0%
6.0%
8.0%
10.0%
12.0%
2000
1Q20
00 3Q
2001
1Q20
01 3Q
2002
1Q20
02 3Q
2003
1Q20
03 3Q
2004
1Q20
04 3Q
2005
1Q20
05 3Q
2006
1Q20
06 3Q
2007
1Q20
07 3Q
2008
1Q QTD
Crystal City Old Town Alexandria Pentagon City Rosslyn-Ballston Corridor
Page 6 of 61
retail vacancy04-12172.00
Printed: 10/30/2008
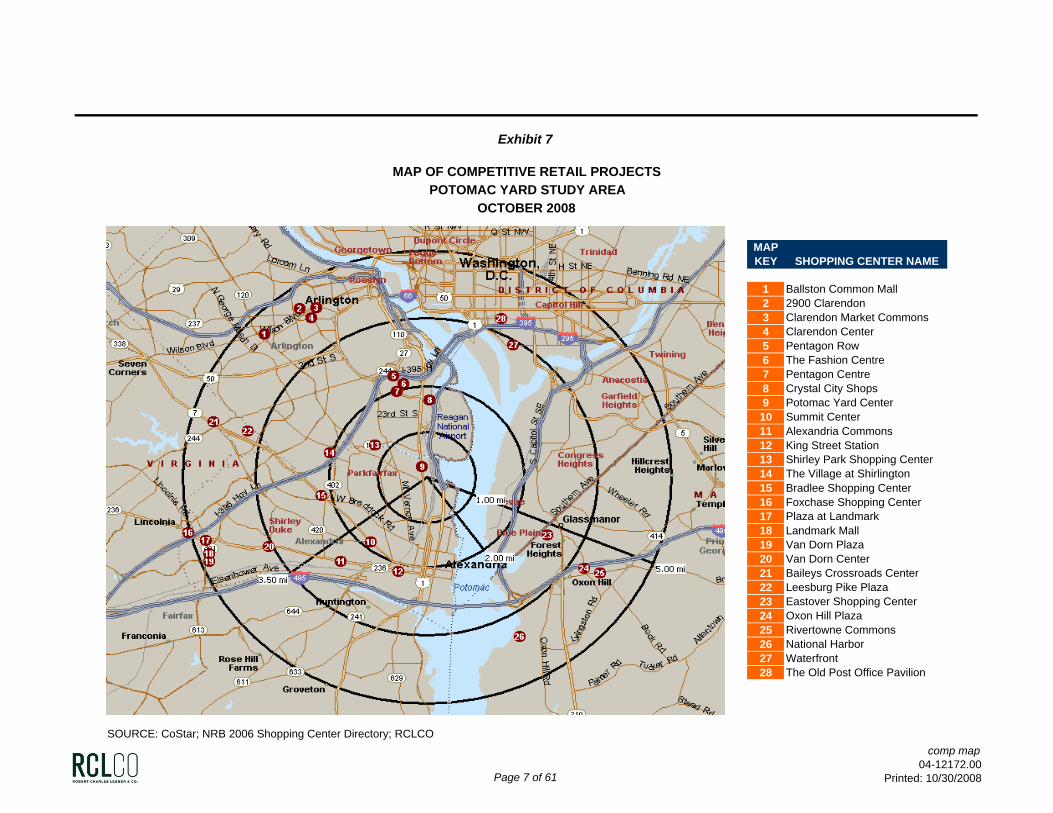
Exhibit 7
MAP OF COMPETITIVE RETAIL PROJECTSPOTOMAC YARD STUDY AREA
OCTOBER 2008
MAP KEY SHOPPING CENTER NAME
1 Ballston Common Mall2 2900 Clarendon3 Clarendon Market Commons4 Clarendon Center5 Pentagon Row6 The Fashion Centre7 Pentagon Centre8 Crystal City Shops9 Potomac Yard Center10 Summit Center11 Alexandria Commons 12 King Street Station13 Shirley Park Shopping Center14 The Village at Shirlington15 Bradlee Shopping Center16 Foxchase Shopping Center17 Plaza at Landmark18 Landmark Mall19 Van Dorn Plaza20 Van Dorn Center21 Baileys Crossroads Center22 Leesburg Pike Plaza23 Eastover Shopping Center24 Oxon Hill Plaza25 Rivertowne Commons26 National Harbor27 Waterfront28 The Old Post Office Pavilion
SOURCE: CoStar; NRB 2006 Shopping Center Directory; RCLCO
Page 7 of 61
comp map04-12172.00
Printed: 10/30/2008
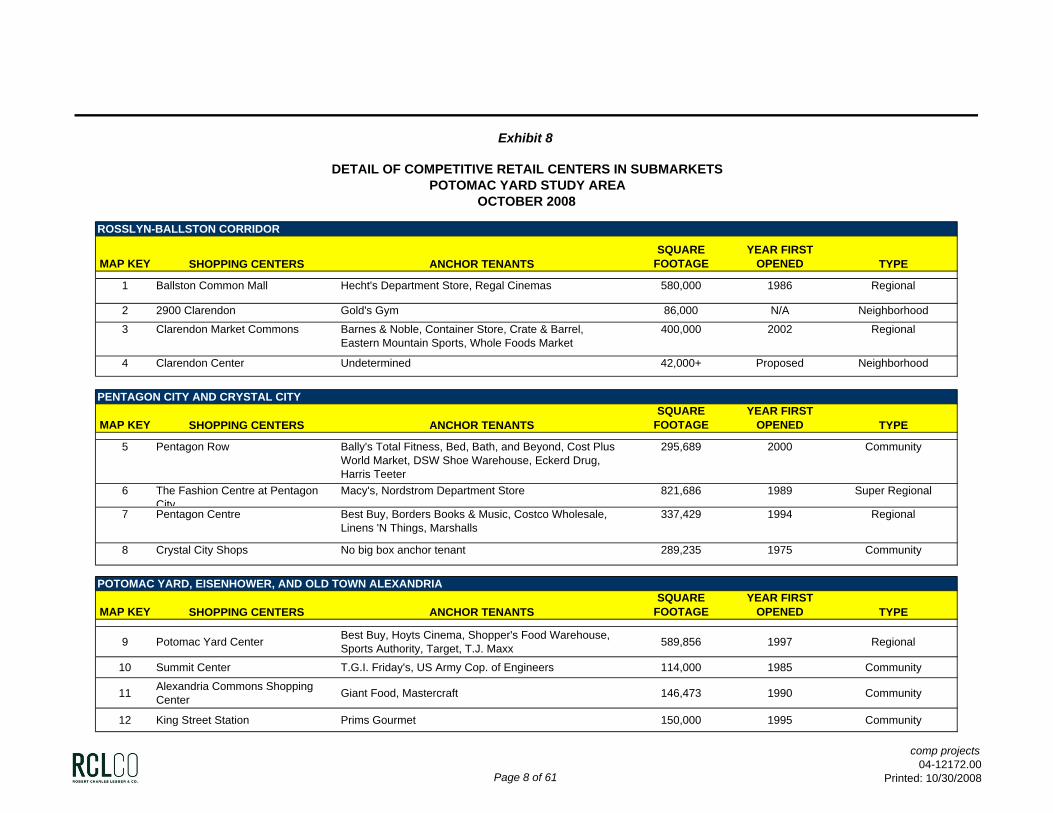
Exhibit 8
DETAIL OF COMPETITIVE RETAIL CENTERS IN SUBMARKETSPOTOMAC YARD STUDY AREA
OCTOBER 2008
ROSSLYN-BALLSTON CORRIDOR
MAP KEY SHOPPING CENTERS ANCHOR TENANTSSQUARE
FOOTAGEYEAR FIRST
OPENED TYPE
1 Ballston Common Mall Hecht's Department Store, Regal Cinemas 580,000 1986 Regional
2 2900 Clarendon Gold's Gym 86,000 N/A Neighborhood
3 Clarendon Market Commons Barnes & Noble, Container Store, Crate & Barrel, Eastern Mountain Sports, Whole Foods Market
400,000 2002 Regional
4 Clarendon Center Undetermined 42,000+ Proposed Neighborhood
PENTAGON CITY AND CRYSTAL CITY
MAP KEY SHOPPING CENTERS ANCHOR TENANTSSQUARE
FOOTAGEYEAR FIRST
OPENED TYPE
5 Pentagon Row Bally's Total Fitness, Bed, Bath, and Beyond, Cost Plus World Market, DSW Shoe Warehouse, Eckerd Drug, Harris Teeter
295,689 2000 Community
6 The Fashion Centre at Pentagon City
Macy's, Nordstrom Department Store 821,686 1989 Super Regional
7 Pentagon Centre Best Buy, Borders Books & Music, Costco Wholesale, Linens 'N Things, Marshalls
337,429 1994 Regional
8 Crystal City Shops No big box anchor tenant 289,235 1975 Community
POTOMAC YARD, EISENHOWER, AND OLD TOWN ALEXANDRIA
MAP KEY SHOPPING CENTERS ANCHOR TENANTSSQUARE
FOOTAGEYEAR FIRST
OPENED TYPE
9 Potomac Yard Center Best Buy, Hoyts Cinema, Shopper's Food Warehouse, Sports Authority, Target, T.J. Maxx 589,856 1997 Regional
10 Summit Center T.G.I. Friday's, US Army Cop. of Engineers 114,000 1985 Community
11 Alexandria Commons Shopping Center Giant Food, Mastercraft 146,473 1990 Community
12 King Street Station Prims Gourmet 150,000 1995 Community
Page 8 of 61
comp projects04-12172.00
Printed: 10/30/2008
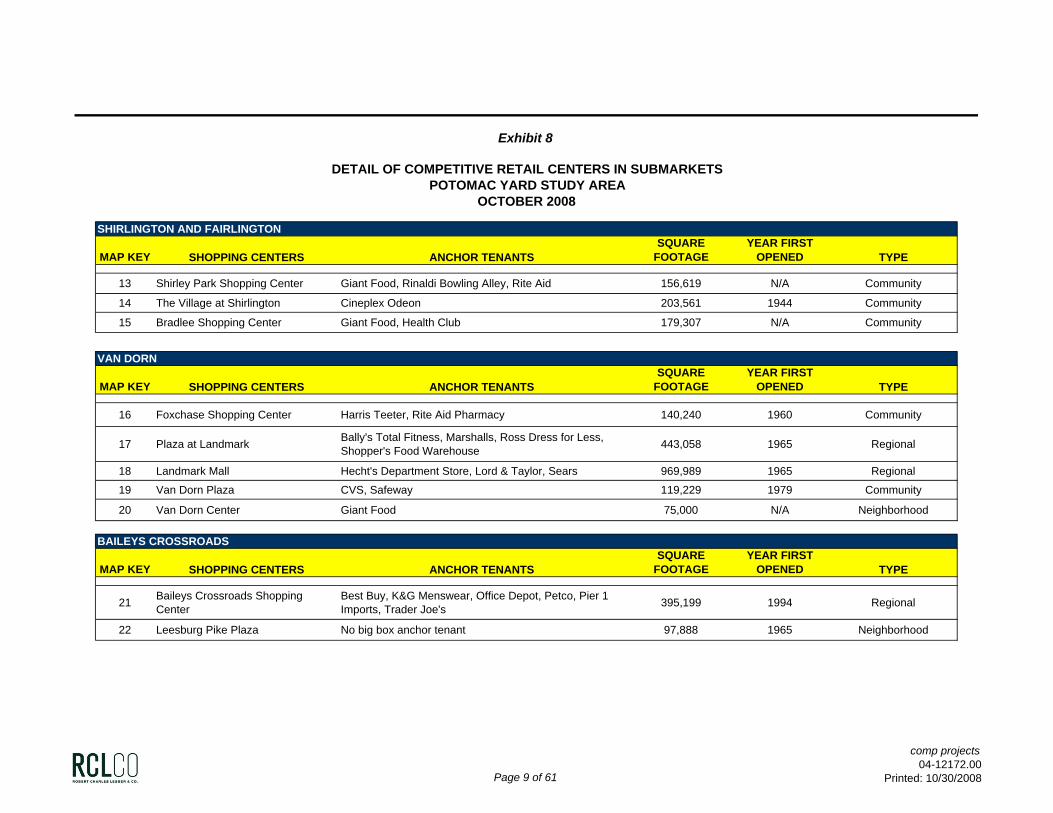
Exhibit 8
DETAIL OF COMPETITIVE RETAIL CENTERS IN SUBMARKETSPOTOMAC YARD STUDY AREA
OCTOBER 2008
SHIRLINGTON AND FAIRLINGTON
MAP KEY SHOPPING CENTERS ANCHOR TENANTSSQUARE
FOOTAGEYEAR FIRST
OPENED TYPE
13 Shirley Park Shopping Center Giant Food, Rinaldi Bowling Alley, Rite Aid 156,619 N/A Community
14 The Village at Shirlington Cineplex Odeon 203,561 1944 Community
15 Bradlee Shopping Center Giant Food, Health Club 179,307 N/A Community
VAN DORN
MAP KEY SHOPPING CENTERS ANCHOR TENANTSSQUARE
FOOTAGEYEAR FIRST
OPENED TYPE
16 Foxchase Shopping Center Harris Teeter, Rite Aid Pharmacy 140,240 1960 Community
17 Plaza at Landmark Bally's Total Fitness, Marshalls, Ross Dress for Less, Shopper's Food Warehouse 443,058 1965 Regional
18 Landmark Mall Hecht's Department Store, Lord & Taylor, Sears 969,989 1965 Regional
19 Van Dorn Plaza CVS, Safeway 119,229 1979 Community
20 Van Dorn Center Giant Food 75,000 N/A Neighborhood
BAILEYS CROSSROADS
MAP KEY SHOPPING CENTERS ANCHOR TENANTSSQUARE
FOOTAGEYEAR FIRST
OPENED TYPE
21 Baileys Crossroads Shopping Center
Best Buy, K&G Menswear, Office Depot, Petco, Pier 1 Imports, Trader Joe's 395,199 1994 Regional
22 Leesburg Pike Plaza No big box anchor tenant 97,888 1965 Neighborhood
Page 9 of 61
comp projects04-12172.00
Printed: 10/30/2008
Exhibit 8
DETAIL OF COMPETITIVE RETAIL CENTERS IN SUBMARKETSPOTOMAC YARD STUDY AREA
OCTOBER 2008
NATIONAL HARBOR AND OXON HILL, MD
MAP KEY SHOPPING CENTERS ANCHOR TENANTSSQUARE
FOOTAGE1YEAR FIRST
OPENED TYPE
23 Eastover Shopping Center Giant Food 348,899 1955 Regional
24 Oxon Hill Plaza A.J. Wright, Shopper's Food Warehouse 143,468 1966 Community
25 Rivertowne Commons AMC Theatres, Big Kmart, CVS, Old Navy Clothing Co., Safeway, Staples Office Supply 380,000 1986 Regional
26 National Harbor No big box anchor tenant 1,000,000 2008 Super Regional
DISTRICT OF COLUMBIA
MAP KEY SHOPPING CENTERS ANCHOR TENANTSSQUARE
FOOTAGEYEAR FIRST
OPENED TYPE
27 Waterfront CVS, Safeway 100,000 1973 Community
28 The Old Post Office Pavilion No big box anchor tenant 101,140 1983 Community
1 Square footage at National Harbor reflects total planned retail space.SOURCE: CoStar/NRB 2006 Shopping Center Directory; RCLCO
Page 10 of 61
comp projects04-12172.00
Printed: 10/30/2008
Exhibit 9
LOCATION OF KEY RETAIL ANCHORSPOTOMAC YARD SITE AND VICINITY
OCTOBER 2008
Walmart
Kohl's
Bed Bath Beyond
Lowes
Staples
Office Depot
Home Depot
Target
Best Buy
Circuit City
Barnes & Noble
Kmart
Borders/Waldenbooks
Linens 'n Things
SOURCE: RCLCO
Page 11 of 61
anchor map04-12172.00
Printed: 10/30/2008
Exhibit 10
LOCATION OF GROCERY STORE ANCHORSPOTOMAC YARD SITE AND VICINITY
OCTOBER 2008
Whole Foods Market
Trader Joe's
Harris Teeter
Safeway
Giant
SOURCE: RCLCO
Page 12 of 61
grocery map04-12172.00
Printed: 10/30/2008
Exhibit 11
MAP OF WHOLE FOODS GROCERY STORESPOTOMAC YARD STUDY AREA
OCTOBER 2008
SOURCE: RCLCO
Page 13 of 61
whole foods04-12172.00
Printed: 10/30/2008
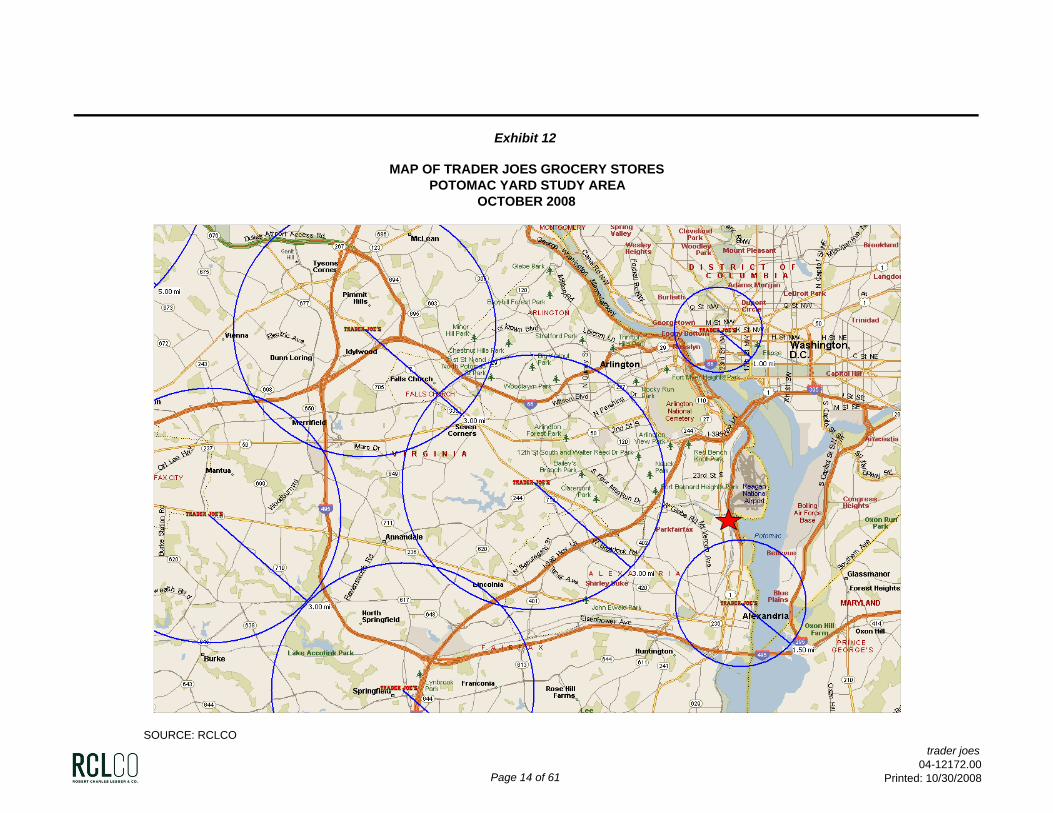
Exhibit 12
MAP OF TRADER JOES GROCERY STORESPOTOMAC YARD STUDY AREA
OCTOBER 2008
SOURCE: RCLCO
Page 14 of 61
trader joes04-12172.00
Printed: 10/30/2008
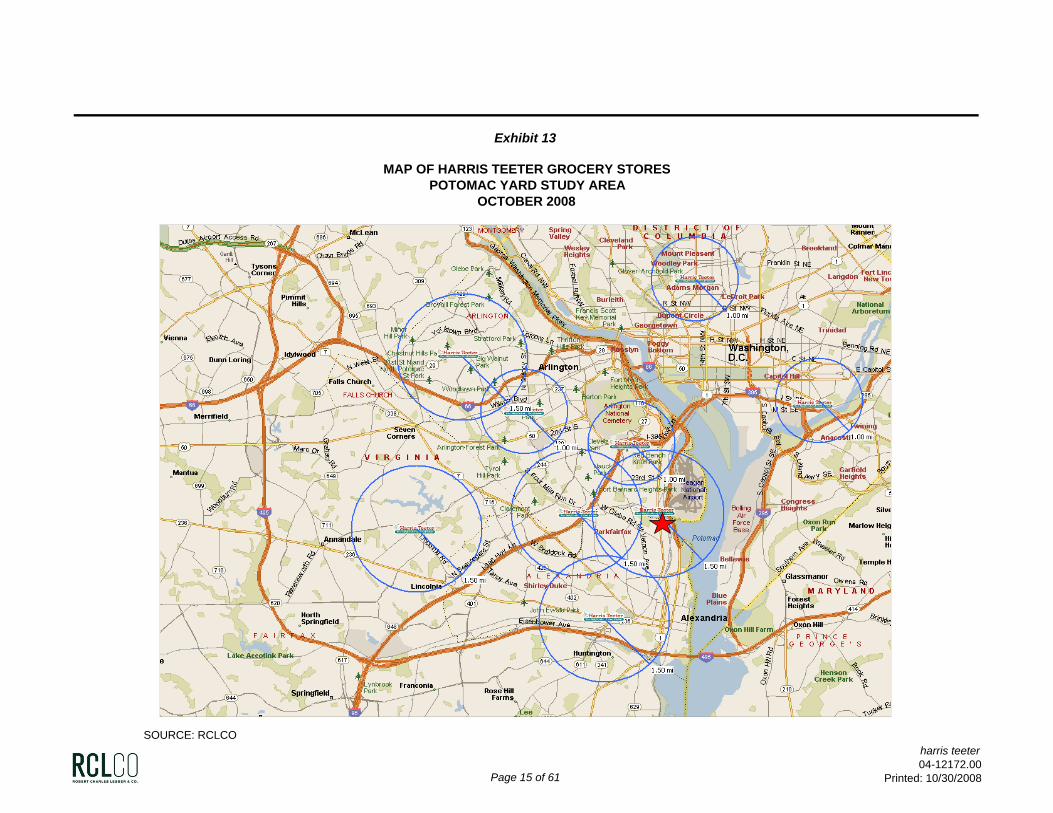
Exhibit 13
MAP OF HARRIS TEETER GROCERY STORESPOTOMAC YARD STUDY AREA
OCTOBER 2008
SOURCE: RCLCO
Page 15 of 61
harris teeter04-12172.00
Printed: 10/30/2008
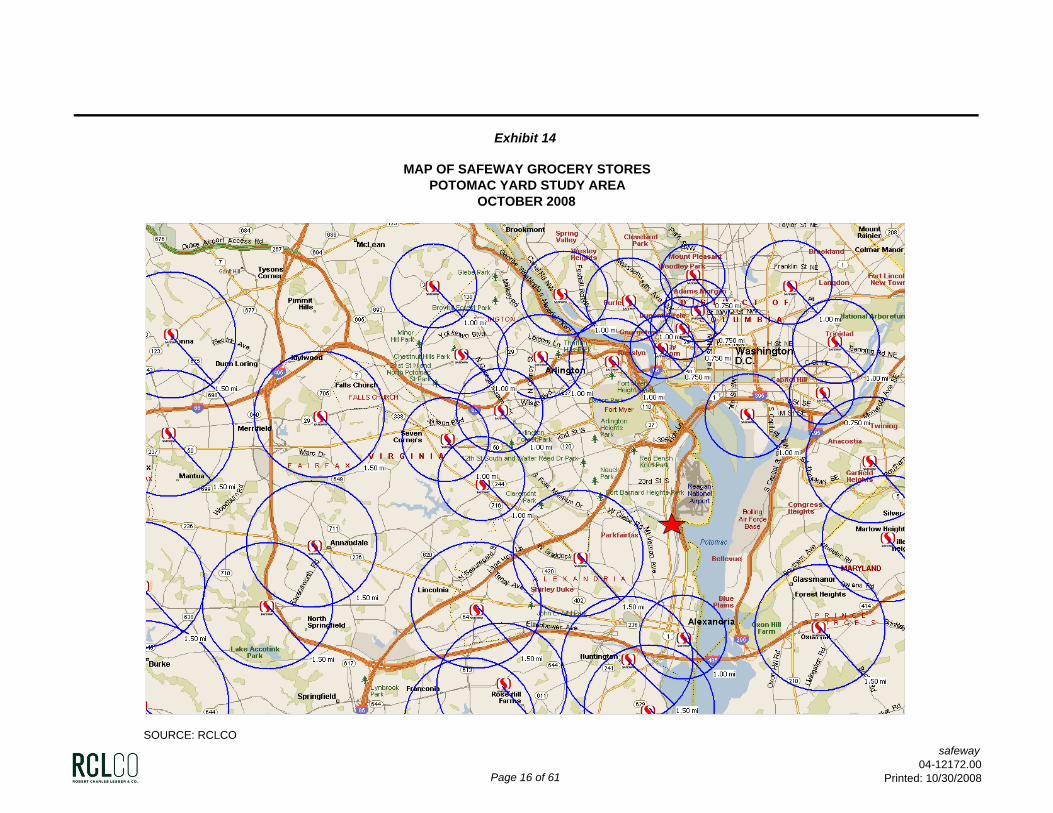
Exhibit 14
MAP OF SAFEWAY GROCERY STORESPOTOMAC YARD STUDY AREA
OCTOBER 2008
SOURCE: RCLCO
Page 16 of 61
safeway04-12172.00
Printed: 10/30/2008
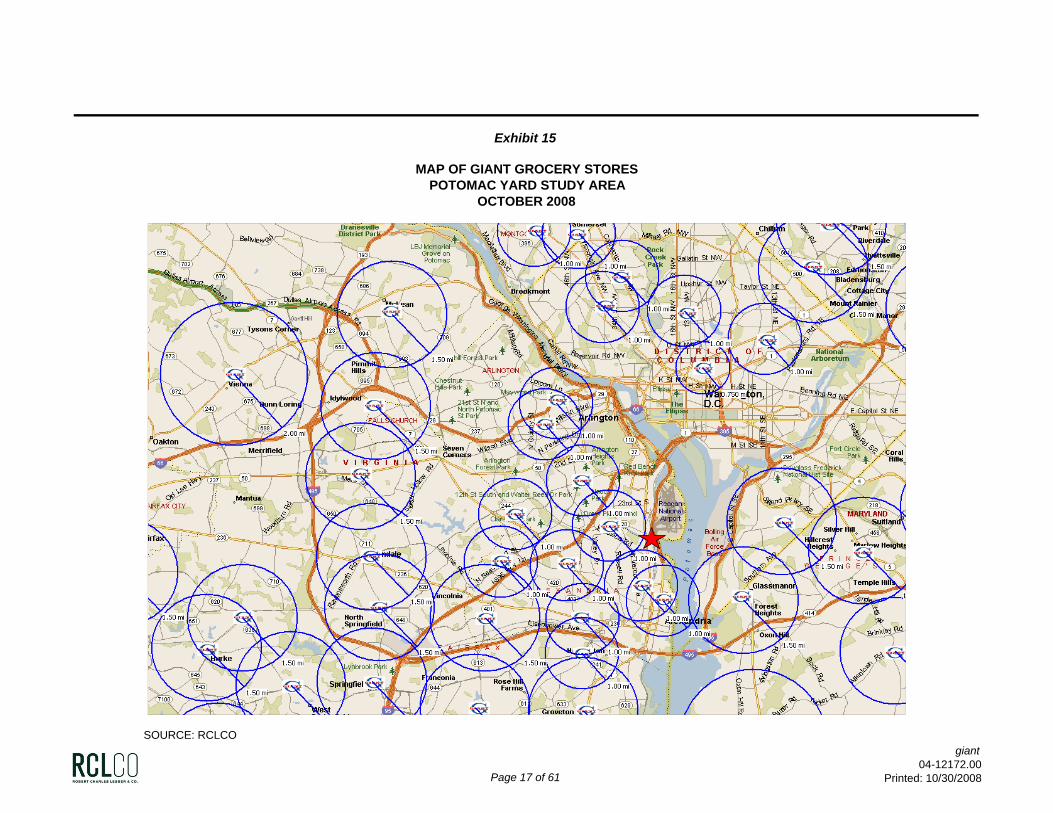
Exhibit 15
MAP OF GIANT GROCERY STORESPOTOMAC YARD STUDY AREA
OCTOBER 2008
SOURCE: RCLCO
Page 17 of 61
giant04-12172.00
Printed: 10/30/2008
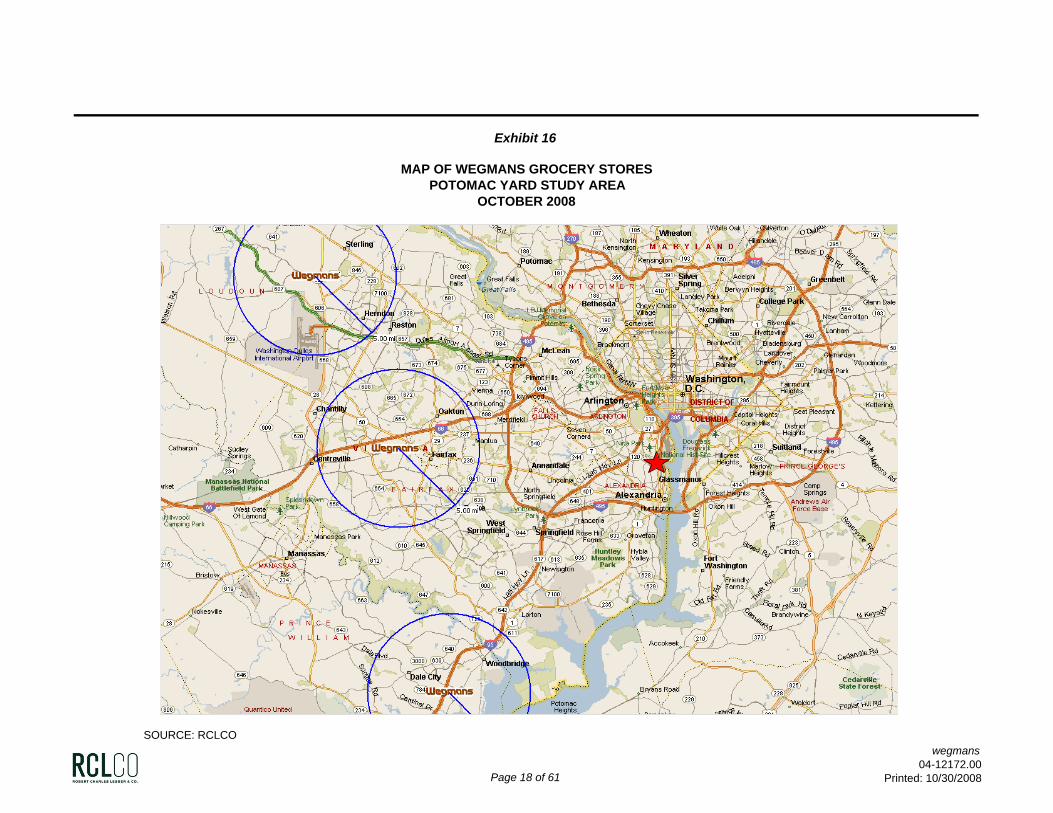
Exhibit 16
MAP OF WEGMANS GROCERY STORESPOTOMAC YARD STUDY AREA
OCTOBER 2008
SOURCE: RCLCO
Page 18 of 61
wegmans04-12172.00
Printed: 10/30/2008
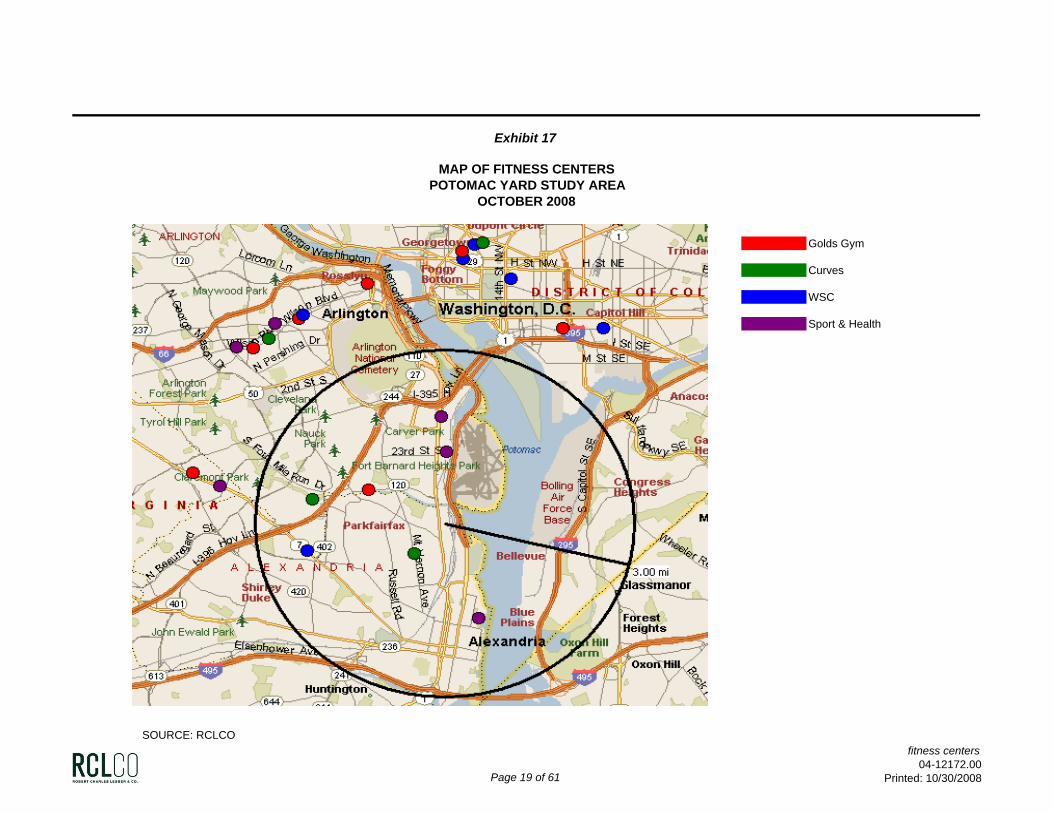
Exhibit 17
MAP OF FITNESS CENTERSPOTOMAC YARD STUDY AREA
OCTOBER 2008
Golds Gym
Curves
WSC
Sport & Health
SOURCE: RCLCO
Page 19 of 61
fitness centers04-12172.00
Printed: 10/30/2008
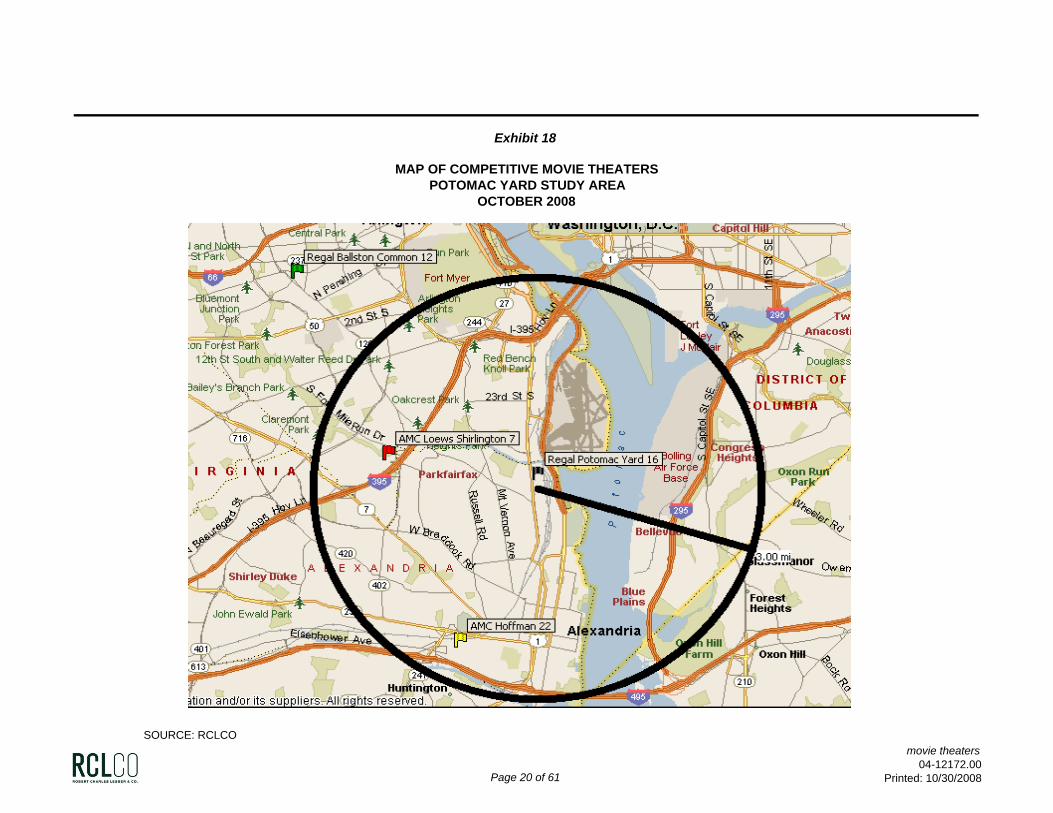
Exhibit 18
MAP OF COMPETITIVE MOVIE THEATERSPOTOMAC YARD STUDY AREA
OCTOBER 2008
SOURCE: RCLCO
Page 20 of 61
movie theaters04-12172.00
Printed: 10/30/2008
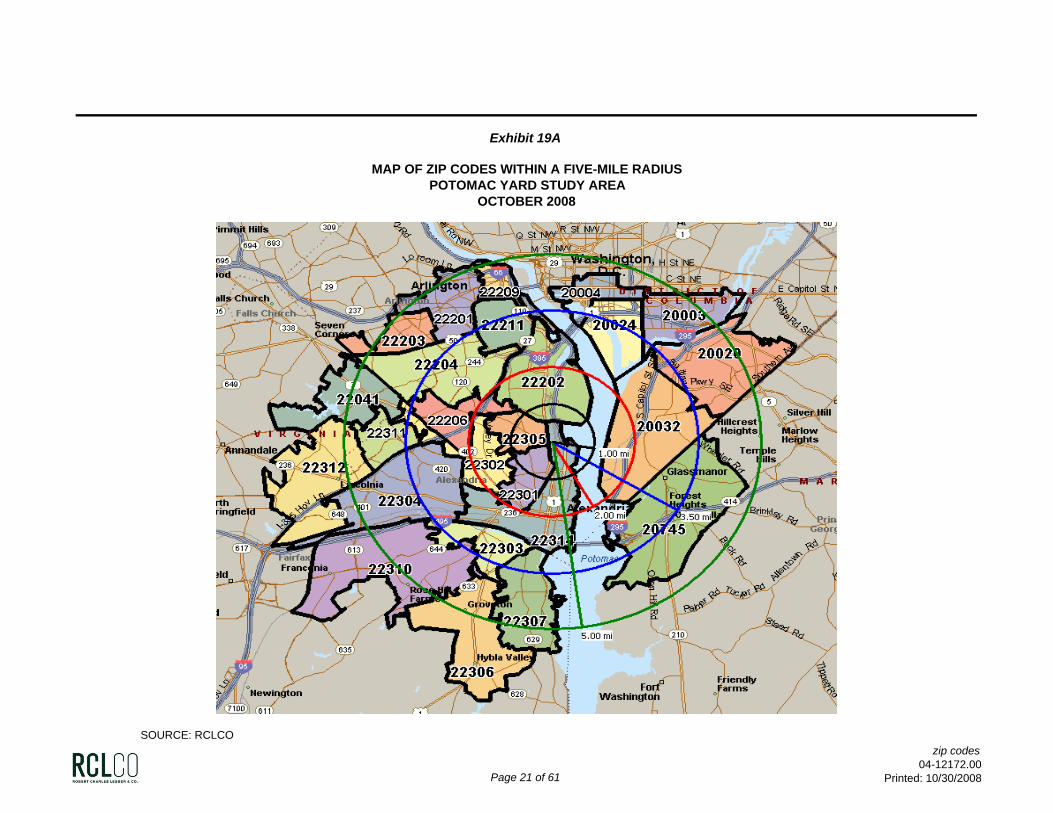
Exhibit 19A
MAP OF ZIP CODES WITHIN A FIVE-MILE RADIUSPOTOMAC YARD STUDY AREA
OCTOBER 2008
SOURCE: RCLCO
Page 21 of 61
zip codes04-12172.00
Printed: 10/30/2008
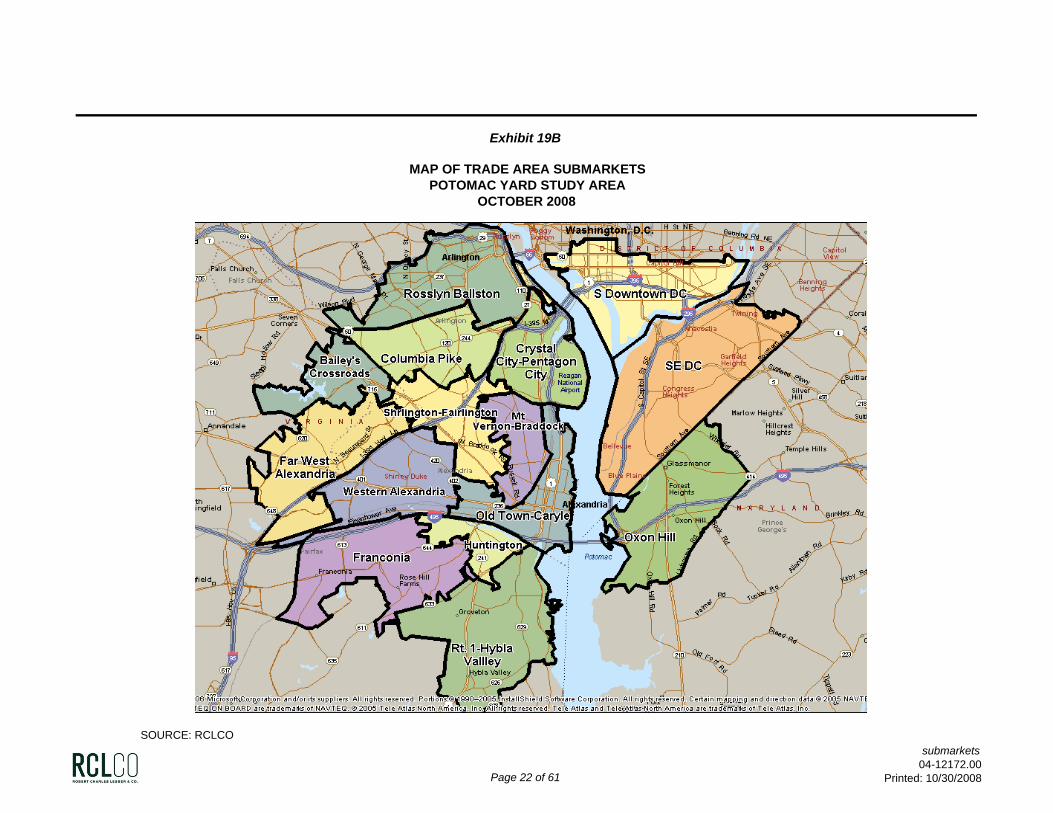
Exhibit 19B
MAP OF TRADE AREA SUBMARKETSPOTOMAC YARD STUDY AREA
OCTOBER 2008
SOURCE: RCLCO
Page 22 of 61
submarkets04-12172.00
Printed: 10/30/2008
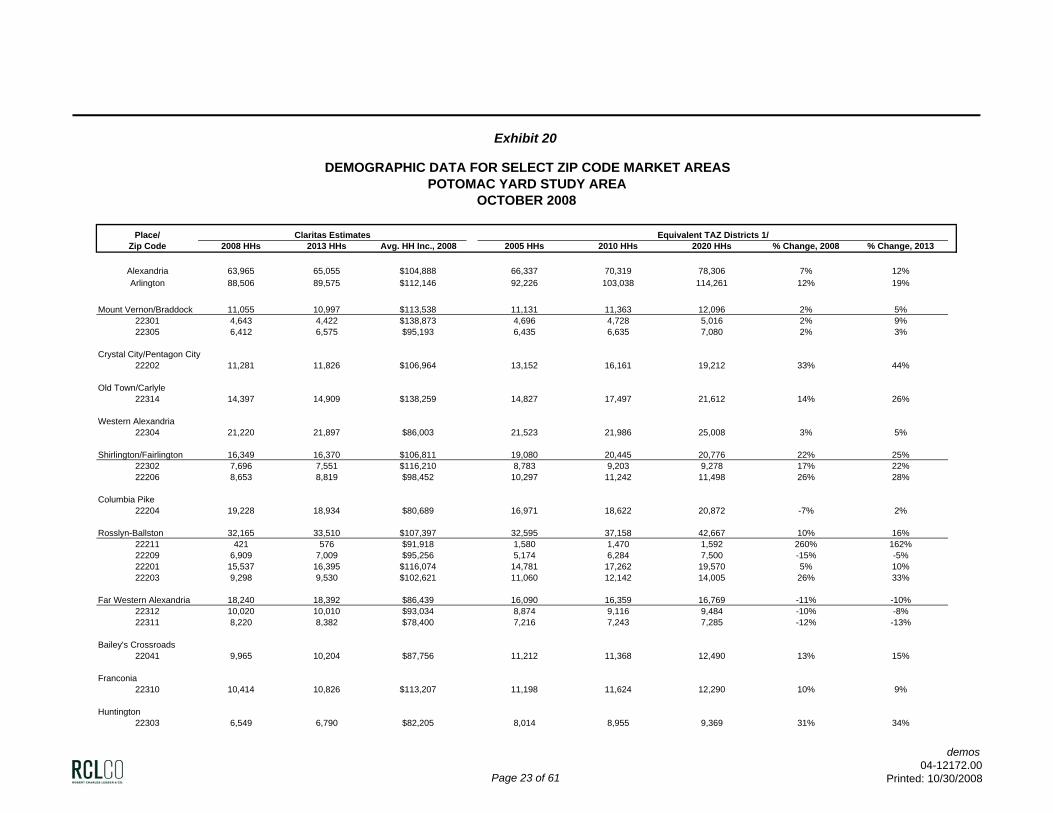
Exhibit 20
DEMOGRAPHIC DATA FOR SELECT ZIP CODE MARKET AREASPOTOMAC YARD STUDY AREA
OCTOBER 2008
Place/ Claritas Estimates Equivalent TAZ Districts 1/Zip Code 2008 HHs 2013 HHs Avg. HH Inc., 2008 2005 HHs 2010 HHs 2020 HHs % Change, 2008 % Change, 2013
Alexandria 63,965 65,055 $104,888 66,337 70,319 78,306 7% 12%Arlington 88,506 89,575 $112,146 92,226 103,038 114,261 12% 19%
Mount Vernon/Braddock 11,055 10,997 $113,538 11,131 11,363 12,096 2% 5%22301 4,643 4,422 $138,873 4,696 4,728 5,016 2% 9%22305 6,412 6,575 $95,193 6,435 6,635 7,080 2% 3%
Crystal City/Pentagon City22202 11,281 11,826 $106,964 13,152 16,161 19,212 33% 44%
Old Town/Carlyle22314 14,397 14,909 $138,259 14,827 17,497 21,612 14% 26%
Western Alexandria22304 21,220 21,897 $86,003 21,523 21,986 25,008 3% 5%
Shirlington/Fairlington 16,349 16,370 $106,811 19,080 20,445 20,776 22% 25%22302 7,696 7,551 $116,210 8,783 9,203 9,278 17% 22%22206 8,653 8,819 $98,452 10,297 11,242 11,498 26% 28%
Columbia Pike22204 19,228 18,934 $80,689 16,971 18,622 20,872 -7% 2%
Rosslyn-Ballston 32,165 33,510 $107,397 32,595 37,158 42,667 10% 16%22211 421 576 $91,918 1,580 1,470 1,592 260% 162%22209 6,909 7,009 $95,256 5,174 6,284 7,500 -15% -5%22201 15,537 16,395 $116,074 14,781 17,262 19,570 5% 10%22203 9,298 9,530 $102,621 11,060 12,142 14,005 26% 33%
Far Western Alexandria 18,240 18,392 $86,439 16,090 16,359 16,769 -11% -10%22312 10,020 10,010 $93,034 8,874 9,116 9,484 -10% -8%22311 8,220 8,382 $78,400 7,216 7,243 7,285 -12% -13%
Bailey's Crossroads22041 9,965 10,204 $87,756 11,212 11,368 12,490 13% 15%
Franconia22310 10,414 10,826 $113,207 11,198 11,624 12,290 10% 9%
Huntington22303 6,549 6,790 $82,205 8,014 8,955 9,369 31% 34%
Page 23 of 61
demos04-12172.00
Printed: 10/30/2008
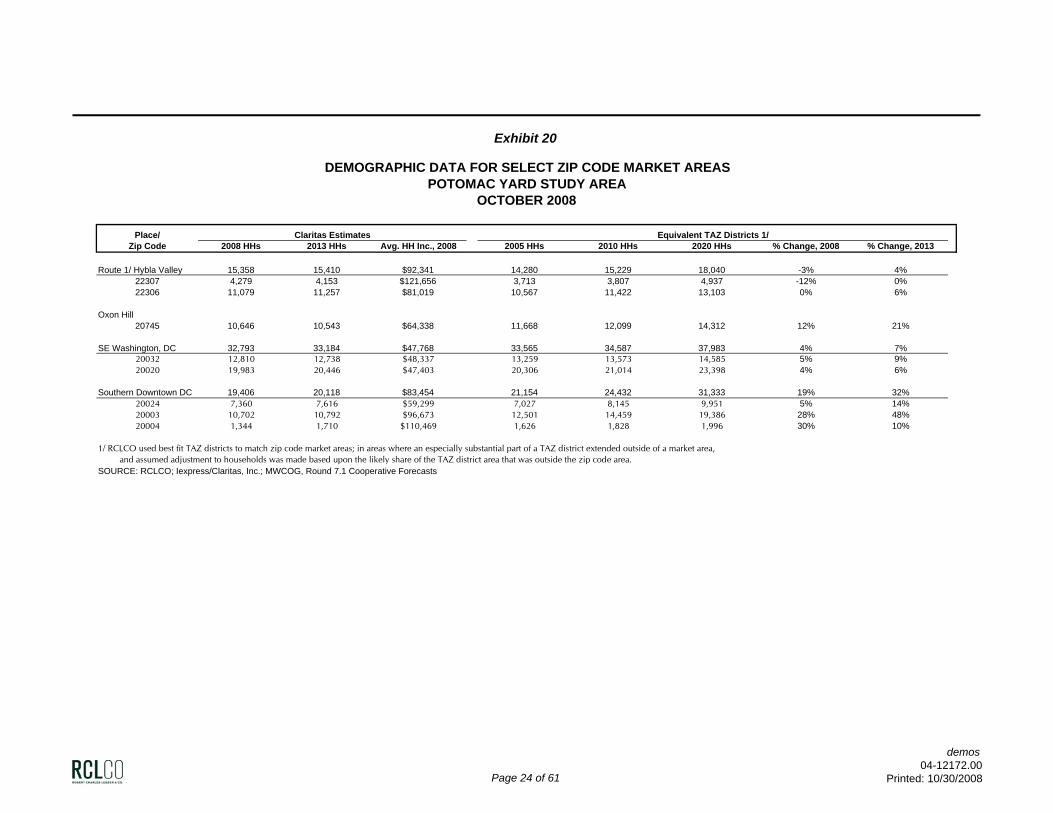
Exhibit 20
DEMOGRAPHIC DATA FOR SELECT ZIP CODE MARKET AREASPOTOMAC YARD STUDY AREA
OCTOBER 2008
Place/ Claritas Estimates Equivalent TAZ Districts 1/Zip Code 2008 HHs 2013 HHs Avg. HH Inc., 2008 2005 HHs 2010 HHs 2020 HHs % Change, 2008 % Change, 2013
Route 1/ Hybla Valley 15,358 15,410 $92,341 14,280 15,229 18,040 -3% 4%22307 4,279 4,153 $121,656 3,713 3,807 4,937 -12% 0%22306 11,079 11,257 $81,019 10,567 11,422 13,103 0% 6%
Oxon Hill20745 10,646 10,543 $64,338 11,668 12,099 14,312 12% 21%
SE Washington, DC 32,793 33,184 $47,768 33,565 34,587 37,983 4% 7%20032 12,810 12,738 $48,337 13,259 13,573 14,585 5% 9%20020 19,983 20,446 $47,403 20,306 21,014 23,398 4% 6%
Southern Downtown DC 19,406 20,118 $83,454 21,154 24,432 31,333 19% 32%20024 7,360 7,616 $59,299 7,027 8,145 9,951 5% 14%20003 10,702 10,792 $96,673 12,501 14,459 19,386 28% 48%20004 1,344 1,710 $110,469 1,626 1,828 1,996 30% 10%
1/ RCLCO used best fit TAZ districts to match zip code market areas; in areas where an especially substantial part of a TAZ district extended outside of a market area,and assumed adjustment to households was made based upon the likely share of the TAZ district area that was outside the zip code area.
SOURCE: RCLCO; Iexpress/Claritas, Inc.; MWCOG, Round 7.1 Cooperative Forecasts
Page 24 of 61
demos04-12172.00
Printed: 10/30/2008
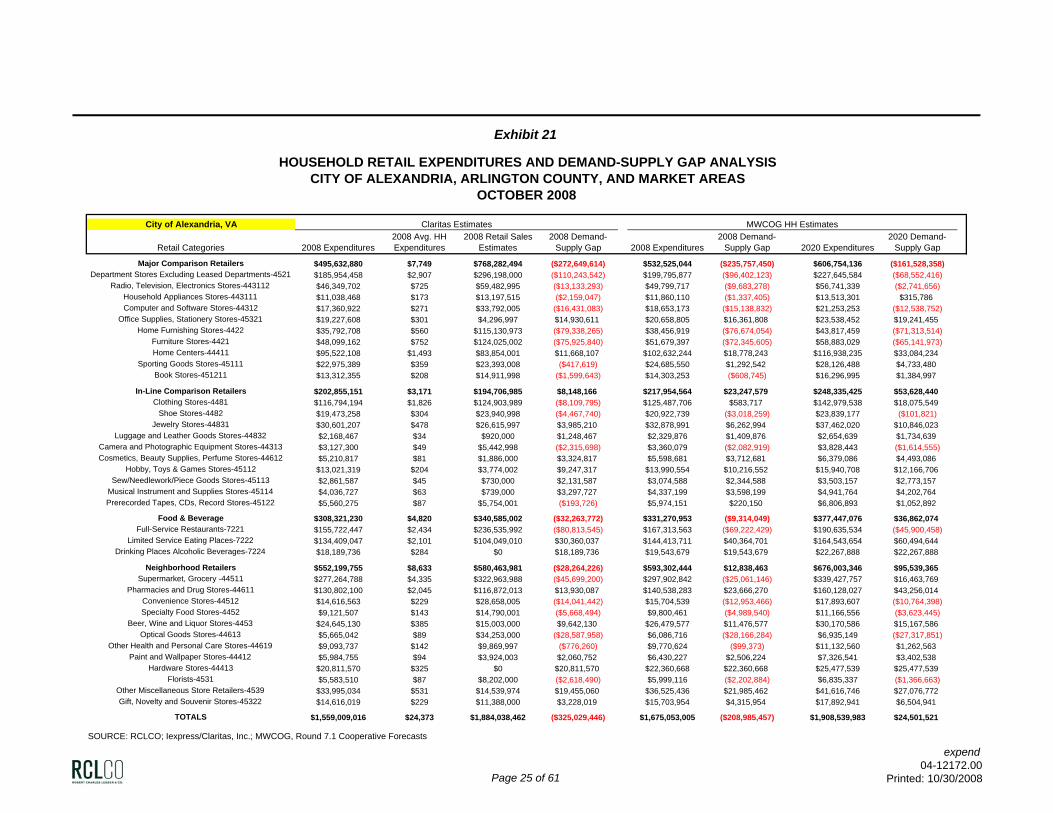
Exhibit 21
HOUSEHOLD RETAIL EXPENDITURES AND DEMAND-SUPPLY GAP ANALYSISCITY OF ALEXANDRIA, ARLINGTON COUNTY, AND MARKET AREAS
OCTOBER 2008
City of Alexandria, VA Claritas Estimates MWCOG HH Estimates
Retail Categories 2008 Expenditures2008 Avg. HH Expenditures
2008 Retail Sales Estimates
2008 Demand-Supply Gap 2008 Expenditures
2008 Demand-Supply Gap 2020 Expenditures
2020 Demand-Supply Gap
Major Comparison Retailers $495,632,880 $7,749 $768,282,494 ($272,649,614) $532,525,044 ($235,757,450) $606,754,136 ($161,528,358)Department Stores Excluding Leased Departments-4521 $185,954,458 $2,907 $296,198,000 ($110,243,542) $199,795,877 ($96,402,123) $227,645,584 ($68,552,416)
Radio, Television, Electronics Stores-443112 $46,349,702 $725 $59,482,995 ($13,133,293) $49,799,717 ($9,683,278) $56,741,339 ($2,741,656)Household Appliances Stores-443111 $11,038,468 $173 $13,197,515 ($2,159,047) $11,860,110 ($1,337,405) $13,513,301 $315,786Computer and Software Stores-44312 $17,360,922 $271 $33,792,005 ($16,431,083) $18,653,173 ($15,138,832) $21,253,253 ($12,538,752)
Office Supplies, Stationery Stores-45321 $19,227,608 $301 $4,296,997 $14,930,611 $20,658,805 $16,361,808 $23,538,452 $19,241,455Home Furnishing Stores-4422 $35,792,708 $560 $115,130,973 ($79,338,265) $38,456,919 ($76,674,054) $43,817,459 ($71,313,514)
Furniture Stores-4421 $48,099,162 $752 $124,025,002 ($75,925,840) $51,679,397 ($72,345,605) $58,883,029 ($65,141,973)Home Centers-44411 $95,522,108 $1,493 $83,854,001 $11,668,107 $102,632,244 $18,778,243 $116,938,235 $33,084,234
Sporting Goods Stores-45111 $22,975,389 $359 $23,393,008 ($417,619) $24,685,550 $1,292,542 $28,126,488 $4,733,480Book Stores-451211 $13,312,355 $208 $14,911,998 ($1,599,643) $14,303,253 ($608,745) $16,296,995 $1,384,997
In-Line Comparison Retailers $202,855,151 $3,171 $194,706,985 $8,148,166 $217,954,564 $23,247,579 $248,335,425 $53,628,440Clothing Stores-4481 $116,794,194 $1,826 $124,903,989 ($8,109,795) $125,487,706 $583,717 $142,979,538 $18,075,549
Shoe Stores-4482 $19,473,258 $304 $23,940,998 ($4,467,740) $20,922,739 ($3,018,259) $23,839,177 ($101,821)Jewelry Stores-44831 $30,601,207 $478 $26,615,997 $3,985,210 $32,878,991 $6,262,994 $37,462,020 $10,846,023
Luggage and Leather Goods Stores-44832 $2,168,467 $34 $920,000 $1,248,467 $2,329,876 $1,409,876 $2,654,639 $1,734,639Camera and Photographic Equipment Stores-44313 $3,127,300 $49 $5,442,998 ($2,315,698) $3,360,079 ($2,082,919) $3,828,443 ($1,614,555)Cosmetics, Beauty Supplies, Perfume Stores-44612 $5,210,817 $81 $1,886,000 $3,324,817 $5,598,681 $3,712,681 $6,379,086 $4,493,086
Hobby, Toys & Games Stores-45112 $13,021,319 $204 $3,774,002 $9,247,317 $13,990,554 $10,216,552 $15,940,708 $12,166,706Sew/Needlework/Piece Goods Stores-45113 $2,861,587 $45 $730,000 $2,131,587 $3,074,588 $2,344,588 $3,503,157 $2,773,157
Musical Instrument and Supplies Stores-45114 $4,036,727 $63 $739,000 $3,297,727 $4,337,199 $3,598,199 $4,941,764 $4,202,764Prerecorded Tapes, CDs, Record Stores-45122 $5,560,275 $87 $5,754,001 ($193,726) $5,974,151 $220,150 $6,806,893 $1,052,892
Food & Beverage $308,321,230 $4,820 $340,585,002 ($32,263,772) $331,270,953 ($9,314,049) $377,447,076 $36,862,074Full-Service Restaurants-7221 $155,722,447 $2,434 $236,535,992 ($80,813,545) $167,313,563 ($69,222,429) $190,635,534 ($45,900,458)
Limited Service Eating Places-7222 $134,409,047 $2,101 $104,049,010 $30,360,037 $144,413,711 $40,364,701 $164,543,654 $60,494,644Drinking Places Alcoholic Beverages-7224 $18,189,736 $284 $0 $18,189,736 $19,543,679 $19,543,679 $22,267,888 $22,267,888
Neighborhood Retailers $552,199,755 $8,633 $580,463,981 ($28,264,226) $593,302,444 $12,838,463 $676,003,346 $95,539,365Supermarket, Grocery -44511 $277,264,788 $4,335 $322,963,988 ($45,699,200) $297,902,842 ($25,061,146) $339,427,757 $16,463,769
Pharmacies and Drug Stores-44611 $130,802,100 $2,045 $116,872,013 $13,930,087 $140,538,283 $23,666,270 $160,128,027 $43,256,014Convenience Stores-44512 $14,616,563 $229 $28,658,005 ($14,041,442) $15,704,539 ($12,953,466) $17,893,607 ($10,764,398)Specialty Food Stores-4452 $9,121,507 $143 $14,790,001 ($5,668,494) $9,800,461 ($4,989,540) $11,166,556 ($3,623,445)
Beer, Wine and Liquor Stores-4453 $24,645,130 $385 $15,003,000 $9,642,130 $26,479,577 $11,476,577 $30,170,586 $15,167,586Optical Goods Stores-44613 $5,665,042 $89 $34,253,000 ($28,587,958) $6,086,716 ($28,166,284) $6,935,149 ($27,317,851)
Other Health and Personal Care Stores-44619 $9,093,737 $142 $9,869,997 ($776,260) $9,770,624 ($99,373) $11,132,560 $1,262,563Paint and Wallpaper Stores-44412 $5,984,755 $94 $3,924,003 $2,060,752 $6,430,227 $2,506,224 $7,326,541 $3,402,538
Hardware Stores-44413 $20,811,570 $325 $0 $20,811,570 $22,360,668 $22,360,668 $25,477,539 $25,477,539Florists-4531 $5,583,510 $87 $8,202,000 ($2,618,490) $5,999,116 ($2,202,884) $6,835,337 ($1,366,663)
Other Miscellaneous Store Retailers-4539 $33,995,034 $531 $14,539,974 $19,455,060 $36,525,436 $21,985,462 $41,616,746 $27,076,772Gift, Novelty and Souvenir Stores-45322 $14,616,019 $229 $11,388,000 $3,228,019 $15,703,954 $4,315,954 $17,892,941 $6,504,941
TOTALS $1,559,009,016 $24,373 $1,884,038,462 ($325,029,446) $1,675,053,005 ($208,985,457) $1,908,539,983 $24,501,521
SOURCE: RCLCO; Iexpress/Claritas, Inc.; MWCOG, Round 7.1 Cooperative Forecasts
Page 25 of 61
expend04-12172.00
Printed: 10/30/2008
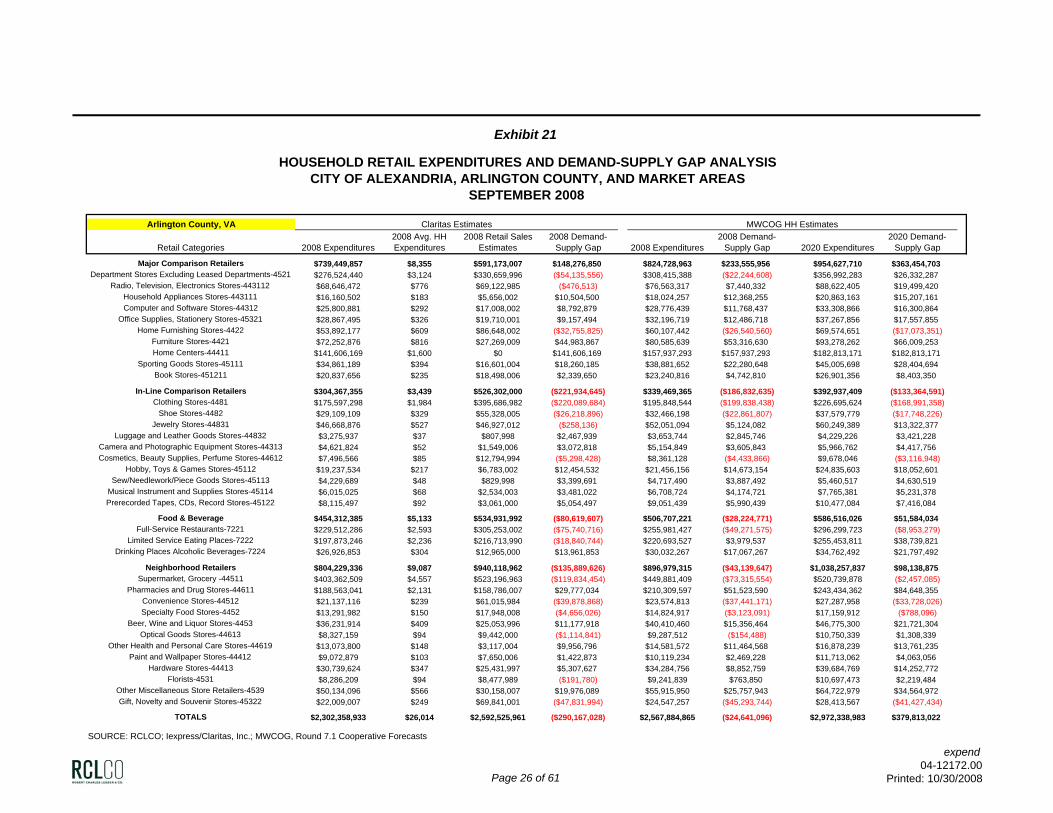
Exhibit 21
HOUSEHOLD RETAIL EXPENDITURES AND DEMAND-SUPPLY GAP ANALYSISCITY OF ALEXANDRIA, ARLINGTON COUNTY, AND MARKET AREAS
SEPTEMBER 2008
Arlington County, VA Claritas Estimates MWCOG HH Estimates
Retail Categories 2008 Expenditures2008 Avg. HH Expenditures
2008 Retail Sales Estimates
2008 Demand-Supply Gap 2008 Expenditures
2008 Demand-Supply Gap 2020 Expenditures
2020 Demand-Supply Gap
Major Comparison Retailers $739,449,857 $8,355 $591,173,007 $148,276,850 $824,728,963 $233,555,956 $954,627,710 $363,454,703Department Stores Excluding Leased Departments-4521 $276,524,440 $3,124 $330,659,996 ($54,135,556) $308,415,388 ($22,244,608) $356,992,283 $26,332,287
Radio, Television, Electronics Stores-443112 $68,646,472 $776 $69,122,985 ($476,513) $76,563,317 $7,440,332 $88,622,405 $19,499,420Household Appliances Stores-443111 $16,160,502 $183 $5,656,002 $10,504,500 $18,024,257 $12,368,255 $20,863,163 $15,207,161Computer and Software Stores-44312 $25,800,881 $292 $17,008,002 $8,792,879 $28,776,439 $11,768,437 $33,308,866 $16,300,864
Office Supplies, Stationery Stores-45321 $28,867,495 $326 $19,710,001 $9,157,494 $32,196,719 $12,486,718 $37,267,856 $17,557,855Home Furnishing Stores-4422 $53,892,177 $609 $86,648,002 ($32,755,825) $60,107,442 ($26,540,560) $69,574,651 ($17,073,351)
Furniture Stores-4421 $72,252,876 $816 $27,269,009 $44,983,867 $80,585,639 $53,316,630 $93,278,262 $66,009,253Home Centers-44411 $141,606,169 $1,600 $0 $141,606,169 $157,937,293 $157,937,293 $182,813,171 $182,813,171
Sporting Goods Stores-45111 $34,861,189 $394 $16,601,004 $18,260,185 $38,881,652 $22,280,648 $45,005,698 $28,404,694Book Stores-451211 $20,837,656 $235 $18,498,006 $2,339,650 $23,240,816 $4,742,810 $26,901,356 $8,403,350
In-Line Comparison Retailers $304,367,355 $3,439 $526,302,000 ($221,934,645) $339,469,365 ($186,832,635) $392,937,409 ($133,364,591)Clothing Stores-4481 $175,597,298 $1,984 $395,686,982 ($220,089,684) $195,848,544 ($199,838,438) $226,695,624 ($168,991,358)
Shoe Stores-4482 $29,109,109 $329 $55,328,005 ($26,218,896) $32,466,198 ($22,861,807) $37,579,779 ($17,748,226)Jewelry Stores-44831 $46,668,876 $527 $46,927,012 ($258,136) $52,051,094 $5,124,082 $60,249,389 $13,322,377
Luggage and Leather Goods Stores-44832 $3,275,937 $37 $807,998 $2,467,939 $3,653,744 $2,845,746 $4,229,226 $3,421,228Camera and Photographic Equipment Stores-44313 $4,621,824 $52 $1,549,006 $3,072,818 $5,154,849 $3,605,843 $5,966,762 $4,417,756Cosmetics, Beauty Supplies, Perfume Stores-44612 $7,496,566 $85 $12,794,994 ($5,298,428) $8,361,128 ($4,433,866) $9,678,046 ($3,116,948)
Hobby, Toys & Games Stores-45112 $19,237,534 $217 $6,783,002 $12,454,532 $21,456,156 $14,673,154 $24,835,603 $18,052,601Sew/Needlework/Piece Goods Stores-45113 $4,229,689 $48 $829,998 $3,399,691 $4,717,490 $3,887,492 $5,460,517 $4,630,519
Musical Instrument and Supplies Stores-45114 $6,015,025 $68 $2,534,003 $3,481,022 $6,708,724 $4,174,721 $7,765,381 $5,231,378Prerecorded Tapes, CDs, Record Stores-45122 $8,115,497 $92 $3,061,000 $5,054,497 $9,051,439 $5,990,439 $10,477,084 $7,416,084
Food & Beverage $454,312,385 $5,133 $534,931,992 ($80,619,607) $506,707,221 ($28,224,771) $586,516,026 $51,584,034Full-Service Restaurants-7221 $229,512,286 $2,593 $305,253,002 ($75,740,716) $255,981,427 ($49,271,575) $296,299,723 ($8,953,279)
Limited Service Eating Places-7222 $197,873,246 $2,236 $216,713,990 ($18,840,744) $220,693,527 $3,979,537 $255,453,811 $38,739,821Drinking Places Alcoholic Beverages-7224 $26,926,853 $304 $12,965,000 $13,961,853 $30,032,267 $17,067,267 $34,762,492 $21,797,492
Neighborhood Retailers $804,229,336 $9,087 $940,118,962 ($135,889,626) $896,979,315 ($43,139,647) $1,038,257,837 $98,138,875Supermarket, Grocery -44511 $403,362,509 $4,557 $523,196,963 ($119,834,454) $449,881,409 ($73,315,554) $520,739,878 ($2,457,085)
Pharmacies and Drug Stores-44611 $188,563,041 $2,131 $158,786,007 $29,777,034 $210,309,597 $51,523,590 $243,434,362 $84,648,355Convenience Stores-44512 $21,137,116 $239 $61,015,984 ($39,878,868) $23,574,813 ($37,441,171) $27,287,958 ($33,728,026)Specialty Food Stores-4452 $13,291,982 $150 $17,948,008 ($4,656,026) $14,824,917 ($3,123,091) $17,159,912 ($788,096)
Beer, Wine and Liquor Stores-4453 $36,231,914 $409 $25,053,996 $11,177,918 $40,410,460 $15,356,464 $46,775,300 $21,721,304Optical Goods Stores-44613 $8,327,159 $94 $9,442,000 ($1,114,841) $9,287,512 ($154,488) $10,750,339 $1,308,339
Other Health and Personal Care Stores-44619 $13,073,800 $148 $3,117,004 $9,956,796 $14,581,572 $11,464,568 $16,878,239 $13,761,235Paint and Wallpaper Stores-44412 $9,072,879 $103 $7,650,006 $1,422,873 $10,119,234 $2,469,228 $11,713,062 $4,063,056
Hardware Stores-44413 $30,739,624 $347 $25,431,997 $5,307,627 $34,284,756 $8,852,759 $39,684,769 $14,252,772Florists-4531 $8,286,209 $94 $8,477,989 ($191,780) $9,241,839 $763,850 $10,697,473 $2,219,484
Other Miscellaneous Store Retailers-4539 $50,134,096 $566 $30,158,007 $19,976,089 $55,915,950 $25,757,943 $64,722,979 $34,564,972Gift, Novelty and Souvenir Stores-45322 $22,009,007 $249 $69,841,001 ($47,831,994) $24,547,257 ($45,293,744) $28,413,567 ($41,427,434)
TOTALS $2,302,358,933 $26,014 $2,592,525,961 ($290,167,028) $2,567,884,865 ($24,641,096) $2,972,338,983 $379,813,022
SOURCE: RCLCO; Iexpress/Claritas, Inc.; MWCOG, Round 7.1 Cooperative Forecasts
Page 26 of 61
expend04-12172.00
Printed: 10/30/2008
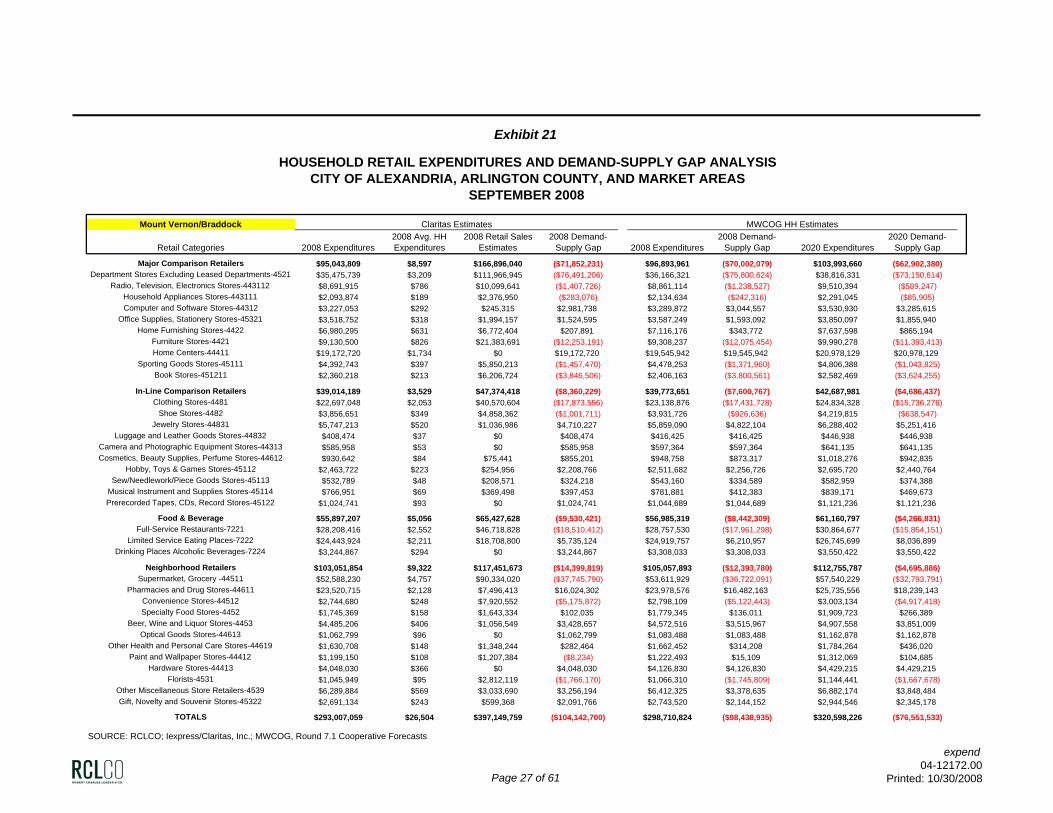
Exhibit 21
HOUSEHOLD RETAIL EXPENDITURES AND DEMAND-SUPPLY GAP ANALYSISCITY OF ALEXANDRIA, ARLINGTON COUNTY, AND MARKET AREAS
SEPTEMBER 2008
Mount Vernon/Braddock Claritas Estimates MWCOG HH Estimates
Retail Categories 2008 Expenditures2008 Avg. HH Expenditures
2008 Retail Sales Estimates
2008 Demand-Supply Gap 2008 Expenditures
2008 Demand-Supply Gap 2020 Expenditures
2020 Demand-Supply Gap
Major Comparison Retailers $95,043,809 $8,597 $166,896,040 ($71,852,231) $96,893,961 ($70,002,079) $103,993,660 ($62,902,380)Department Stores Excluding Leased Departments-4521 $35,475,739 $3,209 $111,966,945 ($76,491,206) $36,166,321 ($75,800,624) $38,816,331 ($73,150,614)
Radio, Television, Electronics Stores-443112 $8,691,915 $786 $10,099,641 ($1,407,726) $8,861,114 ($1,238,527) $9,510,394 ($589,247)Household Appliances Stores-443111 $2,093,874 $189 $2,376,950 ($283,076) $2,134,634 ($242,316) $2,291,045 ($85,905)Computer and Software Stores-44312 $3,227,053 $292 $245,315 $2,981,738 $3,289,872 $3,044,557 $3,530,930 $3,285,615
Office Supplies, Stationery Stores-45321 $3,518,752 $318 $1,994,157 $1,524,595 $3,587,249 $1,593,092 $3,850,097 $1,855,940Home Furnishing Stores-4422 $6,980,295 $631 $6,772,404 $207,891 $7,116,176 $343,772 $7,637,598 $865,194
Furniture Stores-4421 $9,130,500 $826 $21,383,691 ($12,253,191) $9,308,237 ($12,075,454) $9,990,278 ($11,393,413)Home Centers-44411 $19,172,720 $1,734 $0 $19,172,720 $19,545,942 $19,545,942 $20,978,129 $20,978,129
Sporting Goods Stores-45111 $4,392,743 $397 $5,850,213 ($1,457,470) $4,478,253 ($1,371,960) $4,806,388 ($1,043,825)Book Stores-451211 $2,360,218 $213 $6,206,724 ($3,846,506) $2,406,163 ($3,800,561) $2,582,469 ($3,624,255)
In-Line Comparison Retailers $39,014,189 $3,529 $47,374,418 ($8,360,229) $39,773,651 ($7,600,767) $42,687,981 ($4,686,437)Clothing Stores-4481 $22,697,048 $2,053 $40,570,604 ($17,873,556) $23,138,876 ($17,431,728) $24,834,328 ($15,736,276)
Shoe Stores-4482 $3,856,651 $349 $4,858,362 ($1,001,711) $3,931,726 ($926,636) $4,219,815 ($638,547)Jewelry Stores-44831 $5,747,213 $520 $1,036,986 $4,710,227 $5,859,090 $4,822,104 $6,288,402 $5,251,416
Luggage and Leather Goods Stores-44832 $408,474 $37 $0 $408,474 $416,425 $416,425 $446,938 $446,938Camera and Photographic Equipment Stores-44313 $585,958 $53 $0 $585,958 $597,364 $597,364 $641,135 $641,135Cosmetics, Beauty Supplies, Perfume Stores-44612 $930,642 $84 $75,441 $855,201 $948,758 $873,317 $1,018,276 $942,835
Hobby, Toys & Games Stores-45112 $2,463,722 $223 $254,956 $2,208,766 $2,511,682 $2,256,726 $2,695,720 $2,440,764Sew/Needlework/Piece Goods Stores-45113 $532,789 $48 $208,571 $324,218 $543,160 $334,589 $582,959 $374,388
Musical Instrument and Supplies Stores-45114 $766,951 $69 $369,498 $397,453 $781,881 $412,383 $839,171 $469,673Prerecorded Tapes, CDs, Record Stores-45122 $1,024,741 $93 $0 $1,024,741 $1,044,689 $1,044,689 $1,121,236 $1,121,236
Food & Beverage $55,897,207 $5,056 $65,427,628 ($9,530,421) $56,985,319 ($8,442,309) $61,160,797 ($4,266,831)Full-Service Restaurants-7221 $28,208,416 $2,552 $46,718,828 ($18,510,412) $28,757,530 ($17,961,298) $30,864,677 ($15,854,151)
Limited Service Eating Places-7222 $24,443,924 $2,211 $18,708,800 $5,735,124 $24,919,757 $6,210,957 $26,745,699 $8,036,899Drinking Places Alcoholic Beverages-7224 $3,244,867 $294 $0 $3,244,867 $3,308,033 $3,308,033 $3,550,422 $3,550,422
Neighborhood Retailers $103,051,854 $9,322 $117,451,673 ($14,399,819) $105,057,893 ($12,393,780) $112,755,787 ($4,695,886)Supermarket, Grocery -44511 $52,588,230 $4,757 $90,334,020 ($37,745,790) $53,611,929 ($36,722,091) $57,540,229 ($32,793,791)
Pharmacies and Drug Stores-44611 $23,520,715 $2,128 $7,496,413 $16,024,302 $23,978,576 $16,482,163 $25,735,556 $18,239,143Convenience Stores-44512 $2,744,680 $248 $7,920,552 ($5,175,872) $2,798,109 ($5,122,443) $3,003,134 ($4,917,418)Specialty Food Stores-4452 $1,745,369 $158 $1,643,334 $102,035 $1,779,345 $136,011 $1,909,723 $266,389
Beer, Wine and Liquor Stores-4453 $4,485,206 $406 $1,056,549 $3,428,657 $4,572,516 $3,515,967 $4,907,558 $3,851,009Optical Goods Stores-44613 $1,062,799 $96 $0 $1,062,799 $1,083,488 $1,083,488 $1,162,878 $1,162,878
Other Health and Personal Care Stores-44619 $1,630,708 $148 $1,348,244 $282,464 $1,662,452 $314,208 $1,784,264 $436,020Paint and Wallpaper Stores-44412 $1,199,150 $108 $1,207,384 ($8,234) $1,222,493 $15,109 $1,312,069 $104,685
Hardware Stores-44413 $4,048,030 $366 $0 $4,048,030 $4,126,830 $4,126,830 $4,429,215 $4,429,215Florists-4531 $1,045,949 $95 $2,812,119 ($1,766,170) $1,066,310 ($1,745,809) $1,144,441 ($1,667,678)
Other Miscellaneous Store Retailers-4539 $6,289,884 $569 $3,033,690 $3,256,194 $6,412,325 $3,378,635 $6,882,174 $3,848,484Gift, Novelty and Souvenir Stores-45322 $2,691,134 $243 $599,368 $2,091,766 $2,743,520 $2,144,152 $2,944,546 $2,345,178
TOTALS $293,007,059 $26,504 $397,149,759 ($104,142,700) $298,710,824 ($98,438,935) $320,598,226 ($76,551,533)
SOURCE: RCLCO; Iexpress/Claritas, Inc.; MWCOG, Round 7.1 Cooperative Forecasts
Page 27 of 61
expend04-12172.00
Printed: 10/30/2008
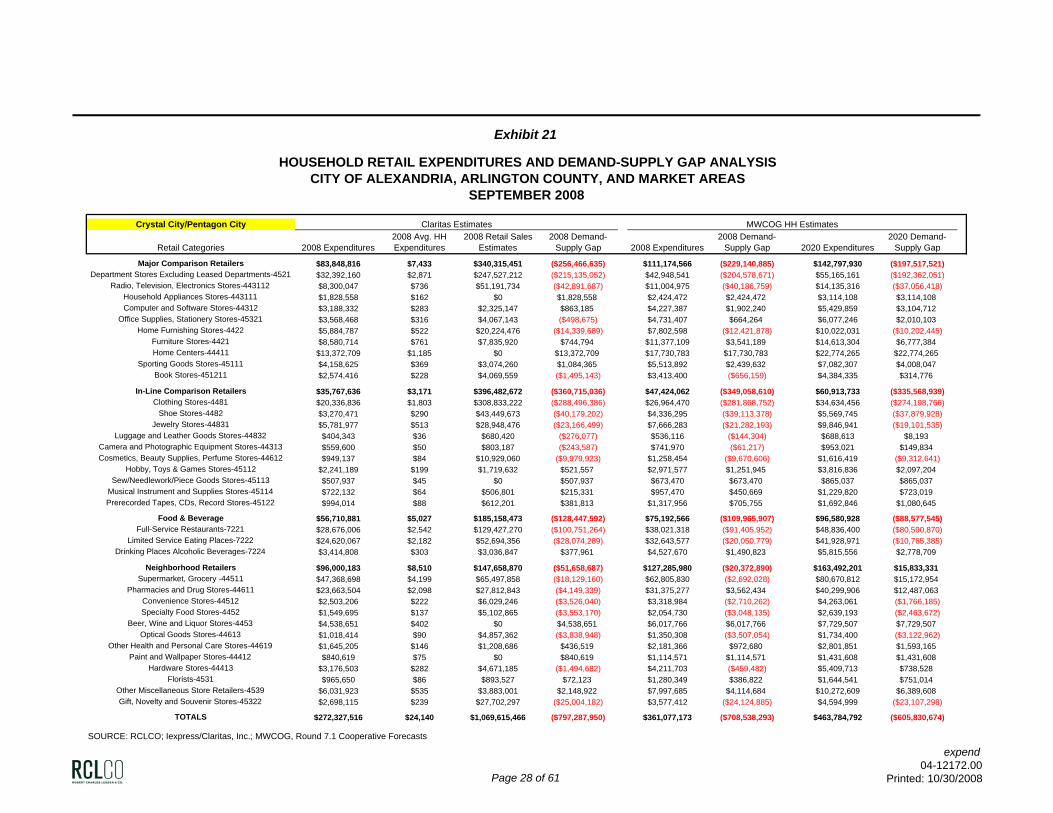
Exhibit 21
HOUSEHOLD RETAIL EXPENDITURES AND DEMAND-SUPPLY GAP ANALYSISCITY OF ALEXANDRIA, ARLINGTON COUNTY, AND MARKET AREAS
SEPTEMBER 2008
Crystal City/Pentagon City Claritas Estimates MWCOG HH Estimates
Retail Categories 2008 Expenditures2008 Avg. HH Expenditures
2008 Retail Sales Estimates
2008 Demand-Supply Gap 2008 Expenditures
2008 Demand-Supply Gap 2020 Expenditures
2020 Demand-Supply Gap
Major Comparison Retailers $83,848,816 $7,433 $340,315,451 ($256,466,635) $111,174,566 ($229,140,885) $142,797,930 ($197,517,521)Department Stores Excluding Leased Departments-4521 $32,392,160 $2,871 $247,527,212 ($215,135,052) $42,948,541 ($204,578,671) $55,165,161 ($192,362,051)
Radio, Television, Electronics Stores-443112 $8,300,047 $736 $51,191,734 ($42,891,687) $11,004,975 ($40,186,759) $14,135,316 ($37,056,418)Household Appliances Stores-443111 $1,828,558 $162 $0 $1,828,558 $2,424,472 $2,424,472 $3,114,108 $3,114,108Computer and Software Stores-44312 $3,188,332 $283 $2,325,147 $863,185 $4,227,387 $1,902,240 $5,429,859 $3,104,712
Office Supplies, Stationery Stores-45321 $3,568,468 $316 $4,067,143 ($498,675) $4,731,407 $664,264 $6,077,246 $2,010,103Home Furnishing Stores-4422 $5,884,787 $522 $20,224,476 ($14,339,689) $7,802,598 ($12,421,878) $10,022,031 ($10,202,445)
Furniture Stores-4421 $8,580,714 $761 $7,835,920 $744,794 $11,377,109 $3,541,189 $14,613,304 $6,777,384Home Centers-44411 $13,372,709 $1,185 $0 $13,372,709 $17,730,783 $17,730,783 $22,774,265 $22,774,265
Sporting Goods Stores-45111 $4,158,625 $369 $3,074,260 $1,084,365 $5,513,892 $2,439,632 $7,082,307 $4,008,047Book Stores-451211 $2,574,416 $228 $4,069,559 ($1,495,143) $3,413,400 ($656,159) $4,384,335 $314,776
In-Line Comparison Retailers $35,767,636 $3,171 $396,482,672 ($360,715,036) $47,424,062 ($349,058,610) $60,913,733 ($335,568,939)Clothing Stores-4481 $20,336,836 $1,803 $308,833,222 ($288,496,386) $26,964,470 ($281,868,752) $34,634,456 ($274,198,766)
Shoe Stores-4482 $3,270,471 $290 $43,449,673 ($40,179,202) $4,336,295 ($39,113,378) $5,569,745 ($37,879,928)Jewelry Stores-44831 $5,781,977 $513 $28,948,476 ($23,166,499) $7,666,283 ($21,282,193) $9,846,941 ($19,101,535)
Luggage and Leather Goods Stores-44832 $404,343 $36 $680,420 ($276,077) $536,116 ($144,304) $688,613 $8,193Camera and Photographic Equipment Stores-44313 $559,600 $50 $803,187 ($243,587) $741,970 ($61,217) $953,021 $149,834Cosmetics, Beauty Supplies, Perfume Stores-44612 $949,137 $84 $10,929,060 ($9,979,923) $1,258,454 ($9,670,606) $1,616,419 ($9,312,641)
Hobby, Toys & Games Stores-45112 $2,241,189 $199 $1,719,632 $521,557 $2,971,577 $1,251,945 $3,816,836 $2,097,204Sew/Needlework/Piece Goods Stores-45113 $507,937 $45 $0 $507,937 $673,470 $673,470 $865,037 $865,037
Musical Instrument and Supplies Stores-45114 $722,132 $64 $506,801 $215,331 $957,470 $450,669 $1,229,820 $723,019Prerecorded Tapes, CDs, Record Stores-45122 $994,014 $88 $612,201 $381,813 $1,317,956 $705,755 $1,692,846 $1,080,645
Food & Beverage $56,710,881 $5,027 $185,158,473 ($128,447,592) $75,192,566 ($109,965,907) $96,580,928 ($88,577,545)Full-Service Restaurants-7221 $28,676,006 $2,542 $129,427,270 ($100,751,264) $38,021,318 ($91,405,952) $48,836,400 ($80,590,870)
Limited Service Eating Places-7222 $24,620,067 $2,182 $52,694,356 ($28,074,289) $32,643,577 ($20,050,779) $41,928,971 ($10,765,385)Drinking Places Alcoholic Beverages-7224 $3,414,808 $303 $3,036,847 $377,961 $4,527,670 $1,490,823 $5,815,556 $2,778,709
Neighborhood Retailers $96,000,183 $8,510 $147,658,870 ($51,658,687) $127,285,980 ($20,372,890) $163,492,201 $15,833,331Supermarket, Grocery -44511 $47,368,698 $4,199 $65,497,858 ($18,129,160) $62,805,830 ($2,692,028) $80,670,812 $15,172,954
Pharmacies and Drug Stores-44611 $23,663,504 $2,098 $27,812,843 ($4,149,339) $31,375,277 $3,562,434 $40,299,906 $12,487,063Convenience Stores-44512 $2,503,206 $222 $6,029,246 ($3,526,040) $3,318,984 ($2,710,262) $4,263,061 ($1,766,185)Specialty Food Stores-4452 $1,549,695 $137 $5,102,865 ($3,553,170) $2,054,730 ($3,048,135) $2,639,193 ($2,463,672)
Beer, Wine and Liquor Stores-4453 $4,538,651 $402 $0 $4,538,651 $6,017,766 $6,017,766 $7,729,507 $7,729,507Optical Goods Stores-44613 $1,018,414 $90 $4,857,362 ($3,838,948) $1,350,308 ($3,507,054) $1,734,400 ($3,122,962)
Other Health and Personal Care Stores-44619 $1,645,205 $146 $1,208,686 $436,519 $2,181,366 $972,680 $2,801,851 $1,593,165Paint and Wallpaper Stores-44412 $840,619 $75 $0 $840,619 $1,114,571 $1,114,571 $1,431,608 $1,431,608
Hardware Stores-44413 $3,176,503 $282 $4,671,185 ($1,494,682) $4,211,703 ($459,482) $5,409,713 $738,528Florists-4531 $965,650 $86 $893,527 $72,123 $1,280,349 $386,822 $1,644,541 $751,014
Other Miscellaneous Store Retailers-4539 $6,031,923 $535 $3,883,001 $2,148,922 $7,997,685 $4,114,684 $10,272,609 $6,389,608Gift, Novelty and Souvenir Stores-45322 $2,698,115 $239 $27,702,297 ($25,004,182) $3,577,412 ($24,124,885) $4,594,999 ($23,107,298)
TOTALS $272,327,516 $24,140 $1,069,615,466 ($797,287,950) $361,077,173 ($708,538,293) $463,784,792 ($605,830,674)
SOURCE: RCLCO; Iexpress/Claritas, Inc.; MWCOG, Round 7.1 Cooperative Forecasts
Page 28 of 61
expend04-12172.00
Printed: 10/30/2008
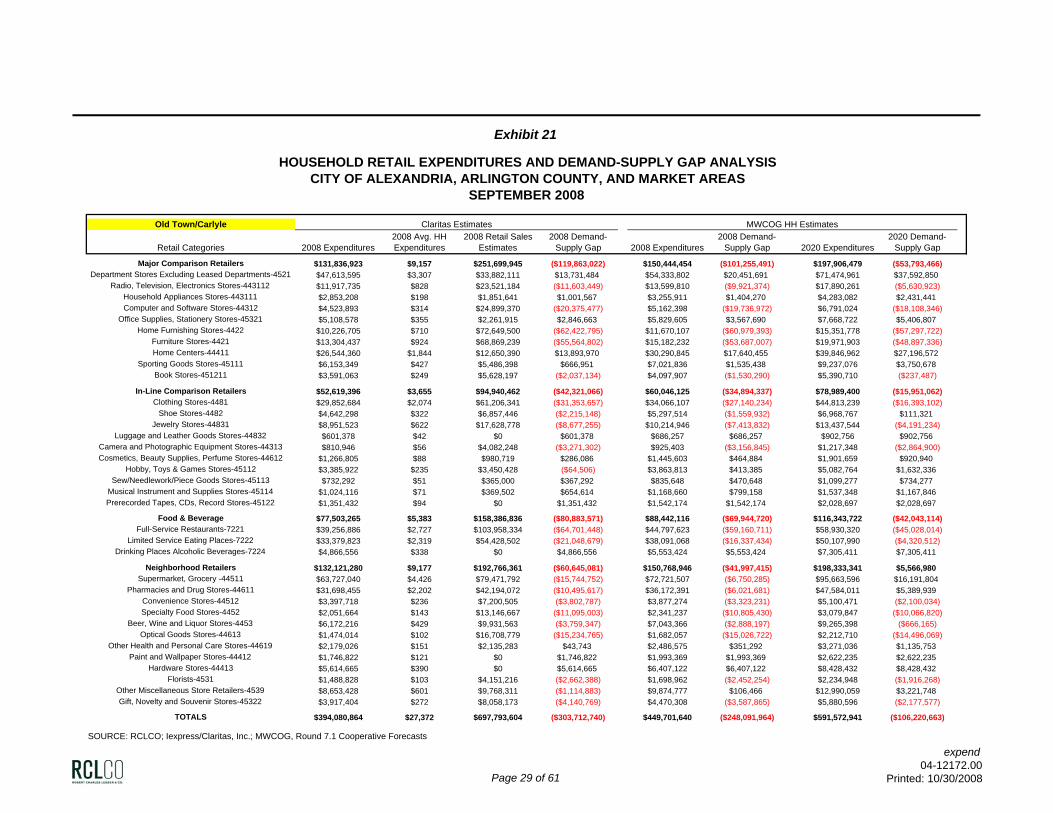
Exhibit 21
HOUSEHOLD RETAIL EXPENDITURES AND DEMAND-SUPPLY GAP ANALYSISCITY OF ALEXANDRIA, ARLINGTON COUNTY, AND MARKET AREAS
SEPTEMBER 2008
Old Town/Carlyle Claritas Estimates MWCOG HH Estimates
Retail Categories 2008 Expenditures2008 Avg. HH Expenditures
2008 Retail Sales Estimates
2008 Demand-Supply Gap 2008 Expenditures
2008 Demand-Supply Gap 2020 Expenditures
2020 Demand-Supply Gap
Major Comparison Retailers $131,836,923 $9,157 $251,699,945 ($119,863,022) $150,444,454 ($101,255,491) $197,906,479 ($53,793,466)Department Stores Excluding Leased Departments-4521 $47,613,595 $3,307 $33,882,111 $13,731,484 $54,333,802 $20,451,691 $71,474,961 $37,592,850
Radio, Television, Electronics Stores-443112 $11,917,735 $828 $23,521,184 ($11,603,449) $13,599,810 ($9,921,374) $17,890,261 ($5,630,923)Household Appliances Stores-443111 $2,853,208 $198 $1,851,641 $1,001,567 $3,255,911 $1,404,270 $4,283,082 $2,431,441Computer and Software Stores-44312 $4,523,893 $314 $24,899,370 ($20,375,477) $5,162,398 ($19,736,972) $6,791,024 ($18,108,346)
Office Supplies, Stationery Stores-45321 $5,108,578 $355 $2,261,915 $2,846,663 $5,829,605 $3,567,690 $7,668,722 $5,406,807Home Furnishing Stores-4422 $10,226,705 $710 $72,649,500 ($62,422,795) $11,670,107 ($60,979,393) $15,351,778 ($57,297,722)
Furniture Stores-4421 $13,304,437 $924 $68,869,239 ($55,564,802) $15,182,232 ($53,687,007) $19,971,903 ($48,897,336)Home Centers-44411 $26,544,360 $1,844 $12,650,390 $13,893,970 $30,290,845 $17,640,455 $39,846,962 $27,196,572
Sporting Goods Stores-45111 $6,153,349 $427 $5,486,398 $666,951 $7,021,836 $1,535,438 $9,237,076 $3,750,678Book Stores-451211 $3,591,063 $249 $5,628,197 ($2,037,134) $4,097,907 ($1,530,290) $5,390,710 ($237,487)
In-Line Comparison Retailers $52,619,396 $3,655 $94,940,462 ($42,321,066) $60,046,125 ($34,894,337) $78,989,400 ($15,951,062)Clothing Stores-4481 $29,852,684 $2,074 $61,206,341 ($31,353,657) $34,066,107 ($27,140,234) $44,813,239 ($16,393,102)
Shoe Stores-4482 $4,642,298 $322 $6,857,446 ($2,215,148) $5,297,514 ($1,559,932) $6,968,767 $111,321Jewelry Stores-44831 $8,951,523 $622 $17,628,778 ($8,677,255) $10,214,946 ($7,413,832) $13,437,544 ($4,191,234)
Luggage and Leather Goods Stores-44832 $601,378 $42 $0 $601,378 $686,257 $686,257 $902,756 $902,756Camera and Photographic Equipment Stores-44313 $810,946 $56 $4,082,248 ($3,271,302) $925,403 ($3,156,845) $1,217,348 ($2,864,900)Cosmetics, Beauty Supplies, Perfume Stores-44612 $1,266,805 $88 $980,719 $286,086 $1,445,603 $464,884 $1,901,659 $920,940
Hobby, Toys & Games Stores-45112 $3,385,922 $235 $3,450,428 ($64,506) $3,863,813 $413,385 $5,082,764 $1,632,336Sew/Needlework/Piece Goods Stores-45113 $732,292 $51 $365,000 $367,292 $835,648 $470,648 $1,099,277 $734,277
Musical Instrument and Supplies Stores-45114 $1,024,116 $71 $369,502 $654,614 $1,168,660 $799,158 $1,537,348 $1,167,846Prerecorded Tapes, CDs, Record Stores-45122 $1,351,432 $94 $0 $1,351,432 $1,542,174 $1,542,174 $2,028,697 $2,028,697
Food & Beverage $77,503,265 $5,383 $158,386,836 ($80,883,571) $88,442,116 ($69,944,720) $116,343,722 ($42,043,114)Full-Service Restaurants-7221 $39,256,886 $2,727 $103,958,334 ($64,701,448) $44,797,623 ($59,160,711) $58,930,320 ($45,028,014)
Limited Service Eating Places-7222 $33,379,823 $2,319 $54,428,502 ($21,048,679) $38,091,068 ($16,337,434) $50,107,990 ($4,320,512)Drinking Places Alcoholic Beverages-7224 $4,866,556 $338 $0 $4,866,556 $5,553,424 $5,553,424 $7,305,411 $7,305,411
Neighborhood Retailers $132,121,280 $9,177 $192,766,361 ($60,645,081) $150,768,946 ($41,997,415) $198,333,341 $5,566,980Supermarket, Grocery -44511 $63,727,040 $4,426 $79,471,792 ($15,744,752) $72,721,507 ($6,750,285) $95,663,596 $16,191,804
Pharmacies and Drug Stores-44611 $31,698,455 $2,202 $42,194,072 ($10,495,617) $36,172,391 ($6,021,681) $47,584,011 $5,389,939Convenience Stores-44512 $3,397,718 $236 $7,200,505 ($3,802,787) $3,877,274 ($3,323,231) $5,100,471 ($2,100,034)Specialty Food Stores-4452 $2,051,664 $143 $13,146,667 ($11,095,003) $2,341,237 ($10,805,430) $3,079,847 ($10,066,820)
Beer, Wine and Liquor Stores-4453 $6,172,216 $429 $9,931,563 ($3,759,347) $7,043,366 ($2,888,197) $9,265,398 ($666,165)Optical Goods Stores-44613 $1,474,014 $102 $16,708,779 ($15,234,765) $1,682,057 ($15,026,722) $2,212,710 ($14,496,069)
Other Health and Personal Care Stores-44619 $2,179,026 $151 $2,135,283 $43,743 $2,486,575 $351,292 $3,271,036 $1,135,753Paint and Wallpaper Stores-44412 $1,746,822 $121 $0 $1,746,822 $1,993,369 $1,993,369 $2,622,235 $2,622,235
Hardware Stores-44413 $5,614,665 $390 $0 $5,614,665 $6,407,122 $6,407,122 $8,428,432 $8,428,432Florists-4531 $1,488,828 $103 $4,151,216 ($2,662,388) $1,698,962 ($2,452,254) $2,234,948 ($1,916,268)
Other Miscellaneous Store Retailers-4539 $8,653,428 $601 $9,768,311 ($1,114,883) $9,874,777 $106,466 $12,990,059 $3,221,748Gift, Novelty and Souvenir Stores-45322 $3,917,404 $272 $8,058,173 ($4,140,769) $4,470,308 ($3,587,865) $5,880,596 ($2,177,577)
TOTALS $394,080,864 $27,372 $697,793,604 ($303,712,740) $449,701,640 ($248,091,964) $591,572,941 ($106,220,663)
SOURCE: RCLCO; Iexpress/Claritas, Inc.; MWCOG, Round 7.1 Cooperative Forecasts
Page 29 of 61
expend04-12172.00
Printed: 10/30/2008
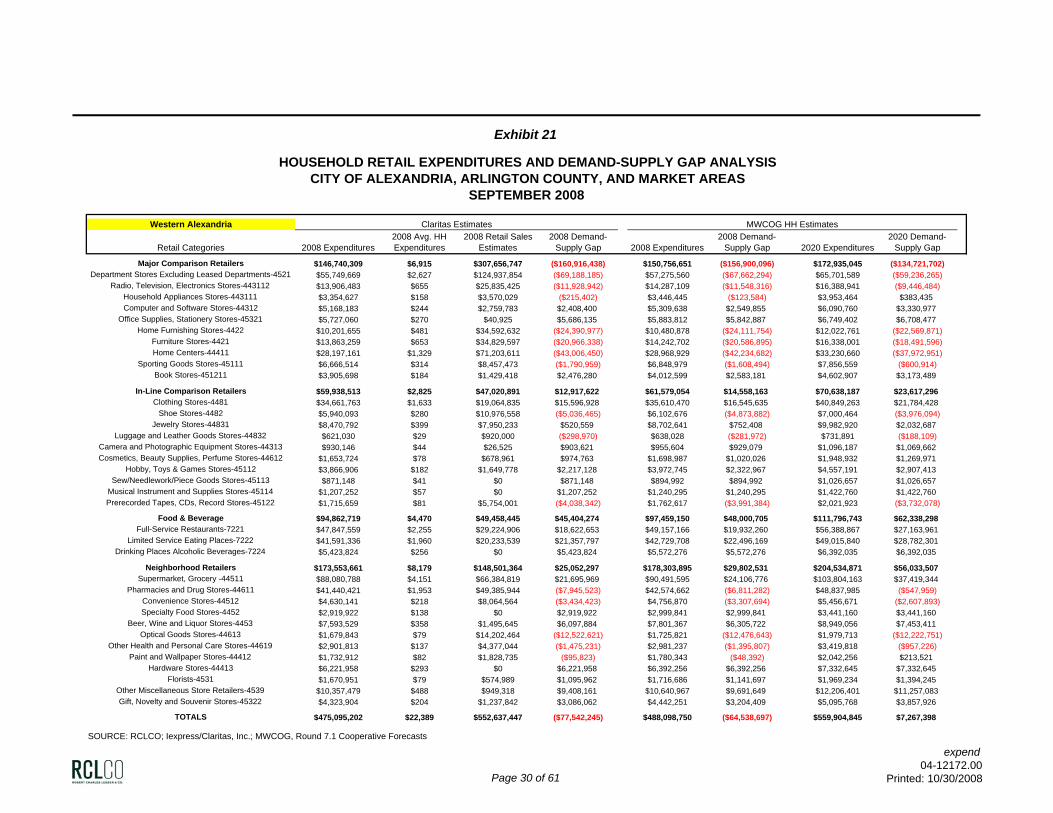
Exhibit 21
HOUSEHOLD RETAIL EXPENDITURES AND DEMAND-SUPPLY GAP ANALYSISCITY OF ALEXANDRIA, ARLINGTON COUNTY, AND MARKET AREAS
SEPTEMBER 2008
Western Alexandria Claritas Estimates MWCOG HH Estimates
Retail Categories 2008 Expenditures2008 Avg. HH Expenditures
2008 Retail Sales Estimates
2008 Demand-Supply Gap 2008 Expenditures
2008 Demand-Supply Gap 2020 Expenditures
2020 Demand-Supply Gap
Major Comparison Retailers $146,740,309 $6,915 $307,656,747 ($160,916,438) $150,756,651 ($156,900,096) $172,935,045 ($134,721,702)Department Stores Excluding Leased Departments-4521 $55,749,669 $2,627 $124,937,854 ($69,188,185) $57,275,560 ($67,662,294) $65,701,589 ($59,236,265)
Radio, Television, Electronics Stores-443112 $13,906,483 $655 $25,835,425 ($11,928,942) $14,287,109 ($11,548,316) $16,388,941 ($9,446,484)Household Appliances Stores-443111 $3,354,627 $158 $3,570,029 ($215,402) $3,446,445 ($123,584) $3,953,464 $383,435Computer and Software Stores-44312 $5,168,183 $244 $2,759,783 $2,408,400 $5,309,638 $2,549,855 $6,090,760 $3,330,977
Office Supplies, Stationery Stores-45321 $5,727,060 $270 $40,925 $5,686,135 $5,883,812 $5,842,887 $6,749,402 $6,708,477Home Furnishing Stores-4422 $10,201,655 $481 $34,592,632 ($24,390,977) $10,480,878 ($24,111,754) $12,022,761 ($22,569,871)
Furniture Stores-4421 $13,863,259 $653 $34,829,597 ($20,966,338) $14,242,702 ($20,586,895) $16,338,001 ($18,491,596)Home Centers-44411 $28,197,161 $1,329 $71,203,611 ($43,006,450) $28,968,929 ($42,234,682) $33,230,660 ($37,972,951)
Sporting Goods Stores-45111 $6,666,514 $314 $8,457,473 ($1,790,959) $6,848,979 ($1,608,494) $7,856,559 ($600,914)Book Stores-451211 $3,905,698 $184 $1,429,418 $2,476,280 $4,012,599 $2,583,181 $4,602,907 $3,173,489
In-Line Comparison Retailers $59,938,513 $2,825 $47,020,891 $12,917,622 $61,579,054 $14,558,163 $70,638,187 $23,617,296Clothing Stores-4481 $34,661,763 $1,633 $19,064,835 $15,596,928 $35,610,470 $16,545,635 $40,849,263 $21,784,428
Shoe Stores-4482 $5,940,093 $280 $10,976,558 ($5,036,465) $6,102,676 ($4,873,882) $7,000,464 ($3,976,094)Jewelry Stores-44831 $8,470,792 $399 $7,950,233 $520,559 $8,702,641 $752,408 $9,982,920 $2,032,687
Luggage and Leather Goods Stores-44832 $621,030 $29 $920,000 ($298,970) $638,028 ($281,972) $731,891 ($188,109)Camera and Photographic Equipment Stores-44313 $930,146 $44 $26,525 $903,621 $955,604 $929,079 $1,096,187 $1,069,662Cosmetics, Beauty Supplies, Perfume Stores-44612 $1,653,724 $78 $678,961 $974,763 $1,698,987 $1,020,026 $1,948,932 $1,269,971
Hobby, Toys & Games Stores-45112 $3,866,906 $182 $1,649,778 $2,217,128 $3,972,745 $2,322,967 $4,557,191 $2,907,413Sew/Needlework/Piece Goods Stores-45113 $871,148 $41 $0 $871,148 $894,992 $894,992 $1,026,657 $1,026,657
Musical Instrument and Supplies Stores-45114 $1,207,252 $57 $0 $1,207,252 $1,240,295 $1,240,295 $1,422,760 $1,422,760Prerecorded Tapes, CDs, Record Stores-45122 $1,715,659 $81 $5,754,001 ($4,038,342) $1,762,617 ($3,991,384) $2,021,923 ($3,732,078)
Food & Beverage $94,862,719 $4,470 $49,458,445 $45,404,274 $97,459,150 $48,000,705 $111,796,743 $62,338,298Full-Service Restaurants-7221 $47,847,559 $2,255 $29,224,906 $18,622,653 $49,157,166 $19,932,260 $56,388,867 $27,163,961
Limited Service Eating Places-7222 $41,591,336 $1,960 $20,233,539 $21,357,797 $42,729,708 $22,496,169 $49,015,840 $28,782,301Drinking Places Alcoholic Beverages-7224 $5,423,824 $256 $0 $5,423,824 $5,572,276 $5,572,276 $6,392,035 $6,392,035
Neighborhood Retailers $173,553,661 $8,179 $148,501,364 $25,052,297 $178,303,895 $29,802,531 $204,534,871 $56,033,507Supermarket, Grocery -44511 $88,080,788 $4,151 $66,384,819 $21,695,969 $90,491,595 $24,106,776 $103,804,163 $37,419,344
Pharmacies and Drug Stores-44611 $41,440,421 $1,953 $49,385,944 ($7,945,523) $42,574,662 ($6,811,282) $48,837,985 ($547,959)Convenience Stores-44512 $4,630,141 $218 $8,064,564 ($3,434,423) $4,756,870 ($3,307,694) $5,456,671 ($2,607,893)Specialty Food Stores-4452 $2,919,922 $138 $0 $2,919,922 $2,999,841 $2,999,841 $3,441,160 $3,441,160
Beer, Wine and Liquor Stores-4453 $7,593,529 $358 $1,495,645 $6,097,884 $7,801,367 $6,305,722 $8,949,056 $7,453,411Optical Goods Stores-44613 $1,679,843 $79 $14,202,464 ($12,522,621) $1,725,821 ($12,476,643) $1,979,713 ($12,222,751)
Other Health and Personal Care Stores-44619 $2,901,813 $137 $4,377,044 ($1,475,231) $2,981,237 ($1,395,807) $3,419,818 ($957,226)Paint and Wallpaper Stores-44412 $1,732,912 $82 $1,828,735 ($95,823) $1,780,343 ($48,392) $2,042,256 $213,521
Hardware Stores-44413 $6,221,958 $293 $0 $6,221,958 $6,392,256 $6,392,256 $7,332,645 $7,332,645Florists-4531 $1,670,951 $79 $574,989 $1,095,962 $1,716,686 $1,141,697 $1,969,234 $1,394,245
Other Miscellaneous Store Retailers-4539 $10,357,479 $488 $949,318 $9,408,161 $10,640,967 $9,691,649 $12,206,401 $11,257,083Gift, Novelty and Souvenir Stores-45322 $4,323,904 $204 $1,237,842 $3,086,062 $4,442,251 $3,204,409 $5,095,768 $3,857,926
TOTALS $475,095,202 $22,389 $552,637,447 ($77,542,245) $488,098,750 ($64,538,697) $559,904,845 $7,267,398
SOURCE: RCLCO; Iexpress/Claritas, Inc.; MWCOG, Round 7.1 Cooperative Forecasts
Page 30 of 61
expend04-12172.00
Printed: 10/30/2008
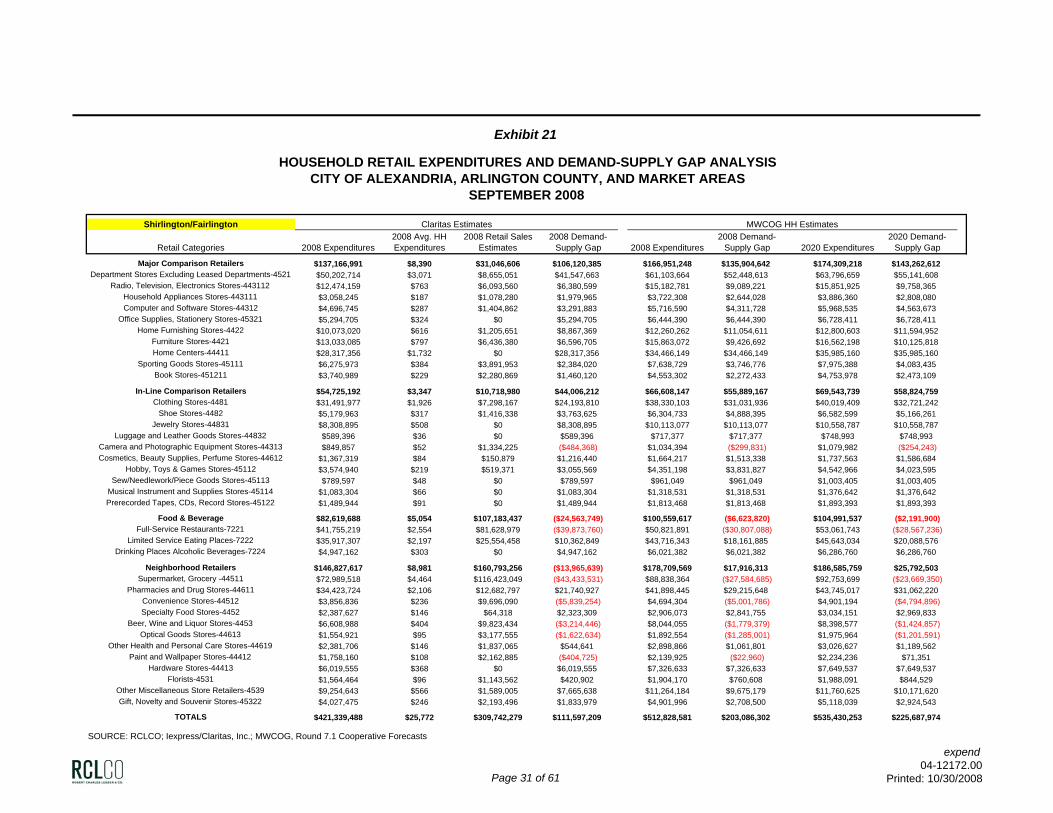
Exhibit 21
HOUSEHOLD RETAIL EXPENDITURES AND DEMAND-SUPPLY GAP ANALYSISCITY OF ALEXANDRIA, ARLINGTON COUNTY, AND MARKET AREAS
SEPTEMBER 2008
Shirlington/Fairlington Claritas Estimates MWCOG HH Estimates
Retail Categories 2008 Expenditures2008 Avg. HH Expenditures
2008 Retail Sales Estimates
2008 Demand-Supply Gap 2008 Expenditures
2008 Demand-Supply Gap 2020 Expenditures
2020 Demand-Supply Gap
Major Comparison Retailers $137,166,991 $8,390 $31,046,606 $106,120,385 $166,951,248 $135,904,642 $174,309,218 $143,262,612Department Stores Excluding Leased Departments-4521 $50,202,714 $3,071 $8,655,051 $41,547,663 $61,103,664 $52,448,613 $63,796,659 $55,141,608
Radio, Television, Electronics Stores-443112 $12,474,159 $763 $6,093,560 $6,380,599 $15,182,781 $9,089,221 $15,851,925 $9,758,365Household Appliances Stores-443111 $3,058,245 $187 $1,078,280 $1,979,965 $3,722,308 $2,644,028 $3,886,360 $2,808,080Computer and Software Stores-44312 $4,696,745 $287 $1,404,862 $3,291,883 $5,716,590 $4,311,728 $5,968,535 $4,563,673
Office Supplies, Stationery Stores-45321 $5,294,705 $324 $0 $5,294,705 $6,444,390 $6,444,390 $6,728,411 $6,728,411Home Furnishing Stores-4422 $10,073,020 $616 $1,205,651 $8,867,369 $12,260,262 $11,054,611 $12,800,603 $11,594,952
Furniture Stores-4421 $13,033,085 $797 $6,436,380 $6,596,705 $15,863,072 $9,426,692 $16,562,198 $10,125,818Home Centers-44411 $28,317,356 $1,732 $0 $28,317,356 $34,466,149 $34,466,149 $35,985,160 $35,985,160
Sporting Goods Stores-45111 $6,275,973 $384 $3,891,953 $2,384,020 $7,638,729 $3,746,776 $7,975,388 $4,083,435Book Stores-451211 $3,740,989 $229 $2,280,869 $1,460,120 $4,553,302 $2,272,433 $4,753,978 $2,473,109
In-Line Comparison Retailers $54,725,192 $3,347 $10,718,980 $44,006,212 $66,608,147 $55,889,167 $69,543,739 $58,824,759Clothing Stores-4481 $31,491,977 $1,926 $7,298,167 $24,193,810 $38,330,103 $31,031,936 $40,019,409 $32,721,242
Shoe Stores-4482 $5,179,963 $317 $1,416,338 $3,763,625 $6,304,733 $4,888,395 $6,582,599 $5,166,261Jewelry Stores-44831 $8,308,895 $508 $0 $8,308,895 $10,113,077 $10,113,077 $10,558,787 $10,558,787
Luggage and Leather Goods Stores-44832 $589,396 $36 $0 $589,396 $717,377 $717,377 $748,993 $748,993Camera and Photographic Equipment Stores-44313 $849,857 $52 $1,334,225 ($484,368) $1,034,394 ($299,831) $1,079,982 ($254,243)Cosmetics, Beauty Supplies, Perfume Stores-44612 $1,367,319 $84 $150,879 $1,216,440 $1,664,217 $1,513,338 $1,737,563 $1,586,684
Hobby, Toys & Games Stores-45112 $3,574,940 $219 $519,371 $3,055,569 $4,351,198 $3,831,827 $4,542,966 $4,023,595Sew/Needlework/Piece Goods Stores-45113 $789,597 $48 $0 $789,597 $961,049 $961,049 $1,003,405 $1,003,405
Musical Instrument and Supplies Stores-45114 $1,083,304 $66 $0 $1,083,304 $1,318,531 $1,318,531 $1,376,642 $1,376,642Prerecorded Tapes, CDs, Record Stores-45122 $1,489,944 $91 $0 $1,489,944 $1,813,468 $1,813,468 $1,893,393 $1,893,393
Food & Beverage $82,619,688 $5,054 $107,183,437 ($24,563,749) $100,559,617 ($6,623,820) $104,991,537 ($2,191,900)Full-Service Restaurants-7221 $41,755,219 $2,554 $81,628,979 ($39,873,760) $50,821,891 ($30,807,088) $53,061,743 ($28,567,236)
Limited Service Eating Places-7222 $35,917,307 $2,197 $25,554,458 $10,362,849 $43,716,343 $18,161,885 $45,643,034 $20,088,576Drinking Places Alcoholic Beverages-7224 $4,947,162 $303 $0 $4,947,162 $6,021,382 $6,021,382 $6,286,760 $6,286,760
Neighborhood Retailers $146,827,617 $8,981 $160,793,256 ($13,965,639) $178,709,569 $17,916,313 $186,585,759 $25,792,503Supermarket, Grocery -44511 $72,989,518 $4,464 $116,423,049 ($43,433,531) $88,838,364 ($27,584,685) $92,753,699 ($23,669,350)
Pharmacies and Drug Stores-44611 $34,423,724 $2,106 $12,682,797 $21,740,927 $41,898,445 $29,215,648 $43,745,017 $31,062,220Convenience Stores-44512 $3,856,836 $236 $9,696,090 ($5,839,254) $4,694,304 ($5,001,786) $4,901,194 ($4,794,896)Specialty Food Stores-4452 $2,387,627 $146 $64,318 $2,323,309 $2,906,073 $2,841,755 $3,034,151 $2,969,833
Beer, Wine and Liquor Stores-4453 $6,608,988 $404 $9,823,434 ($3,214,446) $8,044,055 ($1,779,379) $8,398,577 ($1,424,857)Optical Goods Stores-44613 $1,554,921 $95 $3,177,555 ($1,622,634) $1,892,554 ($1,285,001) $1,975,964 ($1,201,591)
Other Health and Personal Care Stores-44619 $2,381,706 $146 $1,837,065 $544,641 $2,898,866 $1,061,801 $3,026,627 $1,189,562Paint and Wallpaper Stores-44412 $1,758,160 $108 $2,162,885 ($404,725) $2,139,925 ($22,960) $2,234,236 $71,351
Hardware Stores-44413 $6,019,555 $368 $0 $6,019,555 $7,326,633 $7,326,633 $7,649,537 $7,649,537Florists-4531 $1,564,464 $96 $1,143,562 $420,902 $1,904,170 $760,608 $1,988,091 $844,529
Other Miscellaneous Store Retailers-4539 $9,254,643 $566 $1,589,005 $7,665,638 $11,264,184 $9,675,179 $11,760,625 $10,171,620Gift, Novelty and Souvenir Stores-45322 $4,027,475 $246 $2,193,496 $1,833,979 $4,901,996 $2,708,500 $5,118,039 $2,924,543
TOTALS $421,339,488 $25,772 $309,742,279 $111,597,209 $512,828,581 $203,086,302 $535,430,253 $225,687,974
SOURCE: RCLCO; Iexpress/Claritas, Inc.; MWCOG, Round 7.1 Cooperative Forecasts
Page 31 of 61
expend04-12172.00
Printed: 10/30/2008
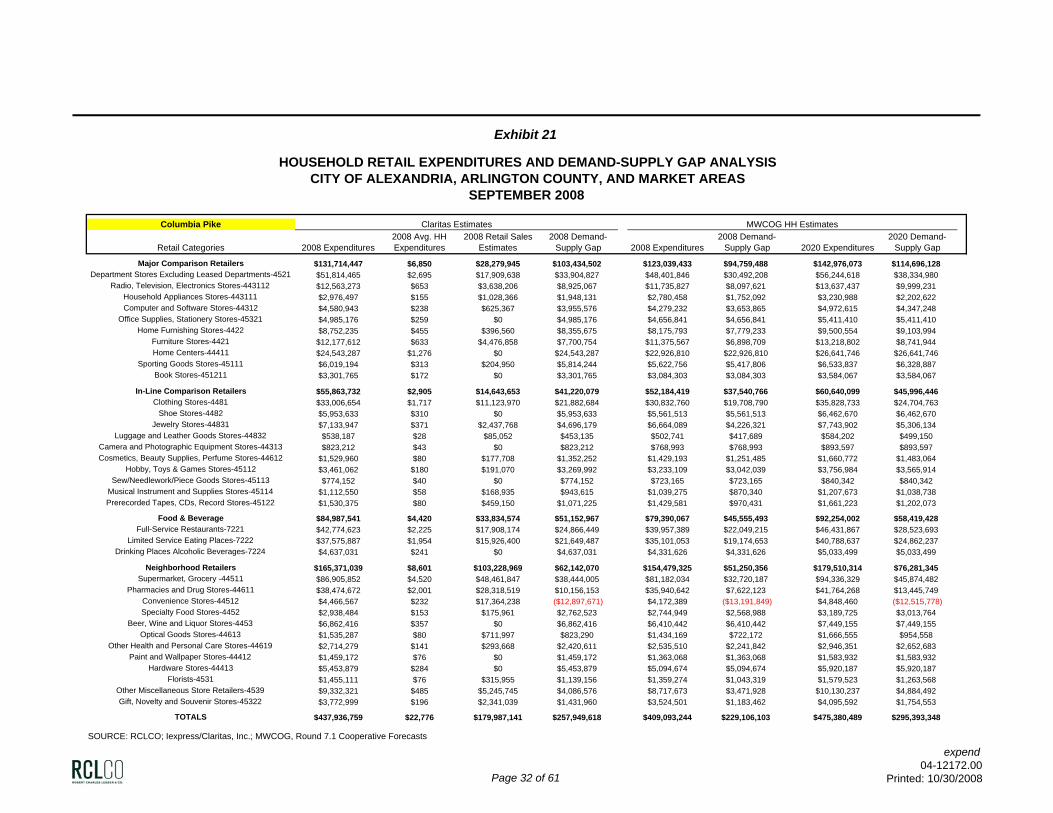
Exhibit 21
HOUSEHOLD RETAIL EXPENDITURES AND DEMAND-SUPPLY GAP ANALYSISCITY OF ALEXANDRIA, ARLINGTON COUNTY, AND MARKET AREAS
SEPTEMBER 2008
Columbia Pike Claritas Estimates MWCOG HH Estimates
Retail Categories 2008 Expenditures2008 Avg. HH Expenditures
2008 Retail Sales Estimates
2008 Demand-Supply Gap 2008 Expenditures
2008 Demand-Supply Gap 2020 Expenditures
2020 Demand-Supply Gap
Major Comparison Retailers $131,714,447 $6,850 $28,279,945 $103,434,502 $123,039,433 $94,759,488 $142,976,073 $114,696,128Department Stores Excluding Leased Departments-4521 $51,814,465 $2,695 $17,909,638 $33,904,827 $48,401,846 $30,492,208 $56,244,618 $38,334,980
Radio, Television, Electronics Stores-443112 $12,563,273 $653 $3,638,206 $8,925,067 $11,735,827 $8,097,621 $13,637,437 $9,999,231Household Appliances Stores-443111 $2,976,497 $155 $1,028,366 $1,948,131 $2,780,458 $1,752,092 $3,230,988 $2,202,622Computer and Software Stores-44312 $4,580,943 $238 $625,367 $3,955,576 $4,279,232 $3,653,865 $4,972,615 $4,347,248
Office Supplies, Stationery Stores-45321 $4,985,176 $259 $0 $4,985,176 $4,656,841 $4,656,841 $5,411,410 $5,411,410Home Furnishing Stores-4422 $8,752,235 $455 $396,560 $8,355,675 $8,175,793 $7,779,233 $9,500,554 $9,103,994
Furniture Stores-4421 $12,177,612 $633 $4,476,858 $7,700,754 $11,375,567 $6,898,709 $13,218,802 $8,741,944Home Centers-44411 $24,543,287 $1,276 $0 $24,543,287 $22,926,810 $22,926,810 $26,641,746 $26,641,746
Sporting Goods Stores-45111 $6,019,194 $313 $204,950 $5,814,244 $5,622,756 $5,417,806 $6,533,837 $6,328,887Book Stores-451211 $3,301,765 $172 $0 $3,301,765 $3,084,303 $3,084,303 $3,584,067 $3,584,067
In-Line Comparison Retailers $55,863,732 $2,905 $14,643,653 $41,220,079 $52,184,419 $37,540,766 $60,640,099 $45,996,446Clothing Stores-4481 $33,006,654 $1,717 $11,123,970 $21,882,684 $30,832,760 $19,708,790 $35,828,733 $24,704,763
Shoe Stores-4482 $5,953,633 $310 $0 $5,953,633 $5,561,513 $5,561,513 $6,462,670 $6,462,670Jewelry Stores-44831 $7,133,947 $371 $2,437,768 $4,696,179 $6,664,089 $4,226,321 $7,743,902 $5,306,134
Luggage and Leather Goods Stores-44832 $538,187 $28 $85,052 $453,135 $502,741 $417,689 $584,202 $499,150Camera and Photographic Equipment Stores-44313 $823,212 $43 $0 $823,212 $768,993 $768,993 $893,597 $893,597Cosmetics, Beauty Supplies, Perfume Stores-44612 $1,529,960 $80 $177,708 $1,352,252 $1,429,193 $1,251,485 $1,660,772 $1,483,064
Hobby, Toys & Games Stores-45112 $3,461,062 $180 $191,070 $3,269,992 $3,233,109 $3,042,039 $3,756,984 $3,565,914Sew/Needlework/Piece Goods Stores-45113 $774,152 $40 $0 $774,152 $723,165 $723,165 $840,342 $840,342
Musical Instrument and Supplies Stores-45114 $1,112,550 $58 $168,935 $943,615 $1,039,275 $870,340 $1,207,673 $1,038,738Prerecorded Tapes, CDs, Record Stores-45122 $1,530,375 $80 $459,150 $1,071,225 $1,429,581 $970,431 $1,661,223 $1,202,073
Food & Beverage $84,987,541 $4,420 $33,834,574 $51,152,967 $79,390,067 $45,555,493 $92,254,002 $58,419,428Full-Service Restaurants-7221 $42,774,623 $2,225 $17,908,174 $24,866,449 $39,957,389 $22,049,215 $46,431,867 $28,523,693
Limited Service Eating Places-7222 $37,575,887 $1,954 $15,926,400 $21,649,487 $35,101,053 $19,174,653 $40,788,637 $24,862,237Drinking Places Alcoholic Beverages-7224 $4,637,031 $241 $0 $4,637,031 $4,331,626 $4,331,626 $5,033,499 $5,033,499
Neighborhood Retailers $165,371,039 $8,601 $103,228,969 $62,142,070 $154,479,325 $51,250,356 $179,510,314 $76,281,345Supermarket, Grocery -44511 $86,905,852 $4,520 $48,461,847 $38,444,005 $81,182,034 $32,720,187 $94,336,329 $45,874,482
Pharmacies and Drug Stores-44611 $38,474,672 $2,001 $28,318,519 $10,156,153 $35,940,642 $7,622,123 $41,764,268 $13,445,749Convenience Stores-44512 $4,466,567 $232 $17,364,238 ($12,897,671) $4,172,389 ($13,191,849) $4,848,460 ($12,515,778)Specialty Food Stores-4452 $2,938,484 $153 $175,961 $2,762,523 $2,744,949 $2,568,988 $3,189,725 $3,013,764
Beer, Wine and Liquor Stores-4453 $6,862,416 $357 $0 $6,862,416 $6,410,442 $6,410,442 $7,449,155 $7,449,155Optical Goods Stores-44613 $1,535,287 $80 $711,997 $823,290 $1,434,169 $722,172 $1,666,555 $954,558
Other Health and Personal Care Stores-44619 $2,714,279 $141 $293,668 $2,420,611 $2,535,510 $2,241,842 $2,946,351 $2,652,683Paint and Wallpaper Stores-44412 $1,459,172 $76 $0 $1,459,172 $1,363,068 $1,363,068 $1,583,932 $1,583,932
Hardware Stores-44413 $5,453,879 $284 $0 $5,453,879 $5,094,674 $5,094,674 $5,920,187 $5,920,187Florists-4531 $1,455,111 $76 $315,955 $1,139,156 $1,359,274 $1,043,319 $1,579,523 $1,263,568
Other Miscellaneous Store Retailers-4539 $9,332,321 $485 $5,245,745 $4,086,576 $8,717,673 $3,471,928 $10,130,237 $4,884,492Gift, Novelty and Souvenir Stores-45322 $3,772,999 $196 $2,341,039 $1,431,960 $3,524,501 $1,183,462 $4,095,592 $1,754,553
TOTALS $437,936,759 $22,776 $179,987,141 $257,949,618 $409,093,244 $229,106,103 $475,380,489 $295,393,348
SOURCE: RCLCO; Iexpress/Claritas, Inc.; MWCOG, Round 7.1 Cooperative Forecasts
Page 32 of 61
expend04-12172.00
Printed: 10/30/2008
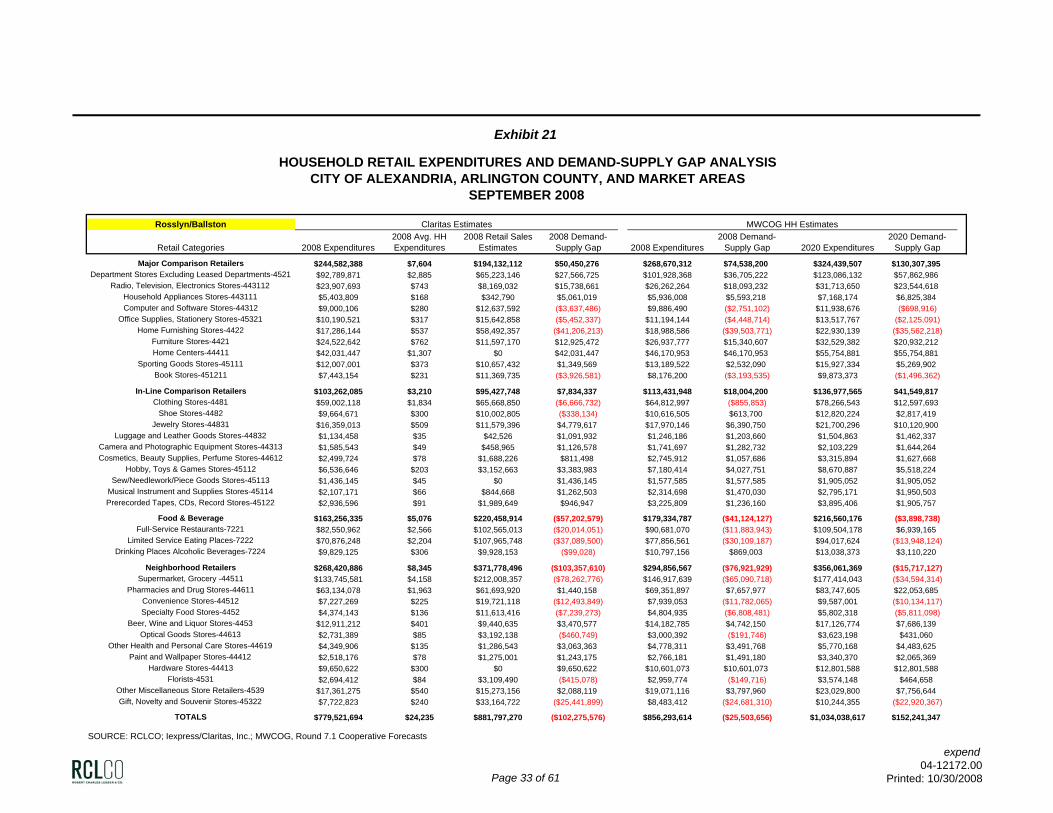
Exhibit 21
HOUSEHOLD RETAIL EXPENDITURES AND DEMAND-SUPPLY GAP ANALYSISCITY OF ALEXANDRIA, ARLINGTON COUNTY, AND MARKET AREAS
SEPTEMBER 2008
Rosslyn/Ballston Claritas Estimates MWCOG HH Estimates
Retail Categories 2008 Expenditures2008 Avg. HH Expenditures
2008 Retail Sales Estimates
2008 Demand-Supply Gap 2008 Expenditures
2008 Demand-Supply Gap 2020 Expenditures
2020 Demand-Supply Gap
Major Comparison Retailers $244,582,388 $7,604 $194,132,112 $50,450,276 $268,670,312 $74,538,200 $324,439,507 $130,307,395Department Stores Excluding Leased Departments-4521 $92,789,871 $2,885 $65,223,146 $27,566,725 $101,928,368 $36,705,222 $123,086,132 $57,862,986
Radio, Television, Electronics Stores-443112 $23,907,693 $743 $8,169,032 $15,738,661 $26,262,264 $18,093,232 $31,713,650 $23,544,618Household Appliances Stores-443111 $5,403,809 $168 $342,790 $5,061,019 $5,936,008 $5,593,218 $7,168,174 $6,825,384Computer and Software Stores-44312 $9,000,106 $280 $12,637,592 ($3,637,486) $9,886,490 ($2,751,102) $11,938,676 ($698,916)
Office Supplies, Stationery Stores-45321 $10,190,521 $317 $15,642,858 ($5,452,337) $11,194,144 ($4,448,714) $13,517,767 ($2,125,091)Home Furnishing Stores-4422 $17,286,144 $537 $58,492,357 ($41,206,213) $18,988,586 ($39,503,771) $22,930,139 ($35,562,218)
Furniture Stores-4421 $24,522,642 $762 $11,597,170 $12,925,472 $26,937,777 $15,340,607 $32,529,382 $20,932,212Home Centers-44411 $42,031,447 $1,307 $0 $42,031,447 $46,170,953 $46,170,953 $55,754,881 $55,754,881
Sporting Goods Stores-45111 $12,007,001 $373 $10,657,432 $1,349,569 $13,189,522 $2,532,090 $15,927,334 $5,269,902Book Stores-451211 $7,443,154 $231 $11,369,735 ($3,926,581) $8,176,200 ($3,193,535) $9,873,373 ($1,496,362)
In-Line Comparison Retailers $103,262,085 $3,210 $95,427,748 $7,834,337 $113,431,948 $18,004,200 $136,977,565 $41,549,817Clothing Stores-4481 $59,002,118 $1,834 $65,668,850 ($6,666,732) $64,812,997 ($855,853) $78,266,543 $12,597,693
Shoe Stores-4482 $9,664,671 $300 $10,002,805 ($338,134) $10,616,505 $613,700 $12,820,224 $2,817,419Jewelry Stores-44831 $16,359,013 $509 $11,579,396 $4,779,617 $17,970,146 $6,390,750 $21,700,296 $10,120,900
Luggage and Leather Goods Stores-44832 $1,134,458 $35 $42,526 $1,091,932 $1,246,186 $1,203,660 $1,504,863 $1,462,337Camera and Photographic Equipment Stores-44313 $1,585,543 $49 $458,965 $1,126,578 $1,741,697 $1,282,732 $2,103,229 $1,644,264Cosmetics, Beauty Supplies, Perfume Stores-44612 $2,499,724 $78 $1,688,226 $811,498 $2,745,912 $1,057,686 $3,315,894 $1,627,668
Hobby, Toys & Games Stores-45112 $6,536,646 $203 $3,152,663 $3,383,983 $7,180,414 $4,027,751 $8,670,887 $5,518,224Sew/Needlework/Piece Goods Stores-45113 $1,436,145 $45 $0 $1,436,145 $1,577,585 $1,577,585 $1,905,052 $1,905,052
Musical Instrument and Supplies Stores-45114 $2,107,171 $66 $844,668 $1,262,503 $2,314,698 $1,470,030 $2,795,171 $1,950,503Prerecorded Tapes, CDs, Record Stores-45122 $2,936,596 $91 $1,989,649 $946,947 $3,225,809 $1,236,160 $3,895,406 $1,905,757
Food & Beverage $163,256,335 $5,076 $220,458,914 ($57,202,579) $179,334,787 ($41,124,127) $216,560,176 ($3,898,738)Full-Service Restaurants-7221 $82,550,962 $2,566 $102,565,013 ($20,014,051) $90,681,070 ($11,883,943) $109,504,178 $6,939,165
Limited Service Eating Places-7222 $70,876,248 $2,204 $107,965,748 ($37,089,500) $77,856,561 ($30,109,187) $94,017,624 ($13,948,124)Drinking Places Alcoholic Beverages-7224 $9,829,125 $306 $9,928,153 ($99,028) $10,797,156 $869,003 $13,038,373 $3,110,220
Neighborhood Retailers $268,420,886 $8,345 $371,778,496 ($103,357,610) $294,856,567 ($76,921,929) $356,061,369 ($15,717,127)Supermarket, Grocery -44511 $133,745,581 $4,158 $212,008,357 ($78,262,776) $146,917,639 ($65,090,718) $177,414,043 ($34,594,314)
Pharmacies and Drug Stores-44611 $63,134,078 $1,963 $61,693,920 $1,440,158 $69,351,897 $7,657,977 $83,747,605 $22,053,685Convenience Stores-44512 $7,227,269 $225 $19,721,118 ($12,493,849) $7,939,053 ($11,782,065) $9,587,001 ($10,134,117)Specialty Food Stores-4452 $4,374,143 $136 $11,613,416 ($7,239,273) $4,804,935 ($6,808,481) $5,802,318 ($5,811,098)
Beer, Wine and Liquor Stores-4453 $12,911,212 $401 $9,440,635 $3,470,577 $14,182,785 $4,742,150 $17,126,774 $7,686,139Optical Goods Stores-44613 $2,731,389 $85 $3,192,138 ($460,749) $3,000,392 ($191,746) $3,623,198 $431,060
Other Health and Personal Care Stores-44619 $4,349,906 $135 $1,286,543 $3,063,363 $4,778,311 $3,491,768 $5,770,168 $4,483,625Paint and Wallpaper Stores-44412 $2,518,176 $78 $1,275,001 $1,243,175 $2,766,181 $1,491,180 $3,340,370 $2,065,369
Hardware Stores-44413 $9,650,622 $300 $0 $9,650,622 $10,601,073 $10,601,073 $12,801,588 $12,801,588Florists-4531 $2,694,412 $84 $3,109,490 ($415,078) $2,959,774 ($149,716) $3,574,148 $464,658
Other Miscellaneous Store Retailers-4539 $17,361,275 $540 $15,273,156 $2,088,119 $19,071,116 $3,797,960 $23,029,800 $7,756,644Gift, Novelty and Souvenir Stores-45322 $7,722,823 $240 $33,164,722 ($25,441,899) $8,483,412 ($24,681,310) $10,244,355 ($22,920,367)
TOTALS $779,521,694 $24,235 $881,797,270 ($102,275,576) $856,293,614 ($25,503,656) $1,034,038,617 $152,241,347
SOURCE: RCLCO; Iexpress/Claritas, Inc.; MWCOG, Round 7.1 Cooperative Forecasts
Page 33 of 61
expend04-12172.00
Printed: 10/30/2008
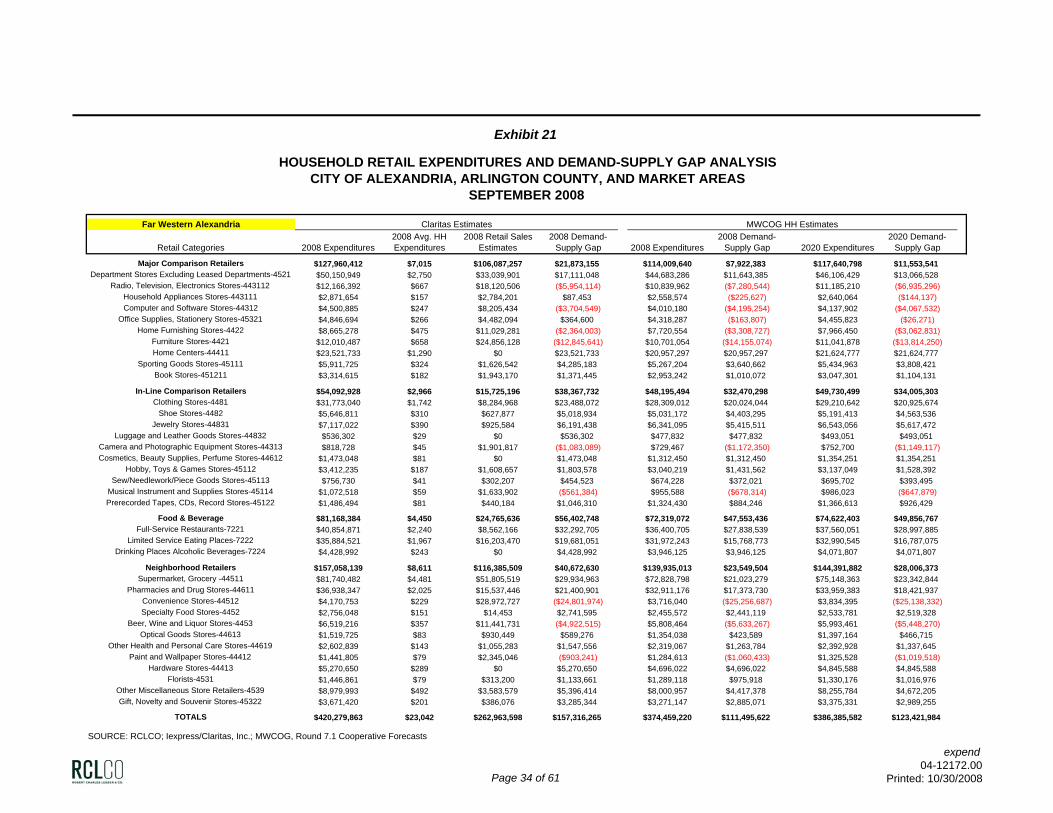
Exhibit 21
HOUSEHOLD RETAIL EXPENDITURES AND DEMAND-SUPPLY GAP ANALYSISCITY OF ALEXANDRIA, ARLINGTON COUNTY, AND MARKET AREAS
SEPTEMBER 2008
Far Western Alexandria Claritas Estimates MWCOG HH Estimates
Retail Categories 2008 Expenditures2008 Avg. HH Expenditures
2008 Retail Sales Estimates
2008 Demand-Supply Gap 2008 Expenditures
2008 Demand-Supply Gap 2020 Expenditures
2020 Demand-Supply Gap
Major Comparison Retailers $127,960,412 $7,015 $106,087,257 $21,873,155 $114,009,640 $7,922,383 $117,640,798 $11,553,541Department Stores Excluding Leased Departments-4521 $50,150,949 $2,750 $33,039,901 $17,111,048 $44,683,286 $11,643,385 $46,106,429 $13,066,528
Radio, Television, Electronics Stores-443112 $12,166,392 $667 $18,120,506 ($5,954,114) $10,839,962 ($7,280,544) $11,185,210 ($6,935,296)Household Appliances Stores-443111 $2,871,654 $157 $2,784,201 $87,453 $2,558,574 ($225,627) $2,640,064 ($144,137)Computer and Software Stores-44312 $4,500,885 $247 $8,205,434 ($3,704,549) $4,010,180 ($4,195,254) $4,137,902 ($4,067,532)
Office Supplies, Stationery Stores-45321 $4,846,694 $266 $4,482,094 $364,600 $4,318,287 ($163,807) $4,455,823 ($26,271)Home Furnishing Stores-4422 $8,665,278 $475 $11,029,281 ($2,364,003) $7,720,554 ($3,308,727) $7,966,450 ($3,062,831)
Furniture Stores-4421 $12,010,487 $658 $24,856,128 ($12,845,641) $10,701,054 ($14,155,074) $11,041,878 ($13,814,250)Home Centers-44411 $23,521,733 $1,290 $0 $23,521,733 $20,957,297 $20,957,297 $21,624,777 $21,624,777
Sporting Goods Stores-45111 $5,911,725 $324 $1,626,542 $4,285,183 $5,267,204 $3,640,662 $5,434,963 $3,808,421Book Stores-451211 $3,314,615 $182 $1,943,170 $1,371,445 $2,953,242 $1,010,072 $3,047,301 $1,104,131
In-Line Comparison Retailers $54,092,928 $2,966 $15,725,196 $38,367,732 $48,195,494 $32,470,298 $49,730,499 $34,005,303Clothing Stores-4481 $31,773,040 $1,742 $8,284,968 $23,488,072 $28,309,012 $20,024,044 $29,210,642 $20,925,674
Shoe Stores-4482 $5,646,811 $310 $627,877 $5,018,934 $5,031,172 $4,403,295 $5,191,413 $4,563,536Jewelry Stores-44831 $7,117,022 $390 $925,584 $6,191,438 $6,341,095 $5,415,511 $6,543,056 $5,617,472
Luggage and Leather Goods Stores-44832 $536,302 $29 $0 $536,302 $477,832 $477,832 $493,051 $493,051Camera and Photographic Equipment Stores-44313 $818,728 $45 $1,901,817 ($1,083,089) $729,467 ($1,172,350) $752,700 ($1,149,117)Cosmetics, Beauty Supplies, Perfume Stores-44612 $1,473,048 $81 $0 $1,473,048 $1,312,450 $1,312,450 $1,354,251 $1,354,251
Hobby, Toys & Games Stores-45112 $3,412,235 $187 $1,608,657 $1,803,578 $3,040,219 $1,431,562 $3,137,049 $1,528,392Sew/Needlework/Piece Goods Stores-45113 $756,730 $41 $302,207 $454,523 $674,228 $372,021 $695,702 $393,495
Musical Instrument and Supplies Stores-45114 $1,072,518 $59 $1,633,902 ($561,384) $955,588 ($678,314) $986,023 ($647,879)Prerecorded Tapes, CDs, Record Stores-45122 $1,486,494 $81 $440,184 $1,046,310 $1,324,430 $884,246 $1,366,613 $926,429
Food & Beverage $81,168,384 $4,450 $24,765,636 $56,402,748 $72,319,072 $47,553,436 $74,622,403 $49,856,767Full-Service Restaurants-7221 $40,854,871 $2,240 $8,562,166 $32,292,705 $36,400,705 $27,838,539 $37,560,051 $28,997,885
Limited Service Eating Places-7222 $35,884,521 $1,967 $16,203,470 $19,681,051 $31,972,243 $15,768,773 $32,990,545 $16,787,075Drinking Places Alcoholic Beverages-7224 $4,428,992 $243 $0 $4,428,992 $3,946,125 $3,946,125 $4,071,807 $4,071,807
Neighborhood Retailers $157,058,139 $8,611 $116,385,509 $40,672,630 $139,935,013 $23,549,504 $144,391,882 $28,006,373Supermarket, Grocery -44511 $81,740,482 $4,481 $51,805,519 $29,934,963 $72,828,798 $21,023,279 $75,148,363 $23,342,844
Pharmacies and Drug Stores-44611 $36,938,347 $2,025 $15,537,446 $21,400,901 $32,911,176 $17,373,730 $33,959,383 $18,421,937Convenience Stores-44512 $4,170,753 $229 $28,972,727 ($24,801,974) $3,716,040 ($25,256,687) $3,834,395 ($25,138,332)Specialty Food Stores-4452 $2,756,048 $151 $14,453 $2,741,595 $2,455,572 $2,441,119 $2,533,781 $2,519,328
Beer, Wine and Liquor Stores-4453 $6,519,216 $357 $11,441,731 ($4,922,515) $5,808,464 ($5,633,267) $5,993,461 ($5,448,270)Optical Goods Stores-44613 $1,519,725 $83 $930,449 $589,276 $1,354,038 $423,589 $1,397,164 $466,715
Other Health and Personal Care Stores-44619 $2,602,839 $143 $1,055,283 $1,547,556 $2,319,067 $1,263,784 $2,392,928 $1,337,645Paint and Wallpaper Stores-44412 $1,441,805 $79 $2,345,046 ($903,241) $1,284,613 ($1,060,433) $1,325,528 ($1,019,518)
Hardware Stores-44413 $5,270,650 $289 $0 $5,270,650 $4,696,022 $4,696,022 $4,845,588 $4,845,588Florists-4531 $1,446,861 $79 $313,200 $1,133,661 $1,289,118 $975,918 $1,330,176 $1,016,976
Other Miscellaneous Store Retailers-4539 $8,979,993 $492 $3,583,579 $5,396,414 $8,000,957 $4,417,378 $8,255,784 $4,672,205Gift, Novelty and Souvenir Stores-45322 $3,671,420 $201 $386,076 $3,285,344 $3,271,147 $2,885,071 $3,375,331 $2,989,255
TOTALS $420,279,863 $23,042 $262,963,598 $157,316,265 $374,459,220 $111,495,622 $386,385,582 $123,421,984
SOURCE: RCLCO; Iexpress/Claritas, Inc.; MWCOG, Round 7.1 Cooperative Forecasts
Page 34 of 61
expend04-12172.00
Printed: 10/30/2008
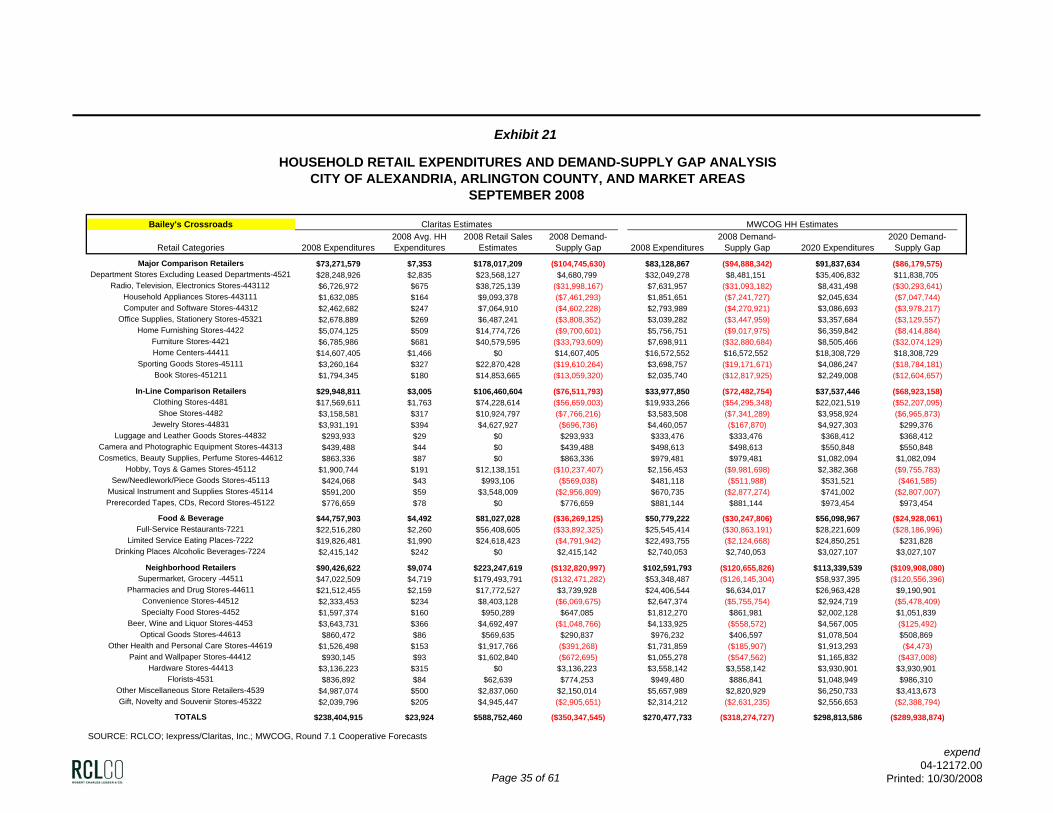
Exhibit 21
HOUSEHOLD RETAIL EXPENDITURES AND DEMAND-SUPPLY GAP ANALYSISCITY OF ALEXANDRIA, ARLINGTON COUNTY, AND MARKET AREAS
SEPTEMBER 2008
Bailey's Crossroads Claritas Estimates MWCOG HH Estimates
Retail Categories 2008 Expenditures2008 Avg. HH Expenditures
2008 Retail Sales Estimates
2008 Demand-Supply Gap 2008 Expenditures
2008 Demand-Supply Gap 2020 Expenditures
2020 Demand-Supply Gap
Major Comparison Retailers $73,271,579 $7,353 $178,017,209 ($104,745,630) $83,128,867 ($94,888,342) $91,837,634 ($86,179,575)Department Stores Excluding Leased Departments-4521 $28,248,926 $2,835 $23,568,127 $4,680,799 $32,049,278 $8,481,151 $35,406,832 $11,838,705
Radio, Television, Electronics Stores-443112 $6,726,972 $675 $38,725,139 ($31,998,167) $7,631,957 ($31,093,182) $8,431,498 ($30,293,641)Household Appliances Stores-443111 $1,632,085 $164 $9,093,378 ($7,461,293) $1,851,651 ($7,241,727) $2,045,634 ($7,047,744)Computer and Software Stores-44312 $2,462,682 $247 $7,064,910 ($4,602,228) $2,793,989 ($4,270,921) $3,086,693 ($3,978,217)
Office Supplies, Stationery Stores-45321 $2,678,889 $269 $6,487,241 ($3,808,352) $3,039,282 ($3,447,959) $3,357,684 ($3,129,557)Home Furnishing Stores-4422 $5,074,125 $509 $14,774,726 ($9,700,601) $5,756,751 ($9,017,975) $6,359,842 ($8,414,884)
Furniture Stores-4421 $6,785,986 $681 $40,579,595 ($33,793,609) $7,698,911 ($32,880,684) $8,505,466 ($32,074,129)Home Centers-44411 $14,607,405 $1,466 $0 $14,607,405 $16,572,552 $16,572,552 $18,308,729 $18,308,729
Sporting Goods Stores-45111 $3,260,164 $327 $22,870,428 ($19,610,264) $3,698,757 ($19,171,671) $4,086,247 ($18,784,181)Book Stores-451211 $1,794,345 $180 $14,853,665 ($13,059,320) $2,035,740 ($12,817,925) $2,249,008 ($12,604,657)
In-Line Comparison Retailers $29,948,811 $3,005 $106,460,604 ($76,511,793) $33,977,850 ($72,482,754) $37,537,446 ($68,923,158)Clothing Stores-4481 $17,569,611 $1,763 $74,228,614 ($56,659,003) $19,933,266 ($54,295,348) $22,021,519 ($52,207,095)
Shoe Stores-4482 $3,158,581 $317 $10,924,797 ($7,766,216) $3,583,508 ($7,341,289) $3,958,924 ($6,965,873)Jewelry Stores-44831 $3,931,191 $394 $4,627,927 ($696,736) $4,460,057 ($167,870) $4,927,303 $299,376
Luggage and Leather Goods Stores-44832 $293,933 $29 $0 $293,933 $333,476 $333,476 $368,412 $368,412Camera and Photographic Equipment Stores-44313 $439,488 $44 $0 $439,488 $498,613 $498,613 $550,848 $550,848Cosmetics, Beauty Supplies, Perfume Stores-44612 $863,336 $87 $0 $863,336 $979,481 $979,481 $1,082,094 $1,082,094
Hobby, Toys & Games Stores-45112 $1,900,744 $191 $12,138,151 ($10,237,407) $2,156,453 ($9,981,698) $2,382,368 ($9,755,783)Sew/Needlework/Piece Goods Stores-45113 $424,068 $43 $993,106 ($569,038) $481,118 ($511,988) $531,521 ($461,585)
Musical Instrument and Supplies Stores-45114 $591,200 $59 $3,548,009 ($2,956,809) $670,735 ($2,877,274) $741,002 ($2,807,007)Prerecorded Tapes, CDs, Record Stores-45122 $776,659 $78 $0 $776,659 $881,144 $881,144 $973,454 $973,454
Food & Beverage $44,757,903 $4,492 $81,027,028 ($36,269,125) $50,779,222 ($30,247,806) $56,098,967 ($24,928,061)Full-Service Restaurants-7221 $22,516,280 $2,260 $56,408,605 ($33,892,325) $25,545,414 ($30,863,191) $28,221,609 ($28,186,996)
Limited Service Eating Places-7222 $19,826,481 $1,990 $24,618,423 ($4,791,942) $22,493,755 ($2,124,668) $24,850,251 $231,828Drinking Places Alcoholic Beverages-7224 $2,415,142 $242 $0 $2,415,142 $2,740,053 $2,740,053 $3,027,107 $3,027,107
Neighborhood Retailers $90,426,622 $9,074 $223,247,619 ($132,820,997) $102,591,793 ($120,655,826) $113,339,539 ($109,908,080)Supermarket, Grocery -44511 $47,022,509 $4,719 $179,493,791 ($132,471,282) $53,348,487 ($126,145,304) $58,937,395 ($120,556,396)
Pharmacies and Drug Stores-44611 $21,512,455 $2,159 $17,772,527 $3,739,928 $24,406,544 $6,634,017 $26,963,428 $9,190,901Convenience Stores-44512 $2,333,453 $234 $8,403,128 ($6,069,675) $2,647,374 ($5,755,754) $2,924,719 ($5,478,409)Specialty Food Stores-4452 $1,597,374 $160 $950,289 $647,085 $1,812,270 $861,981 $2,002,128 $1,051,839
Beer, Wine and Liquor Stores-4453 $3,643,731 $366 $4,692,497 ($1,048,766) $4,133,925 ($558,572) $4,567,005 ($125,492)Optical Goods Stores-44613 $860,472 $86 $569,635 $290,837 $976,232 $406,597 $1,078,504 $508,869
Other Health and Personal Care Stores-44619 $1,526,498 $153 $1,917,766 ($391,268) $1,731,859 ($185,907) $1,913,293 ($4,473)Paint and Wallpaper Stores-44412 $930,145 $93 $1,602,840 ($672,695) $1,055,278 ($547,562) $1,165,832 ($437,008)
Hardware Stores-44413 $3,136,223 $315 $0 $3,136,223 $3,558,142 $3,558,142 $3,930,901 $3,930,901Florists-4531 $836,892 $84 $62,639 $774,253 $949,480 $886,841 $1,048,949 $986,310
Other Miscellaneous Store Retailers-4539 $4,987,074 $500 $2,837,060 $2,150,014 $5,657,989 $2,820,929 $6,250,733 $3,413,673Gift, Novelty and Souvenir Stores-45322 $2,039,796 $205 $4,945,447 ($2,905,651) $2,314,212 ($2,631,235) $2,556,653 ($2,388,794)
TOTALS $238,404,915 $23,924 $588,752,460 ($350,347,545) $270,477,733 ($318,274,727) $298,813,586 ($289,938,874)
SOURCE: RCLCO; Iexpress/Claritas, Inc.; MWCOG, Round 7.1 Cooperative Forecasts
Page 35 of 61
expend04-12172.00
Printed: 10/30/2008
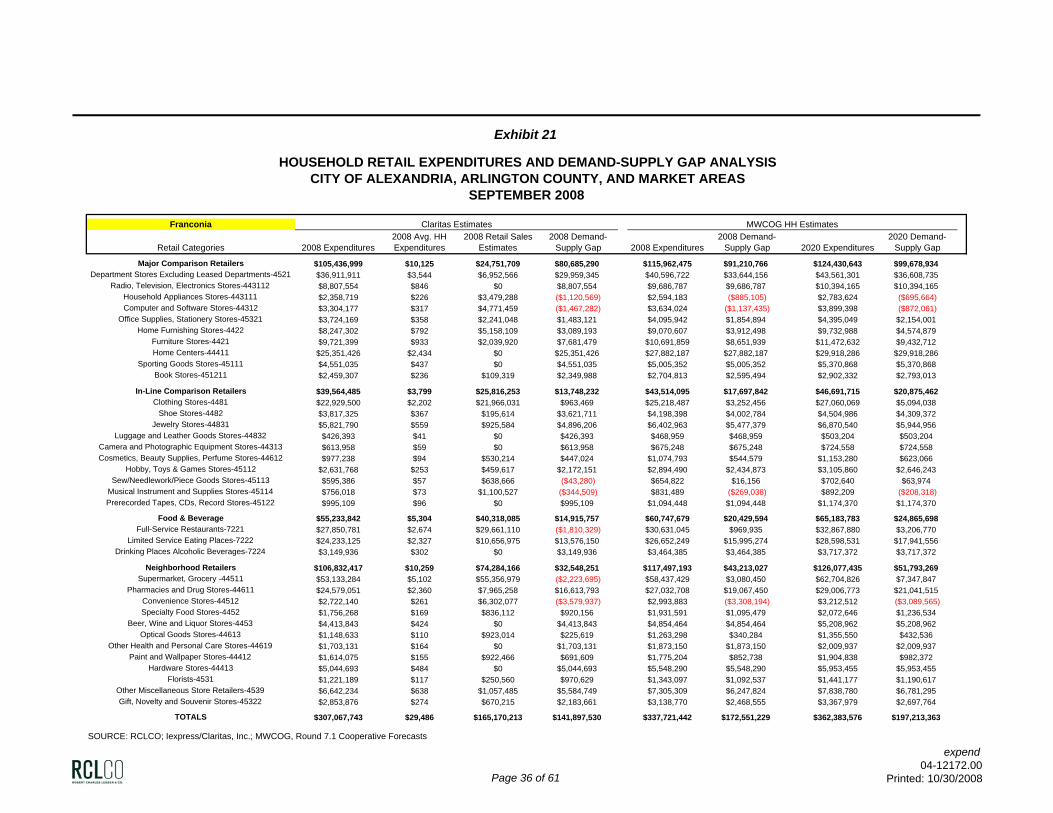
Exhibit 21
HOUSEHOLD RETAIL EXPENDITURES AND DEMAND-SUPPLY GAP ANALYSISCITY OF ALEXANDRIA, ARLINGTON COUNTY, AND MARKET AREAS
SEPTEMBER 2008
Franconia Claritas Estimates MWCOG HH Estimates
Retail Categories 2008 Expenditures2008 Avg. HH Expenditures
2008 Retail Sales Estimates
2008 Demand-Supply Gap 2008 Expenditures
2008 Demand-Supply Gap 2020 Expenditures
2020 Demand-Supply Gap
Major Comparison Retailers $105,436,999 $10,125 $24,751,709 $80,685,290 $115,962,475 $91,210,766 $124,430,643 $99,678,934Department Stores Excluding Leased Departments-4521 $36,911,911 $3,544 $6,952,566 $29,959,345 $40,596,722 $33,644,156 $43,561,301 $36,608,735
Radio, Television, Electronics Stores-443112 $8,807,554 $846 $0 $8,807,554 $9,686,787 $9,686,787 $10,394,165 $10,394,165Household Appliances Stores-443111 $2,358,719 $226 $3,479,288 ($1,120,569) $2,594,183 ($885,105) $2,783,624 ($695,664)Computer and Software Stores-44312 $3,304,177 $317 $4,771,459 ($1,467,282) $3,634,024 ($1,137,435) $3,899,398 ($872,061)
Office Supplies, Stationery Stores-45321 $3,724,169 $358 $2,241,048 $1,483,121 $4,095,942 $1,854,894 $4,395,049 $2,154,001Home Furnishing Stores-4422 $8,247,302 $792 $5,158,109 $3,089,193 $9,070,607 $3,912,498 $9,732,988 $4,574,879
Furniture Stores-4421 $9,721,399 $933 $2,039,920 $7,681,479 $10,691,859 $8,651,939 $11,472,632 $9,432,712Home Centers-44411 $25,351,426 $2,434 $0 $25,351,426 $27,882,187 $27,882,187 $29,918,286 $29,918,286
Sporting Goods Stores-45111 $4,551,035 $437 $0 $4,551,035 $5,005,352 $5,005,352 $5,370,868 $5,370,868Book Stores-451211 $2,459,307 $236 $109,319 $2,349,988 $2,704,813 $2,595,494 $2,902,332 $2,793,013
In-Line Comparison Retailers $39,564,485 $3,799 $25,816,253 $13,748,232 $43,514,095 $17,697,842 $46,691,715 $20,875,462Clothing Stores-4481 $22,929,500 $2,202 $21,966,031 $963,469 $25,218,487 $3,252,456 $27,060,069 $5,094,038
Shoe Stores-4482 $3,817,325 $367 $195,614 $3,621,711 $4,198,398 $4,002,784 $4,504,986 $4,309,372Jewelry Stores-44831 $5,821,790 $559 $925,584 $4,896,206 $6,402,963 $5,477,379 $6,870,540 $5,944,956
Luggage and Leather Goods Stores-44832 $426,393 $41 $0 $426,393 $468,959 $468,959 $503,204 $503,204Camera and Photographic Equipment Stores-44313 $613,958 $59 $0 $613,958 $675,248 $675,248 $724,558 $724,558Cosmetics, Beauty Supplies, Perfume Stores-44612 $977,238 $94 $530,214 $447,024 $1,074,793 $544,579 $1,153,280 $623,066
Hobby, Toys & Games Stores-45112 $2,631,768 $253 $459,617 $2,172,151 $2,894,490 $2,434,873 $3,105,860 $2,646,243Sew/Needlework/Piece Goods Stores-45113 $595,386 $57 $638,666 ($43,280) $654,822 $16,156 $702,640 $63,974
Musical Instrument and Supplies Stores-45114 $756,018 $73 $1,100,527 ($344,509) $831,489 ($269,038) $892,209 ($208,318)Prerecorded Tapes, CDs, Record Stores-45122 $995,109 $96 $0 $995,109 $1,094,448 $1,094,448 $1,174,370 $1,174,370
Food & Beverage $55,233,842 $5,304 $40,318,085 $14,915,757 $60,747,679 $20,429,594 $65,183,783 $24,865,698Full-Service Restaurants-7221 $27,850,781 $2,674 $29,661,110 ($1,810,329) $30,631,045 $969,935 $32,867,880 $3,206,770
Limited Service Eating Places-7222 $24,233,125 $2,327 $10,656,975 $13,576,150 $26,652,249 $15,995,274 $28,598,531 $17,941,556Drinking Places Alcoholic Beverages-7224 $3,149,936 $302 $0 $3,149,936 $3,464,385 $3,464,385 $3,717,372 $3,717,372
Neighborhood Retailers $106,832,417 $10,259 $74,284,166 $32,548,251 $117,497,193 $43,213,027 $126,077,435 $51,793,269Supermarket, Grocery -44511 $53,133,284 $5,102 $55,356,979 ($2,223,695) $58,437,429 $3,080,450 $62,704,826 $7,347,847
Pharmacies and Drug Stores-44611 $24,579,051 $2,360 $7,965,258 $16,613,793 $27,032,708 $19,067,450 $29,006,773 $21,041,515Convenience Stores-44512 $2,722,140 $261 $6,302,077 ($3,579,937) $2,993,883 ($3,308,194) $3,212,512 ($3,089,565)Specialty Food Stores-4452 $1,756,268 $169 $836,112 $920,156 $1,931,591 $1,095,479 $2,072,646 $1,236,534
Beer, Wine and Liquor Stores-4453 $4,413,843 $424 $0 $4,413,843 $4,854,464 $4,854,464 $5,208,962 $5,208,962Optical Goods Stores-44613 $1,148,633 $110 $923,014 $225,619 $1,263,298 $340,284 $1,355,550 $432,536
Other Health and Personal Care Stores-44619 $1,703,131 $164 $0 $1,703,131 $1,873,150 $1,873,150 $2,009,937 $2,009,937Paint and Wallpaper Stores-44412 $1,614,075 $155 $922,466 $691,609 $1,775,204 $852,738 $1,904,838 $982,372
Hardware Stores-44413 $5,044,693 $484 $0 $5,044,693 $5,548,290 $5,548,290 $5,953,455 $5,953,455Florists-4531 $1,221,189 $117 $250,560 $970,629 $1,343,097 $1,092,537 $1,441,177 $1,190,617
Other Miscellaneous Store Retailers-4539 $6,642,234 $638 $1,057,485 $5,584,749 $7,305,309 $6,247,824 $7,838,780 $6,781,295Gift, Novelty and Souvenir Stores-45322 $2,853,876 $274 $670,215 $2,183,661 $3,138,770 $2,468,555 $3,367,979 $2,697,764
TOTALS $307,067,743 $29,486 $165,170,213 $141,897,530 $337,721,442 $172,551,229 $362,383,576 $197,213,363
SOURCE: RCLCO; Iexpress/Claritas, Inc.; MWCOG, Round 7.1 Cooperative Forecasts
Page 36 of 61
expend04-12172.00
Printed: 10/30/2008
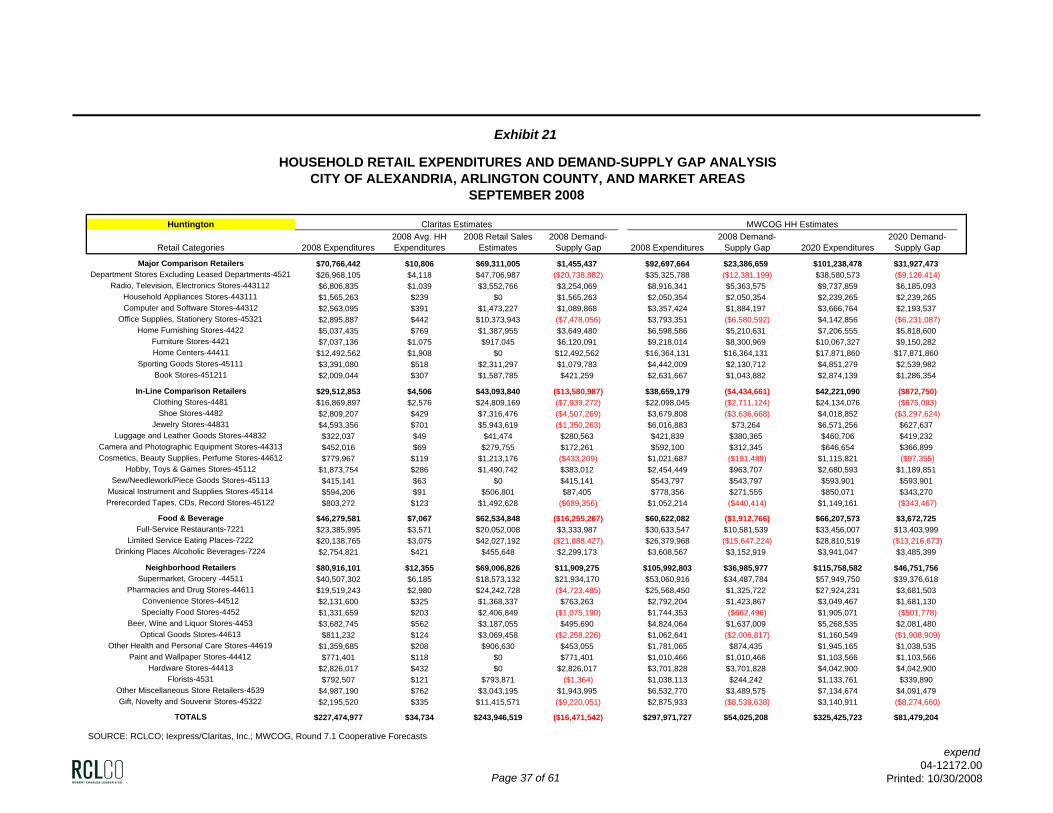
Exhibit 21
HOUSEHOLD RETAIL EXPENDITURES AND DEMAND-SUPPLY GAP ANALYSISCITY OF ALEXANDRIA, ARLINGTON COUNTY, AND MARKET AREAS
SEPTEMBER 2008
Huntington Claritas Estimates MWCOG HH Estimates
Retail Categories 2008 Expenditures2008 Avg. HH Expenditures
2008 Retail Sales Estimates
2008 Demand-Supply Gap 2008 Expenditures
2008 Demand-Supply Gap 2020 Expenditures
2020 Demand-Supply Gap
Major Comparison Retailers $70,766,442 $10,806 $69,311,005 $1,455,437 $92,697,664 $23,386,659 $101,238,478 $31,927,473Department Stores Excluding Leased Departments-4521 $26,968,105 $4,118 $47,706,987 ($20,738,882) $35,325,788 ($12,381,199) $38,580,573 ($9,126,414)
Radio, Television, Electronics Stores-443112 $6,806,835 $1,039 $3,552,766 $3,254,069 $8,916,341 $5,363,575 $9,737,859 $6,185,093Household Appliances Stores-443111 $1,565,263 $239 $0 $1,565,263 $2,050,354 $2,050,354 $2,239,265 $2,239,265Computer and Software Stores-44312 $2,563,095 $391 $1,473,227 $1,089,868 $3,357,424 $1,884,197 $3,666,764 $2,193,537
Office Supplies, Stationery Stores-45321 $2,895,887 $442 $10,373,943 ($7,478,056) $3,793,351 ($6,580,592) $4,142,856 ($6,231,087)Home Furnishing Stores-4422 $5,037,435 $769 $1,387,955 $3,649,480 $6,598,586 $5,210,631 $7,206,555 $5,818,600
Furniture Stores-4421 $7,037,136 $1,075 $917,045 $6,120,091 $9,218,014 $8,300,969 $10,067,327 $9,150,282Home Centers-44411 $12,492,562 $1,908 $0 $12,492,562 $16,364,131 $16,364,131 $17,871,860 $17,871,860
Sporting Goods Stores-45111 $3,391,080 $518 $2,311,297 $1,079,783 $4,442,009 $2,130,712 $4,851,279 $2,539,982Book Stores-451211 $2,009,044 $307 $1,587,785 $421,259 $2,631,667 $1,043,882 $2,874,139 $1,286,354
In-Line Comparison Retailers $29,512,853 $4,506 $43,093,840 ($13,580,987) $38,659,179 ($4,434,661) $42,221,090 ($872,750)Clothing Stores-4481 $16,869,897 $2,576 $24,809,169 ($7,939,272) $22,098,045 ($2,711,124) $24,134,076 ($675,093)
Shoe Stores-4482 $2,809,207 $429 $7,316,476 ($4,507,269) $3,679,808 ($3,636,668) $4,018,852 ($3,297,624)Jewelry Stores-44831 $4,593,356 $701 $5,943,619 ($1,350,263) $6,016,883 $73,264 $6,571,256 $627,637
Luggage and Leather Goods Stores-44832 $322,037 $49 $41,474 $280,563 $421,839 $380,365 $460,706 $419,232Camera and Photographic Equipment Stores-44313 $452,016 $69 $279,755 $172,261 $592,100 $312,345 $646,654 $366,899Cosmetics, Beauty Supplies, Perfume Stores-44612 $779,967 $119 $1,213,176 ($433,209) $1,021,687 ($191,489) $1,115,821 ($97,355)
Hobby, Toys & Games Stores-45112 $1,873,754 $286 $1,490,742 $383,012 $2,454,449 $963,707 $2,680,593 $1,189,851Sew/Needlework/Piece Goods Stores-45113 $415,141 $63 $0 $415,141 $543,797 $543,797 $593,901 $593,901
Musical Instrument and Supplies Stores-45114 $594,206 $91 $506,801 $87,405 $778,356 $271,555 $850,071 $343,270Prerecorded Tapes, CDs, Record Stores-45122 $803,272 $123 $1,492,628 ($689,356) $1,052,214 ($440,414) $1,149,161 ($343,467)
Food & Beverage $46,279,581 $7,067 $62,534,848 ($16,255,267) $60,622,082 ($1,912,766) $66,207,573 $3,672,725Full-Service Restaurants-7221 $23,385,995 $3,571 $20,052,008 $3,333,987 $30,633,547 $10,581,539 $33,456,007 $13,403,999
Limited Service Eating Places-7222 $20,138,765 $3,075 $42,027,192 ($21,888,427) $26,379,968 ($15,647,224) $28,810,519 ($13,216,673)Drinking Places Alcoholic Beverages-7224 $2,754,821 $421 $455,648 $2,299,173 $3,608,567 $3,152,919 $3,941,047 $3,485,399
Neighborhood Retailers $80,916,101 $12,355 $69,006,826 $11,909,275 $105,992,803 $36,985,977 $115,758,582 $46,751,756Supermarket, Grocery -44511 $40,507,302 $6,185 $18,573,132 $21,934,170 $53,060,916 $34,487,784 $57,949,750 $39,376,618
Pharmacies and Drug Stores-44611 $19,519,243 $2,980 $24,242,728 ($4,723,485) $25,568,450 $1,325,722 $27,924,231 $3,681,503Convenience Stores-44512 $2,131,600 $325 $1,368,337 $763,263 $2,792,204 $1,423,867 $3,049,467 $1,681,130Specialty Food Stores-4452 $1,331,659 $203 $2,406,849 ($1,075,190) $1,744,353 ($662,496) $1,905,071 ($501,778)
Beer, Wine and Liquor Stores-4453 $3,682,745 $562 $3,187,055 $495,690 $4,824,064 $1,637,009 $5,268,535 $2,081,480Optical Goods Stores-44613 $811,232 $124 $3,069,458 ($2,258,226) $1,062,641 ($2,006,817) $1,160,549 ($1,908,909)
Other Health and Personal Care Stores-44619 $1,359,685 $208 $906,630 $453,055 $1,781,065 $874,435 $1,945,165 $1,038,535Paint and Wallpaper Stores-44412 $771,401 $118 $0 $771,401 $1,010,466 $1,010,466 $1,103,566 $1,103,566
Hardware Stores-44413 $2,826,017 $432 $0 $2,826,017 $3,701,828 $3,701,828 $4,042,900 $4,042,900Florists-4531 $792,507 $121 $793,871 ($1,364) $1,038,113 $244,242 $1,133,761 $339,890
Other Miscellaneous Store Retailers-4539 $4,987,190 $762 $3,043,195 $1,943,995 $6,532,770 $3,489,575 $7,134,674 $4,091,479Gift, Novelty and Souvenir Stores-45322 $2,195,520 $335 $11,415,571 ($9,220,051) $2,875,933 ($8,539,638) $3,140,911 ($8,274,660)
TOTALS $227,474,977 $34,734 $243,946,519 ($16,471,542) $297,971,727 $54,025,208 $325,425,723 $81,479,204
SOURCE: RCLCO; Iexpress/Claritas, Inc.; MWCOG, Round 7.1 Cooperative Forecasts
Page 37 of 61
expend04-12172.00
Printed: 10/30/2008
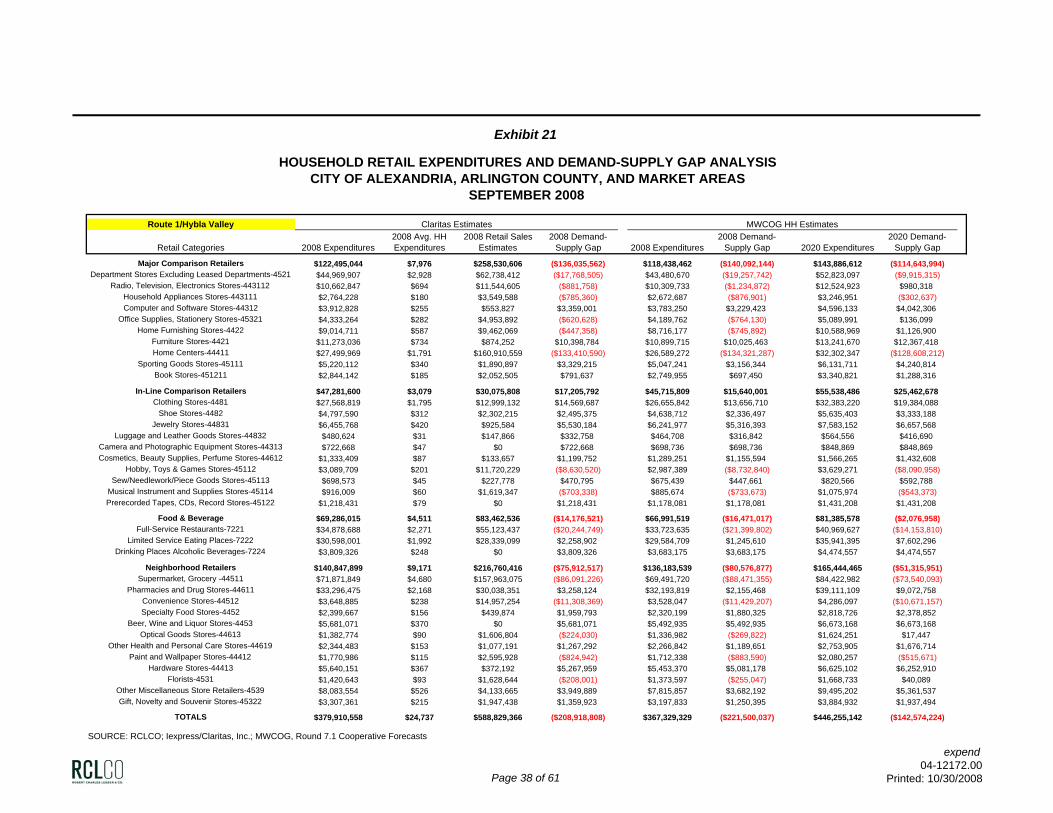
Exhibit 21
HOUSEHOLD RETAIL EXPENDITURES AND DEMAND-SUPPLY GAP ANALYSISCITY OF ALEXANDRIA, ARLINGTON COUNTY, AND MARKET AREAS
SEPTEMBER 2008
Route 1/Hybla Valley Claritas Estimates MWCOG HH Estimates
Retail Categories 2008 Expenditures2008 Avg. HH Expenditures
2008 Retail Sales Estimates
2008 Demand-Supply Gap 2008 Expenditures
2008 Demand-Supply Gap 2020 Expenditures
2020 Demand-Supply Gap
Major Comparison Retailers $122,495,044 $7,976 $258,530,606 ($136,035,562) $118,438,462 ($140,092,144) $143,886,612 ($114,643,994)Department Stores Excluding Leased Departments-4521 $44,969,907 $2,928 $62,738,412 ($17,768,505) $43,480,670 ($19,257,742) $52,823,097 ($9,915,315)
Radio, Television, Electronics Stores-443112 $10,662,847 $694 $11,544,605 ($881,758) $10,309,733 ($1,234,872) $12,524,923 $980,318Household Appliances Stores-443111 $2,764,228 $180 $3,549,588 ($785,360) $2,672,687 ($876,901) $3,246,951 ($302,637)Computer and Software Stores-44312 $3,912,828 $255 $553,827 $3,359,001 $3,783,250 $3,229,423 $4,596,133 $4,042,306
Office Supplies, Stationery Stores-45321 $4,333,264 $282 $4,953,892 ($620,628) $4,189,762 ($764,130) $5,089,991 $136,099Home Furnishing Stores-4422 $9,014,711 $587 $9,462,069 ($447,358) $8,716,177 ($745,892) $10,588,969 $1,126,900
Furniture Stores-4421 $11,273,036 $734 $874,252 $10,398,784 $10,899,715 $10,025,463 $13,241,670 $12,367,418Home Centers-44411 $27,499,969 $1,791 $160,910,559 ($133,410,590) $26,589,272 ($134,321,287) $32,302,347 ($128,608,212)
Sporting Goods Stores-45111 $5,220,112 $340 $1,890,897 $3,329,215 $5,047,241 $3,156,344 $6,131,711 $4,240,814Book Stores-451211 $2,844,142 $185 $2,052,505 $791,637 $2,749,955 $697,450 $3,340,821 $1,288,316
In-Line Comparison Retailers $47,281,600 $3,079 $30,075,808 $17,205,792 $45,715,809 $15,640,001 $55,538,486 $25,462,678Clothing Stores-4481 $27,568,819 $1,795 $12,999,132 $14,569,687 $26,655,842 $13,656,710 $32,383,220 $19,384,088
Shoe Stores-4482 $4,797,590 $312 $2,302,215 $2,495,375 $4,638,712 $2,336,497 $5,635,403 $3,333,188Jewelry Stores-44831 $6,455,768 $420 $925,584 $5,530,184 $6,241,977 $5,316,393 $7,583,152 $6,657,568
Luggage and Leather Goods Stores-44832 $480,624 $31 $147,866 $332,758 $464,708 $316,842 $564,556 $416,690Camera and Photographic Equipment Stores-44313 $722,668 $47 $0 $722,668 $698,736 $698,736 $848,869 $848,869Cosmetics, Beauty Supplies, Perfume Stores-44612 $1,333,409 $87 $133,657 $1,199,752 $1,289,251 $1,155,594 $1,566,265 $1,432,608
Hobby, Toys & Games Stores-45112 $3,089,709 $201 $11,720,229 ($8,630,520) $2,987,389 ($8,732,840) $3,629,271 ($8,090,958)Sew/Needlework/Piece Goods Stores-45113 $698,573 $45 $227,778 $470,795 $675,439 $447,661 $820,566 $592,788
Musical Instrument and Supplies Stores-45114 $916,009 $60 $1,619,347 ($703,338) $885,674 ($733,673) $1,075,974 ($543,373)Prerecorded Tapes, CDs, Record Stores-45122 $1,218,431 $79 $0 $1,218,431 $1,178,081 $1,178,081 $1,431,208 $1,431,208
Food & Beverage $69,286,015 $4,511 $83,462,536 ($14,176,521) $66,991,519 ($16,471,017) $81,385,578 ($2,076,958)Full-Service Restaurants-7221 $34,878,688 $2,271 $55,123,437 ($20,244,749) $33,723,635 ($21,399,802) $40,969,627 ($14,153,810)
Limited Service Eating Places-7222 $30,598,001 $1,992 $28,339,099 $2,258,902 $29,584,709 $1,245,610 $35,941,395 $7,602,296Drinking Places Alcoholic Beverages-7224 $3,809,326 $248 $0 $3,809,326 $3,683,175 $3,683,175 $4,474,557 $4,474,557
Neighborhood Retailers $140,847,899 $9,171 $216,760,416 ($75,912,517) $136,183,539 ($80,576,877) $165,444,465 ($51,315,951)Supermarket, Grocery -44511 $71,871,849 $4,680 $157,963,075 ($86,091,226) $69,491,720 ($88,471,355) $84,422,982 ($73,540,093)
Pharmacies and Drug Stores-44611 $33,296,475 $2,168 $30,038,351 $3,258,124 $32,193,819 $2,155,468 $39,111,109 $9,072,758Convenience Stores-44512 $3,648,885 $238 $14,957,254 ($11,308,369) $3,528,047 ($11,429,207) $4,286,097 ($10,671,157)Specialty Food Stores-4452 $2,399,667 $156 $439,874 $1,959,793 $2,320,199 $1,880,325 $2,818,726 $2,378,852
Beer, Wine and Liquor Stores-4453 $5,681,071 $370 $0 $5,681,071 $5,492,935 $5,492,935 $6,673,168 $6,673,168Optical Goods Stores-44613 $1,382,774 $90 $1,606,804 ($224,030) $1,336,982 ($269,822) $1,624,251 $17,447
Other Health and Personal Care Stores-44619 $2,344,483 $153 $1,077,191 $1,267,292 $2,266,842 $1,189,651 $2,753,905 $1,676,714Paint and Wallpaper Stores-44412 $1,770,986 $115 $2,595,928 ($824,942) $1,712,338 ($883,590) $2,080,257 ($515,671)
Hardware Stores-44413 $5,640,151 $367 $372,192 $5,267,959 $5,453,370 $5,081,178 $6,625,102 $6,252,910Florists-4531 $1,420,643 $93 $1,628,644 ($208,001) $1,373,597 ($255,047) $1,668,733 $40,089
Other Miscellaneous Store Retailers-4539 $8,083,554 $526 $4,133,665 $3,949,889 $7,815,857 $3,682,192 $9,495,202 $5,361,537Gift, Novelty and Souvenir Stores-45322 $3,307,361 $215 $1,947,438 $1,359,923 $3,197,833 $1,250,395 $3,884,932 $1,937,494
TOTALS $379,910,558 $24,737 $588,829,366 ($208,918,808) $367,329,329 ($221,500,037) $446,255,142 ($142,574,224)
SOURCE: RCLCO; Iexpress/Claritas, Inc.; MWCOG, Round 7.1 Cooperative Forecasts
Page 38 of 61
expend04-12172.00
Printed: 10/30/2008
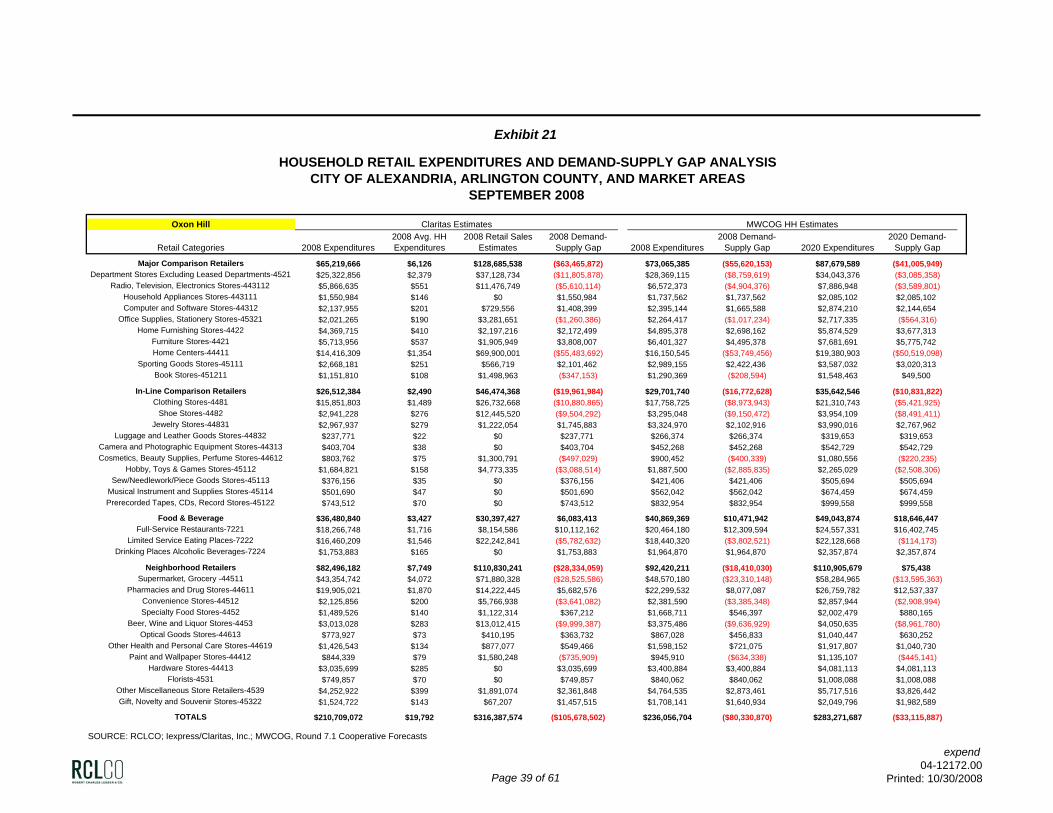
Exhibit 21
HOUSEHOLD RETAIL EXPENDITURES AND DEMAND-SUPPLY GAP ANALYSISCITY OF ALEXANDRIA, ARLINGTON COUNTY, AND MARKET AREAS
SEPTEMBER 2008
Oxon Hill Claritas Estimates MWCOG HH Estimates
Retail Categories 2008 Expenditures2008 Avg. HH Expenditures
2008 Retail Sales Estimates
2008 Demand-Supply Gap 2008 Expenditures
2008 Demand-Supply Gap 2020 Expenditures
2020 Demand-Supply Gap
Major Comparison Retailers $65,219,666 $6,126 $128,685,538 ($63,465,872) $73,065,385 ($55,620,153) $87,679,589 ($41,005,949)Department Stores Excluding Leased Departments-4521 $25,322,856 $2,379 $37,128,734 ($11,805,878) $28,369,115 ($8,759,619) $34,043,376 ($3,085,358)
Radio, Television, Electronics Stores-443112 $5,866,635 $551 $11,476,749 ($5,610,114) $6,572,373 ($4,904,376) $7,886,948 ($3,589,801)Household Appliances Stores-443111 $1,550,984 $146 $0 $1,550,984 $1,737,562 $1,737,562 $2,085,102 $2,085,102Computer and Software Stores-44312 $2,137,955 $201 $729,556 $1,408,399 $2,395,144 $1,665,588 $2,874,210 $2,144,654
Office Supplies, Stationery Stores-45321 $2,021,265 $190 $3,281,651 ($1,260,386) $2,264,417 ($1,017,234) $2,717,335 ($564,316)Home Furnishing Stores-4422 $4,369,715 $410 $2,197,216 $2,172,499 $4,895,378 $2,698,162 $5,874,529 $3,677,313
Furniture Stores-4421 $5,713,956 $537 $1,905,949 $3,808,007 $6,401,327 $4,495,378 $7,681,691 $5,775,742Home Centers-44411 $14,416,309 $1,354 $69,900,001 ($55,483,692) $16,150,545 ($53,749,456) $19,380,903 ($50,519,098)
Sporting Goods Stores-45111 $2,668,181 $251 $566,719 $2,101,462 $2,989,155 $2,422,436 $3,587,032 $3,020,313Book Stores-451211 $1,151,810 $108 $1,498,963 ($347,153) $1,290,369 ($208,594) $1,548,463 $49,500
In-Line Comparison Retailers $26,512,384 $2,490 $46,474,368 ($19,961,984) $29,701,740 ($16,772,628) $35,642,546 ($10,831,822)Clothing Stores-4481 $15,851,803 $1,489 $26,732,668 ($10,880,865) $17,758,725 ($8,973,943) $21,310,743 ($5,421,925)
Shoe Stores-4482 $2,941,228 $276 $12,445,520 ($9,504,292) $3,295,048 ($9,150,472) $3,954,109 ($8,491,411)Jewelry Stores-44831 $2,967,937 $279 $1,222,054 $1,745,883 $3,324,970 $2,102,916 $3,990,016 $2,767,962
Luggage and Leather Goods Stores-44832 $237,771 $22 $0 $237,771 $266,374 $266,374 $319,653 $319,653Camera and Photographic Equipment Stores-44313 $403,704 $38 $0 $403,704 $452,268 $452,268 $542,729 $542,729Cosmetics, Beauty Supplies, Perfume Stores-44612 $803,762 $75 $1,300,791 ($497,029) $900,452 ($400,339) $1,080,556 ($220,235)
Hobby, Toys & Games Stores-45112 $1,684,821 $158 $4,773,335 ($3,088,514) $1,887,500 ($2,885,835) $2,265,029 ($2,508,306)Sew/Needlework/Piece Goods Stores-45113 $376,156 $35 $0 $376,156 $421,406 $421,406 $505,694 $505,694
Musical Instrument and Supplies Stores-45114 $501,690 $47 $0 $501,690 $562,042 $562,042 $674,459 $674,459Prerecorded Tapes, CDs, Record Stores-45122 $743,512 $70 $0 $743,512 $832,954 $832,954 $999,558 $999,558
Food & Beverage $36,480,840 $3,427 $30,397,427 $6,083,413 $40,869,369 $10,471,942 $49,043,874 $18,646,447Full-Service Restaurants-7221 $18,266,748 $1,716 $8,154,586 $10,112,162 $20,464,180 $12,309,594 $24,557,331 $16,402,745
Limited Service Eating Places-7222 $16,460,209 $1,546 $22,242,841 ($5,782,632) $18,440,320 ($3,802,521) $22,128,668 ($114,173)Drinking Places Alcoholic Beverages-7224 $1,753,883 $165 $0 $1,753,883 $1,964,870 $1,964,870 $2,357,874 $2,357,874
Neighborhood Retailers $82,496,182 $7,749 $110,830,241 ($28,334,059) $92,420,211 ($18,410,030) $110,905,679 $75,438Supermarket, Grocery -44511 $43,354,742 $4,072 $71,880,328 ($28,525,586) $48,570,180 ($23,310,148) $58,284,965 ($13,595,363)
Pharmacies and Drug Stores-44611 $19,905,021 $1,870 $14,222,445 $5,682,576 $22,299,532 $8,077,087 $26,759,782 $12,537,337Convenience Stores-44512 $2,125,856 $200 $5,766,938 ($3,641,082) $2,381,590 ($3,385,348) $2,857,944 ($2,908,994)Specialty Food Stores-4452 $1,489,526 $140 $1,122,314 $367,212 $1,668,711 $546,397 $2,002,479 $880,165
Beer, Wine and Liquor Stores-4453 $3,013,028 $283 $13,012,415 ($9,999,387) $3,375,486 ($9,636,929) $4,050,635 ($8,961,780)Optical Goods Stores-44613 $773,927 $73 $410,195 $363,732 $867,028 $456,833 $1,040,447 $630,252
Other Health and Personal Care Stores-44619 $1,426,543 $134 $877,077 $549,466 $1,598,152 $721,075 $1,917,807 $1,040,730Paint and Wallpaper Stores-44412 $844,339 $79 $1,580,248 ($735,909) $945,910 ($634,338) $1,135,107 ($445,141)
Hardware Stores-44413 $3,035,699 $285 $0 $3,035,699 $3,400,884 $3,400,884 $4,081,113 $4,081,113Florists-4531 $749,857 $70 $0 $749,857 $840,062 $840,062 $1,008,088 $1,008,088
Other Miscellaneous Store Retailers-4539 $4,252,922 $399 $1,891,074 $2,361,848 $4,764,535 $2,873,461 $5,717,516 $3,826,442Gift, Novelty and Souvenir Stores-45322 $1,524,722 $143 $67,207 $1,457,515 $1,708,141 $1,640,934 $2,049,796 $1,982,589
TOTALS $210,709,072 $19,792 $316,387,574 ($105,678,502) $236,056,704 ($80,330,870) $283,271,687 ($33,115,887)
SOURCE: RCLCO; Iexpress/Claritas, Inc.; MWCOG, Round 7.1 Cooperative Forecasts
Page 39 of 61
expend04-12172.00
Printed: 10/30/2008
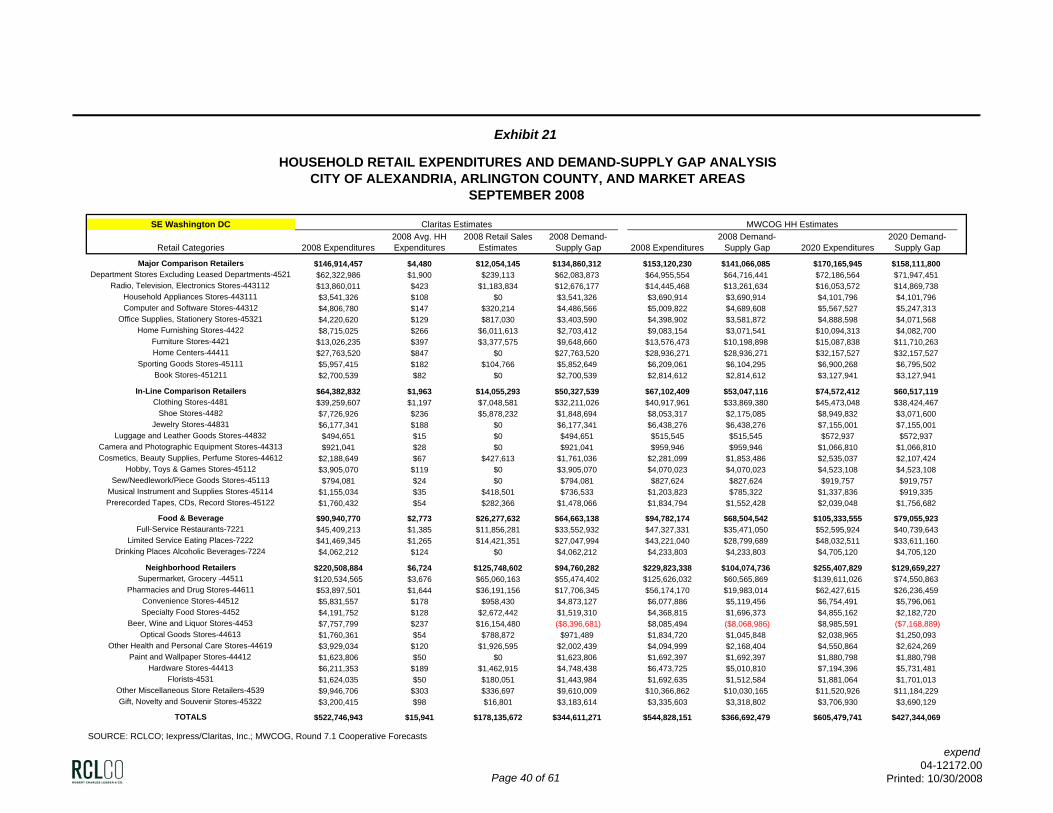
Exhibit 21
HOUSEHOLD RETAIL EXPENDITURES AND DEMAND-SUPPLY GAP ANALYSISCITY OF ALEXANDRIA, ARLINGTON COUNTY, AND MARKET AREAS
SEPTEMBER 2008
SE Washington DC Claritas Estimates MWCOG HH Estimates
Retail Categories 2008 Expenditures2008 Avg. HH Expenditures
2008 Retail Sales Estimates
2008 Demand-Supply Gap 2008 Expenditures
2008 Demand-Supply Gap 2020 Expenditures
2020 Demand-Supply Gap
Major Comparison Retailers $146,914,457 $4,480 $12,054,145 $134,860,312 $153,120,230 $141,066,085 $170,165,945 $158,111,800Department Stores Excluding Leased Departments-4521 $62,322,986 $1,900 $239,113 $62,083,873 $64,955,554 $64,716,441 $72,186,564 $71,947,451
Radio, Television, Electronics Stores-443112 $13,860,011 $423 $1,183,834 $12,676,177 $14,445,468 $13,261,634 $16,053,572 $14,869,738Household Appliances Stores-443111 $3,541,326 $108 $0 $3,541,326 $3,690,914 $3,690,914 $4,101,796 $4,101,796Computer and Software Stores-44312 $4,806,780 $147 $320,214 $4,486,566 $5,009,822 $4,689,608 $5,567,527 $5,247,313
Office Supplies, Stationery Stores-45321 $4,220,620 $129 $817,030 $3,403,590 $4,398,902 $3,581,872 $4,888,598 $4,071,568Home Furnishing Stores-4422 $8,715,025 $266 $6,011,613 $2,703,412 $9,083,154 $3,071,541 $10,094,313 $4,082,700
Furniture Stores-4421 $13,026,235 $397 $3,377,575 $9,648,660 $13,576,473 $10,198,898 $15,087,838 $11,710,263Home Centers-44411 $27,763,520 $847 $0 $27,763,520 $28,936,271 $28,936,271 $32,157,527 $32,157,527
Sporting Goods Stores-45111 $5,957,415 $182 $104,766 $5,852,649 $6,209,061 $6,104,295 $6,900,268 $6,795,502Book Stores-451211 $2,700,539 $82 $0 $2,700,539 $2,814,612 $2,814,612 $3,127,941 $3,127,941
In-Line Comparison Retailers $64,382,832 $1,963 $14,055,293 $50,327,539 $67,102,409 $53,047,116 $74,572,412 $60,517,119Clothing Stores-4481 $39,259,607 $1,197 $7,048,581 $32,211,026 $40,917,961 $33,869,380 $45,473,048 $38,424,467
Shoe Stores-4482 $7,726,926 $236 $5,878,232 $1,848,694 $8,053,317 $2,175,085 $8,949,832 $3,071,600Jewelry Stores-44831 $6,177,341 $188 $0 $6,177,341 $6,438,276 $6,438,276 $7,155,001 $7,155,001
Luggage and Leather Goods Stores-44832 $494,651 $15 $0 $494,651 $515,545 $515,545 $572,937 $572,937Camera and Photographic Equipment Stores-44313 $921,041 $28 $0 $921,041 $959,946 $959,946 $1,066,810 $1,066,810Cosmetics, Beauty Supplies, Perfume Stores-44612 $2,188,649 $67 $427,613 $1,761,036 $2,281,099 $1,853,486 $2,535,037 $2,107,424
Hobby, Toys & Games Stores-45112 $3,905,070 $119 $0 $3,905,070 $4,070,023 $4,070,023 $4,523,108 $4,523,108Sew/Needlework/Piece Goods Stores-45113 $794,081 $24 $0 $794,081 $827,624 $827,624 $919,757 $919,757
Musical Instrument and Supplies Stores-45114 $1,155,034 $35 $418,501 $736,533 $1,203,823 $785,322 $1,337,836 $919,335Prerecorded Tapes, CDs, Record Stores-45122 $1,760,432 $54 $282,366 $1,478,066 $1,834,794 $1,552,428 $2,039,048 $1,756,682
Food & Beverage $90,940,770 $2,773 $26,277,632 $64,663,138 $94,782,174 $68,504,542 $105,333,555 $79,055,923Full-Service Restaurants-7221 $45,409,213 $1,385 $11,856,281 $33,552,932 $47,327,331 $35,471,050 $52,595,924 $40,739,643
Limited Service Eating Places-7222 $41,469,345 $1,265 $14,421,351 $27,047,994 $43,221,040 $28,799,689 $48,032,511 $33,611,160Drinking Places Alcoholic Beverages-7224 $4,062,212 $124 $0 $4,062,212 $4,233,803 $4,233,803 $4,705,120 $4,705,120
Neighborhood Retailers $220,508,884 $6,724 $125,748,602 $94,760,282 $229,823,338 $104,074,736 $255,407,829 $129,659,227Supermarket, Grocery -44511 $120,534,565 $3,676 $65,060,163 $55,474,402 $125,626,032 $60,565,869 $139,611,026 $74,550,863
Pharmacies and Drug Stores-44611 $53,897,501 $1,644 $36,191,156 $17,706,345 $56,174,170 $19,983,014 $62,427,615 $26,236,459Convenience Stores-44512 $5,831,557 $178 $958,430 $4,873,127 $6,077,886 $5,119,456 $6,754,491 $5,796,061Specialty Food Stores-4452 $4,191,752 $128 $2,672,442 $1,519,310 $4,368,815 $1,696,373 $4,855,162 $2,182,720
Beer, Wine and Liquor Stores-4453 $7,757,799 $237 $16,154,480 ($8,396,681) $8,085,494 ($8,068,986) $8,985,591 ($7,168,889)Optical Goods Stores-44613 $1,760,361 $54 $788,872 $971,489 $1,834,720 $1,045,848 $2,038,965 $1,250,093
Other Health and Personal Care Stores-44619 $3,929,034 $120 $1,926,595 $2,002,439 $4,094,999 $2,168,404 $4,550,864 $2,624,269Paint and Wallpaper Stores-44412 $1,623,806 $50 $0 $1,623,806 $1,692,397 $1,692,397 $1,880,798 $1,880,798
Hardware Stores-44413 $6,211,353 $189 $1,462,915 $4,748,438 $6,473,725 $5,010,810 $7,194,396 $5,731,481Florists-4531 $1,624,035 $50 $180,051 $1,443,984 $1,692,635 $1,512,584 $1,881,064 $1,701,013
Other Miscellaneous Store Retailers-4539 $9,946,706 $303 $336,697 $9,610,009 $10,366,862 $10,030,165 $11,520,926 $11,184,229Gift, Novelty and Souvenir Stores-45322 $3,200,415 $98 $16,801 $3,183,614 $3,335,603 $3,318,802 $3,706,930 $3,690,129
TOTALS $522,746,943 $15,941 $178,135,672 $344,611,271 $544,828,151 $366,692,479 $605,479,741 $427,344,069
SOURCE: RCLCO; Iexpress/Claritas, Inc.; MWCOG, Round 7.1 Cooperative Forecasts
Page 40 of 61
expend04-12172.00
Printed: 10/30/2008

Exhibit 21
HOUSEHOLD RETAIL EXPENDITURES AND DEMAND-SUPPLY GAP ANALYSISCITY OF ALEXANDRIA, ARLINGTON COUNTY, AND MARKET AREAS
SEPTEMBER 2008
Southern Downtown DC Claritas Estimates MWCOG HH Estimates
Retail Categories 2008 Expenditures2008 Avg. HH Expenditures
2008 Retail Sales Estimates
2008 Demand-Supply Gap 2008 Expenditures
2008 Demand-Supply Gap 2020 Expenditures
2020 Demand-Supply Gap
Major Comparison Retailers $123,802,571 $6,380 $126,576,127 ($2,773,556) $147,501,519 $20,925,392 $199,892,093 $73,315,966Department Stores Excluding Leased Departments-4521 $45,828,553 $2,362 $26,388,776 $19,439,777 $54,601,299 $28,212,523 $73,994,953 $47,606,177
Radio, Television, Electronics Stores-443112 $11,513,317 $593 $5,509,442 $6,003,875 $13,717,258 $8,207,816 $18,589,445 $13,080,003Household Appliances Stores-443111 $2,875,793 $148 $589,112 $2,286,681 $3,426,293 $2,837,181 $4,643,266 $4,054,154Computer and Software Stores-44312 $4,249,630 $219 $9,527,603 ($5,277,973) $5,063,117 ($4,464,486) $6,861,468 ($2,666,135)
Office Supplies, Stationery Stores-45321 $4,569,531 $235 $2,446,919 $2,122,612 $5,444,255 $2,997,336 $7,377,982 $4,931,063Home Furnishing Stores-4422 $8,878,566 $458 $10,085,459 ($1,206,893) $10,578,148 $492,689 $14,335,366 $4,249,907
Furniture Stores-4421 $11,889,484 $613 $7,211,311 $4,678,173 $14,165,432 $6,954,121 $19,196,805 $11,985,494Home Centers-44411 $25,381,667 $1,308 $51,275,370 ($25,893,703) $30,240,361 ($21,035,009) $40,981,334 ($10,294,036)
Sporting Goods Stores-45111 $5,415,450 $279 $1,754,183 $3,661,267 $6,452,104 $4,697,921 $8,743,806 $6,989,623Book Stores-451211 $3,200,580 $165 $11,787,952 ($8,587,372) $3,813,252 ($7,974,700) $5,167,668 ($6,620,284)
In-Line Comparison Retailers $48,436,567 $2,496 $39,039,567 $9,397,000 $57,708,553 $18,668,986 $78,205,862 $39,166,295Clothing Stores-4481 $27,634,049 $1,424 $28,400,576 ($766,527) $32,923,906 $4,523,330 $44,618,039 $16,217,463
Shoe Stores-4482 $4,611,751 $238 $1,938,650 $2,673,101 $5,494,557 $3,555,907 $7,446,150 $5,507,500Jewelry Stores-44831 $7,369,960 $380 $2,737,436 $4,632,524 $8,780,757 $6,043,321 $11,899,565 $9,162,129
Luggage and Leather Goods Stores-44832 $514,523 $27 $862,193 ($347,670) $613,016 ($249,177) $830,751 ($31,442)Camera and Photographic Equipment Stores-44313 $750,499 $39 $1,709,158 ($958,659) $894,164 ($814,994) $1,211,758 ($497,400)Cosmetics, Beauty Supplies, Perfume Stores-44612 $1,489,694 $77 $855,231 $634,463 $1,774,859 $919,628 $2,405,265 $1,550,034
Hobby, Toys & Games Stores-45112 $3,039,199 $157 $220,642 $2,818,557 $3,620,979 $3,400,337 $4,907,102 $4,686,460Sew/Needlework/Piece Goods Stores-45113 $704,428 $36 $1,264,668 ($560,240) $839,273 ($425,395) $1,137,372 ($127,296)
Musical Instrument and Supplies Stores-45114 $966,672 $50 $1,051,013 ($84,341) $1,151,718 $100,705 $1,560,792 $509,779Prerecorded Tapes, CDs, Record Stores-45122 $1,355,792 $70 $0 $1,355,792 $1,615,325 $1,615,325 $2,189,067 $2,189,067
Food & Beverage $76,876,783 $3,961 $253,711,858 ($176,835,075) $91,592,947 ($162,118,911) $124,125,541 ($129,586,317)Full-Service Restaurants-7221 $38,815,930 $2,000 $82,160,880 ($43,344,950) $46,246,282 ($35,914,598) $62,672,345 ($19,488,535)
Limited Service Eating Places-7222 $33,551,142 $1,729 $155,964,928 ($122,413,786) $39,973,681 ($115,991,247) $54,171,799 ($101,793,129)Drinking Places Alcoholic Beverages-7224 $4,509,711 $232 $15,586,050 ($11,076,339) $5,372,984 ($10,213,066) $7,281,396 ($8,304,654)
Neighborhood Retailers $145,404,869 $7,493 $207,146,812 ($61,741,943) $173,239,044 ($33,907,768) $234,771,244 $27,624,432Supermarket, Grocery -44511 $71,952,087 $3,708 $82,181,254 ($10,229,167) $85,725,539 $3,544,285 $116,174,108 $33,992,854
Pharmacies and Drug Stores-44611 $36,725,405 $1,892 $81,922,998 ($45,197,593) $43,755,578 ($38,167,420) $59,296,976 ($22,626,022)Convenience Stores-44512 $3,702,684 $191 $1,042,001 $2,660,683 $4,411,472 $3,369,471 $5,978,367 $4,936,366Specialty Food Stores-4452 $2,377,912 $123 $3,716,223 ($1,338,311) $2,833,105 ($883,118) $3,839,386 $123,163
Beer, Wine and Liquor Stores-4453 $6,358,507 $328 $13,815,664 ($7,457,157) $7,575,686 ($6,239,978) $10,266,469 ($3,549,195)Optical Goods Stores-44613 $1,422,934 $73 $3,347,678 ($1,924,744) $1,695,320 ($1,652,358) $2,297,475 ($1,050,203)
Other Health and Personal Care Stores-44619 $2,595,927 $134 $2,236,174 $359,753 $3,092,853 $856,679 $4,191,393 $1,955,219Paint and Wallpaper Stores-44412 $1,576,614 $81 $702,874 $873,740 $1,878,418 $1,175,544 $2,545,607 $1,842,733
Hardware Stores-44413 $5,445,147 $281 $9,143,219 ($3,698,072) $6,487,486 ($2,655,733) $8,791,755 ($351,464)Florists-4531 $1,438,757 $74 $871,079 $567,678 $1,714,172 $843,093 $2,323,022 $1,451,943
Other Miscellaneous Store Retailers-4539 $8,360,471 $431 $5,761,864 $2,598,607 $9,960,877 $4,199,013 $13,498,848 $7,736,984Gift, Novelty and Souvenir Stores-45322 $3,448,424 $178 $2,405,784 $1,042,640 $4,108,540 $1,702,756 $5,567,838 $3,162,054
TOTALS $394,520,790 $20,330 $626,474,364 ($231,953,574) $470,042,063 ($156,432,301) $636,994,739 $10,520,375
SOURCE: RCLCO; Iexpress/Claritas, Inc.; MWCOG, Round 7.1 Cooperative Forecasts
Page 41 of 61
expend04-12172.00
Printed: 10/30/2008
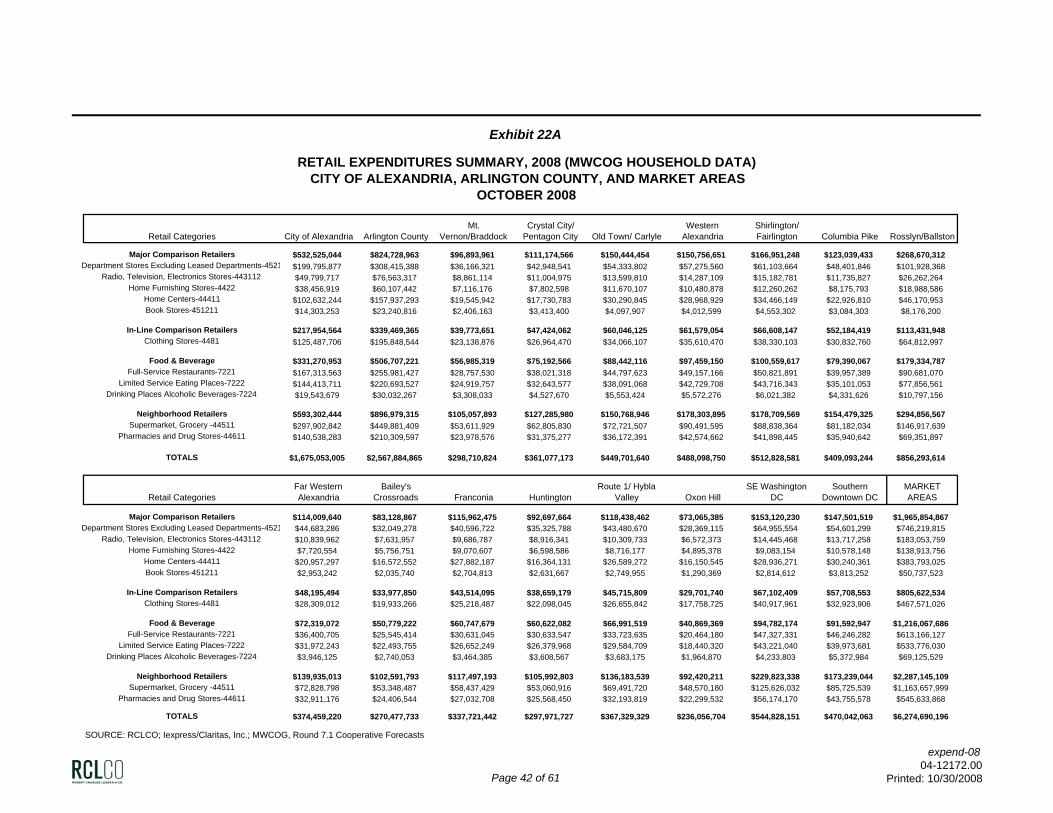
Exhibit 22A
RETAIL EXPENDITURES SUMMARY, 2008 (MWCOG HOUSEHOLD DATA)CITY OF ALEXANDRIA, ARLINGTON COUNTY, AND MARKET AREAS
OCTOBER 2008
Retail Categories City of Alexandria Arlington CountyMt.
Vernon/BraddockCrystal City/
Pentagon City Old Town/ CarlyleWestern
AlexandriaShirlington/ Fairlington Columbia Pike Rosslyn/Ballston
Major Comparison Retailers $532,525,044 $824,728,963 $96,893,961 $111,174,566 $150,444,454 $150,756,651 $166,951,248 $123,039,433 $268,670,312Department Stores Excluding Leased Departments-4521 $199,795,877 $308,415,388 $36,166,321 $42,948,541 $54,333,802 $57,275,560 $61,103,664 $48,401,846 $101,928,368
Radio, Television, Electronics Stores-443112 $49,799,717 $76,563,317 $8,861,114 $11,004,975 $13,599,810 $14,287,109 $15,182,781 $11,735,827 $26,262,264Home Furnishing Stores-4422 $38,456,919 $60,107,442 $7,116,176 $7,802,598 $11,670,107 $10,480,878 $12,260,262 $8,175,793 $18,988,586
Home Centers-44411 $102,632,244 $157,937,293 $19,545,942 $17,730,783 $30,290,845 $28,968,929 $34,466,149 $22,926,810 $46,170,953Book Stores-451211 $14,303,253 $23,240,816 $2,406,163 $3,413,400 $4,097,907 $4,012,599 $4,553,302 $3,084,303 $8,176,200
In-Line Comparison Retailers $217,954,564 $339,469,365 $39,773,651 $47,424,062 $60,046,125 $61,579,054 $66,608,147 $52,184,419 $113,431,948Clothing Stores-4481 $125,487,706 $195,848,544 $23,138,876 $26,964,470 $34,066,107 $35,610,470 $38,330,103 $30,832,760 $64,812,997
Food & Beverage $331,270,953 $506,707,221 $56,985,319 $75,192,566 $88,442,116 $97,459,150 $100,559,617 $79,390,067 $179,334,787Full-Service Restaurants-7221 $167,313,563 $255,981,427 $28,757,530 $38,021,318 $44,797,623 $49,157,166 $50,821,891 $39,957,389 $90,681,070
Limited Service Eating Places-7222 $144,413,711 $220,693,527 $24,919,757 $32,643,577 $38,091,068 $42,729,708 $43,716,343 $35,101,053 $77,856,561Drinking Places Alcoholic Beverages-7224 $19,543,679 $30,032,267 $3,308,033 $4,527,670 $5,553,424 $5,572,276 $6,021,382 $4,331,626 $10,797,156
Neighborhood Retailers $593,302,444 $896,979,315 $105,057,893 $127,285,980 $150,768,946 $178,303,895 $178,709,569 $154,479,325 $294,856,567Supermarket, Grocery -44511 $297,902,842 $449,881,409 $53,611,929 $62,805,830 $72,721,507 $90,491,595 $88,838,364 $81,182,034 $146,917,639
Pharmacies and Drug Stores-44611 $140,538,283 $210,309,597 $23,978,576 $31,375,277 $36,172,391 $42,574,662 $41,898,445 $35,940,642 $69,351,897
TOTALS $1,675,053,005 $2,567,884,865 $298,710,824 $361,077,173 $449,701,640 $488,098,750 $512,828,581 $409,093,244 $856,293,614
Retail CategoriesFar Western Alexandria
Bailey's Crossroads Franconia Huntington
Route 1/ Hybla Valley Oxon Hill
SE Washington DC
Southern Downtown DC
MARKET AREAS
Major Comparison Retailers $114,009,640 $83,128,867 $115,962,475 $92,697,664 $118,438,462 $73,065,385 $153,120,230 $147,501,519 $1,965,854,867Department Stores Excluding Leased Departments-4521 $44,683,286 $32,049,278 $40,596,722 $35,325,788 $43,480,670 $28,369,115 $64,955,554 $54,601,299 $746,219,815
Radio, Television, Electronics Stores-443112 $10,839,962 $7,631,957 $9,686,787 $8,916,341 $10,309,733 $6,572,373 $14,445,468 $13,717,258 $183,053,759Home Furnishing Stores-4422 $7,720,554 $5,756,751 $9,070,607 $6,598,586 $8,716,177 $4,895,378 $9,083,154 $10,578,148 $138,913,756
Home Centers-44411 $20,957,297 $16,572,552 $27,882,187 $16,364,131 $26,589,272 $16,150,545 $28,936,271 $30,240,361 $383,793,025Book Stores-451211 $2,953,242 $2,035,740 $2,704,813 $2,631,667 $2,749,955 $1,290,369 $2,814,612 $3,813,252 $50,737,523
In-Line Comparison Retailers $48,195,494 $33,977,850 $43,514,095 $38,659,179 $45,715,809 $29,701,740 $67,102,409 $57,708,553 $805,622,534Clothing Stores-4481 $28,309,012 $19,933,266 $25,218,487 $22,098,045 $26,655,842 $17,758,725 $40,917,961 $32,923,906 $467,571,026
Food & Beverage $72,319,072 $50,779,222 $60,747,679 $60,622,082 $66,991,519 $40,869,369 $94,782,174 $91,592,947 $1,216,067,686Full-Service Restaurants-7221 $36,400,705 $25,545,414 $30,631,045 $30,633,547 $33,723,635 $20,464,180 $47,327,331 $46,246,282 $613,166,127
Limited Service Eating Places-7222 $31,972,243 $22,493,755 $26,652,249 $26,379,968 $29,584,709 $18,440,320 $43,221,040 $39,973,681 $533,776,030Drinking Places Alcoholic Beverages-7224 $3,946,125 $2,740,053 $3,464,385 $3,608,567 $3,683,175 $1,964,870 $4,233,803 $5,372,984 $69,125,529
Neighborhood Retailers $139,935,013 $102,591,793 $117,497,193 $105,992,803 $136,183,539 $92,420,211 $229,823,338 $173,239,044 $2,287,145,109Supermarket, Grocery -44511 $72,828,798 $53,348,487 $58,437,429 $53,060,916 $69,491,720 $48,570,180 $125,626,032 $85,725,539 $1,163,657,999
Pharmacies and Drug Stores-44611 $32,911,176 $24,406,544 $27,032,708 $25,568,450 $32,193,819 $22,299,532 $56,174,170 $43,755,578 $545,633,868
TOTALS $374,459,220 $270,477,733 $337,721,442 $297,971,727 $367,329,329 $236,056,704 $544,828,151 $470,042,063 $6,274,690,196
SOURCE: RCLCO; Iexpress/Claritas, Inc.; MWCOG, Round 7.1 Cooperative Forecasts
Page 42 of 61
expend-0804-12172.00
Printed: 10/30/2008
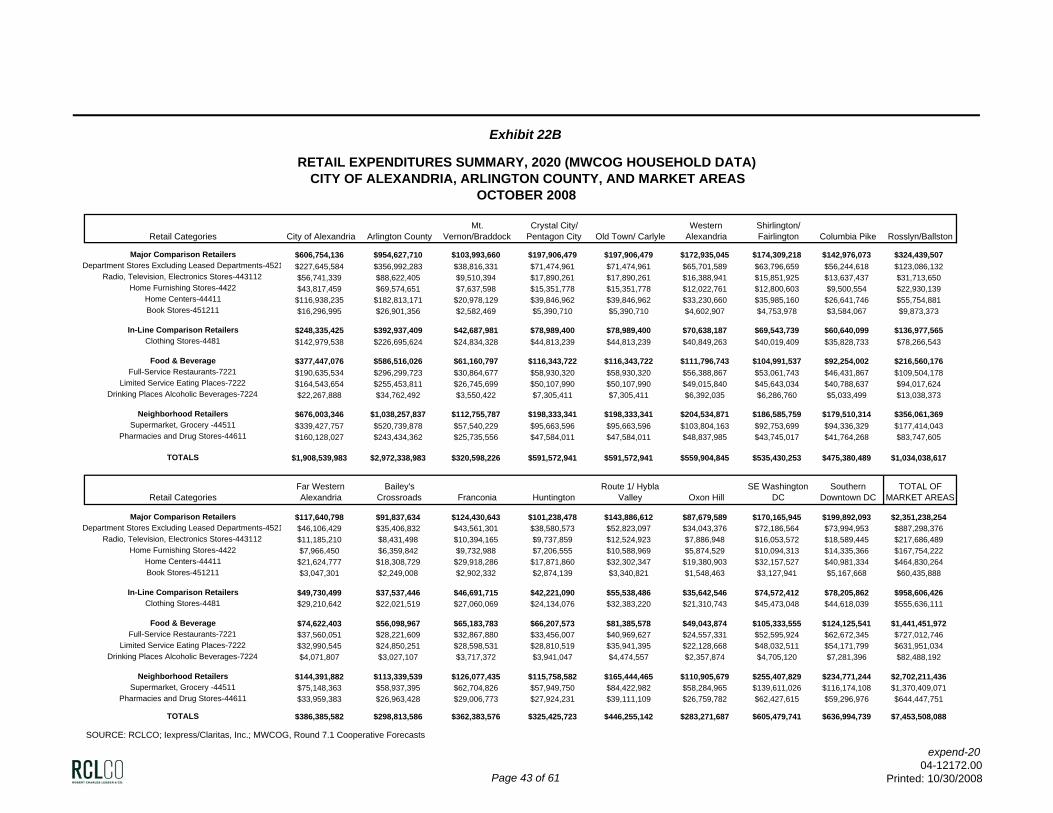
Exhibit 22B
RETAIL EXPENDITURES SUMMARY, 2020 (MWCOG HOUSEHOLD DATA)CITY OF ALEXANDRIA, ARLINGTON COUNTY, AND MARKET AREAS
OCTOBER 2008
Retail Categories City of Alexandria Arlington CountyMt.
Vernon/BraddockCrystal City/
Pentagon City Old Town/ CarlyleWestern
AlexandriaShirlington/ Fairlington Columbia Pike Rosslyn/Ballston
Major Comparison Retailers $606,754,136 $954,627,710 $103,993,660 $197,906,479 $197,906,479 $172,935,045 $174,309,218 $142,976,073 $324,439,507Department Stores Excluding Leased Departments-4521 $227,645,584 $356,992,283 $38,816,331 $71,474,961 $71,474,961 $65,701,589 $63,796,659 $56,244,618 $123,086,132
Radio, Television, Electronics Stores-443112 $56,741,339 $88,622,405 $9,510,394 $17,890,261 $17,890,261 $16,388,941 $15,851,925 $13,637,437 $31,713,650Home Furnishing Stores-4422 $43,817,459 $69,574,651 $7,637,598 $15,351,778 $15,351,778 $12,022,761 $12,800,603 $9,500,554 $22,930,139
Home Centers-44411 $116,938,235 $182,813,171 $20,978,129 $39,846,962 $39,846,962 $33,230,660 $35,985,160 $26,641,746 $55,754,881Book Stores-451211 $16,296,995 $26,901,356 $2,582,469 $5,390,710 $5,390,710 $4,602,907 $4,753,978 $3,584,067 $9,873,373
In-Line Comparison Retailers $248,335,425 $392,937,409 $42,687,981 $78,989,400 $78,989,400 $70,638,187 $69,543,739 $60,640,099 $136,977,565Clothing Stores-4481 $142,979,538 $226,695,624 $24,834,328 $44,813,239 $44,813,239 $40,849,263 $40,019,409 $35,828,733 $78,266,543
Food & Beverage $377,447,076 $586,516,026 $61,160,797 $116,343,722 $116,343,722 $111,796,743 $104,991,537 $92,254,002 $216,560,176Full-Service Restaurants-7221 $190,635,534 $296,299,723 $30,864,677 $58,930,320 $58,930,320 $56,388,867 $53,061,743 $46,431,867 $109,504,178
Limited Service Eating Places-7222 $164,543,654 $255,453,811 $26,745,699 $50,107,990 $50,107,990 $49,015,840 $45,643,034 $40,788,637 $94,017,624Drinking Places Alcoholic Beverages-7224 $22,267,888 $34,762,492 $3,550,422 $7,305,411 $7,305,411 $6,392,035 $6,286,760 $5,033,499 $13,038,373
Neighborhood Retailers $676,003,346 $1,038,257,837 $112,755,787 $198,333,341 $198,333,341 $204,534,871 $186,585,759 $179,510,314 $356,061,369Supermarket, Grocery -44511 $339,427,757 $520,739,878 $57,540,229 $95,663,596 $95,663,596 $103,804,163 $92,753,699 $94,336,329 $177,414,043
Pharmacies and Drug Stores-44611 $160,128,027 $243,434,362 $25,735,556 $47,584,011 $47,584,011 $48,837,985 $43,745,017 $41,764,268 $83,747,605
TOTALS $1,908,539,983 $2,972,338,983 $320,598,226 $591,572,941 $591,572,941 $559,904,845 $535,430,253 $475,380,489 $1,034,038,617
Retail CategoriesFar Western Alexandria
Bailey's Crossroads Franconia Huntington
Route 1/ Hybla Valley Oxon Hill
SE Washington DC
Southern Downtown DC
TOTAL OF MARKET AREAS
Major Comparison Retailers $117,640,798 $91,837,634 $124,430,643 $101,238,478 $143,886,612 $87,679,589 $170,165,945 $199,892,093 $2,351,238,254Department Stores Excluding Leased Departments-4521 $46,106,429 $35,406,832 $43,561,301 $38,580,573 $52,823,097 $34,043,376 $72,186,564 $73,994,953 $887,298,376
Radio, Television, Electronics Stores-443112 $11,185,210 $8,431,498 $10,394,165 $9,737,859 $12,524,923 $7,886,948 $16,053,572 $18,589,445 $217,686,489Home Furnishing Stores-4422 $7,966,450 $6,359,842 $9,732,988 $7,206,555 $10,588,969 $5,874,529 $10,094,313 $14,335,366 $167,754,222
Home Centers-44411 $21,624,777 $18,308,729 $29,918,286 $17,871,860 $32,302,347 $19,380,903 $32,157,527 $40,981,334 $464,830,264Book Stores-451211 $3,047,301 $2,249,008 $2,902,332 $2,874,139 $3,340,821 $1,548,463 $3,127,941 $5,167,668 $60,435,888
In-Line Comparison Retailers $49,730,499 $37,537,446 $46,691,715 $42,221,090 $55,538,486 $35,642,546 $74,572,412 $78,205,862 $958,606,426Clothing Stores-4481 $29,210,642 $22,021,519 $27,060,069 $24,134,076 $32,383,220 $21,310,743 $45,473,048 $44,618,039 $555,636,111
Food & Beverage $74,622,403 $56,098,967 $65,183,783 $66,207,573 $81,385,578 $49,043,874 $105,333,555 $124,125,541 $1,441,451,972Full-Service Restaurants-7221 $37,560,051 $28,221,609 $32,867,880 $33,456,007 $40,969,627 $24,557,331 $52,595,924 $62,672,345 $727,012,746
Limited Service Eating Places-7222 $32,990,545 $24,850,251 $28,598,531 $28,810,519 $35,941,395 $22,128,668 $48,032,511 $54,171,799 $631,951,034Drinking Places Alcoholic Beverages-7224 $4,071,807 $3,027,107 $3,717,372 $3,941,047 $4,474,557 $2,357,874 $4,705,120 $7,281,396 $82,488,192
Neighborhood Retailers $144,391,882 $113,339,539 $126,077,435 $115,758,582 $165,444,465 $110,905,679 $255,407,829 $234,771,244 $2,702,211,436Supermarket, Grocery -44511 $75,148,363 $58,937,395 $62,704,826 $57,949,750 $84,422,982 $58,284,965 $139,611,026 $116,174,108 $1,370,409,071
Pharmacies and Drug Stores-44611 $33,959,383 $26,963,428 $29,006,773 $27,924,231 $39,111,109 $26,759,782 $62,427,615 $59,296,976 $644,447,751
TOTALS $386,385,582 $298,813,586 $362,383,576 $325,425,723 $446,255,142 $283,271,687 $605,479,741 $636,994,739 $7,453,508,088
SOURCE: RCLCO; Iexpress/Claritas, Inc.; MWCOG, Round 7.1 Cooperative Forecasts
Page 43 of 61
expend-2004-12172.00
Printed: 10/30/2008
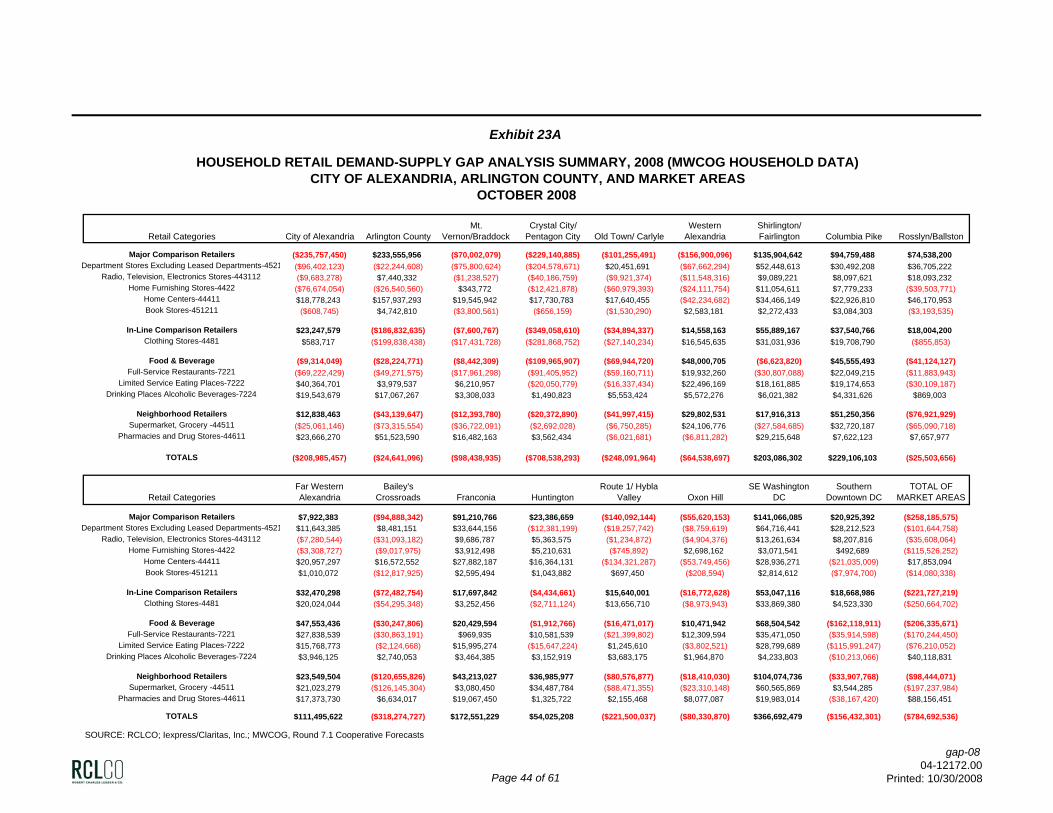
Exhibit 23A
HOUSEHOLD RETAIL DEMAND-SUPPLY GAP ANALYSIS SUMMARY, 2008 (MWCOG HOUSEHOLD DATA)CITY OF ALEXANDRIA, ARLINGTON COUNTY, AND MARKET AREAS
OCTOBER 2008
Retail Categories City of Alexandria Arlington CountyMt.
Vernon/BraddockCrystal City/
Pentagon City Old Town/ CarlyleWestern
AlexandriaShirlington/ Fairlington Columbia Pike Rosslyn/Ballston
Major Comparison Retailers ($235,757,450) $233,555,956 ($70,002,079) ($229,140,885) ($101,255,491) ($156,900,096) $135,904,642 $94,759,488 $74,538,200Department Stores Excluding Leased Departments-4521 ($96,402,123) ($22,244,608) ($75,800,624) ($204,578,671) $20,451,691 ($67,662,294) $52,448,613 $30,492,208 $36,705,222
Radio, Television, Electronics Stores-443112 ($9,683,278) $7,440,332 ($1,238,527) ($40,186,759) ($9,921,374) ($11,548,316) $9,089,221 $8,097,621 $18,093,232Home Furnishing Stores-4422 ($76,674,054) ($26,540,560) $343,772 ($12,421,878) ($60,979,393) ($24,111,754) $11,054,611 $7,779,233 ($39,503,771)
Home Centers-44411 $18,778,243 $157,937,293 $19,545,942 $17,730,783 $17,640,455 ($42,234,682) $34,466,149 $22,926,810 $46,170,953Book Stores-451211 ($608,745) $4,742,810 ($3,800,561) ($656,159) ($1,530,290) $2,583,181 $2,272,433 $3,084,303 ($3,193,535)
In-Line Comparison Retailers $23,247,579 ($186,832,635) ($7,600,767) ($349,058,610) ($34,894,337) $14,558,163 $55,889,167 $37,540,766 $18,004,200Clothing Stores-4481 $583,717 ($199,838,438) ($17,431,728) ($281,868,752) ($27,140,234) $16,545,635 $31,031,936 $19,708,790 ($855,853)
Food & Beverage ($9,314,049) ($28,224,771) ($8,442,309) ($109,965,907) ($69,944,720) $48,000,705 ($6,623,820) $45,555,493 ($41,124,127)Full-Service Restaurants-7221 ($69,222,429) ($49,271,575) ($17,961,298) ($91,405,952) ($59,160,711) $19,932,260 ($30,807,088) $22,049,215 ($11,883,943)
Limited Service Eating Places-7222 $40,364,701 $3,979,537 $6,210,957 ($20,050,779) ($16,337,434) $22,496,169 $18,161,885 $19,174,653 ($30,109,187)Drinking Places Alcoholic Beverages-7224 $19,543,679 $17,067,267 $3,308,033 $1,490,823 $5,553,424 $5,572,276 $6,021,382 $4,331,626 $869,003
Neighborhood Retailers $12,838,463 ($43,139,647) ($12,393,780) ($20,372,890) ($41,997,415) $29,802,531 $17,916,313 $51,250,356 ($76,921,929)Supermarket, Grocery -44511 ($25,061,146) ($73,315,554) ($36,722,091) ($2,692,028) ($6,750,285) $24,106,776 ($27,584,685) $32,720,187 ($65,090,718)
Pharmacies and Drug Stores-44611 $23,666,270 $51,523,590 $16,482,163 $3,562,434 ($6,021,681) ($6,811,282) $29,215,648 $7,622,123 $7,657,977
TOTALS ($208,985,457) ($24,641,096) ($98,438,935) ($708,538,293) ($248,091,964) ($64,538,697) $203,086,302 $229,106,103 ($25,503,656)
Retail CategoriesFar Western Alexandria
Bailey's Crossroads Franconia Huntington
Route 1/ Hybla Valley Oxon Hill
SE Washington DC
Southern Downtown DC
TOTAL OF MARKET AREAS
Major Comparison Retailers $7,922,383 ($94,888,342) $91,210,766 $23,386,659 ($140,092,144) ($55,620,153) $141,066,085 $20,925,392 ($258,185,575)Department Stores Excluding Leased Departments-4521 $11,643,385 $8,481,151 $33,644,156 ($12,381,199) ($19,257,742) ($8,759,619) $64,716,441 $28,212,523 ($101,644,758)
Radio, Television, Electronics Stores-443112 ($7,280,544) ($31,093,182) $9,686,787 $5,363,575 ($1,234,872) ($4,904,376) $13,261,634 $8,207,816 ($35,608,064)Home Furnishing Stores-4422 ($3,308,727) ($9,017,975) $3,912,498 $5,210,631 ($745,892) $2,698,162 $3,071,541 $492,689 ($115,526,252)
Home Centers-44411 $20,957,297 $16,572,552 $27,882,187 $16,364,131 ($134,321,287) ($53,749,456) $28,936,271 ($21,035,009) $17,853,094Book Stores-451211 $1,010,072 ($12,817,925) $2,595,494 $1,043,882 $697,450 ($208,594) $2,814,612 ($7,974,700) ($14,080,338)
In-Line Comparison Retailers $32,470,298 ($72,482,754) $17,697,842 ($4,434,661) $15,640,001 ($16,772,628) $53,047,116 $18,668,986 ($221,727,219)Clothing Stores-4481 $20,024,044 ($54,295,348) $3,252,456 ($2,711,124) $13,656,710 ($8,973,943) $33,869,380 $4,523,330 ($250,664,702)
Food & Beverage $47,553,436 ($30,247,806) $20,429,594 ($1,912,766) ($16,471,017) $10,471,942 $68,504,542 ($162,118,911) ($206,335,671)Full-Service Restaurants-7221 $27,838,539 ($30,863,191) $969,935 $10,581,539 ($21,399,802) $12,309,594 $35,471,050 ($35,914,598) ($170,244,450)
Limited Service Eating Places-7222 $15,768,773 ($2,124,668) $15,995,274 ($15,647,224) $1,245,610 ($3,802,521) $28,799,689 ($115,991,247) ($76,210,052)Drinking Places Alcoholic Beverages-7224 $3,946,125 $2,740,053 $3,464,385 $3,152,919 $3,683,175 $1,964,870 $4,233,803 ($10,213,066) $40,118,831
Neighborhood Retailers $23,549,504 ($120,655,826) $43,213,027 $36,985,977 ($80,576,877) ($18,410,030) $104,074,736 ($33,907,768) ($98,444,071)Supermarket, Grocery -44511 $21,023,279 ($126,145,304) $3,080,450 $34,487,784 ($88,471,355) ($23,310,148) $60,565,869 $3,544,285 ($197,237,984)
Pharmacies and Drug Stores-44611 $17,373,730 $6,634,017 $19,067,450 $1,325,722 $2,155,468 $8,077,087 $19,983,014 ($38,167,420) $88,156,451
TOTALS $111,495,622 ($318,274,727) $172,551,229 $54,025,208 ($221,500,037) ($80,330,870) $366,692,479 ($156,432,301) ($784,692,536)
SOURCE: RCLCO; Iexpress/Claritas, Inc.; MWCOG, Round 7.1 Cooperative Forecasts
Page 44 of 61
gap-0804-12172.00
Printed: 10/30/2008
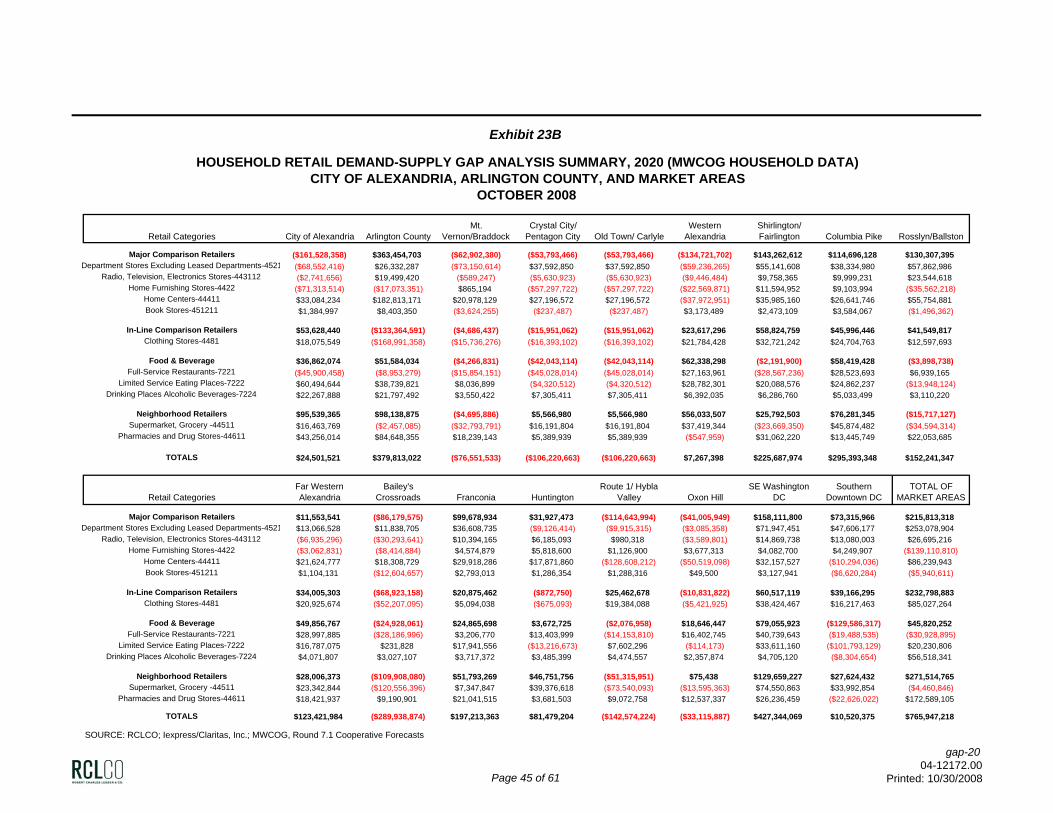
Exhibit 23B
HOUSEHOLD RETAIL DEMAND-SUPPLY GAP ANALYSIS SUMMARY, 2020 (MWCOG HOUSEHOLD DATA)CITY OF ALEXANDRIA, ARLINGTON COUNTY, AND MARKET AREAS
OCTOBER 2008
Retail Categories City of Alexandria Arlington CountyMt.
Vernon/BraddockCrystal City/
Pentagon City Old Town/ CarlyleWestern
AlexandriaShirlington/ Fairlington Columbia Pike Rosslyn/Ballston
Major Comparison Retailers ($161,528,358) $363,454,703 ($62,902,380) ($53,793,466) ($53,793,466) ($134,721,702) $143,262,612 $114,696,128 $130,307,395Department Stores Excluding Leased Departments-4521 ($68,552,416) $26,332,287 ($73,150,614) $37,592,850 $37,592,850 ($59,236,265) $55,141,608 $38,334,980 $57,862,986
Radio, Television, Electronics Stores-443112 ($2,741,656) $19,499,420 ($589,247) ($5,630,923) ($5,630,923) ($9,446,484) $9,758,365 $9,999,231 $23,544,618Home Furnishing Stores-4422 ($71,313,514) ($17,073,351) $865,194 ($57,297,722) ($57,297,722) ($22,569,871) $11,594,952 $9,103,994 ($35,562,218)
Home Centers-44411 $33,084,234 $182,813,171 $20,978,129 $27,196,572 $27,196,572 ($37,972,951) $35,985,160 $26,641,746 $55,754,881Book Stores-451211 $1,384,997 $8,403,350 ($3,624,255) ($237,487) ($237,487) $3,173,489 $2,473,109 $3,584,067 ($1,496,362)
In-Line Comparison Retailers $53,628,440 ($133,364,591) ($4,686,437) ($15,951,062) ($15,951,062) $23,617,296 $58,824,759 $45,996,446 $41,549,817Clothing Stores-4481 $18,075,549 ($168,991,358) ($15,736,276) ($16,393,102) ($16,393,102) $21,784,428 $32,721,242 $24,704,763 $12,597,693
Food & Beverage $36,862,074 $51,584,034 ($4,266,831) ($42,043,114) ($42,043,114) $62,338,298 ($2,191,900) $58,419,428 ($3,898,738)Full-Service Restaurants-7221 ($45,900,458) ($8,953,279) ($15,854,151) ($45,028,014) ($45,028,014) $27,163,961 ($28,567,236) $28,523,693 $6,939,165
Limited Service Eating Places-7222 $60,494,644 $38,739,821 $8,036,899 ($4,320,512) ($4,320,512) $28,782,301 $20,088,576 $24,862,237 ($13,948,124)Drinking Places Alcoholic Beverages-7224 $22,267,888 $21,797,492 $3,550,422 $7,305,411 $7,305,411 $6,392,035 $6,286,760 $5,033,499 $3,110,220
Neighborhood Retailers $95,539,365 $98,138,875 ($4,695,886) $5,566,980 $5,566,980 $56,033,507 $25,792,503 $76,281,345 ($15,717,127)Supermarket, Grocery -44511 $16,463,769 ($2,457,085) ($32,793,791) $16,191,804 $16,191,804 $37,419,344 ($23,669,350) $45,874,482 ($34,594,314)
Pharmacies and Drug Stores-44611 $43,256,014 $84,648,355 $18,239,143 $5,389,939 $5,389,939 ($547,959) $31,062,220 $13,445,749 $22,053,685
TOTALS $24,501,521 $379,813,022 ($76,551,533) ($106,220,663) ($106,220,663) $7,267,398 $225,687,974 $295,393,348 $152,241,347
Retail CategoriesFar Western Alexandria
Bailey's Crossroads Franconia Huntington
Route 1/ Hybla Valley Oxon Hill
SE Washington DC
Southern Downtown DC
TOTAL OF MARKET AREAS
Major Comparison Retailers $11,553,541 ($86,179,575) $99,678,934 $31,927,473 ($114,643,994) ($41,005,949) $158,111,800 $73,315,966 $215,813,318Department Stores Excluding Leased Departments-4521 $13,066,528 $11,838,705 $36,608,735 ($9,126,414) ($9,915,315) ($3,085,358) $71,947,451 $47,606,177 $253,078,904
Radio, Television, Electronics Stores-443112 ($6,935,296) ($30,293,641) $10,394,165 $6,185,093 $980,318 ($3,589,801) $14,869,738 $13,080,003 $26,695,216Home Furnishing Stores-4422 ($3,062,831) ($8,414,884) $4,574,879 $5,818,600 $1,126,900 $3,677,313 $4,082,700 $4,249,907 ($139,110,810)
Home Centers-44411 $21,624,777 $18,308,729 $29,918,286 $17,871,860 ($128,608,212) ($50,519,098) $32,157,527 ($10,294,036) $86,239,943Book Stores-451211 $1,104,131 ($12,604,657) $2,793,013 $1,286,354 $1,288,316 $49,500 $3,127,941 ($6,620,284) ($5,940,611)
In-Line Comparison Retailers $34,005,303 ($68,923,158) $20,875,462 ($872,750) $25,462,678 ($10,831,822) $60,517,119 $39,166,295 $232,798,883Clothing Stores-4481 $20,925,674 ($52,207,095) $5,094,038 ($675,093) $19,384,088 ($5,421,925) $38,424,467 $16,217,463 $85,027,264
Food & Beverage $49,856,767 ($24,928,061) $24,865,698 $3,672,725 ($2,076,958) $18,646,447 $79,055,923 ($129,586,317) $45,820,252Full-Service Restaurants-7221 $28,997,885 ($28,186,996) $3,206,770 $13,403,999 ($14,153,810) $16,402,745 $40,739,643 ($19,488,535) ($30,928,895)
Limited Service Eating Places-7222 $16,787,075 $231,828 $17,941,556 ($13,216,673) $7,602,296 ($114,173) $33,611,160 ($101,793,129) $20,230,806Drinking Places Alcoholic Beverages-7224 $4,071,807 $3,027,107 $3,717,372 $3,485,399 $4,474,557 $2,357,874 $4,705,120 ($8,304,654) $56,518,341
Neighborhood Retailers $28,006,373 ($109,908,080) $51,793,269 $46,751,756 ($51,315,951) $75,438 $129,659,227 $27,624,432 $271,514,765Supermarket, Grocery -44511 $23,342,844 ($120,556,396) $7,347,847 $39,376,618 ($73,540,093) ($13,595,363) $74,550,863 $33,992,854 ($4,460,846)
Pharmacies and Drug Stores-44611 $18,421,937 $9,190,901 $21,041,515 $3,681,503 $9,072,758 $12,537,337 $26,236,459 ($22,626,022) $172,589,105
TOTALS $123,421,984 ($289,938,874) $197,213,363 $81,479,204 ($142,574,224) ($33,115,887) $427,344,069 $10,520,375 $765,947,218
SOURCE: RCLCO; Iexpress/Claritas, Inc.; MWCOG, Round 7.1 Cooperative Forecasts
Page 45 of 61
gap-2004-12172.00
Printed: 10/30/2008
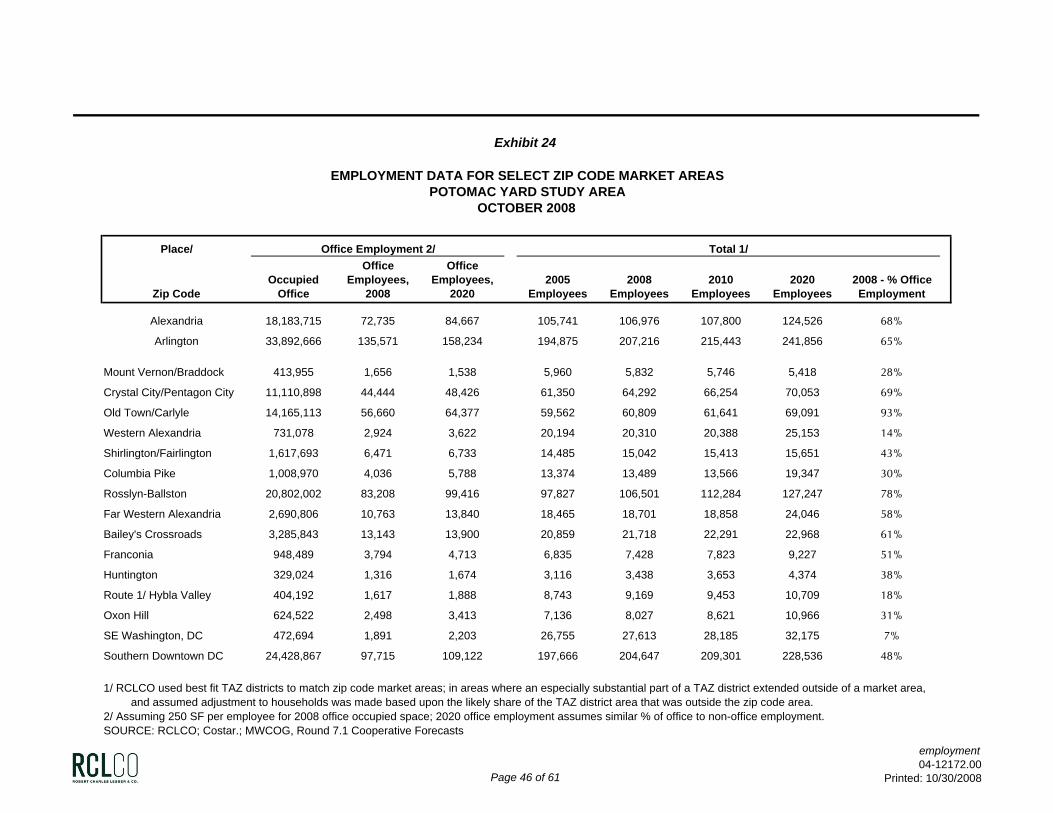
Exhibit 24
EMPLOYMENT DATA FOR SELECT ZIP CODE MARKET AREASPOTOMAC YARD STUDY AREA
OCTOBER 2008
Place/ Office Employment 2/ Total 1/
Zip CodeOccupied
Office
Office Employees,
2008
Office Employees,
20202005
Employees2008
Employees2010
Employees2020
Employees2008 - % Office Employment
Alexandria 18,183,715 72,735 84,667 105,741 106,976 107,800 124,526 68%
Arlington 33,892,666 135,571 158,234 194,875 207,216 215,443 241,856 65%
Mount Vernon/Braddock 413,955 1,656 1,538 5,960 5,832 5,746 5,418 28%
Crystal City/Pentagon City 11,110,898 44,444 48,426 61,350 64,292 66,254 70,053 69%
Old Town/Carlyle 14,165,113 56,660 64,377 59,562 60,809 61,641 69,091 93%
Western Alexandria 731,078 2,924 3,622 20,194 20,310 20,388 25,153 14%
Shirlington/Fairlington 1,617,693 6,471 6,733 14,485 15,042 15,413 15,651 43%
Columbia Pike 1,008,970 4,036 5,788 13,374 13,489 13,566 19,347 30%
Rosslyn-Ballston 20,802,002 83,208 99,416 97,827 106,501 112,284 127,247 78%
Far Western Alexandria 2,690,806 10,763 13,840 18,465 18,701 18,858 24,046 58%
Bailey's Crossroads 3,285,843 13,143 13,900 20,859 21,718 22,291 22,968 61%
Franconia 948,489 3,794 4,713 6,835 7,428 7,823 9,227 51%
Huntington 329,024 1,316 1,674 3,116 3,438 3,653 4,374 38%
Route 1/ Hybla Valley 404,192 1,617 1,888 8,743 9,169 9,453 10,709 18%
Oxon Hill 624,522 2,498 3,413 7,136 8,027 8,621 10,966 31%
SE Washington, DC 472,694 1,891 2,203 26,755 27,613 28,185 32,175 7%
Southern Downtown DC 24,428,867 97,715 109,122 197,666 204,647 209,301 228,536 48%
1/ RCLCO used best fit TAZ districts to match zip code market areas; in areas where an especially substantial part of a TAZ district extended outside of a market area,and assumed adjustment to households was made based upon the likely share of the TAZ district area that was outside the zip code area.
2/ Assuming 250 SF per employee for 2008 office occupied space; 2020 office employment assumes similar % of office to non-office employment.SOURCE: RCLCO; Costar.; MWCOG, Round 7.1 Cooperative Forecasts
Page 46 of 61
employment04-12172.00
Printed: 10/30/2008
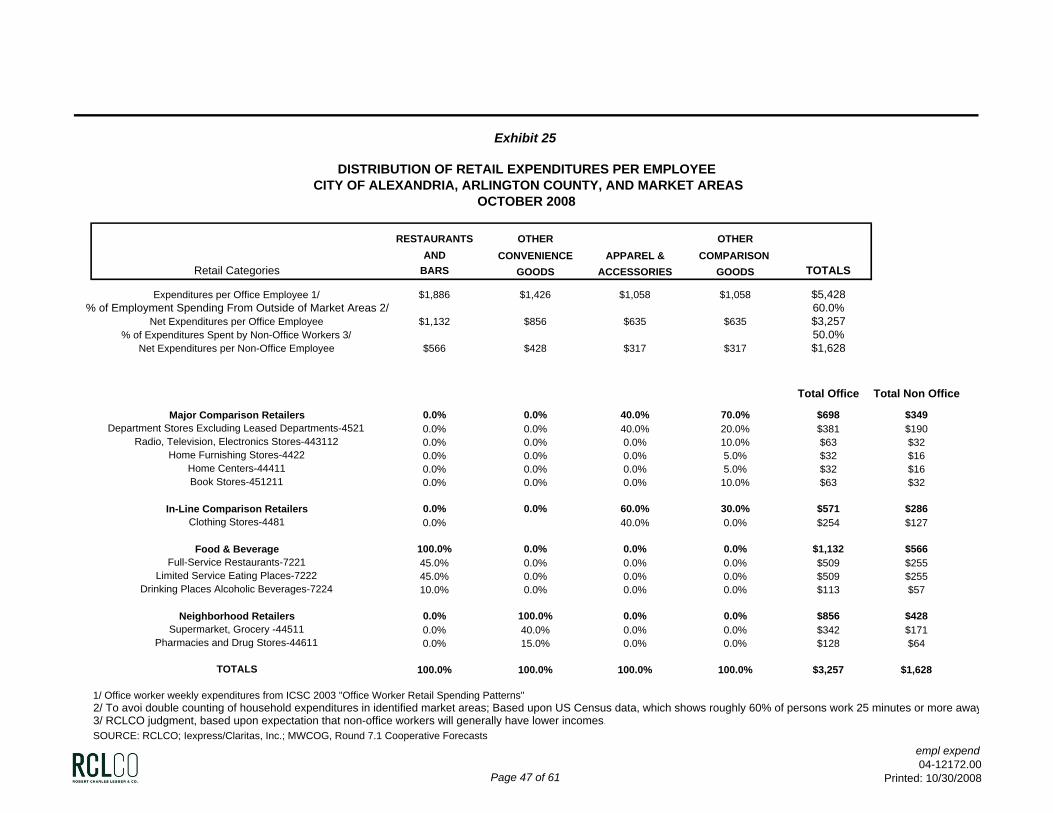
Exhibit 25
DISTRIBUTION OF RETAIL EXPENDITURES PER EMPLOYEECITY OF ALEXANDRIA, ARLINGTON COUNTY, AND MARKET AREAS
OCTOBER 2008
RESTAURANTS OTHER OTHERAND CONVENIENCE APPAREL & COMPARISON
Retail Categories BARS GOODS ACCESSORIES GOODS TOTALS
Expenditures per Office Employee 1/ $1,886 $1,426 $1,058 $1,058 $5,428% of Employment Spending From Outside of Market Areas 2/ 60.0%
Net Expenditures per Office Employee $1,132 $856 $635 $635 $3,257% of Expenditures Spent by Non-Office Workers 3/ 50.0%
Net Expenditures per Non-Office Employee $566 $428 $317 $317 $1,628
Total Office Total Non Office
Major Comparison Retailers 0.0% 0.0% 40.0% 70.0% $698 $349Department Stores Excluding Leased Departments-4521 0.0% 0.0% 40.0% 20.0% $381 $190
Radio, Television, Electronics Stores-443112 0.0% 0.0% 0.0% 10.0% $63 $32Home Furnishing Stores-4422 0.0% 0.0% 0.0% 5.0% $32 $16
Home Centers-44411 0.0% 0.0% 0.0% 5.0% $32 $16Book Stores-451211 0.0% 0.0% 0.0% 10.0% $63 $32
In-Line Comparison Retailers 0.0% 0.0% 60.0% 30.0% $571 $286Clothing Stores-4481 0.0% 40.0% 0.0% $254 $127
Food & Beverage 100.0% 0.0% 0.0% 0.0% $1,132 $566Full-Service Restaurants-7221 45.0% 0.0% 0.0% 0.0% $509 $255
Limited Service Eating Places-7222 45.0% 0.0% 0.0% 0.0% $509 $255Drinking Places Alcoholic Beverages-7224 10.0% 0.0% 0.0% 0.0% $113 $57
Neighborhood Retailers 0.0% 100.0% 0.0% 0.0% $856 $428Supermarket, Grocery -44511 0.0% 40.0% 0.0% 0.0% $342 $171
Pharmacies and Drug Stores-44611 0.0% 15.0% 0.0% 0.0% $128 $64
TOTALS 100.0% 100.0% 100.0% 100.0% $3,257 $1,628
1/ Office worker weekly expenditures from ICSC 2003 "Office Worker Retail Spending Patterns"2/ To avoi double counting of household expenditures in identified market areas; Based upon US Census data, which shows roughly 60% of persons work 25 minutes or more away3/ RCLCO judgment, based upon expectation that non-office workers will generally have lower incomes.SOURCE: RCLCO; Iexpress/Claritas, Inc.; MWCOG, Round 7.1 Cooperative Forecasts
Page 47 of 61
empl expend04-12172.00
Printed: 10/30/2008
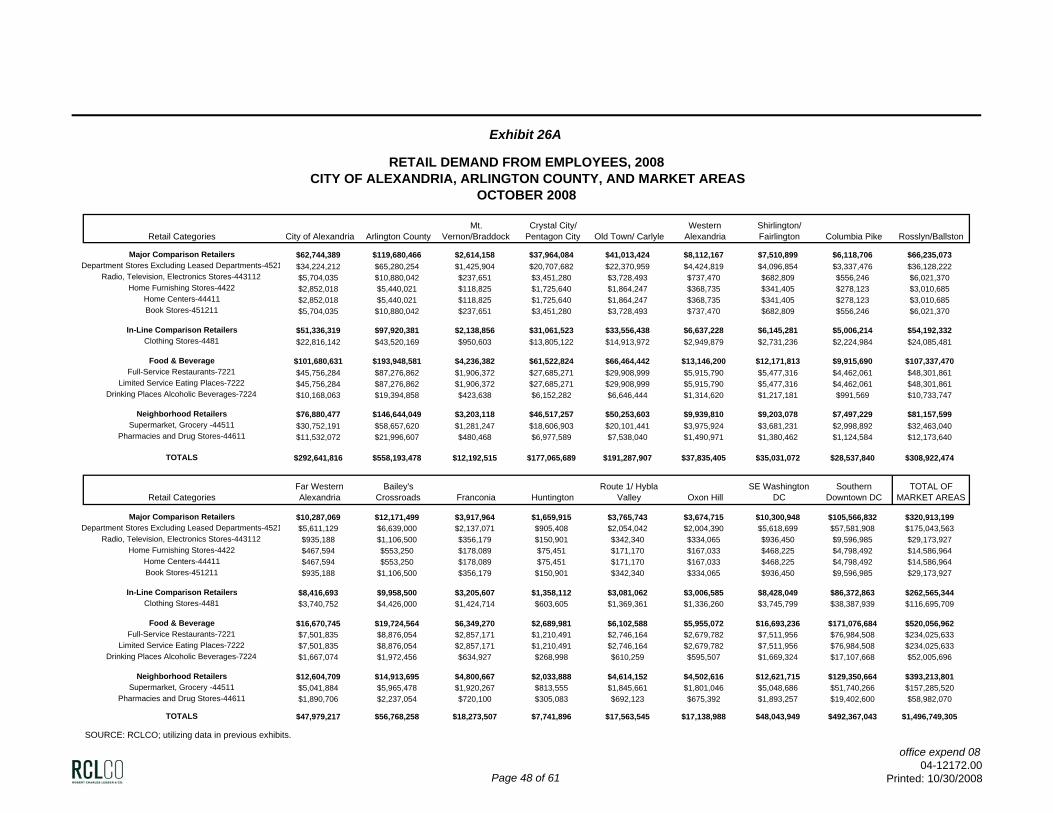
Exhibit 26A
RETAIL DEMAND FROM EMPLOYEES, 2008CITY OF ALEXANDRIA, ARLINGTON COUNTY, AND MARKET AREAS
OCTOBER 2008
Retail Categories City of Alexandria Arlington CountyMt.
Vernon/BraddockCrystal City/
Pentagon City Old Town/ CarlyleWestern
AlexandriaShirlington/ Fairlington Columbia Pike Rosslyn/Ballston
Major Comparison Retailers $62,744,389 $119,680,466 $2,614,158 $37,964,084 $41,013,424 $8,112,167 $7,510,899 $6,118,706 $66,235,073Department Stores Excluding Leased Departments-4521 $34,224,212 $65,280,254 $1,425,904 $20,707,682 $22,370,959 $4,424,819 $4,096,854 $3,337,476 $36,128,222
Radio, Television, Electronics Stores-443112 $5,704,035 $10,880,042 $237,651 $3,451,280 $3,728,493 $737,470 $682,809 $556,246 $6,021,370Home Furnishing Stores-4422 $2,852,018 $5,440,021 $118,825 $1,725,640 $1,864,247 $368,735 $341,405 $278,123 $3,010,685
Home Centers-44411 $2,852,018 $5,440,021 $118,825 $1,725,640 $1,864,247 $368,735 $341,405 $278,123 $3,010,685Book Stores-451211 $5,704,035 $10,880,042 $237,651 $3,451,280 $3,728,493 $737,470 $682,809 $556,246 $6,021,370
In-Line Comparison Retailers $51,336,319 $97,920,381 $2,138,856 $31,061,523 $33,556,438 $6,637,228 $6,145,281 $5,006,214 $54,192,332Clothing Stores-4481 $22,816,142 $43,520,169 $950,603 $13,805,122 $14,913,972 $2,949,879 $2,731,236 $2,224,984 $24,085,481
Food & Beverage $101,680,631 $193,948,581 $4,236,382 $61,522,824 $66,464,442 $13,146,200 $12,171,813 $9,915,690 $107,337,470Full-Service Restaurants-7221 $45,756,284 $87,276,862 $1,906,372 $27,685,271 $29,908,999 $5,915,790 $5,477,316 $4,462,061 $48,301,861
Limited Service Eating Places-7222 $45,756,284 $87,276,862 $1,906,372 $27,685,271 $29,908,999 $5,915,790 $5,477,316 $4,462,061 $48,301,861Drinking Places Alcoholic Beverages-7224 $10,168,063 $19,394,858 $423,638 $6,152,282 $6,646,444 $1,314,620 $1,217,181 $991,569 $10,733,747
Neighborhood Retailers $76,880,477 $146,644,049 $3,203,118 $46,517,257 $50,253,603 $9,939,810 $9,203,078 $7,497,229 $81,157,599Supermarket, Grocery -44511 $30,752,191 $58,657,620 $1,281,247 $18,606,903 $20,101,441 $3,975,924 $3,681,231 $2,998,892 $32,463,040
Pharmacies and Drug Stores-44611 $11,532,072 $21,996,607 $480,468 $6,977,589 $7,538,040 $1,490,971 $1,380,462 $1,124,584 $12,173,640
TOTALS $292,641,816 $558,193,478 $12,192,515 $177,065,689 $191,287,907 $37,835,405 $35,031,072 $28,537,840 $308,922,474
Retail CategoriesFar Western Alexandria
Bailey's Crossroads Franconia Huntington
Route 1/ Hybla Valley Oxon Hill
SE Washington DC
Southern Downtown DC
TOTAL OF MARKET AREAS
Major Comparison Retailers $10,287,069 $12,171,499 $3,917,964 $1,659,915 $3,765,743 $3,674,715 $10,300,948 $105,566,832 $320,913,199Department Stores Excluding Leased Departments-4521 $5,611,129 $6,639,000 $2,137,071 $905,408 $2,054,042 $2,004,390 $5,618,699 $57,581,908 $175,043,563
Radio, Television, Electronics Stores-443112 $935,188 $1,106,500 $356,179 $150,901 $342,340 $334,065 $936,450 $9,596,985 $29,173,927Home Furnishing Stores-4422 $467,594 $553,250 $178,089 $75,451 $171,170 $167,033 $468,225 $4,798,492 $14,586,964
Home Centers-44411 $467,594 $553,250 $178,089 $75,451 $171,170 $167,033 $468,225 $4,798,492 $14,586,964Book Stores-451211 $935,188 $1,106,500 $356,179 $150,901 $342,340 $334,065 $936,450 $9,596,985 $29,173,927
In-Line Comparison Retailers $8,416,693 $9,958,500 $3,205,607 $1,358,112 $3,081,062 $3,006,585 $8,428,049 $86,372,863 $262,565,344Clothing Stores-4481 $3,740,752 $4,426,000 $1,424,714 $603,605 $1,369,361 $1,336,260 $3,745,799 $38,387,939 $116,695,709
Food & Beverage $16,670,745 $19,724,564 $6,349,270 $2,689,981 $6,102,588 $5,955,072 $16,693,236 $171,076,684 $520,056,962Full-Service Restaurants-7221 $7,501,835 $8,876,054 $2,857,171 $1,210,491 $2,746,164 $2,679,782 $7,511,956 $76,984,508 $234,025,633
Limited Service Eating Places-7222 $7,501,835 $8,876,054 $2,857,171 $1,210,491 $2,746,164 $2,679,782 $7,511,956 $76,984,508 $234,025,633Drinking Places Alcoholic Beverages-7224 $1,667,074 $1,972,456 $634,927 $268,998 $610,259 $595,507 $1,669,324 $17,107,668 $52,005,696
Neighborhood Retailers $12,604,709 $14,913,695 $4,800,667 $2,033,888 $4,614,152 $4,502,616 $12,621,715 $129,350,664 $393,213,801Supermarket, Grocery -44511 $5,041,884 $5,965,478 $1,920,267 $813,555 $1,845,661 $1,801,046 $5,048,686 $51,740,266 $157,285,520
Pharmacies and Drug Stores-44611 $1,890,706 $2,237,054 $720,100 $305,083 $692,123 $675,392 $1,893,257 $19,402,600 $58,982,070
TOTALS $47,979,217 $56,768,258 $18,273,507 $7,741,896 $17,563,545 $17,138,988 $48,043,949 $492,367,043 $1,496,749,305
SOURCE: RCLCO; utilizing data in previous exhibits.
Page 48 of 61
office expend 0804-12172.00
Printed: 10/30/2008
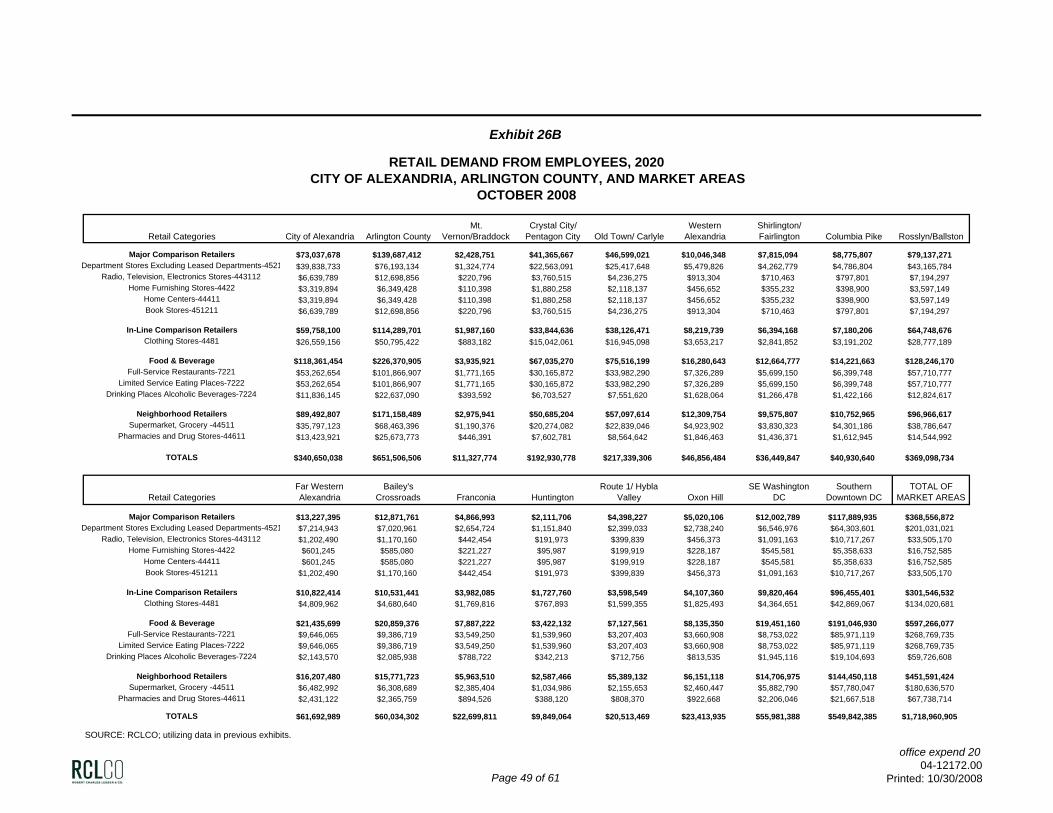
Exhibit 26B
RETAIL DEMAND FROM EMPLOYEES, 2020CITY OF ALEXANDRIA, ARLINGTON COUNTY, AND MARKET AREAS
OCTOBER 2008
Retail Categories City of Alexandria Arlington CountyMt.
Vernon/BraddockCrystal City/
Pentagon City Old Town/ CarlyleWestern
AlexandriaShirlington/ Fairlington Columbia Pike Rosslyn/Ballston
Major Comparison Retailers $73,037,678 $139,687,412 $2,428,751 $41,365,667 $46,599,021 $10,046,348 $7,815,094 $8,775,807 $79,137,271Department Stores Excluding Leased Departments-4521 $39,838,733 $76,193,134 $1,324,774 $22,563,091 $25,417,648 $5,479,826 $4,262,779 $4,786,804 $43,165,784
Radio, Television, Electronics Stores-443112 $6,639,789 $12,698,856 $220,796 $3,760,515 $4,236,275 $913,304 $710,463 $797,801 $7,194,297Home Furnishing Stores-4422 $3,319,894 $6,349,428 $110,398 $1,880,258 $2,118,137 $456,652 $355,232 $398,900 $3,597,149
Home Centers-44411 $3,319,894 $6,349,428 $110,398 $1,880,258 $2,118,137 $456,652 $355,232 $398,900 $3,597,149Book Stores-451211 $6,639,789 $12,698,856 $220,796 $3,760,515 $4,236,275 $913,304 $710,463 $797,801 $7,194,297
In-Line Comparison Retailers $59,758,100 $114,289,701 $1,987,160 $33,844,636 $38,126,471 $8,219,739 $6,394,168 $7,180,206 $64,748,676Clothing Stores-4481 $26,559,156 $50,795,422 $883,182 $15,042,061 $16,945,098 $3,653,217 $2,841,852 $3,191,202 $28,777,189
Food & Beverage $118,361,454 $226,370,905 $3,935,921 $67,035,270 $75,516,199 $16,280,643 $12,664,777 $14,221,663 $128,246,170Full-Service Restaurants-7221 $53,262,654 $101,866,907 $1,771,165 $30,165,872 $33,982,290 $7,326,289 $5,699,150 $6,399,748 $57,710,777
Limited Service Eating Places-7222 $53,262,654 $101,866,907 $1,771,165 $30,165,872 $33,982,290 $7,326,289 $5,699,150 $6,399,748 $57,710,777Drinking Places Alcoholic Beverages-7224 $11,836,145 $22,637,090 $393,592 $6,703,527 $7,551,620 $1,628,064 $1,266,478 $1,422,166 $12,824,617
Neighborhood Retailers $89,492,807 $171,158,489 $2,975,941 $50,685,204 $57,097,614 $12,309,754 $9,575,807 $10,752,965 $96,966,617Supermarket, Grocery -44511 $35,797,123 $68,463,396 $1,190,376 $20,274,082 $22,839,046 $4,923,902 $3,830,323 $4,301,186 $38,786,647
Pharmacies and Drug Stores-44611 $13,423,921 $25,673,773 $446,391 $7,602,781 $8,564,642 $1,846,463 $1,436,371 $1,612,945 $14,544,992
TOTALS $340,650,038 $651,506,506 $11,327,774 $192,930,778 $217,339,306 $46,856,484 $36,449,847 $40,930,640 $369,098,734
Retail CategoriesFar Western Alexandria
Bailey's Crossroads Franconia Huntington
Route 1/ Hybla Valley Oxon Hill
SE Washington DC
Southern Downtown DC
TOTAL OF MARKET AREAS
Major Comparison Retailers $13,227,395 $12,871,761 $4,866,993 $2,111,706 $4,398,227 $5,020,106 $12,002,789 $117,889,935 $368,556,872Department Stores Excluding Leased Departments-4521 $7,214,943 $7,020,961 $2,654,724 $1,151,840 $2,399,033 $2,738,240 $6,546,976 $64,303,601 $201,031,021
Radio, Television, Electronics Stores-443112 $1,202,490 $1,170,160 $442,454 $191,973 $399,839 $456,373 $1,091,163 $10,717,267 $33,505,170Home Furnishing Stores-4422 $601,245 $585,080 $221,227 $95,987 $199,919 $228,187 $545,581 $5,358,633 $16,752,585
Home Centers-44411 $601,245 $585,080 $221,227 $95,987 $199,919 $228,187 $545,581 $5,358,633 $16,752,585Book Stores-451211 $1,202,490 $1,170,160 $442,454 $191,973 $399,839 $456,373 $1,091,163 $10,717,267 $33,505,170
In-Line Comparison Retailers $10,822,414 $10,531,441 $3,982,085 $1,727,760 $3,598,549 $4,107,360 $9,820,464 $96,455,401 $301,546,532Clothing Stores-4481 $4,809,962 $4,680,640 $1,769,816 $767,893 $1,599,355 $1,825,493 $4,364,651 $42,869,067 $134,020,681
Food & Beverage $21,435,699 $20,859,376 $7,887,222 $3,422,132 $7,127,561 $8,135,350 $19,451,160 $191,046,930 $597,266,077Full-Service Restaurants-7221 $9,646,065 $9,386,719 $3,549,250 $1,539,960 $3,207,403 $3,660,908 $8,753,022 $85,971,119 $268,769,735
Limited Service Eating Places-7222 $9,646,065 $9,386,719 $3,549,250 $1,539,960 $3,207,403 $3,660,908 $8,753,022 $85,971,119 $268,769,735Drinking Places Alcoholic Beverages-7224 $2,143,570 $2,085,938 $788,722 $342,213 $712,756 $813,535 $1,945,116 $19,104,693 $59,726,608
Neighborhood Retailers $16,207,480 $15,771,723 $5,963,510 $2,587,466 $5,389,132 $6,151,118 $14,706,975 $144,450,118 $451,591,424Supermarket, Grocery -44511 $6,482,992 $6,308,689 $2,385,404 $1,034,986 $2,155,653 $2,460,447 $5,882,790 $57,780,047 $180,636,570
Pharmacies and Drug Stores-44611 $2,431,122 $2,365,759 $894,526 $388,120 $808,370 $922,668 $2,206,046 $21,667,518 $67,738,714
TOTALS $61,692,989 $60,034,302 $22,699,811 $9,849,064 $20,513,469 $23,413,935 $55,981,388 $549,842,385 $1,718,960,905
SOURCE: RCLCO; utilizing data in previous exhibits.
Page 49 of 61
office expend 2004-12172.00
Printed: 10/30/2008
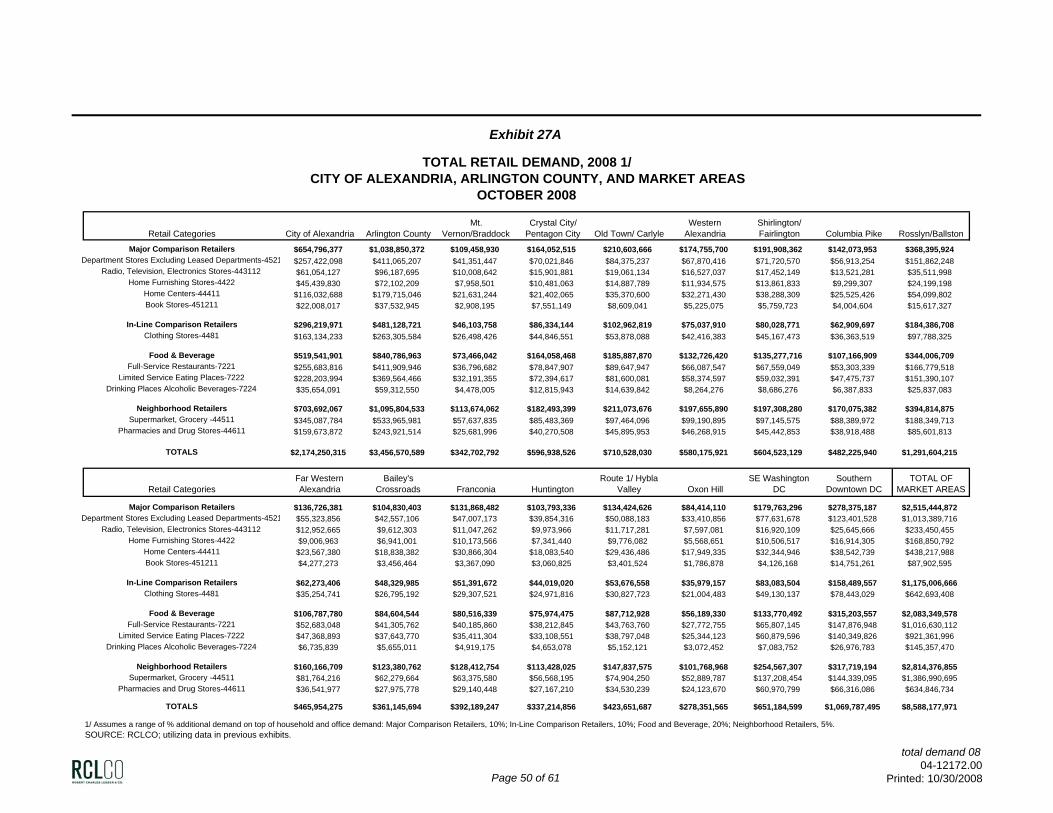
Exhibit 27A
TOTAL RETAIL DEMAND, 2008 1/CITY OF ALEXANDRIA, ARLINGTON COUNTY, AND MARKET AREAS
OCTOBER 2008
Retail Categories City of Alexandria Arlington CountyMt.
Vernon/BraddockCrystal City/
Pentagon City Old Town/ CarlyleWestern
AlexandriaShirlington/ Fairlington Columbia Pike Rosslyn/Ballston
Major Comparison Retailers $654,796,377 $1,038,850,372 $109,458,930 $164,052,515 $210,603,666 $174,755,700 $191,908,362 $142,073,953 $368,395,924Department Stores Excluding Leased Departments-4521 $257,422,098 $411,065,207 $41,351,447 $70,021,846 $84,375,237 $67,870,416 $71,720,570 $56,913,254 $151,862,248
Radio, Television, Electronics Stores-443112 $61,054,127 $96,187,695 $10,008,642 $15,901,881 $19,061,134 $16,527,037 $17,452,149 $13,521,281 $35,511,998Home Furnishing Stores-4422 $45,439,830 $72,102,209 $7,958,501 $10,481,063 $14,887,789 $11,934,575 $13,861,833 $9,299,307 $24,199,198
Home Centers-44411 $116,032,688 $179,715,046 $21,631,244 $21,402,065 $35,370,600 $32,271,430 $38,288,309 $25,525,426 $54,099,802Book Stores-451211 $22,008,017 $37,532,945 $2,908,195 $7,551,149 $8,609,041 $5,225,075 $5,759,723 $4,004,604 $15,617,327
In-Line Comparison Retailers $296,219,971 $481,128,721 $46,103,758 $86,334,144 $102,962,819 $75,037,910 $80,028,771 $62,909,697 $184,386,708Clothing Stores-4481 $163,134,233 $263,305,584 $26,498,426 $44,846,551 $53,878,088 $42,416,383 $45,167,473 $36,363,519 $97,788,325
Food & Beverage $519,541,901 $840,786,963 $73,466,042 $164,058,468 $185,887,870 $132,726,420 $135,277,716 $107,166,909 $344,006,709Full-Service Restaurants-7221 $255,683,816 $411,909,946 $36,796,682 $78,847,907 $89,647,947 $66,087,547 $67,559,049 $53,303,339 $166,779,518
Limited Service Eating Places-7222 $228,203,994 $369,564,466 $32,191,355 $72,394,617 $81,600,081 $58,374,597 $59,032,391 $47,475,737 $151,390,107Drinking Places Alcoholic Beverages-7224 $35,654,091 $59,312,550 $4,478,005 $12,815,943 $14,639,842 $8,264,276 $8,686,276 $6,387,833 $25,837,083
Neighborhood Retailers $703,692,067 $1,095,804,533 $113,674,062 $182,493,399 $211,073,676 $197,655,890 $197,308,280 $170,075,382 $394,814,875Supermarket, Grocery -44511 $345,087,784 $533,965,981 $57,637,835 $85,483,369 $97,464,096 $99,190,895 $97,145,575 $88,389,972 $188,349,713
Pharmacies and Drug Stores-44611 $159,673,872 $243,921,514 $25,681,996 $40,270,508 $45,895,953 $46,268,915 $45,442,853 $38,918,488 $85,601,813
TOTALS $2,174,250,315 $3,456,570,589 $342,702,792 $596,938,526 $710,528,030 $580,175,921 $604,523,129 $482,225,940 $1,291,604,215
Retail CategoriesFar Western Alexandria
Bailey's Crossroads Franconia Huntington
Route 1/ Hybla Valley Oxon Hill
SE Washington DC
Southern Downtown DC
TOTAL OF MARKET AREAS
Major Comparison Retailers $136,726,381 $104,830,403 $131,868,482 $103,793,336 $134,424,626 $84,414,110 $179,763,296 $278,375,187 $2,515,444,872Department Stores Excluding Leased Departments-4521 $55,323,856 $42,557,106 $47,007,173 $39,854,316 $50,088,183 $33,410,856 $77,631,678 $123,401,528 $1,013,389,716
Radio, Television, Electronics Stores-443112 $12,952,665 $9,612,303 $11,047,262 $9,973,966 $11,717,281 $7,597,081 $16,920,109 $25,645,666 $233,450,455Home Furnishing Stores-4422 $9,006,963 $6,941,001 $10,173,566 $7,341,440 $9,776,082 $5,568,651 $10,506,517 $16,914,305 $168,850,792
Home Centers-44411 $23,567,380 $18,838,382 $30,866,304 $18,083,540 $29,436,486 $17,949,335 $32,344,946 $38,542,739 $438,217,988Book Stores-451211 $4,277,273 $3,456,464 $3,367,090 $3,060,825 $3,401,524 $1,786,878 $4,126,168 $14,751,261 $87,902,595
In-Line Comparison Retailers $62,273,406 $48,329,985 $51,391,672 $44,019,020 $53,676,558 $35,979,157 $83,083,504 $158,489,557 $1,175,006,666Clothing Stores-4481 $35,254,741 $26,795,192 $29,307,521 $24,971,816 $30,827,723 $21,004,483 $49,130,137 $78,443,029 $642,693,408
Food & Beverage $106,787,780 $84,604,544 $80,516,339 $75,974,475 $87,712,928 $56,189,330 $133,770,492 $315,203,557 $2,083,349,578Full-Service Restaurants-7221 $52,683,048 $41,305,762 $40,185,860 $38,212,845 $43,763,760 $27,772,755 $65,807,145 $147,876,948 $1,016,630,112
Limited Service Eating Places-7222 $47,368,893 $37,643,770 $35,411,304 $33,108,551 $38,797,048 $25,344,123 $60,879,596 $140,349,826 $921,361,996Drinking Places Alcoholic Beverages-7224 $6,735,839 $5,655,011 $4,919,175 $4,653,078 $5,152,121 $3,072,452 $7,083,752 $26,976,783 $145,357,470
Neighborhood Retailers $160,166,709 $123,380,762 $128,412,754 $113,428,025 $147,837,575 $101,768,968 $254,567,307 $317,719,194 $2,814,376,855Supermarket, Grocery -44511 $81,764,216 $62,279,664 $63,375,580 $56,568,195 $74,904,250 $52,889,787 $137,208,454 $144,339,095 $1,386,990,695
Pharmacies and Drug Stores-44611 $36,541,977 $27,975,778 $29,140,448 $27,167,210 $34,530,239 $24,123,670 $60,970,799 $66,316,086 $634,846,734
TOTALS $465,954,275 $361,145,694 $392,189,247 $337,214,856 $423,651,687 $278,351,565 $651,184,599 $1,069,787,495 $8,588,177,971
1/ Assumes a range of % additional demand on top of household and office demand: Major Comparison Retailers, 10%; In-Line Comparison Retailers, 10%; Food and Beverage, 20%; Neighborhood Retailers, 5%.SOURCE: RCLCO; utilizing data in previous exhibits.
Page 50 of 61
total demand 0804-12172.00
Printed: 10/30/2008
Exhibit 27B
TOTAL RETAIL DEMAND, 2020 1/CITY OF ALEXANDRIA, ARLINGTON COUNTY, AND MARKET AREAS
OCTOBER 2008
Retail Categories City of Alexandria Arlington CountyMt.
Vernon/BraddockCrystal City/
Pentagon City Old Town/ CarlyleWestern
AlexandriaShirlington/ Fairlington Columbia Pike Rosslyn/Ballston
Major Comparison Retailers $747,770,995 $1,203,746,634 $117,064,653 $263,199,360 $268,956,050 $201,279,532 $200,336,744 $166,927,068 $443,934,456Department Stores Excluding Leased Departments-4521 $294,232,749 $476,503,959 $44,155,215 $103,441,857 $106,581,870 $78,299,557 $74,865,382 $67,134,564 $182,877,107
Radio, Television, Electronics Stores-443112 $69,719,241 $111,453,386 $10,704,308 $23,815,854 $24,339,189 $19,032,470 $18,218,627 $15,878,761 $42,798,742Home Furnishing Stores-4422 $51,851,089 $83,516,486 $8,522,796 $18,955,239 $19,216,907 $13,727,354 $14,471,418 $10,889,400 $29,180,016
Home Centers-44411 $132,283,942 $208,078,858 $23,197,380 $45,899,941 $46,161,609 $37,056,043 $39,974,431 $29,744,711 $65,287,233Book Stores-451211 $25,230,462 $43,560,233 $3,083,591 $10,066,348 $10,589,683 $6,067,833 $6,010,885 $4,820,054 $18,774,438
In-Line Comparison Retailers $338,902,877 $557,949,821 $49,142,655 $124,117,440 $128,827,458 $86,743,719 $83,531,698 $74,602,335 $221,898,865Clothing Stores-4481 $186,492,563 $305,240,151 $28,289,261 $65,840,830 $67,934,172 $48,952,729 $47,147,387 $42,921,929 $117,748,106
Food & Beverage $545,389,383 $894,175,624 $71,606,391 $201,716,891 $211,045,913 $140,885,124 $129,421,946 $117,123,232 $379,286,980Full-Service Restaurants-7221 $268,288,007 $437,983,293 $35,899,425 $98,005,811 $102,203,871 $70,086,672 $64,636,982 $58,114,777 $183,936,450
Limited Service Eating Places-7222 $239,586,939 $393,052,789 $31,368,550 $88,301,248 $92,499,308 $61,976,343 $56,476,403 $51,907,224 $166,901,241Drinking Places Alcoholic Beverages-7224 $37,514,437 $63,139,541 $4,338,415 $15,409,832 $16,342,735 $8,822,110 $8,308,561 $7,101,231 $28,449,289
Neighborhood Retailers $842,045,768 $1,330,357,959 $127,304,900 $273,920,399 $280,974,050 $238,529,088 $215,777,723 $209,289,607 $498,330,784Supermarket, Grocery -44511 $412,747,368 $648,123,601 $64,603,666 $127,531,445 $130,352,906 $119,600,872 $106,242,424 $108,501,267 $237,820,759
Pharmacies and Drug Stores-44611 $190,907,143 $296,018,949 $28,800,141 $60,705,471 $61,763,519 $55,752,893 $49,699,527 $47,714,935 $108,121,857
TOTALS $2,474,109,023 $3,986,230,038 $365,118,599 $862,954,091 $889,803,472 $667,437,462 $629,068,110 $567,942,242 $1,543,451,086
Retail CategoriesFar Western Alexandria
Bailey's Crossroads Franconia Huntington
Route 1/ Hybla Valley Oxon Hill
SE Washington DC
Southern Downtown DC
TOTAL OF MARKET AREAS
Major Comparison Retailers $143,955,012 $115,180,335 $142,227,400 $113,685,203 $163,113,323 $101,969,665 $200,385,607 $349,560,231 $2,991,774,638Department Stores Excluding Leased Departments-4521 $58,653,509 $46,670,573 $50,837,627 $43,705,654 $60,744,343 $40,459,777 $86,606,893 $152,128,409 $1,197,162,337
Radio, Television, Electronics Stores-443112 $13,626,470 $10,561,824 $11,920,281 $10,922,815 $14,217,237 $9,177,654 $18,859,208 $32,237,383 $276,310,825Home Furnishing Stores-4422 $9,424,465 $7,639,414 $10,949,637 $8,032,796 $11,867,777 $6,712,987 $11,703,883 $21,663,399 $202,957,488
Home Centers-44411 $24,448,625 $20,783,190 $33,153,464 $19,764,632 $35,752,493 $21,569,999 $35,973,419 $50,973,964 $529,741,134Book Stores-451211 $4,674,771 $3,761,085 $3,679,264 $3,372,723 $4,114,725 $2,205,320 $4,641,014 $17,473,429 $103,335,164
In-Line Comparison Retailers $66,608,205 $52,875,776 $55,741,181 $48,343,735 $65,050,739 $43,724,896 $92,832,163 $192,127,389 $1,386,168,253Clothing Stores-4481 $37,422,664 $29,372,376 $31,712,873 $27,392,166 $37,380,833 $25,449,860 $54,821,468 $96,235,816 $758,622,471
Food & Beverage $105,663,913 $84,654,178 $80,378,106 $76,592,676 $97,364,454 $62,897,146 $137,263,187 $346,689,718 $2,242,589,854Full-Service Restaurants-7221 $51,926,727 $41,369,161 $40,058,843 $38,495,563 $48,594,733 $31,040,063 $67,483,841 $163,507,810 $1,095,360,729
Limited Service Eating Places-7222 $46,900,270 $37,660,667 $35,362,560 $33,385,526 $43,063,677 $28,368,534 $62,464,086 $154,157,209 $990,792,845Drinking Places Alcoholic Beverages-7224 $6,836,915 $5,624,349 $4,956,704 $4,711,586 $5,706,044 $3,488,550 $7,315,260 $29,024,698 $156,436,280
Neighborhood Retailers $176,659,299 $142,022,389 $145,245,039 $130,180,652 $187,916,957 $128,762,477 $297,126,284 $417,143,498 $3,469,183,146Supermarket, Grocery -44511 $89,794,491 $71,770,692 $71,599,253 $64,883,210 $95,236,498 $66,819,954 $160,043,198 $191,349,571 $1,706,150,205
Pharmacies and Drug Stores-44611 $40,029,555 $32,262,105 $32,891,430 $31,143,586 $43,911,426 $30,450,695 $71,097,027 $89,060,943 $783,405,111
TOTALS $492,886,428 $394,732,677 $423,591,725 $368,802,265 $513,445,472 $337,354,184 $727,607,241 $1,305,520,837 $10,089,715,892
1/ Assumes a range of % additional demand on top of household and office demand: Major Comparison Retailers, 10%; In-Line Comparison Retailers, 10%; Food and Beverage, 20%; Neighborhood Retailers, 5%.SOURCE: RCLCO; utilizing data in previous exhibits.
Page 51 of 61
total demand 2004-12172.00
Printed: 10/30/2008
Exhibit 28
RETAIL SALES SUMMARY, 2008CITY OF ALEXANDRIA, ARLINGTON COUNTY, AND MARKET AREAS
OCTOBER 2008
Retail Categories City of Alexandria Arlington CountyMt.
Vernon/BraddockCrystal City/
Pentagon City Old Town/ CarlyleWestern
AlexandriaShirlington/ Fairlington Columbia Pike Rosslyn/Ballston
Major Comparison Retailers $768,282,494 $591,173,007 $166,896,040 $340,315,451 $251,699,945 $307,656,747 $31,046,606 $28,279,945 $194,132,112Department Stores Excluding Leased Departments-4521 $296,198,000 $330,659,996 $111,966,945 $247,527,212 $33,882,111 $124,937,854 $8,655,051 $17,909,638 $65,223,146
Radio, Television, Electronics Stores-443112 $59,482,995 $69,122,985 $10,099,641 $51,191,734 $23,521,184 $25,835,425 $6,093,560 $3,638,206 $8,169,032Home Furnishing Stores-4422 $115,130,973 $86,648,002 $6,772,404 $20,224,476 $72,649,500 $34,592,632 $1,205,651 $396,560 $58,492,357
Home Centers-44411 $83,854,001 $0 $0 $0 $12,650,390 $71,203,611 $0 $0 $0Book Stores-451211 $14,911,998 $18,498,006 $6,206,724 $4,069,559 $5,628,197 $1,429,418 $2,280,869 $0 $11,369,735
In-Line Comparison Retailers $194,706,985 $526,302,000 $47,374,418 $396,482,672 $94,940,462 $47,020,891 $10,718,980 $14,643,653 $95,427,748Clothing Stores-4481 $124,903,989 $395,686,982 $40,570,604 $308,833,222 $61,206,341 $19,064,835 $7,298,167 $11,123,970 $65,668,850
Food & Beverage $340,585,002 $534,931,992 $65,427,628 $185,158,473 $158,386,836 $49,458,445 $107,183,437 $33,834,574 $220,458,914Full-Service Restaurants-7221 $236,535,992 $305,253,002 $46,718,828 $129,427,270 $103,958,334 $29,224,906 $81,628,979 $17,908,174 $102,565,013
Limited Service Eating Places-7222 $104,049,010 $216,713,990 $18,708,800 $52,694,356 $54,428,502 $20,233,539 $25,554,458 $15,926,400 $107,965,748Drinking Places Alcoholic Beverages-7224 $0 $12,965,000 $0 $3,036,847 $0 $0 $0 $0 $9,928,153
Neighborhood Retailers $580,463,981 $940,118,962 $117,451,673 $147,658,870 $192,766,361 $148,501,364 $160,793,256 $103,228,969 $371,778,496Supermarket, Grocery -44511 $322,963,988 $523,196,963 $90,334,020 $65,497,858 $79,471,792 $66,384,819 $116,423,049 $48,461,847 $212,008,357
Pharmacies and Drug Stores-44611 $116,872,013 $158,786,007 $7,496,413 $27,812,843 $42,194,072 $49,385,944 $12,682,797 $28,318,519 $61,693,920
TOTALS $1,884,038,462 $2,592,525,961 $397,149,759 $1,069,615,466 $697,793,604 $552,637,447 $309,742,279 $179,987,141 $881,797,270
Retail CategoriesFar Western Alexandria
Bailey's Crossroads Franconia Huntington
Route 1/ Hybla Valley Oxon Hill
SE Washington DC
Southern Downtown DC
TOTAL OF MARKET AREAS
Major Comparison Retailers $106,087,257 $178,017,209 $24,751,709 $69,311,005 $258,530,606 $128,685,538 $12,054,145 $126,576,127 $2,224,040,442Department Stores Excluding Leased Departments-4521 $33,039,901 $23,568,127 $6,952,566 $47,706,987 $62,738,412 $37,128,734 $239,113 $26,388,776 $847,864,573
Radio, Television, Electronics Stores-443112 $18,120,506 $38,725,139 $0 $3,552,766 $11,544,605 $11,476,749 $1,183,834 $5,509,442 $218,661,823Home Furnishing Stores-4422 $11,029,281 $14,774,726 $5,158,109 $1,387,955 $9,462,069 $2,197,216 $6,011,613 $10,085,459 $254,440,008
Home Centers-44411 $0 $0 $0 $0 $160,910,559 $69,900,001 $0 $51,275,370 $365,939,931Book Stores-451211 $1,943,170 $14,853,665 $109,319 $1,587,785 $2,052,505 $1,498,963 $0 $11,787,952 $64,817,861
In-Line Comparison Retailers $15,725,196 $106,460,604 $25,816,253 $43,093,840 $30,075,808 $46,474,368 $14,055,293 $39,039,567 $1,027,349,753Clothing Stores-4481 $8,284,968 $74,228,614 $21,966,031 $24,809,169 $12,999,132 $26,732,668 $7,048,581 $28,400,576 $718,235,728
Food & Beverage $24,765,636 $81,027,028 $40,318,085 $62,534,848 $83,462,536 $30,397,427 $26,277,632 $253,711,858 $1,422,403,357Full-Service Restaurants-7221 $8,562,166 $56,408,605 $29,661,110 $20,052,008 $55,123,437 $8,154,586 $11,856,281 $82,160,880 $783,410,577
Limited Service Eating Places-7222 $16,203,470 $24,618,423 $10,656,975 $42,027,192 $28,339,099 $22,242,841 $14,421,351 $155,964,928 $609,986,082Drinking Places Alcoholic Beverages-7224 $0 $0 $0 $455,648 $0 $0 $0 $15,586,050 $29,006,698
Neighborhood Retailers $116,385,509 $223,247,619 $74,284,166 $69,006,826 $216,760,416 $110,830,241 $125,748,602 $207,146,812 $2,385,589,180Supermarket, Grocery -44511 $51,805,519 $179,493,791 $55,356,979 $18,573,132 $157,963,075 $71,880,328 $65,060,163 $82,181,254 $1,360,895,983
Pharmacies and Drug Stores-44611 $15,537,446 $17,772,527 $7,965,258 $24,242,728 $30,038,351 $14,222,445 $36,191,156 $81,922,998 $457,477,417
TOTALS $262,963,598 $588,752,460 $165,170,213 $243,946,519 $588,829,366 $316,387,574 $178,135,672 $626,474,364 $7,059,382,732
SOURCE: RCLCO; Iexpress/Claritas, Inc.
Page 52 of 61
retail sales 0804-12172.00
Printed: 10/30/2008
Exhibit 29A
TOTAL RETAIL DEMAND-SUPPLY GAP ANALYSIS, 2008 1/CITY OF ALEXANDRIA, ARLINGTON COUNTY, AND MARKET AREAS
OCTOBER 2008
Retail Categories City of Alexandria Arlington CountyMt.
Vernon/BraddockCrystal City/
Pentagon City Old Town/ CarlyleWestern
AlexandriaShirlington/ Fairlington Columbia Pike Rosslyn/Ballston
Major Comparison Retailers ($113,486,117) $447,677,365 ($57,437,110) ($176,262,936) ($41,096,279) ($132,901,047) $160,861,756 $113,794,008 $174,263,812Department Stores Excluding Leased Departments-4521 ($38,775,902) $80,405,211 ($70,615,498) ($177,505,366) $50,493,126 ($57,067,438) $63,065,519 $39,003,616 $86,639,102
Radio, Television, Electronics Stores-443112 $1,571,132 $27,064,710 ($90,999) ($35,289,853) ($4,460,050) ($9,308,388) $11,358,589 $9,883,075 $27,342,966Home Furnishing Stores-4422 ($69,691,143) ($14,545,793) $1,186,097 ($9,743,413) ($57,761,711) ($22,658,057) $12,656,182 $8,902,747 ($34,293,159)
Home Centers-44411 $32,178,687 $179,715,046 $21,631,244 $21,402,065 $22,720,210 ($38,932,181) $38,288,309 $25,525,426 $54,099,802Book Stores-451211 $7,096,019 $19,034,939 ($3,298,529) $3,481,590 $2,980,844 $3,795,657 $3,478,854 $4,004,604 $4,247,592
In-Line Comparison Retailers $101,512,986 ($45,173,279) ($1,270,660) ($310,148,528) $8,022,357 $28,017,019 $69,309,791 $48,266,044 $88,958,960Clothing Stores-4481 $38,230,244 ($132,381,398) ($14,072,178) ($263,986,671) ($7,328,253) $23,351,548 $37,869,306 $25,239,549 $32,119,475
Food & Beverage $178,956,899 $305,854,971 $8,038,414 ($21,100,005) $27,501,034 $83,267,975 $28,094,279 $73,332,335 $123,547,795Full-Service Restaurants-7221 $19,147,824 $106,656,944 ($9,922,146) ($50,579,363) ($14,310,387) $36,862,641 ($14,069,930) $35,395,165 $64,214,505
Limited Service Eating Places-7222 $124,154,984 $152,850,476 $13,482,555 $19,700,261 $27,171,579 $38,141,058 $33,477,933 $31,549,337 $43,424,359Drinking Places Alcoholic Beverages-7224 $35,654,091 $46,347,550 $4,478,005 $9,779,096 $14,639,842 $8,264,276 $8,686,276 $6,387,833 $15,908,930
Neighborhood Retailers $123,228,086 $155,685,571 ($3,777,611) $34,834,529 $18,307,315 $49,154,526 $36,515,024 $66,846,413 $23,036,379Supermarket, Grocery -44511 $22,123,796 $10,769,018 ($32,696,185) $19,985,511 $17,992,304 $32,806,076 ($19,277,474) $39,928,125 ($23,658,644)
Pharmacies and Drug Stores-44611 $42,801,859 $85,135,507 $18,185,583 $12,457,665 $3,701,881 ($3,117,029) $32,760,056 $10,599,969 $23,907,893
TOTALS $290,211,853 $864,044,628 ($54,446,967) ($472,676,940) $12,734,426 $27,538,474 $294,780,850 $302,238,799 $409,806,945
Retail CategoriesFar Western Alexandria
Bailey's Crossroads Franconia Huntington
Route 1/ Hybla Valley Oxon Hill
SE Washington DC
Southern Downtown DC
TOTAL OF MARKET AREAS
Major Comparison Retailers $30,639,124 ($73,186,806) $107,116,773 $34,482,331 ($124,105,980) ($44,271,428) $167,709,151 $151,799,060 $291,404,430Department Stores Excluding Leased Departments-4521 $22,283,955 $18,988,979 $40,054,607 ($7,852,671) ($12,650,229) ($3,717,878) $77,392,565 $97,012,752 $165,525,143
Radio, Television, Electronics Stores-443112 ($5,167,841) ($29,112,836) $11,047,262 $6,421,200 $172,676 ($3,879,668) $15,736,275 $20,136,224 $14,788,632Home Furnishing Stores-4422 ($2,022,318) ($7,833,725) $5,015,457 $5,953,485 $314,013 $3,371,435 $4,494,904 $6,828,846 ($85,589,216)
Home Centers-44411 $23,567,380 $18,838,382 $30,866,304 $18,083,540 ($131,474,073) ($51,950,666) $32,344,946 ($12,732,631) $72,278,057Book Stores-451211 $2,334,103 ($11,397,201) $3,257,771 $1,473,040 $1,349,019 $287,915 $4,126,168 $2,963,309 $23,084,734
In-Line Comparison Retailers $46,548,210 ($58,130,619) $25,575,419 $925,180 $23,600,750 ($10,495,211) $69,028,211 $119,449,990 $147,656,913Clothing Stores-4481 $26,969,773 ($47,433,422) $7,341,490 $162,647 $17,828,591 ($5,728,185) $42,081,556 $50,042,453 ($75,542,320)
Food & Beverage $82,022,144 $3,577,516 $40,198,254 $13,439,627 $4,250,392 $25,791,903 $107,492,860 $61,491,699 $660,946,221Full-Service Restaurants-7221 $44,120,882 ($15,102,843) $10,524,750 $18,160,837 ($11,359,677) $19,618,169 $53,950,864 $65,716,068 $233,219,535
Limited Service Eating Places-7222 $31,165,423 $13,025,347 $24,754,329 ($8,918,641) $10,457,949 $3,101,282 $46,458,245 ($15,615,102) $311,375,914Drinking Places Alcoholic Beverages-7224 $6,735,839 $5,655,011 $4,919,175 $4,197,430 $5,152,121 $3,072,452 $7,083,752 $11,390,733 $116,350,772
Neighborhood Retailers $43,781,200 ($99,866,857) $54,128,588 $44,421,199 ($68,922,841) ($9,061,273) $128,818,705 $110,572,382 $428,787,675Supermarket, Grocery -44511 $29,958,697 ($117,214,127) $8,018,601 $37,995,063 ($83,058,825) ($18,990,541) $72,148,291 $62,157,841 $26,094,712
Pharmacies and Drug Stores-44611 $21,004,531 $10,203,251 $21,175,190 $2,924,482 $4,491,888 $9,901,225 $24,779,643 ($15,606,912) $177,369,317
TOTALS $202,990,677 ($227,606,766) $227,019,034 $93,268,337 ($165,177,679) ($38,036,009) $473,048,927 $443,313,131 $1,528,795,239
1/ Assumes a range of % additional demand on top of household and office demand: Major Comparison Retailers, 10%; In-Line Comparison Retailers, 10%; Food and Beverage, 20%; Neighborhood Retailers, 5%.SOURCE: RCLCO; utilizing data in previous exhibits.
Page 53 of 61
gap 0804-12172.00
Printed: 10/30/2008
Exhibit 29B
TOTAL RETAIL DEMAND-SUPPLY GAP ANALYSIS, 2020 1/CITY OF ALEXANDRIA, ARLINGTON COUNTY, AND MARKET AREAS
OCTOBER 2008
Retail Categories City of Alexandria Arlington CountyMt.
Vernon/BraddockCrystal City/
Pentagon City Old Town/ CarlyleWestern
AlexandriaShirlington/ Fairlington Columbia Pike Rosslyn/Ballston
Major Comparison Retailers ($20,511,499) $612,573,627 ($49,831,387) ($77,116,091) $17,256,105 ($106,377,215) $169,290,138 $138,647,123 $249,802,344Department Stores Excluding Leased Departments-4521 ($1,965,251) $145,843,963 ($67,811,730) ($144,085,355) $72,699,759 ($46,638,297) $66,210,331 $49,224,926 $117,653,961
Radio, Television, Electronics Stores-443112 $10,236,246 $42,330,401 $604,667 ($27,375,880) $818,005 ($6,802,955) $12,125,067 $12,240,555 $34,629,710Home Furnishing Stores-4422 ($63,279,884) ($3,131,516) $1,750,392 ($1,269,237) ($53,432,593) ($20,865,278) $13,265,767 $10,492,840 ($29,312,341)
Home Centers-44411 $48,429,941 $208,078,858 $23,197,380 $45,899,941 $33,511,219 ($34,147,568) $39,974,431 $29,744,711 $65,287,233Book Stores-451211 $10,318,464 $25,062,227 ($3,123,133) $5,996,789 $4,961,486 $4,638,415 $3,730,016 $4,820,054 $7,404,703
In-Line Comparison Retailers $144,195,892 $31,647,821 $1,768,237 ($272,365,232) $33,886,996 $39,722,828 $72,812,718 $59,958,682 $126,471,117Clothing Stores-4481 $61,588,574 ($90,446,831) ($12,281,343) ($242,992,392) $6,727,831 $29,887,894 $39,849,220 $31,797,959 $52,079,256
Food & Beverage $204,804,381 $359,243,632 $6,178,763 $16,558,418 $52,659,077 $91,426,679 $22,238,509 $83,288,658 $158,828,066Full-Service Restaurants-7221 $31,752,015 $132,730,291 ($10,819,403) ($31,421,459) ($1,754,463) $40,861,766 ($16,991,997) $40,206,603 $81,371,437
Limited Service Eating Places-7222 $135,537,929 $176,338,799 $12,659,750 $35,606,892 $38,070,806 $41,742,804 $30,921,945 $35,980,824 $58,935,493Drinking Places Alcoholic Beverages-7224 $37,514,437 $50,174,541 $4,338,415 $12,372,985 $16,342,735 $8,822,110 $8,308,561 $7,101,231 $18,521,136
Neighborhood Retailers $261,581,787 $390,238,997 $9,853,227 $126,261,529 $88,207,689 $90,027,724 $54,984,467 $106,060,638 $126,552,288Supermarket, Grocery -44511 $89,783,380 $124,926,638 ($25,730,354) $62,033,587 $50,881,114 $53,216,053 ($10,180,625) $60,039,420 $25,812,402
Pharmacies and Drug Stores-44611 $74,035,130 $137,232,942 $21,303,728 $32,892,628 $19,569,447 $6,366,949 $37,016,730 $19,396,416 $46,427,937
TOTALS $590,070,561 $1,393,704,077 ($32,031,160) ($206,661,375) $192,009,868 $114,800,015 $319,325,831 $387,955,101 $661,653,816
Retail CategoriesFar Western Alexandria
Bailey's Crossroads Franconia Huntington
Route 1/ Hybla Valley Oxon Hill
SE Washington DC
Southern Downtown DC
TOTAL OF MARKET AREAS
Major Comparison Retailers $37,867,755 ($62,836,874) $117,475,691 $44,374,198 ($95,417,283) ($26,715,873) $188,331,462 $222,984,104 $767,734,196Department Stores Excluding Leased Departments-4521 $25,613,608 $23,102,446 $43,885,061 ($4,001,333) ($1,994,069) $3,331,043 $86,367,780 $125,739,633 $349,297,764
Radio, Television, Electronics Stores-443112 ($4,494,036) ($28,163,315) $11,920,281 $7,370,049 $2,672,632 ($2,299,095) $17,675,374 $26,727,941 $57,649,002Home Furnishing Stores-4422 ($1,604,816) ($7,135,312) $5,791,528 $6,644,841 $2,405,708 $4,515,771 $5,692,270 $11,577,940 ($51,482,520)
Home Centers-44411 $24,448,625 $20,783,190 $33,153,464 $19,764,632 ($125,158,066) ($48,330,002) $35,973,419 ($301,406) $163,801,203Book Stores-451211 $2,731,601 ($11,092,580) $3,569,945 $1,784,938 $2,062,220 $706,357 $4,641,014 $5,685,477 $38,517,303
In-Line Comparison Retailers $50,883,009 ($53,584,828) $29,924,928 $5,249,895 $34,974,931 ($2,749,472) $78,776,870 $153,087,822 $358,818,500Clothing Stores-4481 $29,137,696 ($44,856,238) $9,746,842 $2,582,997 $24,381,701 ($1,282,808) $47,772,887 $67,835,240 $40,386,743
Food & Beverage $80,898,277 $3,627,150 $40,060,021 $14,057,828 $13,901,918 $32,499,719 $110,985,555 $92,977,860 $820,186,497Full-Service Restaurants-7221 $43,364,561 ($15,039,444) $10,397,733 $18,443,555 ($6,528,704) $22,885,477 $55,627,560 $81,346,930 $311,950,152
Limited Service Eating Places-7222 $30,696,800 $13,042,244 $24,705,585 ($8,641,666) $14,724,578 $6,125,693 $48,042,735 ($1,807,719) $380,806,763Drinking Places Alcoholic Beverages-7224 $6,836,915 $5,624,349 $4,956,704 $4,255,938 $5,706,044 $3,488,550 $7,315,260 $13,438,648 $127,429,582
Neighborhood Retailers $60,273,790 ($81,225,230) $70,960,873 $61,173,826 ($28,843,459) $17,932,236 $171,377,682 $209,996,686 $1,083,593,966Supermarket, Grocery -44511 $37,988,972 ($107,723,099) $16,242,274 $46,310,078 ($62,726,577) ($5,060,374) $94,983,035 $109,168,317 $345,254,222
Pharmacies and Drug Stores-44611 $24,492,109 $14,489,578 $24,926,172 $6,900,858 $13,873,075 $16,228,250 $34,905,871 $7,137,945 $325,927,694
TOTALS $229,922,830 ($194,019,783) $258,421,512 $124,855,746 ($75,383,894) $20,966,610 $549,471,569 $679,046,473 $3,030,333,160
1/ Assumes a range of % additional demand on top of household and office demand: Major Comparison Retailers, 10%; In-Line Comparison Retailers, 10%; Food and Beverage, 20%; Neighborhood Retailers, 5%.SOURCE: RCLCO; utilizing data in previous exhibits.
Page 54 of 61
gap 2004-12172.00
Printed: 10/30/2008
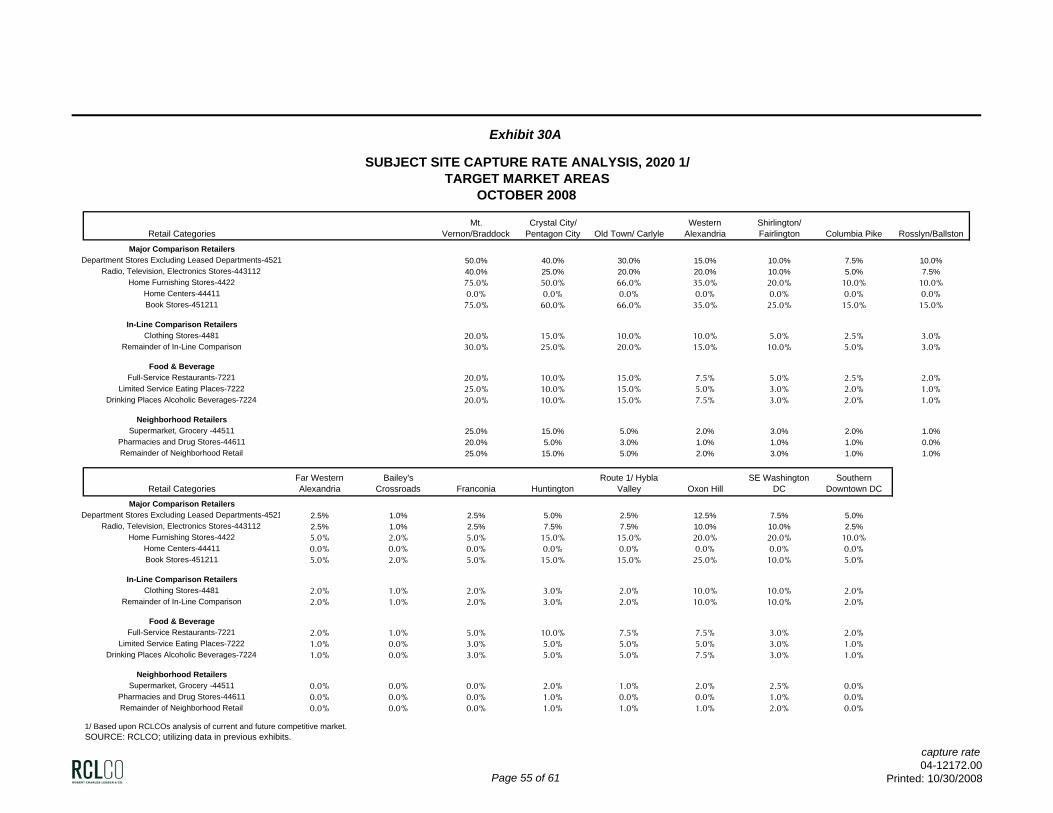
Exhibit 30A
SUBJECT SITE CAPTURE RATE ANALYSIS, 2020 1/TARGET MARKET AREAS
OCTOBER 2008
Retail CategoriesMt.
Vernon/BraddockCrystal City/
Pentagon City Old Town/ CarlyleWestern
AlexandriaShirlington/ Fairlington Columbia Pike Rosslyn/Ballston
Major Comparison RetailersDepartment Stores Excluding Leased Departments-4521 50.0% 40.0% 30.0% 15.0% 10.0% 7.5% 10.0%
Radio, Television, Electronics Stores-443112 40.0% 25.0% 20.0% 20.0% 10.0% 5.0% 7.5%Home Furnishing Stores-4422 75.0% 50.0% 66.0% 35.0% 20.0% 10.0% 10.0%
Home Centers-44411 0.0% 0.0% 0.0% 0.0% 0.0% 0.0% 0.0%Book Stores-451211 75.0% 60.0% 66.0% 35.0% 25.0% 15.0% 15.0%
In-Line Comparison RetailersClothing Stores-4481 20.0% 15.0% 10.0% 10.0% 5.0% 2.5% 3.0%
Remainder of In-Line Comparison 30.0% 25.0% 20.0% 15.0% 10.0% 5.0% 3.0%
Food & BeverageFull-Service Restaurants-7221 20.0% 10.0% 15.0% 7.5% 5.0% 2.5% 2.0%
Limited Service Eating Places-7222 25.0% 10.0% 15.0% 5.0% 3.0% 2.0% 1.0%Drinking Places Alcoholic Beverages-7224 20.0% 10.0% 15.0% 7.5% 3.0% 2.0% 1.0%
Neighborhood RetailersSupermarket, Grocery -44511 25.0% 15.0% 5.0% 2.0% 3.0% 2.0% 1.0%
Pharmacies and Drug Stores-44611 20.0% 5.0% 3.0% 1.0% 1.0% 1.0% 0.0%Remainder of Neighborhood Retail 25.0% 15.0% 5.0% 2.0% 3.0% 1.0% 1.0%
Retail CategoriesFar Western Alexandria
Bailey's Crossroads Franconia Huntington
Route 1/ Hybla Valley Oxon Hill
SE Washington DC
Southern Downtown DC
Major Comparison RetailersDepartment Stores Excluding Leased Departments-4521 2.5% 1.0% 2.5% 5.0% 2.5% 12.5% 7.5% 5.0%
Radio, Television, Electronics Stores-443112 2.5% 1.0% 2.5% 7.5% 7.5% 10.0% 10.0% 2.5%Home Furnishing Stores-4422 5.0% 2.0% 5.0% 15.0% 15.0% 20.0% 20.0% 10.0%
Home Centers-44411 0.0% 0.0% 0.0% 0.0% 0.0% 0.0% 0.0% 0.0%Book Stores-451211 5.0% 2.0% 5.0% 15.0% 15.0% 25.0% 10.0% 5.0%
In-Line Comparison RetailersClothing Stores-4481 2.0% 1.0% 2.0% 3.0% 2.0% 10.0% 10.0% 2.0%
Remainder of In-Line Comparison 2.0% 1.0% 2.0% 3.0% 2.0% 10.0% 10.0% 2.0%
Food & BeverageFull-Service Restaurants-7221 2.0% 1.0% 5.0% 10.0% 7.5% 7.5% 3.0% 2.0%
Limited Service Eating Places-7222 1.0% 0.0% 3.0% 5.0% 5.0% 5.0% 3.0% 1.0%Drinking Places Alcoholic Beverages-7224 1.0% 0.0% 3.0% 5.0% 5.0% 7.5% 3.0% 1.0%
Neighborhood RetailersSupermarket, Grocery -44511 0.0% 0.0% 0.0% 2.0% 1.0% 2.0% 2.5% 0.0%
Pharmacies and Drug Stores-44611 0.0% 0.0% 0.0% 1.0% 0.0% 0.0% 1.0% 0.0%Remainder of Neighborhood Retail 0.0% 0.0% 0.0% 1.0% 1.0% 1.0% 2.0% 0.0%
1/ Based upon RCLCOs analysis of current and future competitive market.SOURCE: RCLCO; utilizing data in previous exhibits.
Page 55 of 61
capture rate04-12172.00
Printed: 10/30/2008
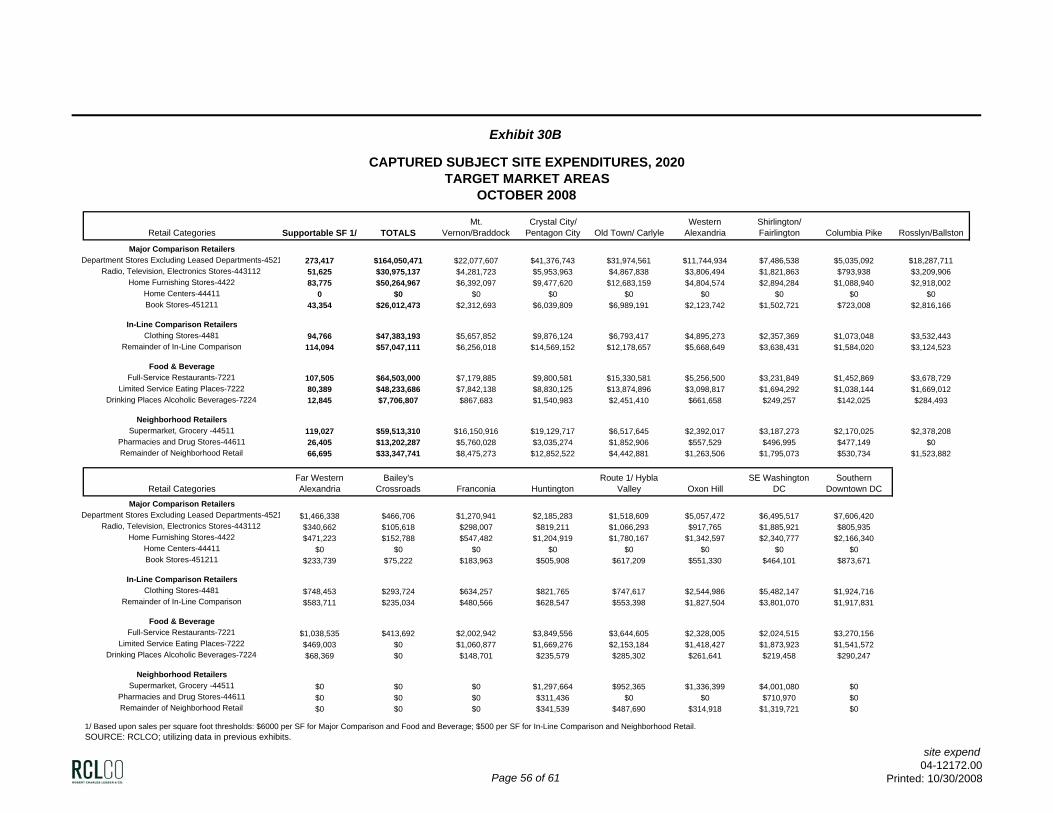
Exhibit 30B
CAPTURED SUBJECT SITE EXPENDITURES, 2020TARGET MARKET AREAS
OCTOBER 2008
Retail Categories Supportable SF 1/ TOTALSMt.
Vernon/BraddockCrystal City/
Pentagon City Old Town/ CarlyleWestern
AlexandriaShirlington/ Fairlington Columbia Pike Rosslyn/Ballston
Major Comparison RetailersDepartment Stores Excluding Leased Departments-4521 273,417 $164,050,471 $22,077,607 $41,376,743 $31,974,561 $11,744,934 $7,486,538 $5,035,092 $18,287,711
Radio, Television, Electronics Stores-443112 51,625 $30,975,137 $4,281,723 $5,953,963 $4,867,838 $3,806,494 $1,821,863 $793,938 $3,209,906Home Furnishing Stores-4422 83,775 $50,264,967 $6,392,097 $9,477,620 $12,683,159 $4,804,574 $2,894,284 $1,088,940 $2,918,002
Home Centers-44411 0 $0 $0 $0 $0 $0 $0 $0 $0Book Stores-451211 43,354 $26,012,473 $2,312,693 $6,039,809 $6,989,191 $2,123,742 $1,502,721 $723,008 $2,816,166
In-Line Comparison RetailersClothing Stores-4481 94,766 $47,383,193 $5,657,852 $9,876,124 $6,793,417 $4,895,273 $2,357,369 $1,073,048 $3,532,443
Remainder of In-Line Comparison 114,094 $57,047,111 $6,256,018 $14,569,152 $12,178,657 $5,668,649 $3,638,431 $1,584,020 $3,124,523
Food & BeverageFull-Service Restaurants-7221 107,505 $64,503,000 $7,179,885 $9,800,581 $15,330,581 $5,256,500 $3,231,849 $1,452,869 $3,678,729
Limited Service Eating Places-7222 80,389 $48,233,686 $7,842,138 $8,830,125 $13,874,896 $3,098,817 $1,694,292 $1,038,144 $1,669,012Drinking Places Alcoholic Beverages-7224 12,845 $7,706,807 $867,683 $1,540,983 $2,451,410 $661,658 $249,257 $142,025 $284,493
Neighborhood RetailersSupermarket, Grocery -44511 119,027 $59,513,310 $16,150,916 $19,129,717 $6,517,645 $2,392,017 $3,187,273 $2,170,025 $2,378,208
Pharmacies and Drug Stores-44611 26,405 $13,202,287 $5,760,028 $3,035,274 $1,852,906 $557,529 $496,995 $477,149 $0Remainder of Neighborhood Retail 66,695 $33,347,741 $8,475,273 $12,852,522 $4,442,881 $1,263,506 $1,795,073 $530,734 $1,523,882
Retail CategoriesFar Western Alexandria
Bailey's Crossroads Franconia Huntington
Route 1/ Hybla Valley Oxon Hill
SE Washington DC
Southern Downtown DC
Major Comparison RetailersDepartment Stores Excluding Leased Departments-4521 $1,466,338 $466,706 $1,270,941 $2,185,283 $1,518,609 $5,057,472 $6,495,517 $7,606,420
Radio, Television, Electronics Stores-443112 $340,662 $105,618 $298,007 $819,211 $1,066,293 $917,765 $1,885,921 $805,935Home Furnishing Stores-4422 $471,223 $152,788 $547,482 $1,204,919 $1,780,167 $1,342,597 $2,340,777 $2,166,340
Home Centers-44411 $0 $0 $0 $0 $0 $0 $0 $0Book Stores-451211 $233,739 $75,222 $183,963 $505,908 $617,209 $551,330 $464,101 $873,671
In-Line Comparison RetailersClothing Stores-4481 $748,453 $293,724 $634,257 $821,765 $747,617 $2,544,986 $5,482,147 $1,924,716
Remainder of In-Line Comparison $583,711 $235,034 $480,566 $628,547 $553,398 $1,827,504 $3,801,070 $1,917,831
Food & BeverageFull-Service Restaurants-7221 $1,038,535 $413,692 $2,002,942 $3,849,556 $3,644,605 $2,328,005 $2,024,515 $3,270,156
Limited Service Eating Places-7222 $469,003 $0 $1,060,877 $1,669,276 $2,153,184 $1,418,427 $1,873,923 $1,541,572Drinking Places Alcoholic Beverages-7224 $68,369 $0 $148,701 $235,579 $285,302 $261,641 $219,458 $290,247
Neighborhood RetailersSupermarket, Grocery -44511 $0 $0 $0 $1,297,664 $952,365 $1,336,399 $4,001,080 $0
Pharmacies and Drug Stores-44611 $0 $0 $0 $311,436 $0 $0 $710,970 $0Remainder of Neighborhood Retail $0 $0 $0 $341,539 $487,690 $314,918 $1,319,721 $0
1/ Based upon sales per square foot thresholds: $6000 per SF for Major Comparison and Food and Beverage; $500 per SF for In-Line Comparison and Neighborhood Retail.SOURCE: RCLCO; utilizing data in previous exhibits.
Page 56 of 61
site expend04-12172.00
Printed: 10/30/2008
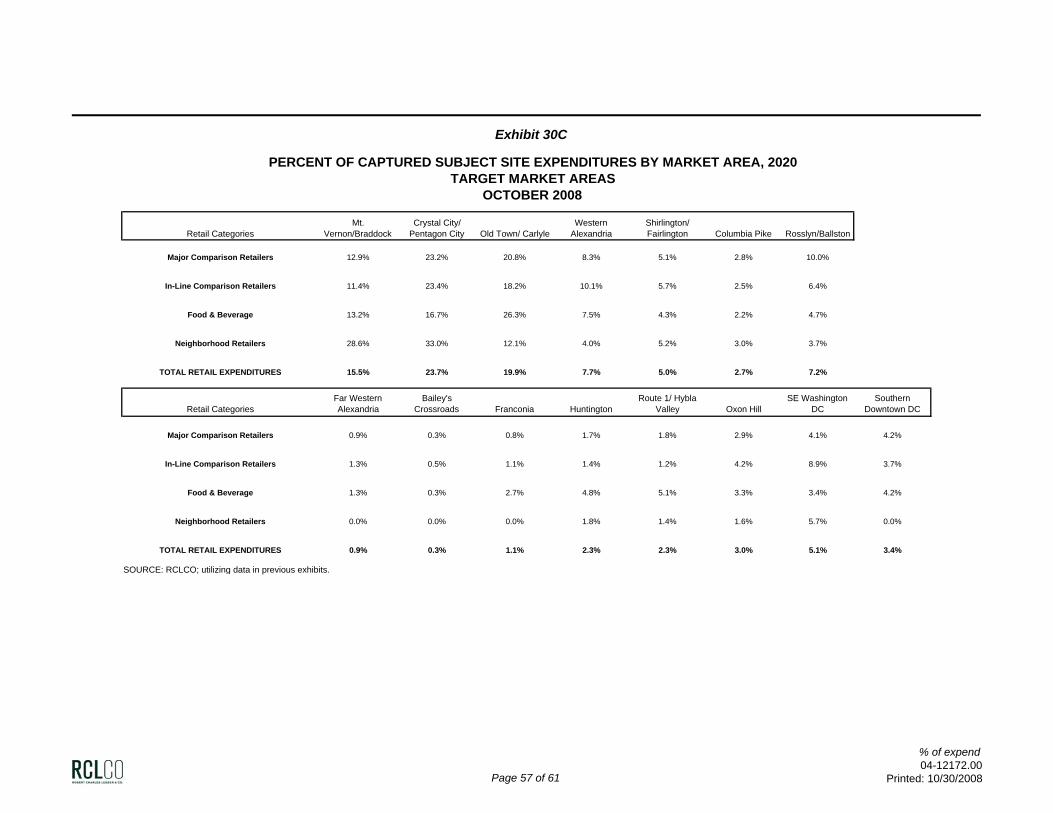
Exhibit 30C
PERCENT OF CAPTURED SUBJECT SITE EXPENDITURES BY MARKET AREA, 2020TARGET MARKET AREAS
OCTOBER 2008
Retail CategoriesMt.
Vernon/BraddockCrystal City/
Pentagon City Old Town/ CarlyleWestern
AlexandriaShirlington/ Fairlington Columbia Pike Rosslyn/Ballston
Major Comparison Retailers 12.9% 23.2% 20.8% 8.3% 5.1% 2.8% 10.0%
In-Line Comparison Retailers 11.4% 23.4% 18.2% 10.1% 5.7% 2.5% 6.4%
Food & Beverage 13.2% 16.7% 26.3% 7.5% 4.3% 2.2% 4.7%
Neighborhood Retailers 28.6% 33.0% 12.1% 4.0% 5.2% 3.0% 3.7%
TOTAL RETAIL EXPENDITURES 15.5% 23.7% 19.9% 7.7% 5.0% 2.7% 7.2%
Retail CategoriesFar Western Alexandria
Bailey's Crossroads Franconia Huntington
Route 1/ Hybla Valley Oxon Hill
SE Washington DC
Southern Downtown DC
Major Comparison Retailers 0.9% 0.3% 0.8% 1.7% 1.8% 2.9% 4.1% 4.2%
In-Line Comparison Retailers 1.3% 0.5% 1.1% 1.4% 1.2% 4.2% 8.9% 3.7%
Food & Beverage 1.3% 0.3% 2.7% 4.8% 5.1% 3.3% 3.4% 4.2%
Neighborhood Retailers 0.0% 0.0% 0.0% 1.8% 1.4% 1.6% 5.7% 0.0%
TOTAL RETAIL EXPENDITURES 0.9% 0.3% 1.1% 2.3% 2.3% 3.0% 5.1% 3.4%
SOURCE: RCLCO; utilizing data in previous exhibits.
Page 57 of 61
% of expend04-12172.00
Printed: 10/30/2008
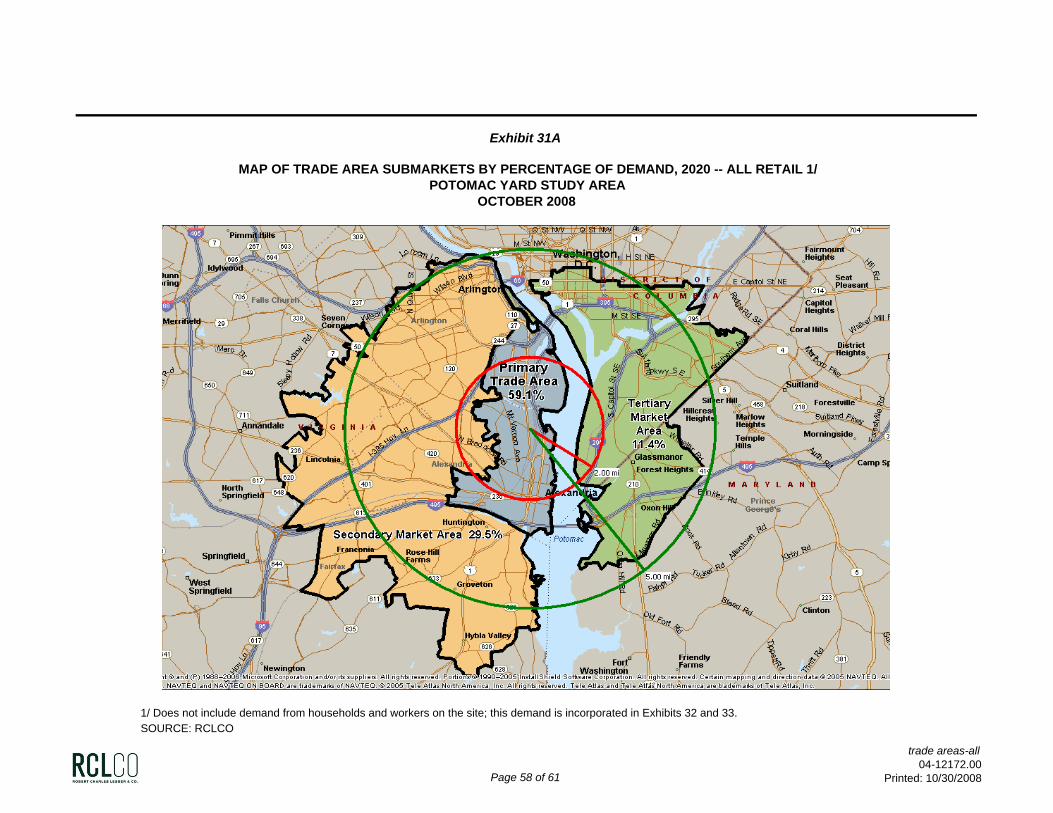
Exhibit 31A
MAP OF TRADE AREA SUBMARKETS BY PERCENTAGE OF DEMAND, 2020 -- ALL RETAIL 1/POTOMAC YARD STUDY AREA
OCTOBER 2008
1/ Does not include demand from households and workers on the site; this demand is incorporated in Exhibits 32 and 33.SOURCE: RCLCO
Page 58 of 61
trade areas-all04-12172.00
Printed: 10/30/2008
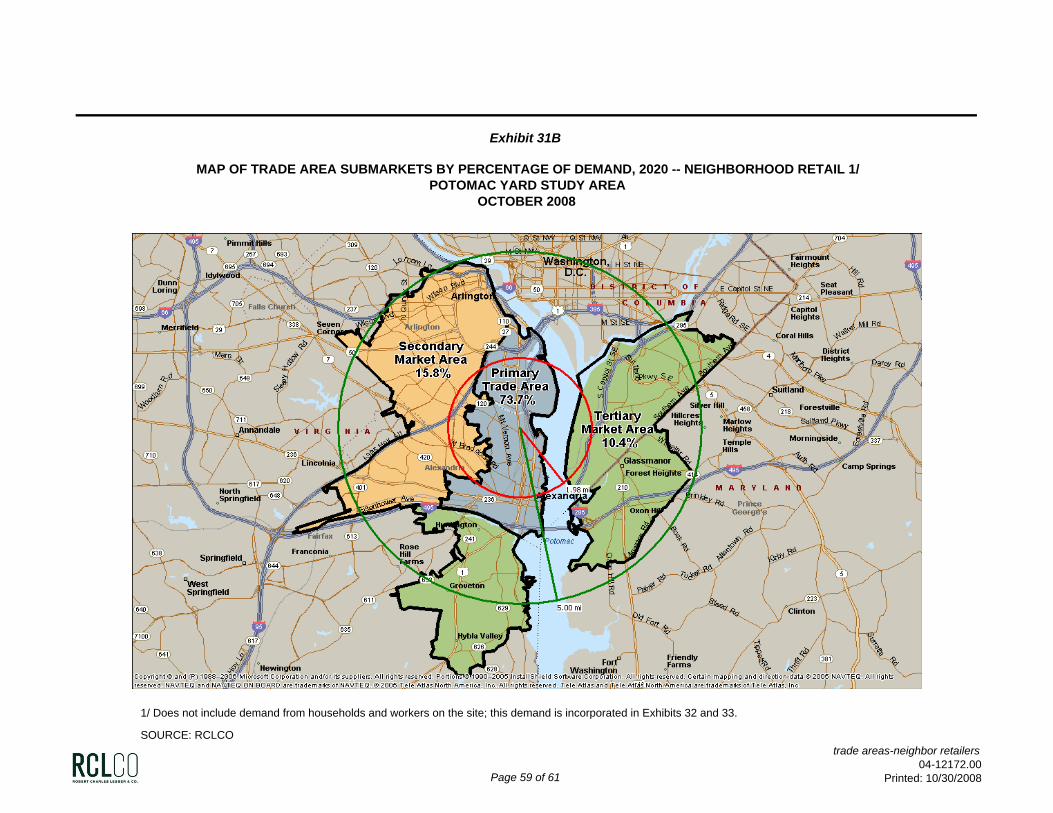
Exhibit 31B
MAP OF TRADE AREA SUBMARKETS BY PERCENTAGE OF DEMAND, 2020 -- NEIGHBORHOOD RETAIL 1/POTOMAC YARD STUDY AREA
OCTOBER 2008
1/ Does not include demand from households and workers on the site; this demand is incorporated in Exhibits 32 and 33.
SOURCE: RCLCO
Page 59 of 61
trade areas-neighbor retailers04-12172.00
Printed: 10/30/2008
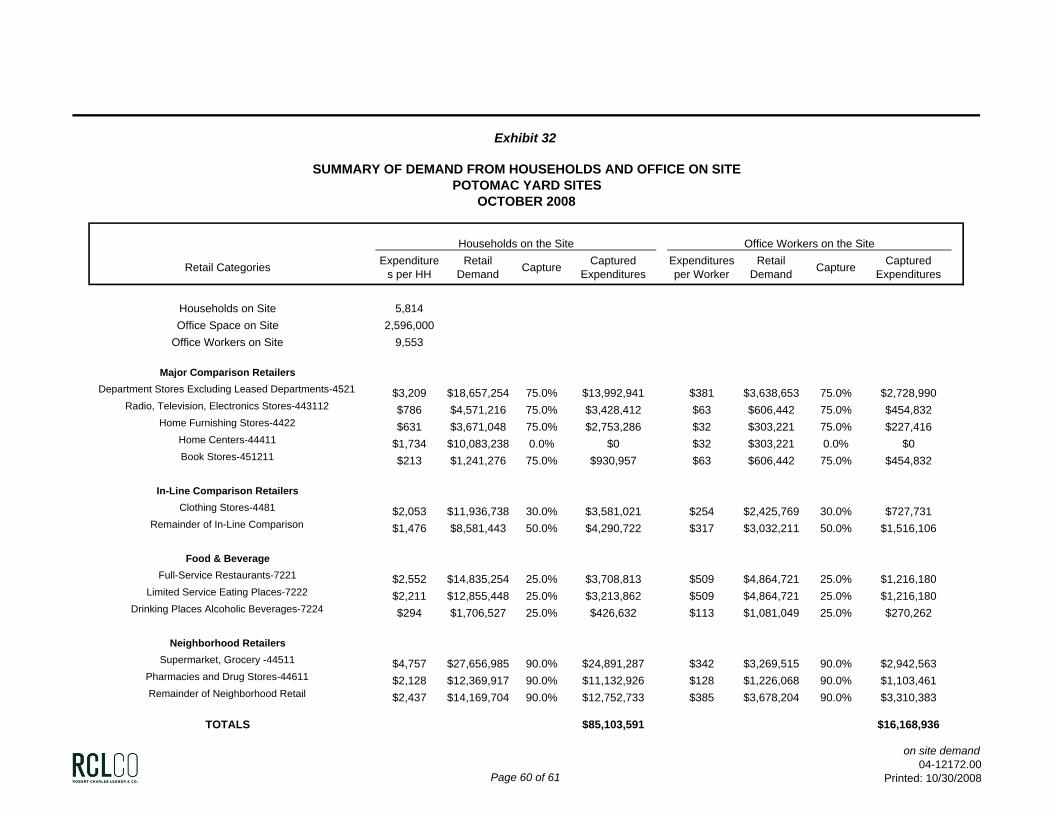
Exhibit 32
SUMMARY OF DEMAND FROM HOUSEHOLDS AND OFFICE ON SITEPOTOMAC YARD SITES
OCTOBER 2008
Households on the Site Office Workers on the Site
Retail Categories Expenditures per HH
Retail Demand Capture Captured
ExpendituresExpenditures per Worker
Retail Demand Capture Captured
Expenditures
Households on Site 5,814Office Space on Site 2,596,000
Office Workers on Site 9,553
Major Comparison RetailersDepartment Stores Excluding Leased Departments-4521 $3,209 $18,657,254 75.0% $13,992,941 $381 $3,638,653 75.0% $2,728,990
Radio, Television, Electronics Stores-443112 $786 $4,571,216 75.0% $3,428,412 $63 $606,442 75.0% $454,832Home Furnishing Stores-4422 $631 $3,671,048 75.0% $2,753,286 $32 $303,221 75.0% $227,416
Home Centers-44411 $1,734 $10,083,238 0.0% $0 $32 $303,221 0.0% $0Book Stores-451211 $213 $1,241,276 75.0% $930,957 $63 $606,442 75.0% $454,832
In-Line Comparison RetailersClothing Stores-4481 $2,053 $11,936,738 30.0% $3,581,021 $254 $2,425,769 30.0% $727,731
Remainder of In-Line Comparison $1,476 $8,581,443 50.0% $4,290,722 $317 $3,032,211 50.0% $1,516,106
Food & BeverageFull-Service Restaurants-7221 $2,552 $14,835,254 25.0% $3,708,813 $509 $4,864,721 25.0% $1,216,180
Limited Service Eating Places-7222 $2,211 $12,855,448 25.0% $3,213,862 $509 $4,864,721 25.0% $1,216,180Drinking Places Alcoholic Beverages-7224 $294 $1,706,527 25.0% $426,632 $113 $1,081,049 25.0% $270,262
Neighborhood RetailersSupermarket, Grocery -44511 $4,757 $27,656,985 90.0% $24,891,287 $342 $3,269,515 90.0% $2,942,563
Pharmacies and Drug Stores-44611 $2,128 $12,369,917 90.0% $11,132,926 $128 $1,226,068 90.0% $1,103,461Remainder of Neighborhood Retail $2,437 $14,169,704 90.0% $12,752,733 $385 $3,678,204 90.0% $3,310,383
TOTALS $85,103,591 $16,168,936
Page 60 of 61
on site demand04-12172.00
Printed: 10/30/2008
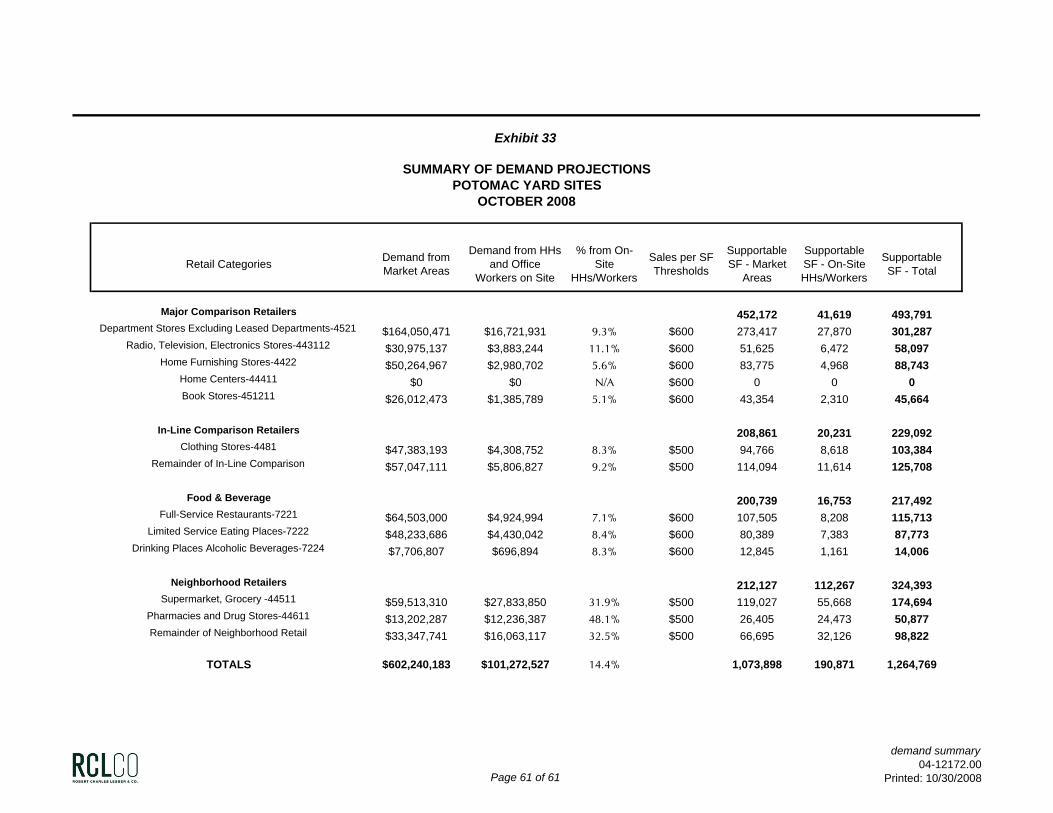
Exhibit 33
SUMMARY OF DEMAND PROJECTIONSPOTOMAC YARD SITES
OCTOBER 2008
Retail Categories Demand from Market Areas
Demand from HHs and Office
Workers on Site
% from On-Site
HHs/Workers
Sales per SF Thresholds
Supportable SF - Market
Areas
Supportable SF - On-Site HHs/Workers
Supportable SF - Total
Major Comparison Retailers 452,172 41,619 493,791Department Stores Excluding Leased Departments-4521 $164,050,471 $16,721,931 9.3% $600 273,417 27,870 301,287
Radio, Television, Electronics Stores-443112 $30,975,137 $3,883,244 11.1% $600 51,625 6,472 58,097Home Furnishing Stores-4422 $50,264,967 $2,980,702 5.6% $600 83,775 4,968 88,743
Home Centers-44411 $0 $0 N/A $600 0 0 0Book Stores-451211 $26,012,473 $1,385,789 5.1% $600 43,354 2,310 45,664
In-Line Comparison Retailers 208,861 20,231 229,092Clothing Stores-4481 $47,383,193 $4,308,752 8.3% $500 94,766 8,618 103,384
Remainder of In-Line Comparison $57,047,111 $5,806,827 9.2% $500 114,094 11,614 125,708
Food & Beverage 200,739 16,753 217,492Full-Service Restaurants-7221 $64,503,000 $4,924,994 7.1% $600 107,505 8,208 115,713
Limited Service Eating Places-7222 $48,233,686 $4,430,042 8.4% $600 80,389 7,383 87,773Drinking Places Alcoholic Beverages-7224 $7,706,807 $696,894 8.3% $600 12,845 1,161 14,006
Neighborhood Retailers 212,127 112,267 324,393Supermarket, Grocery -44511 $59,513,310 $27,833,850 31.9% $500 119,027 55,668 174,694
Pharmacies and Drug Stores-44611 $13,202,287 $12,236,387 48.1% $500 26,405 24,473 50,877Remainder of Neighborhood Retail $33,347,741 $16,063,117 32.5% $500 66,695 32,126 98,822
TOTALS $602,240,183 $101,272,527 14.4% 1,073,898 190,871 1,264,769
Page 61 of 61
demand summary04-12172.00
Printed: 10/30/2008