Embed Size (px)
Citation preview
The project is funded by the European Commission’s The project is funded by the European Commission’s
DirectorateDirectorate--General EnvironmentGeneral Environment
www.eutransportghg2050.euwww.eutransportghg2050.eu
Drivers of transport demand trends
Riccardo Enei - ISIS
This presentation
• The Task 3 introduction
• Results
– The hierarchy of drivers
– Trends
• Conclusions
– Impacts on GHG
– Uncertainties

Task 3 – Drivers of transport demand -
Part I (‘Review of the available information’) involves Tasks 1 to 4
aiming at collating the relevant data and providing the context for the project
Concerning transport trends and drivers, two main objectives:
Analyse transport demand, divided in appropriate major categories
and key characteristics: transport performed, modal use, GHG emissions.
Analyse the drivers behind transport demand trends, e.g. future trends.
the role of infrastructure planning and investment in influencing transport
activity over time.
Task 2: Transport scenarios Task 4: Policy measures

The hierarchy of drivers
Problem to overcome: The complexity of the drivers
1.SOCIETY1. Population growth and ageing
2. Migration
3. Urbanization
4. Work-time regimes (tele-working)
5. Tourism and leisure
6. Lifestyle
7. Safety
8. Security
2.ECONOMY9. Growth and productivity
10. Trade
11. Employment
12. Public budget constraints
3.ENERGY13. Energy supply
14. Energy demand
15. Energy prices
4.TECHNOLOGY
16. New energy infrastructure
17. New transport infrastructure
18. New fuels and vehicles
19. ICT development
5.ENVIRONMENT20. Pollution
21. Waste
22. Greenhouse gas emissions
23. Climate change
24. Natural resource consumption
6.POLICY25. EU enlargement
26. EU integration
27. EU territorial cohesion
28. EU taxation policy
29. Global trade governance
30. Global Climate Change governance
31. Global security governance

Suggested Solution: Prioritize the list of drivers on the basis of the TRANSvisions
DELPHI survey
The hierarchy of drivers
• Energy
1. Energy prices
• Society
2. Population ageing
3. Urbanization
4. Migration
5. Tourism
6. Lifestyle changes
• Economy
7. GDP growth
8. Globalization
• Technology and infrastructure
9. New infrastructure
10. ICT

The hierarchy of driversThe identification of drivers needs to be consistent with literature review
TRANSvisions EEA Paper (*) ITF/OECD Preliminary
Report (**)
1. Energy prices 1. Transport costs
2. Population ageing 1. Socio-demographic
changes
2. Population
3. Demographic
3. Urbanization 2. Physical changes to urban
forms/Land use
4. Urban form
5. Service Provision
4. Migration
5. Tourism
6. Lifestyle changes 3. Socio-cultural changes 6. Behaviour
7. Motorization rate
7. GDP growth 4. Economic growth
5. Organizational changes at
workplaces and schools
8. Income
9. Economy and trade
8. Globalization 6. Globalization
9. New infrastructure 10. Infrastructure
10. ICT 7. Technological development
(*) Beyond transport policy — exploring and managing the external drivers of transport demand.
Illustrative case studies from Europe, Technical report, NO 12/2008
(**) “Greenhouse Gas Reduction Strategies in the Transport Sector”, Preliminary Report, 2008
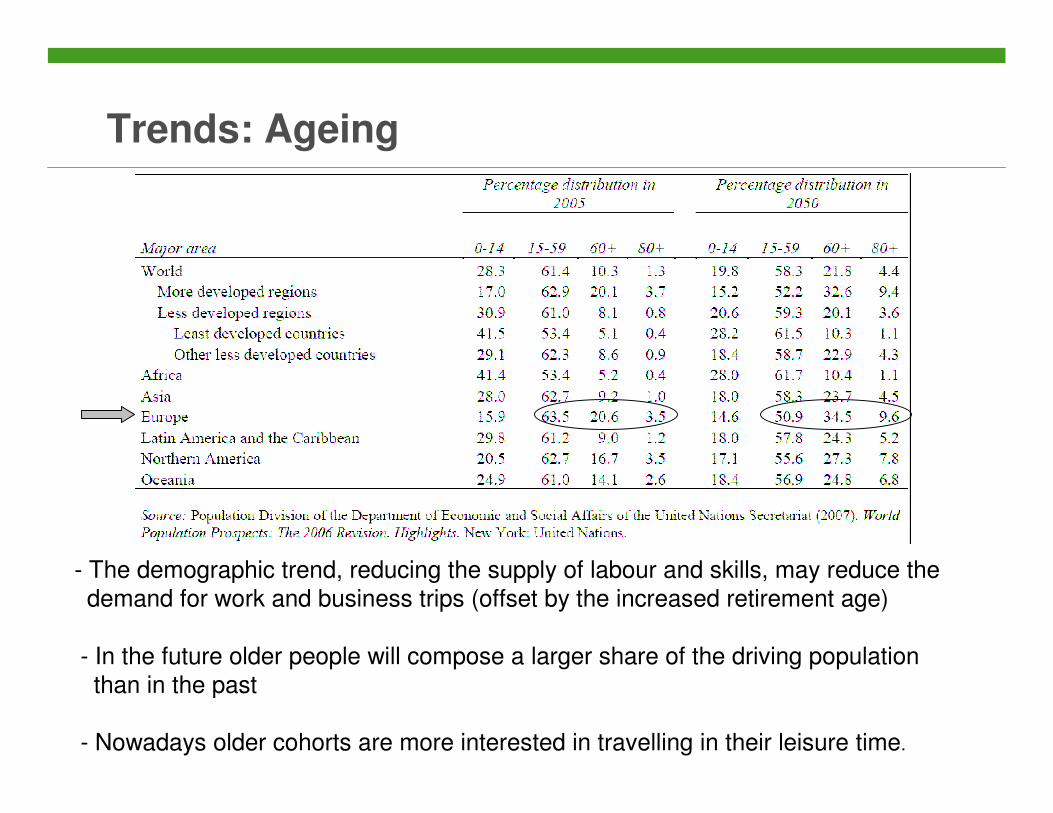
Trends: Ageing
- The demographic trend, reducing the supply of labour and skills, may reduce the
demand for work and business trips (offset by the increased retirement age)
- In the future older people will compose a larger share of the driving population
than in the past
- Nowadays older cohorts are more interested in travelling in their leisure time.

Trends: Migration
• At 2050, Europe is expected to be one of the primary recipients of international
migration patterns.
• EU-15 represents the major receiving area; in particular Germany, Italy and UK
On the contrary several NMS such as Estonia, Lithuania, Latvia and Poland,
are expected to have a negative average net migration.
Source: EC (2008) Demography report 2008

Trends: Urbanization
2005 2010 2015 2020 2025 2030
EU-15 73,8% 74,8% 76,0% 77,3% 78,7% 80,2%
NMS 63,0% 63,6% 64,4% 65,5% 66,8% 68,1%
EU-25 72,1% 73,0% 74,1% 75,4% 76,9% 78,4%
Source: World Urbanization Prospect, the 2005 Revision
• Urban growth is accompanied by urban sprawl – a relative shift in the location of
activities (housing, industries, retail and other services) towards
the peripheries of the urban agglomeration.
• Indeed, one of the consequences of urban sprawl is an increasing
dependence on the automobile for intra- and inter-metropolitan travel.
• Empirical evidences confirm that car dependency and car ownerships tend
to be lower in presence of more compact cities

Trends: Energy prices
• Responses to higher fuel prices are likely to fall within one of the following four categories:
1. in-vehicle adjustments (e.g. more efficient vehicles,
trip consolidation); 2. mode shift (walking/cycling PT, car pooling);
3. land use changes (change of residence)4. travel reduction

Trends: GDP growth
• For passenger transport, the GDP elasticity is equal to 0.65 on average for the period
2005 to 2030.
• For freight transport, the GDP elasticity of activity is projected to decrease gradually,
first down to 0.92 in 2005-2010, and then further down to 0.72 between 2010 and 2030.

Trends: Globalization
Source: Martin Stopford, Hong Kong Shipowners Association, • An important feature of globalization has been the ever increasing international trade
•Sea trade and investment are expected to growth, as consequence.
Trends: ICT
•Concerning production, the impacts affect both the manufacturing systems
and logistic and freight distribution: (just-in-time production, E-commerce,
transport cost reduction, spatial concentration, etc)
• Concerning living, a number of activities can be done now through the
Internet: these include e-shopping, e-medicine, e-education,
e-banking and e-entertainment. The direct effects on transport may be
some replacement of existing travel, but in the longer term new patterns of
longer distance travel may take place as the ICT becomes
embedded in lifestyles (e.g. last-minutes deals done through the Internet)
•Concerning working, much of the debate has concentrated on the potential
of tele-working to reduce commuting travel. However, much of the evidence
is limited

Trends: New Infrastructure
The provision of the new infrastructure, e.g. the planned TEN-T priority projects
is the main objective of the assessment: (TEN CONNECT project)
2005 Baseline-2050 % variation
Annual EU27 intra-NUTS3 passenger traffic variation Road passenger 0,9%
Rail passenger 0,9%
Annual EU27 inter-NUTS3 traffic variation Road passenger 0,6%
Rail passenger 2,7%
Annual Extra EU27 passenger traffic variation Air passenger 2,1%
Annual EU27 intra-NUTS2 freight traffic variation Road freight 0,4%
Annual EU27 inter-NUTS2 traffic variation Road freight 1,3%
Rail freight 2,3%
Annual Extra EU27 freight traffic variation Sea freight 1,5%
Sea freight outside EU 2,0%
EU27 traffic variation 2005/2050 Pkm 44,7%
Tkm 89,6%
Annual EU27 traffic variation Passenger 0,8%
Freight 1,4%

Trends: New Infrastructure
•The average passenger trip will become longer, to the extent that more intra/Extra
European trips and relatively less regional and domestic trips will be made.
•Passenger traffic will grow following the travel time and budget constraint
(approximately 15% of personal available income allocated in transport, in average).
While daily commuting trips may remain stable,
business and leisure trips abroad will grow faster.
•Freight trips will likely become longer as the share of intra European and extraEU27
increase against regional and domestic movements.
Economic integration of Eastern European countries and the globalisation process
(increase on imports and exports for overseas) may act as causal factors
• In central and northern regions, domestic freight traffic will remain stable,
decoupled from the economic growth, while traffics originated or having adestination outside EU27 grow faster than the economy.
•Eastern countries will have the biggest increase of freight transport(4,3% ton‐km per year), compared to the South – P, I, ES, GR -(1,58% per year)
and the North‐Centre – EU 15 - (‐0,3% per year)
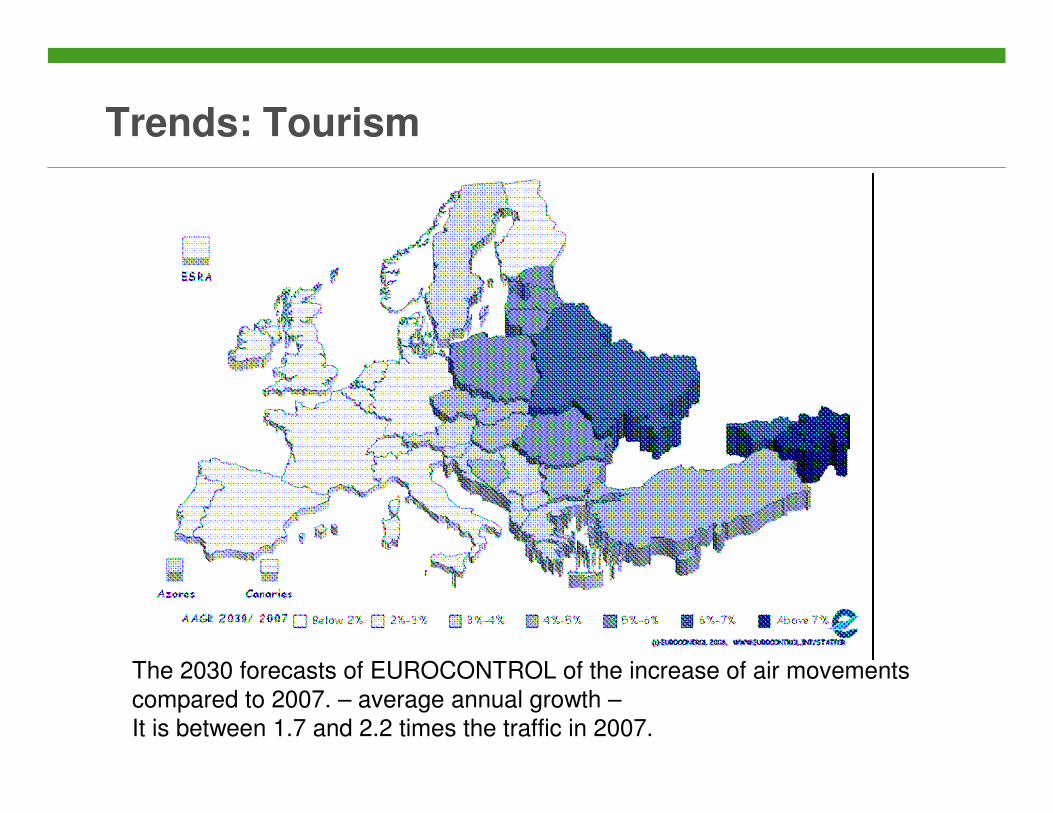
Trends: Tourism
The 2030 forecasts of EUROCONTROL of the increase of air movements
compared to 2007. – average annual growth –
It is between 1.7 and 2.2 times the traffic in 2007.

Conclusions: Drivers that reduce GHG emissions?
• High energy prices (high uncertainty)
• New infrastructure (assuming modal shift to public transport) (medium uncertainty)
• Lifestyle change (low carbon lifestyles) (high uncertainty)
• Ageing population using more public transport
(medium uncertainty)
… but outnumbered by drivers that are likely to increase
demand…

Conclusions: Drivers that increase GHG emissions?
• High GDP growth (high uncertainty)• Globalization (high uncertainty)
• Tourism (medium uncertainties)• Urbanization (high uncertainty)
• ICT (reducing transport costs) (high uncertainty)
• Ageing population using more car/air for leisure (medium uncertainty)
… but outnumbered by drivers that are likely to decrease demand…

Thank you for your attention