Embed Size (px)
Citation preview

THE PRACTITIONER’S
GUIDEto Cost-Effectiveness Analysis
of Nutrition Interventions
written byPatricia L. Splett, R.D., M.P.H., Ph.D.
for theMaternal and Child Health Interorganizational Nutrition Group
(MCHING)
May 1996
Maternal and Child Health Interorganizational Nutrition Group

The Practitioner’s Guide to
Cost-Effectiveness Analysis
of Nutrition Interventions
written by
Patricia L. Splett, R.D., M.P.H., Ph.D.
for the
Maternal and Child Health Interorganizational Nutrition Group(MCHING)
May 1996

Cite as: Splett, PL. 1996. The Practitioner’s Guide to Cost-Effectiveness Analysis of Nutrition Interventions.Arlington, VA: National Center for Education in Maternal and Child Health.
The Practitioner’s Guide to Cost-Effectiveness Analysis of Nutrition Interventions was prepared for the Maternaland Child Health Interorganizational Nutrition Group (MCHING) and is not copyrighted. Readers arefree to duplicate and use all or part of the information contained in this publication. In accordance withaccepted publishing standards, the National Center for Education in Maternal and Child Health (NCEMCH) requests acknowledgment, in print, of any information reproduced in another publication.
The mission of the National Center for Education in Maternal and Child Health is to promote andimprove the health, education, and well-being of children and families by leading a national effort to collect, develop, and disseminate information and educational materials on maternal and child health; andby collaborating with public health agencies, voluntary and professional organizations, research and train-ing programs, policy centers, and others to advance knowledge in programs, service delivery, and policydevelopment. Established in 1982 at Georgetown University, NCEMCH is part of the Graduate PublicPolicy Program. NCEMCH is funded primarily by the U.S. Department of Health and Human Servicesthrough its Maternal and Child Health Bureau.
Patricia L. Splett, R.D., M.P.H., Ph.D., an expert in evaluation and cost-effectiveness analysis, has preparedthe practitioner’s guide in collaboration with MCHING. She may be contacted at:Splett & Associates3219 Midland AvenueSt. Paul, MN 55110Tel: (612) 779-0554, fax: (612) 779-8099
Published by:National Center for Education in Maternal and Child Health2000 15th Street, North, Suite 701Arlington, VA 22201-2617Tel: (703) 524-7802, fax: (703) 524-9335Internet: [email protected]
Single copies of this publication are available for $10.00 from:Katrina HoltNational Center for Education in Maternal and Child Health2000 15th Street, North, Suite 701Arlington, VA 22201-2617Tel: (703) 524-7802, fax: (703) 524-9335Make checks or purchase orders payable to NCEMCH/Georgetown University.
This publication has been produced by the National Center for Education in Maternal and Child Healthunder its cooperative agreement (MCU-117007) with the Maternal and Child Health Bureau, HealthResources and Services Administration, U.S. Department of Health and Human Services.

iii
Acknowledgments ..........................................................................................................v
I. Introduction and Overview..................................................................................1Why Cost-Effectiveness Analysis? ....................................................................................................1Developing the Analytical Model ....................................................................................................3How to Use This Guide ..................................................................................................................3
II. Core Elements of Cost-Effectiveness Analysis ......................................................5
III. Determining Costs in Cost-Effectiveness Analysis ..............................................11Important Concepts of Cost Analysis ............................................................................................11Defining Costs ..............................................................................................................................13Specifying Costs and Collecting Data ............................................................................................14
IV. Determining Outcomes of Nutrition Services: Key Concepts ..........................16
V. Determining Outcomes of Nutrition Services: Effectiveness Evaluation............19Formulating the Evaluation Question ............................................................................................20Identifying Outcomes and Indicators ............................................................................................20Designing the Evaluation................................................................................................................22Ensuring Scientific Validity............................................................................................................23Determining the Study Sample ......................................................................................................25Defining Other Variables to Be Documented ................................................................................26Choosing Instrumentation ............................................................................................................26Pilot Testing Procedures for Data Collection..................................................................................26Quantifying the Magnitude of Effectiveness: Data Analysis ............................................................27
VI. Cost-Effectiveness Analysis: Reporting Results ..................................................30Relating Outcomes to Costs for Cost-Effectiveness Analysis ..........................................................30Reporting Cost-Effectiveness Analysis Results................................................................................31
VII. Pulling It All Together: Illustrating the Concepts ..............................................37Planning a Cost-Effectiveness Analysis of Nutrition Interventions ..................................................39Example: A Comparison of Three Staffing Models ........................................................................43
VIII. Future Challenges ..............................................................................................49
Table of Contents

iv
References and Suggested Resources............................................................................50
Appendix A: Worksheet to Critique Studies and Reports ............................................52
Appendix B: Glossary of Terms....................................................................................54
Exhibits1. Cost-Effectiveness Statement................................................................................................................52. Core Elements of Cost-Effectiveness Analysis ......................................................................................63. Report of Results of an Economic Analysis..........................................................................................94. Principal Cost Components for Cost Analysis....................................................................................115. Types of Costs Used in Economic Analysis........................................................................................136. Determining Outcome: Effectiveness Evaluation ..............................................................................207. Outcomes of Nutrition Intervention..................................................................................................218. Sources of Data..................................................................................................................................229. Practical Evaluation Designs for Nutrition Interventions....................................................................2410. Example of an Effectiveness Evaluation..............................................................................................2811. Cost-Effectiveness Ratio ....................................................................................................................3212. Cost-Effectiveness Ratio Using Quality of Life ..................................................................................3313. Cost-Effectiveness Ratios in a Meta-Analysis ......................................................................................3414. Cost-Effectiveness Analysis Results Presented in an Array..................................................................3515. Quick Style Presentation of Cost-Effectiveness Analysis Results ........................................................3516. Tips for Effective Communication on the Cost-Effectiveness of Nutrition Interventions ..................3617. Before You Begin . . . ......................................................................................................................3718. Six Steps for Cost-Effectiveness Analysis............................................................................................3819. Results from an Economic Analysis of Three Staffing Models ............................................................47

Acknowledgments
The Maternal and Child Health Interorganizational Nutrition Group (MCHING) is a partnership ofnational professional and voluntary organizations and federal agencies committed to improving the nutri-tion status of mothers, children, and families. Its goals are to (1) develop and improve collaboration, com-munication, exchange of information, and working relationships among partner organizations and agencies;and (2) provide a forum for policy and program development and advocacy for nutrition services for thesepopulations.
The project of developing a model to guide more studies on the cost-effectiveness of nutrition serviceswas initiated by MCHING and its constituent organizations in 1994. Factors related to cost were recog-nized as especially important in decision making regarding new health care delivery systems for mothersand children. Cost-effectiveness analysis is one of many strategies initially identified at the 1990 nationalworkshop, “Call to Action: Better Nutrition for Mothers, Children, and Families,” to focus on promotingand improving nutritional health and well-being.
Participants at the April 1995 MCHING meeting engaged in a stimulating and critical discussion of theapplication of evaluation and cost-effectiveness analysis in practice settings. The important challenges, limi-tations, and opportunities they raised helped refine and focus the Guide as a useful tool for practitionersand organizations.
The Practitioner’s Guide to Cost-Effectiveness Analysis of Nutrition Interventions is the result of the foresightand input of many people throughout the MCHING network. Special thanks are expressed to the follow-ing individuals and to many others whose names are not listed here.
Thanks go to the following reviewers representing MCHING organizations: Michaela Donohue,American College of Nurse Midwives; Joyce Dougherty, Association of State and Territorial Public HealthNutrition Directors; Jerianne Heimendinger, National Cancer Institute; Leslie Jackson, AmericanOccupational Therapy Association; Jackie Krick, University Affiliated Programs; Sally Ann Lederman,Association of Faculties of Graduate Programs in Public Health Nutrition; Jackie McDonald, NationalAssociation of WIC Directors; Ann Prendergast, Maternal and Child Health Bureau, DHHS; MargaretTate, American Dietetic Association; and Elizabeth Tuckermanty, Extension Service, USDA. Thanks arealso expressed to Maria Nardella, Washington State Office of Children with Special Health Care Needs, forreviewing the document and providing suggestions.
The author would like to acknowledge the valuable contribution of Marcia H. Magnus, FloridaInternational University, who piloted a draft of the Guide with nutrition graduate students and providedmany helpful suggestions for improving the document.
The author also wishes to express appreciation to colleagues at the National Center for Education inMaternal and Child Health. Darby Graves, Cheryl Oros, and Carol West Suitor contributed innumerableideas for the development of the document and Katrina Holt assisted with the final preparation of the doc-ument. The expertise of the publications staff—Jeanne Anastasi, copyeditor; Oliver Green, designer; andCarol Adams, director of communications is evident in this publication. Rochelle Mayer, NCEMCHDirector, deserves special thanks for her continuous support throughout the project.
v


1
T he Practitioner’s Guide presents a tool forlearning about cost-effectiveness analysis and
for developing skills in planning and carrying outevaluations that assess the cost-effectiveness ofcompeting alternatives. The purpose of this Guideis to make cost-effectiveness analysis achievable forany practitioner or student interested in the nutri-tional well-being of clients, patients, or programparticipants. The approach presented can beimplemented in any setting where there is an interest in learning more about the effectivenessand the cost of nutrition-related activities.
The Practitioner’s Guide is designed to provideyou, the MCH practitioner, with:
• A general understanding of cost-effectivenessanalysis;
• A step-by-step model for determining the cost-effectiveness of a nutrition intervention, pro-gram, or service; and
• Examples of cost-effectiveness analysis applied inthe field of nutrition.
The content of the Guide was selected and orga-nized to provide only the essential information forinitiating cost-effectiveness analysis, using the per-spective of the organization. Once this is mastered,practitioners will be prepared to expand to othermethods and perspectives of economic analysis.Suggested resources are included for those interest-ed in further exploring economic analysis.
Why Cost-Effectiveness Analysis?
When health and human service resources arescarce, as they are now, these resources must becarefully allocated to the activities and programsthat have the highest potential for achievingimportant outcomes. Today, both practitioners andpolicymakers are asking the question: Are the
Cost-effectiveness analysis, as defined inthis Guide, is a systematic process of
comparing the costs and outcomes of two ormore competing alternatives for the purpose
of making a decision that improvesefficiency.
Why do cost-effectiveness analysis?• To impact the decision-making process• To develop awareness• To ensure the survival of nutrition
programs• To promote accountability
I.Introduction and Overview
nutrition and health gains a reasonable return forthe resources invested? By examining the amountor magnitude of outcome produced per unit ofcost, cost-effectiveness analysis can provide theanswer.
Impacting the decision-making process
Who is going to decide the best way to helppeople in your target audience or service popula-tion meet their nutrition and health needs? Howwill these decisions be made? Maternal and childhealth (MCH) practitioners must be informed par-ticipants in the decision-making process. Concreteinformation on the outcomes and costs of nutri-tion programs will be crucial in sorting out thoseprograms that have the greatest impact on impor-tant nutrition needs, but do so at a reasonable costor at a lower cost than competing intervention orprogram alternatives.
When MCH practitioners have actual data onexpected outcomes and expected costs, not just forone program, but for a range of possible alterna-tives, then they can responsibly and convincinglyimpact the decision-making process. This decisionmaking may happen within the nutrition unit, inthe MCH program, across the organization,between organizations, or in legislative bodies.
Developing awareness
One important result of cost-effectiveness analy-sis is greater awareness among practitioners con-cerning the processes and related resource require-ments of nutrition interventions and programs.This can help identify ways to streamline andimprove the efficiency of program operations andimprove the overall cost-effectiveness of the pro-gram. Section III will lay the groundwork forgreater understanding of the process and costs ofnutrition interventions, programs, and services.
Ensuring survival of nutrition programs
Not all practitioners take time to examine theoutcomes of their programs and summarize them
for a year or other period of operation. In manysettings, MCH practitioners focus on the successin enabling the individual client to achieve a clini-cal goal. Although this is important for the indi-vidual patient or client, it is not enough. To ensurethe ongoing availability of nutrition services inmaternal and child health, the survival of nutritionprograms requires regular evaluation and goodinformation on outcomes.
Program effectiveness must not be judged fromthe “best case” scenario; rather, it must be objec-tively determined from a systematic look at all par-ticipants who were referred, eligible, or enrolled inthe program, or who received services. The effec-tiveness of the nutrition program is the aggregateeffect over a complete range of clients (some highlymotivated, others not so motivated; some withnutrition as a primary concern, others with manybarriers or complications). Sections IV and V willexpand the processes and issues in evaluating theeffectiveness of nutrition interventions, programs,and services.
Promoting accountability
No matter how the analysis is approached, youas MCH practitioners must be accountable. Youmust have a thorough understanding of theresources required to operate effective programs,and must have evidence to show that nutritionprograms do make a difference. Cost-effectivenessanalysis can help meet accountability requirements.
The steps of determining costs and outcomesare not entirely new, nor do they need to be com-plex and difficult. The steps involved can build onthose used in quality assurance initiatives in manyorganizations today, where total quality manage-ment (TQM) or continuous quality improvement(CQI) teams are charged with identifying opportu-nities for improving services.
2

Developing the Analytical Model
In 1977, the American Dietetic Associationestablished a committee to develop a cost-benefitanalysis protocol for nutrition care. The result cul-minated in the development of a model for poten-tial economic benefits of nutritional counseling(Mason, 1979). That model remains valid today.During the same period, the Office of TechnologyAssessment (1982) directed work on the cost-effec-tiveness of medical technologies and defined 10general principles for cost-effectiveness and cost-benefit analyses that examine costs and outcomes.Those principles are reflected in the model pre-sented in the Guide.
Several reviews have summarized publishedreports on the costs, effectiveness, and methods ofcost-benefit analysis and cost-effectiveness analysisof nutrition care (Mason, 1979; Disbrow, 1989;Splett, 1991; Barr, 1993). Each of these reviewspointed out the lack of reported evidence and chal-lenged nutrition practitioners to collect and reportdata on the costs and outcomes of nutrition inter-ventions and programs, and to do so followingsound methodology. In recent years, the AmericanDietetic Association and several state dietetic asso-ciations have collected dietitians’ reports of exam-ples where cost savings resulted from nutritionintervention.
These reports present a picture of significantclinical and economic impacts resulting fromnutrition intervention in a wide range of settings(Mathieu-Harris, 1994). However, case reports andanecdotes are just the beginning step in programevaluation and justification. Difficult decisionswith far-reaching consequences should be based ona more comprehensive examination of nutritionprograms. Considering the monumental changesbeing initiated by welfare and health care reform,it is now time to strengthen the information baserelated to the cost-effectiveness of nutrition inter-ventions and programs, particularly those address-ing the needs of the vulnerable maternal and childhealth population.
How to Use This Guide
This Guide is divided into eight sections.Sections I and II provide background informationon cost-effectiveness analysis. If you are alreadyfamiliar with these concepts, you may want to goon to Sections III, IV, and V—these sections focuson “how to” perform cost-effectiveness analysis.Section VI focuses on reporting results, once yourcost-effectiveness analysis is complete. Section VIIprovides step-by-step illustrations and models forcost-effectiveness analysis. Section VIII discussesfuture challenges for nutritionists in performingcost-effectiveness analysis successfully.
Important points throughout the text are high-lighted in the margin. Exhibits (in boxes) andexamples (noted by italics) illustrate conceptsdescribed in the text. References, suggestedresources, a checklist, and a glossary are alsoincluded.
Section II defines and describes the basic ele-ments integral to cost-effective analysis. The nineelements include: (1) defining a clear problem state-ment or evaluation objective; (2) following specificguidelines for the type of analysis (in this case, cost-effective analysis); (3) determining the perspectivefor analysis (whose resources are at stake); (4) iden-tifying two or more program alternatives for com-parison; (5) determining one key outcome or resultto be achieved by the intervention or program; (6) considering all costs involved (all resources consumed in the delivery of the intervention); (7) determining the time horizon or relevant periodfor implementation of the intervention and out-come measurements; (8) using sound data to esti-mate costs and outcomes; and (9) summarizingfindings and interpreting results.
Section III explains how to calculate the costsof a nutrition intervention, using the cost analysismethod. The principal resources or cost componentsinvolved in cost analysis are identified, and timehorizon and market price concepts are discussed.Advanced elements in cost analysis, including sen-
3

sitivity analysis and discounting, are introduced inthis section. Discounting is a procedure used tocovert future costs and future outcomes to “pre-sent value,” or to convert data collected in differ-ent time periods to a standard base year. Sensitivityanalysis is used to determine whether assumptionsmade in the analysis have affected the final conclusion.
This section also defines the three kinds of costsassociated with economic analysis: direct costs (costsassociated directly with the intervention or costsborne by the client), indirect costs (involving timeand productivity), and intangible costs (such as painand suffering). Cost analysis—the systematicprocess of quantifying costs—involves a series ofseven activities, one of which involves methods ofcalculating costs. Costs can be calculated andreported as full cost (total cost of program over aperiod of time), average cost (cost per unit of out-come), incremental cost (cost of adding to an exist-ing program), or marginal cost (the cost of doing alittle more or less). Section III concludes with anexample showing how a nutritionist might deter-mine the cost analysis of prenatal nutrition servicesin a public health setting for a specified period oftime.
Section IV defines and describes the key ele-ments involved in determining outcome. Theseinclude: (1) clearly defining the intervention ortreatment; (2) measuring efficacy or effectiveness; (3) determining the criterion against which successwill be measured; (4) choosing an appropriate tar-get population; (5) identifying possible outcomes ofthe intervention; (6) selecting an indicator to mea-sure the outcome; (7) determining the relevantperiod or time horizon for the normal course ofintervention; (8) preparing an evaluation design;and (9) using sensitivity analysis for assessing theimpact of assumptions on the effectiveness of vari-ous interventions.
Section V explains how to evaluate the effective-ness of a nutrition intervention. This section tellshow to define the evaluation question and identify
the key outcome and its indicators. It describesdesigning an evaluation so that equal attention isgiven to collecting data on the outcomes producedby each alternative under consideration. It discuss-es ensuring scientific validity and determining thestudy sample, including sample size and sampleselection. Other variables, including interventionvariables, client characteristics, and intervening vari-ables, are also mentioned. This section discusseschoosing instrumentation, the method used tomeasure outcomes and other important variables.Finally, data collection and data analysis are cov-ered. Section V concludes with an example ofeffectiveness evaluation taken from a publishedstudy.
Section VI explains how to report results of acost-effectiveness analysis so that the results aremeaningful to the readers of the report.Possibilities include a full report, an executive sum-mary, a cost-effectiveness ratio, an array, and otherpresentation styles.
Section VII ties the previous informationtogether in a six-step process for planning a cost-effectiveness analysis of nutrition interventions.These steps include: (1) stating the objective of the analysis; (2) defining the framework for theanalysis; (3) determining costs; (4) determiningoutcomes; (5) relating costs to outcomes; and (6) summarizing, interpreting, and reporting thefindings.
Section VIII identifies future challenges for thenutrition community related to the cost-effective-ness analysis of nutrition interventions.
4

5
Cost-effectiveness analysis links costs and out-comes to determine the payoff of investing
resources in a given course of action. A claim thata program or intervention is “cost-effective” can bemade only in comparison to some other alternativefor achieving the same outcome. Exhibit 1 pro-vides an example of an appropriate cost-effective-ness claim.
Becoming familiar with the following nine ele-ments and the specific definition of terms will helpMCH practitioners understand economic evalua-tion and cost-effectiveness analysis. These elementsare classified as core elements and must be under-stood before beginning any cost-effectivenessanalysis. The advanced elements, including sensi-tivity analysis and discounting, will be discussed inthe Cost and Outcome sections.
1. PROBLEM/EVALUATION OBJECTIVE.What type of program or intervention options areunder consideration? What are the nutrition andhealth aims of the intervention/program? Whoneeds the evaluation information? Answers to thesequestions help clarify the objective to be accom-plished through the economic evaluation.Remember, the objective should be an unbiaseddetermination of how to most efficiently use scarceresources for a specific purpose.
2. TYPE OF ANALYSIS. Cost-effectiveness analy-sis is one method of assessing options and makingdecisions, using the criterion of economic efficien-cy. There are several other types of economicanalysis, including cost minimization, cost-benefitanalysis, cost utility analysis, and clinical decision
II.Core Elements of
Cost-Effectiveness Analysis
Exhibit 1. Cost-Effectiveness Statement
“While the least expensive single interventions and the more costly multiple interventions wereall highly effective in improving blood pressure control in low-risk patients, only the combinationsof interventions were effective in improving control in the high-risk patients.This evidence sug-gests that targeting combinations of interventions to high-risk groups would improve the cost-effectiveness of multiple interventions.”
Cantor, JC, Morisky, DE, Green, LW, Levine, DM, Salkever, DS. Cost-Effectiveness of Educational Interventions toImprove Patient Outcomes in Blood Pressure Control. Preventive Medicine,14:782–800, 1985.

analysis. All of these methods identify, quantify,and evaluate both the costs and the outcomes ofalternative projects and help to inform decisionsabout initiating or expanding interventions or pro-grams designed to achieve a desired outcome.MCH practitioners with limited experience in eco-nomic analysis should start with cost minimizationand cost-effectiveness analysis. [The major meth-ods of cost analysis are briefly defined in theGlossary of Terms.]
3. PERSPECTIVE. The perspective for analysisidentifies those whose resources are at stake. Theperspective influences which costs and which out-comes are most relevant to include in the analysis;therefore, the perspective for analysis is decidedearly when planning the evaluation. The perspec-tive for analysis is selected based on the primaryaudience for the results. The perspective is select-ed from the following: the organization providingthe nutrition program or service, the payer (e.g.,third-party payer), patients, the health care sector,or society (taxpayers). This Guide focuses on theperspective of the provider organization.
4. ALTERNATIVES. Two or more alternativesmust be identified for comparison. The point is toidentify other alternatives that could be selected to
address the nutrition aims besides your program orthe current way of doing things. All reasonablealternatives should be evaluated; however, at leasttwo must be identified. Occasionally, a cost effec-tiveness analysis considers the costs and outcomesof choosing a specific alternative or doing nothing.
Example #1: Alternatives for supplementing the diet oflow-income women during pregnancy might include thefollowing: distribution of food commodities (CSFP), dis-tribution of vitamin and mineral supplements, provisionof vouchers for specific nutritious foods (WIC), provisionof extra vouchers for any food (food stamps), or provisionof an extra cash allowance to pregnant women (to be usedfor food). These alternatives vary greatly in cost and intheir likely impact on the nutritional well-being of thepregnant woman and the infant.
Example #2: A WIC nutritionist might ask: Within ourWIC program, is it more cost-effective to teach nutritioneducation on an individual basis or in a group setting? Inthis example, only two alternatives are under considera-tion.
5. COSTS. This element considers all resourcesthat are consumed in the delivery of the interven-tion. The element of costs emphasizes resourcerequirements to put in place the intervention,which can then produce the desired outcomes.Costs can include direct costs to the health caresystem (such as personnel to provide the service),indirect costs experienced by the patient or partici-pant (such as lost wages to attend clinic), or intan-gible costs such as pain and suffering. (This Guidediscusses only the direct costs incurred by theprovider organization to deliver the nutrition inter-vention.)
The framework for cost-effectiveness analysisalso can be planned to consider some costs of out-comes. Costs can be assigned to the major conse-quences that result from the intervention. Thesemight be added costs related to complications(e.g., the cost of treating complications related to amisplaced feeding tube), or cost savings due to thenutrition intervention (e.g., cost savings when thewell-controlled woman with gestational diabetes
6
Exhibit 2. Core Elements ofCost-Effectiveness Analysis
• Problem/Evaluation Objective• Type of Analysis• Perspective• Alternatives• Costs• Outcomes• Time Horizon• Sound Data• Results and Interpretation

delivers a healthy baby). Cost on the results sideare added to the input costs to yield a net cost; orsavings on the results side are subtracted from theinput costs to yield the net costs of nutrition ser-vices. (See Section III for additional informationon costs.)
6. OUTCOMES. The term “outcome” is used inthis Guide as a general term to include all possibleintended and unintended results of the nutritionprogram or intervention. Other terms used in thecost-effectiveness literature include “results,” “con-sequences,” “effects,” “quality adjusted life years,”and “benefits.” The outcome is the result producedby the nutrition intervention or program. It caninclude positive as well as negative consequences.A key outcome for cost-effectiveness analysis isderived from the objective of the program or inter-vention. Some programs have many desired out-comes.
Example: Nutrition services in prenatal care have goals ofimproving the dietary intake of the women, assuring ade-quate maternal weight gain, and contributing to thedevelopment of a healthy, normal weight infant. Fromthese, the key outcome for cost-effectiveness analysis couldbe infant birthweight.
In cost-effectiveness analysis, one key outcome isidentified and used uniformly across all alterna-tives. This outcome must be observable and mea-surable. Outcomes address patient/participantachievement of the clinical goal (e.g., cholesterolreduction, weight gain, blood glucose control, riskfactor reduction, improved management of fooddollars, or other goal) as a result of the nutritionintervention. Secondary outcomes related to theneed for or use of health care services in the futurecan also be measured. (See Sections IV and V foradditional information on outcomes and theirmeasurement.)
7. TIME HORIZON. The time horizon is the rel-evant period for the normal course of intervention(e.g., one contact, three visits during the prenatalperiod, or semiannual contacts across a lifetime).
The MCH practitioner must determine whichtime horizon is feasible for data collection for theintervention and for the outcome. The availabilityof resources to conduct the cost-effectivenessanalysis will determine whether short-term orlonger-term costs and outcomes can be measured.If a short-term time horizon is selected, conclu-sions about long-term costs and outcomes arebeyond the scope of the analysis.
The model recommended in this Guide focuseson current costs and outcomes. It identifies andsummarizes the costs and outcomes of nutritionintervention as they are experienced in the shortterm. It should be recognized that nutrition behav-iors are adopted and changed over time, and whilesome outcomes can be observed and measured inthe short term, many important outcomes are notattained until years later.
Example: Consider a cost-effectiveness analysis whoseobjective is to determine whether a basic intervention (one45-minute contact) is more cost-effective than an intensiveintervention (180 minutes divided into three contacts) inenabling persons with diabetes to control their blood glu-cose. The problem must be defined in terms of the timehorizon under consideration. Some ongoing nutrition con-tact would be expected throughout the life of persons withdiabetes, and blood glucose could be measured at anypoint. But for short-term analysis, practitioners coulddefine nutrition intervention during one quarter (costs),and could measure its short-term impact on blood glucose(outcome) when patients return for their next quarterlyvisit. This plan measures the short-term effect of the nutri-tion intervention and the extent to which patients begin aregimen of blood glucose control. This analysis is balancedin that resource inputs (costs) are tracked in a reasonableperiod of time that is relevant to the period over whichoutcomes are evaluated. The analysis allows conclusionsabout the cost-effectiveness of nutrition intervention over ashort-time horizon.
Two factors affect the specification of the timehorizon. First, a meaningful temporal relationshipshould exist between input costs and outcomes.Second, feasibility considerations influence whatoutcomes can be tracked and the realistic time
7

period for tracking them. To illustrate these fac-tors: A successful weight control program for chil-dren may reduce the rate of obesity, hypertension,and hypercholesterolemia as cardiovascular diseaserisk factors in adulthood. However, the long-termoutcomes are very difficult to track, and, as timepasses, it becomes more difficult to attribute suchoutcomes to the childhood weight control pro-gram. Furthermore, the participating clients maybe exposed to additional interventions in order tocontrol weight throughout childhood and earlyadulthood.
8. SOUND DATA. Data to document or estimatecosts and outcomes must be precise, valid, andreliable. Data collection could be retrospective(where records from the current or past year areused as a source of cost and outcome estimates); orprospective—where plans for data collection aremade and cost and outcome data are collected asthe intervention is implemented during the follow-ing months.
Existing data from program reports and pub-lished studies also can be used to estimate out-comes. Use of existing data is especially relevantwhen the objective of the analysis is to estimate thepotential cost-effectiveness of a proposed new pro-gram or intervention or modification of an existingone. Meta-analysis is a method of integrating thedata from several studies to get an estimate ofprobable outcome. Government reports, profes-sional journals, and other scientific literature aresources of data on the effectiveness of variousnutrition intervention strategies and programs. A
checklist included in this Guide (see Appendix A)will assist you in critically reviewing existingreports before deciding to use data from them inyour cost-effectiveness study.
Little information has been published on thecosts of nutrition interventions and programs.Even when existing data are available to estimateoutcomes, it will probably be necessary to collectactual data on the costs for each alternative. Animportant point to remember is that consistentmethods should be used across all alternatives formeasuring or estimating costs and outcomes.
9. RESULTS AND INTERPRETATION. Thereport should include a description of methodsused for cost and outcome determination, assump-tions made, and a summary of the costs and out-comes for each alternative. The final results of acost-effectiveness analysis are usually reported inratio form, as illustrated in Exhibit 3a. Since manynutrition interventions have important conse-quences that cannot be summarized in the keyoutcome, other positive and negative consequencesshould also be listed and discussed. Many expertsrecommend using an array to report a range ofconsequences (Exhibit 3b) and cost detail (Exhibit3c). Presenting the results and comparisons ineasy-to-understand tables and charts renders themmore useful (and user-friendly) to decision makers.The results are followed by a discussion of thefindings, their interpretation, and implications.Include all issues of concern to users of the report,especially the issues likely to be considered in thedecision making. Tips for presentation of theresults of cost-effectiveness analysis are expanded inSection VI.
8
NOTE: To ensure the relationship betweenthe nutrition intervention and the out-comes, identify a similar time horizon forboth cost and outcomes, and plan a timehorizon in which sound data on costs andoutcomes can be tracked.

9
3b. A Comparisona of Outcome Measures of Prenatal Care Clients*
Measure The Corner OB Clinic p ValuePercent who stopped/reduced smokingb 27.6 9.5 0.00Mean gestational age (weeks) 39.1 38.9 0.38Gestational age 37+ weeks (%) 90.4 90.0 0.91Mean birthweight (grams) 3161 3178 0.78Birthweight < 2500 g (%) 15.5 10.8 0.20Mean Apgar score
1 minute 7.5 7.5 0.995 minutes 8.6 8.5 0.39
Index pregnancy complications score 3.20 3.36 0.81Percent with Cesarean section 15.4 13.9 0.69Mean days hospitalized for mother 4.82 4.92 0.76Mean days ICUc 0.00 0.01 —Mean days hospitalized for baby 5.11 4.77 0.49Mean days NICUd 0.44 0.24 0.32Mean days moderate care for baby 1.06 0.85 0.57Index newborn complications score 5.54 4.15 0.25
a Adjusted for age, race, insurance coverage, and smoking status.b [(No. who stopped or reduced smoking during prenatal care)100/Total no. who smoked] adjusted for age, race, and insurancecoverage.c ICU, intensive care unit.d NICU, neonatal intensive care unit.* Reprinted with permission. Kay, BJ, Share, DA, Jones, K, Smith, M, Garcia, D,Yeo, SE. Process, Cost, and Outcomes of Community-Based Prenatal Care for Adolescents. Medical Care, 29(6):531–542, 1991.
3a. Cost-Effectiveness Ratios for Prenatal Care Alternatives for Adolescents*
The Corner OB Clinicn=180 n=180
Cost:Total cost of program $134,640–145,080 $327,240–363,960(for all 180 served)
Effectiveness: 150 160No. infants > 2500 g
Cost-effectiveness ratio: $898–967 $2045–2275Cost per infant achieving birthweight > 2500 g
*Calculated from data reported by Kay, et al. (1991) shown below.
Exhibit 3. Report of Results of an Economic Analysis

The authors did not select one outcome as a keyoutcome. If they had chosen one (e.g., birthweightwith the criterion for success defined as birth-weight > 2500 g), then a cost-effectiveness ratiocould be calculated, as in Exhibit 3a, which showsthe comparative cost per successful outcome. Notethat comparing ratios in Exhibit 3a leads to thesame conclusion as looking at the array of outcomeand cost data (in Exhibit 3b and 3c)—The Corneris the preferred alternative.
The costs in Exhibit 3c are presented as conserv-ative and liberal estimates. This is a way of express-ing uncertainty and enabling comparisons across arange of estimates. Exhibit 3b reports numerousoutcome measures. Note that there was only onestatistically significant difference—percent who
stopped smoking. Since the outcomes are approxi-mately equal, costs become the deciding factor inselecting the most efficient alternative.
10
3c. Comparative Costs of Prenatal Programs:The Corner and Women’s Hospital OB Clinic*
Component The Corner OB ClinicAverage cost/initial visit (including initial labs) $74–$81 $291–$317Average cost/revisit $18–$23 $86–$107
Average number revisits 9.79 6.79Average cost/final visit $18–$23 $89–$112Average cost/postpartum visit $30–$37 $89–$112
Subtotal $303–$361 $1,053–$1,268Charge/NSOPVa $50 $50
Average number NSOPV 0.64 1.04Charge/IP room $456 $456
Average number IP days 0.57 0.69Charge/ultrasound $180 $180
Average number ultrasounds 0.67 1.32Charge/nonstress test $45 $45
Average number nonstress tests 0.29 0.73Laboratory charges not included in visits $20 $118
Subtotal $445 $755Total average cost/client $776 $1918
($748–$806)b ($1,818–$2,022)
a NSOPV, nonscheduled hospital outpatient visits.b The dollar ranges reported resulted from conservative and liberal estimates about salaries and wages and, in the case of the OBClinic, varying estimates on the average number of prenatal visits per month.* Reprinted with permission. Kay, BJ, Share, DA, Jones, K, Smith, M, Garcia, D,Yeo, SE. Process, Cost, and Outcomes of Community-Based Prenatal Care for Adolescents. Medical Care, 29(6):531–542, 1991.

To analyze the cost-effectiveness of nutritioninterventions and programs, it is essential to
identify and quantify all costs associated with thespecific nutrition intervention/program and theother alternatives under review. All costs are deter-mined, starting with the initial client recruitmentor registration through to the achievement of thefinal outcome. After resource requirements aremeasured or estimated for each alternative, theyare summarized as total, average, incremental,and/or marginal costs. In addition, discountingand sensitivity analysis should be applied whenappropriate. This section defines and elaboratesthese concepts and processes.
Important Concepts in Cost Analysis
Understanding Basic Concepts
Resources. The concept of resources is integral tothe process of determining costs. To provide nutri-tion interventions or programs and produce thedesired outcomes, resources must be consumed,making them unavailable for another purpose.When resources are scarce, consumption should betracked and the efficiency (or productivity) ofresource allocation should be assessed. The princi-pal resource components tracked and assigned acost value in accounting systems are personnel,
fringe benefits, supplies, materials, contracted ser-vices, facility costs, and administrative overhead.These principal cost components are organizedtogether in activities that make up interventions orprograms designed to produce important healthoutcomes.
Time Horizon. Few nutrition interventions aresingle events. Consider the intervention model and
11
III.Determining Costs in
Cost-Effectiveness Analysis
Exhibit 4. Principal CostComponents for Cost Analysis
PersonnelFringe benefitsFood and nutrition products
and suppliesOffice suppliesEducation materialsEquipmentLaboratory testsOther diagnostic and monitoring
proceduresOther ancillary servicesContinuing education and training of staffFacility/spaceAdministrative overhead

the course of interaction that the client shouldhave with the program to achieve successful healthoutcomes. This leads to more comprehensive cost-ing of the intervention over a realistic time period;as well as appropriate linking of resource needs tothe desired outcome. The following examples illus-trate long and short time horizons.
Example (shorter time horizon): Practitioner engages inbreastfeeding promotion activities with the pregnant clientduring the prenatal period to inform the client about allthe benefits of breastfeeding and to influence her decisionto initiate breastfeeding.
Example (longer time horizon): Practitioner conducts aninitial series of four contacts over a six-month period witha newly diagnosed adolescent client with diabetes, in orderto establish a successful nutrition plan to manage bloodglucose levels. This series is followed by semiannual visitswith the dietitian over the client’s lifetime, as an adjunctto medical management, to prevent or delay the complica-tions of diabetes.
Market Price. In determining costs, a monetaryvalue is assigned to every cost component, usingthe actual market price to the buyer or an assignedvalue. In many economic evaluations of nutritionservices, the buyer is the provider/ health careorganization; other times the buyer is the third-party payer. Occasionally, the buyer is the govern-ment or the patient. Several reported cost-effective-ness analyses of nutrition services have used patientor third-party charges rather than actual costs.Costs based on market prices paid by the organiza-tion are generally preferred, since they provide amuch better indication of the real resource require-ments needed to deliver nutrition services andachieve outcomes.
Understanding Advanced Concepts
Discounting. Discounting is a mathematical pro-cedure used to convert future costs and future out-comes to “present value.” When resources are usedover a long period (more than one year), analysisrequires the discounting of all costs to a standardbase year. Two factors make discounting necessary
in long-term analyses: (1) Inflation reduces thevalue of money over time; and (2) there is a ten-dency to prefer both dollars and benefits now,rather than in the future. In the analysis, data arediscounted before costs are related to outcomesand conclusions drawn. Discounting can be doneusing computer accounting or statistical analysissoftware. The discount rate used can rangebetween 2 and 10 percent per year, with 5 percentas the most common rate.
Example: A child with phenylketonuria (PKU) receivesintensive nutrition services from a nutritionist in the earlychildhood years and less frequent intervention later in life.When these costs are added together, they would be quitedifferent depending on whether the costs were projected atthe beginning of life (say, for example, 1975) or at adult-hood (1995). In this example, the analysis of the totalcost of nutrition intervention to prevent mental retarda-tion and support adequate growth and development so theperson can become a functioning adult must include dis-counting of costs to a standard base year.
Sensitivity Analysis. When calculating costs,assumptions frequently need to be made to assigna value to each cost component. All assumptionsshould be documented.
Example: Nutritionists’ salaries vary significantly byregion of the country, by years of experience, and by jobclassification. Cost might be low if it is assumed that theservice is provided by an entry-level nutritionist receivingthe base salary in a specific state. On the other hand, if thenational average salary for a public health nutritionist isused, the costs would be very different.
12
TIP: When comparing costs between pro-grams in different years and when usingpublished reports of costs, it is importantto note the base year for cost analysis andadjust the figures to a common base yearusing the Consumer Price Index beforemaking comparisons.

Example: The actual amount of time nutritionists spendwith prenatal clients was not documented, but nutrition-ists estimated that they spent 45 minutes with clients atthe first visit and 10 minutes at each follow-up visit.Because of the uncertainty, sensitivity analysis could beused to explore the results if the nutritionists underestimat-ed or overestimated the time commitment by 25 percent,for example.
It is essential to perform sensitivity analysiswhenever assumptions have been made and uncer-tainty exists about a value used in the analysis. Toperform sensitivity analysis, “what if ” scenarios areused to document and determine the impact ofsalary assumptions (or other uncertainties) on thecost figures. The report of costs should describethe assumptions made and how sensitivity analysiswas used to explore the impact of the assumptionson the cost analysis and results.
If changing some of the assumptions used toassign value to resources significantly changes theconclusion, then greater efforts should be directedtoward determining the true value for the cost
component. When this is not possible, the analystshould state explicitly that the results are “sensitiveto” the value assigned to that component (e.g.,“the conclusion of cost-effectiveness of alternativeB over alternative A is sensitive to assumptionsabout salary level of nutritionists providing theeducation”).
Defining Costs
Costs have been grouped by economists intodirect, indirect, and intangible costs (see Exhibit5). In most cost-effectiveness analyses of nutritionprograms, direct costs are estimated from principalcost components incurred by the provider organi-zation. Direct costs include resources consumed inthe prevention, diagnosis, treatment, and habilita-tion of a disease. In nutrition, direct costs aredefined as those resources used by the provider inthe delivery of nutrition and related care to achievethe health goals or outcome objectives of the inter-vention or program. Other perspectives for analysiswould require the inclusion of other kinds of costs.
13
Exhibit 5.Types of Costs Used in Economic Analysis
Cost Definition Examples
Direct health care •Costs associated directly with the nutrition • Nutrition education and counseling(or other sector) cost intervention and related health care • Supplemental foods
•Health care or other cost resulting from • Related medical visitsthe intervention • Laboratory tests
• Hospitalization (required or avoided)
Direct patient costs •Costs borne by patients or their families • Transportation to clinicas a result of participating in the nutrition • Cost of special food productsintervention
Indirect costs •Cost of reduced productivity as a result of • Time lost (from work, school, nor- condition/illness and nutrition intervention mal activities) because of condition
• Preparation of special feeding• Time needed to participate in inter-
vention/program
Intangible costs •Difficult-to-quantify costs related to pain • Impaired mental functioningand suffering and quality of life • Social limitation due to dietary
restriction

Specifying Costs and Collecting Data
The process of quantifying costs is called costanalysis. It provides a systematic and defensibleestimation of resource consumption, which is nec-essary for cost-effectiveness analysis. The process isnot complicated, but it must be approached in asystematic and careful manner. (See Splett andCaldwell [1985] for additional detail.) Cost analy-sis must be carried out with equal precision foreach alternative being compared. Cost analysisinvolves:
• Listing all activities;
• Identifying principal cost components for activities;
• Collecting data or estimating resource consump-tion for principal cost components;
• Assigning a monetary value to each componentand activity using market prices;
• Listing all assumptions made for possible sensitivity analysis;
• Calculating total, average, incremental, and/ormarginal costs; and
• Performing discounting if necessary.
Summarizing and Reporting Costs
The findings of the cost analysis can be summa-rized and reported in a number of ways, including:
Full cost —the total cost of program over a periodof time (usually one year).
Total costs can be further broken down into:
• Fixed costs—stable costs not related to volumeof service; or
• Variable costs—resource utilization that varieswith volume (number of clients) or intensity(frequency and type of contact) of service.
Average cost—the cost per unit of output/outcome,determined by dividing all fixed and variable costsinvolved divided by the number of units of service(e.g., cost per nutrition assessment; cost per lowbirthweight infant prevented).
Incremental cost—the cost for nutrition as an add-on to an existing service (e.g., nutrition assessmentadded to an EPSDT visit).
Marginal cost—the cost of doing a little more or alittle less (e.g., adding a second nutrition follow-upvisit for people completing a weight loss program).
Incremental or marginal costs are more relevantto economic analysis than total or average costs,because incremental or marginal costs relate to theextra cost to produce each added effect. Total andunit costs are especially useful for budgeting andfor establishing fee and negotiating reimbursementrates.
Example: A substantial amount of resources are consumedto develop a program and system to deliver nutrition mes-sages through local grocery stores. Once the program isdeveloped, adding another store greatly expands the num-ber of families reached but the “marginal” costs are con-siderably less than the original cost of introducing the pro-gram in the first store.
Step-by-Step Cost Analysis
The following example illustrates how a nutri-tionist might proceed to determine the cost ofnutrition services in prenatal care from the per-spective of the public health center, based on thecurrent program year.
1. Prepare a flow chart of all activities involved inproviding nutrition services to pregnant clients,including activities such as:
• Client recruitment and outreach;
• Nutrition assessment and counseling of clients;
• Record keeping and scheduling;
• Client follow-up and monitoring; and
• Program administration and evaluation.
(Note that preservice and postservice activities areincluded in costs.)
2. Identify the principal cost components necessaryfor each activity. This might include nutrition andclerical personnel, fringe benefits, nutrition educa-
14

tion materials and equipment, laboratory tests tomonitor anemia, office and clinic space, nutritionreference materials, office supplies, and administra-tive overhead.
3. Specify ways costs will be measured. Use workschedules and existing reports such as service statis-tics or accounting records (after verifying theircompleteness and accuracy), or conduct time stud-ies or productivity studies, or use other methods toaccurately estimate the quantity of principal costcomponents necessary to carry out each activity.
4. Work with accounting staff to assign a monetaryvalue based on the actual cost to the organizationfor each cost component. Keep track of allassumptions made along the way.
5. Calculate the total costs for prenatal nutritionservices, then divide by the number of womenserved to get an average or unit cost. If the costanalysis looked only at nutrition costs as a compo-nent of an existing prenatal care program, the costscould be considered incremental costs. Freestand-ing nutrition services delivered at a different loca-tion requiring separate staffing and facilities wouldlikely have significantly different, and probablyhigher, costs. Similar steps with similar assump-tions should be carried out for each alternative tobe compared in the cost-effectiveness analysis.
15

The following concepts are essential in deter-mining outcomes of nutrition services.
Additional, more advanced concepts, are discussedin the next section.
Intervention (treatment). An intervention is apurposefully planned service, program, policy, orother activity provided or directed to a definedpopulation for the purpose of changing a behavior,risk factor, condition, aspect of health status, orsystem. Before evaluation can proceed, these ele-ments of the intervention must be clearly defined:the service, program, policy or activity; target pop-ulation; and desired effect or outcome. In researchand evaluation reports, the intervention is fre-quently referred to as the treatment. In experimen-tal studies, the intervention/treatment is carefullysupervised by the investigators; in field studies, theintervention is more likely to vary as program staffimplement it in real-world conditions.
Efficacy versus Effectiveness. “Efficacy”reflects the level of outcome expected when theintervention is applied under ideal conditions.Controlled experimental studies measure efficacy.“Effectiveness” involves the level of outcomeachieved when services are rendered under ordi-nary circumstances by average practitioners fortypical clients. Evaluation and the new approach toclinical research, called Medical EffectivenessResearch or Outcomes Research, focus on effec-
tiveness in real-world settings (Green, Bondy,Maklan, 1994).
An intervention is “effective” when the targetpopulation is successful in reaching a meaningfuloutcome. Effectiveness is determined by compari-son to a preestablished criterion for success. Twojudgments are relevant. One is clinical importance(that is, is the degree of change important in termsof generally accepted measures of signs and symp-toms of disease, health status, physical, social ormental functioning, quality of life, or other out-comes?). The second is statistical significance. Doesthe change from preintervention to postinterven-tion represent a statistically significant difference?Is the difference in magnitude of change betweengroups or between interventions statistically signif-icant?
Criterion. The criterion is the benchmarkagainst which effectiveness or success is assessed.The criterion for the judgment of clinical impor-tance is commonly selected from the following:substantial improvement from the baseline value, astandard value established by science or expertconsensus, a national objective such as HealthyPeople 2000 objectives, or the intervention objec-tive (when it has been expressed in definite, mea-surable terms). The criterion for statistical signifi-cance is usually set at a 0.05 level of significance.
16
IV.Determining Outcomes of
Nutrition Services: Key Concepts

Target Population. Individuals respond in dif-ferent ways to behavioral interventions such asnutrition. It is important to carefully define thecharacteristics of the population receiving thenutrition intervention. Evaluation results with onetype of population are not necessarily applicable topopulations with other characteristics.
The target population for whom the interven-tion was designed is the reference population forthe evaluation. Characteristics such as geographiclocation, sociodemographics (age, economic sta-tus), disease risk, and severity of condition are fre-quently used to define the target population. Onechallenge in evaluation is to obtain a representativesample of the reference population for the study.
Outcome. Outcomes address what happens toclients in terms of prevention, control of risk fac-tors, and results of treatment, rehabilitation, or pal-liation of disease or disability. Outcomes includeboth intended and unintended consequences. Akey desired outcome is usually expressed in theintervention objectives. In addition to the key out-come, there may be other positive or negative out-comes. Although cost-effectiveness analysis focuseson one key outcome, other outcomes may beimportant in overall decision making and shouldbe considered in the evaluation.
Indicator. An indicator is an observable andmeasurable form of an outcome. It defines the spe-cific terms by which the outcome will be mea-sured. Standard indicator sets enable common datacollection and documentation across sites and pro-grams using standardized terminology and defini-tions. Standardization increases the efficiency andaccuracy of evaluation efforts and allows for aggre-gation of outcome data across programs and states.Efforts are underway to define standard clinicalindicators for nutrition care (Kushner, et al., 1994).
Example: The desired outcome of a weight managementprogram is weight loss. The indicator could be defined inquantitative terms as number of pounds lost or as percentof baseline body weight lost over a six-month period. Theindicator could also be defined in categorical terms such asachieved weight loss goal at six months (Yes/No).
For cost-effectiveness studies, select an indicatorthat has units that can logically be related to costsand that will be understood by decision makers.The reliability and validity of instruments and pro-cedures for measuring and documenting the indi-cator also must be considered when selecting indi-cators.
Time Horizon. The concept of time horizonhas a special application in determining effective-ness. Depending on the definition of the outcomeindicator, there is a natural period of time thatmust pass before the outcome can be validlyassessed. This is determined by the behavioral,physiological, or clinical response to the interven-tion. Change in knowledge can be assessed imme-diately after an educational intervention; however,the impact of the education on dietary behaviorrequires a period for trial and adoption into theclient’s lifestyle. Meaningful assessment of trialbehavior change might be 3–6 months after theintervention, while assessment at 2–5 years may benecessary to assert permanent lifestyle change.
Example: A nutritionist providing the nutrition compo-nent of a wellness program designed to reduce risk factorsfor cardiovascular disease and ultimately reduce the inci-dence of cardiovascular events (angina, stroke, heartattack) must think carefully about relevant indicators ofsuccess and the appropriate time horizon to measure them.Serum cholesterol reduction could be measured in a fewweeks, nutrition risks within the profile of risk factorscould be assessed at the one-year follow-up screening, andcardiovascular disease events must be measured severalyears in the future.
Design. Evaluation design refers to a set of deci-sions you make in setting up the evaluation.Design consists of:
• Identifying groups (intervention alternatives orcontrol or comparison groups) to be studied andcompared;
• Defining relevant reference population anddetermining the sample size and method ofsampling from the population;
• Assigning clients to groups (e.g., random, self-selection);
17

• Identifying points in time when key outcomeindicators will be measured in each group;
• Selecting and defining other outcome, interven-tion, client, and intervening variables to betracked;
• Developing and testing forms and proceduresfor data collection; and
• Planning for analysis of data.
Section V expands these points for applicationin nutrition programs.
Sensitivity Analysis. In the process of deter-mining outcomes, many uncertainties are facedand assumptions are made to deal with the uncer-tainties. All assumptions should be documented.Sensitivity analysis uses “what if ” scenarios toassess the impact of assumptions before final con-clusions are made regarding the effectiveness ofvarious interventions.
Example: Consider a situation where breastfeeding initia-tion rates were assessed in six different WIC sites acrossthe state—three using peer educators and three offering“standard” breastfeeding promotion. The nutritionistwants to use the success rates at the peer educator sites toestimate the number of WIC infants who would shift fromthe formula package to breastfeeding if the peer educatorprogram is expanded to all sites. The breastfeeding initia-tion rates at the three peer educator sites were 59 percent,73 percent, and 85 percent, respectively, compared to therates at the standard sites (49 percent, 53 percent, and 55percent). The future rate of initiation of breastfeeding withpeer educators could be the best rate, the lowest rate, themedian rate, or an average rate. What rate should thenutritionist use? Answer: the median or average rate.Then the nutritionist should perform a sensitivity analysisby recalculating the results to answer the questions:“What if we get results more like the low site?” and“What if the results we get are more like the best site?”Now the nutritionist has three estimates of the number ofWIC infants who could be expected to shift from the formula package, and has more outcome information torelate to costs for the cost-effectiveness analysis of this pro-posed expansion.
18

K nowledge about the efficacy and effectivenessof nutrition interventions is increasing.
Nutrition counseling was identified by the U.S.Preventive Services Task Force (1989) as one of the169 clinical preventive services for which there isempirical evidence of effectiveness. A recent reviewby Barr (1993) of the literature on clinical effec-tiveness of dietetic services identified 120 articles.While prenatal care is included, no articles are ref-erenced on nutrition in infancy, childhood, or ado-lescence. Evaluations of nutrition interventions forchildren with special health needs are conspicuous-ly absent from reviews of the literature. Data arealso lacking on the effectiveness of nutrition inter-vention in health promotion and disease preven-tion for mothers, children, and families. The evalu-ation of nutrition interventions is challengingbecause nutrition is often an adjunct to other ser-vices such as prenatal care or management ofchronic conditions; and many competing forcesinfluence nutrition behaviors. In spite of thosechallenges, evaluation is possible and achievable.Effectiveness evaluation is crucial for programimprovement and survival.
Estimation of effectiveness is an essential ingre-dient in cost-effectiveness analysis. Cost-effective-ness analysis requires careful assessment and docu-mentation of the outcomes produced bycompeting interventions. Since cost-effectiveness
analysis compares the magnitude of a specific out-come per unit of cost, accurate assessment or pre-diction of the magnitude of outcome for eachcompeting alternative is imperative.
The magnitude of outcomes resulting fromnutrition intervention is determined through effec-tiveness evaluation. The steps involved in effective-ness evaluation are outlined in Exhibit 6 and dis-cussed in this section.
19
V.Determining Outcomes of
Nutrition Services: Effectiveness Evaluation

Formulating the EvaluationQuestion
Any evaluation requires explicit statement of theevaluation question. In effectiveness evaluation, thebasic questions are: Does the intervention lead to aclinically important and statistically significantchange in the key outcome indicator? What is themagnitude of effect? Is the magnitude of effect dif-ferent between compared alternatives? Are otherimportant outcomes achieved?
At this stage, you should have clearly deter-mined the specific intervention you are evaluatingand the relevant alternatives or comparisons.
Identifying Outcomes andIndicators
The outcome of interest in a specific evaluationmust be linked to the objective of the intervention.Thus, in defining the key outcome, the firstrequirement is to clarify the objectives of the inter-vention and define the primary indicator of “suc-cess.” This is the key outcome to be comparedacross alternatives. Other consequences can andshould be tracked and compared, but the key out-come should be the basis for determining thedegree of effectiveness for the cost-effectivenessanalysis.
20
Exhibit 6. Determining Outcome: Effectiveness Evaluation
Define the Evaluation Question• Determine which interventions will be evaluated
Determine Key Outcome Indicators
Design the Evaluation and Specify Procedures for Data Collection• Define relevant population • Determine sample size and method of sampling• Establish points to collect outcome data • Define all intervention, client, intervening, and other outcome variables to be collected• Develop and pilot test forms and procedures for data collection• Plan data analysis methods
Collect Data According to Procedures• Train data collectors• Monitor quality and completeness of data
Analyze the Data• Code and enter data• Assess clinical importance• Assess statistical significance
Interpret and Report Results
Act on the Findings
After identifying the key outcome, the next stepis to specify indicators. An outcome indicator isthe precise way the outcome is measured. Theindicator must be objectively determined and doc-umented in a standardized manner, and must belogically and directly related to the process ofintervention.
Example: The nutrition education message in the 5-A-Day campaign is clearly linked to the desired outcome ofincreasing the number of servings of fruit and vegetablesconsumed in a day. The indicator, compared before andafter the intervention, is the number of servings of fruitand vegetables determined from a 24-hour food recall.
Nutrition interventions have many outcomes.Limiting the evaluation of effectiveness to one out-come can be misleading. In addition, users ofnutrition program evaluations have different needsand interests. Physicians and other health carepractitioners are interested in clinical outcomes,policymakers are interested in functional status andfuture utilization of health care resources, andclients and advocates place primary emphasis ongeneral quality of life. Another consideration isthat different outcomes are produced and can bemeasured at different points in time. Thus, it iswise to track other outcomes in addition to thekey outcome. However, the choice of outcomes toevaluate is limited by the resources available, thetime available to allocate to the evaluation, and theavailability of valid and reliable methods for mea-suring and documenting relevant outcome indica-tors. It is better to assess a few outcomes accuratelyin a defined sample using standardized tools andprocedures than to have a lot of data of question-able value.
One generic outcome indicator recommendedfor use in cost-effectiveness studies since the 1970sis the quality-adjusted life years indicator. A recenttrend in outcome evaluation in health care is toassess quality of life and patient satisfaction. Theglobal indicator of quality of life is used when theoutcome is complex and has many dimensions.Quality of life is being used along with other direct
disease-related indicators in evaluations. Manytools exist for measuring quality of life. Interestedreaders are referred to the comprehensive list ofquality of life indexes reported in Medical Care(1990). Patient satisfaction is believed to be linkedto compliance with medical advice and directlylinked with health outcomes. Thus, it also meritsattention on the evaluation of nutrition interven-tions. For a review of instruments for measuringpatient satisfaction, see von Campen (1995).
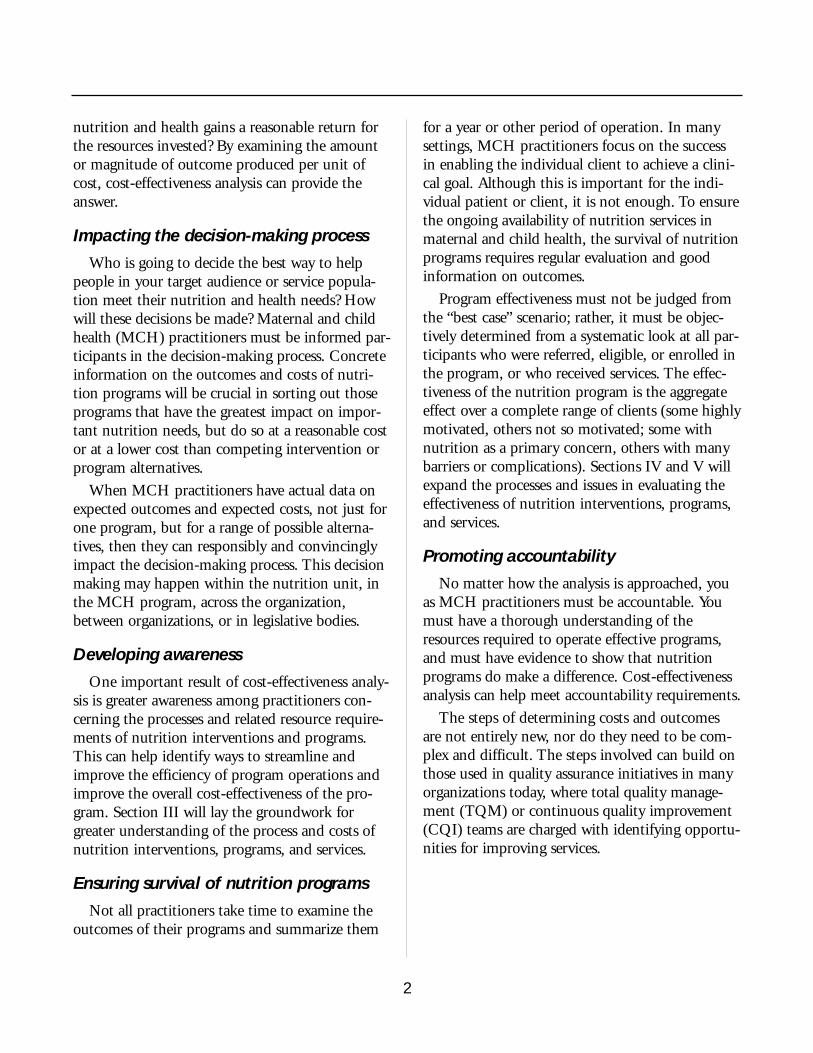
Exhibit 7 lists examples of outcome indicatorsthat are commonly linked to nutrition interven-tion. The table also suggests outcomes for mea-surement at proximal, intermediate, and long-termpoints in the time horizon.
21
Exhibit 7. Outcomes ofNutrition Intervention
Short-term (proximal) outcomes—knowledgeimprovement, behavior change, physiologi-cal indicators of risk (e.g., weight gain orloss, cholesterol reduction, anemia), otherspecific indicators related to life stage, risklevel, or compromised health status.
Intermediate outcomes—sustained changesin knowledge, behavior, physiological indica-tors or related consequences, improvedfunctional status, changes in individual ororganizational practices, delay or preven-tion of complications or deterioration,downstream health care, education, orsocial service utilization.
Long-term (distal) outcomes—chronic diseaseonset in later life, associated health carecosts, years added to life.

Designing the Evaluation
Remember, in cost-effectiveness analysis, onealternative is assessed in comparison to other alter-natives. Thus, in effectiveness evaluation, attentionmust be given to obtaining equally sound data onthe outcomes produced by each alternative underconsideration.
In-house data collection (retrospectiveand prospective)
Collecting actual data in your setting by doingan in-house evaluation of the clinical effectivenessof nutrition care (using either retrospective orprospective data collection) provides importantinformation that can be used to understand,improve, and justify nutrition services. Programstatistics can be used as a source of data, and clientrecords can be audited. Existing data can be sup-plemented with ad hoc surveys or special studies togain more information about outcomes or inter-
vening variables. Retrospective approaches workbest if definitions and procedures, including stan-dardized indicators and forms, have been in placeto assure continuous and standardized documenta-tion for every client by all staff. Standardized defi-nitions and documentation should be the first pri-ority in laying the groundwork for futureeffectiveness studies.
Special studies can be designed to collect qualitydata on your specific program and its effectivenesswith a defined target audience. Carefully plannedprospective data collection enables you to measurekey indicators in a standard way and track otherfactors (e.g., intervening variables such as compet-ing messages in the environment, and personal ororganizational barriers to access) that could modifyoutcomes, or to explain excellent or poor results ina subset of clients (e.g., literacy level, compliance,readiness to change). Additionally, in prospectivestudies, you can investigate the occurrence of otherpositive and negative consequences beyond thestandard outcome indicator. Small-scale, in-housestudies can also serve as a valuable pilot study formore complex effectiveness studies.
Design considerations, such as selecting compar-ison groups and controlling for other factors thatcan influence outcomes, are necessary to show atrue causal relationship between nutrition care andclient outcomes. For many evaluation and deci-sion-making purposes, this level of complexity isnecessary. (See Exhibit 9 for the range of evalua-tion designs. In addition, the example at the endof this section illustrates a study that incorporatedcontrols and a comparison group.)
Using data reported by others
Existing data reported in the medical andhuman service literature as single studies or as ameta-analysis of all available studies, and dataavailable in program reports and government doc-uments, may be used (after you critique its qualityand consider its relevance).
22
Exhibit 8. Sources of Data
Generally, there are four sources of data*used to estimate outcomes:1. Existing in-house data from program
statistics and client records (retrospec-tive).
2. New data collected on program activi-ties and outcomes (prospective).
3. Data from existing studies conducted insettings and target populations similarto yours.
4. Estimates based on a meta-analysis of allexisting reports of the intervention.
*Whether collecting new data or relying on existing datagenerated by you or reported in the literature, you areresponsible for reviewing the quality of the data.Appendix A: Worksheet to Critique Studies and Reports,may be helpful in reviewing the data.

A worksheet for reviewing existing reports isprovided in Appendix A. Use this tool as a guidefor reviewing studies before assuming their resultsare relevant to your situation. When using otherstudies as a basis for estimating the possible out-come of an intervention, carefully consider thedetails of the intervention reported, the populationstudied, and other unique features that may haveenhanced or restricted actual effectiveness.Consider the degree of match between the report-ed situation and the one you are considering.
Meta-analysis is a specific process of reviewingand integrating the findings of all available studieson a defined topic. Meta-analysis is believed toproduce a more accurate prediction of the range ofresults than a single study. Refer to Louis (1985),Gerbarg (1988), and Thacker (1988) for guidanceon how to conduct a meta-analysis.
Prospective hypothetical analysis
Another approach used in cost-effectivenessanalysis to estimate outcomes was suggested byDrummond (1987). This approach requires theinvestigator to make assumptions about interven-tion processes and outcome indicators and to gen-erate estimates of effectiveness, using available dataand professional judgment. The investigator thenundertakes sensitivity analysis to determinewhether the results of the economic evaluationhold up over a range of assumptions. If the finalresult is positive for the program and is not sensi-tive to varying assumptions related to uncertaintyabout outcomes or costs, then expending furthereffort and resources to gather additional data is notwarranted. Likewise, if the economic analysisresults are negative and remain so when varyingassumptions are tested using sensitivity analysis,the program should not be initiated or continuedand no further data collection is indicated. Thisapproach is particularly useful when consideringestablishing a new program, substantially modify-ing an existing program, or expanding an existingprogram to a new location or new target audience.
Ensuring Scientific Validity
Whether you design your own study or use datareported by others, you have the responsibility touse data that meet accepted standards of scientificvalidity. Before asserting a causal relationshipbetween a nutrition intervention and an observedoutcome, all of the following conditions must bemet:
1. The evidence must demonstrate a definite rela-tionship between the intervention and the out-come (correlation).
2. The intervention must take place before theeffect (time-order sequence).
3. Other possible explanations for the observedrelationship between the intervention and theoutcome must be ruled out (confounding).
In nonrandomized (quasi-experimental) studies,additional conditions also must be met:
4. The possibility that the effect is due to preexist-ing differences between clients in comparedalternatives must be ruled out or controlled for(selection bias).
5. Other studies using other designs carried out indifferent settings and with different subsets ofthe populations help confirm the causal rela-tionship and identify setting or population orintervention characteristics that may moderatethe magnitude of outcome (replication).
Exhibit 9 illustrates a range of evaluationdesigns. Note that each design varies in terms ofnumber of groups, number of points when dataare collected, and methods for assigning individu-als to group. Limitations and common applica-tions of each design are noted. In general, thehigher the level of design (indicated by the higherletters on the exhibit), the stronger the basis forasserting a causal relationship between the nutri-tion intervention and the outcome.
Lower level designs give little basis for conclu-sions about the true effectiveness of nutritioninterventions, but they are useful as preliminary
23

steps to understanding the intervention, refiningthe definition of variables, and developing work-able procedures for documentation and data col-lection and aggregation.
Higher level designs reduce the possibility that
findings are spurious (not valid) or are caused bysome external, unobserved factor (such as clients’exposure to influences in their environment, ornormal aging).
Experimental designs require a control/compari-
24
Exhibit 9. Practical Evaluation Designs for Nutrition Interventions
A. Case Study
B. Ex Post Facto
C. Before & After
In-depth observations to gain insight. Focus on relationshipbetween services and participants. Especially useful in first-of-a-kind situations.
Measure change by comparison with client’s self-reported statusprior to service. Used when pre-program documentation isunavailable.
Good data collection before and after intervention.
postpre-postseries
retrospectiveself-reportsfor pre-post
pre-post
DESCRIPTIVE, INTERPRETIVE DESIGNSWhat is happening?
D. Staged Designs (replication)
E. Comparison Group(participants/ non-participants)
F. Program ComparisonProgram AProgram B
G. Time Series Design
Data from successive sets of participants are compared.Requires definition of outcomes and indicators and stable datacollection over time.
Comparison of change experienced by participants with a similar(matched) group of people who did not participate in the pro-gram. Bias of self-selection a problem. Most popular evaluationdesign.
Provides comparison of results using different methods toachieve similar objectives (e.g., videotape vs. one-on-one instruc-tion). This is the basis for cost-effectiveness analysis.
Separates true program effects from natural history and matura-tion effects and can be used to determine long-term changes.Important in nutrition intervention to demonstrate maintenanceor continued improvements.
pre-postpre-
pre-postpre-post
pre-postpre-post
pre-123-post-123
COMPARATIVE, QUASI-EXPERIMENTAL DESIGNSDoes the change follow after the nutrition intervention?
H. Randomized ClinicalTrials (RCTs)TreatmentAlternative
The acid test of research and evaluation. Rules out the possibilitythat outside factors are responsible for the changes in healthoutcomes. Subjects are randomized to experimental treatmentand alternatives that may be no treatment, standard treatment,different level of intensity, etc.
postpost
EXPERIMENTAL DESIGNSDoes the nutrition intervention cause the effect?

son group, randomization, and tight control of theintervention by the investigators. This is oftenimpractical to implement. Quasi-experimentaldesigns, when carefully planned and executed,offer a compromise that can yield sound informa-tion for use in cost-effectiveness analyses. Whenusing quasi-experimental designs, the characteris-tics of the subjects in each compared alternativeshould be as nearly identical as possible (except forthe characteristic being addressed through theintervention).
Controlled studies are essential for attributingobserved changes in the outcome indicator to thenutrition intervention. Control can take twoforms: random assignment to the interventionalternatives (or to intervention and noninterven-tion), and statistical controls to adjust for factorsthat are unequally represented in the study groups(Cook and Campbell, 1979; Mohr, 1992).
Decisions about which evaluation design to usemust take into account available time andresources, access to relevant comparison groups,and considerations of client and provider burdenfor data collection, as well as selection of thedesign that will produce results with the strongestbasis for attributing outcomes to the nutritionintervention. Suggested evaluation designs for spe-cialized nutrition interventions have been pub-lished along with steps to consider in planningeffectiveness evaluations (Splett, 1991). For addi-tional references, see Suggested Resources andReferences or discuss design options with evalua-tion experts in your organization or at universitiesor health departments.
Determining the Study Sample
Sample Size
Adequate sample size is necessary to approxi-mate the true distribution of results among clientsin the reference population. One of the hazards ofsmall sample sizes is that statistical tests will notdetect a significant effect of the intervention, evenif an effect is present.
Formulas exist for calculating the sample sizeneeded for various types of studies (Cheney andBoushey, 1992). The information you need to cal-culate sample size consists of: minimum value forclinically meaningful change (the magnitude ofchange you want to be able to detect), the normalrange of variation of the key outcome indicator(standard deviation), the statistical test that isappropriate for the data, and a prediction of attri-tion (dropout) rates. You can get this informationfrom similar studies reported in the literature, apilot study, or informed estimates.
Sample Selection
To determine true effectiveness you’ll want tostudy all or a representative subset of the targetpopulation (called the study sample). The studysample can be randomly selected from programclients. Using volunteers or a convenience samplemay seem easier, but could be problematic. Theconveniently available subset may be differentfrom the whole population in systematic orserendipitous ways that bias the study. If randomselection is not possible, then it is important todocument more client characteristics and make sta-tistical adjustments for characteristics known to bedifferent from the total population, or at least con-sider the possible impact of selection bias when theresults are interpreted.
Obtaining a representative sample for the evalu-ation is one challenge. Retaining them in the studyis another. Ideally, you’ll want to track all subjects(“subjects” is used here to indicate the members ofthe client population who are selected for the eval-uation) through all scheduled data collectionpoints. A high dropout or attrition rate reduces thevalidity of the results. To prevent bias due to dif-ferential dropout of some types of clients, you’llneed to plan and carry out activities to trackclients and encourage full participation in data col-lection. In reality, some subjects will move away;others will refuse or be unable to participate. Theremaining subjects may no longer be representativeof the total population of interest. In performing
25

the evaluation, the characteristics of dropoutsshould be compared with the characteristics of the remaining sample to determine if bias is present.
Defining Other Variables to Be Documented
In addition to outcome indicators, many otherdata elements (or variables) must be documentedfor a complete evaluation. The selection andimportance of these variables depends on eachevaluation situation. You will need to considerwhich intervention, client, and intervening vari-ables to track as you design the evaluation.
Intervention variables are specific and meaning-ful descriptors of the type and amount of nutritioncare to which clients are exposed (e.g., number ofvisits, content of education event, type of provider,compliance with care plan).
Client characteristics are factors unique to theclient, that could account for degree of participa-tion in the intervention and acceptance and adop-tion of nutrition intervention messages (e.g., dis-ease severity, attitude, readiness to change, literacylevel, social support, previous exposure to nutritionservices).
Intervening variables are factors external to theintervention or client, that could (1) mediate theeffectiveness of the nutrition intervention (e.g.,clients’ increased interest in the intervention due tomedia coverage of a nutrition-related topic); or (2) independently affect the outcome as the “real”reason for the change or lack of change rather thanthe nutrition intervention (e.g., increased con-sumption of fruits and vegetables in summer dueto greater availability, or school lunch regulationsrequiring attention to a child’s special nutritionneeds).
Indicators and procedures for measuring anddocumenting relevant intervention, client, andintervening variables must also be defined. Relia-bility and validity issues must also be considered.
Choosing Instrumentation
Instrumentation is the evaluator’s term for themethod chosen to measure outcomes and otherimportant variables. The method could be a nutri-tion knowledge test, a food frequency question-naire, a balance beam to measure weight, a labora-tory test, client self-report, sales receipts, orobservation and judgment of a practitioner or eval-uator. When deciding which method to use, theissues of validity and reliability come into play.Validity means the instrument measures what it isintended to measure. Reliability deals with theability of the measurement procedure to produceconsistent, repeatable results. Types of reliabilityinclude test-retest reliability, interrater reliability,and interinformant reliability.
Validity and reliability of measurement instru-ments and procedures are important to qualitydata and appropriate interpretation of study find-ings. Each area of nutrition has its share of chal-lenges and successes in defining valid and reliablemethods for assessing the outcome of nutritionintervention. The best source of information oninstruments is published articles in the specific areaof interest and research sessions at professional andscientific meetings.
Pilot Testing Procedures for Data Collection
If you have not done so by this point, youshould consult with a statistician to review design,sample size estimates, and data analysis plans.Planning and pilot testing procedures for data col-lection are the final steps in evaluation design.
Pilot testing allows you to “work out the bugs”before expending resources on a full-scale evalua-tion. During pilot testing, reassess assumptionsabout the availability and accessibility of clientsand data, and about staff or others skilled inadministering tests and documenting data. Clarifyprocedures, revise forms if necessary, and identifytraining and coaching needs for accurate and
26

complete data collection.
You are now ready to train data collectors andimplement the evaluation. Throughout the datacollection period, review and supervise data collec-tion to assure consistency. Consistency is impor-tant during the implementation of a prospectivestudy as well as in a retrospective evaluation wheredata are abstracted from existing records.
When implementing group comparison designsat a single location, you must be alert to cross-con-tamination of groups and to the potential forbiased observations and interpretation when inves-tigators/data collectors are aware of a client’s groupassignment.
Quantifying the Magnitude ofEffectiveness: Data Analysis
Preliminary steps to data analysis include qualitychecks of data collection forms, data coding, anddata entry into a computer program. Next, youwill review a printout of the data for possible cod-ing or entry errors (evidenced by unusual distribu-tion of the data or outlying values).
After the data are “cleaned up,” the analysisstage begins. Your job is to summarize the find-ings to make inferences about the population fromwhich the sample was drawn. This involves threesteps: (1) aggregate the raw data into summary sta-tistics, (2) estimate the magnitude of change ineach group and the difference between groups, and(3) test for statistical significance. First, comparethe magnitude of change with the criterion forclinical importance. This judgment is just asimportant as the assessment of statistical signifi-cance. Commonly used tests of statistical signifi-cance include t-tests, chi-square, Wilcoxon’ssigned-rank test, analysis of variance (ANOVA),and analysis of covariance (ANCOVA). The statis-tical test used depends on the evaluation designand the level of measurement of the indicator.
Don’t be intimidated by the analysis-statisticsstage. Computerized software is becoming easier to
use. (See EPI Info and Minitab, for example). Forsmall pilot studies, statistical calculations availableon spreadsheet software (such as Excel or Lotus)can be used. Consult with a software distributor tofind the software that is best suited to your needs.
The important thing is to select the correct sta-tistical test for the data. Refer to Cheney (1992)for helpful guidance on selecting the correct statis-tical test and for presenting results of each type oftest. Another very helpful reference for selectingthe appropriate statistical test is A Guide forSelecting Statistical Techniques for Analyzing SocialScience Data (1981). It is also a very good idea toconsult with a statistician at the analysis stage.
At minimum, you should plan to summarize,analyze, and report:
• Descriptive data about the sample;
• Group averages and range of variation (e.g.,mean and standard deviation or frequency andpercent) of the key outcome indicator beforeand after the intervention;
• Assessment of the clinical importance of themagnitude of change;
• Comparison of the magnitude of change withother groups/alternatives; and
• Assessment of statistical significance of the dif-ference between groups/alternatives.
Depending on the evaluation questions, com-plexity of the evaluation, and quality of the dataavailable, you should also analyze and report:
• Descriptive data about intervening variables;
• Descriptive and inferential statistics about otheroutcomes of interest;
• Statistical adjustment of the magnitude of out-come for preexisting group differences and forintervening variables; and
• The relationship of the degree of outcome withthe amount of exposure to the nutrition inter-vention.
27

28
Exhibit 10. Example of an Effectiveness Evaluation
Bruce and Tchabo (1989) studied the effect of nutrition counseling on weight gain in pregnancyand on birthweight of the infant in underweight and failure-to-gain pregnant women. The specificquestion to be answered was,“Does nutrition intervention that provides intensive nutrition edu-cation and follow-up improve maternal weight gain and infant birthweight?”
Two groups of underweight, failure-to-gain women were studied.The first group (57 women)received intensive nutrition care from a nutritionist (counseling in diet and weight during everymaternity visit throughout pregnancy).The second group (52 women), who underwent prenatalcare in the same clinic one year later, received no nutrition care beyond routine advice given bythe nurse or physician.The no-treatment comparison group allowed the investigators to assessthe course of pregnancy among this high-risk group when specialized nutrition care was notincluded.The comparison between groups helped provide evidence that any change seen was aresult of the intervention and not caused by other factors in the environment.
The outcome indicators selected by the investigators (weight gain and birthweight) were appro-priate for two reasons: (1) They would be expected to improve as a result of the nutrition inter-vention, and (2) higher weights would suggest improved health status of the woman and infant,improved clinical management of pregnancy by practitioners, and a measure of success to thethird-party payer. Recognizing that smoking, race, age, start of prenatal care, medical complica-tions, and access to supplemental foods can affect these outcomes, the investigators also trackedthese intervening factors in the study and considered them in the analysis.
The data collection procedures that were used had been tested for reliability and validity, and alldata were collected following established procedures. After the data were collected and summa-rized, the results were compared to existing standards for weight gain and birthweight to deter-mine if differences were clinically meaningful, and statistical tests were performed to make judg-ments about the statistical significance of differences between the groups. The results, showingthat the group receiving nutrition counseling had significantly higher weight gain (1.3 kg more)and infant birthweight (300 g more) than the no-treatment group, were reported in a widely circulated medical journal. This study represents a reasonable pilot study carried out in a clinicalsetting.
However, the study design could be improved to provide stronger evidence of effectiveness andgreater confidence regarding the impact of nutrition intervention on pregnancy outcomes ofunderweight and failure-to-gain women.
Considerations in the design of similar clinical studies:
• Evaluate two or more methods of intervention at the same time to remove the possible influ-ence of outside forces on outcomes.
(continued on next page)

29
• Evaluate varying aspects of the content and intensity of nutrition care rather than care or nocare. This gets beyond defending nutrition services (versus no nutrition care) to developing agreater knowledge about what kind of nutrition intervention leads to effectiveness.
• Determine the magnitude of a clinically important outcome ahead of time; then use that valueto calculate a sample size for the study.
• Randomly or systematically assign women to intervention alternatives (rather than haphazardlyor by self-selection) to prevent bias in the groups.
• Implement the study prospectively, monitor quality and completeness of data, and encouragecomplete participation of study participants.This leads to higher quality data, reduces attrition,and improves the generalizability of the results.
• Track other outcomes including short-term, proximal outcomes of nutrition interventions likedietary intake, and consider measuring quality of life issues as was done by Walker et al., 1994.
• Continue the study until a large enough sample size has been enrolled in each interventionalternative.
• Verify that study participants fairly represent the population to which results are to be applied.Examine characteristics of participants in each intervention and compare those characteristicswith the reference population.
• Get appropriate statistical advice to conduct statistical analysis of data and interpret findings.

The report of your effectiveness evaluation ide-ally should include the standard parts of a
research or technical report: abstract; introduc-tion/statement of the problem and relevant back-ground information including past research in thearea; explicit listing of evaluation objectives andquestions; description of the evaluation designincluding alternatives/groups compared, sampleselection, key outcomes and other variablesassessed, and data collection methods; findingsincluding clinical meaning and statistical signifi-cance; discussion; and recommendations for appli-cation.
Also consider a one- to two-page executivesummary highlighting the intervention evaluat-ed—the type and amount of service delivered toclients, characteristics of the target population,brief description of evaluation methods, rate ofsuccess in terms relevant to decision makers(including clinical terms and statistical signifi-cance), and implications of the evaluation findingsfor pending decisions.
In the full report, describe the specific interven-tion(s) evaluated and the characteristics of the sam-ple population studied. Include variations andproblems in the delivery of the intervention if thisis the reality of your evaluation situation (and afact of real-world conditions). Disclose the datacollection and analysis processes along with prob-
lems encountered and how you dealt with them.Report positive as well as negative findings. Presentthe findings for the key indicator as well as otherimportant consequences experienced by the clientas a result of participating in the intervention. Ifsubgroups of the population had different levels ofsuccess, describe these differences. With this infor-mation, other users can judge the scientific validityand appropriate application of your findings.Complete reporting enables you and others toappropriately use the findings from carefully exe-cuted effectiveness evaluations in cost-effectivenessanalysis.
Present the results in a concise, easy-to-readform and in terms that are meaningful to the read-ers of your report. Refer to Suitor (1992) for helpin using tables and graphs to present evaluationresults more effectively. Today’s spreadsheet andgraphics software makes this task considerably easier.
Relating Outcomes to Costs forCost-Effectiveness Analysis
Reports of cost-effectiveness often present theresults in ratio form (as illustrated at the bottom ofExhibit 11). The ratios communicate the cost for aunit of outcome and allow direct comparisonbetween the efficiency of one alternative and the
30
VI.Cost-Effectiveness Analysis:
Reporting Results

efficiency of another. When the ratio is used, it ismore difficult to visualize the total cost of imple-menting the intervention, and the actual magni-tude of change is not evident. Decision makersultimately will need additional descriptive orgraphic information to consider budgetary ramifi-cations and numbers of persons who are likely tohave access to the proposed nutrition interventionsand to benefit from them.
Occasionally, evaluators create a weighted out-come composed of more than one outcome indica-tor or use a global outcome such as quality of lifeor quality-adjusted-life-years in the cost-effective-ness ratio. Use of quality of life estimates is illus-trated in Exhibit 12.
In a recent meta-analysis that used a global cost-effectiveness ratio of median cost per life-yearsaved, many MCH interventions ranked very effi-cient compared to other public health measures(see Exhibit 13).
Various audiences may be interested in otheroutcomes beyond the key outcome identified forthe cost-effectiveness ratio. Furthermore, mostnutrition interventions have several outcomes thatare not easily condensed into a single unit of mea-sure. Presenting outcomes and costs in an array ortable allows the audience to consider simultaneous-ly a range of outcomes in relation to the resourcerequirements needed to produce the outcomes.Exhibit 14 illustrates the presentation of cost-effectiveness results in an array. This approach alsoallows for reporting intangible costs and effectsthat are important in the decision making contextbut not quantified in the cost-effectiveness analysis.
Reporting Cost-EffectivenessAnalysis Results
In reporting the results of economic evaluations,consider the target audiences for the findings.Early in the process of planning the economicevaluation, you considered who needs to know
about the costs and effectiveness of nutrition inter-ventions. Now your challenge is to provide usefulinformation relevant to their needs and decision-making responsibilities. Relate the findings of thecost-effectiveness analysis to decisions that need tobe made.
There are numerous decision makers in health,social service, and education systems who areappropriate target audiences for the results of cost-effectiveness studies of nutrition interventions.Consider policymakers at the state and federallevel, health service planners, administrators andbenefits managers in managed care organizations atlocal and corporate levels, local and state healthdepartments, underwriters in insurance companies,and physicians and other health care providers.
Present results in ways that help decision makersrecognize the relevance of nutrition outcomes totheir decisions. This means you have to understandthe pressures and constraints of your target audi-ence. For example, adding or expanding a cost-effective nutrition intervention is likely to be morereadily accepted in settings that have current expe-rience with nutrition services and programs. In set-tings that lack experience, trained staff, and infra-structure to provide nutrition services, greaterhesitancy can be expected. In addition, these twotypes of settings can be expected to incur differentlevels of cost in initiating the nutrition interven-tion. Another factor affecting the target audience’sreceptivity to information about the cost-effective-ness of nutrition interventions is the prevalence ofnutrition-related problems in their jurisdiction andtheir awareness of nutrition as a problem area.
The results of the cost-effectiveness analysis willbe more relevant to decision makers if the perspec-tive for analysis is clearly identified and matchestheir perspective. The administrator of the man-aged care organization, for example, will appreciatethe organizational perspective that analyzes costsand outcomes as experienced at the organizationallevel; the U.S. senator may be more interested inan analysis applied at the societal level. Onestrength of economic analysis methodology is that
31

the perspective for analysis is made explicit fromthe start.
Finally, it is important to recognize that eco-nomic efficiency is not the only factor used in thedecision-making process. Outcomes resulting whendecisions are based solely on the economic criteri-on of cost-effectiveness are not necessarily consis-tent with other program goals. Often, it is morecostly, for example, to deliver services to “hard-to-reach” populations and these populations may have
lower levels of success because of numerous barri-ers and competing needs. Thus, cost-effectivenessresults might not favor provision of services to thispopulation. Interpretation of the results of the cost-effectiveness analysis should include discussion ofthe ethical implications of going with the preferredalternative, based strictly on the efficiency criteri-on. Ethical considerations of results should beexplored and discussed in cost-effectiveness reports.
When considering target audiences for the
32
Exhibit 11. Cost-Effectiveness Ratio
Costs, Effects, and Cost-Effectiveness Ratios for Cholesterol Intervention Alternatives*
Education Education Drug No Inter- TotalOnly + Drug Only vention (n=219)
(n=132) (n=44) (n=32)CostsBaseline Medical Supervision $31,858.00 $10,619.00 $2,654.00 $7,723.00 $52,855.00Intervention Marginal Costs 13,828.00 29,044.00 7,922.00 0 50,795.00Total Costs 45,686.00 39,663.00 10,578.00 7,723.00 103,650.00Total Cost/Patient 346.11 901.45 961.60 241.35 473.29Marginal Cost/Patient 104.76 660.10 720.25 0 231.94
EffectsCholesterol Reduction (mg/dL)
Observed ± se -33.8 ± 3.5 -60.7 ± 6.9 -74.8±15.8 -17.5±9.5Net (Obs - No Interv) -16.3 -43.2 -57.3 0Adjusted ± se -14.6 ± 8.3 -31.9±9.9 -38.4±10.1 ——
Cholesterol Change (% of initial chol)Observed ± se -11.8 ± 1.2 -19.5 ± 2.2 -22.9 ± 4.6 -5.1 ± 3.2Net (Obs - No Interv) -6.7 -14.4 -17.8 0Adjusted ± se -6.3 ± 2.9 -12.2 ± 3.5 -14.3 ± 5.0 ——
Cost-Effectiveness Ratios($/1% change)Marginal Cost/Observed 1% 8.88 33.85 31.45 47.32Marginal Cost/Net 1% 15.64 45.84 40.46 ——Marginal Cost/Adjusted 1% 16.60 54.11 50.54 ——
*Reproduced with permission. Splett, PL. The Cost Effectiveness of Education for Cholesterol Reduction: A Three State ClinicalInvestigation. Doctoral Thesis, University of Minnesota, 1990.

results of cost-effectiveness analyses, also considerclients, the public, and advocates. Informationabout the cost-effectiveness of nutrition interven-tions mobilizes these audiences to demand nutri-tion services within the systems they use and pre-pares them for a role in influencing policydecisions at local, state, and federal levels.
Organizing the elements of traditional reporting
Reports of research and evaluation studies,including economic analysis, traditionally are orga-nized in the following way:
• Abstract;
• Evaluation context: intervention purpose, alter-natives studied;
• Research/evaluation questions—cost-effectiveanalysis framework, including perspective, alter-natives, time horizon, key outcome(s) of interest;
• Methods—evaluation design, sample, data col-lection procedures for cost and outcomes;
• Results—costs and outcomes, cost-effectivenessfindings, sensitivity analysis;
• Discussion;
• Recommendations (not included in all reports);and
• References.
Be prepared to report cost-effectiveness resultsin this way for publication through traditionalchannels of journal publication and for presenta-tions at professional and scientific meetings.Disseminating the data and methodology to otherpractitioners and researchers is essential.
Considering other presentation styles
Also consider other presentation styles for otherpurposes. In the traditional style of reporting, the
33
Exhibit 12. Cost-Effectiveness Ratio Using Quality of Life
Illustration of Cost-Effectiveness Ratio Calculations Using Hypothetical Data*
Strategy Treatment Effectiveness Utility Utility (Quality BenefitsCosts (Life Expectancy) (Quality of Life) Adjusted Life
Expectancy)
Treatment A $20,000 4.5 years 0.80 3.6 QALYs** $4,000Treatment B $10,000 3.5 years 0.90 3.15 QALYs $2,000
Incremental cost-effectiveness ratio = $20,000 – $10,000 = $10,000 per life-year gained4.5 years – 3.5 years
Incremental cost-utility ratio = $20,000 – $10,000 = $22,222 per QALY gained000.3.6 QALYs – 3.15 QALYs
Incremental cost-benefit ratio = $20,000 – $10,000 = 500000000000000000000000$4,000 – $2,000
*Reproduced with permission. Detsky, AS, Naglie, IG. A Clinician’s Guide to Cost-Effectiveness Analysis. Annals of Internal Medicine,113:147–154, 1990.**QALYs = quality-adjusted life.

decisions and recommendations are separated fromthe results. For many audiences, reporting can bemore effective when the results and the decisionimplications are linked together—by stating theevaluation question, presenting the results, thenimmediately following with the conclusion or rec-ommendations. Conclude with a discussion of spe-cial issues such as sensitivity analysis to explicitlyidentify and explore the implication of uncertaintyfor various situations, and cite any ethical consid-erations. Exhibit 15 illustrates this approach,which is useful in both written and verbal presen-tations.
Finally, remember to apply techniques for effec-tive communication whether you are preparing fororal or written presentations. See Exhibit 16 fortips.
34
Exhibit 13. Cost-Effectiveness Ratios in a Meta-Analysis
Median Cost/Life-Year Saved Estimates Within Intervention Sub-Category*
Life-Saving Intervention Sub-Category No. of Estimates Median Cost/Life-Year Saved
Childhood immunization 6 <$0Drug and alcohol treatment 4 <$0Prenatal care 12 <$0Venous thromboembolism prevention 17 <$0Influenza vaccination 3 $1000Helmet protection 4 $2000Cholesterol screening 2 $6000Smoking cessation advice 15 $6000Cervical cancer screening 21 $12000Neonatal intensive care 4 $12000Gastrointestinal screening and treatment 15 $12000Organized health services 6 $14000Osteoporosis screening 3 $18000Coronary artery bypass graft surgery 8 $26000Hormone replacement therapy 13 $42000Cholesterol treatment 19 $154000HIV/AIDS screening and prevention 4 $447000
*Abstracted from Tengs,TO, Adams, ME, Pliskin, JS, Safrant, DG, Siegel, JE,Weinstein, MC, Grahaln, JD. Five-Hundred Life-Saving Interventions and Their Cost-Effectiveness. Center for Risk Analysis, Harvard School of Public Health: Boston, MA,1994.
35
Exhibit 14. Cost-Effectiveness Analysis Results Presented in an Array
Nutrition Visits, Costs, Outcomes, and Cost-Saving for Nutrition Care in NIDDM*
*Reproduced with permission. Franz, M, Splett, PL, Monk,A, et al. Cost Effectiveness of Medical Nutrition Therapy Provided by Dietitians forPersons with Non-Insulin-Dependent Diabetes Mellitus. Journal of the American Dietetic Association, 95(9):1018–1024, 1995.**Incremental costs for medical nutrition therapy as a component of diabetes care, expressed in 1993 dollars.
Level ofNutritionCare
Basic Care(BC)(n=85)
PracticeGuidelineCare(PGC)(n=94)
No.Visits
1
3
AverageContactTime
1 hr
21/2 hr
TotalCosts
$3,565.55
$10,534.33
PerPatientCost**
$41.95
$112.07
MeanChangeFPG(mg/dl)
-7.3 ±49.4
-19.2 ±49.9
MeanChangeHbA1c (% point)
-0.69 ±1.67
-0.93 ±1.63
No. ofTherapyChanges
9
17
AverageCostSavingsDue toTherapyChanges
$3.13
$31.49
Exhibit 15. Quick Style Presentation of Cost-Effectiveness Analysis Results
CLINICAL PREVENTIVE SERVICES ARE MOST EFFECTIVE IF TREATMENT COSTS
ARE KEPT LOW AND TARGETED TO THOSE WHO ARE AT GREATEST RISK.*
Cholesterol testing and follow-up treatment with diet and/or medicines is cost-effective if the treatment costs arekept low and testing is targeted to men and women who already have heart disease and only middle-aged menamong those without known heart disease.
BOTTOM LINE:In prevention of coronary heart disease deaths, a year of life gained costs roughly $1000 for smoking cessation counseling, $10,000 for organized exercise programs, and $20,000+ for cholesterol reduction in high-risk middle-aged men.
These estimates are very sensitive to selection of patients and cost of the test and treatment.We can expect manynew tests to be developed, especially with the rapid advances in genetics, starting with genetic tests for predisposi-tion to colon cancer and breast cancer, which will have to be evaluated carefully and be used in ways designed tomaximize cost-effectiveness.
*Hatziandreu, EI, Koplan, JP, Weinstein, MC, Caspersen, CJ,Warner, KE. A Cost-Effectiveness Analysis of Exercise as a HealthPromotion Activity. American Journal of Public Health, 78:1417–1421, 1988. As reported in Omenn, GS. Prevention: Benefits, Costs, &Savings. Washington, DC: Partnership for Prevention, 1994. Reproduced with permission.

36
Exhibit 16.Tips for Effective Communication on the Cost-Effectiveness of Nutrition Interventions
Apply these practical, proven tips for effective communication in written and verbal presentations.
Get ready for the presentation• Know your audience and their need for information and their decision-making roles• Relate the information to decisions that must be made• Do not give the audience more than they need
Do it• Start with the most important information• Be brief• Be memorable • Use graphs and tables to present information • Give them a short quotable summary
Follow through• Be accurate, be credible, avoid overgeneralizing the results• Time communication early in the decision process and send reinforcing information at
later stages.

37
VII.Pulling It All Together:
Illustrating the Concepts
Exhibit 17. Before You Begin . . .
Ask yourself these questions:
• What problem is to be addressed in the cost-effectiveness analysis? What is the nutritionintervention or program? What are the alternatives?
• Who are the recipients/target audience?• What is the desired key outcome of the intervention for the target audience? • What are the other positive or negative consequences? For whom?• When are the key outcome and other consequences experienced?• Do good data exist on the cost of the intervention? Are data on the key outcome and other
consequences currently available or will new data collection be necessary?• Who will be the primary users of the results? Will there be other users? Who?

38
Exhibit 18. Six Steps for Cost-Effectiveness Analysis (CEA)
Step 1. State OBJECTIVE
Step 2. Define CEA FRAMEWORK
• perspective• alternatives• time horizon
Step 5. RELATE costs to outcomes
• ratio• array
Step 3. Determine COSTS
• define all activities• specify measurement• collect cost data• calculate costs• discount
Step 4. Determine OUTCOMES
• define outcomes• select design• collect data• analyze data• discount
Step 6. Summarize, Interpret, andREPORT findings
• ethical implications• sensitivity analysis• usefulness to decision makers
Exhibit 18 presents a schematic for the process of performing a cost-effectiveness analysis.

39
An expanded look at the steps for planning and implementing cost-effectiveness analysis follows. Use thisas a checklist to move through the process.
Planning a Cost-Effectiveness Analysis of Nutrition Interventions
Step 1. State the objective of the cost-effectiveness analysis.
1.1 ❑ What type of program or intervention are you evaluating?
1.2 ❑ Why are you doing the cost-effectiveness evaluation?
Step 2. Define the framework for the cost-effectiveness analysis.
2.1. What is the perspective for the economic analysis? Whose resources are at stake?
❑ Provider/organization ❑ Society
❑ Payer ❑ Health care sector
❑ Patient/family ❑ Other
2.2. What intervention alternatives will be evaluated?
❑ Identify your target intervention or program.
❑ Identify one or more relevant comparisons.
2.3. Define the time horizon for costs and outcomes.
❑ Over what time horizon are the input costs incurred?
❑ What is the appropriate time horizon to track the key outcome (and other consequences) ofthe intervention alternatives?

40
Steps 3 and 4. Determine costs and outcomes. These are parallel steps in which accepted methods of eval-uation are applied to identify, measure, and quantify costs and outcomes for each alternative. Discountcosts and outcomes to a standard base year if time horizon is longer than one year or if data for some alter-natives were collected in different time periods.
Step 3. Determine costs.
3.1. Types of costs
Direct costs to the organization:
❑ Define all activities related to implementation of the intervention or program.
❑ Will other costs be included? (If yes, describe.)
❑ Direct cost to patients____________________________________________________
❑ Indirect costs __________________________________________________________
❑ Intangible costs ________________________________________________________
3.2. Specify how costs will be measured or estimated.
❑ List principal cost components for each activity.
❑ Specify source of cost data.
3.3. Collect data on costs.
❑ Make plans for monitoring cost data collection.
3.4. Calculate costs.
❑ Total costs for intervention __________________________________________________
❑ Unit cost ________________________________________________________________
❑ Marginal cost ____________________________________________________________
❑ Incremental cost __________________________________________________________

41
3.5. Is discounting indicated?
❑ Yes ❑ No
Step 4. Determine outcomes.
4.1a Key outcome
❑ Define the key outcome to be tracked __________________________________________
❑ Select indicator ____________________________________________________________
❑ Measurement/documentation method __________________________________________
❑ Criterion or benchmark for determining effectiveness ______________________________
4.1b List other important positive and negative outcomes/consequences to be tracked.
❑ Identify the appropriate indicators and measurement methods for each.
Outcome/consequence Indicator Measurement/documentation method
________________________________________________________________________
4.2 Select the evaluation design and procedures.
Type of study
❑ Refer to Exhibit 9 for evaluation design options.
________________________________________________________________________
❑ Sources of data
❑ In-house existing data
❑ New data collection
❑ Data from existing studies
❑ Estimates based on meta-analysis
Sample
❑ Determine sample size __________________________________________________
❑ Determine how client population will be sampled ______________________________
Other variables to be documented
❑ List variables (including intervention variables, client characteristics, and intervening variables) and define indicators and how each will be measured.
Variable Indicator Measurement/documentation method
______________________________________________________________________

42
Data collection procedures/instrumentation (consider for every outcome and variable listed)
❑ Measurement techniques and documentation procedures exist.
❑ Need to develop new procedures.
Data analysis
❑ Consult with statistician to plan appropriate analysis of data.
4.3. Gather data on outcomes and other variables.
❑ Make plans for monitoring data collection processes.
4.4. Analyze data. Determine:
❑ Clinical importance
❑ Statistical significance
❑ Other consequences (positive and negative)
4.5. Is discounting indicated?
❑ Yes ❑ No
Step 5. How will you relate costs to outcomes for each alternative?
❑ Cost-effectiveness ratio
❑ Cost and outcome findings in an array
❑ Both
Step 6. Summarize, interpret, and report the findings in terms of the objectives of the cost-effectiveness analysis and the decision for a sensitivity analysis to be made.
❑ List possible uncertainties sensitivity for analysis.
❑ Note possible ethical considerations.
❑ Plan to make report meaningful for decision makers/audience.

43
Example: A Comparison of Three Staffing Models
This section of the Guide illustrates the six-step model for cost-effectiveness analysis. The example chosendoes not include nutrition, but was selected because it is a good study that addresses the question: What isthe most cost-effective staffing model to provide essential care? This kind of question is important to devel-oping and evaluating strategies that incorporate nutrition intervention into health promotion and diseaseprevention initiatives.
The following example is taken from A Cost Effectiveness Analysis of Three Staffing Models for theDelivery of Low-Risk Prenatal Care as reported by Graveley, EA, Littlefield, JH, in the American Journal ofPublic Health, 82(2):180–184, 1990.
Step 1. State the objective of the cost-effectiveness analysis.
This analysis will compare the cost-effectiveness of three low-risk prenatal staffing models.
The results will help public officials make future decisions about safe and efficient methods to providequality prenatal care to low-income women in a predominantly Hispanic population. This is important tothe Texas community where the study was done, and it also produces information related to the HealthyPeople 2000 national objectives for reducing the rate of low birthweight infants, improving access to earlyprenatal care, and closing the gap in perinatal outcomes among minority populations.
Step 2. Define the framework for the cost-effectiveness analysis.
2.1.What is the perspective for the economic analysis?
Provider organizations (three clinics) are the perspective for analysis.
In addition, the evaluators collected information on patients’ out-of-pocket costs for prenatal care.
2.2.What intervention alternatives will be evaluated?
Three alternatives will be evaluated:
a. A physician-based clinic operated by a private, not-for-profit entity (MDC).
b. A mixed staffing clinic operated by city health department (MSC).
c. A nurse-based clinic operated by a county hospital and a university (RNC).
2.3. Define the time horizon for costs and outcomes.
Outcomes were measured by interviewing women after delivery at the county hospital for three months in1989. Costs were provided by the financial officers at each clinic. (The authors do not state the time ofcost data. It is assumed to be 1989 for the period of prenatal care preceding delivery.)

Step 3. Determine Costs
3.1. Define all activities.
Activities included appointments made, prenatal care delivered, nurses’ consultations with physicians.
3.2. Specify how costs will be measured.
Costs were limited to personnel costs, which were calculated from hourly wages/salaries of personnel x stan-dard appointment times (15 minutes per visit at MDC, 30 minutes at RNC, and preset times for each per-sonnel category at MSC). Personnel included a physician, nurse practitioner, clinical nurse specialist, regis-tered nurse, licensed vocational nurse, nurse’s aide, social worker, caseworker, and clerk. Facility costs wereexcluded because they were not considered germane to determining the clinic’s staffing model costs. Thiscost analysis thus considers the marginal cost of personnel and assumes the facility and support activitiesare in place and unaffected by the staffing model.
3.3. Gather data on costs.
Financial officers provided data on five variables: number of staff, hourly wages, number of prenatalappointments made, number of prenatal appointments kept, and number of hours spent delivering prena-tal care. (The authors note that the nurses kept flow charts of the amount of time spent conferring withphysicians.)
3.4. Calculate costs.
Salary levels used by authors to calculate total personnel costs for each clinic are reported in the article.Cost per clinic visit was determined by dividing the personnel costs by the number of kept appointments.Clinic productivity was determined by dividing the number of patients seen for prenatal care by the num-ber of hours spent delivering prenatal care.
For cost-effectiveness analysis, the differences among clinic costs and appointment outcomes were calculat-ed using a percent difference (with the lowest percent as baseline). To calculate this difference, the clinicwith the lowest cost or outcome value was identified, then the percentage difference between this modeland the other two was calculated (see Exhibit 19c). Note that this results in an incremental cost or out-come.
3.5. Perform discounting.
Because the time horizon of the study was limited to a short period of time, no discounting is indicated.(Note: To apply these results to a current decision, the 1989 dollars would need to be adjusted to presentvalue using the Consumer Price Index.)
Step 4. Determine Outcomes
4.1. Define the key outcome and other important consequences to be tracked.
The key outcome of interest for the cost-effectiveness analysis was the number of appointments kept.When related to cost, this is the indicator or productivity of each clinic and forms the basis for future policy decisions.
44

45
Clinic productivity cannot be judged in the absence of information about pregnancy outcome and patientsatisfaction; thus, the evaluators also tracked those important outcomes. The analysis was planned to inves-tigate differences between clinics on a range of outcomes relevant to prenatal care. To accomplish this, fourcategories of patient variables were tracked:
a. Demographic variables—age, ethnicity, education, Medicaid status, marital status, gravida, number ofprenatal visits, adequacy of prenatal visits using the Kessner Index, prenatal classes;
b. Physiological variables—maternal weight gain, hemoglobin, complications at time of delivery, neonatalweeks of gestation, birthweight, Apgar score, admission to NICU;
c. Satisfaction with care (using a patient satisfaction tool); and
d. Cost to patient—subjects’ reported out-of-pocket costs for prenatal care.
4.2. Select evaluation design.
The three existing clinic modules were studied in a cross program comparison. The study is a quasi-experi-mental design using retrospective data collection.
A power analysis was used to estimate the sample size (156 subjects, with 52 seen at each clinic) needed toidentify a significant difference in infant birthweight among the three clinics. Existing research reports wereused to develop the variables and responses included in the patient interview. Eligibility criteria were speci-fied, and eligible women were identified from hospital records.
4.3. Gather data on outcomes and other variables.
All women who met eligibility criteria were interviewed within 48 hours of delivery; no one declined toparticipate. (No information is provided about the interviewers.) Hospital records were audited.
4.4.Analyze data. Determine the degree of effectiveness. Describe other consequence (positive and negative).
Numbers of appointments made and kept at each clinic were reported (see Exhibit 19b). There were nosignificant differences among the clinics for any of the maternal physiological variables. Babies bornthrough the three clinics did not differ on any of the five neonatal variables. Maternal satisfaction was notsignificantly different for accessibility or affordability, but significant differences were found for availability,acceptability, and accommodation (see Exhibit 19a).
4.5. Perform discounting.
Discounting is not needed in this short-term study.
Step 5. Relate costs to outcomes for each alternative using a cost-effectiveness ratio or an array.
Example 19b presents the costs and key outcome for each clinic. This information, along with other tablesin the article, gives readers a good understanding of the range of costs and outcomes experienced by thethree staffing models. This type of presentation of data is called an array. The last two lines of Exhibit 19b
46
present cost-effectiveness ratios. The cost per kept appointment is the key index for comparing the threestaffing alternatives. Exhibit 19c is an incremental cost-effectiveness analysis that shows the added cost oroutcome compared to the lowest cost. Consideration of additional cost and additional outcome (over thelowest alternative) is useful to decision makers.
Step 6. Summarize, interpret, and report findings.
• Conduct sensitivity analysis.
• Include ethical considerations.
• Make report meaningful to decision makers.
The authors conclude: “The study found that increasing the availability of low-risk prenatal care profes-sionals through the use of nonphysician maternal health providers, with physicians available for consulta-tion, might substantially reduce the cost of providing this care while maintaining quality. Therefore, such asystem might save valuable resources.” The report includes easy-to-read tables, which allow the reader toconsider the actual outcome and cost data behind this conclusion.
The discussion section explores some of the processes in clinics that are related to differences in staffing,and notes that these are not associated with differences in outcomes. “The absence of significant differencesamong the three clinics for the maternal-neonatal physiological variables was expected and supports otherreports that nurses prepared for a specific area of health care can provide quality care.”
No sensitivity analysis is reported. The authors do note that one clinic (MSC) frequently was open formore than the four hours per week reported by the financial officer. Discussions with RNC staff revealedconcern about time spent waiting for physician consultation and the subsequent impact on productivity ofsome staff at that clinic. Differences in missed appointment rates among clinics was noted to increase costsbecause fixed personnel costs are expended whether or not care is delivered. The role of the case manager infollowing up on missed appointments was a factor in improving appointments kept and improving produc-tivity at one clinic (MDC).

47
19a. Student Newman-Kauls Significant PSTa Category Means by Clinic
Clinic Mean Score
Significant Category MDCb MSCc RNCd
Availability 22.3 18.5e 23.5Acceptability 52.3 51.6f 53.9Accommodation 36.2b 32.3e 37.9Total PST score 124.5b 116.6f 129.1
a PST, patient satisfaction tool. d RNC, nurse-based clinic.b MDC, physician-based clinic. e Significantly lower score compared with MDC and RNC.c MSC, mixed-staffing clinic. f Significantly lower score compared with RNC.
19b. Cost and Outcome Data for Three Clinic Staffing Models
Alternative
Measure MDC MSC RNC
CostPersonnel costs $18,965 $12,381 $13,008a
OutcomeAppointments made 1695 1341 1665Appointments kept 1395 984 1216Hours 804 962 590Productivity 1.7 1.02 2.06
Cost-effectivenessCost per appointment $11.19 1$9.23 1$7.81Cost per kept appointment $13.58 $12.58 $10.70
aIncludes six hours of consultation time.
Exhibit 19. Results from an Economic Analysis of Three Staffing ModelsReproduced with permission. Graveley, EA, Littlefield, JH. A Cost Effectiveness Analysis of Three Staffing Models for theDelivery of Low-Risk Prenatal Care. American Journal of Public Health, 82(2):180–184, 1990.

48
19c. Percentage Differences in Cost and Outcome Data forClinic Staffing Models for Three Study Months
Clinic, %
Measure MDC MSC RNC
Personnel costs 53 0 5Appointments kept 42 0 24Hours delivering prenatal care 35 63 0Productivity 67 0 101Cost per kept appointment 27 18 0

49
I n the nutrition community, we need betterlinkage between the process of nutrition care
and its outcomes. This is increasingly necessary asresources are cut for maternal and child health,public health, and nutrition programs, as well asclinically based services. Available resources mustbe applied as efficiently as possible to the mosteffective activities and interventions within thefield of nutrition. This means moving toward well-defined interventions based on what works.Practice guidelines, protocols, and standards thatoutline appropriate nutrition care for specific cir-cumstances need to be further developed and dis-seminated. Efforts can build on CQI and otherquality management programs within institutionswhich evaluate and continuously improve theprocess of nutrition intervention and programdelivery.
We need to improve and expand the standard-ization of nutrition outcome indicators andencourage the development of systems to docu-ment and track these indicators. We need morereliable and valid measures of nutrition outcomes.We urgently need core data sets with standardizedindicators to document nutrition interventions andtheir outcomes. We need computerized data sys-tems to collate and aggregate data. We need morestudies concerning the outcomes, costs, and cost-effectiveness and cost-benefit of nutrition interventions.
With these steps, we will have greater compara-bility across studies, intervention settings, andpopulation subgroups. This will give us the abilityto assess and understand the effectiveness of uni-versal nutrition programs—will there be any?—and specialized target interventions. Better datawill allow for greater efficiency in nutrition prac-tice and provide an empirical basis for policy deci-sions involving nutrition interventions.
Not all nutrition interventions will producefinancial benefits that exceed the cost of the indi-cated and appropriate nutrition intervention. Thisdoes not mean such nutrition interventions shouldbe eliminated. The contribution of nutrition ser-vice to the desired outcome must be known—andthe outcome valued in human as well as economicterms. We should attempt to achieve the outcomeas efficiently as possible. Through these steps, ser-vices and interventions will be available to supportoptimum nutrition for mothers, children, andfamilies.
VIII.Future Challenges

50
American Public Health Association. Healthy Communities2000: Model Standards (3rd ed.). Washington, DC:American Public Health Association, 1991.
Andrews, FM, Klem, L, Davidson, TN, O’Malley, PM,Rodgers, WL. A Guide for Selecting Statistical Techniquesfor Analyzing Social Science Data (2nd ed.). Ann Arbor,MI: University of Michigan Institute for Social Research,1981.
Barr, JT. Clinical Effectiveness in Allied Health Practices.U.S. Department of Health and Human Services, Agencyfor Health Care Policy and Research, 1993.
Bruce, L, Tchabo, J. Nutrition Intervention Program in aPrenatal Clinic. American Journal of Obstetrics andGynecology, 74:310–312, 1989.
Cheney, CL. Statistical Applications. In Monsen, ER (Ed.).Research: Successful Approaches. Chicago, IL: AmericanDietetic Association, 1992.
Cheney, CL, Boushey, CJ. Estimating Sample Size. InMonsen, ER (Ed.). Research: Successful Approaches.Chicago, IL: American Dietetic Association, 1992.
Cook, TD, Campbell, DT. Quasi-Experimentation: Designand Analysis Issues for Field Settings. Boston, MA:Houghton Mifflin Company, 1979.
Disbrow, DD. The Cost and Benefits of Nutrition Services:A Literature Review. Journal of the American DieteticAssociation, 89(4):Supplement, 1989.
Drummond, MF, Stoddard, GL, Torrance, GW. Methods forthe Economic Evaluation of Health Care Programs. NewYork, NY: Oxford University Press, 1986.
Franz, MJ, Splett, PL, Monk, A, et al. Cost Effectiveness ofMedical Nutrition Therapy Provided by Dietitians forPersons with Non-Insulin-Dependent Diabetes Mellitus.Journal of the American Dietetic Association,95(9):1018–1024, 1995.
Gerbarg, ZB. Resolving Conflicting Clinical Trials:Guidelines for Meta-Analysis. Journal of ClinicalEpidemiology, 41:503–509, 1988.
Graveley, EA, Littlefield, JH. A Cost Effectiveness Analysis ofThree Staffing Models for the Delivery of Low-Risk
Prenatal Care. American Journal of Public Health,82(2):180–184, 1990.
Green, R, Bondy, PK, Maklan, CW. The National MedicalEffectiveness Research Initiative. Diabetes Care, 17:45–49,1994.
Kushner, RF, Ayello, EA, Beyer, PL, Skipper, A, VanWay,CW, Young, EA, Balogun, LB. National CoordinatingCommittee Clinical Indicators of Nutrition Care. Journalof the American Dietetic Association, 10:1168–1177, 1994.
Louis, TA, Finegerg, HV, Mosteller, F. Findings for PublicHealth from Meta-Analysis. Annual Review of PublicHealth, 6:1–20, 1985.
Mason, M (Ed.). Cost and Benefits of Nutritional Care PhaseI. Chicago, IL: American Dietetic Association, 1979.
Mathieu-Harris, M. How You Can Promote the Value ofYour Services. ADA Courier, September 2, 1994.
Mohr, LB. Impact Analysis for Program Evaluation. NewburyPark, CA: Sage Publications, 1992.
Quality of Life Bibliography and Indexes. Medical Care,23(12) Supplement, 1990.
Sims, L. The Effectiveness of Nutrition Education andImplications for Nutrition Education Policy, Programs,and Research: A Review of Research. Journal of NutritionEducation, 27(6), 277–418, 1995.
Splett, PL. Effectiveness and Cost Effectiveness of NutritionCare: A Critical Analysis with Recommendations. Journalof the American Dietetic Association, 91:S1–S53, 1991.
Splett, PL. Phase III. Research Designs for Future Studies. InEffectiveness and Cost Effectiveness of Nutrition Care: ACritical Analysis with Recommendations. Journal of theAmerican Dietetic Association, 91:S46–S50, 1991.
Splett, P, Caldwell, M. Costing Nutrition Services: AWorkbook. Chicago, IL: Region V, U.S. Department ofHealth and Human Services, 1985.
Suitor, CW. Illustrating the Results of Research. In Monsen,ER (Ed). Research: Successful Approaches. Chicago, IL:American Dietetic Association, 1992.
References and Suggested Resources

Thacker, SB. Meta-Analysis: A Quantitative Approach toResearch Integration. Journal of the American MedicalAssociation, 259:1685–1689, 1988.
U.S. Congress, Office of Technology Assessment. Strategiesfor Medical Technology Assessment. Washington, DC: U.S.Government Printing Office, 1982.
U.S. Department of Health and Human Services, PublicHealth Service. Healthy People 2000: National HealthPromotion and Disease Prevention Objectives. Washington,DC: U.S. Department of Health and Human Services,Public Health Service, 1991.
U.S. Preventive Services Task Force. Guide to ClinicalPreventive Services: An Assessment of the Effectiveness of 169Interventions. Baltimore, MD: Williams and Wilkins,1989.
U.S. Preventive Services Task Force. Guide to ClinicalPreventive Services (2nd ed.). Baltimore, MD: Williamsand Wilkins, 1995.
von Campen, C, Sixma, H, Friele, RD, Kerssens, JJ, Peters,L. Quality of Care and Patient Satisfaction: A Review ofMeasuring Instruments. Medical Care Research andReview, 52(1):109–133, 1995.
Walker, LO, Walker, ML, Walker, ME. Health and Well-Being of Childbearing Women in Rural and UrbanContexts. Journal of Rural Health, 10(3):168–172, 1994.
51

52
Appendix A: Worksheet to Critique Studies and Reports on the Effectiveness of
Nutrition Interventions
Use this worksheet to determine if the findings from nutrition intervention evaluations reported in pub-lished articles, program reports, government documents, etc., apply to your situation.
I. Initial Screening of Report
A. TitleIs the topic potentially related to your interest?
B. Authors and SourceDo they have experience and credibility?
C. Evaluation Context• Intervention
What was the exact intervention studied in terms of intensity, content, duration? What was the setting for application of the intervention? Who were the providers of service?Is the intervention sufficiently similar to yours?
• Target PopulationWho was the target audience?Are the subjects similar to yours in terms of age, ethnicity, disease, severity, risk factors, socio-economic status, and other features bearing on the intervention and desired outcome?
• OutcomesWhat key outcomes were assessed?Are these outcomes relevant?
• Evaluation PurposeWhat was the purpose (objectives, research questions, hypothesis) of the study?Does the approach allow an unbiased investigation of the effectiveness of the nutrition interven-tion?
II. Detailed Critique of the Quality of the Study and Report
If the report passes the initial screening questions, then do a more detailed review. Use the following ques-tions to determine if you can use the data with confidence as to their scientific validity.
A. Evaluation Design and Data Collection Procedures (Methodology)What was the evaluation design?Does it allow for attribution of outcomes to the nutrition intervention?

53
What groups/alternatives were compared?Is there a clear description of samples studied?What was the mode of sample selection (random assignment, matching, voluntary participation,convenience)?Does the sample represent the reference population?What was the attrition/dropout rate? Did it differ between groups?
Are all relevant intervention, client, intervening, and key outcome and other outcome variablesdefined? Are the indicators used for measurement appropriate?Are measurement instruments and procedures reliable and valid?
Is description of procedures for data collection complete—where, when, and how data obtained?Is there protection against investigator bias in data collection?
Are methodological assumptions such as adequacy of reliability and validity of measures, representa-tiveness of samples, and fulfillment of appropriate requirements for statistical tests reported?
B. Analysis and Presentation of FindingsObjective (data based) rather than speculative presentation of resultsFindings presented in readable charts, tables, figures, graphsBoth clinical meaning and statistical significance addressed
Appropriate statistical tests usedStatistical adjustments for preexisting differences between groups Uncontrolled factors appropriately citedNegative as well as positive findings reported
C. DiscussionSeparation of findings from interpretation and discussion Weaknesses of the evaluation and data honestly discussedContradictions or inconsistencies within the data and in comparison with previous reports discussed
D. Conclusions and RecommendationsConclusions consistent with and supported by data Conclusions within scope justified by the evaluation and dataAppropriate implications and recommendations for application Questions for further investigation identified

54
Appendix B: Glossary of Terms
Analyses
Cost-Minimization Analysis—focuses on identifying and quantifying costs. This method is used when theoutcomes between alternatives are assumed to be equal. Cost minimization analysis identifies the least cost-ly way to proceed.
Cost-Effectiveness Analysis—compares two or more alternative interventions for achieving a specified out-come. It relates the cost of resources, expressed in dollars, to the amount of outcome achieved, expressed innatural units such as pounds of weight loss or reduction in number of cases of anemia.
Cost-Benefit Analysis—assigns dollar values to both resource inputs and health care and other cost savings orlosses associated with positive or negative outcomes. Input costs are then related to outcomes in either aratio or as net cost or net benefit (when the dollar value of costs is subtracted from the dollar value of out-comes). Cost-benefit analysis can compare interventions with different goals or desired outcomes.
Cost Utility Analysis—evaluates costs and outcomes in terms of the patient’s quality of life, or preference.Utility refers to satisfaction. Cost utility analysis incorporates the concept of “willingness to pay” to get theexpected level of satisfaction or quality of life from the intervention.
Clinical Decision Analysis—an emerging area for application of economic evaluation methodology in healthcare. Clinical decision trees or algorithms illustrate decision options and give the estimated probability thatspecific outcomes will result from a course of action. The probability that adverse events will occur with orwithout clinical intervention is used to estimate the rate of adverse outcomes. This can then be used to esti-mate health care costs based on the dollar value to treat the resulting adverse event.
Costs
Direct costs (in nutrition)—those resources used by the provider in the delivery of nutrition and related careto achieve the health goals or outcome objectives of the intervention or program.
Full (or total) cost—the total cost of the program over a period of time (usually one year). • fixed costs—stable costs not related to volume of service; or• variable costs—resource utilization that varies with volume (number of clients) or intensity (frequency
and type of contact) of service
Average cost—cost per unit of output/outcome (all fixed and variable cost involved divided by the numberof units of service) (e.g., cost per nutrition assessment; cost per low birthweight infant prevented).
Incremental cost—cost for nutrition as an add-on to existing service (e.g., nutrition assessment added to anEPSDT visit).

55
Marginal costs—cost of doing a little more or a little less (e.g., adding a second nutrition follow-up visit forpeople completing a weight loss program).
Other Terms
Intervention—a purposefully planned service, program, policy, or other activity provided or directed to adefined population for the purpose of changing a behavior, risk factor, condition, aspect of health status, orsystem.
Efficacy—the level of outcome expected when the intervention is applied under ideal conditions.(Controlled experimental studies measure efficacy.)
Effectiveness—the level of outcome achieved when services are rendered under ordinary circumstances byaverage practitioners for typical clients.
Reference population—in an evaluation, the target population for whom the intervention was designed.
Time horizon—the defined period for tracking costs and outcomes; usually coincides with the normalcourse of intervention.
Discounting—a mathematical procedure used to convert future costs and future outcomes to “presentvalue.”
Indicator—an observable and measurable form of an outcome. It defines the specific terms by which theoutcome will be measured.

Evaluation FormPlease take a few minutes to share your comments about The Practitioner’s Guide to Cost-EffectivenessAnalysis of Nutrition Interventions, and return this form to the address or fax number given below.
What is your occupation? (check one box)n Administrator n Policymaker
n Health Educator n Program Director
n Practitioner (specify field of practice) __________________________________________________
n Other (specify) __________________________________________________________________
What type of agency or facility do you work in? (check one box)n Hospital n School, College, University
n Managed Care Organization n State Health Department
n National MCH Organization n Local Health Department
n Private Practice n WIC Clinic
n Other (specify) __________________________________________________________________
Please rate the usefulness of this book relative to other “how-to” books you have read. (circle one)1 2 3
less useful average more useful
Were any particular parts of the book especially useful to you? (check one)n No
n Yes (specify) ____________________________________________________________________
How do you or your organization plan to use the information in this book?
n Learn about cost-effectiveness studies
n Conduct a cost-effectiveness study
n Work on a cost-effectiveness study already done or in progress
n Other (specify) __________________________________________________________________
Do you or your organization plan to carry out or have you done a cost-effectiveness study?
n Yes, future study planned Expected start date: ____________________________________
n Yes, study in process Expected date of completion: ____________________________
n Yes, study has been completed Date completed: ______________________________________
If yes, specify topics__________________________________________________________________
n No study is planned
n Other (specify) __________________________________________________________________
56

What additional resources or assistance does your organization need to carry out a cost-effectiveness study?
(check all applicable boxes)n Funding
n Technical assistance
n Staff
n Other (specify) __________________________________________________________________
Who else should receive this book? (specify groups or names and contact information if possible)
Today’s date:__________________________
Send to: NCEMCH Evaluator, Cost-Effectiveness of Nutrition Services2000 15th Street North, Suite 701Arlington, VA 22201-2617Tel: (703) 524-7802Fax: (703) 524-9335
57