Embed Size (px)
Citation preview

The Potential Impacts of the Biosafety Protocolon Agricultural Commodity Trade
Prepared for the International Food & Agricultural Trade Policy Council
By
Nicholas Kalaitzandonakes
University of Missouri-Columbia
Second Printing
1616 P Street NW, Suite 100 Washington, DC 20036 / USA / TEL 1 202 328 5056 / FAX 1 202 328 5133 / www.agritrade.org
10 rue Berckmans / B-1060 Brussels / Belgium / TEL 32 2 534 9036 / FAX 32 2 534 9882
IPC TechnologyIssue Brief
InternationalFood & Agricultural Trade
Policy Council
December 26, 2004
N. Kalaitzandonakes is MSMC Endowed Professor of Agribusiness and Director of the Economics and Managementof Agrobiotechnology Center (EMAC) at the University of Missouri-Columbia, Columbia MO 65211.

Foreword
At its recent plenary meeting, the International Food & Agricultural Trade Policy Council (IPC) discussed theissues surrounding the implementation of the Biosafety Protocol (BSP). During that discussion, IPC Membersexpressed grave concerns that the potential implications for the agricultural trade system, in particular for importingand developing countries, were not well documented or understood by those making the decisions on the BSP.IPC members were also concerned that policy makers do not know who will bear the costs of implementation,what the unintended consequences might be, or whether the implementation options being considered werenecessary to achieve the objectives of the BSP.
This paper, based on analysis by Professor N. Kalaitzandonakes and with input from the IPC, identifies potentialissues that will arise as these implementation decisions are made, and outlines the likely effects on farmers,consumers, and traders in developed and developing countries. Before the parties to the BSP take furtherdecisions on implementation, the IPC believes that the costs and implications for the global agricultural system,for food importers, and for farmers must be understood. The IPC plans to continue its analytical work to quantifythe costs and implications of potential BSP implementation decisions on developed and developing countryimporters.
About the IPC
The International Food & Agricultural Trade Policy Council (IPC) convenes high-ranking government officials, farmleaders, agribusiness executives and agricultural trade experts from around the world and throughout the food chainto build consensus on practical solutions to food and agricultural trade problems.
An independent group of leaders in food and agriculture from industrialized, developing and least developed countries,the IPC’s thirty-six members are chosen to ensure the Council’s credible and impartial approach. Members areinfluential leaders with extensive experience in farming, agribusiness, government and academia.
i
Membership of the International Food & Agricultural Trade Policy Council
Robert L. Thompson, Chairman, IPC. Agricultural Policy Chair, University of Illinois; Former Director, RuralDevelopment, World Bank; President, Winrock International; Dean of Agriculture, Purdue University; and AssistantSecretary of Economics, USDA. (United States)Piet Bukman, Vice Chairman, IPC. Former Dutch Minister of Agriculture, Minister of Trade, Minister of DevelopmentCooperation, and former President, Dutch Farmers Union. (The Netherlands)
Allen Andreas. Chairman, Archer Daniels Midland Company. (United States)Bernard Auxenfans. Managing Director, Kincannon and Reed; Former Chairman, Monsanto Europe-Africa. (France)Andrew Burke. Managing Director, Soy Ingredients and New Business Development, Bunge Ltd. (United States)Brian Chamberlin. Former Trade Negotiator, New Zealand.Csába Csáki. Senior Advisor, Rural Development Strategy and Policy, World Bank; Former Director, Budapest Universityof Economics. (Hungary)Devi Dayal. Trustee, National Institute of Agriculture. (India)Pedro de Camargo. Former Secretary of Agricultural Production and Trade. (Brazil)Luis de la Calle. Former Undersecretary for International Trade Agreements. (Mexico)Cal Dooley. President and CEO, National Food Processors Association (NFPA); Former Member, United StatesHouse of Representatives. (United States)Franz Fischler. Former Commissioner for Agriculture, European Commission. (Austria)Michael Gifford. Former Chief Agricultural Trade Negotiator, Agriculture and Agri-Food Canada. (Canada)Ahmed Goueli. Director General, Council of Arab Economic Unity. (Egypt)Dale Hathaway. Executive Director, National Center for Food and Agricultural Policy. Former Undersecretary forInternational Affairs and Commodity Programs. (United States)

ii
Jikun Huang. Director, Center For Chinese Agricultural Policy, Chinese Academy of Sciences, (People’s Republic ofChina)Heinz Imhof. Chairman, Syngenta Agricultural Company. (Switzerland)Robbin Johnson. Senior Vice President and Director, Corporate Affairs, Cargill. (United States)Hans Jöhr. Corporate Head of Agriculture, Assistant Vice President, Nestlé Company. (Switzerland)Timothy Josling. Senior Fellow and Professor Emeritus, Institute for International Studies, Stanford University. (UnitedKingdom)Guy Legras. Former Director General, DG Agriculture and Former Director General for External Relations, EuropeanCommission. (France)Rolf Moehler. Former Deputy Director General, Agriculture. European Commission. (Germany)Raul Q. Montemayor, President, Federation of Free Farmers Cooperatives, Inc., (Philippines)Donald Nelson. Vice President of International Business Relations, Kraft Foods International. (United States)C. Joe O’Mara. Former Special Agricultural Trade Negotiator (United States)Néstor Osorio. Executive Director, International Coffee Organization. (Colombia)Michel Petit. Professor, National Agricultural Economics Institute. Former Director, Rural Development, World Bank.(France)Per Pinstrup-Andersen. Former Director General, International Food Research Policy Institute. Recipient of theWorld Food Prize (Denmark)Henry Plumb. Former President, European Parliament. Former President, National Farmers Union. (United Kingdom)Marcelo Regunaga. Former Minister of Agriculture. (Argentina)Eugenia Serova. President, Analytical Center of Agri-Food Economics. (Russia)Hiroshi Shiraiwa. Former Counselor, Japan International Agricultural Council. Former Director, Mitsui & Co. (Japan)Jiro Shiwaku. President, Agriculture and Fishers Co-op Savings Insurance Corp., Former Vice-Minister for Int’lAffairs, MAFF. (Japan)James Starkey. Vice President, Universal Corporation. Former Deputy Undersecretary for Int’l Affairs & CommodityPrograms. (United States)Jerry Steiner. Executive Vice President, Monsanto Company. (United States)Ajay Vashee. President, Southern African Confederation of Agricultural Unions. (Zambia)Anthony Wylie. Executive Director, Qualitec. Former Director-General, Fundación Chile. (Chile)Jorge Zorreguieta. President, Argentine Sugar Growers Association. Former Minister of Agriculture. (Argentina)

Executive Summary
In September 2003 the BSP entered into force. In the coming months, the signatories will be making key decisionsabout implementing the Protocol, which could significantly affect global agricultural production, consumption andtrade; induce structural changes; and ultimately, affect social welfare.
For Living Modified Organisms destined for food, feed, or processing (LMO-FFPs), the key implementation issuesto be decided in 2005 include:
• What kind of information should be required with export documentation?
• How will “Adventitious Presence” (AP) be defined?
• Will AP considerations be for LMO crops only or for all (including non-LMO) crops?
• What thresholds should be established for AP?
• How will approved versus unapproved events be treated?
• What kind of documentation will be required of exporters?
• What kind of testing will be done and where will it occur?
Because the BSP is a mandatory, global system governing the exports and imports of all LMOs traded internationally,its impact will be felt throughout global agriculture. Prior experience suggests that even seemingly small differences inorganism testing requirements and thresholds can result in enormous shifts in the scope and impacts of LMO regulations.The potential impacts of various options for implementing the BSP provisions must be evaluated so that the Protocolcan be implemented in the most effective and least costly manner. The following questions need to be addressed.
• What portion of global crop production and trade could be affected by the BSP?
• What are the potential impacts on the costs and structure of production and trade?
• How will the costs of implementing the BSP be distributed across the agrifood chain?
• How will those costs affect exporters (developed and developing countries)?
• What are the costs to importers (developed and developing countries)?
• What are the impacts on farmers (large, developed country farmers and small, subsistence farmers)?
• What are the potential consequences in the supply chain arising from the BSP (vertical integration, bias towardlarger farmers, risk aversion by exporters to certain markets)?
• How might such impacts evolve over time?
Potential Scope of BSP
Global Consumption and Production Dominated by Few Crops
Feed crops such as maize and soybeans, constitute a large portion of global agriculture and represent a significantshare of the cultivated land around the world. Four crops – wheat, rice, maize, and soybeans – account forapproximately 50% of the world’s arable land, while another four – barley, sorghum, cotton and canola – account foran additional 15%. Due to rising demand for animal protein (because of population growth and rising incomes),demand for and production of these crops is expected to climb in the next thirty years.
Global Trade Dominated by Few Crops
The same crops that dominate land use and agricultural production around the world represent the bulk of globalagricultural commodity trade. Almost 300 million metric tons of wheat, maize, soybeans, and rice are traded globallyevery year. However, trade represents only a fraction of total crop production – typically less than 15%. Despite itssmall share, agricultural trade plays a critical role in balancing global demand and supply.
iii

Global Trade Characterized by Few Exporters and Many Importers
Just as there are a few key crops in global production, there are also only a few key exporters in global trade. TheUnited States and Argentina dominate maize exports. Australia, Canada and the United States dominate wheatexports, followed by Argentina and the European Union. The United States, Argentina and Brazil dominate globalsoybean production and trade.
Indeed, with the exception of rice, seven countries with large agricultural sectors – namely, Argentina, Australia,Brazil, Canada, China, the EU and the US – supply 60-90% of all exports in all key crops. While developed countriesare the largest importers in terms of volume, the vast majority of the importers are developing countries.
LMO Adoption Concentrated in Few Key Crops in Key Exporting Countries
Most LMO adoption has occurred in these few key crops and in these few major exporting countries. With theexception of Europe, all of the major producing and exporting nations have commercially introduced one or moreLMOs in their production system. Where commercialization of LMOs has been allowed, adoption has occurred at anunprecedented pace.
The introduction of LMOs has transformed global production of soybeans, maize, cotton and canola. While LMOshave not yet been commercialized in rice and wheat production, China has announced introduction of LMO rice in2006. LMO wheat varieties are also in the pipeline. Since the adoption and use of LMOs is concentrated in preciselythe key crops and in the key countries that dominate global production and trade, the BSP covers a large portion oftoday’s agricultural commodity trade. Moreover, it is clear that its scope will expand as LMOs are introduced in otherwidely traded agricultural commodities in the future.
Complex Global Marketing Chain
The potential impacts of the BSP emanate from the changes it imposes on the global marketing chain for agriculturalcrop commodities. In any given year, the harvest from millions of small and large farms dispersed over vast terrainmust be collected during a short period of time and moved to storage from where it will gradually be dispersed toanimal feeding and processing facilities throughout the year. An expansive global marketing chain ensures thatcrops are moved from surplus to deficit areas, that crops are stored when they are plentiful and drawn down whenneeded, and that crops of varying quality are put to their optimal uses.
Although these functions of the global marketing chain are conceptually simple, the execution is not. Even well-functioning crop marketing chains must contend with many uncertainties that complicate their operations. Localproduction and consumption volatility lead to significant investment risks for physical assets. Crops change handsmany times in any given year and in every transaction the buyer must confront price risk while owning the crop.Uncertainty in freight prices, interest rates, and in exchange rates further add to the price risk confronted by operatorsin the crop marketing chain. Even the most developed marketing chain will have difficulties managing theimplementation of the BSP, and will incur costs. The less sophisticated marketing chains will have more difficultycomplying with precise BSP provisions.
Analysis of Potential Implementation Decisions
The operational details currently under discussion by the parties to the BSP will determine its impact on production,consumption and trade of LMOs for feed, food or processing. Using case studies it is possible to evaluate thepotential costs of various identification and testing protocols.
Exporting LMOs: The Costs of Identifying LMOs
In the absence of substantial efforts to source and identity preserve non-LMOs under strict protocols, export vesselsoriginating from countries with meaningful LMO production should generally be expected to contain LMOs. Theexact level of LMOs and the share of individual LMO events will vary drastically across vessels depending on theproduction in the regions where crops are originated. Importantly, commercial production of an LMO event does notautomatically imply that it is present in a particular export cargo.
Accordingly, without testing each cargo for its overall LMO content and for the share of each LMO event, exportersmay be unable to indicate that their cargoes definitively “contain” certain events simply on the basis that they havebeen commercialized in a given country. In an LMO producing country and in the absence of extensive testing,exporters may only be able to reliably indicate that a cargo “may contain” LMOs.
Exporters could develop “may contain” identification and documentation procedures with modest changes in current
iv

operations. If exporters must specifically identify (or quantify) the LMO content of export cargoes, they would have toextensively test each and every cargo and could be forced to change their operations to avoid costly delays.
Case Study: Identifying LMOs in a US Maize Cargo
The United States is a major producer and exporter of maize as well as a leading user of LMOs. The farm leveladoption of the various LMO maize traits is not evenly distributed across the US geography. Adoption is generallydriven by farm-level economic benefits that tend to vary across farms and geographic regions due to differences inpest and weed pressures. All maize LMOs that are approved for commercialization in the United States are consideredequivalent to conventional maize. Accordingly, no effort is generally made to separate LMO and non-LMO maizeduring harvest.
An extensive infrastructure moves maize from the key producing regions to the few large export elevators that arelocated in coastal areas. Most maize exports originate in surplus producing states in the Midwest and most flow outof the country through the Gulf of Mexico. Ocean vessels carry an average of 25,000 metric tons of maize in eachjourney and many exceed 50,000 metric tons of cargo. Depending on their point of departure, these vessels containlarge amounts of maize of different varieties from various regional elevators in multiple locations.
With the geographically dispersed use of LMOs, the continual commingling and aggregation of maize from variousfarms to trucks to storage bins in the local and river elevator, to river barges, and then onto export vessels, whatmight be the expected LMO content and share of LMO events in any given vessel cargo?
As an example, take an ocean vessel with a maize cargo destined for Japan carrying 58,000 metric tons of maizeagglomerated from smaller cargos carried by 52 river barges: The barges were sourced from 16 different locationsin 6 states – Iowa, Illinois, Indiana, Missouri, Minnesota, and Louisiana. The contribution of each barge to the vesselaveraged 1100 metric tons, but varied widely from 50 to 2000 metric tons.
In all the states where the barges were sourced, there was significant production of LMOs. In the absence ofsubstantial efforts to source and identity-preserve non-LMO maize under strict protocols, the vessel certainly containedLMOs. However, the exact level of LMOs and share of individual events could vary drastically across vesselsdepending on the LMO production in regions where their cargoes originated. Importantly, commercial production ofan LMO event does not automatically mean it will be found in a particular export cargo (See page 16).
In the absence of testing each cargo for LMO content and for the share each LMO event, exporters may be unableto indicate that cargos definitively “contain” certain events simply on the basis that such LMOs are commerciallyproduced in a given country. Hence, in an LMO producing country and in the absence of extensive testing, the mostaccurate reporting exporters might be able to do could be to indicate that a cargo “may contain LMOs.”
Case Study: The Cost of Testing for LMOs
Laboratory costs increase with the number of samples that must be tested; the type of assessment required (i.e.qualitative, quantitative); the number of events that must be measured; and the number of crops that must beevaluated. Using customs data from the two main exporting countries – the United States and Argentina – and bookprices for relevant tests, it is possible to assess the appropriate number of export cargoes that might require testingand the projected cost under alternative sampling and testing procedures that might be dictated by alternativelabeling requirements.
If the BSP were to require 1) a qualitative assessment of whether the cargo contains LMOs; 2) an identification ofspecific LMO events contained in the cargo; and 3) the measurement of the amount of each LMO event in the cargo,laboratory-testing costs for all US and Argentine maize exports could range from $936,000 to $4,356,000, with thehighest costs incurred if quantification of traits is required.
If the BSP requires more stringent sampling procedures, then a larger number of samples might be tested individuallyfor each event. Under such potential sampling procedures, laboratory-testing costs would explode, ranging from$18 to $87 million for maize cargoes from these two countries (See page 18).
Beyond these laboratory costs, additional compliance costs in testing export cargoes for LMO content exist but aremore difficult to calculate. These include handling and overhead charges incurred by exporters for maintaining aninventory of samples and managing the interface and test reporting with labs, sampling authorities, regulators andtheir customers.
Other compliance costs are less direct and obvious but could still be significant. BSP labeling reduces the inherentfungibility of commodity grain and the flexibility of its marketing chain. Some of the gains from efficiencies and scale
v

economies achieved in today’s commodity chains could therefore be lost. It is difficult to estimate the magnitude ofthese costs.
Importing LMOs: Potential Uncertainties and Costs
A central implementation issue of the BSP is whether the importer will confirm the presence of LMOs through laboratorytesting. If so, the exact LMO content must be identified and measured. The vessel would need to be sampled andtested in similar ways as at its point of departure, doubling the testing costs incurred in the marketing chain. Evenmore than the testing and other compliance costs, however, are the uncertainties created through such practices.Since LMO testing is a statistical process, even with identical testing protocols, repeated sampling of the very samecargo would likely produce different results.
Moreover, trade in LMOs that have been granted regulatory approval in a producing country but not in an importingcountry has proved challenging for the crop marketing chain. Since only 19 countries in the world have an establishedregulatory process that has approved any LMOs, building the capacity to effectively regulate and approve LMOsacross all importing countries could prove challenging, at least in the short run.
If re-testing is required or if vessels must be diverted to other locations, the potential holdup costs from suchcircumstances would be astronomical. Depending on the size of cargo and the import location; reloading costs anddemurrage charges from re-directing a vessel to an alternative destination; as well as quality deterioration and othercosts could add up to millions of dollars per held-up vessel. The uncertainty of the approval status of various LMOevents in countries that lack an ongoing regulatory process amplify such holdup risks and costs. The higher theuncertainty of a destination, the higher the transaction costs importers in that destination would have to pay (Seepages 19-20).
Importing Non-LMOs: Potential Costs and Risks
Importers who want to avoid LMOs can contract for non-LMO cargoes. Procuring non-LMOs implies operationalchanges in the crop marketing chain. Strict identity preservation (IP) must be used throughout the chain to preventpresence of LMOs and secure the required purity in sourced cargoes. IP procedures in non-LMO systems, therefore,imply additional costs. Direct IP costs result from:
• Increased need for market coordination and control: IP systems require increased search and coordinationefforts resulting in substantial transaction costs, including salaries and wages for sourcing and management,information systems, third party certification fees, etc.
• Changes in operations: As firms adapt their operations, they incur extra payable capital, labor and materialcosts. For farmers, payable costs may result from extra labor for equipment cleaning during planting, harvest andstorage; increased field isolation to prevent pollen flow from other adjacent fields; as well as increased deliverytransport costs. Testing can also lead to significant incremental material costs.
• Risks and liabilities: IP often involves risks and liabilities beyond those confronted in commodity markets.Such risks and costs might involve testing risks or risks associated with unplanned disruptions in the supply chainand ensuing sourcing risks, etc. When insurable, such risks and liabilities translate directly into payable costs inthe form of premiums.
Indirect IP costs stem from underutilization of production, storage, transportation, and processing assets. Lostprofits represent additional indirect costs to IP systems. Foregone storage margins and carrying spreads, andforegone profits from adoption of LMOs, are examples of indirect costs.
The IP costs in non-LMO markets are not fixed. They vary significantly from one part of the chain to another andacross commodities. They also vary substantially with logistics and available infrastructure. The impacts of somekey drivers are well understood and more or less predictable:
• Purity Standards and AP Tolerances: The rigor with which IP procedures are designed and implementeddepends mostly on the desired level of purity. For non-LMO systems with low thresholds, strict measures designedto prevent adventitious presence of LMOs must be put in place. Beyond certain levels, as thresholds diminish, IPcosts increase exponentially.
• Scale of IP Systems: Unlike commodity systems, IP non-LMO systems do not enjoy scale economies.Indeed, if the demand for non-LMOs grows quickly, driving these markets beyond their current “niche” status, IPcosts could escalate in the short term, as unsuitable assets would be increasingly employed, raising the averagecost of IP systems.
vi

• Scale of LMO Production: With increasing numbers of LMO events and acreage, adventitious presence ofLMOs in non-LMO lots would tend to increase. Under such conditions, firms all along the IP marketing chain mustimplement more rigid IP processes to meet purity thresholds and incur rising IP costs.
To estimate these IP costs, it is useful to examine the extra costs (above commodity) paid by buyers for non-LMOcargoes at points of import in two main non-LMO markets: the European Union and Japan. Despite their limitedmarket share, non-LMO maize and soybean markets cost consumers in Japan and the EU an additional $100 millionper year. These costs would rise with increasing adoption of LMOs; increasing number of LMO events; increasingnumber of LMO crops; and lower AP thresholds (See page 22).
The Distribution of Costs: Impact on Importers
Markets for commodities, feed ingredients, animal products, and various processed foods are vertically and horizontallylinked within any given country but also with markets in other countries. The degree of vertical integration andmarket power also complicates insights on expected outcomes. Nevertheless, some useful initial observations canbe made. The compliance costs associated with the implementation of the BSP – much like with IP costs in non-LMO segments – will likely become “costs of selling” in export markets and will be paid by the buyers.
Most of the top-importing countries have signed and ratified the BSP and could end up paying compliance costs inproportion to their import shares. However, small developing countries will likely incur disproportionately highercosts. Per vessel compliance costs are more or less fixed; therefore lower volumes will result in higher per unitcosts.
ConclusionsIt should be clear that the broad scope of the BSP will influence the level and distribution of the compliance costsborne by the global food system. In particular:
• Compliance costs will be significant and will be spread across the global food system. While it isdifficult to anticipate the exact ways such compliance costs will be distributed, it is reasonable to expect that themajority of compliance costs will be borne by consumers in importing countries.
• Compliance costs will increase with lower thresholds (e.g. costs increase exponentially as thresholdsbecome lower).
• Compliance costs are unevenly distributed across the supply chain. Large commodity importers wouldlikely bear a substantial share of the compliance costs. Importers with low volumes and inefficient infrastructurewill likely bear disproportionately higher unit costs.
• Compliance costs are unevenly distributed across commodities. The potential impacts from supplyresponses across commodities are complex and difficult to anticipate. While supply increases in non-LMO cropsmight be expected, land constraints; processing infrastructure; and consumption patterns can mute such potentialsupply responses.
• Compliance costs will be unequally distributed among various importers and also among differentexporters, depending both on their size in the marketplace, but also on the relative sophistication of their agriculturalinfrastructure.
The scope of the BSP will influence the amount of incremental risks borne by various actors in the system. Specifically:
• Test-based enforcement creates incremental risks. Adoption of testing standards decreases but does noteliminate incremental risks because of sampling variance and testing errors. Even the same test performed onthe same cargo will yield different results.
• Incremental risks are difficult to estimate and hence cannot be easily priced and insured.
• Incremental risks expand disproportionately when AP thresholds become lower.
• The uncertainty of the approval status of events in countries that lack an ongoing regulatory processamplify incremental risks.
• Incremental risks and compliance costs resulting from BSP implementation are not static; they willincrease with changing market conditions including:
vii

- Increasing adoption of LMO crops (this is very likely, based on trend)
- Increasing number of LMO events/traits (this is very likely, also based on trend)
- Increasing number of LMO crops
- Improvements in testing technology (very likely)
Incremental risks and compliance costs resulting from the BSP will change the incentive structure in the supplychain. Some potential consequences include:
• Changes in the composition of trade away from raw commodities to more highly processed products(i.e., not LMOs) such as soybean meal and soybean oil: Countries with processing facilities located near majorproduction areas would benefit from such potential impacts while those with processing capacity that is dependenton imported commodities would lose.
• Increased vertical integration throughout the marketing chain: In the presence of increased uncertaintythat cannot be easily mitigated or insured, risk-averse exporters might opt to control their cargoes from plantingall the way to the point of export. This structural change could benefit larger, more integrated farmers, and makelife more difficult for smaller farmers.
The scope of these concerns and the potential for real, significant costs to be imposed on food importers calls for thevarious implementation options being considered under the Protocol to be assessed and understood so that theobjectives of the BSP can be met in the most efficient and least costly manner possible.
This analysis covers only a small number of the issues arising from BSP implementation, and draws from casestudies of how developed country agricultural systems might respond. Given their weaker physical and regulatoryinfrastructure, it is likely that these costs will be even higher for developing countries, which represent a large shareof global food importers. The IPC strongly urges parties to the BSP to assess the likely impacts of these issues– in particular for developing country importers, who may bear the brunt of higher food costs – beforefinalizing implementation details.
The information in this paper was presented to IPC members and discussed at the Council’s Plenary Meeting inOctober 2004. Statements made in this paper should not be attributed to any individual IPC member.
viii

The Potential Impacts of the Biosafety Protocol on Agricultural Commodity Trade
I. Introduction
On September 11, 2003 a new international agreement affecting the transboundary movement of agricultural commodities– the Biosafety Protocol (BSP) – entered into force. In the coming months, the signatories to the BSP will be makingkey decisions about implementing the Protocol, which could significantly affect global agricultural production,consumption and trade, induce structural changes and ultimately affect social welfare.
The key implementation decisions to be made in 2005 include:
• What kind of identification should be required for Living Modified Organisms (LMOs) destined for food, feed orprocessing?
• How will “Adventitious Presence” (AP) be defined?
• Will AP cover LMO crops only or all (including non-LMO) crops?
• How will approved versus unapproved events be treated?
• What thresholds should be established for AP?
• What kind of documentation will be required of exporters?
• What kind of testing will be done and where will it occur?
• How will the Protocol be enforced?
Because the BSP is a mandatory, global system governing the export and import of all LMOs traded internationally, itsimpact will be pervasive throughout global agriculture, with the exception of trade between non-parties to the protocol.Prior experience suggests that even seemingly small differences in documentation requirements and thresholds canresult in enormous shifts in the scope and impacts of LMO regulations. It is important that the potential impacts ofvarious options under consideration be evaluated so that the Protocol can be implemented in the most effective andleast costly manner. The following questions need to be addressed:
• What portion of global crop production and trade could be affected by the BSP?
• What are the potential impacts on the costs and structure of production and trade?
• How will the costs of implementing the BSP be distributed across the agricultural chain?
• How will those costs affect exporters (developed versus developing countries)?
• What are the costs to importers (developed versus developing countries)?
• What are the impacts on farmers (large, developed country farmers versus small, subsistence farmers)?
• What are the potential consequences in the supply chain arising from the BSP (vertical integration, biastoward larger farmers, risk aversion by exporters to certain markets)?
• How might such impacts evolve over time?
II. The evolution of the biosafety protocol
The BSP originated in 1992 as part of the Convention of Biological Diversity (CBD) The objectives of the CBD are toconserve biodiversity, to ensure its sustainable use, and to guarantee that the benefits of biodiversity are equitable(Mackenzie et al.). The CBD contains specific provisions on “living modified organisms”1 (LMOs) produced throughbiotechnology. Indeed, since its inception, the CBD emphasized the need for a protocol to set out conditions for thesafe transfer, handling, and use of LMOs that could adversely affect the conservation and sustainable use of biologicaldiversity. In 1994, at the first CBD Conference, the parties to the Convention authorized a series of meetings toconsider the “need and modalities” for such a protocol.
1 The term “living modified organisms” is similar to the term “genetically modified organisms” or GMOs used in the European Union andelsewhere. The major difference between LMOs and GMOs is that LMOs are capable of reproducing, whereas GMOs may not, if alreadyprocessed or refined. This is a critical distinction since the BSP applies only to the LMOs and not to processed modified commodities.
1

In those meetings over the course of several years, considerable disagreement emerged on the content of the protocol.A draft for consideration was finally produced in February 1999 at a meeting held in Cartagena, Colombia. Though theparties could not reach agreement on the draft during that meeting, subsequent deliberations produced a compromisedraft and the Protocol was adopted on January 29, 2000 in Montreal, Canada. The BSP then entered into force inSeptember 2003. As of 20 December 2004, 111 countries have ratified the protocol.
The BSP creates rights and obligations for the parties to the Protocol on the transboundary movements of LMOs.Exporting countries that ship biotech seeds and other LMOs intended for introduction in the environment mustinform importing countries of their intent through Advanced Informed Agreements (AIAs) and must providedocumentation during the material transfer that identifies the LMO. Transboundary shipments of LMOs intended forfood, feed, or processing (FFP) do not require AIAs. Instead of country-by-country notification, exporting countriesmust communicate regulatory approvals of LMOs through a web-based database – the Biosafety Clearing House.Exporters must provide documentation indicating that the exported LMOs are not intended for introduction into theenvironment.
Having received information through an AIA or the Biosafety Clearing House, importing countries can place conditionsor refuse imports of LMOS if they believe there is insufficient scientific evidence regarding the potential impact of theLMOs on their biodiversity. Indeed, the BSP, in-line with the CBD, has advocated the use of the “precautionaryprinciple” (de Greef). In this context, the BSP allows restrictions on the trade of LMOs in the presence of perceivedrisks, however small (ibid).
Despite the introduction of such rights and obligations, the presence of the BSP has, so far, hardly been felt ininternational trade. Indeed, other than Mexico’s decision to enter into a Trilateral Agreement with Canada and theUnited States to define documentation requirements under Article 18.2(a) and the European Union’s regulatory reform,it is unclear that there has been any serious attempt by the parties to enforce the Protocol. This is, in part, becausethe parties have not yet made decisions on how to implement it in practice. For instance, in the case of LMO-FFPs,details on how to operationalize the documentation requirements in the BSP remain under consideration. Suchoperational details include the form of the documentation that will be required, the content of the accompanyinginformation that should be included, a working definition for “adventitious presence” (AP) of LMOs, and specific APthresholds below which identification is not required. Similarly, details on enforcement practices are absent. Therefore,the full impact of the BSP on global agricultural trade is uncertain.
It is important to recognize that despite its environmental origin, the BSP is a mandatory global system that appliesto all LMOs traded internationally. Its operational details must therefore be evaluated in this context. Prior experiencesuggests that even small differences in documentation requirements and AP thresholds can result in enormous shiftsin the scope and impacts of LMO regulations (Kalaitzandonakes, 2004, Kalaitzandonakes and Magnier, NERA). It istherefore important to assess the potential impacts of BSP provisions currently under consideration in global commoditytrade.
III. The Potential Impacts of BSP on LMO-FFPs
Since the vast majority of genetically modified crops are produced and traded for food, feed, or processing, thepotential impacts of the BSP on LMO-FFPs is of particular interest. Article 18 of the BSP addresses the handling,transport, packaging and identification of LMOs. On the documentation requirements of LMO-FFPs, article 18.2(A)dictates that
Each party shall take measures to require that documentation accompanying living modified organismsthat are intended for direct use as food or feed, or for processing, clearly identifies that they “maycontain” living modified organisms and are not intended for intentional introduction into the environment,as well as a contact point for further information. The Conference of the Parties, serving as themeeting of the Parties to this Protocol shall take a decision on the detail requirements for thispurpose, including specification of their identity and any unique identification, no later thantwo years after the date of entry into force of this Protocol (emphasis added).
Many of the “detailed requirements” mentioned in Article 18.2 (A), which will ultimately determine the scope of BSPmust be decided in the near future. These requirements can be grouped into three relevant sets.
The first set includes decisions on allowances for accidental commingling or admixtures of LMOs in export cargos.These decisions, in turn, determine what is an LMO and when identification might be necessary. Some of the keyquestions that need to be answered include:
2

• At what purity threshold will identification not be necessary? That is, what might be an allowable level for“adventitious presence” (AP) of LMOs in any given export cargo?
• Will BSP rules apply to crops for which LMOs have been commercialized (e.g. maize and soybeans) or willthey also apply to other crops for which LMOs are not yet commercially available, (e.g., wheat or rice) butwhere trace amounts of LMOs from other crops might be accidentally present in any export cargo?
A second set covers the content of the information provided by exporters and how such information should be collected.The following questions need to be answered:
• Will a “may contain” indication be sufficient or will more detailed identification – or quantification – of all theLMOs in a cargo be needed?
• Should BSP rules involve issuance of separate documents or could relevant information be provided throughexisting documentation, such as commercial invoices?
• How should exporters acquire relevant information on the LMO content of an export cargo before they canreport it?
Finally, the third set of issues involves decisions on how the importer receives and, in turn, uses the informationprovided by the exporter. A key question is:
• Will the importer need to independently confirm the information provided by the exporter? If so, how andwhat might be allowable responses?
These decisions will operationalize the BSP and determine its scope. The potential impacts of BSP can be determinedby the changes in the global marketing chain needed to implement its provisions and the associated benefits andcosts. In this context, the current functions of the global crop marketing chain provide a baseline for any examinationof the impacts of the BSP.
IV. Global Crop Production and Trade and the Scope of BSP
To examine the potential scope of the BSP, it is necessary to place the use of LMOs within the context of the globalproduction and trade of crops directed to food, feed, or processing. In doing so, it readily becomes apparent that theBSP already pertains to a large segment of global agricultural production and trade, and could influence the vastmajority of it in the very near future.
Global Production
Over the last four decades, global production of crops produced for food, feed, and industrial uses has continued togrow rapidly in response to increasing food demand. Key drivers for increased food consumption have been populationgrowth and economic development.
Not only has the world’s population been growing at a fast pace but so too have incomes and wealth. These changeshave led to diets with increased caloric intake and higher consumption of animal protein and vegetable oils (Figures1 & 2). The changes have been more pronounced in Asian countries like India and China, but growth has occurredin other regions as well.
Increased meat consumption has translated into even higher demand for grains and oilseeds. Consequently, feeddemand dominates the utilization of many key crops. For example 73 percent of the global maize production isdirectly fed to livestock. The remainder is processed for food and industrial uses, with many of the byproductsutilized in livestock feed.
Feed crops such as maize, soybeans, and sorghum therefore constitute a large portion of global agriculture andhave a significant share of the cultivated land around the world. Indeed, four crops alone – wheat, rice, maize, andsoybeans – account for approximately 50 percent of the world’s arable land, while another four – barley, sorghum,cotton and canola – account for an additional 15 percent of planted acreage (FAOSTAT, 2004).
To meet increasing demand, production of these key crops has continued to expand in recent decades (Figure 3).Much of the growth in production has come from productivity gains, as the total amount of land in crop productionhas remained relatively stable (Figure 4).
3

Figure 1 Global Meat Production/Consumption (1000 MT)
-
50,000
100,000
150,000
200,000
250,000
1961
1964
1967
1970
1973
1976
1979
1982
1985
1988
1991
1994
1997
2000
2003
Poultry MeatPigmeatBeef and Veal
Source: FAOSTAT
Figure 2 Oil Production/Consumption (1000 MT)
-
10,000
20,000
30,000
40,000
50,000
60,000
70,000
80,000
90,000
100,000
1961
1964
1967
1970
1973
1976
1979
1982
1985
1988
1991
1994
1997
2000
2003
Sunflower OilSoy Oil
Canola OilPalm Kernel Oil
Palm OilCorn Oil
Coconut Oil
Source: FAOSTAT
4

Figure 3 Global Production of Key Crops (1000 MT)
-
500,000
1,000,000
1,500,000
2,000,000
2,500,000
1961
1963
1965
1967
1969
1971
1973
1975
1977
1979
1981
1983
1985
1987
1989
1991
1993
1995
1997
1999
2001
2003
WheatSoybeansRice, PaddyMaize
Source: FAOSTAT
Figure 4 World Grain Area and Yields
-
100,000
200,000
300,000
400,000
500,000
600,000
700,000
800,000
900,000
1961 1966 1971 1976 1981 1986 1991 1996 20010
0.5
1
1.5
2
2.5
3
Area Harvested (1000 HA)
Yield (MT/HA)
Source: FAOSTAT
5

Global Trade
Not surprisingly, the same crops that dominate production also represent the bulk of global agricultural commoditytrade. Almost 300 million metric tons of wheat, maize, soybeans, and rice are traded globally every year across alarge number of countries. However, trade in these agricultural commodities represents only a fraction of total cropproduction – typically less than 15 percent (Figure 5).
Figure 5 Global Grain Production, Consumption, and Trade 1960-2003
-
200,000
400,000
600,000
800,000
1,000,000
1,200,000
1,400,000
1,600,000
1,800,000
2,000,000
1961
1964
1967
1970
1973
1976
1979
1982
1985
1988
1991
1994
1997
2000
2003
ProductionDomestic DemandExports
Source: USDA ERS, PS&D DatabaseDespite its overall small share, however, trade in agricultural commodities plays a critical role in equilibrating demandand supply conditions across the globe, keeping a vast food system working, for the most part, uninterrupted. Cropmarkets are inherently unstable with significant production and quality fluctuations from region to region and fromone year to another, principally, due to variations in weather and pest infestations. In this context, grain and oilseedtrade moves products from surplus to deficit regions, mitigating the risks caused by the volatility of local markets.
Trade is also essential when local demand outpaces production growth. For instance, over the last forty yearsimports of grains and oilseeds have outstripped imports by developed countries (Figure 6) as developing countryincomes have risen. Trade has been instrumental in bridging the gap between domestic production and consumption(Table 1).
Figure 6 Changes in Grain Consumption by Region – 1972 to 2002
1972 2002
E. Europe4%
Africa8%
Other Asia22%
China20%
Eu 1510%
S. America5%
USA14%
Rest of World17%
Africa5%
E. Europe7%
USA15%
Rest of World22%
Other Asia19%
China14%
Eu 1514%
S. America4%
Source: USDA, ERS PS&D Database
6

Table 1 Global Vegetable Oil Imports by Region, 1970-2002 (in 1000 MT)
Source: FAOSTAT
Table 2 Maize Trade Flows: Primary Exporters and Importers(2000-2 average —in MT)
Source FAOSTAT
Just as there are a few key crops in global production, there are also a few key exporters in global trade. For instance,Argentina, Brazil and the United States dominate soybean exports while the United States and Argentina dominatemaize exports (Table 2). Australia, Canada, and the United States supply the bulk of wheat exports while Argentinaand the EU also contribute significant amounts (Table 3).
Indeed, with the exception of rice, 60-90 percent of exports in all key crops are supplied by a handful of countries thathave expansive agricultural sectors and are major exporters – namely, Argentina, Australia, Brazil, Canada, China, theEuropean Union and the United States (Table 4). Some of these countries also have large domestic markets wheremuch of their production is utilized (e.g. Brazil, China, the EU, and the United States). Indeed, China’s domesticmarket has expanded quickly in recent years and has become a significant net importer. Others, like Australia,Argentina and Canada export the bulk of their production (Table 5).
7
1970 1980 1990 2000 2002 Developed Countries 2,474 4,418 7,507 12,106 12,188 Less Developed 1,686 6,459 12,638 22,777 23,765 North America 537 860 1,659 2,495 2,547 Europe 2,065 4,056 6,428 10,087 10,354 Africa 447 1,317 2,233 3,399 3,474 Asia and Oceania 749 3,195 6,725 14,387 14,582
Exporter
Importer Argentina Brazil China Hungary Romania USA Total
Japan 325,700 286,350 14,113,967 14,726,017 S. Korea 1,038,300 2,837,150 2,240,891 6,116,341 Egypt 572,600 345,936 4,870,106 5,788,642 Mexico 868 5,336,977 5,337,845 China 18,700 65,410 4,792,506 4,876,616 Canada 17,600 3,528,320 3,545,920 Malaysia 284,700 1,702,983 23,198 2,010,881 Colombia 98,300 287 1,756,757 1,855,344 Algeria 258,300 15,907 10,044 1,371,956 1,656,207 Saudi Arabia 458,000 918,314 1,376,314 Spain 881,300 471,169 2,341 4,733 1,359,543 Chile 1,103,300 171,022 14 33,904 1,308,240 Turkey 400 295,341 82,225 817,739 1,195,705 Dominican Republic 990,081 990,081 Peru 694,000 320 283,969 978,289 Syrian 97,200 1,703 782,477 881,380 Indonesia 620,790 257,595 878,385 Israel 49,200 1,324 781,177 831,701 Morocco 155,200 6,807 12,807 626,339 801,153 Tunisia 86,700 2,045 5,910 699,329 793,984 Venezuela, 2,600 684,387 686,987 Iran 545,200 56,559 62,999 664,758 United Arab Emirates 240,600 402,409 643,009 Guatemala 595,172 595,172 South Africa 236,500 324,530 561,030 Costa Rica 456,364 456,364 Russia 10,240 278,828 40 102,287 391,395 Jordan 338,000 39,022 377,022 Portugal 345,400 18 114 345,532 N. Korea 344,730 344,730 El Salvador 344,090 344,090 Cyprus 24,900 93,711 123,840 1,883 96,782 341,116

Table 3 Wheat Trade Flows: Primary Exporters & Importers(2000-02 average —in MT)
Source: FAOSTAT
Table 4 Country Shares of Global Exports for Selected Grains & Oilseeds(2000-02 average)
Source: FAOSTAT
Exporter Importer
Argentina
USA
Australia
Canada
EU-15
Brazil 6,519,500 199,198 6,300 972 Egypt 108,900 3,546,903 1,680,069 159,000 761,700 Japan 2,996,267 1,195,509 1,443,958 2,872 Indonesia 201,300 186,804 2,105,279 625,000 114,059 Algeria 131,600 217,022 25,652 813,000 1,931,056 Mexico 2,192,039 882,100 Iraq 346,500 2,245,095 Korea 1,210,435 952,818 294,200 278 Nigeria 86,500 1,882,487 279,500 167,728 Philippines 1,418,002 83,126 738,500 4,862 Italy 74,900 1,075,802 451,213 537,200 China 13,500 1,149,735 99,474 758,603 Morocco 49,300 152,079 129,500 628,500 1,059,000 Yemen 592,100 450,113 7,300 427,689 Peru 469,300 564,066 352,000 Colombia 42,200 537,082 600,800 139 Malaysia 167,127 681,725 187,900 Cuba 153,675 58,600 797,657 Thailand 363,432 285,930 202,800 6,251 Sudan 25,600 17,400 450,462 195,800 101,924 Tunisia 201,700 45,154 319,300 159,200 Sri Lanka 80,400 431,883 209,167 Israel 608,387 18,436 60,190 Jordan 202,700 456,506 11,800 3,611 Spain 21,000 397,974 189,000 United Arab Emirates 43,600 67,253 226,417 205,300 25,972 Bangladesh 214,248 132,855 153,000 55,000 Guatemala 155,065 353,900 South Africa 329,600 18,568 97,755 11,000 44,356
Cottonseed Maize Canola Rice Soybeans Wheat European Union (15) 8.0% Argentina 1.0% 12.5% 1.1% 12.1% 8.4% Australia 40.6% 16.7% 1.7% 12.9% Brazil 28.4% Canada 38.4% 1.0% 12.7% China 10.8% 7.5% USA 21.0% 58.5% 3.1% 10.8% 50.5% 21.3% TOTAL 69.1% 81.8% 64.8% 22.2% 92.0% 63.3%
8

Table 5 Exports as a Percent of Total Production(2000-02 average)
Source: FAOSTAT
Biotechnology Innovation and Adoption
Against this global crop production and trade context, much of the adoption of LMOs has taken place in these keycrops and in these key exporting countries (Figure 7). Excluding Europe, all of the major crop producing and exportingnations have commercially introduced one or more LMOs into their production system. And, in those countrieswhere commercialization of LMOs has been allowed, adoption has occurred at an unprecedented pace, often coveringmore than 80 percent of the available acreage in just a few years (ISAAA, 2004).
Figure 7 Adoption of LMOs in various Crops and Major Exporting Countries
0%
10%
20%
30%
40%
50%
60%
70%
80%
90%
100%
USA Argentina Canada Brazil Australia China
SoybeanCornCanolaCotton
Source: USDA NASS, AAFC, and ISAAA
These patterns of LMO adoption are the outcome of strong economic forces. Market potential drove the early focus ofbiotechnology research and development on LMO traits toward large acreage crops such as maize, soybeans, cotton,canola, wheat, and rice. Identifying, inserting, and validating any genetic modification, as well as guiding a modifiedcrop through the regulatory process, is a lengthy process that typically takes 7-10 years. Research and developmentand regulatory costs are similar across crops and traits. Innovators must therefore incur these fixed costs whether thetechnology could be adopted on one or a million acres. The profits, on the other hand, are directly proportional to thenumber of acres on which the technology is adopted. As a result of these economic forces, biotechnology companieshave developed LMO traits that offer the largest potential value among the most widely planted field crops, namelyfeed-grains and fiber crops.
Cottonseed Maize Canola Rice Soybeans Wheat World 2% 13% 24% 5% 31% 20% European Union (15) 10% Argentina 4% 67% 24% 38% 24% 72% Australia 41% 84% 31% 11% 87% Brazil 40% Canada 69% 29% 81% China 7% 1% 2% 1% USA 3% 20% 32% 30% 37% 51%
9

Once LMOs are commercialized, farmers quickly adopt them because of strong economic incentives at the farm level.Adopters generally enjoy substantial benefits from increased yields, lower risks, reduced use of chemical pesticides,as well as increased savings in management, labor and capital equipment costs. There are also gains from reducedtillage and other synergistic production practices (Kalaitzandonakes, 2003).
Incentives for adoption and use of LMOs have been stronger in export-minded countries with agricultural sectors thatcompete in global markets (Anderson and Jackson). Producers in these countries continuously look for more efficienttechnologies and improved farming systems in order to maintain their cost competitiveness. Countries with protectedand inward looking agricultural sectors have diminished incentives to use LMOs as they could add to domesticproduction surpluses and to government subsidy spending (ibid).
Under these conditions, the observed patterns of adoption and use of LMOs are not surprising and will continue in thefuture. Use of LMOs has already transformed the production systems of major field crops such as soybeans, maize,cotton and canola. And while LMOs have not yet been commercially introduced in rice and wheat production, manyare already in the pipeline. For instance, China has already field-tested and is expected to be the first to commercializeLMO rice in 2006 (Huang).
Since the adoption and use of LMOs is concentrated in key crops and in countries that dominate global productionand trade, it is clear that the BSP will pertain to a large portion of today’s agricultural commodity trade. Its scope willonly expand as LMOs are introduced and adopted in other widely traded agricultural commodities in the near future.
The Global Crop Marketing Chain
The potential impacts of the BSP will be determined by the changes in the global marketing chain that will benecessary to implement its provisions. In this context, it is crucial to understand the current functions of the globalmarketing chain.
Every year, the harvest from millions of small and large crop farms that are spatially dispersed over vast terrainsmust be collected during a short period of time, and moved to storage where it will be gradually dispersed to animalfeeding and processing facilities throughout the coming year. An expansive global marketing chain transmits timelyand accurate information between consumers and producers so supply and demand adjust spatially (moving cropsfrom surplus to deficit areas); temporally (storing crops when they are plenty and drawing from stocks when they areneeded); and qualitatively (moving crops of varying quality to their optimal uses).
Although this key function of the global marketing chain is conceptually simple, its execution is not – especially in theface of continually changing market conditions. Indeed, marketing chains in many countries and regions are noteffective or well functioning. For instance, marketing chains in many countries suffer chronic under-investment instorage, transport and other assets. Others have misplaced physical assets with poor market access and ineffectiveinformation channels. Systematically, such marketing chains experience large postharvest losses from spoilage,rodent and pest infestations. In some countries ineffective marketing chains have often created the need for largeimports even in the presence of local bumper crops.
Crop marketing chains contend with many uncertainties that complicate their operations. The volatility of localproduction and consumption from one year to another leads to significant changes in the utilization rates of physicalassets (e.g. storage silos, transport, processing plants) thereby raising the investment risk for such assets. Pricerisks are also significant. As they are traded, crops change hands many times in any given year, and in everytransaction the buyer assumes price risk.
For instance, country elevators that purchase grain from local farmers in the fall and store it through the winteranticipate that prices in the spring, when they will sell their grain, will be at least as high as the prices they paid, plusa margin for storage costs and quality deterioration. Indeed, grain prices typically rise through the marketing seasonreflecting the costs of storage. But this is not true in all years or all locations. Uncertainties in freight prices, interestrates, and in exchange rates of international currencies further add to the overall risk confronted by operators in cropmarketing chains. Counterparty risks are also significant as transactions are mostly impersonal, occurring amongparties in distant locations, often in different countries.
Complex institutions have developed to facilitate information flows between buyers and sellers and minimize risks inthe marketing chain. For instance, public and private agencies have emerged (e.g. USDA, International GrainsCouncil) to produce and disseminate market information and statistics and reduce risks from limited or inadequatemarket knowledge. Similarly, broadly accepted standardized trading terms (e.g. the Grain and Feed Trade Association,
10

the North American Export Grain Association, and the Canadian Wheat Board) as well as arbitration procedures havebeen developed to manage counterparty risks.
Futures markets also diversify price risks. Buyers and sellers in the marketing chain can trade promises of futurecommodity deliveries in futures markets. Through hedging – making equal and opposite transactions on the cash andfutures markets – farmers, elevator managers, traders, processors and others can protect themselves against adverseprice movements while they hold grain inventories. Freight and exchange rate risks can be similarly hedged.
To facilitate the exchange of appropriate signals between buyers and sellers in distant markets and reduce transactionscosts, grades and standards have been developed for key grains and oilseeds. Grades and standards provideinformation that enables buyers to determine end-product yield and quality as well as storability, without visual inspection.Public and private agencies (e.g. the USFederal Grain Inspection Service) provide inspection services and ensurethat grain standards are upheld. In this way, a large number of transactions can be consummated at limited transactionscosts.
Grain and oilseeds grades and standards also facilitate improvements in the efficiency of crop marketing chains.Grains and oilseeds from numerous farms are mixed and blended to meet specific grades throughout the supplychain and over time resulting in perfectly fungible and divisible product streams. This fungibility has facilitated theefficient use of discrete storage and transport assets and has yielded significant scale economies.2 Since grains andoilseeds are bulky and relatively expensive to transport and store, efficiencies and scale economies throughout thegrain marketing chain have helped control costs and expand trade.
V. Calculating the Costs of Implementing the BSP for LMO-FFPs
Identifying Cargoes at the Point of Export
The impact of the BSP on the global marketing chain will be determined by the nature of the LMO identification that willbe required. These decisions have yet to be made. Positions supported by various stakeholders include:
• Simply indicating that a cargo “may contain” LMOs;
• Identifying the specific LMOs in the cargo; and
• Identifying the specific LMOs in the cargo and quantifying their amounts.
As described above, under typical conditions crops change hands multiple times as they travel through the marketingchain, commingled time and again in storage and transport to improve quality characteristics and maximize the useof physical assets. The exporter is the last in a long series of entrepreneurs that take ownership of the crops alongtheir journey within a given country and any given season. The question then is: what changes in typical operationsmight be needed so exporters have appropriate information to effectively describe a cargo according to BSP provisions?
Necessary operational changes will depend on what must be labeled and how. For instance, a “may contain” statementcould be substantiated by exporters through knowledge of what LMOs are in production and of the cargo’s origin.More specific requirements where the LMOs in a cargo must be specifically identified or quantified would need to besupported by extensive testing. The operational challenges are best clarified with a specific case study below.
Case Study: Identifying LMOs in a Maize Cargo
The United States is a major producer and exporter of maize as well as a leading user of LMOs. Since the commercialrelease of the first biotech maize traits in the mid-1990s, the adoption of biotechnology in US maize production hascontinued to grow at a rapid pace, reaching 45 percent of all the maize acreage in 2004 (Figure 8).
Commercial maize LMOs involve two main phenotypic properties: herbicide tolerance and pest resistance. Pestresistance accounts for the majority of the adoption – over 80 percent of total LMO maize seed sales – in the formof single or stacked traits. The approved LMO events include a number of commercial products each conferring aunique mode of action. Table 6 reports the maize LMO events that have been approved by regulators for commercialintroduction in the United States. Of those, BT 11, GA21, MON 810, MON 863, NK 603 and TC1507 are commerciallycultivated in the United States.
2 For instance, transporting a ton of cargo by barge is almost 15 times cheaper than transporting it by truck. Similarly, the cost of storing abushel of grain varies by as much as five times, between some small and large elevators. Such economies of scale exist throughout the grainmarketing chain and can only be captured through a flexible commodity system of fungible commodities.
11

Figure 8 US Adoption of Maize LMOs – 1996-2004
0
5
10
15
20
25
30
35
40
45
50
1996 1997 1998 1999 2000 2001 2002 2003 2004
Stacked Corn
Herbicide Tolerant Corn
Insect Resistant Corn
Table 6 Maize LMOs Approved for Commercialization in the United States
Event Company Gene Phenotype
176 Syngenta Seeds, Inc. CryIA(b) - Donor: Bt kurstaki
Phosphinothricin acetyl transferase IR - European Corn Borer resistant
676, 678, 680 Pioneer Hi-Bred DNA adenine methylase - Donor: E. coli Phosphinothricin acetyl transferase - Donor: Strep. viridochromogenes
AP - Male sterile HT - Phosphinothricin tolerant
B16 (DLL25) Dekalb Genetics Phosphinothricin acetyl transferase - Donor: Strep. hygroscopicus
HT - Phosphinothricin tolerant
BT11 (X4334CBR, X4734CBR)
Syngenta Seeds, Inc. CryIA(b) - Donor: Btk Phosphinothricin acetyl transferase
IR - Lepidopteran resistant
CBH-351 Aventis CropScience Cry9C - Donor: Bt tolworthi Phosphinothricin acetyl transferase - Donor: Strep. hygroscopicus
HT - Phosphinothricin tolerant IR - Lepidopteran resistant
DBT418 Dekalb Genetics CryIA(c) - Donor: Bt kurstaki Phosphinothricin acetyl transferase
IR - European Corn Borer resistant
GA21 Monsanto EPSPS - Donor: Corn HT - Glyphosate tolerant MON80100 Monsanto CryIA(b) – Donor: Bt kurstaki EPSPS IR - European Corn Borer
resistant MON802 Monsanto CryIA(b) - Donor: Bt kurstaki EPSPS
- Donor: Agrobacterium Glyphosate oxidoreductase - Donor: Achromobacter NptII*
HT - Glyphosate tolerant IR - European Corn Borer resistant
MON809 Pioneer Hi-Bred CryIA(b) - Donor: Bt kurstaki EPSPS* Glyphosate oxidoreductase*
IR - Lepidopteran resistant
MON810 Monsanto CryIA(c) - Donor: Bt kurstaki Phosphinothricin acetyl transferase*
IR - European Corn Borer resistant
MON863 Monsanto Cry3Bb1 - Donor: Bt kumamotoensis NptII*
IR - Coleopteran resistant
MS3 Bayer CropScience (Aventis CropScience(AgrEvo))
Barnase - Donor: Bacillus amyloliquefaciens Phosphinothricin acetyl transferase - Donor: Strep. hygroscopicus
AP - Male sterile HT - Phosphinothricin tolerant
MS6 Bayer CropScience (Aventis CropScience(AgrEvo))
Barnase - Donor: Bacillus amyloliqufaciens Phosphinothricin acetyl transferase*
AP - Male sterile
NK603 Monsanto EPSPS - Donor: Agrobacterium HT - Glyphosate tolerant
T14, T25 Bayer CropScience (Aventis CropScience(AgrEvo))
Phosphinothricin acetyl transferase - Donor: Strep. viridochromogenes
HT - Phosphinothricin tolerant
TC1507 Mycogen (c/o Dow AgroSciences); Pioneer (c/o Dupont)
Cry1F - Donor: Bta Phosphinothricin acetyl transferase - Donor: Strep. viridochromogenes
HT - Phosphinothricin tolerant IR - Lepidopteran resistant
12
Source: USDA APHIS

The farm-level adoption of the various LMO maize traits is not evenly distributed across the United States (Figures 9and 10). Adoption is generally driven by farm-level economic benefits that vary across farms and geographic regionsdue to differences in pest and weed pressures (Kalaitzandonakes, 2003). For example, pressures from the Europeancorn borer and corn rootworm differ dramatically across the Corn Belt from year to year and affect the use of insectresistant (IR) maize.
Figure 9 Adoption of Insect Resistant Maize in the United States, 2003
Figure 10 Adoption of Herbicide Resistant Maize in the United States, 2003
13
Local maize markets also influence producers’ planting decisions. Production areas close to waterways targetingexport markets are affected by international market preferences. Similarly, production areas close to dry and wetmills are influenced by the manufacturers’ effective demand for specific maize varieties and traits.
Against this context, in 2003 the use of maize LMOs was higher in the Western Corn Belt where adoption levelsreached 80 percent (South Dakota). In contrast, the Eastern Corn Belt had much lower adoption levels with Indianaand Ohio, on average, below 20 percent.
All maize LMOs that are approved for commercialization in the United States are considered by regulation equivalentto conventional maize. Accordingly, no effort is generally made to separate LMO and non-LMO maize during harvest.Over half of the United States maize production is fed to livestock on the farm it is produced or on other nearbyfarms. Another 25 percent travels to the closest wet or dry milling facilities, located in the center of maize producingareas to improve sourcing and minimize transport costs. Such facilities process maize into ethanol, starches, syrupsand a variety of other industrial products and feed byproducts (Figures 11 and 12).
Figure 11 Location and Capacity of the United States Maize Wet Milling Industry, 2003
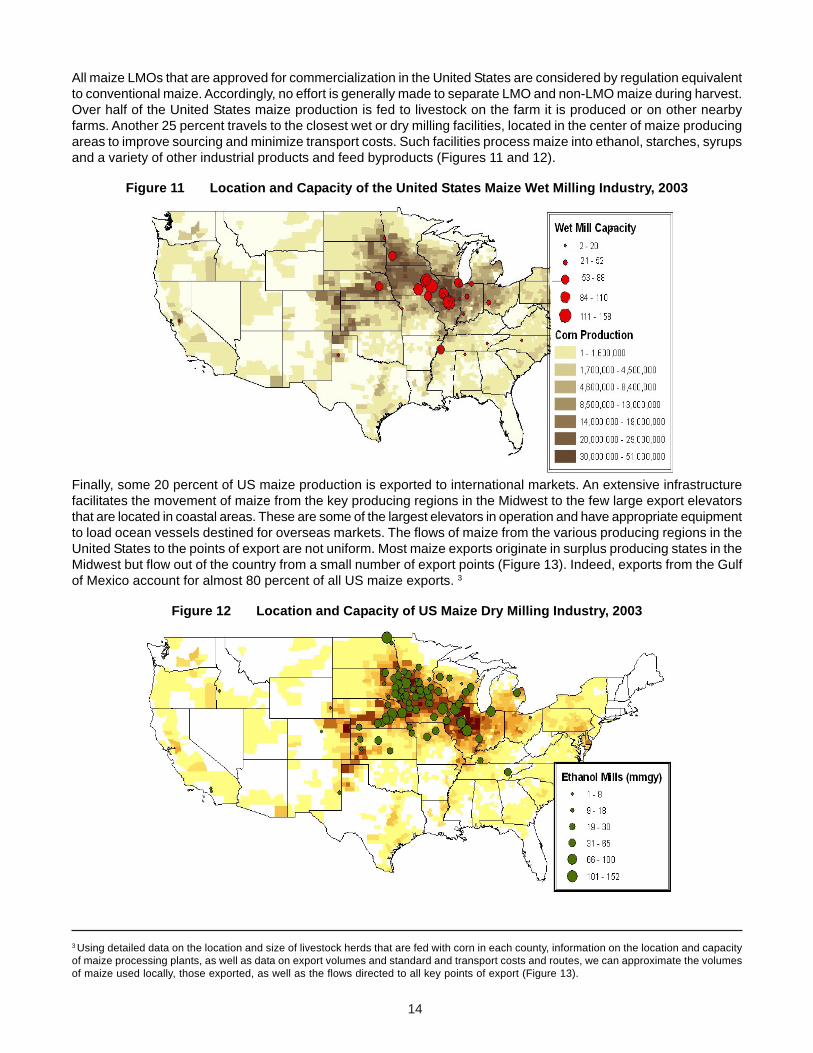
Finally, some 20 percent of US maize production is exported to international markets. An extensive infrastructurefacilitates the movement of maize from the key producing regions in the Midwest to the few large export elevatorsthat are located in coastal areas. These are some of the largest elevators in operation and have appropriate equipmentto load ocean vessels destined for overseas markets. The flows of maize from the various producing regions in theUnited States to the points of export are not uniform. Most maize exports originate in surplus producing states in theMidwest but flow out of the country from a small number of export points (Figure 13). Indeed, exports from the Gulfof Mexico account for almost 80 percent of all US maize exports. 3
Figure 12 Location and Capacity of US Maize Dry Milling Industry, 2003
3 Using detailed data on the location and size of livestock herds that are fed with corn in each county, information on the location and capacityof maize processing plants, as well as data on export volumes and standard and transport costs and routes, we can approximate the volumesof maize used locally, those exported, as well as the flows directed to all key points of export (Figure 13).
14

Ocean vessels carry an average of 25,000 metric tons of maize in each journey and many exceed 50,000 metric tonsof cargo. Depending on their point of departure, they source large amounts of maize from various regional elevators inmultiple locations that have available supplies and can minimize transport costs. The typical journey involves maizetraveling on barges along the river all the way to the large silos of the export elevator and ultimately into a vessel.
Figure 13 Maize Export Flows from Maize Producing States to Points of Export
76% 1.5%
3%
6%
2.5% 10%
Given the geographically dispersed use of LMOs, the continual commingling and aggregation of maize from thevarious farms, to the trucks, to the storage bins in the local and river elevator, to the river barges, and then onto theexport vessel, what might be the expected LMO content of any given vessel cargo? And what might be the share ofeach LMO maize event?
Using actual data from representative export vessels and county-level adoption data for individual LMO maizeevents, it is possible to calculate the expected LMO content of the cargo in the vessels. The results of one suchcalculation are illustrated below. 4
4Information on the origins of barges sourced to supply representative export vessels were provided by grain trading firms for the purpose ofthis research. The conclusions from analyses of other vessels were qualitatively similar to those presented here.
Figure 14 Barge Origination for a Maize Cargo
15

Consider an ocean vessel with a maize cargo destined for Japan. This vessel carried a total of 58,000 metric tons ofmaize that was agglomerated from smaller cargos carried by 52 river barges. The barges were sourced from 16different locations in 6 states –Iowa, Illinois, Indiana, Missouri, Minnesota, and Louisiana (Figure 14). The contributionof each barge to the vessel averaged 1100 metric tons, but varied widely from 50 to 2000 metric tons.
In all the states where the barges were sourced, there was significant production of LMOs. In the absence ofsubstantial efforts to source and identity-preserve non-LMO maize under strict protocols, the vessel likely containedLMOs. Of course, the exact LMO content would depend on the production profile of the areas surrounding the riverelevators where the barges were sourced.5
Assuming that all the maize loaded on each barge was sourced within 100 miles of the elevator location, and usingcounty level adoption of various LMO maize events, the expected share of LMO events in the barges and ultimatelyin the vessel can be estimated (Table 7). While this is certainly only an approximation to the actual LMO content ofthe vessel it is revealing in certain ways.
Table 7 Expected Shares of Commercial LMO Events in Vessel(Percentage of vessel cargo)
Specifically, the results indicate that in the absence of identity preservation or segregation, vessels originating fromcountries with meaningful LMO production should be expected to contain LMOs. The exact level of LMOs and shareof individual events, however, could vary drastically across vessels depending on the production profile of the regionswhere their cargoes originate. Importantly, the results indicate that commercial production of an LMO event does notautomatically warrant its presence in a particular export cargo. For instance, while the stacked trait MON 863 X NK603 has meaningful adoption levels in the United States, only trace amounts were expected in the cargo of thevessel.
Accordingly, without testing each cargo for LMO content and for the share each LMO event, exporters would be unableto indicate that cargos definitively “contain” certain events simply on the basis that such LMOs are commerciallyproduced in a given country. Hence, in an LMO producing country and in the absence of extensive testing, the mostaccurate reporting exporters might be able to do could be to indicate that a cargo “may contain LMOs.”
Operational Changes and Potential Compliance Costs at the Point of Export
If exporters must verify specific events or the share of those events in a given cargo, what operational changes in thecrop marketing chain might be required to implement detailed BSP documentation provisions? The changes in theoperations of the exporters would be proportional to the detail required by the mandated BSP labels. Exporters couldspecify that a cargo “may contain” LMOs with modest changes in the operations. If exporters had to specificallyidentify or quantify the LMO content of export cargoes, they would have to extensively test each one separately.
Case Study: The Cost of Testing for LMOs
Anticipating the operational changes that might be required and estimating the compliance costs for testing andidentifying export cargoes according to BSP guidelines involves complex analysis beyond the scope of this study.Some initial insights, however, can be derived through straightforward calculations. To proceed, one must first answera number of practical questions, including:
• How should one appropriately sample an export cargo so that the test results are representative of its content?
• Should one test only for commercial LMO events or all deregulated ones?
5 Typically some 90 percent of the grains and oilseeds handled by river elevators in the US are sourced from surrounding areas. The restmight be sourced from other distant locations. These shares, of course, can vary from one year to another depending on the local harvest.
GA21/NK603 MON 810
MON 863 X MON
810 MON 863 MON 810 X NK 603
MON 863 X NK 603
X MON 810
MON 863 X NK 603 TC 1507 BT11
9.92% 18.41% 0.22% 4.95% 3.32% 0.10% 0.34% 9.90% 2.21%
16

• Should one test for LMOs in the exported crop only or as well for LMOs in other crops that are likely presentin trace amounts in most export cargoes?
• Should one simply assess the presence of LMOs in a cargo, assess the presence of specific LMO events, orquantify their individual share?
Laboratory costs increase with the number of samples that must be tested; the type of assessment required by theBSP (i.e. qualitative, quantitative); the number of events that must be tested; and the number of crops that must beevaluated. Some of the compliance costs are easier to estimate than others. For instance, the costs associatedwith testing for LMOs in export cargoes under different BSP implementation scenarios can be estimated by calculatinga per cargo testing charge and the total number of cargoes that would require such testing. Clearly, the number ofcargoes exported from different countries varies from year to year and so average forecasts must suffice. Furthermore,practical data limitations allow only approximating the number of export cargoes that would require testing.Nevertheless, such approximations can be revealing.
For instance, consider the testing costs that might be incurred for identifying LMOs in maize export cargoes. Assumingthat:
• Only maize LMO events that are currently in production are evaluated;
• Stacked LMO traits are not separately tested for6; and
• Bagged and containerized cargoes are assumed to be identity-preserved and do not require testing.
Using customs data from the two main maize exporting countries – the United States and Argentina – it is possible toapproximate the number of export cargoes that might require testing.7 Using book prices for relevant tests from varioustesting laboratories to calculate laboratory charges, it is possible to calculate aggregate annual laboratory costs forsix scenarios derived from two alternative sampling approaches and three testing procedures dictated by alternativelabeling requirements.
In the first three scenarios, a single composite sample is used to evaluate the content of a vessel under threealternative test options: (a) qualitative assessment of whether the cargo contains LMOs; (b) identification of specificLMO events contained in the cargo; and (c) measurement of the amount of each LMO event in the cargo. With anaverage cargo size of 25,000 metric tons of maize, vessels are sampled multiple times in set intervals as the grainflows into the cargo hold. A representative sub-sample of approximately 2.3 kg is sent to a laboratory for testing.From that, 10 grams of homogenized ground maize are tested for LMO content. Under this sampling approach, thelaboratory testing costs for maize exports ranges from $936,000 to $4,356,000 annually in Argentina and the UnitedStates, with the highest costs incurred if quantification of traits is required (Table 8).
The relevance of the test results derived, of course, depends on whether the tested sample is representative. Using2.3 kg (or 10 grams that are actually tested) to accurately represent the content of a 25,000 metric ton cargo mightbe difficult.
To address these considerations, the European Commission recently produced a draft of recommended practicesfor sampling and testing LMOs in bulk commodities to provide guidance for EU member states when conductingofficial tests. These testing plans were developed to address stratification/pockets of LMOs in shipments and to testthe level of LMOs in a “lot” (e.g. vessel, ship hold, container, etc). The draft plan requires collecting a large numberof samples to be tested individually for each event. The recommended practices suggest that for lots exceeding 500metric tons, 100 separate primary 0.5 kg samples should be taken at regular time intervals as grain moves throughthe grain trade system, following broadly accepted sampling standards (e.g. ISO 13690, ISO 6664, and GAFTA Rule124 Annex B). From those, a minimum of 20 samples are to be separately tested and a composite test score to beproduced to represent the content of the lot. Under such potential sampling procedures, laboratory-testing costsexplode. Even with the minimum recommended 20 tests per cargo, laboratory-testing costs for maize exports rangefrom $18 to $87 million annually for the United States and Argentina (Table 8).
6 Stacked events represented an estimated 18 percent of US LMO maize acres in 2004. Their popularity is expected to increase further in thefuture. Testing for stacked events implies complications that are most significant when the share of such events needs to be quantified.Currently, this can be achieved only by testing individual kernels/seeds in the cargo—escalating complexity and testing costs beyond thoseconsidered here.7 Data for cargoes exported through ocean vessels are considered here. Exports through other means of transport (e.g. rail) are not included.
17

Table 8 Estimated Annual LMO Testing Costs of Maize Export Cargoes (in US dollars)
Author’s calculations
Beyond these laboratory costs, there are additional compliance costs in testing export cargoes for LMO content thatare more difficult to calculate. These include handling and overhead charges incurred by exporters for maintaining aninventory of samples and managing the interface and test reporting with labs, sampling authorities, regulators andtheir customers. These compliance costs increase as the number of samples tested increases.8
Other changes are less direct and obvious. The associated costs might be more difficult to estimate but could still besignificant. Ultimately, BSP requirements reduce the inherent fungibility of commodity grain and the flexibility of itsmarketing chain. Some of the gains from efficiencies and scale economies achieved could therefore be lost. It isdifficult to estimate how large such implicit compliance costs could be.
The estimated costs for testing maize cargoes indicates the magnitude of compliance costs that could be incurred inimplementing the BSP provisions across all commodities and countries involved in LMO trade, and illustrates thelarge differences in compliance costs driven by seemingly small shifts in implementation details. Full accounting ofthe BSP compliance costs must, of course, tally expenditures for testing all crops that have LMOs (e.g. maize,canola, soybeans) and, potentially, crops that do not (e.g. wheat and rice) but could include traces of LMOs through“adventitious presence” of other LMO crops (e.g. maize and soybeans). Full accounting should also incorporate futureincreases in compliance costs that will come from: increasing adoption of LMO crops; an increasing number of LMOevents/traits; an increasing number of LMO crops; and an increasing number of countries that will become LMOproducers.
It is important to point out that very few developing countries have facilities capable of testing for LMOs. In order toperform the required tests, samples would have to be sent to a laboratory abroad. Not only would this add to the directcosts of testing, it would add to the demurrage costs while a cargo awaited test results.
Operational Changes and Compliance Costs at Point of Import
A central implementation issue is how importers will receive and verify the information provided through BSPdocumentation. Will confirmation of the documentation be needed, and if so will it be done through laboratory testing?If exact LMO content must be identified and measured, the loaded vessel will likely be probed and sampled in waysthat are different from the sampling procedures used at the point of export.9
Such practices would more than double the laboratory testing costs incurred by the marketing chain. It typically takes5-7 days to receive laboratory test results for any given vessel suggesting costly delays at the point of import. Onaverage, each additional day at the port adds $25,000-$30,000 to the freight costs of a 50,000 metric ton vessel.Depending on the number of samples and the number of events tested, it might be economical to expedite testing.Testing can be expedited to 1-2 day turnaround time, but at increased laboratory costs, up to three times the normalcharges. Hence under most scenarios, laboratory-testing costs would more than double the costs presented inTable 8.
Even more troublesome than the explicit testing costs, however, are the implicit uncertainties associated with testing.Indeed, it is not clear which authorities will be responsible for implementing the BSP at the point of import. It is alsounclear how an importing country might respond if the test results at origin differ with the test results at the finaldestination. And, it is highly likely that these test results will differ.
8 For instance, with thousands of export vessels transporting corn every year, taking 20 separate 1 kgr samples for each vessel would amountto a very large number of samples that must be properly archived, stored and maintained for quality. The number of test results that must behandled also increases in parallel.9 It is unlikely that a vessel would be unloaded at the point of import before the testing was completed, if such testing was in fact required.Current practices would dictate that a 12 ft probe be used to sample the static grain.
Samples Tested Cargoes Tested "Contains LMOs" "Identifies LMOs" Quantifies LMOs
1 sample/cargo 3,575 $936,650 $2,342,900 $4,356,900
20 samples/cargo $18,733,000 $46,858,000 $87,138,000
18

Since LMO testing is a statistical process, repeated sampling and testing of the very same cargo would regularlyproduce different results. There are several sources of variance in test results, including: differences in the testing andsampling methods and protocols as well as uncertainty or error rates in tests. Clearly differences in testing methodsand protocols across various labs are significant sources of variance. No standardization in LMO testing methods isexpected in the near future and hence such source of variance will not diminish.
Conflicting test results, however, could occur even if identical lab protocols are used, unless the same sample istested. Depending on the concentration and distribution of a trait within a particular lot and how it was sampled, itcould be difficult, if not impossible, to duplicate any set of test results.
Finally, every assay should be measured to confirm the level of relative uncertainty (for quantitative assays) or assayerror rate for generating false positive and/or false negative results (qualitative assays). Irrespectively, some relativeuncertainty or error is present in every assay.
Depending on the sampling procedures and the testing protocols used, some divergence of the test results at originand destination should be expected. Could such divergence result in delays or rejections of cargoes at destination?
The potential holdup costs from such circumstances could escalate rapidly. Depending on the size of cargo and portof import, demurrage charges from delayed unloading of a cargo or from re-directing a vessel to an alternativedestination, quality deterioration and other costs could add up to millions of dollars per held-up vessel. To put suchholdup costs in perspective, it is useful to look at a case study of demurrage charges that resulted from redirectinga vessel from its original destination to an alternative one.
Case Study: Demurrage Costs
Consider a 56,000 metric ton vessel loaded with maize traveling towards its original destination port Tarragona,Spain. After arrival, and for reasons that are not relevant to the study, the vessel did not discharge its cargo. Afterone-day delay, it is redirected to Brake, Germany and ultimately redelivered to Cape Finisterre (Figure 15).
Port delays and additional travel time added a total of 7.73 days to the time the vessel was hired. Accounting foradded fuel and port charges, demurrage costs for an additional week’s delivery time amounted to over $460,000(Table 9).
This case study illustrates how quickly costs add up for cargoes that are held-up at or redirected away from theiroriginal discharge destination. Test-driven compliance to BSP would create uncertainties that are impossible toeliminate and difficult to manage. Holdup costs associated with such uncertainties could prove very substantial.
Figure 15 Redirected Vessel: Original Port and Deviation
Intended discharge port: Tarragona –Deviated to: Brake - Re-Delivery: Cape Finisterre
19

Table 9 Demurrage Costs for Redirection of Vessel
10 Using 2004 hire daily rates –almost $50,000 per day—and fuel costs, the demurrage costs of the case study presented here would bealmost 50 percent higher than those incurred just one year earlier.
The Costs of Avoiding LMOs: Sourcing non-LMOs
At present, importers who want to avoid LMOs can contract for non-LMO cargoes. Procuring non-LMOs impliesoperational changes in the crop marketing chain. Strict identity preservation (IP) must be used throughout the chain toprevent presence of LMOs and secure the required purity in sourced cargoes. IP procedures in non-LMO systemstherefore imply additional costs, which are normally paid by the purchaser. Some relevant questions for importingcountries then are: How large are IP costs in non-LMO markets? What are their key drivers? How sensitive are non-LMO IP costs to these drivers?
Why do non-LMOs Cost More?
IP non-LMO systems involve more coordination and planning than commodity-based systems. In most cases, changesmust begin at the time a cargo is procured by an importer. While under current practices an importer’s order can befulfilled within 3-6 months, non-LMO cargos require procurement 12-18 months ahead of delivery. Exporters mustreach, either directly or through intermediaries, all the way back to individual farms to contract acres for non-LMOproduction well ahead of the production season. And depending on the BSP standards in the country in question,coordination all the way back to the seed stock could be necessary.
Additional changes in the functions of the marketing chain are also necessary, as the production of the contractedacres must be protected from commingling with LMOs in the field, during harvest and transport, in storage, in the railcart or barge, and all the way to the export vessel. Hence, operations at each and every part of the marketing chainare changed, with significant incremental costs. Recent research has begun to examine the size and dimensions ofIP costs.
Both direct and indirect IP costs are incurred in non-LMO systems and must be tallied. (Kalaitzandonakes et al.).Direct IP costs are payable costs and generally result from:
Coordination and control: IP non-LMO systems require more market coordination resulting in higher transactioncosts. Such costs typically include salaries and wages for sourcing and management personnel, specializedinformation systems, third party certification fees, and so on.
Re-engineering of operations: As firms adapt their production and marketing operations for IP, they often incurextra capital, labor and material costs. For instance, farmers incur higher costs from extra labor for equipment
20
Travel/Distances Tarragona-Brake
Brake-Cape Finisterre Distance – NM 2,100 1,032 Average speed – KN 13.00 13.00 Duration – DAYS 6.73 3.31 Additional waiting time – DAYS 1.00 0 Hire payment voyage Tarragona-Brake
7.73 days @ USD 30,000.00 per day10 231923
Bunker consumption Tarragona-Brake (fuel for engines & generators)
Intermediate Fuel Oil 7.73 days @ 37 MT/day @ USD 200.00/mt 57202 Marine Diesel Oil 7.73 days @ 3 MT/day @ USD 500.00/mt 11596
68798 Port disbursements Tarragona, vessel one day berthed, in and out 37000 Hire payment voyage Brake-Cape Finisterre
3.31 days @ USD 30,000.00 per day 99231
Bunker consumption Brake-Cape Finisterre (fuel for engines & generators)
Intermediate Fuel Oil 3.31 days @ 37 MT/day @ USD 200.00/mt 24477 Marine Diesel Oil 3.31 days @ 3 MT/day @ USD 500.00/mt 4962
29438 TOTAL DEMURRAGE COSTS USD 466,390

cleaning during planting, harvest and storage as well as increased field isolation to prevent pollen flow fromadjacent fields. Elevators incur extra labor costs for facility clean outs, and higher testing costs (Lin et al.). In fact,similar re-engineering costs are incurred throughout the chain.
Risks and liabilities: IP often involves risks and liabilities beyond those confronted in commodity markets (e.g.Alexander et al.). The most significant risks come from potential system failures at each stage. When insurable,such risks and liabilities translate into payable costs in the form of premiums.
Indirect IP costs are mostly implicit costs that result from loss of flexibility; inefficiencies due to underutilization ofproduction, storage, transportation and processing assets; and lost profits (e.g. foregone storage margins andcarrying spreads and potential loss of technology benefits from use of LMOs).
Drivers of IP Costs in non-LMO Markets
IP costs in non-LMO markets are not fixed. They vary significantly from one part of the chain to the other (Borchgraveet al.) and across commodities.11 They also vary substantially with logistics and the infrastructure at hand. Becauseof such heterogeneity and limited experience with such systems, it is difficult to characterize the structure of IP costsin non-LMO markets. Nevertheless, the impacts of some key drivers are well understood and the direction of thoseimpacts is reasonably predictable.
Purity Standards and AP Tolerances: The rigor with which IP procedures are designed and implemented dependsmostly on the desired level of purity. For non-LMO systems with low thresholds, strict measures designed toprevent adventitious presence of LMOs must be put in place. Beyond certain levels, as thresholds diminish, IPcosts increase exponentially (Kalaitzandonakes and Magnier, Huygen, et al.).
Scale of IP Systems: Unlike commodities, IP non-LMO systems do not generally enjoy scale economies. Indeed,if the aggregate demand for non-LMOs was to grow quickly and drive these markets beyond their current“niche” status, IP costs could escalate, as unsuitable assets would be increasingly employed in IP systems.Farmers, elevators and other contracted participants in non-LMO marketing chains are currently selected forskills and attributes (e.g. availability of on-farm storage, location with little penetration of LMO production) thatminimize IP costs. Under significant scale expansion, less suitable, or more “average” assets, would be utilized,thereby raising the average cost of IP (Kalaitzandonakes et al.).
Scale of LMO Production: With increasing LMO acreage, adventitious presence of LMOs in non-LMO lotswould tend to increase. Under such conditions, firms all along the IP marketing chain must implement more rigidIP processes to meet purity thresholds and incur rising IP costs.
How High are non-LMO IP Costs?
Most studies on IP costs have concentrated on a specific part in the marketing chain (e.g. seed – Kalaitzandonakesand Magnier; agricultural production – Bullock et al.; elevator— Maltsbarger and Kalaitzandonakes, Herman et al.).There are only few studies that provide estimates on how IP costs accumulate through the whole chain and theirlevels at the point of import. The evidence is rather limited and covers a wide range. Borchgrave et al. reported thatIP costs for non-LMO soybean marketing chains with 1 percent AP tolerance levels average $22.5/metric ton at thepoint of import. Similarly, the Canada Grains Council put average IP costs for non-LMO bulk shipments with 5percent AP tolerance levels at $8/metric ton and those with 2 percent AP tolerance at $25/metric ton.
For some confirmation of these IP costs, it is useful to examine the extra costs (beyond those paid for the commodity)borne by buyers for non-LMO cargoes at points of import in the main non-LMO markets: the European Union andJapan.12 Using export data and information from various industry sources, it is possible to approximate the range ofincremental costs paid by buyers at the point of import, given the size of these non-LMO markets.
The Japanese non-LMO maize market ranges between 3.5-4.5 million metric tons in any given year. Most non-LMOmaize originates in the United States and is identity-preserved from the farm throughout the supply chain and all theway to the end user – largely the Japanese wet milling industry. Japan also has an active non-LMO soybean marketthat draws IP soybeans mostly from the United States for food uses. The estimated volume of the non-LMO soybean
11 Commodities differ in their production systems, marketing chains, and end uses. Because of idiosyncrasies, non-LMO IP costs can varysubstantially across commodities. For instance, while outcrossing control requires expensive measures in the production of cross-pollinatingcanola and corn, it is a minor issue for self-pollinating soybeans.12 The incremental costs or “premiums” paid by buyers for non-LMOs at the point of import can vary from year to year with demand and supplyconditions and may be quite different from IP costs. Nevertheless, since IP non-LMO markets are competitive and rather stable in size, IPcosts and “premiums” paid by buyers will tend to converge in the long run.
21

market in Japan varies from 1-1.5 million metric tons in any given year. Both markets have been rather stable and havenot experienced significant growth in the last 3-4 years.
The only other meaningful non-LMO market is found in the European Union where non-LMO soybeans have beensourced mostly from Brazil. The non-LMO soybean market in the EU ranges between 1.2-1.6 million metric tons.13
The incremental costs paid by importers in the EU and Japan for non-LMO soybeans are rather similar. In 2004, theincremental costs for soybeans in the EU were typically $20-25/metric ton while they were slightly higher in Japanaveraging $22-27/metric ton. The incremental costs paid by Japanese non-LMO maize buyers averaged $10/metricton at the point of import. These incremental costs seem to confirm the range of costs that accumulate up to thepoint of imports in non-LMO chains.
On average, the incremental costs paid by non-LMO maize buyers in Japan have been stable in the last few yearsreflecting the adequate supply conditions in the United States. Indeed, in 2004 less than 50 percent of the US maizeacreage was LMO, suggesting adequate supplies of non-LMO maize. On the other hand, the incremental costs paidby non-LMO soybean buyers in both the European Union and Japan have been edging higher. It is unlikely that suchincreases are due to supply constraints, as the total non-LMO soybean market absorbs less than 2 percent of thetotal soybean production in the United States and less than 3.5 percent the soybean production in Brazil. It is morelikely, that such increases reflect higher IP costs that come with increasing adoption of LMOs in both countries.
Finally, the aggregate costs of the non-LMO markets are of interest. Despite their limited share, non-LMO maize andsoybean markets in Japan and the EU cost approximately $100 million per year to the domestic consumers, beyondthe actual cost of the commodities themselves. These costs would of course increase with increasing adoption ofLMOs; increasing number of LMO events (more costly to IP and test for); increasing number of LMO crops; andlower AP thresholds.14
The Challenge of “Unapproved Events”
An issue worthy of separate consideration concerns “unapproved events” – LMOs that have been granted regulatoryapproval in a producing country but not in an importing country. Unapproved events have already proved challengingfor the crop marketing chain. Despite efforts to align commercialization and production of LMOs with regulatoryapprovals in major import markets, there have been a few cases where unapproved events had to be kept away ofspecific markets. The record in such cases is rather mixed with the most known disruption in trade coming from USexports of (unapproved) StarLink maize to Japan in early 2001. Indeed, deliveries of the unapproved event occurreddespite significant efforts to test and segregate small amounts of such event out of the US maize marketing chain(Lin, et al.).
In these cases, the BSP creates an interesting tension. On the one hand, it empowers importing countries to regulateany environmental and human health risks that might apply to LMOs within their own domestic conditions, facilitatedby AIA and other relevant procedures. On the other hand, the BSP also obligates the importing countries to a timelydecision carried out “in a scientifically sound manner” (Article 15). Since only 19 countries in the world have establishedregulatory processes that have approved any LMOs, building the capacity to effectively regulate and approve LMOsacross all importing countries could prove challenging, at least in the short run.
If implementation of the BSP resulted in increased exchange of scientific information, regulatory transparency, andimproved coordination and speed in the global regulatory infrastructure, unapproved events would prove to be anon-issue. If however, implementation resulted in a highly segmented system with differential lists of unapprovedevents across various countries, the impacts would be pervasive. The existing global crop marketing chain cannotserve such a highly segmented global market and it is unlikely that it can develop relevant capabilities in the foreseeablefuture. Major exporters would most likely avoid import markets with long lists of unapproved events – in all likelihoodthose with the weakest regulatory infrastructures – leading to diminishing quality and higher costs of grain andoilseed imports.
VI. Who Pays?
Markets for commodities, feed ingredients, animal products, and various processed foods are vertically and horizontallylinked within any given country but also with markets in other countries. Local institutions, policies, technologies andother idiosyncratic factors make the links among markets more complex and unpredictable. The degree of vertical
13 There are small amounts of non-LMO corn and soybeans that are traded under IP protocols to countries such as South Korea, Australia,New Zealand, China and others. However, such amounts are generally very small.14 Current AP thresholds for non-LMO markets are 5 percent in Japan and 0.9 percent in the EU.
22

integration and market power also complicates insights on expected market outcomes. Under these conditions, fullyanticipating the trade and welfare impacts from BSP compliance costs on selected market segments is complicated.It is similarly difficult to fully evaluate the allocation of compliance costs of the BSP in the absence of a formal trademodel.
Nevertheless, some useful initial observations can be made. As noted earlier, most key exporters of grains andoilseeds are LMO users. In their domestic markets, LMOs are equivalent by regulation to conventional crops andtheir use implies no incremental handling costs. In export markets, LMO cargoes would incur compliance costsassociated with the BSP but these costs would be similar across all exporting countries. Under these conditions, thecompliance costs associated with the implementation of the BSP, much like with IP costs in non-LMO segments, willbecome “costs of selling” in export markets, meaning that importers will pay the price.
It is therefore interesting to examine the spatial allocation of key grain and oilseed imports. Countries with largeimport volumes – especially those that are signatories and have ratified the BSP – will likely incur a large share of thecompliance costs. As Table 10 indicates, the top grain and oilseed importers are developed and large developingcountries with Japan, South Korea, China, and Mexico leading the group. Most of the largest importing countrieshave signed and ratified the BSP and would end up paying compliance costs that are proportional to their importshares. Among the top commodity importers, China and South Korea have signed, but have not yet ratified the BSP.Japan and Mexico are full members and hence they could end up shouldering a large share of the compliance costs.
On a per unit basis, however, small developing countries will likely incur disproportionately higher costs. As Table 11illustrates, the average cargo size shipped from the United States to such destinations is typically significantlysmaller than that of cargoes sent to many developed countries and large developing countries.15 Since the pervessel compliance costs are more or less fixed, smaller cargoes destined for developing country markets will resultin higher per unit costs.
VII. Summary and ConclusionsIt should be clear from the foregoing analysis that the broad scope of the BSP would influence the level and distributionof the compliance costs borne by the global food system. In particular:
• Compliance costs will be significant and will be spread across the global food system. While it is difficult toanticipate how such compliance costs will be distributed, it is reasonable to expect that the majority ofcompliance costs will be borne by the importing countries.
• Compliance costs will increase with strict identification and documentation standards (e.g. they increaseexponentially as the requirements become more demanding or as the AP thresholds become lower).
• Compliance costs are unevenly distributed across the supply chain. Large commodity importers will likelybear a substantial share of the compliance costs. Importers with low volumes and inefficient infrastructurewill likely bear disproportionately higher unit costs.
• Compliance costs will be unevenly distributed across commodities. The potential impacts from supplyresponses across commodities are complex and difficult to anticipate. While supply increases in non-LMOcrops might be expected, land constraints, processing infrastructure, and consumption patterns can mutesuch potential supply responses.
• Compliance costs will be unequally distributed among various importers and also among different exporters,depending both on their size in the marketplace, but also on the relative sophistication of their agriculturalinfrastructure.
The scope of BSP will also influence the amount of incremental risks borne by various actors in the system. Specifically:
• Test-driven enforcement creates incremental risks. Adoption of testing standards decreases but does noteliminate incremental risks, because of sampling variance and testing errors.
• Incremental risks are difficult to estimate and hence cannot be easily priced and insured.
15 Exports from other major exporters (Brazil and Canada) and other crops (e.g. wheat) were examined and showed similarly small averagecargo sizes being shipped to small developing countries. Hence the data presented in table 11 are representative.
23

Table 10 Top Crop Importing Countries & BSP Membership(In metric tons)
Source FAO
Importing Country Maize Soybeans Wheat Total Signed BSP?
Ratified BSP?
Japan 16321093 4935444 5692039 26948576 Y China 5148023 15115128 1734458 21997608 Y Korea, Republic
of 8797167 1415089 3745042 13957298 Y Mexico 5843470 4431094 3262794 13537357 Y Spain 3119884 3290183 5105067 11515134 Y Netherlands 1984993 5918696 3490411 11394100 Y Egypt 4758902 335994 4993845 10088740 Y Italy 685158 1110760 7621149 9417067 Y Brazil 484809 947394 6794286 8226488 Y Iran, Islamic Rep
of 1510498 425563 5280467 7216527 Y Algeria 1778302 5 5268020 7046326 Y Germany 796847 4459907 1180591 6437345 Y Indonesia 1094930 1250836 3512129 5857895 Y Y Belgium 610703 1574064 3374756 5559523 Y Morocco 1024066 287022 3346943 4658030 Y Malaysia 2191313 667793 1653052 4512158 Y Canada 3632053 752393 67407 4451852 Y Portugal 1175828 1090797 1608660 3875285 Y United Kingdom 1506567 930416 1289610 3726593 Y Colombia 1934334 530589 1253906 3718828 Y Philippines 225488 290057 2995483 3511028 Y Israel 950094 652582 1429153 3031829 Tunisia 847592 9 1635013 2482613 Y Peru 893455 68449 1411632 2373536 Y United States of
America 255179 110823 2007191 2373193 Nigeria 24311 1 2294020 2318331 Y Bangladesh 223857 0 2014391 2238248 Y Turkey 857570 466875 722297 2046741 Y Venezuela,
Bolivia Rep of 638602 89783 1211889 1940274 Y Greece 547785 355274 1033072 1936130 Y Tanzania, United
Rep of 54626 1445891 385937 1886453 Y Yemen 258423 52094 1461585 1772101 France 263993 992649 505701 1762343 Y Chile 1147443 124942 265006 1537391 Y United Arab Emirates 470794 15148 891558 1377499 Dominican Republic 1034120 120 338038 1372277 Saudi Arabia 1124235 1181 1335 1126751 South Africa 576473 23513 467908 1067894 Y Korea, Dem People's Rep 467211 46900 550000 1064111 Y
World 84955692 57064364 116105862 258125917
24

Table 11 Average Cargo Sizes of US Exports by Destination(In metric tons)
Author’s calculations from 2003 export data
Incremental risks and compliance costs resulting from BSP implementation are not static; they will increase withchanging market conditions including:
• Increasing adoption of LMO crops (this is very likely, based on trend)
• Increasing number of LMO events/traits (this is very likely, also based on trend)
• Increasing number of LMO crops (as mentioned earlier China plans to commercialize LMO wheat and ricein the next few years)
• Improvements in testing technology (very likely)
Incremental risks and compliance costs associated with the BSP will change the incentive structure in the supplychain. Some potential consequences include:
• Changes in the composition of trade away from raw commodities to more highly processed products (i.e.not LMOs), such as soybean meal and soybean oil. Countries with processing facilities located near majorproduction areas would benefit from such potential impacts while others with processing capacity that isdependent on imported commodities would lose.
• Increased vertical integration throughout the marketing chain. In the presence of increased uncertainty thatcannot be easily mitigated or insured, risk-averse exporters might opt to control their cargoes from plantingall the way to the point of export.
The scope of these concerns and the potential for real and significant costs to be imposed on food importers arguesthat the various implementation options being considered under the Protocol need to be assessed and understoodbefore implementation decisions are taken so that the objectives of the BSP can be met in the most efficient andleast costly manner possible.
Maize Soybeans
TOP 10 Average
cargo Average
Size of Cargo
EGYPT 49338 THAILAND 51920 CHINA 48925 CHINA 51483 S. KOREA 44973 SPAIN 49391
INDONESIA 44404 BELGIUM 41344 TURKEY 40430 S KOREA 40189 SYRIA 34183 INDONESIA 39532 JAPAN 31955 PORTUGAL 37577 MOROCCO 28135 NETHERLANDS 36253 LEBANON 26908 MALAYSIA 28183
S ARABIA 25468 MOROCCO 24828
BOTTOM 10 EL SALVADOR 9700 PHILIPPINES 12268 CHILE 9596 CUBA 12216 HONDURA 8615 TRINIDAD 7826
MOZAMBIQUE 6657 COSTA RICA 6893 TRINIDAD 5995 COLOMBIA 6143 JAMAICA 5933 NIGERIA 4686 NICARAGUA 4774 JAMAICA 3124 BARBADOES 4530 GUATEMALA 3080 GHANA 4492 BARBADOS 2822
SURINAM 1975 NICARAGUA 1810
25

References
Alexander, C., J. Fernado-Cornejo, and R. Goodhue “Production of Value-Added Crops: The Case of High Oil Corn,Agricultural Outlook, October 2001, pp. 23-25
Borchgrave, R., N. Kalaitzandonakes, A. Galvao Gomes, H. de Frahan “Economics of Non-GM Food/FeedSupply Chains in Europe” AgraEurope, London, UK, May 2003.
Bullock, D., M. Desquilbet, E. Nitsi “The Economics of Non-GMO Segregation and Identity Preservation” PresentedPaper, AAEA 2000 annual meetings, Tampa FL, August 2000.
Canada Grains Council “Additional Transportation and Handling Costs for Identity Preservation of Bulk GrainShipments in Canada” Unpublished Report, August 2003.
de Greef, W. “The Biosafety Protocol and the Future of Agbiotech “ Nature Biotechnology, 22, 811-12, 2004
Food and Agricultural Organization of the UN (FAO). 2004. FAOSTAT Statistics Database.
Hermann, Boland and Heishman “Economic Feasibility of Wheat Segregation at Country Elevators” ManhattanKansas, Kansas State University, 1999
Huygen, I., Veeman, M., & Lerohl, M.. Cost implications of alternative GM tolerance levels: Non-geneticallymodified wheat in western Canada. AgBioForum, 6(4), 169-177, 2004. Available on the World Wide Web: http://www.agbioforum.org.
Hurburgh, C.R. “Identification and Segregation of High-value Soybeans at a Country Elevator.” Journal of AmericanOil-Chemists Society, 71, 1073-1078, 1994.
James, Clive. 2004. Global Status of Commercialized Transgenic Crops: 2003. International Service for the Acquisitionof Agri-biotech Applications (ISAAA) Brief #30-2003.
Kalaitzandonakes, N. (ed.). Economic and Environmental Impacts of Agbiotech: A Global Perspective, Kluwer-Plenum Academic Publishers, New York, 2003.
Kalaitzandonakes, N., and A. Magnier “Biotech Labeling Standards and Compliance Costs in Seed Production”Choices 2004
Kalaitzandonakes N. “Another look at Biotech Regulation” Regulation 26(1): 44-50, 2004
Kalaitzandonakes, N. R. Maltsbarger, and J Barnes. “The Costs of Identity Preservation in the Global FoodSystem” Canadian Journal of Agricultural Economics 49: 605-615, 2001.
Lin, W, G. Price, and E. Allen “”Impacts on the U.S. Corn Market and World Trade” USDA’s Feed Yearbook, pages40-48, 2001
Mackenzie, Burhenne-Guilmin, et al., An Explanatory Guide to the Cartagena Protocol on Biosafety GlandSwitzerland, IUCN, 2003.
Maltsbarger, R. and N. Kalaitzandonakes “The Hidden Costs of Identity Preservation” Feedstuffs, 72(36): 1-2,2000.
National Economic Research Associates (N/E/R/A) Economic Appraisal of Options for Extension of Legislation onGM Labeling The Food Standards Agency, London United Kingdom, (May 2001).
U.S. Dept of Agriculture, Economic Research Service (ERS). 2004. Production Supply & Distribution (PS&D) Database,Available on the WWW at: http://www.ers.usda.gov/data/psd/
U.S. Dept. of Agriculture, National Agricultural Statistics Service (NASS), 2000-2004 Acreage.
26

About the IPC
The International Food & Agricultural Trade Policy Council (IPC) convenes high-ranking government officials, farmleaders, agribusiness executives and agricultural trade experts from around the world and throughout the food chain tobuild consensus on practical solutions to food and agricultural trade problems.
An independent group of leaders in food and agriculture from industrialized, developing and least developed countries,the IPC’s thirty-six members are chosen to ensure the Council’s credible and impartial approach. Members are influentialleaders with extensive experience in farming, agribusiness, government and academia.
The IPC’s MembersIPC members represent the geographic diversity of the global food system, and the entire food chain from producer to consumer. IPC membersare influential and experienced leaders in agricultural trade policy who are committed to finding solutions to global food and agricultural tradechallenges.
Robert L. Thompson (Chair), United States
Allen Andreas, United StatesBernard Auxenfans, FranceAndrew Burke, United StatesBrian Chamberlin, New ZealandCsàba Csàki, HungaryDevi Dayal, IndiaPedro de Camargo Neto, BrazilLuis de la Calle, MexicoCal Dooley, United StatesFranz Fischler, AustriaMichael Gifford, CanadaAhmed Goueli, Egypt
Dale Hathaway, United StatesHuang Jikun, ChinaHeinz Imhof, SwitzerlandHans Jöhr, SwitzerlandRob Johnson, United StatesTimothy Josling, United KingdomGuy Legras, FranceRolf Moehler, BelgiumRaul Montemayor, PhilippinesDonald Nelson, United StatesJoe O’Mara, United StatesNèstor Osorio, Colombia
Michel Petit, FrancePer Pinstrup-Andersen, DenmarkHenry Plumb, United KingdomMarcelo Regunaga, ArgentinaEugenia Serova, RussiaHiroshi Shiraiwa, JapanJiro Shiwaku, JapanJim Starkey, United StatesJerry Steiner, United StatesAnthony Wylie, ChileAjay Vashee, ZambiaJorge Zorreguieta, Argentina
Piet Bukman (Vice-Chair), The Netherlands