Embed Size (px)
Citation preview

The Journal of Neuroscience, February 1988, 8(2): 882-700
The Ontogeny of Inhibition and Excitation in the Gerbil Lateral Superior Olive
Dan H. Sanes and E. W RubeP
Departments of Otolaryngology and Physiology, University of Virginia Medical Center, Charlottesville, Virginia 22908
While the development of excitatory responses has been the focus of considerable research, the ontogeny of inhibi- tory connections has received relatively little attention.The lateral superior olive (LSO), an auditory nucleus in the ventral brain stem, is a favorable system in which to compare the maturation of an inhibitory and an excitatory input. Neurons in the LSO are excited by stimuli delivered to the ipsilateral ear and inhibited by similar stimuli to the contralateral ear.
Single-neuron recordings were made to characterize tone- evoked responses at the onset of hearing and in adult Mon- golian gerbils. The results indicated that frequency selec- tivity was significantly poorer in young than adult animals. In several cases, neurons within the same animal were found to have disparate tuning properties, such that one of the units had “adult-like” tuning, while the other was much more broadly tuned. No difference existed between excitatory and inhibitory tuning within any age group. The degree to which the excitatory and inhibitory characteristic frequencies of an LSO neuron were correlated was used as a measure of tono- topic map alignment. A significant improvement of matching was seen with increasing age. A comparison of excitatory and inhibitory thresholds indicated that the inhibitory system was relatively more efficacious in young than adult animals.
The ability of LSO neurons to respond to interaural inten- sity differences, the binaural parameter to which they are sensitive, indicated 3 differences between adult and young animals: the dynamic range was smaller, the slope was shal- lower, and the sample of neurons encoded a constrained range of interaural intensity difference values. We conclude that the maturation of the inhibitory and excitatory systems are nearly identical.
Whereas the developmental characteristics of excitatory con- nections have been studied extensively in sensory and motor systems, relatively few investigations have carefully examined the ontogeny of inhibitory connections. Several investigators
Received Apr. 16, 1987; revised Aug. 10, 1987; accepted Aug. 12, 1987. Suooorted .bv Grant NS 15478 from the NIH and funds from the Lions of
Virg%ia Hearing Foundation, and a Postdoctoral Fellowship NS 07462 to D.H.S. We wish to thank P. Brill and S. Donaldson for design and implementation of computer software, D. Born for technical advice, L. Kitzes for suggesting the approach to LSO, Lynne Olsho for help with statistical analyses, and D. Webster for suggesting the use of chloral hydrate in young animals. Knowles, Inc. kindly provided us with miniature microphones for calibration. These results were pre- sented at the Society for Neuroscience, 1986.
Correspondence should be addressed to.Dan H. Sanes, Department of Otolar- yngology, Physiology and Biophysics, NYU Medical Center, 550 First Avenue, New York, NY 10016.
a Present address: Department of Otolaryngology RL-30, University of Wash- ington, Seattle, WA 98 195.
Copyright 0 1988 Society for Neuroscience 0270-6474/88/020682-I9.$02.00/0
have noted delayed functional development (Perrson, 1973; Armstrong-James, 1975; Saito, 1979; Schwartzkroin, 1982; Ko- matsu, 1983; Berardi and Morrone, 1984; Schwab et al., 1984; Shatz and Kirkwood, 1984; Gardette et al., 1985; Fitzgerald and Koltzenberg, 1986) while other reports have emphasized the prominence of inhibition early in development (Purpura et al., 1965, 1968; Crain and Bomstein, 1974; Wilson and Leon, 1986). Several developmental properties that have received extensive attention with regard to excitatory connections remain entirely unaddressed for inhibitory systems. Examples include the initial overproliferation of functional contacts (Redfem, 1970; Licht- man, 1977; Mariani and Changeux, 1981; Jackson and Parks, 1982) the ontogeny of functional and anatomical specificity, and the role of inhibitory afferent connections for maintaining the integrity of postsynaptic neurons. Beyond its descriptive importance, a comprehensive comparison of inhibitory and ex- citatory ontogeny will allow us to critically examine the theo- retical formulations (LeVay et al., 1975; Willshaw and von der Marlsburg, 1976; Law and Constantine-Paton, 198 1) and ex- perimental observations (Wiesel and Hubel, 1965; Hirsch and Spinelli, 1970; Olsen and Pettigrew, 1974; Keating and Feld- man, 1975; Singer, 1977; Pearson and Murphy, 1983; Sanes and Constantine-Paton, 1985a; Dubin et al., 1986) that have directly implicated excitatory potentials in synaptogenetic events.
A major difficulty when studying the development of inhib- itory connections is that the neurons of origin are often intrinsic to the postsynaptic nucleus (Eccles, 1969). These intemeurons are ill-suited for anatomical identification, selective stimulation, or experimental manipulation. The mammalian superior oli- vary complex provides a favorable system in which to explore the ontogeny of an inhibitory network. Neurons in the LSO are excited by acoustic stimuli presented to the ipsilateral ear and inhibited by contralateral stimulation (Galambos et al., 1959; Boudreau and Tsuchitani, 1968, 1970). The ipsilateral excita- tory pathway originates in the anteroventral cochlear nucleus (AVCN) (Harrison and Warr, 1962; Wart-, 1966, 1982; van Noort, 1969; Glendenning et al., 1985; Cant and Casseday, 1986) and terminates in the LSO tonotopically (Tsuchitani and Boudreau, 1966). The contralateral inhibitory pathway also originates in the AVCN. These neurons project to the contra- lateral medial nucleus of the trapezoid body (MNTB) (Held, 1893; Ramon y Cajal, 1909; Morest, 1968; Tolbert et al., 1982; Glendenning et al., 1985). The efferent projection of MNTB neurons provides inhibition to the LSO (Rasmussen, 1946; Browner and Webster, 1975; Elverland, 1978; Glendenning et al., 1985; Spangler et al., 1985) and is also tonotopically orga- nized (Boudreau and Tsuchitani, 1970). LSO neurons are ex- quisitely sensitive to sound intensity differences between the 2 ears (Boudreau and Tsuchitani, 1968, 1970; Caird and Klinke,

The Journal of Neuroscience, February 1988, 8(2) 663
1983; Hamischfeger et al., 1985). A sound source emanating from the ipsilateral field would be expected to evoke a greater response from the excitatory system than the inhibitory system because of the decrement in sound level across the head. The graphic representation of this property plots discharge rate against the difference in sound level at the 2 ears and is called an in- teraural intensity dijkrence (IID) function. Therefore, inhibitory neurons to the LSO can be consistently identified, they project topographically as most excitatory systems do, they can be stim- ulated independently of an excitatory system to the same post- synaptic neurons, and they contribute to a neural response prop- erty with a likely perceptual correlate (i.e., sound localization).
In the present study we examined the development of stimulus coding by LSO neurons in the Mongolian gerbil. A small number of reports have previously addressed the maturation of auditory function in this species. Most notable are a pair of studies by Woolf and Ryan (1984, 1985) that describe developmental changes in response properties at the level of the cochlea and the ventral cochlear nucleus. The gerbil ear begins to transduce airborne sound during the second postnatal week; both the co- chlea and cochlear nucleus exhibit sound-evoked responses at 12 d postpartum (Finck et al., 1972; Woolf and Ryan, 1984, 1985). Initially, the range of frequencies is limited to low and midrange tones, this being more obvious for single neuron re- sponses (Woolf and Ryan, 1985) than for the cochlea (Finck et al., 1972; Woolf and Ryan, 1984). One explanation for this progression is that the cochlea undergoes a change in its spatial frequency map such that a physical place along the basilar mem- brane transduces successively higher frequencies with age (Lippe and Rubel, 1983, 1985; Rubel and Ryals, 1983; Harris and Dallos, 1984; Ryals and Rubel, 1985; Sanes et al., unpublished observations).
The cochlea and cochlear nucleus also share similar matu- rational timing with regard to increases in dynamic range and maximum response amplitude, which continue beyond 30 d (Woolf and Ryan, 1984, 1985). An evaluation of frequency selectivity at the level of the cochlear nucleus indicates that while tuning is poorer at hearing onset, this may be less pro- nounced for neurons encoding frequencies above 4 kHz than below (Woolf and Ryan, 1985). These findings, in addition to a pair of studies on the development of deoxyglucose metabo- lism in gerbil brain-stem auditory structures (Ryan et al., 1982, 1985), suggest that an adultlike state is reached between days 16 and 30, depending on the parameter being examined.
In the present report we describe the responses of single neu- rons in the gerbil LSO to pure tone stimuli in adult animals and in animals near the age of hearing onset. Quantitative compar- ison of the frequency selectivity exhibited by inhibitory and excitatory inputs to these cells were made along with an eval- uation of the relative efficacies of these pathways. The degree of frequency matching between the 2 systems was ascertained by comparing the characteristic excitatory and inhibitory fre- quencies to one another. Finally, the response of neurons to IIDs was examined as a function of age. Our results indicated that the maturation of excitatory and inhibitory function was synchronous. One possible exception was a dynamic change in the relative efficacy of the inhibitory input.
Materials and Methods Animal preparation. All gerbils (Meriones unguiculatus) used in this study were reared in our breeding colony to postnatal day 13 (n = 24), 14 (n = 19) 15 (n = 15), 16 (n = 13), or 84-112 (n = 25). The colony
2 loo-
z 80:
2 60-
cn 40-
20-
b I I 1 4 0 5 IO I5 20
FREQUENCY (kHz1
Figure 1. Representative calibration curve for the right earphone. The maximum output of the earphone from one experiment in an adult animal is shown. The system was capable of producing over 130 dB SPL for frequencies up to 5 kHz, and between 100-l 20 dB SPL above this point. The calibration curves were relatively reproducible from animal to animal.
originated from commercially obtained breeding pairs (Tumblebrook Farms). Chlorprothixene (7 mg/kg, i.p.) or ketamine hydrochloride (15- 40 mg/kg, i.p.) was given as a pre-anesthetic tranquilizer. Animals were then anesthetized with sodium pentobarbitol (40-55 mg/kg. in.) or chloral hydrate (350-400 mg/kg, i.p.) and given a single in&&on of atropine sulfate (0.08 mdkg, i.m.). Animals 13-16 d ofage were alwavs given chloral hydrate as-the anesthetic. Supplemental doses of both the tranquilizer and the barbiturate were administered as needed during the course of the experiment to eliminate movement and nociceptive re- flexes. Adult animals were tracheotomized to prevent aspiration, but this was not necessary for the younger animals.
All animals were transferred to a custom-designed holder with bite- bar and head plate that allowed the head to be positioned at a 55” angle (i.e., tilted forward). A heating pad underneath the animal was auto- matically regulated based on core body temperature (Davis Servo Heat- er). Surgery was carried out at approximately 35°C; physiological re- cording was performed while body temperature was maintained at 37.5 + 0.5”C. The animal’s head was immobilized, after reflecting the skin and soft tissue overlying the dorsal cranium, by affixing the skull to the head plate with cyanoacrylic glue (Aron Alpha).
The pinnae, skin, soft tissue, and cartilage surrounding the bony ex- ternal meati were carefully removed. We checked the external meati for debris and confirmed that the typmanic membrane was intact and in excellent condition. The neck musculature, inserting along the dorsal surface below the bregma suture, was resected to expose the foramen magnum. Just prior to electrophysiological recording, the dura mater overlying the foramen was torn and a small amount of bone was re- moved laterally, allowing full access to the dorsal surface of the brain stem.
Stimulus delivery and calibration. Sound stimuli were presented bin- aurally through a calibrated, closed delivery system. Sound delivery tubes were positioned over the bony external meati and sealed to the sides of the head with a 4% agar solution. Sound was generated by matched Beyer DT-48 (50 Q) earphones housed in aluminum casings that tapered into the delivery tubes. The sound pressure level at the tip of the delivery tube was measured with a calibrated probe tube inserted down the delivery tube center and connected to a Knowles microphone (model CA 183 1). The system was calibrated from 40 to 20,000 Hz and produced sounds with a peak amplitude in the range 90-140 dB SPL (Fig. 1).
Prior to the beginning of each experiment, both earphones were cal- ibrated by monitoring the output of the probe tube microphones with a narrowlband spectrum analyzer (Bruel and Kjaer, type 2031). This information was transferred to and stored in a PDP 1 l/23 combmet for use in automated stimulus control. The Knowles microphones were previously calibrated with a Bruel and Kjaer condenser microphone (type 26 19 preamp, type 4 134 cartridge) in a closed coupler.
Sine waves, generated by an arbitrary function generator (Wavetek model 134 and Krohn-Hite model 5910 B), were first passed through wave-shaping switches (Wisconsin) and then led into custom-designed

664 Sanes and Rubel * Development of Tuning in LSO
digital attenuators (RD Systems). The stimulus duration and repetition rates were controlled with a custom-designed gate (G.W. Instruments). The stimulus frequency and sound level were controlled independently to each ear. The tonal stimuli were presented for 50 msec with a 4 msec rise/fall and a repetition rate of I-5/set, depending on the animal’s age. White noise was produced by a Grason-Stadler noise generator (model 901B).
Electrophysiological procedures. Extracellular single-neuron record- ings were obtained with glass micropipettes (5-l 5 MO) filled with 2 M
NaCl and 1% Fast greenFCF dye. The electrodes were mounted on a remote-controlled microdrive (Mike Walsh Electronics, model D-101) and positioned such that they ‘were at a 75” angle with respect to the physiology table. This angle, in conjunction with the angle at which the animal’s head was placed, allowed for maximal rostrocaudal access to the LSO in any single electrode penetration. The electrical signal was amplified (Grass Pl5D or WPI DAM-SA), bandpass-filtered at 300 and 5000 Hz (Krohn-Hite 355OR). disulaved on an oscilloscope (Tektronix 5 103N), and monitored with’an audib speaker (Grass AMI). The am- plified unit activity was also led to a window discriminator (WPI model 12 1) whose TTL output pulses were used for on-line data analysis.
Physiological recordings were performed inside a double-walled, sound- attenuated chamber (Industrial Acoustics Corporation). The electrode was advanced from outside the chamber while bursts of white noise were presented as a search stimulus. When sound-evoked neural activity was encountered, we determined which of the superior olivary nuclei had been entered. For example, if multi- or single-unit activity was driven exclusively by contralateral stimulation, it was assumed that the recording site was in MNTB, and the electrode was moved laterally prior to the next pass. Only single units with signal-to-noise ratios of 3: 1 or greater were analyzed in the present study.
After a unit had been isolated and determined to be ipsilaterally excited and contralaterally inhibited by sound (EI neuron), a fairly stan- dard stimulus paradigm was presented. The approximate excitatory frequency range and approximate threshold were first manually deter- mined. Then under computer control, the discharge rate was monitored as progressively higher-frequency probes were presented at a single in- tensity. At the end of each frequency “sweep,” the sound pressure was incremented by 5 or 10 dB and the procedure repeated. Each frequency- intensity pair was presented 5-9 times and the discharge rates averaged. In this way, the unit’s excitatory response area was determined.
Spontaneous activity was severely depressed, as has been noted by other authors (Tsuchitani and Boudreau, 1966; Hamischfeger et al., 1985) presumably due to anesthetic state (Brownell et al., 1979). In order to ascertain the inhibitory response area, a consistent discharge rate was evoked with a single frequency and intensity presented to the ipsilateral ear. Pilot data indicated that neither the frequency nor the intensity of this probe stimulus altered the general characteristics of an inhibitory response area. On the few occasions when significant spon- taneous activity was present, and we could assay inhibition in the ab- sence of excitatory stimulation, the response area was identical to that obtained in the presence of an excitatory stimulus. Therefore, we used an ipsilateral stimulus frequency set at the excitatory characteristic fre- quency and 5-35 dB above the neuron’s threshold. The evoked discharge rates were found to be quite consistent after the first 5-10 presentations, when some adaptation or habituation was seen. The inhibitory response area was documented with the same stimulus paradigm used for the excitatory pathway. An ascending progression of frequencies was pre- sented at a fixed sound level and then repeated after a 5 or 10 dB increment in sound level. The on-line analysis also consisted of post- stimulus time histogram (PSTH) construction.
The threshold of a neuron was defined as the lowest intensity at which any frequency elicited a reliable increase or decrease in discharge rate (i.e., a change of > 10 spikes/set). The characteristic frequency was defined as that frequency which elicited the greatest change in discharge rate at threshold. The measure of tuning (frequency selectivity) was based on the frequency bandwidth at 5 and 15 dB above the threshold sound level. It should also be noted that rate-intensity (R-I) and IID functions could be extracted from the response areas. That is, at any given frequency, the discharge rate associated with each sound pressure level was obtained. For IID functions, the IID was computed using the constant sound level delivered to the ipsilateral ear. Statistical analyses were done by one-way analysis of variance followed by pairwise com- parisons.
To permit the unambiguous identification of each recording site, Fast green was iontophoretically ejected (Grass SD9 stimulator) from the
electrode (3-20 PA, 5-20 min, continuous cathodal). The tonotopic map constructed from these data, and its ontogeny, are considered in a sep- arate report (Sanes et al., unpublished observations). Only neurons iso- lated within the anatomical boundaries of the LSO are included in the present study. EI neurons were rarely located outside of the LSO bound- aries.
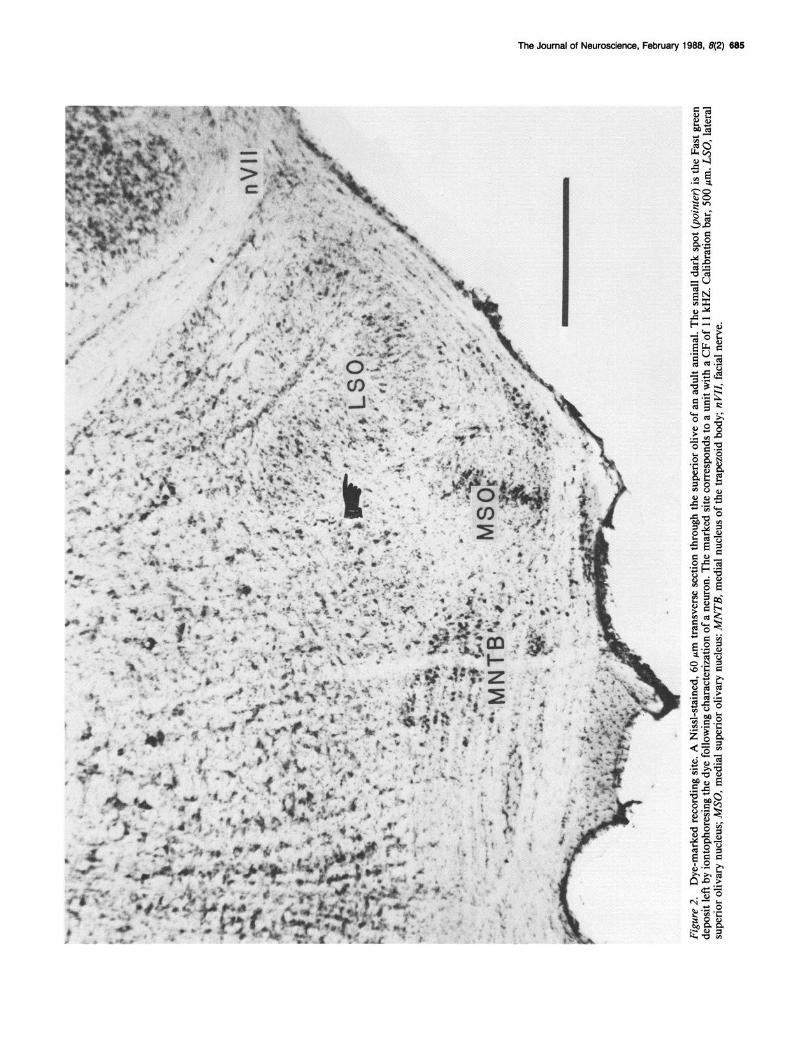
Histologicalprocedures. At the end of each experiment, the gerbil was given a lethal injection of sodium pentobarbital and perfused through the heart with 10% buffered formalin (pH 7.4). The brain was removed, immersed in the same solution for l-7 d, blocked, and then embedded in Frank-Harris medium. Serial frozen sections were cut at 60 pm and mounted on gelatin-subbed glass slides. The sections were allowed to drv ovemiaht before being raoidlv stained in a 0.25% thionin solution. All Fast green dye marks were localized prior to Nissl staining because of potential loss of the dye due to water solubility. An example of dye- marked recording site is shown in Figure 2.
Results General characteristics The present data set draws upon 78 units from 13-14 d animals, 70 units from 15-l 6 d animals, and 85 units from adult animals (i.e., L 12 weeks). The animal body weights (8 + SD) for these groups at the time of recording were 11.9 + 1.2, 13.1 + 1.4, and 76.9 f 9.9 gm, respectively.
Several basic differences between neurons in young and adult animals were apparent. Figure 3A shows the average latency of the first discharge evoked by a stimulus at characteristic fre- quency (CF) delivered at lo-20 dB above threshold to the ip- silateral ear. The average values (*SD) were 10.9 + 3.6 msec at 13/14 d, 8.5 + 2.8 msec at 15-16 d, and 4.7 + 1.6 msec for adult animals. Spontaneous activity was low (i.e., l-5 dis- charges/set) or absent from the vast majority of EI units at all ages, but inhibitory sidebands could be observed when activity was present. Figure 3B shows the maximum discharge rates evoked by an excitatory stimulus at CF. The rates increased dramatically between 15-16 d and adult from 116 -+ 54 dis- charges/set (8 f SD) to 35 1 f 144 discharges/set, respectively. The amplitude and duration of the extracellularly recorded ac- tion potentials were also monitored (Fig. 3, C, D). The mean peak-to-peak amplitude of the biphasic discharges did not differ significantly between groups (F2,80 = 2.9, p > 0.05). The mean duration of these discharges, measured from the most negative to the most positive voltage deviation, decreased with age: 0.42 msec in 13-14 d animals, 0.36 msec in 15-16 d animals, and 0.26 msec in adults (F2,82 = 25.76, p < 0.001).
Representative PSTHs to increasing intensity at CF are shown for the 3 age groups in Figure 4. The proportion of primary, onset, and other response patterns was not quantified because of the limited sample sizes, and in some experiments, the res- olution of the histograms did not allow us to discern their fine structure. Our subjective impression was that the younger an- imals exhibited a preponderance of onset responses, while adult animals showed “primary-like” or “chopper” responses. The bottom-most PSTH in each column of Figure 4 was obtained with stimuli presented to both ears, thus introducing the effects of inhibition. It can be seen that the inhibitory influence covers the entire stimulus time window but is less effective at the very onset. A spontaneous rhythmic bursting activity that continued during stimulation was occasionally present in 13-14 d animals, but this was not fully characterized.
Excitatory and inhibitory response areas The most general feature of inhibitory and excitatory response areas was the degree of matching in the frequency domain. Not
The Journal of Neuroscience, February 1988, 8(2) 685

666 Sanes and Rubel - Development of Tuning in LSO
Al LATENCY
C , SPIKE AMPLITUDE
Age Group
Bl MAXIMUM RATE
50
"400
: 1300
2 2200
z
Ld
100
D SPIKE DURATION
Age Group
Figure 3. Comparison of discharge latency, maximum rate, action potential amplitude, and duration for 3 age groups. A, Latency of first discharge to CF at 15-25 dB above threshold, B, Maximum discharge rate to CF. C, Amplitude of the extracellularly recorded action potential measured from negative- to positive-going peak. D, Duration of the extracellularly recorded action potential as measured from negative- to positive-going peak.
only were the characteristic inhibitory and excitatory frequen- cies well matched (see below), but the entire range of effective stimuli corresponded at all ages. Representative response areas from 2 neurons are shown for each age group in Figure 5. The examples were chosen to illustrate that the best response areas from 13-l 6 d animals closely resembled the form of those from adult animals.
In order to gain a more objective impression of the differences and similarities in the age groups, several properties of each neuron’s excitatory and inhibitory responses were quantified. These included thresholds, characteristic frequencies, and tun- ing. In addition, excitatory R-I functions and IIDs were com- pared across age groups.
Frequency selectivity
The frequency bandwiths at 5 and 15 dB above threshold for each inhibitory and excitatory response area were converted to a value independent of CF (Calford et al., 1983). This involved a square-root transformation such that the square root of the lower frequency limit (F,) was subtracted from the square root of the higher frequency limit (FJ. The values generated range between 0 and 2, with larger values representing broadly tuned neurons.
A plot of square-root transformation values at 5 dB above threshold for adult animals is shown in Figure 6 (A and D). The range of values appeared fairly uniform across frequency, the mean for the excitatory bandwith (6A) being 0.46 + 0.16 (8 f SD), and the mean for the inhibitory bandwidth (60) being 0.53 + 0.17. If one divides the population in Figure 6A into 2 groups, those with CF above 4 kHz and those with CF below 4 kHz, then the mean values were 0.49 +- 0.18 and 0.41 f 0.13,
respectively. These were not significantly different (F,,6, = 4.30, p > 0.05), demonstrating the relative utility of the square-root transformation in making developmental comparisons.
The values from 15-16 d animals (Fig. 6, B, E) exhibited complete overlap with adult values. However, there appeared to be several neurons with broader tuning than any of those observed in adults (e.g., values > 1.0). The mean values for excitatory and inhibitory tuning at 15-16 d were 0.59 f 0.28 and 0.64 & 0.28, respectively. At 13-14 d the majority of neu- rons displayed tuning characteristics that were considerably broader than those of adult animals (Fig. 6, C, F). The mean values for excitatory and inhibitory tuning were 0.87 + 0.36 and 0.80 -t 0.4 1, respectively. Although the values for excitatory and inhibitory tuning did not differ from each other within any age group (t tests; p’s > 0.05), there were significant differences between age groups. The tuning of neurons in 13-l 4 d animals was broader than in 15-l 6 d and adult groups, and units in the 15-16 d group were broader than those of adults (F2,202 = 38.70, p < 0.001).
An identical analysis was performed on frequency bandwidths at 15 dB above threshold (Fig. 7). The frequency tuning for neurons of 15-l 6 d animals overlapped that seen in adults, yet there were several neurons with broader frequency tuning (Fig. 7, B, E). The 13-l 4 d group exhibited much broader excitatory and inhibitory tuning. Again, there were no reliable differences between the excitatory and inhibitory bandwidths at any age (t tests; p’s > 0.05). However, the frequency tuning was signifi- cantly sharper in the 15-16 d group than the 13-14 d group, and sharper in the adult group than in the 15-l 6 d group (F2,,89 = 54.82, p < 0.001).
Although the comparison of populations gives some indica- tion of changes in tuning during development, it was instructive to describe the relationship between excitatory and inhibitory tuning for the same neuron and then to compare the frequency selectivity between neurons recorded within an animal. In Fig- ure 8, each neuron’s excitatory and inhibitory tuning at 15 dB above threshold are plotted, illustrating that the tuning of the 2 pathways was as well correlated in young animals as in adult animals. A comparison of the tuning characteristics within an- imals, where more than one neuron was characterized, revealed that dramatic disparities were possible at 13-l 6 d of age. That is, neurons with very sharp frequency tuning could be found along with those having very broad tuning in the same animal. The numbered points in Figure 7, B, C, E, and F, refer to neurons that were recorded in the same animals. For example, there are 9 examples of disparities in excitatory tuning in 15-l 6 d animals (Fig. 7B). In each case at least one of the units had a tuning value > 1.1, the high end of the adult range (see Fig. 7A). Ad- ditional examples were found at 13-14 d for both excitatory tuning (n F 7; Fig. 7B) and inhibitory tuning (n = 4; Fig. 7E), and at 15-16 d for inhibitory tuning (n = 4; Fig. 7F). These observations suggest that, although the cochlea was capable of generating mature frequency selectivity, at least for the 15-l 6 d examples, the neural responses could be quite immature. There was no consistent relationship between threshold and frequency tuning (e.g., in 11 of 21 cases the neuron with lower threshold exhibited broader tuning).
A number of response areas with unusual frequency ranges were found in animals 13-l 6 d of age. A common characteristic of these response areas was the presence of a second discrete range of frequencies capable of eliciting responses from the neu- ron. A total of 24 neurons exhibited response areas of this sort,

The Journal of Neuroscience, February 1966, 8(2) 667
AA ++%ki5 42 49 s’e 63
15-16 day
TIME @‘SEC) Figure 4. Representative poststimulus time histograms from 3 age groups. A-C, Top 3 PSTHs in each column show the excitatory response of a neuron to CF at increasing sound level. Bottom PSTH shows the response of the neuron when both excitatory (i.e., ipsilateral) and inhibitory (i.e., contralateral) pathways were stimulated. The sound levels at both ears are indicated for each PSTH. A, Response of a neuron in an adult animal. The CF of this unit was 10.0 kHz. II, The response of a neuron in a 15-16 d animal. The CF of this unit was 1.3 kHz. C, Response of a neuron in a 13-14 d animal. The CF of this unit was 1.9 kHz. Stimuli were delivered for 50 msec. Each PSTH was the sum of 50 stimulus repetitions, and events were collected in 0.1 msec bins.
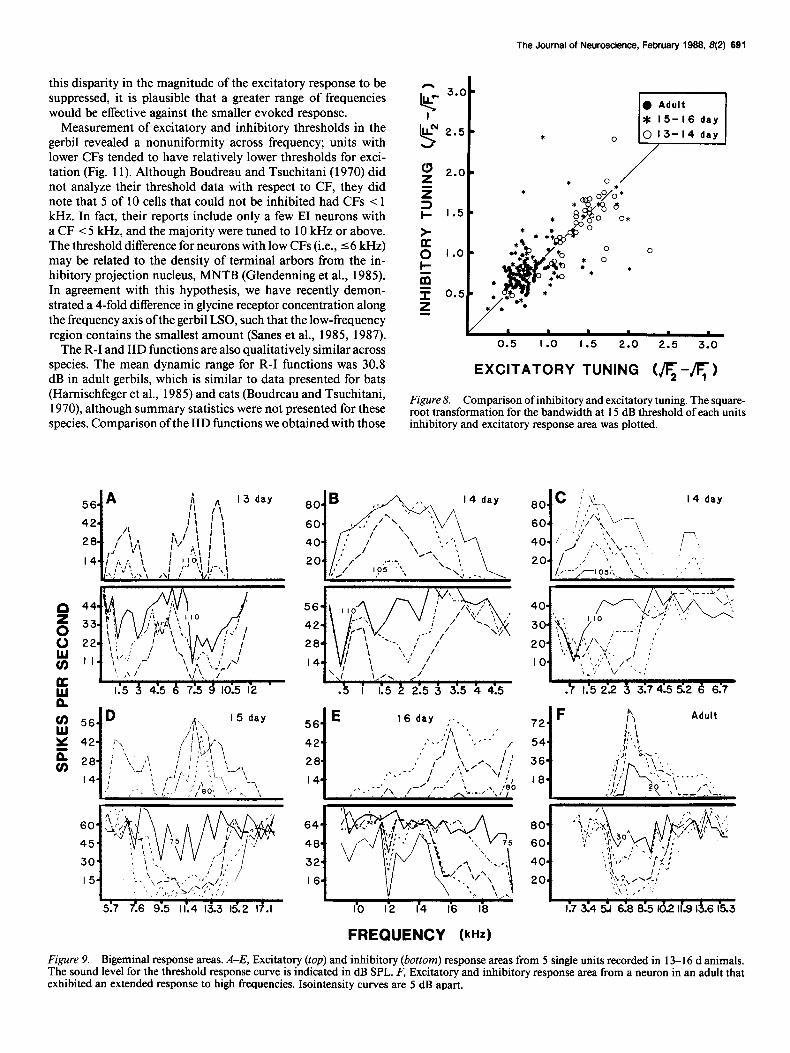
and 5 examples are shown in Figure 9 (A-E). Since the stimuli were often presented at high sound pressure levels to 13-l 6 d animals, the possibility existed that harmonic distortion could account for these response areas. Several observations make this explanation unlikely, however. First, a calibration of our sound system revealed all harmonics were below the neurons’s thresh- olds. Second, in 11 of these response areas the lower frequency range was effective at equal or lower threshold than the high frequency range (see Fig. 9c), which would have necessitated that high frequencies produced low frequency distortions. Sub- harmonic distortions were not found in our system at the in- tensities used. Third, in 10 cases, one, but not both, of the excitatory and inhibitory response areas was irregular, whereas the other was of normal shape. Finally, in 5 cases, another neuron was recorded from the same animal sharing one fre- quency range with the unusual neuron but not responding to a second frequency range. Although these response areas were not generally seen in adult animals, there were 9 examples of a diminished response to an extended range of excitatory fre- quencies (Fig. 90.
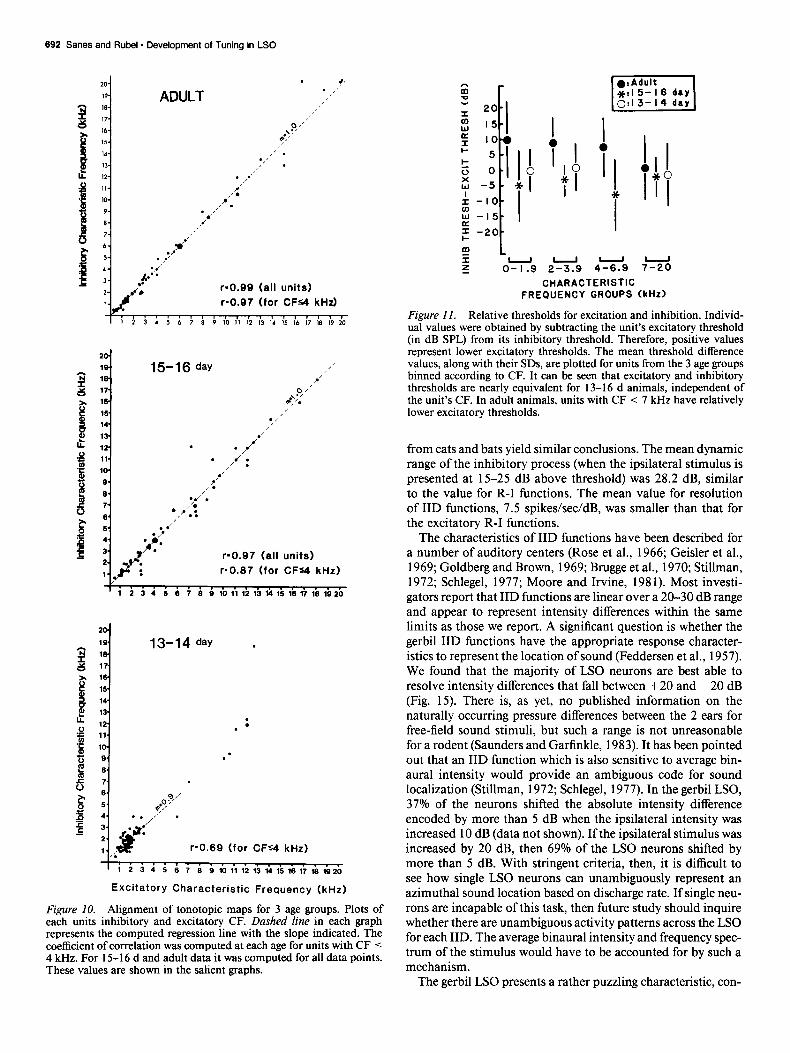
Alignment of tonotopic maps In adult animals, binaural neurons respond optimally to the same frequencies delivered to either ear. The degree to which the inhibitory and excitatory inputs were functionally matched was quantified by comparing the inhibitory and excitatory char- acteristic frequencies to one another for each unit in each age group. Figure 10 (top) shows a scatter plot of these data from adult animals, and illustrates the remarkable precision of align- ment. The correlation coefficient computed from these data points was 0.993 and the slope of the linear regression was 1 .O 1.
The alignment of tonotopic maps was apparent in neurons from the youngest animals (Fig. lo), although not with the pre- cision found in adults. Since there were so few neurons sampled with CFs >4 kHz in the 13-14 d group, separate r values were calculated considering only those units with CFs ~4 kHz. This analysis revealed that, for units with CF I 4 kHz, there was a lower correlation between excitatory and inhibitory CFs in units from 13-14 d animals than 15-16-d-olds (p < 0.05) or adults (p < O.Ol), and in neurons from the 15-16 d group than in

688 Sanes and Rubel l Development of Tuning in LSO
Adult I5- I6 day
\ 1. ‘,
2 4 6 8 IO 12 14 2 4 6 8 IO I2 I4
FREQUENCY (kHz1
I3- I4 day
20.,I,“,: ,y $3 ‘I 4
i 6 I 8 1 IO 1 I2 1 1
4 I4
Figure 5. Excitatory and inhibitory response areas from 3 age groups. Top sets of curves are the excitatory response areas from 2 neurons with different frequency ranges. Below each excitatory response area is the inhibitory response area from the same neuron when the excitatory stimulus was CF presented at 15-25 dB above threshold. The stimulus sound level at 15 dB above threshold is indicated in dB SPL for each response area. Isointensity curves are 10 dB apart for adult response areas, and 5 dB apart for 15-l 6 and 13-l 4 day response areas.
adults (p < 0.05). Comparing the 15-16 d and adult groups, where all data were included, it was again found that the younger group showed reliably lower correlations (p < 0.01).
Thresholds
A comparison of the sound levels that first evoke a change in discharge rate for the inhibitory and the excitatory pathway is a useful measure of their relative efficacy. Therefore, the differ- ence in threshold between the 2 pathways was examined as a function of age. The excitatory threshold (in dB SPL) was sub- tracted from the inhibitory threshold, yielding a positive value if the excitatory pathway was more efficacious than the inhib- itory pathway. A summary of the mean difference values for each frequency range is shown in Figure 11. In adult animals, mean values were $7 to + 10 for units with CFs ~7 kHz, and - 5 to +5 for units with CF >7 kHz. In contrast, all mean values were less than 0 for units in 13-l 6 d animals, regardless of CF. Statistical analyses of these sample means revealed a significant difference between units with CFs above and below 7 kHz (F, ss = 3.79, p < 0.05) in adult animals. There is also a reliable difference between both the 13-14 and the 15-16 d groups and the adult group for units with CF ~7 kHz (F2,89 = 12.34, p < 0.00 1). The inhibitory pathway therefore appears to have an equivalent threshold as the excitatory pathway in 13- 16 d animals. In adult animals, however, the excitatory thresh- old tends to be lower for units with CF ~7 kHz.
R-I functions: dynamic range and resolution
A more complete description of the excitatory pathway’s efficacy considers the dynamic range and resolution of LSO neurons. Representative R-I functions are shown in Figure 12. The most obvious differences between the R-I functions from adults (Fig. 12A) and those from young animals (Fig. 12, B, C) are the maximum discharge rate and the range of sound levels encoded.
Both dynamic range and resolution were relatively poor in 13-16 d animals. The dynamic range in young animals was approximately 50-60% that of the adults, as was the resolution
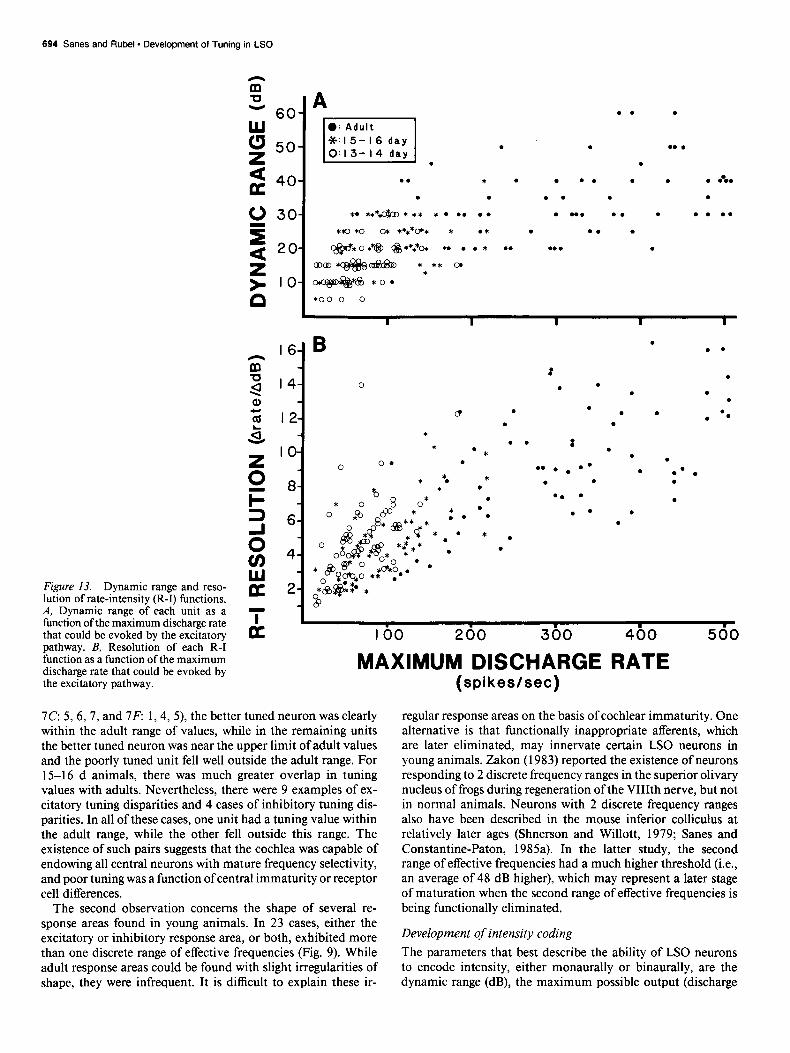
(Table 1). There were several R-I functions with very low max- imal discharge rates (e.g., ~60 spikes/set) in 13-16 d animals that also displayed a very shallow slope. That is, the “resolution” (i.e., change in discharge rate/dB) for these neurons was ex- tremely poor. Although these values were unrelated to CF (data not shown), they were correlated with maximum discharge rate (Fig. 13). Neurons from animals of all ages had overlapping distributions of dynamic range and resolution values for a given discharge rate. Therefore, the developmental discrepancy results from the absence of units with low maximum discharge rates in adult animals. In addition, there was a trend for neurons to have greater resolution values (i.e., change in discharge rate for a given change in sound level) for the excitatory process than the inhibitory process (Table 1).
IID functions: dynamic range and resolution
IID functions may be thought of as R-I functions for the inhib- itory pathway. That is, from an initial discharge rate evoked by stimulation of the excitatory (ipsilateral) ear, one observes a sequential decrement in this rate with increasing sound level presented to the contralateral ear. A representative sample of IID functions from animals of each age is shown in Figure 14. IID functions from 13-l 6 d animals were often very shallow or somewhat irregular in shape.
The sample of neurons recorded in adult animals encoded a greater range of intensity differences than those in young animals (Fig. 15). In addition, the majority ofneurons in 13-l 6 d animals were restricted to those IIDs where the ipsilateral sound level is greater than the contralateral sound level. The midpoints of the IID range from each neuron were compared across age groups and a reliable difference was found (F2,, ,9 = 737, p < 0.0 1). The average midpoint values were - 14.4 f 8.2 at 13-14, - 15.6 + 10.0 at 15-16, and -5.6 f 17.9 d in adult animals. Pairwise comparisons indicated that there was a significant difference between the 13-14 d and adult groups and the 15-16 d and adult groups (p < 0.01).
The dynamic range and resolution of the IID functions were

The Journal of Neuroscience, February 1988, 8(2) 899
,A Adult
2.01 B 15-16 day
A I ’
. . . l .
c3 i.
2 0.5 ?...+.Ec~ . ..*. ,....,..:t.... . . . . . . . . . . ...! . . . . . . . . . . . . . . . . . l %’ . . . . . . . . . . .: LA
i . . .
2 o C -t
13-14 day
t
F 13-14 day
1.5. ::* .
$S . 1.0~ rj;r . . l ;+ . . 0.5 ? :q;
. ’ . _,.,.,,._.._.,,.,,,,,,,.......,.,,,.,,..,,. L‘ . . . . . . . . . . . . . . . . . . . . . . . . . . . . . . . * .
2 4 6 6 10 12 14 16 16 20
CHARACTERISTIC
. . . . . . . . . . . . . . . . . . . . . . . . . . . . . . . . . . . ..~ *
.
l * . .
. .r.. ’ .
*c . . l r.* l * l
.
#!f . . . . . . . . . . . . . . . . . . . . . . . . i’ . . . . . . . . . . . . . . . . . . . . . . . . . . . . . . . . . . . . . . . *
c ‘,’ ‘. . .
2 4 6 6 10 12 14 16 16 20
FREQUENCY W-W Figure 6. Frequency selectivity at 5 dB above threshold. A-F, Plots of frequency selectivity as measured with the square-root transformation (see text) for excitatory (A-C) and inhibitory (D-F) response areas. The mean and SD are shown for each graph. Values for excitatory tuning in the adult (A), in 15-l 6 d animals (B), and in 13-14 d animals (C’). Values for inhibitory tuning in adult animals (D), in 15-16 d animals (E) and in 13-14 d animals (F). Dotted line in each graph represents the mean value for adult neurons.
similar to those of R-I functions in that they were highly cor- related with the initial discharge rate (Fig. 16). The dynamic range in animals 13-l 6 days was 60-70% that seen in adults, while the resolution in young animals was approximately 50% of the adult value (Table 1). This was true regardless of the relative sound level presented to the ipsilateral (i.e., excitatory) ear to elicit a fixed discharge rate. Figure 17 plots the resolution values as a function of the sound level delivered to the ipsilateral ear. It is clear that resolution values derived from neurons in adult animals were consistently greater than those from 13-l 6 d animals, regardless of excitatory sound level.
Discussion The major developmental trends observed in LSO neurons were quite similar for the excitatory and the inhibitory pathways. This was the case for response parameters such as frequency
selectivity, tonotopic alignment, dynamic range, and resolution. However, two findings suggest that the inhibitory pathway was relatively more efficient than the excitatory pathway at the onset of hearing: the relative threshold difference (Fig. 11) and the range of IID values encoded (Fig. 15). In this discussion, we first compare the data on mature LSO function to previously published reports and then examine developmental changes in light of findings from related developmental studies. Finally, the relationship to maturation in other neural systems, especially with respect to inhibition, is considered.
Coding properties of adult LSO neurons
The majority of analyses conducted in the present study were previously used by Boudreau and Tsuchitani (1968, 1970) in their elegant studies of LSO neurons in the adult cat. Perhaps the most dramatic difference between the cat and gerbil auditory

690 Sanes and Rubel l Development of Tuning in LSO
A Adult
I a
B . 15-16 day
:6
l -C 19 ” 3
6
1.0 $ 3 . .
0.5
5 . . . . . . . . . . . . . . . . . . . . . . . . . . . . . . . . . . . . . . . . . . . . . . . . . . . . . . A
C 13-14 day
7
. .
5
2 4 6 8 10 12 14 16 18 20 2 4 6 8 10 12 14 16 18 20
A... . . . . . . . . .
A
.E 15-16 da; , . . . .
. . . .4
3 2
I . .
’ . . _ . . . . . . . . . . . . . . . . . . . f . . . . . . . _ . . . . . . . . . . . . . . . . ? A
I . .
2
.F 4 13-14 day
.
3
7. l
= ;3: 5
I l 0 . . . . . . . . 4, l . . . . . . . . . . . . . . . . . . . . . . . . . . . . . . . . . . . . i’ .___......,,,: ,..._.............................................. A
. 5 l
CHARACTERISTIC FREQUENCY (k”z) Figure 7. Frequency selectivity at 15 dB above threshold. A-F, Plots of frequency selectivity as measured with square-root transformation (see text) for excitatory (A-C) and inhibitory @I-F) response areas. The mean and SD are shown for each graph. B, C, E, and F, Numbers denote data points obtained from the same animal. Excitatory tuning in adults (A), in 15-16 d animals (B), and in 13-14 d animals (C). Inhibitory tuning in adults (D), in 15-l 6 d animals (E), and in 13-l 4 d animals (fl. Dotted line in each graph represents the mean value for adult neurons.
systems is the predominance of low-frequency responsiveness in the latter. Despite this distinction, the general response prop- erties of LSO neurons in the 2 species are similar. The mean latency of the first discharge was 4.7 msec in the gerbil, 2-4 msec in the bat (Harnischfeger et al., 1985), and 7-10 msec in the cat for tonal stimuli at CF 20 dB above threshold (Boudreau and Tsuchitani, 1968). The temporal discharge patterns were also quite similar. The initial portion of the PSTHs exhibited a chopper response (Boudreau and Tsuchitani, 1968; Hamisch- feger et al., 1985), which often appeared to become a sustained response. Other units simply displayed primary-like PSTHs. Whereas the inhibitory pathway suppressed discharges during all portions of the PSTH in cats and gerbils (Boudreau and Tsuchitani, 1968; Caird and Klinke, 1983) the onset spike could rarely be inhibited in bats (Hamischfeger et al., 1985). The precise matching of excitatory and inhibitory CFs is also quite similar in the gerbil (Fig. 1OA) and cat (Boudreau and Tsuchi- tani, 1968).
Frequency selectivity cannot be directly compared across
studies because of differences in response criteria. However, once the effect of CF has been discounted, either by measuring the bandwidth in octaves (Boudreau and Tsuchitani, 1970) or using the square-root transformation, it is clear that frequency selectivity does not vary greatly across species. There does ap- pear to be a disagreement on the relative frequency selectivity of the excitatory and inhibitory systems in adult animals, how- ever. Boudreau and Tsuchitani (1970) showed that tuning of the inhibitory process is, on average, broader than that of the excitatory process. This was not the case in the present study (Fig. 8); the measures of tuning for excitation (0.69 + 0.2) and inhibition (0.75 + 0.2) were virtually identical. One possible explanation for this discrepancy is the way in which bandwidth data was obtained. In the present study, inhibitory tuning was assessed by competing the contralateral stimulus against the discharge rate evoked by a CF tone delivered ipsilaterally at 20 dB above threshold. In the cat, inhibitory bandwidths were determined by competing the contralateral stimulus against the ipsilateral stimulus that evoked a single action potential. Given
The Journal of Neuroscience, February 1988. 8(2) 691
this disparity in the magnitude of the excitatory response to be suppressed, it is plausible that a greater range of frequencies would be effective against the smaller evoked response.
Measurement of excitatory and inhibitory thresholds in the gerbil revealed a nonuniformity across frequency; units with lower CFs tended to have relatively lower thresholds for exci- tation (Fig. 11). Although Boudreau and Tsuchitani (1970) did not analyze their threshold data with respect to CF, they did note that 5 of 10 cells that could not be inhibited had CFs < 1 kHz. In fact, their reports include only a few EI neurons with a CF < 5 kHz, and the majority were tuned to 10 kHz or above. The threshold difference for neurons with low CFs (i.e., 16 kHz) may be related to the density of terminal arbors from the in- hibitory projection nucleus, MNTB (Glendenning et al., 1985). In agreement with this hypothesis, we have recently demon- strated a 4-fold difference in glycine receptor concentration along the frequency axis of the gerbil LSO, such that the low-frequency region contains the smallest amount (Sanes et al., 1985, 1987).
The R-I and IID functions are also qualitatively similar across species. The mean dynamic range for R-I functions was 30.8 dB in adult gerbils, which is similar to data presented for bats (Hamischfeger et al., 1985) and cats (Boudreau and Tsuchitani, 1970), although summary statistics were not presented for these species. Comparison of the IID functions we obtained with those
. 0.5 1.0 1.5 2.0 2.5 3.0
EXCITATORY TUNING (6 -6 1
Figure 8. Comparison of inhibitory and excitatory tuning. The square- root transformation for the bandwidth at 15 dB threshold of each units inhibitory and excitatory response area was plotted.
I.5 3 4.5 6 7.5 9 10.5 12 .5 I I:5 !2 2.5 i 3.5 h 4:s
5.7 7.6 9.5 Ii.4 13.3 lg.2 If.1 1’0 I2 I4 I6 16
FREQUENCY @Hz) Figure 9. Bigeminal response areas. A-E, Excitatory (top) and inhibitory (bottom) response areas from 5 single units recorded in 13-16 d animals. The sound level for the threshold response curve is indicated in dB SPL. F, Excitatory and inhibitory response area from a neuron in an adult that exhibited an extended response to high frequencies. Isointensity curves are 5 dB apart.
692 Sanes and Rubel l Development of Tuning in LSO
r-0.99 (all units)
r-O.97 (for CFs4 kH3
+\ :9 ’ ,
6,’ ,’
.,l’ ’ .
I .
13-14 day .
(for CFq kHz)
’ 1 2 3 4 5 6 7 8 9 IO 11 12 13 14 15 16 17 18 ,s 20
Excitatory Characteristic Frequency (kHz)
Figure 10. Alignment of tonotopic maps for 3 age groups. Plots of each units inhibitory and excitatory CF. Dashed line in each graph represents the computed regression line with the slope indicated. The coefficient of correlation was computed at each age for units with CF 5 4 kHz. For 15-l 6 d and adult data it was computed for all data points. These values are shown in the salient graphs.
1 I l ?O 1 I I
m E L z O?Q 2-3.9 4-6.9 7-20
CHARACTERISTIC FREQUENCY GROUPS (kHz)
Figure II. Relative thresholds for excitation and inhibition. Individ- ual values were obtained by subtracting the unit’s excitatory threshold (in dB SPL) from its inhibitory threshold. Therefore, positive values represent lower excitatory thresholds. The mean threshold difference values, along with their SDS, are plotted for units from the 3 age groups binned according to CF. It can be seen that excitatory and inhibitory thresholds are nearly equivalent for 13-16 d animals, independent of the unit’s CF. In adult animals, units with CF < 7 kHz have relatively lower excitatory thresholds.
from cats and bats yield similar conclusions. The mean dynamic range of the inhibitory process (when the ipsilateral stimulus is presented at 15-25 dB above threshold) was 28.2 dB, similar to the value for R-I functions. The mean value for resolution of IID functions, 7.5 spikes/sec/dB, was smaller than that for the excitatory R-I functions.
The characteristics of IID functions have been described for a number of auditory centers (Rose et al., 1966; Geisler et al., 1969; Goldberg and Brown, 1969; Brugge et al., 1970; Stillman, 1972; Schlegel, 1977; Moore and Irvine, 198 1). Most investi- gators report that IID functions are linear over a 20-30 dB range and appear to represent intensity differences within the same limits as those we report. A significant question is whether the gerbil IID functions have the appropriate response character- istics to represent the location of sound (Feddersen et al., 1957). We found that the majority of LSO neurons are best able to resolve intensity differences that fall between +20 and - 20 dB (Fig. 15). There is, as yet, no published information on the naturally occurring pressure differences between the 2 ears for free-field sound stimuli, but such a range is not unreasonable for a rodent (Saunders and Garfinkle, 1983). It has been pointed out that an IID function which is also sensitive to average bin- aural intensity would provide an ambiguous code for sound localization (Stillman, 1972; Schlegel, 1977). In the gerbil LSO, 37% of the neurons shifted the absolute intensity difference encoded by more than 5 dB when the ipsilateral intensity was increased 10 dB (data not shown). If the ipsilateral stimulus was increased by 20 dB, then 69% of the LSO neurons shifted by more than 5 dB. With stringent criteria, then, it is difficult to see how single LSO neurons can unambiguously represent an azimuthal sound location based on discharge rate. If single neu- rons are incapable of this task, then future study should inquire whether there are unambiguous activity patterns across the LSO for each IID. The average binaural intensity and frequency spec- trum of the stimulus would have to be accounted for by such a mechanism.
The gerbil LSO presents a rather puzzling characteristic, con-

The Journal of Neuroscience, February 1988, 8(2) 893
0 10203040506070
B 15-16 day
C 13-14 day
SOUND LEVEL @‘B)
taining numerous low-frequency EI neurons. Generally, it has been accepted that low frequencies (i.e., ~4 kHz) are of little use for determining the azimuth of sound since the head does not serve as an effective acoustic shadow (Feddersen et al., 1957). It may be that the small IIDs from low frequencies are encoded by a large number of neurons, and useful information is ex- tracted from an “averaged” response. It is important to note that interaural time differences, which were not assayed in the present study, may also be encoded by these neurons (Caird and Klinke, 1983). Behavioral analyses will be necessary to deter- mine whether low-frequency neurons in LSO are of use in sound localization or other perceptual tasks or are functionally vestig- ial.
Development of frequency selectivity Several previous studies have shown that the range of frequen- cies encoded by a neuron in the CNS decreases during matu- ration (Aitkin and Moore, 1975; Brugge et al., 1978, 198 1; Wil- lott and Shnerson, 1978; Shnerson and Willott, 1979; Saunders et al., 1980; Woolf and Ryan, 1985). Since the coding of fre- quency is a sensitive functional measure of a neuron’s afferent
Figure 12. Representative rate-inten- sity functions for 3 age groups. The in- crease in each unit’s discharge rate is plotted against the sound level (in dB SPL) that CF was presented at to elicit the response. A, Adult; B, 15-16 d; C, 13-14 d.
connections, it is useful to determine whether the process of sharpening entails cochlear mechanisms, central mechanisms, or both (Rubel, 1985). Tone-on-tone masking of compound action potentials (Carlier et al., 1979; Shnerson and Pujol, 1982) and single-fiber recordings from VIIIth nerve axons (Romand, 1983) demonstrate sharpening of tuning curves for several days following hearing onset. Noting the close temporal association between the VIIIth nerve and cochlear nucleus tuning for units with low CFs, Brugge et al. (198 1) attributed the entire process to the cochlea. Therefore, should a central mechanism exist, its elucidation would depend on dissociation from cochlear events.
The present results show that both excitatory and inhibitory frequency selectivity are relatively poor near the time of hearing onset (Figs. 6 and 7). While the ensuing changes are at least partially attributable to maturation of the transducing system, two observations suggest that changes in synaptic connections in the cochlea or central nervous system may also contribute. First, units with similar CFs, recorded within the same animal, had disparate tuning properties. In 13-14 d animals there were 7 such cases for excitatory tuning (Fig. 7C) and 5 cases for inhibitory tuning (Fig. 7fl. In over half of these examples (Fig.
694 Sanes and Rubel * Development of Tuning in LSO
Figure 13. Dynamic range and reso- lution of rate-intensity (R-I) functions. A, Dynamic range of each unit as a function of the maximum discharge rate that could be evoked by the excitatory pathway. B, Resolution of each R-I function as a function of the maximum discharge rate that could be evoked by the excitatory pathway.
60-
50-
40-
30-
20-
I o-
p-&q] .
. . * . . .
*. ***#z$D*** *. . . . .
*w *o ot *\*oc* * .* .
q-p* 0 *@ @j****c?e *. . . * . .
cm0 *at&& * ** CD
a&qsd&@*o* *
*ooo 0
. . .
. . . .
.
. . . . . . A.
. . . .
. . . . . . . . . . .
. . .
. . . .
‘64 B
I I I I I
. . .
8 . . .
. . . 0 . .
. . . l .
. .
lb0 . .
200 300 400 500
7C: 5, 6, 7, and 7F: 1,4, 5) the better tuned neuron was clearly within the adult range of values, while in the remaining units the better tuned neuron was near the upper limit of adult values and the poorly tuned unit fell well outside the adult range. For 15-16 d animals, there was much greater overlap in tuning values with adults. Nevertheless, there were 9 examples of ex- citatory tuning disparities and 4 cases of inhibitory tuning dis- parities. In all of these cases, one unit had a tuning value within the adult range, while the other fell outside this range. The existence of such pairs suggests that the cochlea was capable of endowing all central neurons with mature frequency selectivity, and poor tuning was a function of central immaturity or receptor cell differences.
The second observation concerns the shape of several re- sponse areas found in young animals. In 23 cases, either the excitatory or inhibitory response area, or both, exhibited more than one discrete range of effective frequencies (Fig. 9). While adult response areas could be found with slight irregularities of shape, they were infrequent. It is difficult to explain these ir-
MAXIMUM DISCHARGE RATE (spikedsec)
regular response areas on the basis of cochlear immaturity. One alternative is that functionally inappropriate afferents, which are later eliminated, may innervate certain LSO neurons in young animals. Zakon (1983) reported the existence of neurons responding to 2 discrete frequency ranges in the superior olivary nucleus of frogs during regeneration of the VIIIth nerve, but not in normal animals. Neurons with 2 discrete frequency ranges also have been described in the mouse inferior colliculus at relatively later ages (Shnerson and Willott, 1979; Sanes and Constantine-Paton, 1985a). In the latter study, the second range of effective frequencies had a much higher threshold (i.e., an average of 48 dB higher), which may represent a later stage of maturation when the second range of effective frequencies is being functionally eliminated.
Development of intensity coding
The parameters that best describe the ability of LSO neurons to encode intensity, either monaurally or binaurally, are the dynamic range (dB), the maximum possible output (discharge
The Journal of Neuroscience, February 1988, 8(2) 696
ADULT
-5b >ipeilateral >contralateral
15-16 day
-40-30-20-10 0 IO 20
13-14 day .
\ I
,.~ , -40 -30-20 -10 0 l-0 2’0
bipeilateral kontralateral
100
50
INTERAURAL INTENSITY DIFFERENCE (dB)
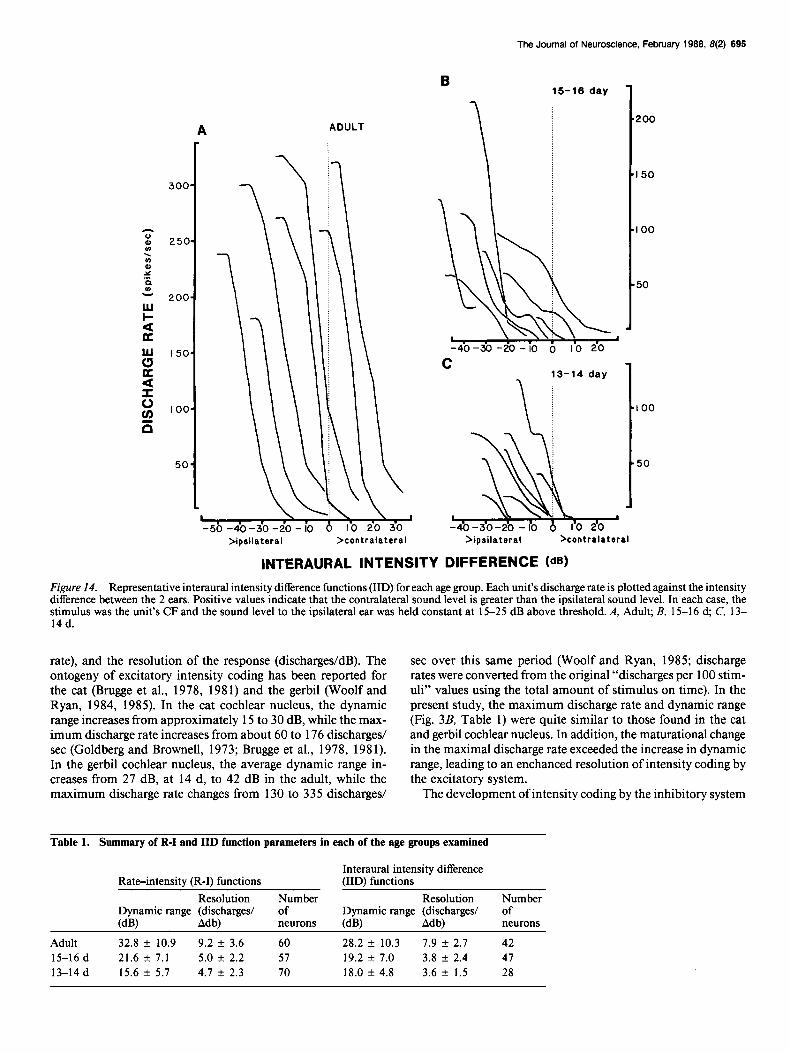
Figure 14. Representative interaural intensity difference functions (IID) for each age group. Each unit’s discharge rate is plotted against the intensity difference between the 2 ears. Positive values indicate that the contralateral sound level is greater than the ipsilateral sound level. In each case, the stimulus was the unit’s CF and the sound level to the ipsilateral ear was held constant at 15-25 dB above threshold. A, Adult; B, 15-l 6 d; C, 13- 14 d.
rate), and the resolution of the response (discharges/dB). The ontogeny of excitatory intensity coding has been reported for the cat (Brugge et al., 1978, 1981) and the gerbil (Woolf and Ryan, 1984, 1985). In the cat cochlear nucleus, the dynamic range increases from approximately 15 to 30 dB, while the max- imum discharge rate increases from about 60 to 176 discharges/ set (Goldberg and Brownell, 1973; Brugge et al., 1978, 1981). In the gerbil cochlear nucleus, the average dynamic range in- creases from 27 dB, at 14 d, to 42 dB in the adult, while the maximum discharge rate changes from 130 to 335 discharges/
set over this same period (Woolf and Ryan, 1985; discharge rates were converted from the original “discharges per 100 stim- uli” values using the total amount of stimulus on time). In the present study, the maximum discharge rate and dynamic range (Fig. 3B, Table 1) were quite similar to those found in the cat and gerbil cochlear nucleus. In addition, the maturational change in the maximal discharge rate exceeded the increase in dynamic range, leading to an enchanced resolution of intensity coding by the excitatory system.
The development of intensity coding by the inhibitory system
Table 1. Summary of R-I and IID function parameters in each of the age groups examined
Interaural intensity difference Rate-intensity (R-I) functions (IID) functions
Resolution Number Resolution Number Dynamic range (discharges/ of Dynamic range (discharges/ of W-9 Adb) neurons WV Adb) neurons
Adult 32.8 + 10.9 9.2 f 3.6 60 28.2 k 10.3 1.9 f 2.1 42 15-16 d 21.6 k 7.1 5.0 + 2.2 57 19.2 zt 7.0 3.8 + 2.4 47 13-14 d 15.6 + 5.7 4.7 2 2.3 70 18.0 k 4.8 3.6 t 1.5 28

696 Sanes and Rubel - Development of Tuning in LSO
Figure 15. Linear portion of each unit’s IID function. The region ofgreat- est resolution is plotted for IID func- tions from animals in the 3 age groups. In all cases, the IID function was ob- tained when the ipsilateral (i.e., exci- tatory) stimulus was CF at 15-25 dB above threshold. Units in adult animals are more likely to encode intensity dif-
Mpsilateral >contralateral ferences when the contralateral sound level is greater than the ipsilateral level. IID RANGE W)
Adult
15-16 da Y
13-14 day
of LSO was examined as well. The average dynamic range of IID functions expanded from 18 dB, in 13-14 d animals, to 28.2 dB in adults. Over this same period, the resolution in- creased from 3.6 to 7.5 discharges/sec/dB, or approximately 100%. The change in these values from 13-l 4 to 15-l 6 d was minimal, indicating that maturation of IID functions occurs after 16 d of age in the gerbil. In addition, the population of neurons characterized at 13-16 d was considerably more con- strained with respect to the IIDs they encoded. As maturation progressed, LSO neurons began to encode binaural stimuli in which contralateral intensities were greater than ipsilateral in- tensities (Fig. 15).
Two previous studies have described the development of in- teraural intensity coding in the auditory midbrain. Moore and Irvine (198 1) report that high-frequency EI neurons in the kitten exhibit quite irregular IID functions up to 4 weeks after birth. Interestingly, low-frequency neurons (i.e., CF < 2 kHz) exhib- ited IID functions that closely resembled those of adult cats. These results are qualitatively different from those in the present study, as we observed very “mature looking” IID functions from the onset of hearing (Fig. 14). Our quantitative observations, however, indicate that coding properties continue to mature after 16 d of age. A second study followed the maturation of IID resolution using evoked potentials recorded from the bat

The Journal of Neuroscience, February 1988, 8(2) 897
60-
50-
40-
30-
20-
I o-
.
. .
t: I5- I6 day
. .
. .
I 4-
I 2-
I o-
8-
6-
4-
2-
. .
. . .
’ i *
l * . .
:* . l
“*a
. .
. l .
. . .*a t* . . l .
. ’
.* .
I60 260 360
MAXIMUM DISCHARGE (spikeslsec)
inferior colliculus (Brown et al., 1978). These results seem to indicate that neurons are poorly tuned for azimuthal location through postnatal day 2 1, and thereafter increase in resolution. Since the number of afferent connections to the LSO are far simpler than those to the inferior colliculus, it may be that the generation of IID coding requires a greater amount of time in the latter structure. Sequential development of function has been described for certain properties as one ascends the auditory pathway (Ryan et al., 1982; Sanes and Constantine-Paton, 1985b).
Development of topographic alignment An orderly representation of the frequency axis is present in central auditory nuclei from the onset of hearing, even though the frequency range is limited (Aitkin and Moore, 1975; Lippe and Rubel, 1985; Sanes et al., unpublished observations). A related characteristic of binaural auditory nuclei is the corre- spondence of 2 cochleotopic projections. To assess the precision of binaural frequency matching we compared the excitatory CF and the inhibitory CF of LSO neurons. The present results sug-
460 500
~ RATE
Figure 16. Dynamic range and reso- lution of IID functions for the 3 age groups. A, Dynamic range ofeach unit’s IID as a function of the maximum dis- charge rate that could be evoked in the absence of inhibition. B, Resolution of each unit’s IID as a function ofthe max- imum discharge rate that could be evoked in the absence of inhibition.
gest that CF matching is somewhat less precise in animals at hearing onset (13-14 d) than in adults (Fig. 10). On the other hand, examination of the excitatory and inhibitory response areas revealed a great degree of overlap at all ages (Fig. 5). Therefore, it is difficult to determine either the means by which CFs become well matched or the functional implications of immature alignment. One possible explanation is that the 2 cochleas, which are each undergoing a change in their own ton- otopic maps (Lippe and Rubel, 1983, 1985; Rubel and Ryals, 1983; Harris and Dallos, 1984; Sanes et al., unpublished ob- servations), are not maturing in synchony. An alternative ex- planation is that the lower discharge rates, common in young animals, did not allow us to determine CF with the same pre- cision as in adults. A fine-grained quantitative analysis of CF would be necessary to resolve this issue.
Previous studies have not quantitatively assessed the devel- opmental alignment of tonotopic maps, but at least 2 experi- mental systems address the issue. Following unilateral transec- tion of the frog auditory nerve, the sequence of functional reinnervation has been followed by recording from single neu-
696 Saws and Rubel * Development of Tuning in LSO
l
*b
uuuuuu 5 IO 15 20 25 230
IPSILATERAL SOUND LEVEL (dB above threshold)
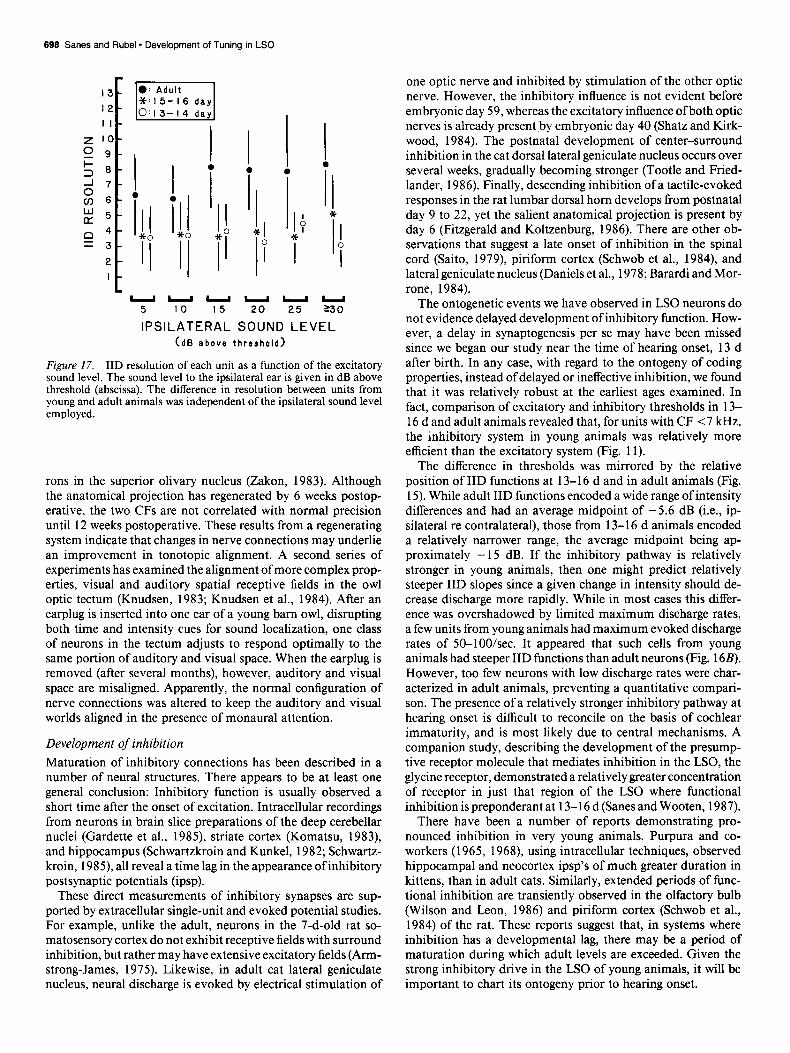
Figure 17. IID resolution of each unit as a function of the excitatory sound level. The sound level to the ipsilateral ear is given in dB above threshold (abscissa). The difference in resolution between units from young and adult animals was independent of the ipsilateral sound level employed.
rons in the superior olivary nucleus (Zakon, 1983). Although the anatomical projection has regenerated by 6 weeks postop- erative, the two CFs are not correlated with normal precision until 12 weeks postoperative. These results from a regenerating system indicate that changes in nerve connections may underlie an improvement in tonotopic alignment. A second series of experiments has examined the alignment of more complex prop- erties, visual and auditory spatial receptive fields in the owl optic tectum (Knudsen, 1983; Knudsen et al., 1984). After an earplug is inserted into one ear of a young barn owl, disrupting both time and intensity cues for sound localization, one class of neurons in the tectum adjusts to respond optimally to the same portion of auditory and visual space. When the earplug is removed (after several months), however, auditory and visual space are misaligned. Apparently, the normal configuration of nerve connections was altered to keep the auditory and visual worlds aligned in the presence of monaural attention.
Development of inhibition Maturation of inhibitory connections has been described in a number of neural structures. There appears to be at least one general conclusion: Inhibitory function is usually observed a short time after the onset of excitation. Intracellular recordings from neurons in brain slice preparations of the deep cerebellar nuclei (Gardette et al., 1985), striate cortex (Komatsu, 1983), and hippocampus (Schwartzkroin and Kunkel, 1982; Schwartz- kroin, 1985) all reveal a time lag in the appearance of inhibitory postsynaptic potentials (ipsp).
These direct measurements of inhibitory synapses are sup- ported by extracellular single-unit and evoked potential studies. For example, unlike the adult, neurons in the 7-d-old rat so- matosensory cortex do not exhibit receptive fields with surround inhibition, but rather may have extensive excitatory fields (Arm- strong-James, 1975). Likewise, in adult cat lateral geniculate nucleus, neural discharge is evoked by electrical stimulation of
one optic nerve and inhibited by stimulation of the other optic nerve. However, the inhibitory influence is not evident before embryonic day 59, whereas the excitatory influence ofboth optic nerves is already present by embryonic day 40 (Shatz and Kirk- wood, 1984). The postnatal development of center-surround inhibition in the cat dorsal lateral geniculate nucleus occurs over several weeks, gradually becoming stronger (Tootle and Fried- lander, 1986). Finally, descending inhibition of a tactile-evoked responses in the rat lumbar dorsal horn develops from postnatal day 9 to 22, yet the salient anatomical projection is present by day 6 (Fitzgerald and Koltzenburg, 1986). There are other ob- servations that suggest a late onset of inhibition in the spinal cord (Saito, 1979), piriform cortex (Schwab et al., 1984), and lateral geniculate nucleus (Daniels et al., 1978; Barardi and Mor- rone, 1984).
The ontogenetic events we have observed in LSO neurons do not evidence delayed development of inhibitory function. How- ever, a delay in synaptogenesis per se may have been missed since we began our study near the time of hearing onset, 13 d after birth. In any case, with regard to the ontogeny of coding properties, instead of delayed or ineffective inhibition, we found that it was relatively robust at the earliest ages examined. In fact, comparison of excitatory and inhibitory thresholds in 13- 16 d and adult animals revealed that, for units with CF < 7 kHz, the inhibitory system in young animals was relatively more efficient than the excitatory system (Fig. 11).
The difference in thresholds was mirrored by the relative position of IID functions at 13-l 6 d and in adult animals (Fig. 15). While adult IID functions encoded a wide range of intensity differences and had an average midpoint of -5.6 dB (i.e., ip- silateral re contralateral), those from 13-l 6 d animals encoded a relatively narrower range, the average midpoint being ap- proximately - 15 dB. If the inhibitory pathway is relatively stronger in young animals, then one might predict relatively steeper IID slopes since a given change in intensity should de- crease discharge more rapidly. While in most cases this differ- ence was overshadowed by limited maximum discharge rates, a few units from young animals had maximum evoked discharge rates of 50-lOO/sec. It appeared that such cells from young animals had steeper IID functions than adult neurons (Fig. 16B). However, too few neurons with low discharge rates were char- acterized in adult animals, preventing a quantitative compari- son. The presence of a relatively stronger inhibitory pathway at hearing onset is difficult to reconcile on the basis of cochlear immaturity, and is most likely due to central mechanisms. A companion study, describing the development of the presump- tive receptor molecule that mediates inhibition in the LSO, the glycine receptor, demonstrated a relatively greater concentration of receptor in just that region of the LSO where functional inhibition is preponderant at 13-l 6 d (Sanes and Wooten, 1987).
There have been a number of reports demonstrating pro- nounced inhibition in very young animals. Purpura and co- workers (1965, 1968) using intracellular techniques, observed hippocampal and neocortex ipsp’s of much greater duration in kittens, than in adult cats. Similarly, extended periods of func- tional inhibition are transiently observed in the olfactory bulb (Wilson and Leon, 1986) and piriform cortex (Schwab et al., 1984) of the rat. These reports suggest that, in systems where inhibition has a developmental lag, there may be a period of maturation during which adult levels are exceeded. Given the strong inhibitory drive in the LSO of young animals, it will be important to chart its ontogeny prior to hearing onset.

The Journal of Neuroscience, February 1988, 8(2) 699
References Aitkin, L. M., and D. R. Moore (1975) Inferior colliculus. II. Devel-
opment of tuning characteristics and tonotopic organization in central nucleus of the neonatal cat. J. Neurophysiol. 38: 1208-l 2 16.
Armstrong-James, M. (1975) The functional status and columnar or- ganization of single cells responding to cutaneous stimulation in neo- natal rat somatosensory cortex Sl. J. Physiol. (Lond.) 246: 501-538.
Berardi, N., and M. C. Morrone (1984) Development of r-amino- butyric acid mediated inhibition of X cells of the cat lateral geniculate nucleus. J. Physiol. (Lond.) 357: 525-537.
Boudreau, J. C., and C. Tsuchitani (1968) Binaural interaction in the cat superior olive s-segment. J. Neurophysiol. 31: 442-454.
Boudreau, J. C., and C. Tsuchitani (1970) Cat superior olive s-segment cell discharge to tonal stimulation. In Contributions to Sensory Phys- iology, Vol. 4, W. D. Neff, ed., pp. 143-2 13, Academic, New York.
Brown, P. E., A. D. Grinnell, and J. B. Harrison (1978) The devel- opment of hearing in the pallid bat, Antrozous pallidus. J. Comp. Physiol. 126: 169-182.
Brownell, W. E., P. B. Manis, and L. A. Ritz (1979) Ipsilateral inhib- itory responses in the cat lateral superior olive. Brain Res. 177: 189- 193.
Browner, R. H., and D. B. Webster (1975) Projections of the trapezoid body and the superior olivary complex of the Kangaroo Rat (Dipod- omys merriami). Brain Behav. Evol. 11: 322-354.
Brugge, J. F., D. J. Anderson, and L. M. Aitkin (1970) Responses of neurons in the dorsal nucleus of the lateral lemniscus of cat to binaural tonal stimulation. J. Neurophysiol. 33: 441-458.
Brugge, J. F., E. Javel, and L. M. Kitzes (1978) Signs of functional maturation of peripheral auditory system in discharge patterns of neurons in anteroventral cochlear nucleus of kitten. J. Neurophysiol. 41: 1557-1579.
Brugge, J. F., L. M. Kitzes, and E. Javel (198 1) Postnatal development of frequency and intensity sensitivity of neurons in the anteroventral cochlear nucleus of kittens. Hearing Res. 5: 2 17-229.
Caird, D., and R. Klinke (1983) Processing of binaural stimuli by cat superior olivary complex neurons. Exp. Brain Res. 52: 385-399.
Calford, M. B., W. R. Webster, and M. M. Semple (1983) Measure- ment of frequency selectivity of single neurons in the central auditory pathway. Hearing Res. 11: 395-40 1.
Cant, N. B., and J. H. Casseday (1986) Proiections from the antero- ventral cochlear nucleus to the lateral and medial superior olivary nuclei. J. Comn. Neurol. 247: 457-476.
Carlier, E., M. L&oir, and R. Pujol (1979) Development of cochlear frequency selectivity tested by compound action potential tuning curves. Hearing Res. 1: 197-201.
Crain, S. M., and M. B. Bomstein (1974) Early onset in inhibitory functions during synaptogenesis in fetal mouse brain cultures. Brain Res. 68: 35 l-357.
Daniels, J. D., J. D. Pettigrew, and J. L. Norman (1978) Development of single neuron responses in kitten’s lateral geniculate nucleus. J. Neurophysiol. 41: 1373-1393.
Dubin, M. W., L. A. Stark, and S. M. Archer (1986) A role for action potential activity in the development of neuronal connections in the kitten retinogeniculate pathway. J. Neurosci. 6: 1021-1036.
Eccles, J. C. (1969) The Inhibitory Pathways of the Central Nervous System, Thomas, Springfield, IL.
Elverland, H. H. (1978) Ascending and intrinsic projections of the superior olivary complex in the cat. Exp. Brain Res. 32: 117-l 34.
Feddersen, W. E., T. T. Sandel, D. C. Teas, and L. A. Jeffress (1957) Localization of high frequency tones. J. Acoust. Sot. Am. 29: 988- 991.
Finck, A., C. D. Schneck, and A. F. Hartman (1972) Development of cochlear function in the neonate Mongolian gerbil (Meriones unguic- ulatus). J. Comp. Physiol. Psychol. 78: 375-380.
Fitzgerald, M., and M. Koltzenburg (1986) The functional develop- ment of descending inhibitory pathways in the dorsolateral funiculus of the newborn rat sninal cord. Dev. Brain Res. 24: 26 l-270.
Galambos, R., J. Schwartzkopf, and A. Rupert (1959) Microelectrode study of superior olivary nuclei. Am. J. Physiol. 197: 527-536.
Gardette, R., M. Debono, J.-L. DuPont, and F. Crepe1 (1985) Elec- trophysiological studies on the postnatal development of intracere- bellar nuclei neurons in the rat cerebellar slices maintained in vitro. I. Postsynaptic potentials. Dev. Brain. Res. 19: 47-55.
Geisler, C. D., W. S. Rhode, and D. W. Hazelton (1969) Responses
of inferior colliculus neurons in the cat to binaural acoustic stimuli having wide-band spectra. J. Neurophysiol. 32: 960-974.
Glendenning, K. K., K. A. Hutson, R. J. Nudo, and R. B. Masterton (1985) Acoustic chiasm II: Anatomical basis of binaurality in lateral superior olive of cat. J. Comp. Neurol. 232: 26 l-285.
Goldberg, J. M., and P. B. Brown (1969) Response of binaural neurons of dog superior olivary complex to dichotic tonal stimuli: Some phys- iological mechanisms of sound localization. J. Neurophysiol. 32: 6 13- 636.
Goldberg, J. M., and W. E. Brownell (1973) Discharge characteristics of neurons in anteroventral and dorsal cochlear nuclei of cat. Brain Res. 64: 35-54.
Harnischfeger, G., G. Neuweiler, and P. Schlegel (1985) Interaural time and intensity coding in superior olivary complex and inferior colliculus of the echo locating bat Molossus ater. J. Neurophysiol. 53: 89-109.
Harris, D. M., and P. Dallos (1984) Ontogenetic changes in frequency mapping of a mammalian ear. Science 225: 741-743.
Harrison, J. M., and W. B. Warr (1962) A study of the cochlear nuclei and ascending auditory pathways of the medulla. J. Comp. Neurol. 119: 341-379.
Held. H. (1893) Die Zentrale Gehorleitune. Arch. Anat. Physiol. Anat. A&. 171 20 11248.
Hirsch, H. V. B., and D. N. Spinelli (1970) Visual experience modifies distribution of horizontallv and verticallv oriented receptive fields in cats. Science 168: 869-87 i.
Jackson, H., and T. N. Parks (1982) Functional synapse elimination in the developing avian cochlear nucleus with simultaneous reduction in cochlear nerve axon branchina. J. Neurosci. 2: 1736-1743.
Keating, M. J., and J. D. Feldman (1975) Visual deprivation and intertectal neuronal connexions in Xenopus laevis. Proc. R. Sot. Lon- don [Biol.] 191: 457-474.
Knudsen, E. I. (1983) Early auditory experience aligns the auditory map of space in the optic tectum of the barn owl. Science 222: 939- 942.
Knudsen, E. I., S. D. Easterly, and P. F. Knudsen (1984) Monaural occlusion alters sound localization during a sensitive period in the barn owl. J. Neurosci. 4: 1001-1011.
Komatsu, Y. (1983) Development of cortical inhibition in kitten striate cortex investigated by a slice preparation. Dev. Brain Res. 8: 136- 139.
Law, M. I., and M. Constantine-Paton (1981) Anatomy and physi- ology of experimentally produced striped tecta. J. Neurosci. 1: 741- 759.
Levay, S., D. H. Hubel, and T. N. Wiesel (1975) The pattern of ocular dominance columns in macaque visual cortex revealed by a reduced silver stain. J. Comp. Neurol. 159: 559-576.
Lichtman, J. W. (1977) The reorganization of synaptic connexions in the rat submandibular ganglion during postnatal development. J. Phvsiol. ILond.) 273: 155-l 77.
Lippe, W.,, and E. W Rubel (1983) Development of the place principle: tonotopic organization. Science 219: 5 14-5 16.
Lippe, W., and-E. W Rubel (1985) Ontogeny of tonotopic organization of brainstem auditory nuclei in the chicken: Implications for devel- opment of the place principle. J. Comp. Neurol. 237: 273-289.
Mariani, J., and J.-P. Changeux (198 1) Ontogenesis of olivocerebellar relationships. I. Studies by intracellular recordings of the multiple innervation of Purkinje cells by climbing fibers in the developing rat cerebellum. J. Neurosci. 1: 696-702.
Moore, D. R., and D. R. F. Irvine (198 1) Development of responses to acoustic interaural intensity differences in the cat inferior colliculus. Exp. Brain Res. 41: 301-309.
Morest, D. K. (1968) The collateral system of the medial nucleus of the trapezoid body of the cat, its neuronal architecture and relation to the olivo-cochlear bundle. Brain Res. 9: 288-3 11.
Olsen, C. R., and J. D. Pettigrew (1974) Single units in the visual cortex of kittens reared in stroboscopic illumination. Brain Res. 70: 189-204.
Pearson, H. E., and E. H. Murphy (1983) Effects of stroboscopic rearing on the response properties and laminar distribution of single units in the rabbit superior colliculus. Dev. Brain Res. 9: 241-250.
Persson, H. E. (1973) Foetal and neonatal physiology. In Proceedings of the Sir Joseph Barcroft Centenary Symposium, R. S. Comline, K. W. Cross, G. S. Dawes, and P. W. Nathanielsz, eds., pp. 20-27, University Press, Cambridge.

700 Sanes and Rubel - Development of Tuning in LSO
Purpura, D. P., S. Prelevic, and M. Santini (1968) Postsynaptic po- tentials and spike variations in the feline hippocampus during post- natal ontoaenesis. EXD. Neurol. 22: 408-422.
Purpura, D. P., R. J. Shdfer, and T. Scarff (1965) Properties ofsynaptic activities and spike potentials of neurons in immature neocortex. J. Neurophysiol. 28: 925-942.
Ramon y Cajal, S. (1909) Histologie du Systeme Nerveux de I’Homme et des Vertebres, Vol. 1. Institute Ramon y Cajal, Madrid, 1952, pp. 774-838.
Rasmussen, G. L. (1946) The olivary peduncle and other fiber pro- jections of the superior olivary complex. J. Comp. Neurol. 84: 14 l- 219.
Redfem, P. A. (1970) Neuromuscular transmission in newborn rats. J. Physiol. (Lond.) 209: 70 l-709.
Romand, R. (1983) Development in the frequency selectivity of au- ditory nerve fibers in the kitten. Neurosci. Lett. 35: 27 l-276.
Rose, J. E., N. B. Gross, C. D. Geisler, and J. E. Hind (1966) Some neural mechanisms in the inferior colliculus of the cat which may be relevant to localization of a sound source. J. Neurophysiol. 29: 288- 314.
Rubel, E. W (1985) Strategies and problems for future studies of auditory development. Acta Otolaryngol. (Suppl.) 421: 114-128.
Rubel, E. W, and B. M. Ryals (1983) Development of the place principle: Acoustic trauma. Science 219: 5 12-5 14.
Rvals. B. M.. and E. W. Rubel (1985) Ontoaenetic changes in the ‘position of hair cell loss after acoustic overstimulation in avian basilar papilla. Hearing Res. 19: 135-142.
Ryan, A. F., N. K. Woolf, and F. R. Sharp (1982) Functional ontogeny in the central auditory pathway of the Mongolian gerbil. Exp. Brain Res. 47: 428-436.
Ryan, A. F., N. K. Woolf, A. Catanzaro, S. Raverman, and F. R. Sharp (1985) Deoxyglucose uptake patterns in the auditory system: Met- abolic response to sound stimulation in the adult and neonate. In Auditory Biochemistry. D. G. Drescher, ed., pp. 401-421, Thomas, Springfield, IL.
Saito, K. (1979) Development of spinal reflexes in the rat fetus studied in vitro. J. Physiol. (Lond.) 294: 58 l-594.
Sanes, D. H., and M. Constantine-Paton (1985a) The sharpening of frequency tuning curves requires patterned activity during develop- ment in the mouse, Mus musculus. J. Neurosci. 5: 1152-l 166.
Sanes, D. H., and M. Constantine-Paton (1985b) The development of stimulus following in the cochlear nerve and inferior colliculus of the mouse. Dev. Brain Res. 22: 255-267.
Sanes, D. H., and G. F. Wooten (1987) Development of glycine re- ceptor distribution in the lateral superior olive of the gerbil. J. Neu- rosci. 7: 3803-38 11.
Sanes, D. H., W. A. Geary, and G. F. Wooten (1985) The quantitative distribution of ‘H-strychnine binding in the lateral superior olivary nucleus of the gerbil. Sot. Neurosci. Abstr. 15: 105 1.
Sanes, D. H., W. A. Geary, G. F. Wooten, and E. W Rubel (1987) Quantitative distribution of the glycine receptor in the auditory brain stem of the gerbil. J. Neurosci. 7: 3793-3802.
Saunders, J. C., and T. J. Garfinkle (1983) Peripheral anatomy and physiology. In Auditory Psychobiology in the Mouse, J. F. Willott, ed., pp. 131-168, Thomas, Springfield, IL.
Saunders, J. C., K. G. Dolgin, and L. D. Lowry (1980) The maturation offreauencv selectivitv in C57BL/6J mice studied with auditorv evoked response tuning cur&. Brain Res. 187: 69-79.
Schlegel, P. (1977) Directional coding by binaural brainstem units of the CF-FM bat. Rhinolovhos ferrum eauinum. J. Comu. Phvsiol. 118: 327-352. - - -
_
Schwartzkroin, P. A. (1982) Development of rabbit hippocampus: Physiology. Dev. Brain Res. 2: 469-486.
Schwartzkroin, P. A., and D. D. Kunkel (1982) Electrophysiology and morphology of the developing hippocampus of fetal rabbits. J. Neu- rosci. 2: 448-462.
Schwab, J. E., L. B. Haberly, and J. L. Price (1984) The development of physiological responses of the piriform cortex in rats to stimulation of the lateral olfactory tract. J. Comp. Neurol. 223: 223-237.
Shatz, C. J., and P. A. Kirkwood (1984) Prenatal development of functional connections in the cat’s retinogeniculate pathway. J. Neu- rosci. 4: 1378-1397.
Shnerson, A., and R. Pujol (1982) Age-related changes in the C57BL/ 6J mouse cochlea. I. Physiological findings. Dev. Brain Res. 2: 65- -I<
IJ.
Shnerson, A., and J. F. Willott (1979) Development of inferior col- liculus response properties in C57BL/6J mouse pups. Exp. Brain Res. 37: 373-385.
Singer, W. (1977) Effects of monocular deprivation on excitatory and inhibitorv uathwavs in cat striate cortex. EXD. Brain Res. 30: 25-4 1.
Spangler, K. M., W. B. Warr, and C. K. Henkel- (1985) The projections of principal cells of the medial nucleus of the trapezoid body in the cat. J. Comp Neurol. 238: 249-262.
Stillman, R. D. (1972) Responses of high frequency inferior colliculus neurons to interaural intensity differences. Exp. Neurol. 36: 118-126.
Tolbert, L. P., D. K. Morest, and D. A. Yurgelun-Todd (1982) The neuronal architecture of the anteroventral cochlear nucleus of the cat in the region of the cochlear nerve root: Horseradish peroxidase la- beling of identified cell types. Neuroscience 7: 303 l-3052.
Tootle, J. S., and M. J. Friedlander (1986) Postnatal development of receptive field surround inhibition in kitten dorsal lateral geniculate nucleus. J. Neurophysiol. 56: 523-24 1.
Tsuchitani, C., and J. C. Boudreau (1966) Single unit analysis of cat superior olive s-segment with tonal stimuli. J. Neurophysiol. 29: 684- 697.
van Noort, J. (1969) The anatomical basis for frequency analysis in the cochlear nucleus complex. Psychiatr. Neurol. Neurochir. 72: 109- 114.
Warr, W. B. (1966) Fiber degeneration following lesions in the anterior ventral cochlear nucleus of the cat. Exp. Neurol. 14: 453-474.
Warr, W. B. (1982) Parallel ascending pathways from the cochlear nucleus: Neuroanatomical evidence of functional specialization. In Contributions to Sensory Physiology, vol. 7, pp. l-38, W. D. Neff, ed., Academic, New York.
-.
Wiesel, T. N., and D. H. Hubel (1965) Comparison of monocular deprivation and binocular deprivation in cortex of cats. J. Neuro- physiol. 28: 1029-1040.
Willott. .I. F.. and A. Shnerson (1978) Ranid develonment of tunina characteristics of inferior colliculus neurons of mouse pups. Brain Res. 148: 230-233.
Willshaw, D. J., and C. von der Marlsburg (1976) How patterned neural connections can be set uv by self-organization. J. Neurosci. 1: - _ 1369-1387.
Wilson, D. A., and M. Leon (1986) Early appearance of inhibition in the neonatal rat olfactorv bulb. Dev. Brain Res. 26: 289-292.
Woolf, N. K., and A. F. Ryan (1984) The development of auditory function the cochlea of the Mongolian gerbil. Hearing Res. 13: 277- 283.
Woolf, N. K., and A. F. Ryan (1985) Ontogeny of neural discharge patterns in the ventral cochlear nucleus of the Mongolina gerbil. Dev. Brain Res. 17: 131-147.
Zakon, H. H. (1983) Reorganization of connectivity in the amphibian central auditory system following VIIIth nerve regeneration: Time course. J. Neurophysiol. 49: 1410-1427.


![GERBIL – General Entity Annotator Benchmarking Frameworknavigli/pubs/... · BAT-framework [7], our approach goes beyond the state of the art in several respects: GERBIL provides](https://img.dokumen.tips/doc/110x75/60f8d1e629737b15792fbf92/gerbil-a-general-entity-annotator-benchmarking-naviglipubs-bat-framework.jpg)