Embed Size (px)
Citation preview
THE NEW ZEALAND MEDICAL JOURNAL
Journal of the New Zealand Medical Association
NZMJ 2 May 2014, Vol 127 No 1393; ISSN 1175 8716 Page 12 URL: http://journal.nzma.org.nz/journal/127-1393/6105/ ©NZMA
Health system costs by sex, age and proximity to death, and implications for estimation of future expenditure
Tony Blakely, June Atkinson, Giorgi Kvizhinadze, Nhung Nghiem, Heather McLeod, Nick Wilson
Abstract
Aims Health expenditure increases with age, but some of this increase is due to costs proximal to death. We used linked health datasets (HealthTracker) to determine health expenditure by proximity to death. We then determined the impact on future health expenditure projections of accounting for proximity to death in costs.
Methods 2007 to 2009 national health event data were linked for hospitalisations, inpatient procedures, outpatient events, pharmaceuticals, laboratory tests, and primary care consultations. Each event was assigned a cost. Health expenditure by sex, age and whether in last 6 or 12 months of life or not were calculated.
Future health expenditure trends were then estimated for the Statistics New Zealand median projection population counts, with 2010–12 mortality rates reducing by 2% per annum into the future.
Results A total of $8.1, $8.8 and $9.2 billion dollars (inflation-adjusted to 2011 NZ$) was allocated to individual health events in HealthTracker in 2007, 2008 and 2009, respectively.
Citizen costs for people not within 6 months of death ranged from $498 per person-year (10–14 year old females) to $6900 per person-year (90–94 year old males). Per person-year costs in the last 6 months of life were 10-fold higher on average, being maximal at $30,000 or more among infants and the older elderly (80+ years). Similar patterns were apparent for costs within 12 months of death.
For people hypothetically exposed to these 2007–09 health system costs over their full life, the cumulative costs for a person dying at age 70 years was $113,000, and doubled to $223,000 for a person dying at age 90. The proportion of cumulative health expenditure in the last year of life declined with increasing age of death: e.g. 24%, 13% and 10% for someone aged 40, 70 and 90 respectively.
Projections of future health system expenditure were overestimated by 2.3% to 3.5% in 2041 when not accounting for proximity to death in costs.
Conclusions New Zealand is fortunate to have access to rich data on health system costs. The age-specific health system costs per citizen we have calculated can be used in health expenditure projections, for cost-effectiveness analyses, and for considering how public health expenditure is distributed across the life course.
There is widespread concern about the growing percentage of GDP spent on health in all countries. New Zealand is no exception. Public or Government-financed health spending as a percentage of GDP in New Zealand has increased from 3.1% in 1950 to 6.9% in 2011.1
NZMJ 2 May 2014, Vol 127 No 1393; ISSN 1175 8716 Page 13 URL: http://journal.nzma.org.nz/journal/127-1393/6105/ ©NZMA
Treasury have forecast, under their ‘best’ set of assumptions, that by 2060 this might increase to 11.1% of GDP.1 It is important to not be alarmist regarding these statistics: an increase in health spending can be considered appropriate as populations age, longevity increases, the range of effective interventions (be they prevention or treatment) to ‘purchase’ increases, the societal benefit of health spending compared to other sectors (e.g. defence) alters, and the relative cost of health sector activity (labour-intensive) increases relative to other sectors where relative costs decrease due to productivity gains (e.g. from greater use of technology and economies of scale in manufacturing).
The more important issue is what extent of increased spending on health we want as a society, given we largely pay for it through taxes that could be used elsewhere (be it on other Government expenditure, or private use).
Broadly speaking, good management of future health spending will involve a mix of cost growth containment (e.g. Government limits of Vote Health appropriations – as already happens, possible patient out of pocket payments), maximising health sector productivity gains (a major challenge in a labour-intensive sector with high international competitiveness for salaries), and prioritising health spending to the most effective and most cost-effective interventions.
One input into this ‘good management’ is good cost data for projections and cost-effectiveness analyses; the goal of this paper is to determine the pattern of health system expenditure per citizen in 2007 to 2009, by sex, age and (importantly) by proximity to death. Why does this matter? We highlight two reasons.
First, future projections of health spending should allow for life expectancy trends, disability rates and age-related disease trends.2 This translates into allowing for, or modeling, population growth, population aging, increasing longevity, and changing morbidity patterns. In addition, allowing for increasing expectations (often captured as a function of increasing incomes), health workforce capacity, health sector productivity changes, changes in technology and changes in models of care is needed.3
An initial first step to such projections is estimation of costs per citizen by demographics. However, a considerable proportion of the cost of health care occurs at the end of life, and in the future people will very probably be living longer. Thus, it is ideal to have citizen costs separately for those about to die, and those not about to die, to apply in projections. To not do this will over estimate health systems costs if mortality rates continue to fall – or what has been termed the ‘red herring’ argument about over-inflated projections of future health expenditure increases.4,5 In the recent Treasury forecasts, the base model did not model these costs separately – a weakness explicitly recognised as a limitation by the Treasury.1
Second, in health cost-effectiveness analyses6, 7 the cost is the sum of: a) the direct intervention cost (e.g., the cost of a new drug, staff time to deliver the intervention; and having subtracted any immediately averted intervention costs in the comparator (e.g. the cost of the old drug the new drug is replacing)); and b) any health system costs incurred or averted in the future due to changing disease incidence, prevalence, severity and case fatality – often called ‘cost-offsets’.
NZMJ 2 May 2014, Vol 127 No 1393; ISSN 1175 8716 Page 14 URL: http://journal.nzma.org.nz/journal/127-1393/6105/ ©NZMA
These cost-offsets are important. In preventive interventions (e.g. alcohol tax8) the savings to the health system by reduced future admissions are often so large (even after discounting) that the intervention is cost saving. But these cost-offsets can also increase net life time costs, in that an intervention that prevents premature death means that these people continue to live longer and incur health system costs for other unrelated diseases, making the intervention less cost-effective.
One important influence on the final cost-effectiveness ratio is when in time the costs occur, as the further into the future they are the more they are discounted and the fewer people will experience them (due to competing mortality risks).9 A key influence on timing of future costs is the timing of death – which interventions often postpone.
To our knowledge, there have been some attempts to consider the impact of proximity to death on future healthcare costs in New Zealand,2,10 but they have been by reference to international studies2 or through ‘predictive modelling’ of how the proportion of the population within 1 year of death effects health systems costs in projections.10 The only study to our knowledge using actual citizen-level data to estimate costs close to death was for Counties-Manukau.11 The direct estimation of health system costs for all New Zealand citizens, and by proximity to death, using individual-level data, is therefore long overdue.
The specific objectives of this paper are: to estimate health system costs by demographics, for people within and not within 6 or 12 months of death; to estimate what proportion of health system costs over a person’s life occur in the last year of life; and to determine how much impact using costs stratified by proximity to death has on future national health expenditure projections (in the face of population growth, aging and increasing longevity).
We undertake these objectives using routine health data for the vast majority of New Zealand, linked to costs per health system event, so-called HealthTracker data assembled by the Ministry of Health.
Methods
Linked administrative health care datasets with costs attributed—The New Zealand health system has a unique identifier of high quality since about 1990 (the National Health Index [NHI], identifier). The following datasets were linked using this identifier to create a record for each New Zealander of all publically funded health care events (e.g. hospital admission, laboratory test) occurring in January 2007 to December 2011. (However, only the actual 2007-2009 calendar years were used to estimate the costs, a restriction for two reasons: first, one has to discard the most recent year of data for costs as you do not ‘know’ whether someone is within a year of death; second, it became apparent that for earlier and later years, data was not complete on all health events and costs.)
Each health event was then assigned a unit cost: hospitalisations and inpatient procedures (using Ministry of Health cost weights per event12; which include inpatient laboratory tests and pharmaceuticals); some private hospitalisations funded by Vote:Health or Vote:ACC (Accident Compensation Corporation; but not including residential care); community laboratory tests; non-admitted patient events (e.g. outpatients and emergency departments); community pharmaceuticals dispensed (including patient contribution); expected general practice costs (i.e. using capitation funding formula) and some actual general practice consultations (when not an enrolled patient in a capitated practice (i.e. the general medical subsidy)). Goods and sales tax was excluded. All costs were inflation-adjusted to 2011 New Zealand dollars, and were assigned to the event ‘end date’ (which if death, and the person had been (say) in hospital for years would lead to some overestimate of costs proximal to death).
NZMJ 2 May 2014, Vol 127 No 1393; ISSN 1175 8716 Page 15 URL: http://journal.nzma.org.nz/journal/127-1393/6105/ ©NZMA
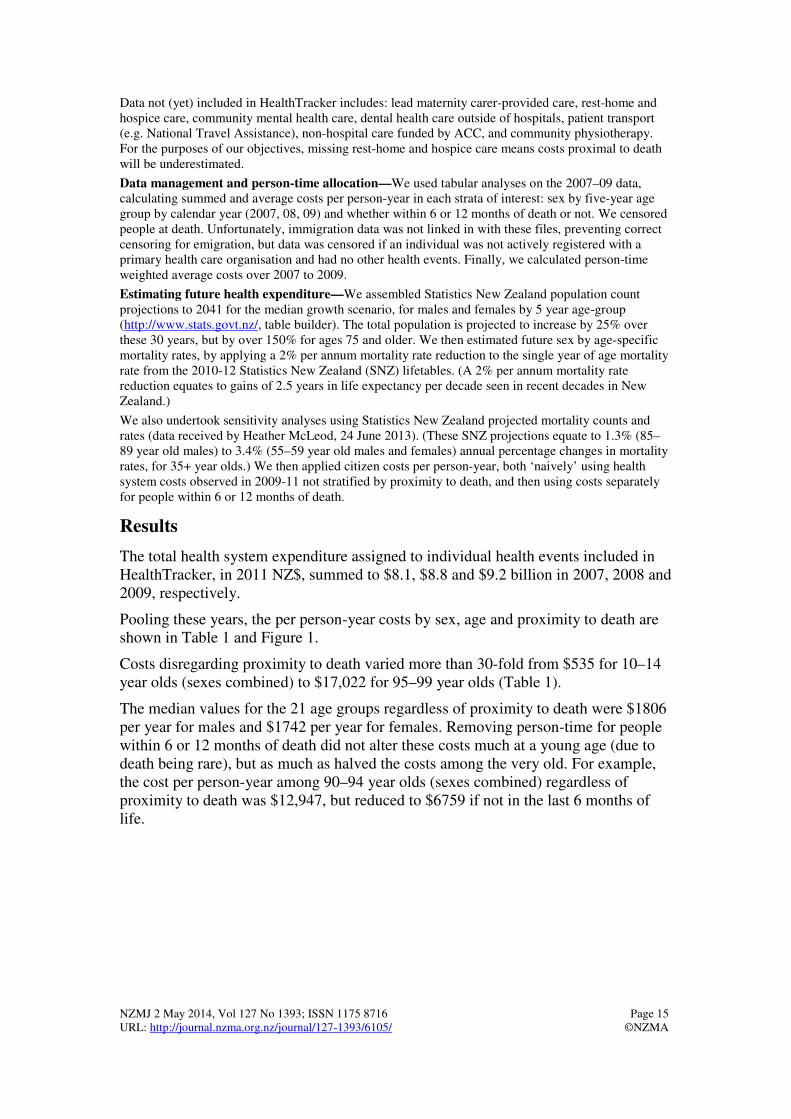
Data not (yet) included in HealthTracker includes: lead maternity carer-provided care, rest-home and hospice care, community mental health care, dental health care outside of hospitals, patient transport (e.g. National Travel Assistance), non-hospital care funded by ACC, and community physiotherapy. For the purposes of our objectives, missing rest-home and hospice care means costs proximal to death will be underestimated.
Data management and person-time allocation—We used tabular analyses on the 2007–09 data, calculating summed and average costs per person-year in each strata of interest: sex by five-year age group by calendar year (2007, 08, 09) and whether within 6 or 12 months of death or not. We censored people at death. Unfortunately, immigration data was not linked in with these files, preventing correct censoring for emigration, but data was censored if an individual was not actively registered with a primary health care organisation and had no other health events. Finally, we calculated person-time weighted average costs over 2007 to 2009.
Estimating future health expenditure—We assembled Statistics New Zealand population count projections to 2041 for the median growth scenario, for males and females by 5 year age-group (http://www.stats.govt.nz/, table builder). The total population is projected to increase by 25% over these 30 years, but by over 150% for ages 75 and older. We then estimated future sex by age-specific mortality rates, by applying a 2% per annum mortality rate reduction to the single year of age mortality rate from the 2010-12 Statistics New Zealand (SNZ) lifetables. (A 2% per annum mortality rate reduction equates to gains of 2.5 years in life expectancy per decade seen in recent decades in New Zealand.)
We also undertook sensitivity analyses using Statistics New Zealand projected mortality counts and rates (data received by Heather McLeod, 24 June 2013). (These SNZ projections equate to 1.3% (85–89 year old males) to 3.4% (55–59 year old males and females) annual percentage changes in mortality rates, for 35+ year olds.) We then applied citizen costs per person-year, both ‘naively’ using health system costs observed in 2009-11 not stratified by proximity to death, and then using costs separately for people within 6 or 12 months of death.
Results
The total health system expenditure assigned to individual health events included in HealthTracker, in 2011 NZ$, summed to $8.1, $8.8 and $9.2 billion in 2007, 2008 and 2009, respectively.
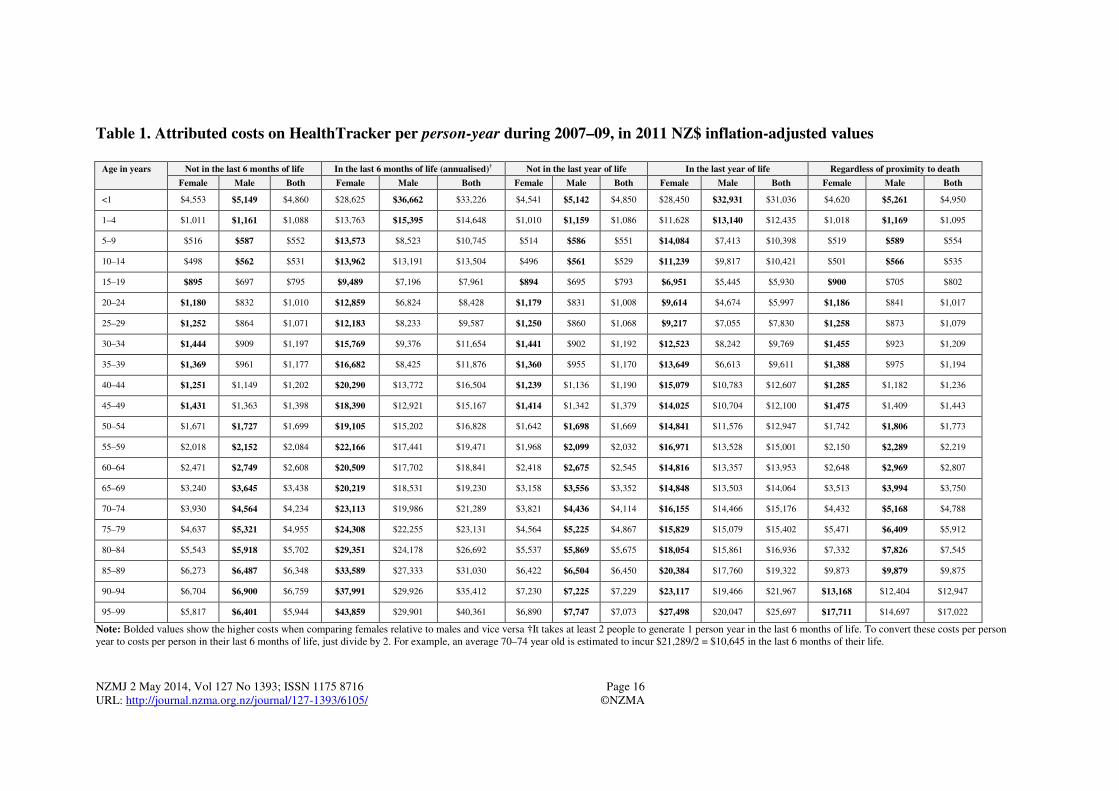
Pooling these years, the per person-year costs by sex, age and proximity to death are shown in Table 1 and Figure 1.
Costs disregarding proximity to death varied more than 30-fold from $535 for 10–14 year olds (sexes combined) to $17,022 for 95–99 year olds (Table 1).
The median values for the 21 age groups regardless of proximity to death were $1806 per year for males and $1742 per year for females. Removing person-time for people within 6 or 12 months of death did not alter these costs much at a young age (due to death being rare), but as much as halved the costs among the very old. For example, the cost per person-year among 90–94 year olds (sexes combined) regardless of proximity to death was $12,947, but reduced to $6759 if not in the last 6 months of life.
NZMJ 2 May 2014, Vol 127 No 1393; ISSN 1175 8716 Page 16 URL: http://journal.nzma.org.nz/journal/127-1393/6105/ ©NZMA
Table 1. Attributed costs on HealthTracker per person-year during 2007–09, in 2011 NZ$ inflation-adjusted values
Age in years Not in the last 6 months of life In the last 6 months of life (annualised)† Not in the last year of life In the last year of life Regardless of proximity to death
Female Male Both Female Male Both Female Male Both Female Male Both Female Male Both
<1 $4,553 $5,149 $4,860 $28,625 $36,662 $33,226 $4,541 $5,142 $4,850 $28,450 $32,931 $31,036 $4,620 $5,261 $4,950
1–4 $1,011 $1,161 $1,088 $13,763 $15,395 $14,648 $1,010 $1,159 $1,086 $11,628 $13,140 $12,435 $1,018 $1,169 $1,095
5–9 $516 $587 $552 $13,573 $8,523 $10,745 $514 $586 $551 $14,084 $7,413 $10,398 $519 $589 $554
10–14 $498 $562 $531 $13,962 $13,191 $13,504 $496 $561 $529 $11,239 $9,817 $10,421 $501 $566 $535
15–19 $895 $697 $795 $9,489 $7,196 $7,961 $894 $695 $793 $6,951 $5,445 $5,930 $900 $705 $802
20–24 $1,180 $832 $1,010 $12,859 $6,824 $8,428 $1,179 $831 $1,008 $9,614 $4,674 $5,997 $1,186 $841 $1,017
25–29 $1,252 $864 $1,071 $12,183 $8,233 $9,587 $1,250 $860 $1,068 $9,217 $7,055 $7,830 $1,258 $873 $1,079
30–34 $1,444 $909 $1,197 $15,769 $9,376 $11,654 $1,441 $902 $1,192 $12,523 $8,242 $9,769 $1,455 $923 $1,209
35–39 $1,369 $961 $1,177 $16,682 $8,425 $11,876 $1,360 $955 $1,170 $13,649 $6,613 $9,611 $1,388 $975 $1,194
40–44 $1,251 $1,149 $1,202 $20,290 $13,772 $16,504 $1,239 $1,136 $1,190 $15,079 $10,783 $12,607 $1,285 $1,182 $1,236
45–49 $1,431 $1,363 $1,398 $18,390 $12,921 $15,167 $1,414 $1,342 $1,379 $14,025 $10,704 $12,100 $1,475 $1,409 $1,443
50–54 $1,671 $1,727 $1,699 $19,105 $15,202 $16,828 $1,642 $1,698 $1,669 $14,841 $11,576 $12,947 $1,742 $1,806 $1,773
55–59 $2,018 $2,152 $2,084 $22,166 $17,441 $19,471 $1,968 $2,099 $2,032 $16,971 $13,528 $15,001 $2,150 $2,289 $2,219
60–64 $2,471 $2,749 $2,608 $20,509 $17,702 $18,841 $2,418 $2,675 $2,545 $14,816 $13,357 $13,953 $2,648 $2,969 $2,807
65–69 $3,240 $3,645 $3,438 $20,219 $18,531 $19,230 $3,158 $3,556 $3,352 $14,848 $13,503 $14,064 $3,513 $3,994 $3,750
70–74 $3,930 $4,564 $4,234 $23,113 $19,986 $21,289 $3,821 $4,436 $4,114 $16,155 $14,466 $15,176 $4,432 $5,168 $4,788
75–79 $4,637 $5,321 $4,955 $24,308 $22,255 $23,131 $4,564 $5,225 $4,867 $15,829 $15,079 $15,402 $5,471 $6,409 $5,912
80–84 $5,543 $5,918 $5,702 $29,351 $24,178 $26,692 $5,537 $5,869 $5,675 $18,054 $15,861 $16,936 $7,332 $7,826 $7,545
85–89 $6,273 $6,487 $6,348 $33,589 $27,333 $31,030 $6,422 $6,504 $6,450 $20,384 $17,760 $19,322 $9,873 $9,879 $9,875
90–94 $6,704 $6,900 $6,759 $37,991 $29,926 $35,412 $7,230 $7,225 $7,229 $23,117 $19,466 $21,967 $13,168 $12,404 $12,947
95–99 $5,817 $6,401 $5,944 $43,859 $29,901 $40,361 $6,890 $7,747 $7,073 $27,498 $20,047 $25,697 $17,711 $14,697 $17,022
Note: Bolded values show the higher costs when comparing females relative to males and vice versa †It takes at least 2 people to generate 1 person year in the last 6 months of life. To convert these costs per person year to costs per person in their last 6 months of life, just divide by 2. For example, an average 70–74 year old is estimated to incur $21,289/2 = $10,645 in the last 6 months of their life.
NZMJ 2 May 2014, Vol 127 No 1393; ISSN 1175 8716 Page 17 URL: http://journal.nzma.org.nz/journal/127-1393/6105/ ©NZMA
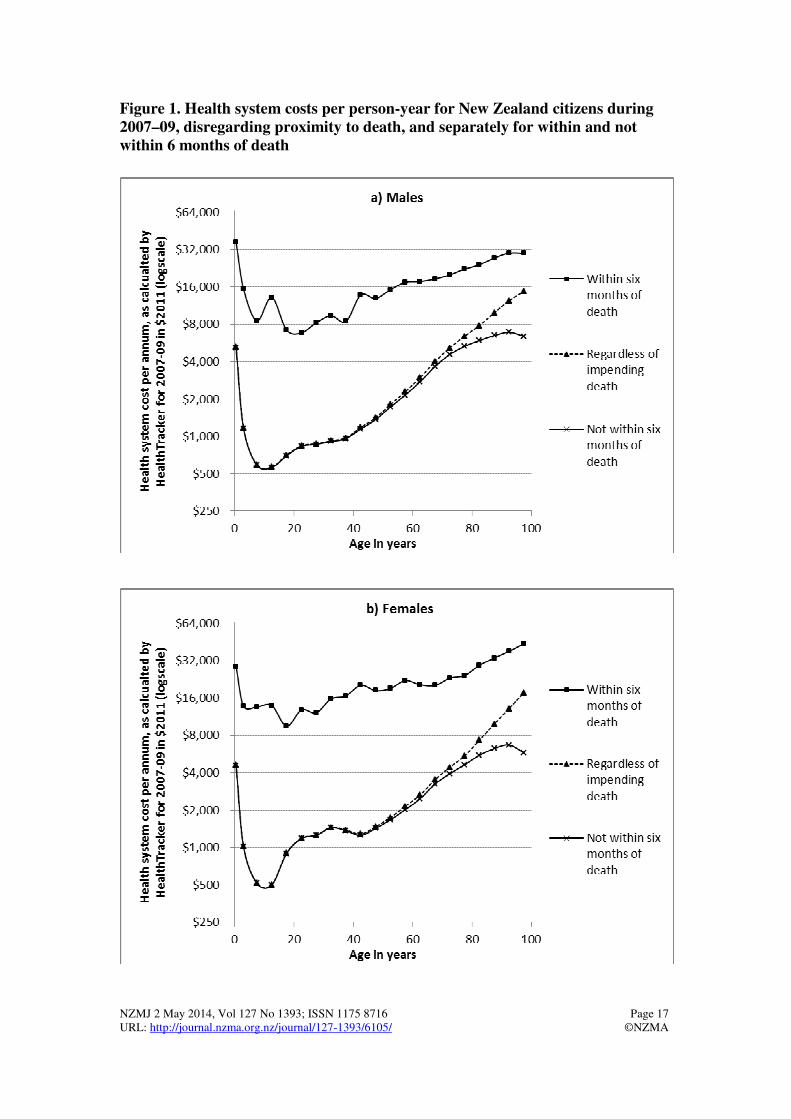
Figure 1. Health system costs per person-year for New Zealand citizens during 2007–09, disregarding proximity to death, and separately for within and not within 6 months of death
NZMJ 2 May 2014, Vol 127 No 1393; ISSN 1175 8716 Page 18 URL: http://journal.nzma.org.nz/journal/127-1393/6105/ ©NZMA
Considering the costs among people within 6 months of death, these costs varied only five-fold between age groups. That is, there was less percentage or relative variation by age in costs during the last 6 months of life, as reflected in the flatter lines (log scale y axis) in Figure 1 for costs within 6 months of life compared to the two other cost lines. This similar ‘flatter’ pattern was true also for costs in the last 12 months of life (Table 1).
Differences in costs over the life course between males and females showed a mixed picture (Table 1). Costs were higher for males up to age 15 years and then costs were higher for females up to age 50 years (no doubt partly due to obstetric-related costs). There were quite large sex differences in costs in the last 6 months of life (nearly always higher in females). This probably reflects higher incidence rates of sudden death in males without preceding chronic illnesses (e.g., death from motor vehicle crashes, occupational injuries and suicide).
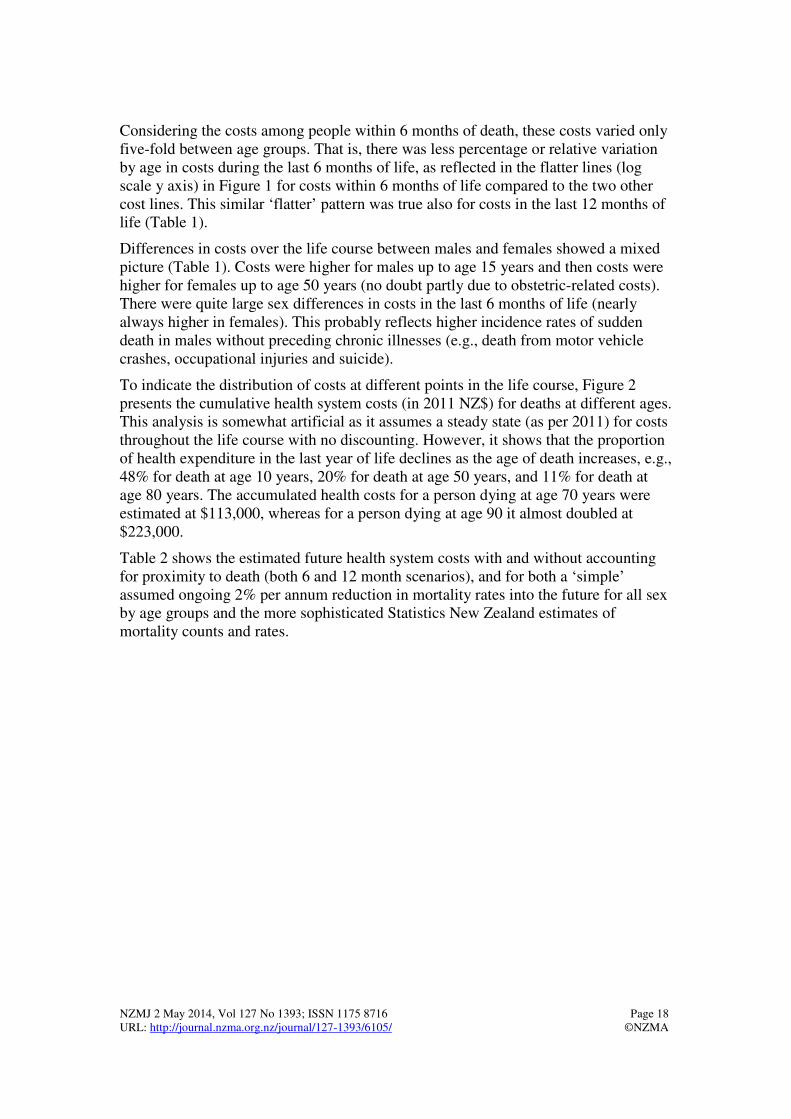
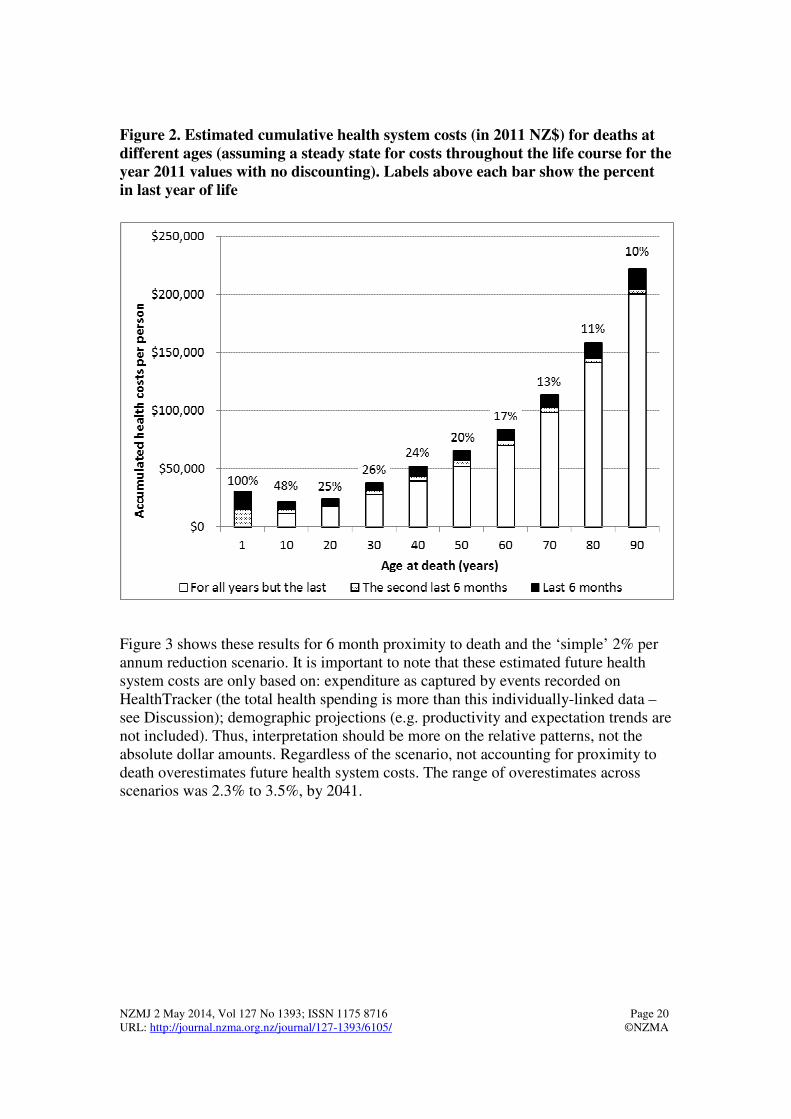
To indicate the distribution of costs at different points in the life course, Figure 2 presents the cumulative health system costs (in 2011 NZ$) for deaths at different ages. This analysis is somewhat artificial as it assumes a steady state (as per 2011) for costs throughout the life course with no discounting. However, it shows that the proportion of health expenditure in the last year of life declines as the age of death increases, e.g., 48% for death at age 10 years, 20% for death at age 50 years, and 11% for death at age 80 years. The accumulated health costs for a person dying at age 70 years were estimated at $113,000, whereas for a person dying at age 90 it almost doubled at $223,000.
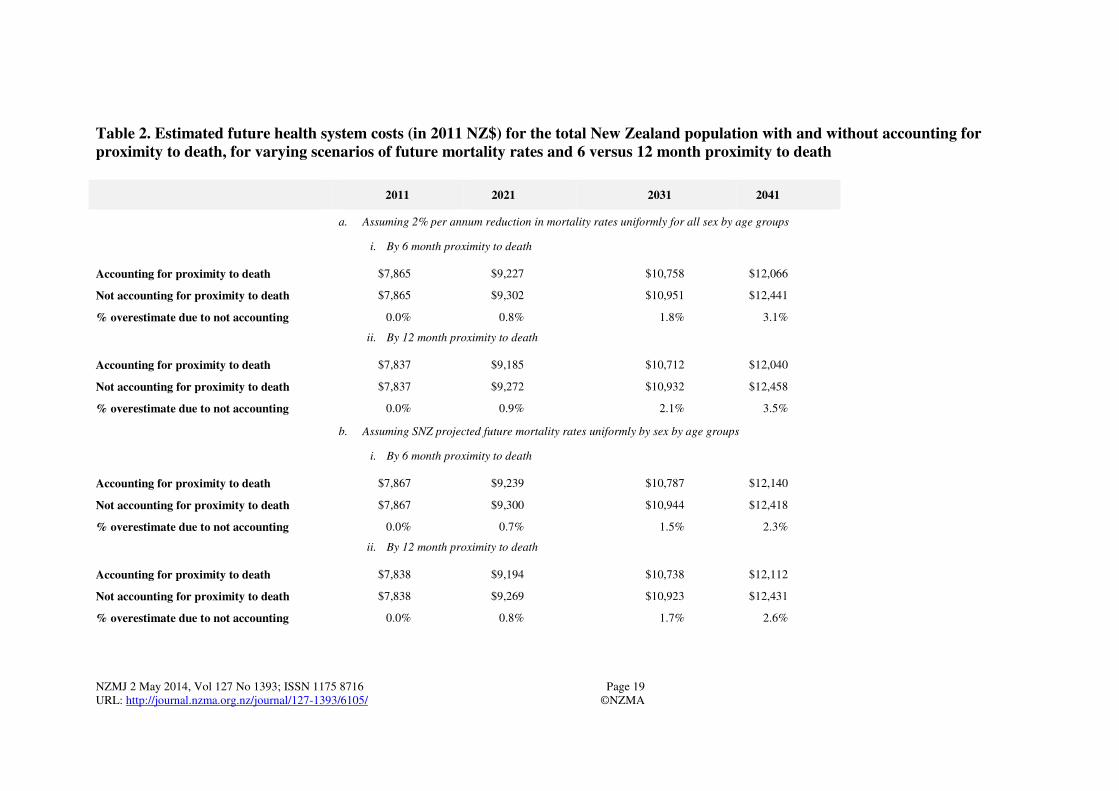
Table 2 shows the estimated future health system costs with and without accounting for proximity to death (both 6 and 12 month scenarios), and for both a ‘simple’ assumed ongoing 2% per annum reduction in mortality rates into the future for all sex by age groups and the more sophisticated Statistics New Zealand estimates of mortality counts and rates.
NZMJ 2 May 2014, Vol 127 No 1393; ISSN 1175 8716 Page 19 URL: http://journal.nzma.org.nz/journal/127-1393/6105/ ©NZMA
Table 2. Estimated future health system costs (in 2011 NZ$) for the total New Zealand population with and without accounting for proximity to death, for varying scenarios of future mortality rates and 6 versus 12 month proximity to death
2011 2021 2031 2041
a. Assuming 2% per annum reduction in mortality rates uniformly for all sex by age groups
i. By 6 month proximity to death
Accounting for proximity to death $7,865 $9,227 $10,758 $12,066
Not accounting for proximity to death $7,865 $9,302 $10,951 $12,441
% overestimate due to not accounting 0.0% 0.8% 1.8% 3.1%
ii. By 12 month proximity to death
Accounting for proximity to death $7,837 $9,185 $10,712 $12,040
Not accounting for proximity to death $7,837 $9,272 $10,932 $12,458
% overestimate due to not accounting 0.0% 0.9% 2.1% 3.5%
b. Assuming SNZ projected future mortality rates uniformly by sex by age groups
i. By 6 month proximity to death
Accounting for proximity to death $7,867 $9,239 $10,787 $12,140
Not accounting for proximity to death $7,867 $9,300 $10,944 $12,418
% overestimate due to not accounting 0.0% 0.7% 1.5% 2.3%
ii. By 12 month proximity to death
Accounting for proximity to death $7,838 $9,194 $10,738 $12,112
Not accounting for proximity to death $7,838 $9,269 $10,923 $12,431
% overestimate due to not accounting 0.0% 0.8% 1.7% 2.6%
NZMJ 2 May 2014, Vol 127 No 1393; ISSN 1175 8716 Page 20 URL: http://journal.nzma.org.nz/journal/127-1393/6105/ ©NZMA
Figure 2. Estimated cumulative health system costs (in 2011 NZ$) for deaths at different ages (assuming a steady state for costs throughout the life course for the year 2011 values with no discounting). Labels above each bar show the percent in last year of life
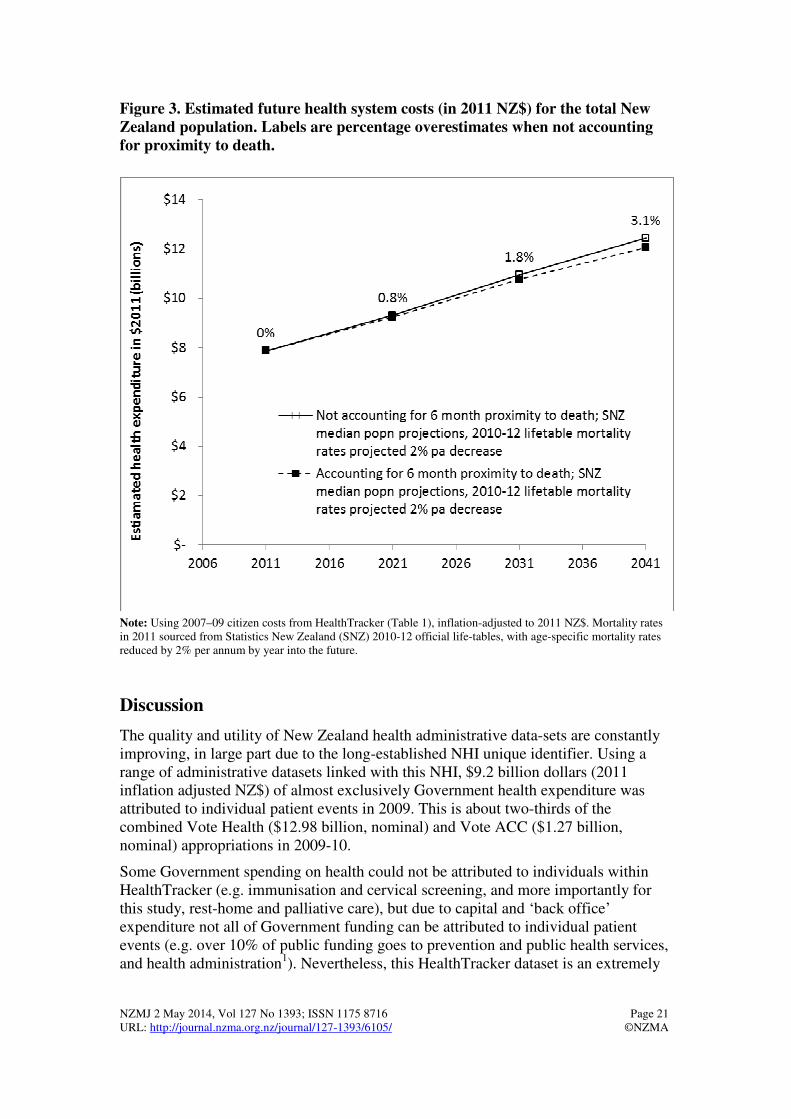
Figure 3 shows these results for 6 month proximity to death and the ‘simple’ 2% per annum reduction scenario. It is important to note that these estimated future health system costs are only based on: expenditure as captured by events recorded on HealthTracker (the total health spending is more than this individually-linked data – see Discussion); demographic projections (e.g. productivity and expectation trends are not included). Thus, interpretation should be more on the relative patterns, not the absolute dollar amounts. Regardless of the scenario, not accounting for proximity to death overestimates future health system costs. The range of overestimates across scenarios was 2.3% to 3.5%, by 2041.
NZMJ 2 May 2014, Vol 127 No 1393; ISSN 1175 8716 Page 21 URL: http://journal.nzma.org.nz/journal/127-1393/6105/ ©NZMA
Figure 3. Estimated future health system costs (in 2011 NZ$) for the total New Zealand population. Labels are percentage overestimates when not accounting for proximity to death.
Note: Using 2007–09 citizen costs from HealthTracker (Table 1), inflation-adjusted to 2011 NZ$. Mortality rates in 2011 sourced from Statistics New Zealand (SNZ) 2010-12 official life-tables, with age-specific mortality rates reduced by 2% per annum by year into the future.
Discussion
The quality and utility of New Zealand health administrative data-sets are constantly improving, in large part due to the long-established NHI unique identifier. Using a range of administrative datasets linked with this NHI, $9.2 billion dollars (2011 inflation adjusted NZ$) of almost exclusively Government health expenditure was attributed to individual patient events in 2009. This is about two-thirds of the combined Vote Health ($12.98 billion, nominal) and Vote ACC ($1.27 billion, nominal) appropriations in 2009-10.
Some Government spending on health could not be attributed to individuals within HealthTracker (e.g. immunisation and cervical screening, and more importantly for this study, rest-home and palliative care), but due to capital and ‘back office’ expenditure not all of Government funding can be attributed to individual patient events (e.g. over 10% of public funding goes to prevention and public health services, and health administration1). Nevertheless, this HealthTracker dataset is an extremely
NZMJ 2 May 2014, Vol 127 No 1393; ISSN 1175 8716 Page 22 URL: http://journal.nzma.org.nz/journal/127-1393/6105/ ©NZMA
rich dataset for analyses, and is likely to continue to improve in the future. As examples, it is already contributing data for work by the National Health Committee on a high-level scan of health spending in order to select domains of health service use for further work on prioritisation,13 and for Treasury projections of future health expenditure.1
We found that citizen costs per person-year, not surprisingly, varied enormously by age. They also varied by proximity to death. Accordingly, and focusing only on demographic drivers to future health expenditure, we estimated that not allowing separately for costs within the last 6 months of life would result in a two to four percent overestimation of health expenditure. We suspect the true overestimation from not accounting for proximity to death in New Zealand might be greater still, as palliative and rest home care is a major component of ‘missing data’ in HealthTracker.
The recent Treasury projections – whilst more sophisticated in that they also projected changing demand and productivity – did not account for proximity to death. Based on the findings of this paper, it seems Treasury estimates are therefore slight overestimates considering the ‘proximity to death’ factor alone, but the bias is probably not large. The Treasury estimates also included relatively simple sensitivity analyses about future compression and expansion of morbidity, which will perhaps partly pick up the proximity to death issue as well. However, we recommend that future New Zealand expenditure projections directly avoid the ‘red herring’ argument4,5 by using cost data by proximity to death, as both the data are available and little complexity is added to projections.
Our modelling, however, does not fully address any future compression or expansion of morbidity that is not captured directly by proximity to death. For example, the diabetes epidemic may increase morbidity (and demand for health services) if we are less successful at reducing incidence than we are at keeping people alive with diabetes, thereby seeing an expansion in morbidity (diabetes disease severity held constant, and likewise other causes of morbidity held constant). Conversely, if New Zealand society successfully controls obesity, this may reduce morbidity prevalence (through diabetes, but also cardiovascular disease, musculoskeletal and other impacts).
Determining past trends in compression or expansion in morbidity is challenging,14-16 let alone estimating future trends. That said, we suggest that one method to include this in future expenditure projections is to use disability-adjusted life expectancy (DALE; as estimated in the recent New Zealand Burden of Disease study17), assume the same ratio of DALE to life expectancy (DALE:LE) in the future, and then back estimate by what percentage the prevalent years of life lived with disability (pYLDs) would need to change in the future to keep the DALE:LE ratio constant (or whatever other ratio is considered plausible). The percentage change in pYLDs across all sex by age groups necessary to generate the desired DALE:LE ratio in the future can then be used as a proxy for morbidity change, and therefore rescaling of the costs not within the last 6 or 12 months of life shown in Table 1.
Our analysis of the cumulative costs at different points in the life course suggests that the proportion of health expenditure in the last year of life is not unexpectedly high e.g., at 11% for a person dying at age 80 years. Again, we must note that
NZMJ 2 May 2014, Vol 127 No 1393; ISSN 1175 8716 Page 23 URL: http://journal.nzma.org.nz/journal/127-1393/6105/ ©NZMA
HealthTracker does not include rest-home and palliative care data, so this 11% is probably an underestimate. (Future analyses should both include more data for these sources, and/or make sensible scaling adjustments based on missing data.) However, our findings are not consistent with blanket statements that 25% of all health care costs are incurred in the last year of life (e.g. Cornwall and Davey2, citing Wanless18): rather, it varies by age and is probably not as great as 25% at the older ages that people usually die at.
The accumulated life time health costs for a person dying at age 90 years were almost double those of a person dying at 70 years ($223,000 versus $113,000). This difference raises distributional issues and is something that policy makers and citizens could ponder. That is, would some of this resource be better spent on preventing disease in younger people, e.g., by expenditure on protecting child health and investing more in education and housing quality etc? To start answering this question thoughtfully would require studies of how New Zealand citizens value years of healthy life over the life course and also the cost-effectiveness of different health sector interventions that achieve health gain at different points in the life course.
There are limitations to the data and analyses in this paper. First, HealthTracker data is not yet complete with respect to linkage to all publicly funded events – we expect the quality to improve further over time. We have already mentioned rest-home and palliative care on several occasions above. Second, Health Tracker includes very little of privately funded health expenditure. But given that 83% of all health system expenditure is estimated to be publicly funded in New Zealand,1 this limitation is not too severe. Third, primary care costs are very simply assigned to citizens using the capitation formula and so our analyses will underestimate costs near death if primary care utilisation increases near death. But given that primary care expenditure is not a large component of end of life care in New Zealand,11 this probably would not cause much of an underestimation in the estimation of the costs in the last 6 months of life.
Finally, this study did not estimate costs by ethnicity since it seems likely that any such cost differences will be due to conflated differences in need, access and utilisation of health services, and as such requires separate and careful analysis and interpretation.
Summarising, there is marked variation in health system costs by age and proximity to death, and some by sex. Good planning has allowed New Zealand to establish a rich dataset on health system costs, and this dataset should continue to improve in quality over time.
The onus on researchers, analysts and planners is to make good use of it. Two good uses of the data we emphasise are using cost estimates by proximity to death in: estimations of future health system costs; and cost-effectiveness evaluations to allow ‘correct’ attribution of costs by proximity to death.9
Competing interests: Nil.
Author information: Tony Blakely, Research Professor, Department of Public Health, University of Otago, Wellington; June Atkinson, Data Analyst, Department of Public Health, University of Otago, Wellington; Giorgi Kvizhinadze, Research Fellow, Department of Public Health, University of Otago, Wellington; Nhung Nghiem, Research Fellow, Department of Public Health, University of Otago,
NZMJ 2 May 2014, Vol 127 No 1393; ISSN 1175 8716 Page 24 URL: http://journal.nzma.org.nz/journal/127-1393/6105/ ©NZMA
Wellington; Heather McLeod, School of Management Studies, University of Cape Town, South Africa; Nick Wilson, Associate Professor, Department of Public Health, University of Otago, Wellington
Funding: The Burden of Disease Epidemiology, Equity and Cost-Effectiveness Programme is funded by the Health Research Council of New Zealand (10/248).
Acknowledgements: Access to HealthTracker data was provided by the Ministry of Health. In particular, we acknowledge the efforts and foresight of Craig Wright in initially assembling the data, Anna Davies for ongoing quality improvement and documentation, and managers within the Ministry who had the foresight to ensure this data source was created and made available.
We acknowledge useful comments on this manuscript from Bronwyn Croxson and Wing Cheuk Chan.
Correspondence: Tony Blakely, Department of Public Health, University of Otago, Wellington, PO Box 7343, Wellington, New Zealand. Email: [email protected]
References:
1. New Zealand Treasury. Health projections and policy options for the 2013 long-term fiscal statement. Draft paper for the long-term fiscal external panel. Wellington: New Zealand Treasury, 2012.
2. Cornwall J, Davey J. Impact of Population Ageing in New Zealand on the Demand for Health and Disability Support Services, and Workforce Implications. A background paper completed for the Ministry of Health. Wellington: New Zealand Institute for Research on Ageing (NZiRA) and the Health Services Research Centre (HSRC), Victoria University of Wellington, 2004.
3. Przywara B. Projecting future health care expenditure at European level: drivers, methodology and main results. Brussels: Directorate General Economic and Monetary Affairs, European Commission, 2010.
4. Polder JJ, Barendregt JJ, van Oers H. Health care costs in the last year of life—The Dutch experience. Soc Sci Med. 2006;63:1720-31.
5. Zweifel P, Felder S, Meiers M. Ageing of population and health care expenditure: A red herring? Health Econ. 1999;8:485–96.
6. Drummond M, Sculpher M, Torrance G, et al. Methods for the Economic Evaluation of Health Care Programmes (Third Edition). London: Oxford University Press, 2005.
7. Briggs A, Sculpher M, Claxton K. Decision modelling for health economic evaluation. New York: Oxford University Press, 2006.
8. Cobiac L, Vos T, Doran C, Wallace A. Cost-effectiveness of interventions to prevent alcohol-related disease and injury in Australia. Addiction. 2009;104:1646-55.
9. van Baal PHM, Feenstra TL, Polder JJ, et al. Economic evaluation and the postponement of health care costs. Health Econ. 2011;20:432-45.
10. Bryant J, Teasdale A, Tobias M, Cheung J, McHugh M. Population Ageing and Government Health Expenditures in New Zealand, 1951–2051. Wellington: The Treasury. URL: http://www.treasury.govt.nz/publications/research-policy/wp/2004/04-14 New Zealand Treasury Working Paper. Wellington: New Zealand Treasury, 2004.
11. Chan W, Jackson G, Winnard D, Anderson P. Healthcare services funded by Counties Manukau District Health Board for people in the last year of life. N Z Med J. 2011;124:40-51.
12. Ministry of Health. New Zealand casemix framework for publicly funded hospitals, including wiesnz11 methodology and casemix purchase unit allocation. Wellington: Ministry of Health, 2013.
NZMJ 2 May 2014, Vol 127 No 1393; ISSN 1175 8716 Page 25 URL: http://journal.nzma.org.nz/journal/127-1393/6105/ ©NZMA
13. National Health Committee. Strategic Overview: Cardiovascular Disease in New Zealand (Working Draft). Wellington: National Health Committee, 2013.
14. Graham P, Blakely T, Davis P, et al. Compression, expansion, or dynamic equilibrium? The evolution of health expectancy in New Zealand. J Epidemiol Community Health. 2004;58:659-66.
15. Christensen K, Doblhammer G, Rau R, Vaupel J. Ageing populations: the challenges ahead. Lancet. 2009;374:1196-208.
16. Statistics New Zealand, Ministry of Health. Longer Life, Better Health? Trends in health expectancy in New Zealand, 1996–2006. Wellington: Statistics New Zealand, 2009.
17. Ministry of Health. Health Loss in New Zealand: A report from the New Zealand Burden of Diseases, Injuries and Risk Factors Study, 2006–2016. Wellington: Ministry of Health, 2013.
18. Wanless D. Securing good health for the whole population. London: HM Treasury and Department of Health, HMSO, 2004. London: HM Treasury, 2004.