Embed Size (px)
Citation preview

FIG. 16. The eye of Hurricane Floyd near its peak intensity 13 Sep 1999. Floyd was a part of the upturn in Atlantic hurricane activity that began in 1995. [Source: Neal Dorst, NOAA.]
A history of the National Hurricane Research Project and its progeny organizations relates its origins and early organization, its involvement in hurricane modification, and its present research using cutting edge technology.
THE NATIONAL HURRICANE RE 50 Years of Research, Rough Rides, and Name ChangesBY NEAL M. DORST
T ropical cyclones have plagued coastal communities for millennia, yet mankind knew little about these storms prior to the nineteenth century, when J. Farrar, W. Redfield, and W. Reid established that hurricanes were circulatory rather than straight-line surges
of wind (Fleming 1990). It was not until the late nineteenth century that scientists compre-hended the differences between tropical and extratropical cyclones (Kutzbach 1979). Prior to the 1930s, they thought tropical cyclones extended less than 6 km in height (Newnham 1922). Many prominent meteorologists, up through 1950, thought that equatorial baroclinic zones initiated tropical cyclones (Bergeron 1954).
These misconceptions were due to a lack of in situ observations. Much of the tropical cyclone’s life cycle occurs over the ocean, where few weather observations were made. When tropical cyclones were detected, ships avoided them, depriving scientists of needed data.
1566 OCTOBER 2007|

SEARCH PROJECT
When mature tropical cyclones made landfall, severe conditions made taking observations difficult, and failures in wind-measuring instruments were common.
Palmén (1948) and Bergeron (1954) attempted to define tropical cyclone structure and thermodynamics using limited information. Their schematics, based on soundings that excluded the central core and on surface observations taken in a Philippine typhoon in the 1930s (Depperman 1939), show an eyewall that slopes outward rapidly with its diameter expanding from 10 km at cloud base to 200 km at cloud top (14-km altitude). The tropopause is depicted inside the eye reaching to within a kilometer of the surface.
Several methods compensated for observational deficiencies. Cline (1926) composited land station observations relative to a moving storm center. In 1944, the first radiosonde was released in the eye of a tropical cyclone (Simpson 2003), and the first
1567OCTOBER 2007AMERICAN METEOROLOGICAL SOCIETY |

radar observations were made as a hurricane passed an experimental naval radar station (Sumner 1944). Simpson (1947) and Arakawa (1950) used the passages of tropical cyclones close to radiosonde stations to collect higher-density soundings and analyze vertical structure. Jordan and Jordan (1954) used radiosonde observations in the vicinity of tropical cyclones to map their outer structure at upper levels.
After J. Duckworth’s historic first f light into a hurricane eye in 1943, aircraft observations in the lower portions of tropical cyclones became available. The following year, Major H. Wexler made a flight into the Great Atlantic Hurricane, recording his observations (Wexler 1945). One of the few to follow Wexler in exploiting reconnaissance f lights for scientific observations. Robert Simpson of the U.S. Weather Bureau (USWB), participated in U.S. Air Force (USAF) flights in 1947 (Simpson 1954a), 1951 (Simpson 1952), 1953 (Simpson 1954b), and 1954 (Simpson and Starrett 1955), carrying out what he termed “piggyback experiments.” Using the time between fix requirements, he had the pilots fly into various parts of the storm to explore its structure and use the limited meteorological instruments to measure temperature and wind at different levels.
Simpson advocated the regular use of reconnais-sance to record scientific observations, and urged the USWB to hire researchers to work full time on the “hurricane problem.” Restrictive budgets in this era precluded even this modest investment. It also went against ingrained attitudes within USWB, which saw the bureau as being strictly operational and research as being the purview of universities. Its previous major research effort, the Thunderstorm Project (1946–47) had been directed by college pro-fessors (Braham 1996).
This remained the case until 1954 when Hurricanes Carol and Edna struck New England within 11 days of each other. There had not been a hurricane landfall
in this region for a decade. The combined effects of two strikes within a short period were unnerving to a populace unused to such storms. A month later, Hurricane Hazel struck the Carolina coast, its center passing over Washington, D.C., cutting a damage swath all the way to Ontario, Ottawa, Canada, again battering coastal New England (Gentry 1955). The devastating 1954 hurricane season caused over 193 deaths in the United States and over $756 million in damages, mostly in the northeastern corridor. Adjusting that value not only for inflation but also for increased possessions and greater population density (Pielke and Landsea 1998) would result in damage values totaling $22.8 billion in 2005. By that reckoning, 1954 would rank as the sixth costliest hurricane season in the twentieth century (Jarrell et al. 2001). Many saw this season as a harbinger of a climate shift that would bring tropical tempests regularly to the northeast (Lissner 1955).
THE FORMATION OF NHRP. During the next legislative session, congressmen from an uneasy New England sponsored bills to increase USWB funding. They allocated $2.5 million as a first installment on a new weather radar network. By August 1955, days after Hurricane Connie passed Washington, D.C., to the east and as Hurricane Diane loomed, an additional half-million dollar supplemental bill was passed, allowing USWB to modernize its hurricane warning network, including a tropical cyclone
AFFILIATIONS: DORST—NOAA/Atlantic Oceanographic and Meteorological Laboratory/Hurricane Research Division, Miami, FloridaCORRESPONDING AUTHOR: Neal M. Dorst, NOAA/Atlantic Oceanographic and Meteorological Laboratory/Hurricane Research Division, 4301 Rickenbacker Causeway, Miami, FL 33149E-mail: [email protected]
The abstract for this article can be found in this issue, following the table of contents.DOI:10.1175/BAMS-88-10-1566
In final form 30 May 2007©2007 American Meteorological Society
SOME ROUGH RIDESAlthough NOAA’s Aircraft Operations Center
has an exceptional safety record, you cannot make hun-dreds of hurricane penetrations over the years without a few bad bumps. Throughout this paper you will fi nd some of the more memorable hurricane fl ights in that regard. [Source: Pete Black, Robert Black, Mark DeMaria, Jim DuGranrut, Paul Flaherty, Howie Friedman, Jeff Hawkins, Greg Holland, David Jorgensen, John Kaplan, Terry Lynch, Frank Merceret, Jim McFadden, John Michie, Jack Parrish, Bob Sheets, and Dave Turner.]
HURRICANE GLADYS: 16 OCTOBER 1968, “40 CHARLIE” As this storm exited the western tip of Cuba, the civilian weather bureau aircraft were tasked by NHC because the reconnaissance pattern fell within Cuban air control. After a run along a rainband to measure cloud drops, they made a fi nal eye fi x. Relaxing after the diffi cult part of the fl ight, several of the crew unstrapped their seat belts. The plane unexpectedly encountered severe turbulence, and several were injured. One technician was rushed to the hospital on return to Miami, but recovered enough to return to duty.
1568 OCTOBER 2007|

research effort. Diane’s center passed west of the nation’s capital, and became the first “billion dollar” hurricane (Dunn et al. 1955). Adjusted for inflation, it would be the “six billion dollar hurricane” today.
To coordinate USWB’s tropical cyclone research, Chief Francis Reichelderfer created the National Hurricane Research Project (NHRP), and selected Simpson as its director. After consultation with many world-renowned meteorologists about NHRP’s direction, Simpson recruited the following senior staff: Associate Director Noel LaSeur of Florida State University (FSU); hurricane forecaster Robert Cecil Gentry as assistant director; Arthur Johnson as operations manager; Arthur Youmans, based in Washington, D.C., as business manager; Charles Jordan as research and development meteorologist; and Robert Rados as aircraft instrumentation specialist.
Several staff members traveled from Cape Canaveral, Florida, to Puerto Rico to Bermuda, scouting bases and examining aircraft. They finally selected Morrison Air Force Base in West Palm Beach, Florida, for their re-search operations base (ROB). It had both the support facilities for military aircraft and civilian amenities for scientists, including proximity to the Miami, Florida, hurricane forecast office.
The main data-gathering seg-ment of NHRP was scheduled for 30 months, from April 1956 to October 1958 (NHRP 1956). In addition to a core group of scientists assigned to ROB, NHRP counted on cooperation from several sections of USWB, such as the Office of Meteorological Research (OMR), the Hydrologic Services Division, the Off ice of Climatology, the Extended Fore c a s t Br a nc h , t he Joi nt Numerical Weather Prediction Unit, and each of the hurricane forecast offices in Miami, San Juan, Puerto Rico, New Orleans, Louisiana, Washington, and Boston, Massachusetts (NHRP 1956). There were also contri-butions from academic scien-tists working on grants managed by NHRP. Institutions eventu-ally collaborating included the University of Chicago (UChicago), the Woods Hole Oceanographic
Institute, FSU, the University of Miami (UMiami), New York University, Massachusetts Institute of Technology (MIT), Colorado State University (CSU), University of California, Los Angeles, and the Japanese Meteorological Research Institute. These institutions also supplied priceless support in the form of graduate and undergraduate students who worked at ROB during summer vacation, processing data and participating in research f lights. A good number of these students, such as Howie Bluestein, Russell Elsberry, Neil Frank, Joseph Golden, William Gray, Richard Johnson, Arthur Pike, Bill Proenza, Daryl Rubsam, Clark Smith, Russell De Souza, Victor Wiggert, and Edward Zipser, went on to have distin-guished careers in meteorology.
During its first three hurricane seasons, NHRP used three Hurricane Hunter aircraft and crews on temporary loan from USAF to fly research missions. The two WB-50s had a low operational ceiling (see Table 1), but the WB-47 high-altitude jet was able to fly above in the outflow layer. Rados installed better-quality weather instruments on these planes and a punch card system to automatically record data once per second (NHRP 1956).
TABLE 1. Research aircraft used over 50 years.
Aircraft type
DesignationYears of service
CeilingMaximum
range
WB-50Gull 46007 1956–58 37,000 ft,
11,300 m4000 n mi,7400 kmGull 46032 1956–58
WB-47 Gull 2115 1956–6040,000 ft,12,200 m
3500 n mi,6500 km
DC-6
N6539C“39 Charlie”
1960–7523,000 ft,7,000 m
2600 n mi,4800 kmN6540C
“40 Charlie”1960–72
WB-57 N1005 1960–7143,000 ft,13,100 m
1900 n mi,3500 km
B-26 N800W 1961–6525,000 ft,7,600 m
1900 n mi3500 km
C-54 N91282 1965–6920,000 ft6,100 m
2700 n mi,5200 km
C-130 N6541C 1970–8123,000 ft,7,000 m
1000 n mi,2000 km
P-3
N42RF“Kermit”
1976–present25,000 ft,7,600 m
3300 n mi,6100 kmN43RF
“Miss Piggy”1977–present
G-IVN49RF
“Gonzo”1996–present
45,000 ft,13,700 m
4075 n mi,7550 km
1569OCTOBER 2007AMERICAN METEOROLOGICAL SOCIETY |

Project scientists not only designed flight plans and briefed crews on the scientific mission, but also rode along on the WB-50s, in the “bubble” nose with its spectacular view. From there, they could make detailed observations, direct the f light, and make changes “on the fly,” as warranted. This was a criti-cal change from operational flights, and bore fruit in better scientific quality of the information gathered.
NHRP undertook to test a hurricane balloon beacon, designed by USAF’s Geophysical Research Directorate, and participated with the U.S. Navy (USN) in an attempt to photograph tropical cyclones from suborbital rockets (NHRP 1956). The beacon idea was inspired by Simpson’s observations of a “hub cloud” in the eye of Typhoon Marge (Simpson 1952) caused by convergent winds. He reasoned that a constant-altitude balloon, with a radio beacon, released in the eye would keep in the center because of this circulation. It could be tracked remotely, either by aircraft outside the storm or by land stations.
The rocket program used film cameras mounted in the nose cone with a homing signal. The plan was that, when a tropical cyclone approached either Wallops Island, Virginia, or later Cape Canaveral, USN would launch a rocket and photograph the
upper clouds of the hurricane from the edge of space. Falling near the launch site, USN vessels and aircraft would track its signal to recover the film. If all went as planned, meteorologists would have an unprecedented look at the upper structure of tropi-cal cyclones.
NHRP also supported the establishment, manning, and maintenance of additional upper-air stations scattered around the Caribbean Sea (NHRP 1956). These stations provided better synoptic analyses for forecasts and a better understanding of the atmo-sphere in this poorly sampled region. The stations were eventually turned over to the weather services of the nations where they were located, although USWB continued to supply and support them. This fostered a closer working relationship between these services, and built a better hurricane warning network.
THE RESEARCH OPERATIONS BASE. Twenty-four scientists were based at NHRP’s ROB in West Palm Beach (Fig. 1). In addition to senior staff, there were analysts and chartists making up the Experimental Analysis Unit, which collected weather reports, including soundings from the new radiosonde network, made detailed, novel maps, and investigated new ways to present the data to assist forecasters. NHRP managers also used these analyses to plan aircraft missions. Additional NHRP scientists (Banner Miller, Paul Moore, Gilbert Clark, and Lester Hubert) were assigned to the Miami and Asheville, North Carolina, offices to research forecast methods and archive operational data. They tried new objective tropical cyclone forecasting techniques, such as Riehl–Haggard method (Riehl and Haggard 1954), and observed how forecasters used information presented to them.
The first research f light for NHRP was into Hurricane Betsy on 13 August 1956 while the storm was over the Turks and Caicos Islands. This and the following mission were minor disasters, with equipment failures and dropped punch card decks
FIG. 1. Bob Simpson and Cecil Gentry outside the Research Operations Base, West Palm Beach, FL, 1956. [Source: NOAA.]
HURRICANE EDITH: 9 SEPTEMBER 1971, “39 CHARLIE” Edith was approaching the Mosquito Coast of Nicaragua
and intensifying on this day. The early eye penetrations went well, but on the last one the eye had shrunk to seven miles in diameter. The turbulence was so severe that the pilots temporarily lost control of the aircraft. By the time they regained control, they had lost 1000 feet (300 m) of altitude.
1570 OCTOBER 2007|
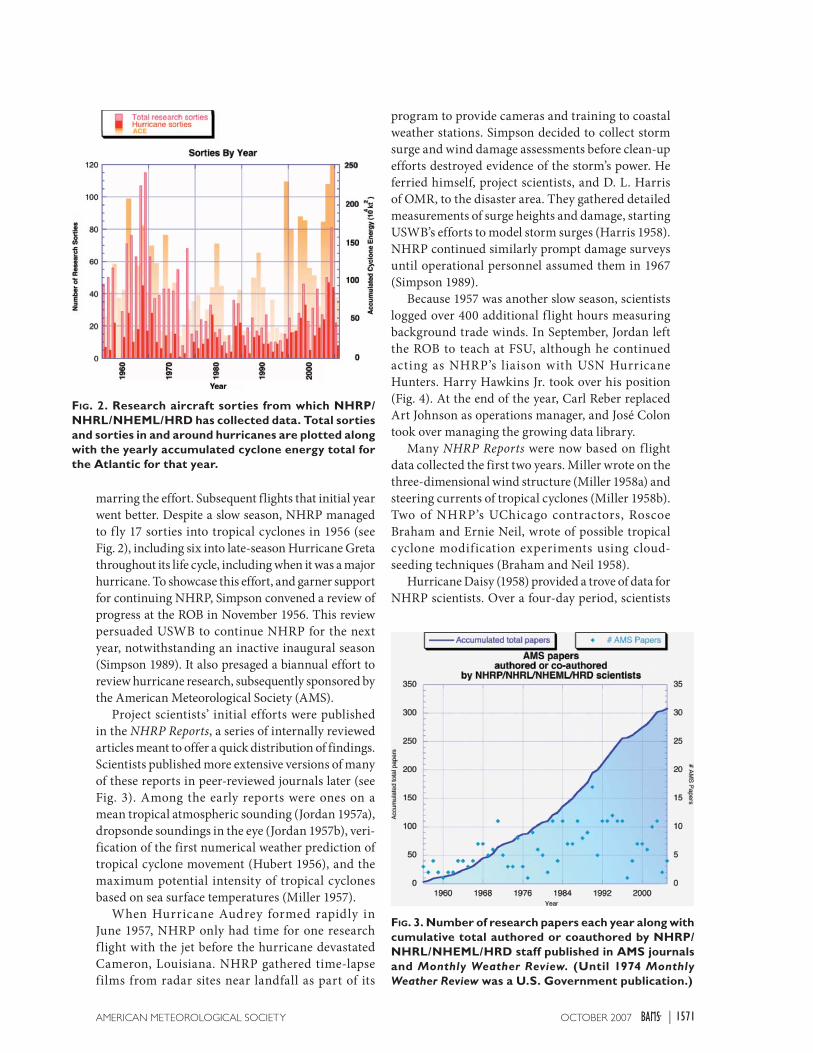
marring the effort. Subsequent flights that initial year went better. Despite a slow season, NHRP managed to f ly 17 sorties into tropical cyclones in 1956 (see Fig. 2), including six into late-season Hurricane Greta throughout its life cycle, including when it was a major hurricane. To showcase this effort, and garner support for continuing NHRP, Simpson convened a review of progress at the ROB in November 1956. This review persuaded USWB to continue NHRP for the next year, notwithstanding an inactive inaugural season (Simpson 1989). It also presaged a biannual effort to review hurricane research, subsequently sponsored by the American Meteorological Society (AMS).
Project scientists’ initial efforts were published in the NHRP Reports, a series of internally reviewed articles meant to offer a quick distribution of findings. Scientists published more extensive versions of many of these reports in peer-reviewed journals later (see Fig. 3). Among the early reports were ones on a mean tropical atmospheric sounding (Jordan 1957a), dropsonde soundings in the eye (Jordan 1957b), veri-fication of the first numerical weather prediction of tropical cyclone movement (Hubert 1956), and the maximum potential intensity of tropical cyclones based on sea surface temperatures (Miller 1957).
When Hurricane Audrey formed rapidly in June 1957, NHRP only had time for one research f light with the jet before the hurricane devastated Cameron, Louisiana. NHRP gathered time-lapse films from radar sites near landfall as part of its
program to provide cameras and training to coastal weather stations. Simpson decided to collect storm surge and wind damage assessments before clean-up efforts destroyed evidence of the storm’s power. He ferried himself, project scientists, and D. L. Harris of OMR, to the disaster area. They gathered detailed measurements of surge heights and damage, starting USWB’s efforts to model storm surges (Harris 1958). NHRP continued similarly prompt damage surveys until operational personnel assumed them in 1967 (Simpson 1989).
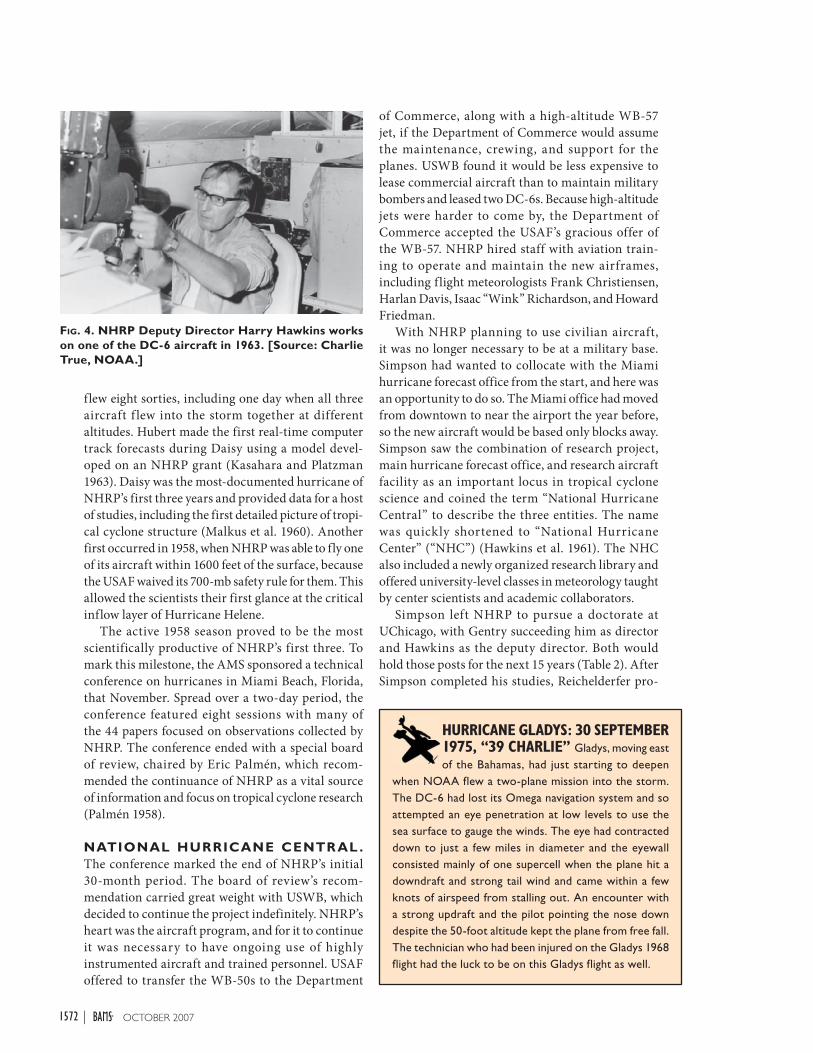
Because 1957 was another slow season, scientists logged over 400 additional f light hours measuring background trade winds. In September, Jordan left the ROB to teach at FSU, although he continued acting as NHRP’s liaison with USN Hurricane Hunters. Harry Hawkins Jr. took over his position (Fig. 4). At the end of the year, Carl Reber replaced Art Johnson as operations manager, and José Colon took over managing the growing data library.
Many NHRP Reports were now based on f light data collected the first two years. Miller wrote on the three-dimensional wind structure (Miller 1958a) and steering currents of tropical cyclones (Miller 1958b). Two of NHRP’s UChicago contractors, Roscoe Braham and Ernie Neil, wrote of possible tropical cyclone modification experiments using cloud-seeding techniques (Braham and Neil 1958).
Hurricane Daisy (1958) provided a trove of data for NHRP scientists. Over a four-day period, scientists
FIG. 2. Research aircraft sorties from which NHRP/NHRL/NHEML/HRD has collected data. Total sorties and sorties in and around hurricanes are plotted along with the yearly accumulated cyclone energy total for the Atlantic for that year.
FIG. 3. Number of research papers each year along with cumulative total authored or coauthored by NHRP/NHRL/NHEML/HRD staff published in AMS journals and Monthly Weather Review. (Until 1974 Monthly Weather Review was a U.S. Government publication.)
1571OCTOBER 2007AMERICAN METEOROLOGICAL SOCIETY |
flew eight sorties, including one day when all three aircraft f lew into the storm together at different altitudes. Hubert made the first real-time computer track forecasts during Daisy using a model devel-oped on an NHRP grant (Kasahara and Platzman 1963). Daisy was the most-documented hurricane of NHRP’s first three years and provided data for a host of studies, including the first detailed picture of tropi-cal cyclone structure (Malkus et al. 1960). Another first occurred in 1958, when NHRP was able to fly one of its aircraft within 1600 feet of the surface, because the USAF waived its 700-mb safety rule for them. This allowed the scientists their first glance at the critical inflow layer of Hurricane Helene.
The active 1958 season proved to be the most scientifically productive of NHRP’s first three. To mark this milestone, the AMS sponsored a technical conference on hurricanes in Miami Beach, Florida, that November. Spread over a two-day period, the conference featured eight sessions with many of the 44 papers focused on observations collected by NHRP. The conference ended with a special board of review, chaired by Eric Palmén, which recom-mended the continuance of NHRP as a vital source of information and focus on tropical cyclone research (Palmén 1958).
NATIONAL HURRICANE CENTR AL . The conference marked the end of NHRP’s initial 30-month period. The board of review’s recom-mendation carried great weight with USWB, which decided to continue the project indefinitely. NHRP’s heart was the aircraft program, and for it to continue it was necessary to have ongoing use of highly instrumented aircraft and trained personnel. USAF offered to transfer the WB-50s to the Department
of Commerce, along with a high-altitude WB-57 jet, if the Department of Commerce would assume the maintenance, crewing, and support for the planes. USWB found it would be less expensive to lease commercial aircraft than to maintain military bombers and leased two DC-6s. Because high-altitude jets were harder to come by, the Department of Commerce accepted the USAF’s gracious offer of the WB-57. NHRP hired staff with aviation train-ing to operate and maintain the new airframes, including flight meteorologists Frank Christiensen, Harlan Davis, Isaac “Wink” Richardson, and Howard Friedman.
With NHRP planning to use civilian aircraft, it was no longer necessary to be at a military base. Simpson had wanted to collocate with the Miami hurricane forecast office from the start, and here was an opportunity to do so. The Miami office had moved from downtown to near the airport the year before, so the new aircraft would be based only blocks away. Simpson saw the combination of research project, main hurricane forecast office, and research aircraft facility as an important locus in tropical cyclone science and coined the term “National Hurricane Central” to describe the three entities. The name was quickly shortened to “National Hurricane Center” (“NHC”) (Hawkins et al. 1961). The NHC also included a newly organized research library and offered university-level classes in meteorology taught by center scientists and academic collaborators.
Simpson left NHRP to pursue a doctorate at UChicago, with Gentry succeeding him as director and Hawkins as the deputy director. Both would hold those posts for the next 15 years (Table 2). After Simpson completed his studies, Reichelderfer pro-
FIG. 4. NHRP Deputy Director Harry Hawkins works on one of the DC-6 aircraft in 1963. [Source: Charlie True, NOAA.]
HURRICANE GLADYS: 30 SEPTEMBER 1975, “39 CHARLIE” Gladys, moving east of the Bahamas, had just starting to deepen
when NOAA flew a two-plane mission into the storm. The DC-6 had lost its Omega navigation system and so attempted an eye penetration at low levels to use the sea surface to gauge the winds. The eye had contracted down to just a few miles in diameter and the eyewall consisted mainly of one supercell when the plane hit a downdraft and strong tail wind and came within a few knots of airspeed from stalling out. An encounter with a strong updraft and the pilot pointing the nose down despite the 50-foot altitude kept the plane from free fall. The technician who had been injured on the Gladys 1968 flight had the luck to be on this Gladys flight as well.
1572 OCTOBER 2007|

moted him to deputy director of research for severe storms, where he oversaw not only NHRP but also the newly formed National Severe Storms Project.
When NHRP moved to the Miami aviation building on April 1959, it upgraded its computer to a faster, magnetic tape–based version. NHRP also designated an aircraft group, formed of its flight meteorologists and technicians, to work primarily on the planes. As planned, this group was administratively separated to form the Research Flight Facility (RFF) under Reber, in 1961 (Hawkins et al. 1961). As a separate group they could be involved in nonhurricane research during the winter and spring.
After three years’ work, NHRP helped produce the Weather Bureau Forecasting Guide No. 3 (Winston 1959), the first formal, systematic manual to teach new objective hurricane forecast methods. NHRP also produced a storm surge forecasting guide (Harris 1959), furthering their goal to aid forecasters.
Originally scheduled for duty July 1959, the new research aircraft were delayed for a year as the low-bid contractor struggled to install the sophisticated instrumentation. Filling the data gap, NHRP technicians created recording pods for the WB-50s to automatically save f light-level information. Over the next few years, NHRP archived USAF’s reconnaissance data, which otherwise would have been lost.
During this hiatus, NHRP concentrated on studying already accumulated data. Two of NHRP’s invaluable collaborators, Herbert Riehl and Joanne Malkus, used Hurricane Daisy data to describe the
energetics of a mature tropical cyclone (Riehl and Malkus 1961). NHRP hired two in-house theoreticians to improve interactions with academics—Mikhail Alaka, who studied the hurricane outflow layer, and Stanley Rosenthal, who created a 2D steady-state model of a mature tropical cyclone.
The success of the first weather satellite in 1960 sounded the death knell of the rocket project. There had been one washout with Tropical Storm Becky (1958) and two failed launches in Hurricane Gracie (1959). The only success was a nonhurricane test launch in July 1958. USWB’s Chief of Research Wexler used copies of its films to promote the concept of weather satellites. Rockets had been positioned at Cape Canaveral at the start of the 1960 season, but funding vanished. Quietly, USN abandoned the program with-out ever photographing a hurricane from space.
Oddly, satellites also ended the hurricane beacon program, although it had been far more successful, including the deployments in Hurricanes Helene (1958) and Hannah (1959). USAF command reasoned that if you could watch a tropical cyclone from space, there was no need to put a tracking device into its eye. NHRP’s hopes to use the beacon to broadcast useful meteorological information (Hawkins 1960) were dashed.
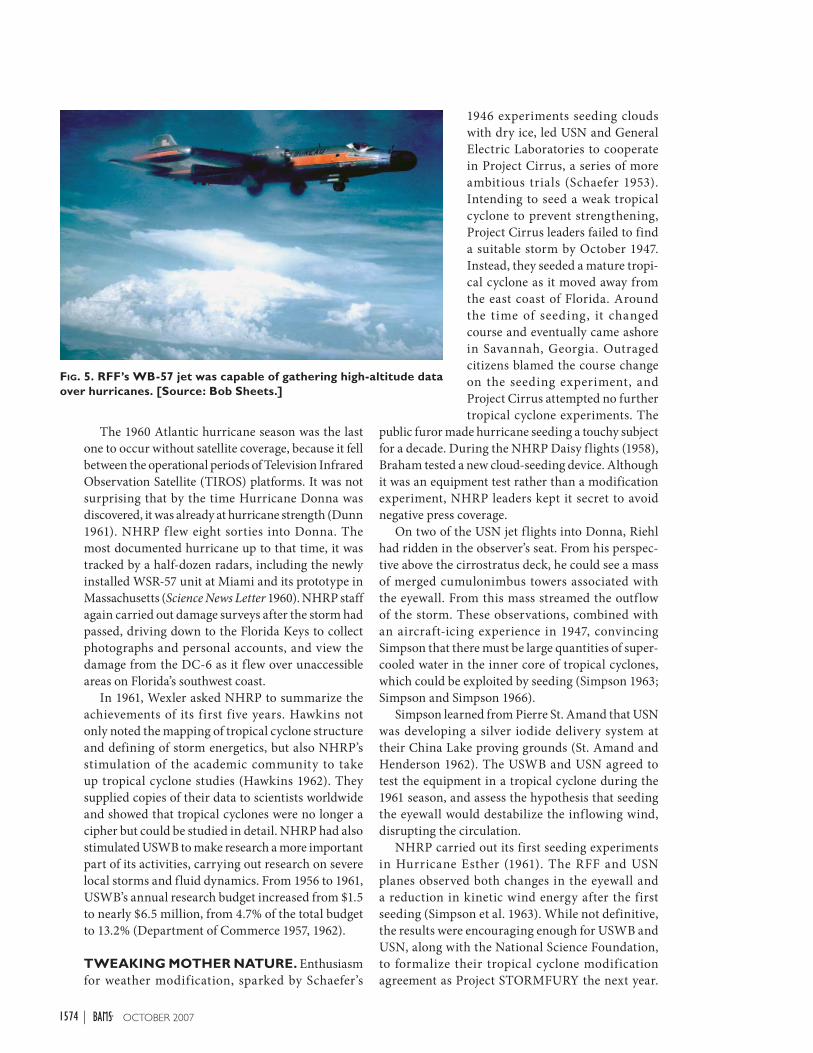
Under pressure from NHRP, the DC-6s were ready by July 1960, without the magnetic tape recording systems. The WB-57 jet (Fig. 5) would not be ready until later in the season, so NHRP persuaded USAF and USN to supply high-altitude aircraft to cover for it.
TABLE 2. Timeline of the hurricane research organization, showing the acronyms it went by, last names of its directors, venues where it was located, airplanes used, names of hurricanes important in their research (seeded storms in bold), major accomplishments of the laboratory, and external experiments to which labo-ratory personnel contributed. The bottom section is divided into colored 5-year blocks with the last year labeled (except 2005, when we were so busy we ran out of space).
1573OCTOBER 2007AMERICAN METEOROLOGICAL SOCIETY |
The 1960 Atlantic hurricane season was the last one to occur without satellite coverage, because it fell between the operational periods of Television Infrared Observation Satellite (TIROS) platforms. It was not surprising that by the time Hurricane Donna was discovered, it was already at hurricane strength (Dunn 1961). NHRP f lew eight sorties into Donna. The most documented hurricane up to that time, it was tracked by a half-dozen radars, including the newly installed WSR-57 unit at Miami and its prototype in Massachusetts (Science News Letter 1960). NHRP staff again carried out damage surveys after the storm had passed, driving down to the Florida Keys to collect photographs and personal accounts, and view the damage from the DC-6 as it flew over unaccessible areas on Florida’s southwest coast.
In 1961, Wexler asked NHRP to summarize the achievements of its first five years. Hawkins not only noted the mapping of tropical cyclone structure and defining of storm energetics, but also NHRP’s stimulation of the academic community to take up tropical cyclone studies (Hawkins 1962). They supplied copies of their data to scientists worldwide and showed that tropical cyclones were no longer a cipher but could be studied in detail. NHRP had also stimulated USWB to make research a more important part of its activities, carrying out research on severe local storms and fluid dynamics. From 1956 to 1961, USWB’s annual research budget increased from $1.5 to nearly $6.5 million, from 4.7% of the total budget to 13.2% (Department of Commerce 1957, 1962).
TWEAKING MOTHER NATURE. Enthusiasm for weather modification, sparked by Schaefer’s
1946 experiments seeding clouds with dry ice, led USN and General Electric Laboratories to cooperate in Project Cirrus, a series of more ambitious trials (Schaefer 1953). Intending to seed a weak tropical cyclone to prevent strengthening, Project Cirrus leaders failed to find a suitable storm by October 1947. Instead, they seeded a mature tropi-cal cyclone as it moved away from the east coast of Florida. Around the time of seeding, it changed course and eventually came ashore in Savannah, Georgia. Outraged citizens blamed the course change on the seeding experiment, and Project Cirrus attempted no further tropical cyclone experiments. The
public furor made hurricane seeding a touchy subject for a decade. During the NHRP Daisy flights (1958), Braham tested a new cloud-seeding device. Although it was an equipment test rather than a modification experiment, NHRP leaders kept it secret to avoid negative press coverage.
On two of the USN jet flights into Donna, Riehl had ridden in the observer’s seat. From his perspec-tive above the cirrostratus deck, he could see a mass of merged cumulonimbus towers associated with the eyewall. From this mass streamed the outflow of the storm. These observations, combined with an aircraft-icing experience in 1947, convincing Simpson that there must be large quantities of super-cooled water in the inner core of tropical cyclones, which could be exploited by seeding (Simpson 1963; Simpson and Simpson 1966).
Simpson learned from Pierre St. Amand that USN was developing a silver iodide delivery system at their China Lake proving grounds (St. Amand and Henderson 1962). The USWB and USN agreed to test the equipment in a tropical cyclone during the 1961 season, and assess the hypothesis that seeding the eyewall would destabilize the inflowing wind, disrupting the circulation.
NHRP carried out its first seeding experiments in Hurricane Esther (1961). The RFF and USN planes observed both changes in the eyewall and a reduction in kinetic wind energy after the first seeding (Simpson et al. 1963). While not definitive, the results were encouraging enough for USWB and USN, along with the National Science Foundation, to formalize their tropical cyclone modification agreement as Project STORMFURY the next year.
FIG. 5. RFF’s WB-57 jet was capable of gathering high-altitude data over hurricanes. [Source: Bob Sheets.]
1574 OCTOBER 2007|

Simpson became project director, with Captain Max Eaton (USN) as his able assistant director. Eaton proved priceless in securing the use of Roosevelt Roads Naval Air Station in Puerto Rico, as a forward base of operations.
STORMFURY’s next seeding experiment came during Hurricane Beulah (1963). Project scientists had slightly modified their theory since Esther, hypothesizing that seeding the eyewall would cause it to reform at a greater radius and thus reduce the maximum winds resulting from conservation of angular momentum (Project STORMFURY 1964). On the first day, the flares missed their target, but on the second day they seeded the eyewall, and results consistent with the expectations were seen. While encouraged by the results, NHRP scientists realized that they knew too little about natural changes in tropical cyclone structure to be able to claim that the weakening of the wind after seeding was due to their actions.
Over the next six years, project scientists’ hopes to carry out further seeding experiments were frustrated by inopportune technical difficulties and by possible target storms such as Betsy (1965) and Faith (1966) passing just outside the restrictive operational area. This area was expanded in 1967 and again in 1968, but still the hurricanes moved outside of it.
During this time, the Environmental Science Services Administration (ESSA) was formed in 1965. In the shakeup, NHRP became the National Hurricane Research Laboratory (NHRL), a change in status reflecting USWB’s commitment to making tropical cyclone research a permanent activity. ESSA also began to separate the research branch of USWB from its operational side.
NHRL continued to f ly research missions into such storms as Cleo (1964), Betsy (1965), and Inez (1966) in order to understand the natural variability of tropical cyclones that could serve as controls for seeding experiments. The Inez flights, in particular, provided a detailed picture of the structure of a major tropical cyclone (Hawkins and Imbembo 1976).
In 1964, Miller and computer programmer Peter Chase, produced NHC-64, a statistical tropical cyclone track forecast model (Miller and Chase 1966).
They modified it in 1967 (NHC-67), in time for an eight-year study of numerical computer forecast tech-niques (Dunn et al. 1968) produced by forecasters and NHRL researchers. NHRL also continued to improve its computer simulations of mature tropical cyclone circulation (Rosenthal and Koss 1968) and to model tropical cyclogenesis (Rosenthal 1964).
NHRL scientists’ expertise in tropical meteorology and aircraft observations led them to participate, along with RFF, in several large, multinational weather experiments, starting with the Interna-tional Indian Ocean Expeditions (IIOE) in 1963 and 1964. Under the Global Atmospheric Research Project (GARP), they carried out research on air–sea interactions over tropical waters in 1969 during the Barbados Oceanographic and Meteorological Experiment (BOMEX) (Holland 1970).
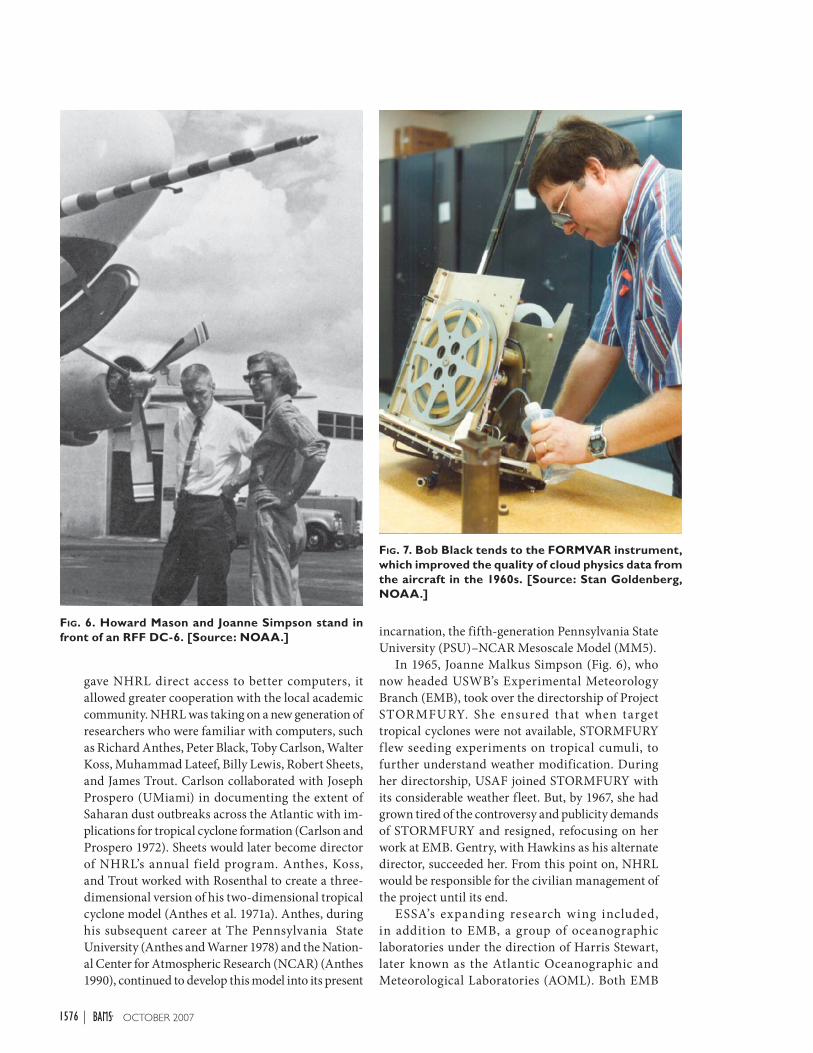
Reber left RFF following participation in the IIOE, and Howard Mason (Fig. 6) became the aircraft center’s new director. Both a pilot and engineer, Mason worked to improve the quality of the data coming from the aircraft, creating new instrument suites in house (Fig. 7), establishing a calibration laboratory, and participating in longer deployments as a liaison between scientists and aircraft crews.
NHRL and the hurricane forecast center moved in 1965 to the computer center building on UMiami’s Coral Gables campus. The building was constructed specifically to house the hurricane organizations along with the university’s computers and envi-ronmental sciences department. This not only
BY THE NUMBERS THROUGH 2006230 Number of named storms into which laboratory research missions have been fl own.334 Number of papers in AMS refereed journals authored or coauthored by laboratory scientists.1729 Number of laboratory-sponsored research fl ights.1772 Number of hurricane eye penetrations made during research fl ights.32,270 Number of man-hours laboratory researchers and collaborators have fl own.
HURRICANE ALLEN: 6 AUGUST 1980, N42RF “KERMIT” As the category-4 hurricane passed between Jamaica
and Cuba, the NOAA P-3s began their second day of flights into Allen. “Kermit” approached the eye from the south, and penetrated without any problem. But, the radar showed cells in the north eyewall with extremely high return, as did the rainbands beyond. The lengthy shaking they encountered knocked loose the life raft and convinced one scientist that hurricane research was not his future.
1575OCTOBER 2007AMERICAN METEOROLOGICAL SOCIETY |
gave NHRL direct access to better computers, it allowed greater cooperation with the local academic community. NHRL was taking on a new generation of researchers who were familiar with computers, such as Richard Anthes, Peter Black, Toby Carlson, Walter Koss, Muhammad Lateef, Billy Lewis, Robert Sheets, and James Trout. Carlson collaborated with Joseph Prospero (UMiami) in documenting the extent of Saharan dust outbreaks across the Atlantic with im-plications for tropical cyclone formation (Carlson and Prospero 1972). Sheets would later become director of NHRL’s annual field program. Anthes, Koss, and Trout worked with Rosenthal to create a three-dimensional version of his two-dimensional tropical cyclone model (Anthes et al. 1971a). Anthes, during his subsequent career at The Pennsylvania State University (Anthes and Warner 1978) and the Nation-al Center for Atmospheric Research (NCAR) (Anthes 1990), continued to develop this model into its present
incarnation, the fifth-generation Pennsylvania State University (PSU)–NCAR Mesoscale Model (MM5).
In 1965, Joanne Malkus Simpson (Fig. 6), who now headed USWB’s Experimental Meteorology Branch (EMB), took over the directorship of Project STORMFURY. She ensured that when target tropical cyclones were not available, STORMFURY f lew seeding experiments on tropical cumuli, to further understand weather modification. During her directorship, USAF joined STORMFURY with its considerable weather fleet. But, by 1967, she had grown tired of the controversy and publicity demands of STORMFURY and resigned, refocusing on her work at EMB. Gentry, with Hawkins as his alternate director, succeeded her. From this point on, NHRL would be responsible for the civilian management of the project until its end.
ESSA’s expanding research wing included, in addition to EMB, a group of oceanographic laboratories under the direction of Harris Stewart, later known as the Atlantic Oceanographic and Meteorological Laboratories (AOML). Both EMB
FIG. 6. Howard Mason and Joanne Simpson stand in front of an RFF DC-6. [Source: NOAA.]
FIG. 7. Bob Black tends to the FORMVAR instrument, which improved the quality of cloud physics data from the aircraft in the 1960s. [Source: Stan Goldenberg, NOAA.]
1576 OCTOBER 2007|
and AOML moved to Miami in 1967, and construc-tion began on a laboratory building on donated land on Virginia Key, a barrier island across Biscayne Bay from Miami.
Bob Simpson became director of the Miami hurricane forecast center by 1968, claiming the “National Hurricane Center” moniker exclusively for the operational office. In August of the following year, Hurricane Debbie moved into the seeding operational area. STORMFURY scrambled its RFF, USN, and USAF planes to Puerto Rico, carrying out 10 seeding runs over two days (Project STORMFURY 1970). NHRL computer modeling studies (Rosenthal 1970a) led planners to modify their strategy, dropping silver iodide canisters beyond the radius of maximum winds to encourage convection outside the eyewall and reduce winds by spreading the circulation outward. During their Debbie experiments, researchers found a 30% reduction in the winds after the first day, and 15% reduction after the second (Project STORMFURY 1970). But, their investigations in unmodified tropical cyclones, made since 1963, showed reductions of a similar magnitude due to natural fluctuations. Again, they were unable to claim that the changes were solely due to their seeding.
While STORMFURY aircraft were involved with Debbie, Camille, like many Gulf hurricanes, rapidly intensified. Two USN planes, left in Jacksonville, Florida, to cover Gulf reconnaissance requirements, were unable to penetrate the storm at a critical point in its deepening. Many of the aircraft that would back them up were committed to the seeding operations. Simpson persuaded a USAF reconnaissance plane to ferry from California to provide critical information on the storm before its devastating landfall. Later, carrying out a survey of Camille’s damage, Simpson briefed Vice President Agnew, mentioning the poor state of the hurricane reconnaissance fleet that led to this dicey situation. This created a bureaucratic firestorm (Simpson 1989). However, it did spur the acquisition of much-needed new equipment for USN and USAF Hurricane Hunters, and eventually led the Department of Commerce to upgrade the aging DC-6s with new P-3 Orions (Aberson et al. 2006).
Another seeding opportunity presented itself in 1971. Hurricane Ginger followed a wild track far eastward into the Atlantic before looping back. By the time it moved within range of STORMFURY aircraft, Ginger was a minimal hurricane, with a broad, weak wind field, lacking strong convection. This was far from the duplicate of Debbie scientists had hoped for, so instead they seeded its outer rainbands. There was a lack of discernible, objective variations in
radar signature or wind structure due to the seeding (Project STORMFURY 1972).
After the 1972 hurricane season, USN and USAF ended their participation in Project STORMFURY. Two years later the navy disbanded its Hurricane Hunters. RFF, which had acquired a surplus C-130, retired one DC-6 and the WB-57. With its resources more than halved, a great burden fell on Sheets, head of NHRL’s field program and now the STORMFURY director. Silver iodide launchers were built to work on the RFF aircraft, and monitoring plans were modified to use far fewer planes.
THE NOAA SHUFFLE. In 1970, the U.S. Government reorganized its meteorological and oceanographic facilities into the National Oceanic and Atmospheric Administration (NOAA). The operational elements within USWB, including the hurricane warning centers, were formed into the National Weather Service (NWS), while the research elements, including NHRL, RFF, AOML, and EMB, were put under the Environmental Research Laboratories (ERL). As part of the ERL reorganization, the NOAA research facilities in Miami were merged and purged. NHRL and EMB were placed administratively under AOML. While they remained collocated with NHC, they now answered to a different hierarchy and were funded under different budget lines. RFF was adversely affected by a mass reduction in force in 1972 that included firing its director, Mason.
NHRL scientists carried on. Detailed aircraft observations over the years demonstrated that tropical cyclones were not symmetric. Heretofore, computer models had not handled this complexity. The growth of computing power by the early 1970s allowed NHRL’s modeling group to incorporate asymmetries into its three-dimensional model (An-thes et al. 1971b). They also included explicit micro-physical calculations (Rosenthal 1970b) in the two-dimensional model to illustrate the effects of seeding.
HURRICANE EMILY: 22 SEPTEMBER 1987, N42RF “KERMIT” AND N43RF “MISS PIGGY” Rapidly deepening before
encountering Hispañola, Emily reached its peak strength as both P-3 aircraft encountered very strong updrafts and downdrafts going through the eyewall. Both the turbulence and the continual turning in order to make the 27 combined eye penetrations on this day, made these memorable flights.
1577OCTOBER 2007AMERICAN METEOROLOGICAL SOCIETY |

Paul Willis was hired to process cloud physics data, and Bob Jones, Michael Moss, and Burt Morris lent additional manpower to the modeling group, creating a nested grid version of the three-dimensional model (Jones 1976).
MIT Professor Fred Sanders’ graduate student, Robert Burpee, came to work at NHRL, developing Sander’s Barotropic Model (SANBAR), a barotropic track forecast program. He shared an office with Carlson, who interested him in Africa’s influence on the tropical Atlantic. Burpee investigated the origins of easterly waves over Africa, tracing their formation to instabilities in the midtropospheric jet south of the Sahara (Burpee 1972).
In the summer of 1974, NHRL eschewed its usual hurricane field program to participate in the GARP Atlantic Tropical Experiment (GATE). Using an international fleet of aircraft, including the RFF DC-6 and C-130, as well as two nested arrays of surface ships off the west coast of Africa, GATE profiled easterly waves. NHRL scientists used GATE results to sketch out wave structure (Burpee 1975; Gamache and Houze 1985), calculate a Z–R relationship for tropical showers (Cunning and Sax 1977), examine cumulus transport (Johnson 1978), and investigate the spatial scales necessary to resolve significant features (Ooyama 1987).
Simpson retired from NHC in 1973, and a former NHRP summer intern, Neil Frank, succeeded him as director. By this time, AOML had completed
construction of its new building on Virginia Key. ERL administrators attempted to move NHRL and the Experimental Meteorology Laboratory (EML; formerly EMB) out to the facility. In his last signifi-cant act as director, Gentry thwarted the move to the offshore island, keeping meteorological researchers collocated with NHC.
Gentry retired at the end of 1974 and Noel LaSeur, long assistant director, took leave from FSU to direct NHRL for several years. Joanne Simpson departed EML for the University of Virginia [and later to work for the National Aeronautics and Space Administration (NASA)], leaving no one at either laboratory with the administrative clout to resist consolidation. EML merged with NHRL in 1975, forming the National Hurricane and Experimental Meteorology Laboratory (NHEML). EML personnel (John Cunning, Pat Gannon, Cecilia Griffith, Ron Holle, Raúl Lopez, Bob Sax, Irv Watson, Vic Wiggert, and Bill Woodley) became the Cumulus Group. They continued cloud modification, through the Florida Area Cumulus Experiments (FACE I, FACE II), and brought the total laboratory staffing to its highest level (see Fig. 8).
Because of further financial retrenchments, the general services administration moved NHEML and NHC off campus in 1978 to a commercial office building (IRE) in Coral Gables. They continued to share adjoining floors and facilities, and a library. It was a disruptive move, however; some of the archived data were lost, and many longtime employees retired.
The RFF reorganized as the Research Facilities Center (RFC) under Gus Emanuel, and acquired two Orion P-3 aircraft, which became operational in 1976 and 1977. For more information on the impact these new aircraft had on the laboratory’s research, and especially on continuation of the STORMFURY experiments, see Aberson et al. (2006) and Willoughby et al. (1985).
LACK OF “SEED” MONEY. Rosenthal, head of NHEML’s Theoretical Studies Group, took over the laboratory when LaSeur returned to teaching in 1977. He completed a 12-layer version of his 2D model that was able to resolve individual convective elements within the hurricane, a large step forward in simulating tropical cyclone dynamics (Rosenthal 1978). In 1980, Jones completed a 3D version of this hydrostatic model (Jones 1980).
Rosenthal began replacing losses, hiring researchers with strong theoretical backgrounds, such as Steve Lord, Lloyd Shapiro, Katsuyuki Ooyama, and Hugh Willoughby. Lord and Willoughby worked with
FIG. 8. Number of NHRP/NHRL/NHEML/HRD/AOML employees by year. Part time includes temporary, contract, and summer intern workers.
1578 OCTOBER 2007|
programmer Jacqueline Piotrowicz to produce a nonhydrostatic 2D hurricane model (Willoughby et al. 1984b). The laboratory also hired observational specialists (Robert Black, David Jorgensen, Mark Powell, and Frank Marks).
The 1970s and 1980s marked a period of relatively low Atlantic tropical cyclone activity, which provided few opportunities for seeding. During 1972, NHRL f lew only one hurricane sortie (Fig. 2). NHEML attempted moving STORMFURY to the more active Pacific several times, but political considerations and fear of liability frustrated such plans. With no seeding experiments and many new theoretically oriented staff, NHEML shifted emphasis away from weather modi-fication and toward under-standing tropical cyclones in their natural state.
The lower Atlantic trop-ical cyclone activity did not exclude formation of individual strong, long-lived storms, like Anita (1977), David and Frederic (1979), and Allen (1980). Data gathered from these s t or m s w i t h t h e ne w P-3 aircraft (Aberson et al. 2006), flying back-to-back missions (Fig. 9), gave sci-entists a continuous view over the time scale of days, which led to insights in eyewall (Jorgensen 1984) and rainband dynamics (Willoughby et al. 1984a),
and the formulation of the eyewall re-placement cycle theory (Willoughby et al. 1982). This natural transforma-tion mimicked what STORMFURY hoped to initiate, further confusing natural and artificial changes.
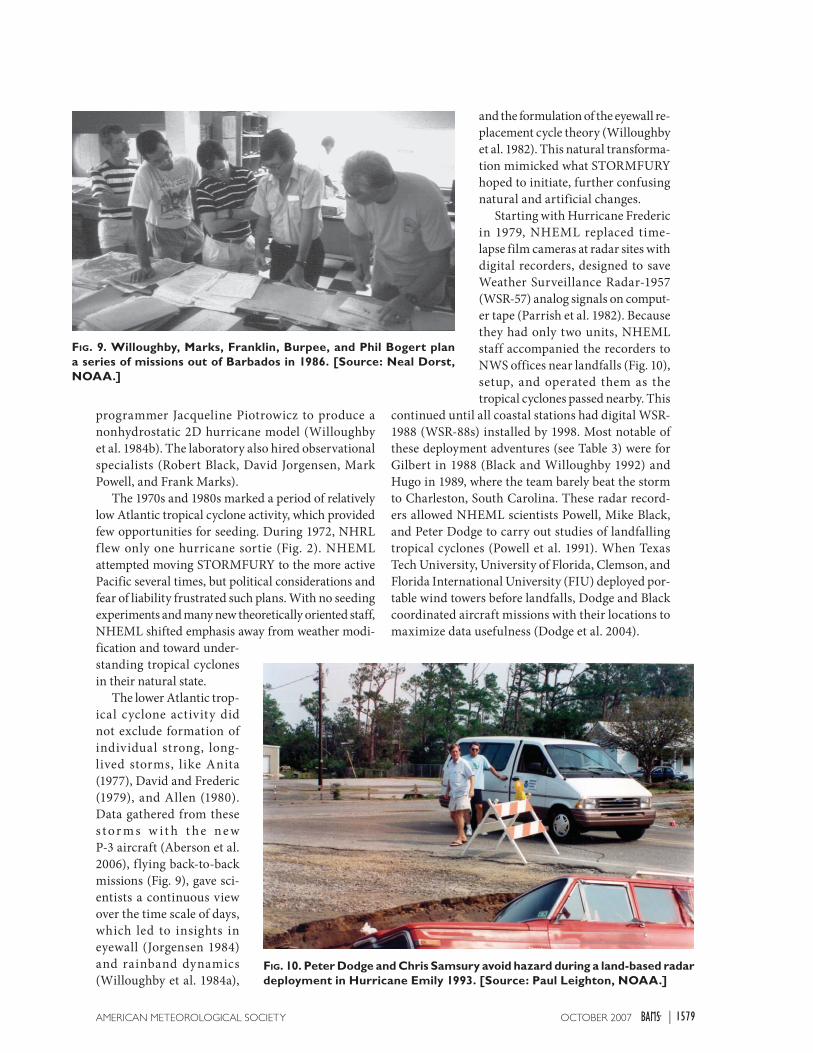
Starting with Hurricane Frederic in 1979, NHEML replaced time-lapse film cameras at radar sites with digital recorders, designed to save Weather Surveillance Radar-1957 (WSR-57) analog signals on comput-er tape (Parrish et al. 1982). Because they had only two units, NHEML staff accompanied the recorders to NWS offices near landfalls (Fig. 10), setup, and operated them as the tropical cyclones passed nearby. This
continued until all coastal stations had digital WSR-1988 (WSR-88s) installed by 1998. Most notable of these deployment adventures (see Table 3) were for Gilbert in 1988 (Black and Willoughby 1992) and Hugo in 1989, where the team barely beat the storm to Charleston, South Carolina. These radar record-ers allowed NHEML scientists Powell, Mike Black, and Peter Dodge to carry out studies of landfalling tropical cyclones (Powell et al. 1991). When Texas Tech University, University of Florida, Clemson, and Florida International University (FIU) deployed por-table wind towers before landfalls, Dodge and Black coordinated aircraft missions with their locations to maximize data usefulness (Dodge et al. 2004).
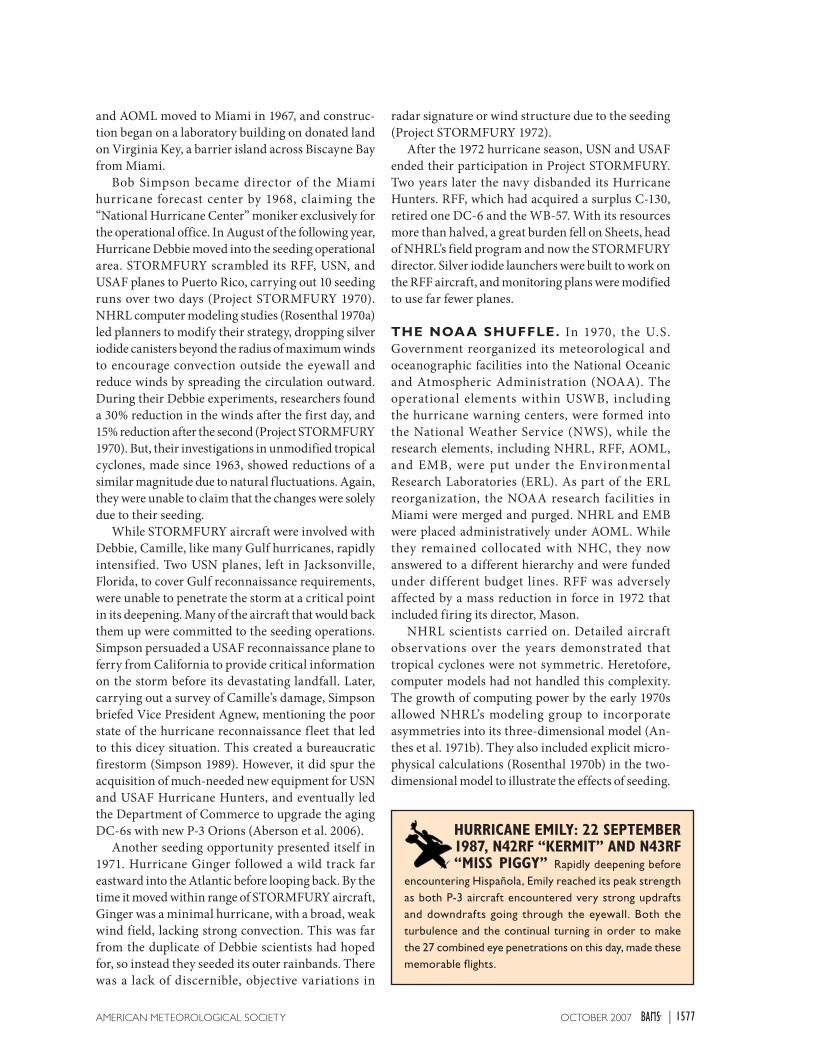
FIG. 9. Willoughby, Marks, Franklin, Burpee, and Phil Bogert plan a series of missions out of Barbados in 1986. [Source: Neal Dorst, NOAA.]
FIG. 10. Peter Dodge and Chris Samsury avoid hazard during a land-based radar deployment in Hurricane Emily 1993. [Source: Paul Leighton, NOAA.]
1579OCTOBER 2007AMERICAN METEOROLOGICAL SOCIETY |

By the early 1980s, public and scientific enthusiasm for weather modification waned and funding declined (Cotton and Pielke 1995). ERL split the Cumulus Group off from NHEML. The laboratory’s acronym thankfully shrank back to NHRL, but its staff shrank too, with people transferred to Boulder, Colorado, laboratories. The loss of the Cumulus Group and Sheets’ move to NHC in 1980 left very few in NHRL with experience in seeding operations. In 1983, Project STORMFURY officially ended, and with it the allocated funding. In its 21 years, the project had seeded only four tropical cyclones, a paltry number for statistical comparisons. This was partly due to restrictions placed on which storms they could target, and to the lower Atlantic activity. But, NHRL scientists’ studies over these years allowed them to write the postmortem on the project (Willoughby et
al. 1985). They found little supercooled water in the hurricane core, no lack of ice to induce freezing, and naturally occurring cycles that would mimic experi-mentally induced changes.
Other research avenues were now explored. NHRL participated in many multiagency scientific projects (Aberson et al. 2006). Burpee, seeing the effectiveness of dropsondes during GATE, proposed deploying them around hurricanes. Riehl (1955) had recommended that reconnaissance f lights sample the steering flow away from the hurricane core, but no one had implemented the idea. With the addition of dropsondes, scientists could now map the three-dimensional structure of the steering flow, and feed that information directly into numerical forecast models. The first of these synoptic flow experiments (Fig. 11) was into Hurricane Debbie (1982) (Burpee et al. 1996).
HURRICANE RESEARCH IN A FLOOD ZONE. Plans were made to move NHC and NHRL from the IRE building to a two-story facility to be constructed for them on the FIU campus, west of Miami. Instead, in 1984, NHRL’s consolidation with AOML was completed when ERL moved the meteorologists out of Virginia Key, ending 25 years of collocation with NHC. Like a divorcing couple, NHRL and NHC split up the books in the research library, and the FIU building plan shrank to one story. While ending daily contact with the operational results of their work, the move put the hurricane researchers in closer contact with the oceanographic community, not only at AOML, but also at UMiami’s Rosenstiel School for Marine and Atmospheric Sciences, across the street. This association helped with joint studies of air–sea interaction and the ocean’s role in tropical cyclone intensity (Black et al. 1988).
The administrative reconfiguration also forced another name change when AOML was redesignated as a single laboratory. This made ERL’s f low chart neater, but reduced AOML’s constituent laboratories to divisions. NHRL became AOML’s Hurricane Research Division (AOML/HRD), its present sobriquet. RFC, no longer under ERL, gained responsibility of all of NOAA’s aircraft and became the Aircraft Operations Center (AOC). Placed under the Office of Marine and Aviation Operations, which operated NOAA’s fleet of ships, AOC was commanded by NOAA Corps officers.
USAF, in the early 1990s, disbanded its Pacific typhoon squadrons and transferred its Atlantic hur-ricane squadron to its reserves. On an upside, their aircraft started receiving onboard computers, which
TABLE 3. Land-based radar deployments. [Source: Peter Dodge.]
Year HurricaneNWS offices where recorders
were deployed
1979
DavidMiami, FL,
West Palm, FL
FredericMobile, AL,
Corpus Christi, TX
1980 Allen Brownsville, TX
1983 Alicia Galveston, TX
1984 DianaCharleston, SC,
Wilmington, NC
1985
DannySlidell, LA,
Lake Charles, LA
ElenaPensacola, FL,
Apalachicola, FL
1987 Floyd Key West, FL
1988
FlorenceMobile, AL,
Slidell, LA
GilbertCorpus Christi, TX,
Brownsville, TX
1989 HugoCharleston, SC,
Wilmington, NC
1991 BobWilmington, NC,
Cape Hatteras, NC
1992 Andrew
Miami, FL,
Tampa, FL,
Slidell, LA,
Lake Charles, LA
1993 Emily Cape Hatteras, NC
1580 OCTOBER 2007|

automatically recorded f light-level information. AOML/HRD was back to archiving USAF’s data, which it does to this day.
A dramatic El Niño in 1982 and 1983 spurred research into teleconnections between the Pacific phenomenon and Atlantic hurricanes, which renewed interest in tropical cyclone climatology. Shapiro and Stanley Goldenberg established a link between El Niño–Southern Oscillation and Atlantic hurricane activity (Goldenberg and Shapiro 1996). Long-time collaborator Gray’s ef-forts to forecast seasonal tropical cyclone activity (Gray et al. 1992) led his colleague, AOML/HRD scientist Chris Landsea, to col-laborate with Goldenberg, the Climate Prediction Center, and NHC, to initiate NOAA’s efforts at hurricane seasonal forecast-ing. Finding serious deficiencies in the Atlantic tropical cyclone database, used in many clima-tological studies, Landsea also undertook an ongoing, compre-hensive reanalysis effort (Landsea et al. 2004).
Despite physical separation from NHC, AOML/HRD’s com-puter programmers—Joseph Griffin, Paul Leighton, William Barry, Nancy Figueroa, and M. Edward Rahn—continued
FIG. 12. A Hurricane Edouard real-time radar composite sent to NHC via satellite. [Source: NOAA.]
FIG. 11. Willoughby, Franklin, and Burpee discuss progress of the syn-optic flow experiment into Hurricane Earl 1986. [Source: Neal Dorst, NOAA.]
support for forecasters by helping visualize the f lood of information coming to NHC from reconnaissance aircraft. They automated plot-ting dropsonde data from the synoptic f low experiments. In 1985, radar sweeps from the aircraft (Fig. 12) were sent via satellite to NHC. By 1987, profiles of the flight-level in-formation were being plotted in near–real time. An aircraft computer workstation, oper-ated by AOML/HRD (Fig. 13), allowed radar compositing in 1990 (Griffin et al. 1992).
Hurricane Joan (1988) un-expectedly deepened before striking Nicaragua, under-scoring the lack of improve-
ment in intensity forecasting since the introduction of the Statistical Hurricane Intensity Forecast (SHIFOR) in 1972 (Jarvinen and Neumann 1979). AOML/HRD scientists Mark DeMaria and John Kaplan began work on an improvement, the Statistical Hurricane Intensity Prediction Scheme (SHIPS) (DeMaria and Kaplan 1994), which became operational in 1995. By 1997, it showed skill over SHIFOR. AOML/HRD sci-entists, cooperating with the National Meteorological Center, developed a nested-grid barotropic tropical
1581OCTOBER 2007AMERICAN METEOROLOGICAL SOCIETY |

cyclone track model, Vic Ooyama’s Barotropic Model (VICBAR; DeMaria et al. 1992), which showed skill comparable with other operational models by 1989.
The destructiveness of rapidly deepening tropical cyclones literally struck home in 1992 when Hurricane Andrew chewed a path of ruin through southern Miami–Dade County, Florida. Many laboratory staff had harrowing, even life-threatening, experiences riding out the storm (Fig. 14). The AOML facility on Virginia Key suffered only minor damage, because Andrew’s eyewall passed 10 miles to the south. For a few months, the laboratory served as a staging area for efforts by its people to supply their fellow workers with the water, food, material, and labor needed in rebuilding their homes and lives.
In an effort to better define the wind field of Andrew, Powell and Sam Houston scoured the Miami area for any wind or pressure measurements that the public or other government agencies had taken (Powell et al. 1996; Powell and Houston 1996). Review of the digitized Miami radar revealed a small echo passing through the eye before landfall led to the discovery of a ship that mistakenly blundered through Andrew. AOML/HRD scientists turned into detectives to find the ship and obtain its weather log. This painstaking effort to reconstruct the wind field inspired the creation of AOML/HRD’s Surface Wind Analysis System (H*Wind), a tool to create wind analyses from a variety of sources in an operational environment (Powell et al. 1998). Concern for wind data quality led Powell to work with NWS, the National Climatic Data Center, the National Data Buoy Center, and colleagues Shirley Murillo, Nick Carrasco, and Russell St. Fleur to document the exposures of the Automated Surface Observing System (ASOS) and Coastal-Marine Automated Network (C-MAN) stations (Powell et al. 2004). Andrew also motivated AOM/HRD scientists to address rapid intensification in their SHIPS scheme. By 2000, they had also introduced storm decay within SHIPS (DeMaria et al. 2005).
THE CENTER WILL NOT HOLD. In the wake of Andrew, AOC moved to MacDill Air Force Base in Tampa, Florida, ending over 32 years of being in the same city as the hurricane researchers. Although the acquisition of the hangar space improved AOC’s maintenance situation, the move made AOML/HRD’s
operations more expensive, and close collaboration on instrumenta-tion and supply became complicated. The storm hastened NHC’s move to its new building on the FIU campus, farther away from Virginia Key. These moves spread Simpson’s vi-sion of a National Hurricane Center across the width of the state.
I n 19 93 , B u r p e e re p l a c e d Rosenthal as division director. The success of Burpee’s synoptic f low f lights led Sheets, now director of NHC, to prod NOAA into pur-chasing a Gulfstream IV (G-IV) high-altitude jet in 1996 (Fig. 15), carrying out operational versions of these missions. With the G-IV came improved dropsondes, relying on GPS navigation and improved humidity sensors. They could now
FIG. 13. Joe Griffin (rhs) demonstrates the AOML/HRD workstation to NHC’s Ed Rappaport. The workstation helped to funnel real-time aircraft data to NHC. [Source: Bob Burpee.]
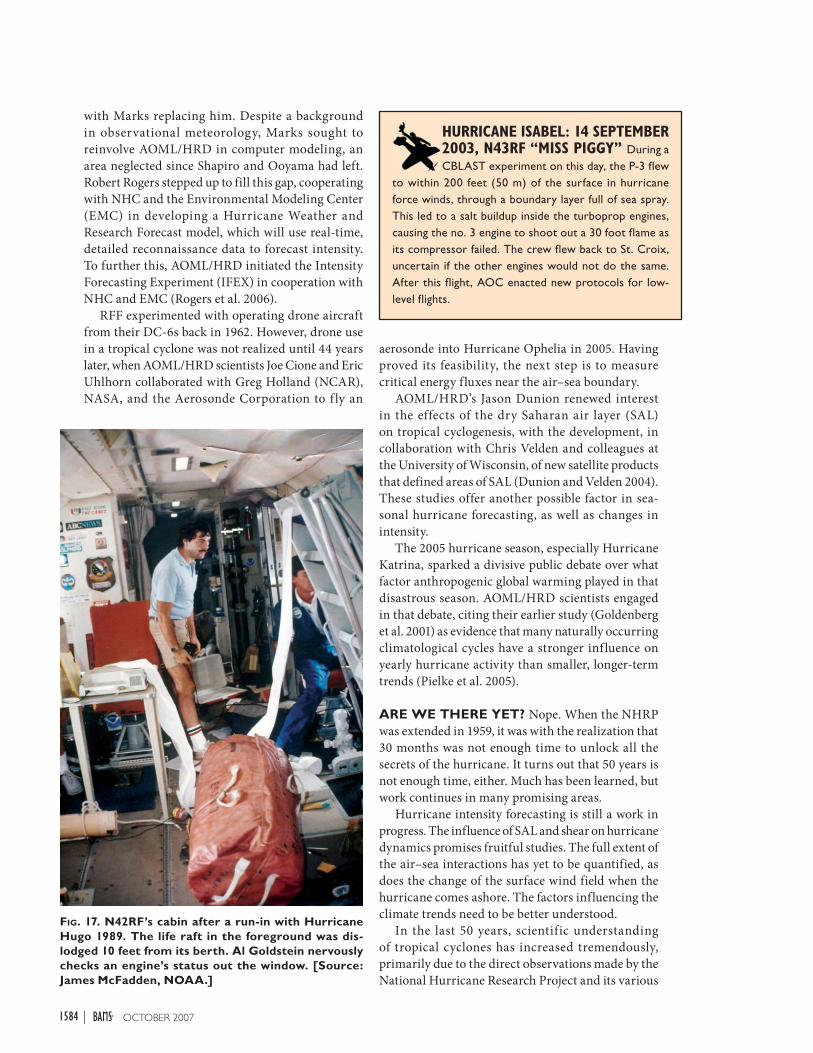
HURRICANE HUGO: 15 SEPTEMBER 1989, N42RF “KERMIT” A classic Cape Verde hurricane, Hugo had just moved within
operational range of the Leeward Islands by the 15th. Having had few problems with Gabrielle in the same area less than two weeks before, the P-3 went in at 1500 feet. Encountering severe turbulence due to a mesocyclone in the eyewall, a mechanical failure caused one of the engines to shut down. Once again, a life raft broke loose, this time denting the overhead handrail (Fig. 17). The plane had to orbit in the eye, burning fuel, while climbing to a safe altitude. N43RF and a U.S. Air Force plane then escorted the injured “Kermit” back to Barbados. N42RF remained out of commission for the rest of the season.
1582 OCTOBER 2007|

be deployed in clouds and hurricane eyewalls, which AOML/HRD did in Hurricane Guillermo (1997). These data offered insights into the lower wind struc-ture of hurricanes (Franklin et al. 2003). AOML/HRD scientists and programmers, led by James Franklin, developed on-board quality control software for the dropsondes and studied the most efficient targeting of them (Aberson 2003). Sim Aberson has also assessed the change dropsonde data have had on objective forecast accuracy since 1997.
An increase in Atlantic tropical cyclone activity in 1995 (Fig. 16; see title page) motivated AOML/HRD scientist to reexamine climatological records for a reason for the upturn. Their conclusion, reached in collaboration with Gray and AOML colleague Alberto Mestez-Nuñez, was that multidecadal cycles in tropical cyclone activity were linked to the Atlantic Multidecadal Oscillation in sea surface temperatures (Goldenberg et al. 2001). The higher activity since 1995, similar to 1926–69, was linked to the warmer phase of the oscillation. It was unsettling news to a coastal population grown used to lower hurricane activity.
Sheets retired in 1995, and Burpee became the third “Bob” from research
to direct NHC. Willoughby, becom-ing AOML/HRD’s director, noted hurricane intensity forecasting was lagging hurricane track forecasting. He brought divisional expertise in hurricane dynamics to bear on the problem, using the AMS 78th an-nual meeting’s special session on tropical cyclone intensity change as a jumping-off point.
AOML/HRD had long been in-volved with studying the affects of sea temperature on hurricane intensity. Studies of Hurricanes Celia in 1970 (Smith 1975) and Jo-sephine in 1984 (Black et al. 1988), and Tropical Cyclone Kerry in 1979 (Black and Holland 1995) were im-proved upon as ocean probes became more sophisticated. In 2002, such probes detailed the ocean’s response to Hurricanes Isidore and Lili (Cione
and Uhlhorn 2003). They mapped out changes in the Caribbean’s heat content resulting from the storms, more accurately assessing the energy flux.
In 2001, division scientists helped formulate the Joint Hurricane Testbed (JHT; Federal Register 2004), a U.S. Weather Research Program grant procedure for transitioning research into operational tools. In addition to H*Wind, dropsonde targeting, and SHIPS refinements, JHT financed John Gamache’s broadcast of real-time Doppler radar information for integration in forecasting models. Marks used JHT to create a statistical scheme predicting rainfall from landfalling hurricanes, Rainfall-Climate and Persistence (R-CLIPER).
After struggling for seven years with stagnant budgets and reduced personnel, Willoughby retired from NOAA to take a faculty position with FIU,
FIG. 15. Barry Damiano and John Kaplan entering the NOAA Gulfstream IV. This high-altitude jet was instrumental in making synoptic flow missions operational. [Source: Neal Dorst, NOAA.]
FIG. 14. Sam Houston, happy he does not own a car, in the NHC parking lot, the morning after Hurricane Andrew 1992. Several AOML/HRD scientists worked at the center during the storm. [Source: Bob Burpee.]
1583OCTOBER 2007AMERICAN METEOROLOGICAL SOCIETY |
with Marks replacing him. Despite a background in observational meteorology, Marks sought to reinvolve AOML/HRD in computer modeling, an area neglected since Shapiro and Ooyama had left. Robert Rogers stepped up to fill this gap, cooperating with NHC and the Environmental Modeling Center (EMC) in developing a Hurricane Weather and Research Forecast model, which will use real-time, detailed reconnaissance data to forecast intensity. To further this, AOML/HRD initiated the Intensity Forecasting Experiment (IFEX) in cooperation with NHC and EMC (Rogers et al. 2006).
RFF experimented with operating drone aircraft from their DC-6s back in 1962. However, drone use in a tropical cyclone was not realized until 44 years later, when AOML/HRD scientists Joe Cione and Eric Uhlhorn collaborated with Greg Holland (NCAR), NASA, and the Aerosonde Corporation to f ly an
aerosonde into Hurricane Ophelia in 2005. Having proved its feasibility, the next step is to measure critical energy fluxes near the air–sea boundary.
AOML/HRD’s Jason Dunion renewed interest in the effects of the dry Saharan air layer (SAL) on tropical cyclogenesis, with the development, in collaboration with Chris Velden and colleagues at the University of Wisconsin, of new satellite products that defined areas of SAL (Dunion and Velden 2004). These studies offer another possible factor in sea-sonal hurricane forecasting, as well as changes in intensity.
The 2005 hurricane season, especially Hurricane Katrina, sparked a divisive public debate over what factor anthropogenic global warming played in that disastrous season. AOML/HRD scientists engaged in that debate, citing their earlier study (Goldenberg et al. 2001) as evidence that many naturally occurring climatological cycles have a stronger influence on yearly hurricane activity than smaller, longer-term trends (Pielke et al. 2005).
ARE WE THERE YET? Nope. When the NHRP was extended in 1959, it was with the realization that 30 months was not enough time to unlock all the secrets of the hurricane. It turns out that 50 years is not enough time, either. Much has been learned, but work continues in many promising areas.
Hurricane intensity forecasting is still a work in progress. The influence of SAL and shear on hurricane dynamics promises fruitful studies. The full extent of the air–sea interactions has yet to be quantified, as does the change of the surface wind field when the hurricane comes ashore. The factors influencing the climate trends need to be better understood.
In the last 50 years, scientific understanding of tropical cyclones has increased tremendously, primarily due to the direct observations made by the National Hurricane Research Project and its various
FIG. 17. N42RF’s cabin after a run-in with Hurricane Hugo 1989. The life raft in the foreground was dis-lodged 10 feet from its berth. Al Goldstein nervously checks an engine’s status out the window. [Source: James McFadden, NOAA.]
HURRICANE ISABEL: 14 SEPTEMBER 2003, N43RF “MISS PIGGY” During a CBLAST experiment on this day, the P-3 flew
to within 200 feet (50 m) of the surface in hurricane force winds, through a boundary layer full of sea spray. This led to a salt buildup inside the turboprop engines, causing the no. 3 engine to shoot out a 30 foot flame as its compressor failed. The crew flew back to St. Croix, uncertain if the other engines would not do the same. After this flight, AOC enacted new protocols for low-level flights.
1584 OCTOBER 2007|

incarnations, and by the collaboration of its scientists with researchers worldwide. By demonstrating that the “hurricane problem” was not intractable, NHRP stimulated the academic community to engage in tropical cyclone studies, and supplied them with the hard data needed. As the first permanent research organization within USWB, it sparked a change in attitude that the bureau needed to move beyond operations to improve forecasting. Following its initial success, U.S. Government funding of weather research dramatically increased and became a significant part of NOAA’s budget.
For 50 years these federal hurricane researchers have led the way in designing airborne experiments, in the use of new technologies to study tropical cyclones, in attempting weather modification, and in carrying out theoretical and computer studies of storm dynamics, all the while, flying into the heart of hurricanes, examining the phenomena first hand.
ACKNOWLEDGMENTS. I am very grateful for the suggestions and corrections provided by former NHRP director Bob Simpson, former EML director Joanne Simpson, former AOML/HRD directors Bob Burpee and Hugh Willoughby, and current AOML/HRD director Frank Marks. Helpful remarks and recommendations were made by Sim Aberson, Stan Goldenberg, and especially Howie Friedman, who lived most of this history. And I am indebted to the men and women, many of whose names I failed to mention, who collaborated over the last fifty years in this wonderful scientific enterprise for their efforts and their meticulous record keeping, which made this paper so much easier to write.
REFERENCESAberson, S. D., 2003: Targeted observations to improve
operational tropical cyclone track forecast guidance. Mon. Wea. Rev., 131, 1613–1628.
—, M. L. Black, R. A. Black, R. W. Burpee, J. J. Cione, C. W. Landsea, and F. D. Marks Jr., 2006: Thirty years of tropical cyclone research with the NOAA P-3 aircraft. Bull. Amer. Meteor. Soc., 87, 1039–1055.
Anthes, R. A., 1990: Recent applications of the Penn State/NCAR Mesoscale Model to synoptic, meso-scale, and climate studies. Bull. Amer. Meteor. Soc., 71, 1610–1629.
—, and T. T. Warner, 1978: Development of hydro-dynamic models suitable for air pollution and other mesometeorological studies. Mon. Wea. Rev., 106, 1045–1078.
—, S. L. Rosenthal, and J. W. Trout, 1971a: Preliminary results from an asymmetric model of the tropical cyclone. Mon. Wea. Rev., 99, 744–758.
—, J. W. Trout, and S. L. Rosenthal, 1971b: Compari-sons of tropical cyclone simulations with and without the assumption of circular symmetry. Mon. Wea. Rev., 99, 759–766.
Arakawa, H., 1950: Vertical structure of a mature typhoon. Mon. Wea. Rev., 78, 197–200.
Bergeron, T., 1954: The problem of tropical hurricanes. Quart. J. Roy. Meteor. Soc., 80, 131–164.
Black, M. L., and H. E. Willoughby, 1992: The concentric eyewall cycle of Hurricane Gilbert. Mon. Wea. Rev., 120, 947–957.
Black, P. G., and G. J. Holland, 1995: The boundary layer of Tropical Cyclone Kerry (1979). Mon. Wea. Rev., 123, 2007–2028.
—, R. L. Elsberry, L. K. Shay, R. P. Partridge, and J. D. Hawkins, 1988: Atmospheric boundary layer and oceanic mixed layer observations in Hurricane Josephine obtained from air-deployed drifting buoys and research aircraft. J. Atmos. Oceanic Technol., 5, 683–698.
Braham, R. R., Jr., 1996: The Thunderstorm Project. 18th Conf. on Severe Local Storms, San Francisco, CA, Amer. Meteor. Soc.
—, and E. A. Neil, 1958: Modification of hurricanes through cloud seeding. NHRP Reports No. 16, 12 pp.
Burpee, R., 1972: The origins and structure of easterly waves in the lower troposphere of north Africa. J. Atmos. Sci., 29, 77–90.
—, 1975: Some features of synoptic-scale waves based on a compositing analysis of GATE data. Mon. Wea. Rev., 103, 921–925.
—, J. L. Franklin, S. J. Lord, R. E. Tuleya, and S. D. Aberson, 1996: The impact of Omega dropwind-sondes on operational hurricane track forecast models. Bull. Amer. Meteor. Soc., 77, 925–933.
Carlson, T. N., and J. M. Prospero, 1972: The large-scale movement of Saharan air outbreaks over the
WEB SITESNHRP/NHRL/NHEML/HRD history: www.aoml.noaa.gov/hrd/hrd_sub/beginning.htmlJoint Hurricane Testbed: www.nhc.noaa.gov/jht/index.shtmlDropsonde assessments: www.aoml.noaa.gov/hrd/assessment/index.htmlFlight data archives: www.aoml.noaa.gov/hrd/data_sub/hurr.htmlH*Wind analyses: www.aoml.noaa.gov/hrd/data_sub/wind.htmlNHRP/NHRL/NHEML/HRD data rescue project: www.aoml.noaa.gov/hrd/project2007/rescue.html
1585OCTOBER 2007AMERICAN METEOROLOGICAL SOCIETY |

northern equatorial Atlantic. J. Appl. Meteor., 11, 283–297.
Cione, J. J., and E. W. Uhlhorn, 2003: Sea surface tem-perature variability in hurricanes: Implications with respect to intensity change. Mon. Wea. Rev., 131, 1783–1796.
Cline, I., 1926: Tropical Cyclones. Macmillan, 301 pp.Cotton, W. R., and R. A. Pielke Sr. 1995: Human Impacts
on Weather and Climate. Cambridge University Press, 288 pp.
Cunning, J. B., and R. I. Sax, 1977: A Z–R relationship for the GATE B-scale array. Mon. Wea. Rev., 105, 1330–1336.
DeMaria, M., and J. Kaplan, 1994: A Statistical Hur-ricane Intensity Prediction Scheme (SHIPS) for the Atlantic basin. Wea. Forecasting, 9, 209–220.
—, S. D. Aberson, K. V. Ooyama, and S. J. Lord, 1992: A nested spectral model for hurricane track forecast-ing. Mon. Wea. Rev., 120, 1628–1643.
—, M. Mainelli, L. K. Shay, J. A. Knaff, and J. Kaplan, 2005: Further improvements to the Statistical Hurricane Intensity Prediction Scheme (SHIPS). Wea. Forecasting, 20, 531–543.
Department of Commerce, 1957: Budget Digest. U.S. Weather Bureau, 2 pp.
—, 1962: Budget Digest. U.S. Weather Bureau, 109 pp.Depperman, C. E., 1939: Some characteristics of
Philippine typhoons. Philippine Weather Bureau, Manila Central Observatory, Philippine Bureau of Printing, 143 pp.
Dodge, P. P., J. Gamache, E. Uhlhorn, D. Estaban, and P. Chang, 2004: Onshore and offshore wind flow regimes at the landfall of Hurricane Isabel (2003). Preprints, 26th Conf. on Hurricanes and Tropical Meteorology, Miami Beach, FL, Amer. Meteor. Soc., 564–565.
Dunion, J. P., and C. S. Velden, 2004: The impact of the Saharan air layer on Atlantic tropical cyclone activ-ity. Bull. Amer. Meteor. Soc., 85, 353–365.
Dunn, G. E., 1961: The hurricane season of 1960. Mon. Wea. Rev., 89, 99–108.
—, W. R. Davis, and P. L. Moore, 1955: Hurricanes of 1955. Mon. Wea. Rev., 83, 315–326.
—, R. C. Gentry, and B. M. Lewis, 1968: An eight-year experiment in improving forecasts of hurricane motion. Mon. Wea. Rev., 96, 708–713.
Federal Register, 2004: JHT overview. Department of Commerce/NOAA, Vol. 69, No. 125, 39431.
Fleming, J. R., 1990: Meteorology in America, 1800–1870. Johns Hopkins University Press, 288 pp.
Franklin, J. L., M. L. Black, and K. Valde, 2003: GPS dropwindsonde wind profiles in hurricanes and their operational implications. Wea. Forecasting, 18, 32–44.
Gamache, J. F., and R. A. Houze Jr., 1985: Further analysis of the composite wind and thermodynamic structure of the 12 September GATE squall line. Mon. Wea. Rev., 113, 1241–1260.
Gentry, R. C., 1955: The 1954 hurricane season. Weatherwise, 8, 12–18.
Goldenberg, S. B., and L. J. Shapiro, 1996: Physical mechanisms for the association of El Niño and West African rainfall with Atlantic major hurricane activ-ity. J. Climate, 9, 1169–1187.
—, C. W. Landsea, A. M. Mestas-Nuñez, and W. M. Gray, 2001: The recent increase in Atlantic hur-ricane activity: Causes and implications. Science, 293, 474–479.
Gray, W. M., C. W. Landsea, P. W. Mielke Jr., and K. J. Berry, 1992: Predicting Atlantic seasonal hurricane activity 6–11 months in advance. Wea. Forecasting, 7, 440–455.
Griffin, J. S., R. W. Burpee, F. D. Marks, and J. F. Franklin, 1992: Real-time airborne analysis of air-craft data supporting operational hurricane forecast-ing. Wea. Forecasting, 7, 480–490.
Harris, D. L., 1958: Hurricane Audrey storm tide. NHRP Reports No. 23, 19 pp.
—, 1959: An interim hurricane storm surge forecast-ing guide. NHRP Reports No. 32, 24 pp.
Hawk ins , H. F. , 1960 : The hurr icane beacon. Weatherwise, 13, 91–93.
—, 1962: Statement on NHRP accomplishments pre-pared for Dr. Wexler’s presentation to the President’s Committee. Official OMR Memo. to H. Wexler, 21 February, 3 pp.
—, and S. M. Imbembo, 1976: The structure of a small, intense hurricane—Inez 1966. Mon. Wea. Rev., 104, 418–442.
Hawkins, H. L., Jr., L. Pardue Jr., and C. Reber, 1961: The National Hurricane Center. Weatherwise, 14, 87–98.
Holland, J. Z., 1970: Preliminary report on the BOMEX sea–air interaction program. Bull. Amer. Meteor. Soc., 51, 809–820.
Hubert, L., 1956: Numerical weather prediction of hur-ricane motion. NHRP Reports No. 2, 29 pp.
Jarrell, J. D., M. Mayfield, E. N. Rappaport, and C. Landsea, 2001: The deadliest, costliest, and most intense United States hurricanes from 1900 to 2000. NOAA Tech. Memo. NWS TPC-1, 30 pp.
Jarvinen, B. R., and C. J. Neumann, 1979: Statistical forecasts of tropical cyclone intensity. NOAA Tech. Memo. NWS NHC-10, 22 pp.
Johnson, R. H., 1978: Cumulus transports in a tropical wave composite for Phase III of GATE. J. Atmos. Sci., 35, 484–494.
1586 OCTOBER 2007|

Jones, R. W., 1976: Integration of a tropical cyclone model on a nested grid. NOAA Tech. Memo. ERL-WMPO-30, 37 pp.
—, 1980: A three-dimensional tropical cyclone model with release of latent heat by the resolvable scales. J. Atmos. Sci., 37, 930–938.
Jordan, C. L., 1957a: A mean atmosphere for the West Indies area. NHRP Reports No. 6, 17 pp.
—, 1957b: Estimating central pressure of tropical cyclones from aircraft data. NHRP Reports No. 10, 12 pp.
—, and E. S. Jordan, 1954: On the mean thermal structure of tropical cyclones. J. Atmos. Sci., 11, 440–448.
Jorgensen, D. F., 1984: Mesoscale and convective-scale characteristics of mature hurricanes: Part II. Inner core structure of Hurricane Allen (1980). J. Atmos. Sci., 41, 1287–1311.
Kasahara, A., and G. W. Platzman, 1963: Interaction of a hurricane with the steering flow and its effect upon the hurricane trajectory. Tellus, 15, 321–335.
Kutzbach, G., 1979: The Thermal Theory of Cyclones. Amer. Meteor. Soc., 280 pp.
Landsea, C. W., and Coauthors, 2004: The Atlantic hur-ricane database reanalysis project: Documentation for the 1851–1910 alterations and additions to the HURDAT database. Hurricanes and Typhoons: Past, Present and Future, R. J. Murname and K.-B. Liu, Eds., Columbia University Press, 177–221.
Lissner, W., 1955: Our mild climate worries experts. The New York Times, sec. A, p. 1, evening edition.
Malkus, J. S., C. Ronne, and M. Chaffee, 1961: Cloud patterns in Hurricane Daisy (1958). Tellus, 13, 8–29.
Miller, B. I., 1957: On the maximum intensity of hur-ricanes. NHRP Reports No. 14, 19 pp.
—, 1958a: The three-dimensional wind structure around a tropical cyclone. NHRP Reports No. 15, 41 pp.
—, 1958b: The use of mean layer winds as a hurricane steering mechanism. NHRP Reports No. 18, 24 pp.
—, and P. P. Chase, 1966: Prediction of hurricane motion by statistical methods. Mon. Wea. Rev., 94, 399–406.
Newnham, E. V., 1922: Hurricanes and tropical revolv-ing storms. Geophys. Mem., 19, 232.
NHRP, 1956: Objectives and basic design of the National Hurricane Research Project. Bull. Amer. Meteor. Soc., 37, 263–269.
Ooyama, K. V., 1987: Scale-controlled objective analysis. Mon. Wea. Rev., 115, 2479–2506.
Palmén, E., 1948: On the formation and structure of tropical hurricanes. Geophysica, 3, 26–38.
—, 1958: F. W. Reichelderfer, December 1958, Official Correspondence, 2 pp.
Parrish, J. R., R. W. Burpee, F. D. Marks Jr., and R. Grebe, 1982: Rainfall patterns observed by digitized radar during the landfall of Hurricane Frederic (1979). Mon. Wea. Rev., 110, 1933–1944.
Pielke, R. A., Jr., and C. W. Landsea, 1998: Normalized U.S. hurricane damage, 1925–1995. Wea. Forecast-ing, 13, 621–631.
—, —, M. Mayfield, J. Laver, and R. Pasch, 2005: Hurricanes and global warming. Bull. Amer. Meteor. Soc., 86, 1571–1575.
Powell, M. D., and S. H. Houston, 1996: Hurricane Andrew’s landfall in south Florida. Part II: Surface wind fields and potential real-time applications. Wea. Forecasting, 11, 329–349.
—, P. P. Dodge, and M. L. Black, 1991: The landfall of Hurricane Hugo in the Carolinas: Surface wind distribution. Wea. Forecasting, 6, 379–399.
—, S. H. Houston, and T. A. Reinhold, 1996: Hurricane Andrew’s landfall in south Florida. Part I: Standard-izing measurements for documentation of surface wind fields. Wea. Forecasting, 11, 304–328.
—, —, L. R. Amat, and N Morisseau-Leroy, 1998: The HRD real-time hurricane wind analysis system. J. Wind. Eng. Indust. Aerodyn., 77–78, 53–64.
—, D. Bowman, D. Gilhousen, S. Murillo, N. Carrasco, and R. St. Fleur, 2004: Tropical cyclone winds at landfall: The ASOS–C-MAN Wind Exposure Documentation Project. Bull. Amer. Meteor. Soc., 85, 845–851.
Project STORMFURY, 1964: Appendix D. Annual Report 1963, D1–D3.
—, 1970: Annual Report 1969. 110 pp.—, 1972: Annual Report 1971. 179 pp.Riehl, H., 1955: Hurricane reconnaissance tracks. Bull.
Amer. Meteor. Soc., 37, 291–292.—, and W. Haggard, 1954: A quantitative method
for the prediction of tropical storm motion. Proc. UNESCO Symp. on Typhoons, 148–247.
—, and J. S. Malkus, 1961: Some aspects of Hurricane Daisy 1958. Tellus, 13, 181–211.
Rogers, R., and Coauthors, 2006: The Intensity Forecast-ing Experiment: A NOAA multiyear field program for improving tropical cyclone intensity forecasts. Bull. Amer. Meteor. Soc., 87, 1523–1537.
Rosenthal, S. L., 1964: Some attempts to simulate the development of a tropical cyclone by numerical methods. Mon. Wea. Rev., 92, 1–21.
—, 1970a: Experiments with a numerical model of tropical cyclone development: Some effects of radial resolution. ESSA Tech. Memo. ERL TM-NHRL 88, 47 pp.
1587OCTOBER 2007AMERICAN METEOROLOGICAL SOCIETY |
—, 1970b: A circularly symmetric primitive equation model of tropical cyclone development containing an explicit water vapor cycle. Mon. Wea. Rev., 98, 643–663.
—, 1978: Numerical simulation of tropical cyclone development with latent heat release by the resolvable scales. I: Model description and preliminary results. J. Atmos. Sci., 35, 258–271.
—, and W. J. Koss, 1968: Linear analysis of a tropical cyclone model with increased vertical resolution. Mon. Wea. Rev., 96, 858–866.
Schaefer, V., 1953: Final report Project Cirrus Part I and II. General Electric Laboratories RL Rep. No. 785, 54 pp.
Science News Letter, 1960: Hurricane Donna tracked by radar. Vol. 77, Science Service, 199.
Simpson, R. H., 1947: A note on the movement and structure of the Florida hurricane of October 1946. Mon. Wea. Rev., 75, 53–58.
—, 1952: Exploring eye of Typhoon Marge 1951. Bull. Amer. Meteor. Soc., 33, 286–298.
—, 1954a: Hurricanes. Sci. Amer., 190, 32–37.—, 1954b: Structure of an immature hurricane. Bull.
Amer. Meteor. Soc., 35, 335–350.—, 1963: Liquid water in squall lines and hurricanes
at air temperatures lower than -40 C. Mon. Wea. Rev., 91, 687–693.
—, 1989: Tape recorded interview. E. Zipser, interviewer, Amer. Meteor. Soc., conducted at Boulder, CO, 45 pp.
—, Ed., 2003: Hurricane! Coping with Disaster. Amer. Geophys. Union, 440 pp.
—, and Major L. G. Starrett, 1955: Further studies of hurricane structure by aircraft reconnaissance. Bull. Amer. Meteor. Soc., 36, 459–468.
—, and J. S. Simpson, 1966: Why experiment on tropi-cal hurricanes? Trans. NYAS, 28, 1045–1052.
—, M. R. Ahrens, and R. D. Decker, 1963: A cloud seeding experiment in Hurrican Esther, 1961. NHRP Reports No. 60, 30 pp.
Smith, C. L., 1975: On the intensification of Hurricane Celia (1970). Mon. Wea. Rev., 103, 131–148.
St. Amand, P., and G. W. Henderson, 1962: Project Cyclops: An experiment in huricane modification. U.S. Naval Ordnance Test Station, 1.
Sumner, H. C., 1944: The North Atlantic hurricane of September 8–16, 1944. Mon. Wea. Rev., 72, 187–193.
Wexler, H., 1945: The structure of the September 1944, hurricane when off Cape Henry, Virginia. Bull. Amer. Meteor. Soc., 24, 156–159.
Willoughby, H. E., J. A. Clos, and M. G. Shoreibah, 1982: Concentric eye walls, secondary wind maxima, and the evolution of the hurricane vortex. J. Atmos. Sci., 39, 395–411.
—, F. D. Marks Jr., and R. J. Feinberg, 1984a: Station-ary and moving convective bands in hurricanes. J. Atmos. Sci., 41, 3189–3211.
—, H.-L. Jin, S. J. Lord, and J. M. Piotrowicz, 1984b: Hurricane structure and evolution as simulated by an axisymmetric, nonhydrostatic numerical model. J. Atmos. Sci., 41, 1169–1186.
—, D. P. Jorgensen, R. A. Black, and S. L. Rosen-thal, 1985: Project STORMFURY: A scientif ic chronicle 1962–1983. Bull. Amer. Meteor. Soc., 66, 505–514.
Winston, J., Ed., 1959: Hurricane forecasting. U.S. Weather Bureau Forecasting Guide No. 3, 108 pp.
1588 OCTOBER 2007|