Embed Size (px)
Citation preview
Advances and Challenges at the National Hurricane Center
EDWARD N. RAPPAPORT, JAMES L. FRANKLIN, LIXION A. AVILA, STEPHEN R. BAIG,* JOHN L. BEVEN II,ERIC S. BLAKE, CHRISTOPHER A. BURR, JIANN-GWO JIING, CHRISTOPHER A. JUCKINS, RICHARD
D. KNABB, CHRISTOPHER W. LANDSEA, MICHELLE MAINELLI,1 MAX MAYFIELD,# COLIN J. MCADIE,RICHARD J. PASCH, CHRISTOPHER SISKO, STACY R. STEWART, AND AHSHA N. TRIBBLE@
NOAA/National Weather Service/National Hurricane Center, Miami, Florida
(Manuscript received 9 February 2008, in final form 1 October 2008)
ABSTRACT
The National Hurricane Center issues analyses, forecasts, and warnings over large parts of the North
Atlantic and Pacific Oceans, and in support of many nearby countries. Advances in observational capabil-
ities, operational numerical weather prediction, and forecaster tools and support systems over the past 15–20
yr have enabled the center to make more accurate forecasts, extend forecast lead times, and provide new
products and services. Important limitations, however, persist. This paper discusses the current workings and
state of the nation’s hurricane warning program, and highlights recent improvements and the enabling
science and technology. It concludes with a look ahead at opportunities to address challenges.
1. Introduction
The National Hurricane Center—Past, Present and
Future (Sheets 1990) chronicled the U.S. government
civilian hurricane forecast and warning service from its
beginnings in the nineteenth century through the 1980s.
It also described the responsibilities, and the tools and
processes applied at the end of that period at the Na-
tional Hurricane Center (NHC; see Table 1 for a list of
acronyms and their expansions used in this paper).
Sheets’s 1990 review occurred near the end of a ;25
yr period of relatively low hurricane activity and impact
in the United States after Hurricane Camille (1969).
Not coincidentally, storm surge, this country’s greatest
tropical cyclone threat historically, caused few casual-
ties during that period. Like other NHC directors,
Sheets made clear, however, that additional hurricane
disasters were imminent and would be exacerbated by
an expected continued rapid growth of coastal popula-
tions and infrastructure.
A large increase in Atlantic basin tropical cyclone
events and impacts indeed followed. The activity in-
cluded the busiest season on record (2005, with 28 trop-
ical storms1 and hurricanes), the most intense hurricane
(as measured by central pressure) on record (Wilma of
2005), one of the deadliest hurricanes (Mitch of 1998),
the deadliest U.S. hurricane in more than 75 yr and the
costliest ever (Katrina of 2005), and the third strongest
hurricane at U.S. landfall (Andrew of 1992). This period
also presented its share of critical operational challenges,
including some memorable instances where forecasts
fell short of goals. Examples include Andrew’s accel-
eration toward Florida, Mitch’s southward movement
(Pasch et al. 2001), Wilma’s unprecedented intensifica-
tion (Beven et al. 2008), and Humberto’s development
during 2007 from a weak low into a landfalling hurri-
cane in less than 24 h (Blake 2007).
Sheets’s article served not only to describe the na-
tion’s hurricane program, but also to educate readers
on the U.S. hurricane problem. His depiction, based
on National Weather Service (NWS) storm surge
*Retired.1Current affiliation: National Centers for Environmental Pre-
diction Central Operations, Camp Springs, Maryland.
#Current affiliation: WPLG-TV, Miami, Florida.
@Current affiliation: National Weather Service/Climate Service
Division, Silver Spring, Maryland.
Corresponding author address: Edward N. Rappaport, National
Hurricane Center, 11691 SW 17th St., Miami, FL 33165-2149.
E-mail: [email protected]
1 This count includes one subtropical storm. In this paper, the
term ‘‘tropical cyclone’’ refers to both tropical and subtropical
systems of depression [,34 kt (17.5 m s21)], storm [34–63 kt (17.5–
32.4 m s21)], or hurricane [$ 64 kt (32.4 m s21)] intensity.
APRIL 2009 R A P P A P O R T E T A L . 395
DOI: 10.1175/2008WAF2222128.1
simulations, of a hurricane putting 20 1 ft (6 1 m) of
water in New Orleans and environs was prescient (his
Fig. 2b). Fifteen years later Katrina struck that area,
directly causing about 1500 fatalities2 and causing
damage estimated at $81 billion (Beven et al. 2008).
Yet, well before its arrival, some had projected the
impact in that area of a strong hurricane would be much
worse, with fatalities reaching 60 000 (Cooper and
Block 2006) or even 100 000 (Schleifstein and McQuaid
2002).
By any measure the losses from Katrina are tragic. Put
in the context of the above projections, however, the
relatively low loss of life is noteworthy. Such a result did
not occur by chance, but rather reflects significant cu-
mulative advances in hurricane forecasting, communi-
cation methods, and preparedness processes made by
NHC and/or its public and private partners—in many
aspects collaboratively. Willoughby et al. (2007) esti-
mated that such advances ‘‘prevented 66-90% of the
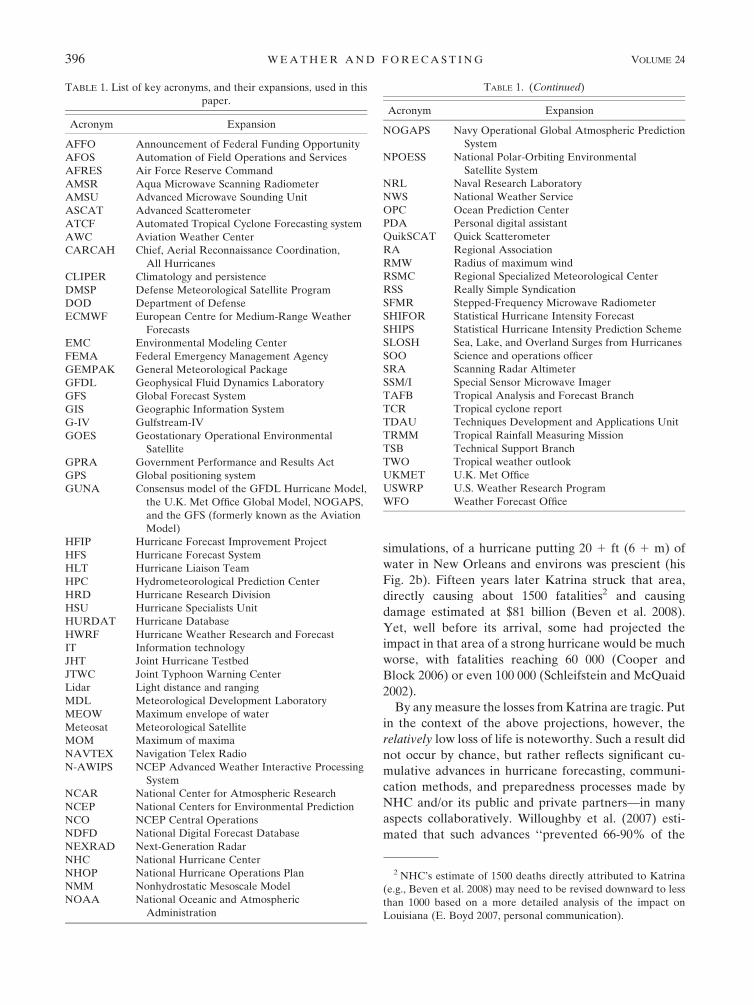
TABLE 1. List of key acronyms, and their expansions, used in this
paper.
Acronym Expansion
AFFO Announcement of Federal Funding Opportunity
AFOS Automation of Field Operations and Services
AFRES Air Force Reserve Command
AMSR Aqua Microwave Scanning Radiometer
AMSU Advanced Microwave Sounding Unit
ASCAT Advanced Scatterometer
ATCF Automated Tropical Cyclone Forecasting system
AWC Aviation Weather Center
CARCAH Chief, Aerial Reconnaissance Coordination,
All Hurricanes
CLIPER Climatology and persistence
DMSP Defense Meteorological Satellite Program
DOD Department of Defense
ECMWF European Centre for Medium-Range Weather
Forecasts
EMC Environmental Modeling Center
FEMA Federal Emergency Management Agency
GEMPAK General Meteorological Package
GFDL Geophysical Fluid Dynamics Laboratory
GFS Global Forecast System
GIS Geographic Information System
G-IV Gulfstream-IV
GOES Geostationary Operational Environmental
Satellite
GPRA Government Performance and Results Act
GPS Global positioning system
GUNA Consensus model of the GFDL Hurricane Model,
the U.K. Met Office Global Model, NOGAPS,
and the GFS (formerly known as the Aviation
Model)
HFIP Hurricane Forecast Improvement Project
HFS Hurricane Forecast System
HLT Hurricane Liaison Team
HPC Hydrometeorological Prediction Center
HRD Hurricane Research Division
HSU Hurricane Specialists Unit
HURDAT Hurricane Database
HWRF Hurricane Weather Research and Forecast
IT Information technology
JHT Joint Hurricane Testbed
JTWC Joint Typhoon Warning Center
Lidar Light distance and ranging
MDL Meteorological Development Laboratory
MEOW Maximum envelope of water
Meteosat Meteorological Satellite
MOM Maximum of maxima
NAVTEX Navigation Telex Radio
N-AWIPS NCEP Advanced Weather Interactive Processing
System
NCAR National Center for Atmospheric Research
NCEP National Centers for Environmental Prediction
NCO NCEP Central Operations
NDFD National Digital Forecast Database
NEXRAD Next-Generation Radar
NHC National Hurricane Center
NHOP National Hurricane Operations Plan
NMM Nonhydrostatic Mesoscale Model
NOAA National Oceanic and Atmospheric
Administration
TABLE 1. (Continued)
Acronym Expansion
NOGAPS Navy Operational Global Atmospheric Prediction
System
NPOESS National Polar-Orbiting Environmental
Satellite System
NRL Naval Research Laboratory
NWS National Weather Service
OPC Ocean Prediction Center
PDA Personal digital assistant
QuikSCAT Quick Scatterometer
RA Regional Association
RMW Radius of maximum wind
RSMC Regional Specialized Meteorological Center
RSS Really Simple Syndication
SFMR Stepped-Frequency Microwave Radiometer
SHIFOR Statistical Hurricane Intensity Forecast
SHIPS Statistical Hurricane Intensity Prediction Scheme
SLOSH Sea, Lake, and Overland Surges from Hurricanes
SOO Science and operations officer
SRA Scanning Radar Altimeter
SSM/I Special Sensor Microwave Imager
TAFB Tropical Analysis and Forecast Branch
TCR Tropical cyclone report
TDAU Techniques Development and Applications Unit
TRMM Tropical Rainfall Measuring Mission
TSB Technical Support Branch
TWO Tropical weather outlook
UKMET U.K. Met Office
USWRP U.S. Weather Research Program
WFO Weather Forecast Office
2 NHC’s estimate of 1500 deaths directly attributed to Katrina
(e.g., Beven et al. 2008) may need to be revised downward to less
than 1000 based on a more detailed analysis of the impact on
Louisiana (E. Boyd 2007, personal communication).
396 W E A T H E R A N D F O R E C A S T I N G VOLUME 24
hurricane-related deaths in the United States that would
have resulted from techniques used in the 1950s. . . .’’
These efforts by NHC and others produced accurate
and consistent forecasts for Katrina in the 2–3 days
before its Gulf landfall—forecasts that were said to have
saved many lives. United States Senator Jim DeMint of
South Carolina, chairman of the Commerce Commit-
tee’s Disaster Prediction and Prevention Subcommittee,
stated ‘‘These early and accurate forecasts [of Katrina]
saved countless lives along the Gulf Coast. . . . We owe a
debt of gratitude to Director Mayfield and his team of
scientists for their hard work.’’ During the 2004 hurri-
cane season, NHC was recognized by the first visit to the
center by a U.S. president, and the president made two
subsequent visits to NHC in 2005 and 2006.
The center’s focus on public service and safety was
formalized in its mission and vision statements devel-
oped in 2001. NHC’s mission is
To save lives, mitigate property loss, and improve eco-nomic efficiency by issuing the best watches, warnings,forecasts, and analyses of hazardous tropical weather,and by increasing understanding of these hazards.
NHC’s vision is
To be America’s calm, clear, and trusted voice in the eyeof the storm, and, with our partners, enable communitiesto be safe from tropical weather threats.
While gains clearly have been made, the losses in
Katrina and in other storms, the looming threat of ad-
ditional tropical cyclone–induced loss of life, and the
remaining significant limitations in tropical cyclone
forecast accuracy show that much work remains to be
done to fully address the goals set by NHC in its mission
and vision statements. This paper discusses the current
workings and state of the nation’s hurricane warning
program, highlighting improvements that have occurred
since Sheets’s review, and concludes with a look at op-
portunities to address challenges that lie ahead.
2. NHC organizational structure and forecastoperations
When it became part of the National Centers for
Environmental Prediction (NCEP) in 1995, NHC be-
came known then alternately as the Tropical Prediction
Center. NHC moved that year from its offices in Coral
Gables, Florida, to its current facility on the campus of
Florida International University in Miami, Florida. The
25 000 ft2 building houses both NHC and the National
Weather Service’s Miami Weather Forecast Office
(WFO). Its design team included engineer Herb Saffir,
an originator of the Saffir–Simpson hurricane scale. The
facility has many enhanced structural and redundant fea-
tures allowing forecast operations to continue through
most local weather and other emergencies.
NHC’s $6.4M (fiscal year 2008) budget supports 46
federal government employees and associated infra-
structure. Other components of the federal government
bear the costs for weather observations, computer mod-
eling, most tropical weather research, etc. used by NHC.
NHC comprises three operational workgroups, the
Hurricane Specialists Unit (HSU), the Tropical Analysis
and Forecast Branch (TAFB), and the Technical Sup-
port Branch (TSB). Their activities are described below.
NHC also has a small administrative staff led by its di-
rector. Following Robert Sheets (1987–95) in that posi-
tion were Robert Burpee (1995–97), Jerry Jarrell (1998–
2000), Max Mayfield (2000–2007), Bill Proenza (2007),
and Bill Read (2008–present). About a dozen employees
from other federal agencies collaborate on site with
NHC staff.
a. Hurricane Specialists Unit (HSU)
The HSU has a full-time focus on hurricanes, with its
members having a wide array of responsibilities through-
out the calendar year. During hurricane season, (15
May–30 November in the eastern North Pacific and
1 June–30 November in the Atlantic basin) they develop,
coordinate, and issue analyses, forecasts, and coastal trop-
ical cyclone watches and warnings in text and graphical
formats. They also provide briefings on active tropical
cyclones to emergency managers and the media, and
write poststorm tropical cyclone reports on each sys-
tem shortly after the event. Their products are governed
by NWS directives, instructions, and manuals (NWS
2007), the National Hurricane Operations Plan (NHOP)
for U.S. Federal Agencies (OFCM 2007), and the World
Meteorological Organization (WMO) Regional Asso-
ciation (RA) IV Hurricane Operational Plan (WMO
2006).
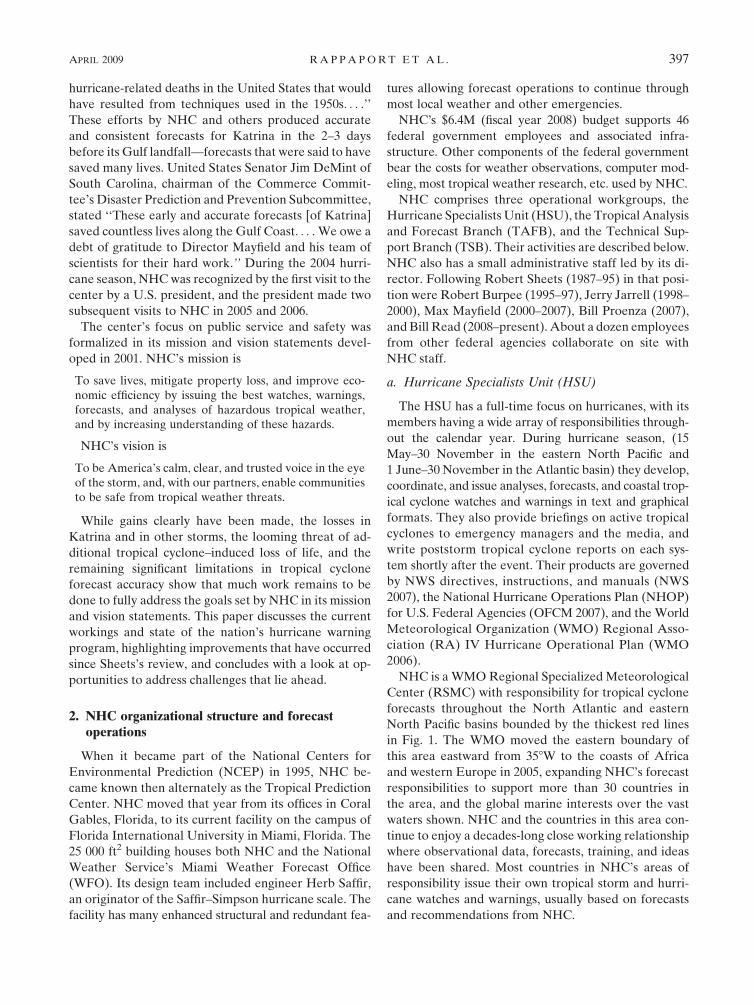
NHC is a WMO Regional Specialized Meteorological
Center (RSMC) with responsibility for tropical cyclone
forecasts throughout the North Atlantic and eastern
North Pacific basins bounded by the thickest red lines
in Fig. 1. The WMO moved the eastern boundary of
this area eastward from 358W to the coasts of Africa
and western Europe in 2005, expanding NHC’s forecast
responsibilities to support more than 30 countries in
the area, and the global marine interests over the vast
waters shown. NHC and the countries in this area con-
tinue to enjoy a decades-long close working relationship
where observational data, forecasts, training, and ideas
have been shared. Most countries in NHC’s areas of
responsibility issue their own tropical storm and hurri-
cane watches and warnings, usually based on forecasts
and recommendations from NHC.
APRIL 2009 R A P P A P O R T E T A L . 397
In addition to its forecast responsibilities, NHC issues
coastal tropical storm and hurricane watches3 and warn-
ings4 for U.S. areas in Fig. 1, including Puerto Rico and
the U.S. Virgin Islands, in collaboration with WFOs. The
WFOs issue tropical storm and hurricane watches and
warnings for inland U.S. locations.
For all active tropical cyclones in the Atlantic and
eastern North Pacific basins, the hurricane specialists at
the NHC issue a suite of forecast products every 6 h that
contain projections valid 12, 24, 36, 48, 72, 96, and 120 h
after the forecast’s initial synoptic time (0000, 0600,
1200, or 1800 UTC). This nominal initial time represents
the beginning of the forecast process, as the actual ad-
visory products are not released until 3 h after the
nominal initial time. The forecasts include the cyclone’s
center position (location of the circulation center in
latitude and longitude) to the nearest 0.18 (generally 0.58
at extended forecast periods) and maximum surface
wind speed (maximum sustained 1-min-average wind
speed at 10-m altitude) to the nearest 5 kt (2.6 m s21).
Five-day forecasts became operational in 2003, prior to
which 3-day forecasts had been issued since 1964. The
size of a tropical cyclone is conveyed via wind radii that
represent the maximum horizontal extent in each of
four quadrants (northeast, southeast, etc.) of a particu-
lar sustained wind speed from the circulation center.
Wind radii for 34 and 50 kt are forecast through 72 h and
64-kt radii are forecast through 36 h. Radii of 12-ft
(3.7 m) seas are included for the advisory time.
NHC’s advisory suite comprises several text and
graphical products. The primary text products are the
tropical cyclone public advisory, forecast/advisory, and
discussion. The public advisory is a plain-language report
on current and short-term forecast characteristics, along
with coastal hurricane and tropical storm watch and
FIG. 1. NHC areas of analysis and/or forecast responsibility.
3 A hurricane watch means hurricane conditions are possible
somewhere within the watch area during the next 36 h.4 A hurricane warning means hurricane conditions are expected
somewhere within the warning area during the next 24 h.
398 W E A T H E R A N D F O R E C A S T I N G VOLUME 24
warning information. The forecast/advisory provides
quantitative forecast information about the cyclone’s
location, intensity, and size. The discussion conveys
NHC’s reasoning behind its analysis and forecast, in-
formation about the (un)certainty in the forecast, and
possible alternate forecast solutions. In 2006 the wind
speed probability text product (section 7b) was intro-
duced into the advisory suite. This product conveys the
chances of sustained winds of tropical storm and hurri-
cane force at specific locations through 120 h, by con-
sidering the combined uncertainties in the forecast track,
intensity, and size (Gross et al. 2004). This wind speed
probability text product replaced the strike probability
product (Sheets 1985) that had been issued only for
Atlantic basin tropical cyclones (and only out to 72 h).
Other text products can be issued between the regular
6-hourly advisory packages. Intermediate public advi-
sories are issued when watches and/or warnings are in
effect, at 2-h intervals when land-based radar can pro-
vide reliable center location fixes, and at 3-h intervals
otherwise. In addition, tropical cyclone position esti-
mates are issued in between two-hourly intermediate
public advisories. This means NHC products give the
cyclone’s estimated location hourly when the threat is
imminent. A ‘‘special advisory’’ package comprising the
standard suite of products can be issued at any time to
convey a significant change to the previous forecast
before the next regularly scheduled issuance. The tropi-
cal cyclone update is a short text product used to advise
of significant changes in a cyclone or to advise of changes
to watches or warnings.
NHC’s tropical cyclone track and watches–warnings
graphic includes a shaded area around the forecast track
to convey uncertainty in that forecast based on official
forecast error statistics for the preceding 5-yr period. In
addition to the wind speed probability text product, the
companion graphical wind speed probability products
became operational in 2006. A maximum wind speed
probability table is also produced to convey uncertainties
in the forecast intensity of the cyclone.
The HSU also issues tropical weather outlook (TWO)
text products four times daily during the hurricane
season in both the Atlantic and eastern North Pacific
basins. These products describe tropical weather sys-
tems of significance and their potential for tropical cy-
clone formation during the next 48 h. A special TWO
can be used to describe formative tropical systems that
have not become a tropical cyclone, especially if sig-
nificant changes have occurred since the most recent
TWO, and for potential tropical cyclones outside of the
hurricane season.
Monthly tropical weather summaries are issued by
the HSU at the end of each month of the hurricane
season for both the North Atlantic and eastern North
Pacific basins. These text products indicate preliminar-
ily the formation and end dates and estimated peak
intensity of each tropical cyclone occurring during the
month. After the conclusion of a tropical cyclone, the
hurricane specialists produce a tropical cyclone report
(TCR) based on their poststorm analysis of all available
data. The report includes an official ‘‘best track’’ chro-
nology of storm center locations, maximum wind speeds,
and minimum pressures, as well as a synoptic history,
summaries and tabulations of important meteorological
observations, casualty and damage statistics, and a fore-
cast and warning critique.
NHC tropical cyclone data acquisition, public pro-
ducts, forecasts, and watches–warnings are coordinated
with various other entities in person, via a ‘‘hurricane
hotline’’ (discussed in section 7d), conventional tele-
phone lines, and/or e-mail. Forecast and warning coor-
dination with international weather services relies on
conventional telephone lines and can occur in languages
other than English—primarily Spanish and French. The
coordination process facilitates a division of responsi-
bility in which NHC products provide ‘‘the big picture’’
while WFOs and WMO international meteorological
services typically focus on complementary details on
local conditions.
NHC also coordinates with the NCEP Hydrometeo-
rological Prediction Center (HPC) and the Department
of Defense regarding potential locations of tropical cy-
clones in the medium range (days 3–7) from 1 June to
30 November. Hurricane specialists request aircraft re-
connaissance missions through the Chief, Aerial Re-
connaissance Coordination, All Hurricanes (CARCAH)
unit at NHC. Hurricane specialists interact closely with
CARCAH during missions to maximize mission effec-
tiveness. Additional discussion of the aircraft program is
provided in sections 4c and 4e.
The HSU issues an average of around 700 full advisory
packages per year. The unit grew from 6 to 10 members
prior to the 2006 hurricane season to better handle the
increased numbers of operational products and services;
expanded forecast horizon; additional observational
data, model guidance, and storms; and new applied re-
search activities. The original six positions are now re-
ferred to as senior hurricane specialists, who currently
average about 15 yr of government tropical cyclone
forecasting experience. NHC is also adding an HSU
branch chief in 2009. Even this increased level of staffing
within the HSU, however, is insufficient during periods
of heightened activity. During the peak months of the
Atlantic season (August–October), TAFB and TSB staff
assist the HSU in meeting operational requirements
as ‘‘hurricane support meteorologists.’’ They can help
APRIL 2009 R A P P A P O R T E T A L . 399
prepare tropical cyclone advisories, enter and analyze
operational data, speak to media and emergency man-
agers, and write TCRs.
Hurricane specialists remain busy outside the hurri-
cane season. Their responsibilities include the occa-
sional off-season tropical cyclone (e.g., Epsilon and
Zeta in 2005–06); participating in several national and
international conferences; training emergency man-
agers, the media, and other meteorologists; conducting
public outreach and preparedness programs; writing
seasonal summary articles (e.g., Beven et al. 2008); and
participating in applied research projects. One such
project is the United States Weather Research Pro-
gram’s (USWRP) Joint Hurricane Testbed (JHT; see
section 6c). NHC also helps the Climate Prediction Cen-
ter prepare the NOAA annual seasonal hurricane fore-
cast (R. W. Higgins et al. 2008, personal communication).
b. Tropical Analysis and Forecast Branch (TAFB)
The TAFB is composed of a branch chief, five lead
forecasters, 10 forecasters, and two meteorologist interns.
They issue operational marine and tropical products
24 hours per day year-round within a 14 million (n mi)2
area of the tropical and subtropical North Atlantic, Ca-
ribbean Sea, Gulf of Mexico, and parts of the tropical and
subtropical eastern North and South Pacific (Fig. 1). The
eastern South Pacific responsibility was added in 1991.
The branch staffs three operational desks: Atlantic
marine, Pacific marine–tropical cyclone classifications,
and Atlantic–Pacific analysis. A fourth desk is staffed
during the peak of the hurricane season in the daytime
to meet an increased workload. TAFB’s customers in-
clude operators of commercial fishing vessels, yachts,
cruise ships, and vessels making transoceanic voyages as
well as the meteorological services of coastal nations.
TAFB issues the majority of NHC products, about 100
per day, split almost evenly between text and graphical
formats. Methods for communicating products include
the Internet, radiofacsimiles (out of the New Orleans;
Point Reyes, California; and Honolulu, Hawaii, trans-
mitter sites), synthesized voice, Navigation Telex Radio
(NAVTEX), and International Mobile Satellite Orga-
nization’s SafetyNET.
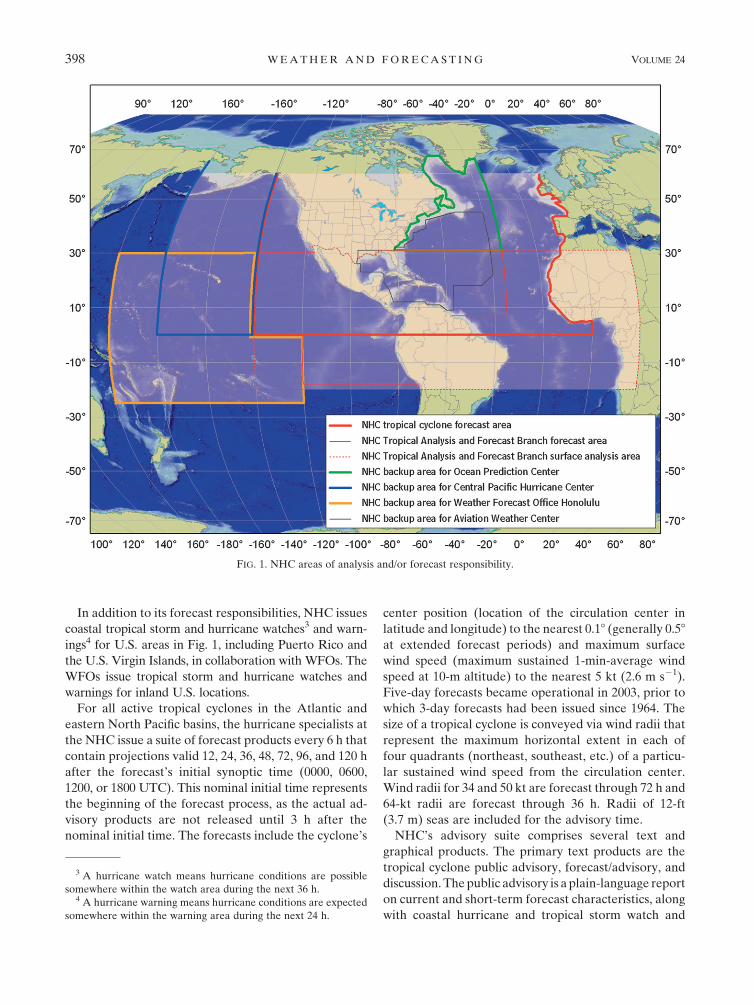
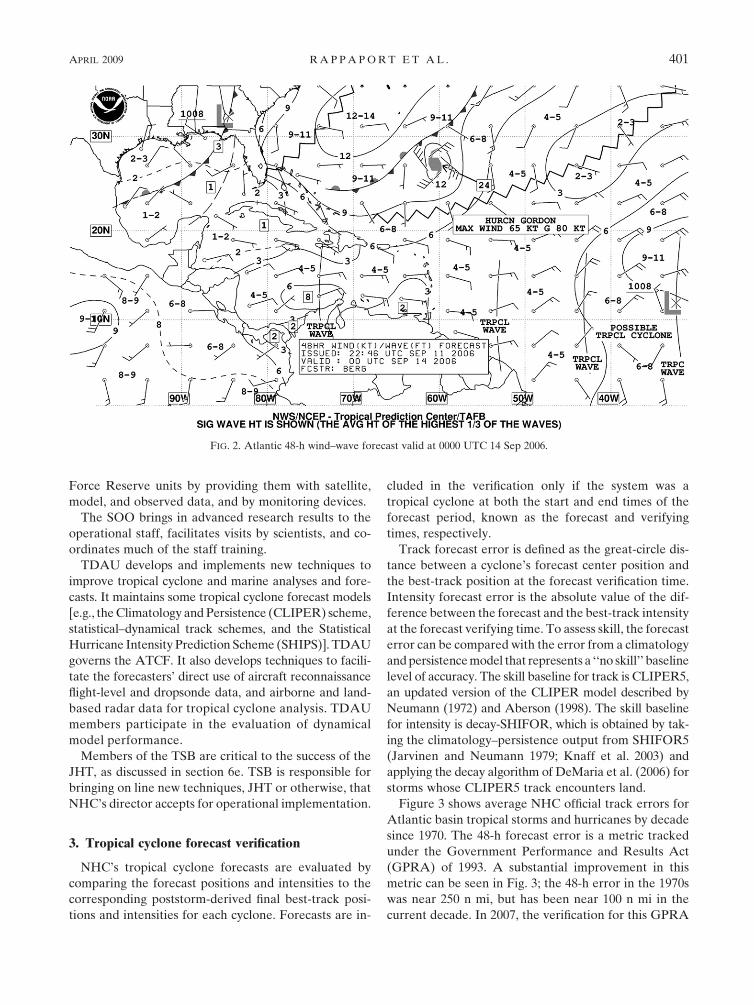
Graphical products include surface analyses, wind–
wave (e.g., Fig. 2) and surface forecast charts out to 72 h,
sea-state analyses, tropical cyclone danger areas, and
peak wave period–peak swell direction charts to 72 h. A
high-wind and associated seas chart replaces the tropi-
cal cyclone danger area graphic outside of the hurricane
season. TAFB has close operational ties with HPC,
the Ocean Prediction Center (OPC), and WFO Hono-
lulu, and collaborates with them to produce the surface
analysis.
Text products include high seas forecasts to 48 h,
offshore waters forecasts to 120 h sent via marine and
tropical weather discussions, and a pan-American pre-
sent weather–temperature–precipitation table. Several
of these products were added near the time when the
TAFB tropical aviation program was transferred to the
NCEP Aviation Weather Center (AWC) in 2000.
The branch produces for the HSU tropical cyclone
position and intensity estimates based on the Dvorak
(1984) geostationary satellite analysis technique, and
similar estimates for subtropical systems (Hebert and
Poteat 1975). In 2004, TAFB began making tropical
cyclone center position estimates using passive micro-
wave satellite imagery. TAFB generates precipitation
estimates for tropical systems within 36–48 h of landfall,
mainly for forecasters and emergency managers in RA-
IV countries.
TAFB writes papers on marine and tropical weather
topics for technical conferences, and an article high-
lighting high-wind and sea events three times per year
for the Mariner’s Weather Log. It also works on JHT
projects and has an outreach component dedicated to
marine–ocean and weather issues.
c. Technical Support Branch (TSB)
The TSB oversees NHC’s local information tech-
nology (IT) needs, providing (24 h) day21 support for
operational equipment and data flow. It also develops
and implements new tropical cyclone and tropical weather
analysis and forecast techniques, updates storm surge
basin databases and generates real-time storm surge
forecasts, and organizes and conducts training for NHC
staff. TSB also assists the HSU and TAFB by per-
forming occasional forecaster duties.
TSB is composed of a branch chief, a science and
operations officer (SOO), a Techniques Development
and Applications Unit (TDAU), which includes a Storm
Surge Unit (section 5d), and IT specialists and pro-
grammers.
Information systems supported by TSB include a
network of Linux servers and workstations, PCs, and
communication hardware for the ingestion, processing,
storage, and display of satellite imagery, numerical
model forecasts, and observations, as well as for the
generation and dissemination of NHC products. TSB
programmers develop and maintain scripts to generate
tropical cyclone and marine forecast and warning
graphics for NHC’s Web site. Two critical information
systems supported and enhanced by TSB are the NCEP
Advanced Weather Interactive Processing System
(N-AWIPS; section 6b) and the Automated Tropical
Cyclone Forecasting (ATCF) system (section 6a). The
IT staff also supports the collocated FEMA and Air
400 W E A T H E R A N D F O R E C A S T I N G VOLUME 24
Force Reserve units by providing them with satellite,
model, and observed data, and by monitoring devices.
The SOO brings in advanced research results to the
operational staff, facilitates visits by scientists, and co-
ordinates much of the staff training.
TDAU develops and implements new techniques to
improve tropical cyclone and marine analyses and fore-
casts. It maintains some tropical cyclone forecast models
[e.g., the Climatology and Persistence (CLIPER) scheme,
statistical–dynamical track schemes, and the Statistical
Hurricane Intensity Prediction Scheme (SHIPS)]. TDAU
governs the ATCF. It also develops techniques to facili-
tate the forecasters’ direct use of aircraft reconnaissance
flight-level and dropsonde data, and airborne and land-
based radar data for tropical cyclone analysis. TDAU
members participate in the evaluation of dynamical
model performance.
Members of the TSB are critical to the success of the
JHT, as discussed in section 6e. TSB is responsible for
bringing on line new techniques, JHT or otherwise, that
NHC’s director accepts for operational implementation.
3. Tropical cyclone forecast verification
NHC’s tropical cyclone forecasts are evaluated by
comparing the forecast positions and intensities to the
corresponding poststorm-derived final best-track posi-
tions and intensities for each cyclone. Forecasts are in-
cluded in the verification only if the system was a
tropical cyclone at both the start and end times of the
forecast period, known as the forecast and verifying
times, respectively.
Track forecast error is defined as the great-circle dis-
tance between a cyclone’s forecast center position and
the best-track position at the forecast verification time.
Intensity forecast error is the absolute value of the dif-
ference between the forecast and the best-track intensity
at the forecast verifying time. To assess skill, the forecast
error can be compared with the error from a climatology
and persistence model that represents a ‘‘no skill’’ baseline
level of accuracy. The skill baseline for track is CLIPER5,
an updated version of the CLIPER model described by
Neumann (1972) and Aberson (1998). The skill baseline
for intensity is decay-SHIFOR, which is obtained by tak-
ing the climatology–persistence output from SHIFOR5
(Jarvinen and Neumann 1979; Knaff et al. 2003) and
applying the decay algorithm of DeMaria et al. (2006) for
storms whose CLIPER5 track encounters land.
Figure 3 shows average NHC official track errors for
Atlantic basin tropical storms and hurricanes by decade
since 1970. The 48-h forecast error is a metric tracked
under the Government Performance and Results Act
(GPRA) of 1993. A substantial improvement in this
metric can be seen in Fig. 3; the 48-h error in the 1970s
was near 250 n mi, but has been near 100 n mi in the
current decade. In 2007, the verification for this GPRA
FIG. 2. Atlantic 48-h wind–wave forecast valid at 0000 UTC 14 Sep 2006.
APRIL 2009 R A P P A P O R T E T A L . 401
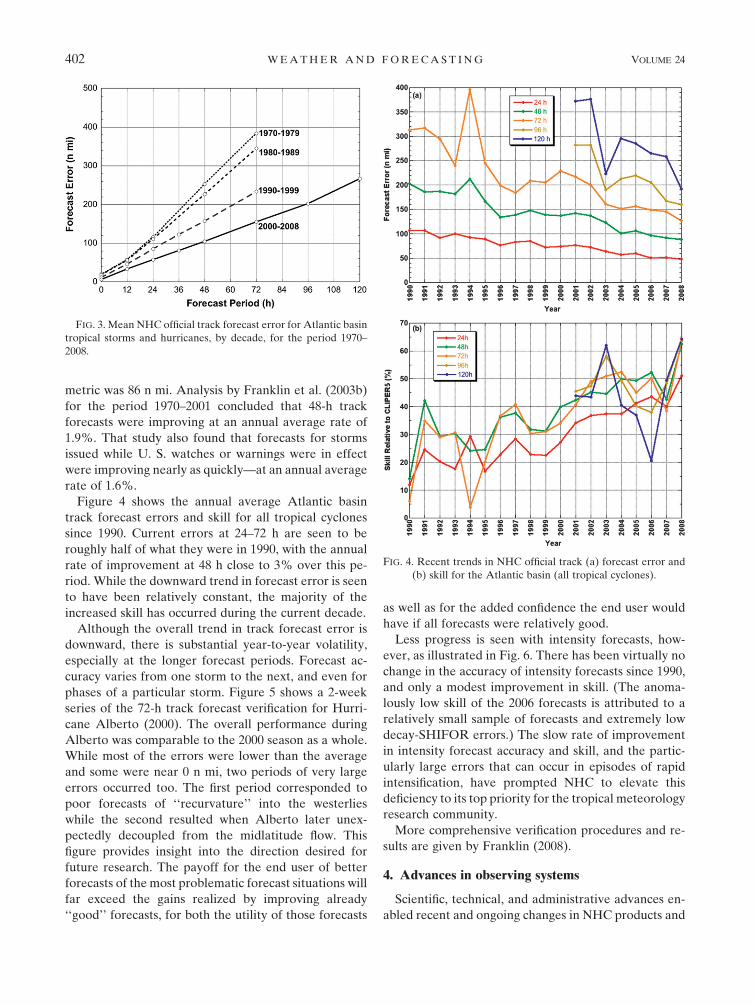
metric was 86 n mi. Analysis by Franklin et al. (2003b)
for the period 1970–2001 concluded that 48-h track
forecasts were improving at an annual average rate of
1.9%. That study also found that forecasts for storms
issued while U. S. watches or warnings were in effect
were improving nearly as quickly—at an annual average
rate of 1.6%.
Figure 4 shows the annual average Atlantic basin
track forecast errors and skill for all tropical cyclones
since 1990. Current errors at 24–72 h are seen to be
roughly half of what they were in 1990, with the annual
rate of improvement at 48 h close to 3% over this pe-
riod. While the downward trend in forecast error is seen
to have been relatively constant, the majority of the
increased skill has occurred during the current decade.
Although the overall trend in track forecast error is
downward, there is substantial year-to-year volatility,
especially at the longer forecast periods. Forecast ac-
curacy varies from one storm to the next, and even for
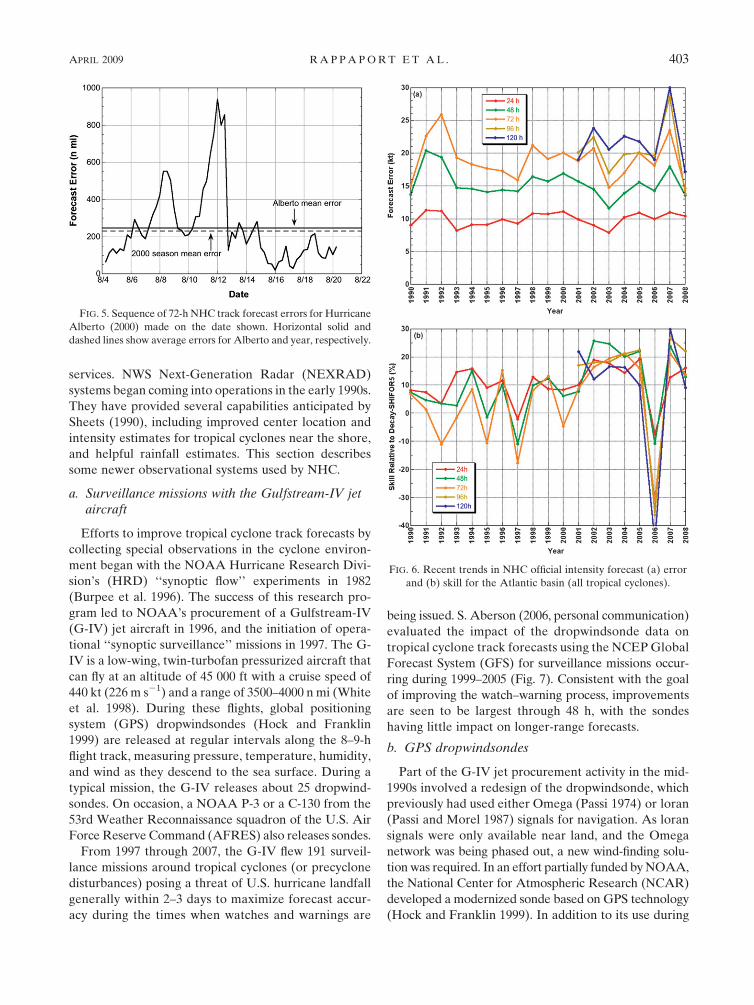
phases of a particular storm. Figure 5 shows a 2-week
series of the 72-h track forecast verification for Hurri-
cane Alberto (2000). The overall performance during
Alberto was comparable to the 2000 season as a whole.
While most of the errors were lower than the average
and some were near 0 n mi, two periods of very large
errors occurred too. The first period corresponded to
poor forecasts of ‘‘recurvature’’ into the westerlies
while the second resulted when Alberto later unex-
pectedly decoupled from the midlatitude flow. This
figure provides insight into the direction desired for
future research. The payoff for the end user of better
forecasts of the most problematic forecast situations will
far exceed the gains realized by improving already
‘‘good’’ forecasts, for both the utility of those forecasts
as well as for the added confidence the end user would
have if all forecasts were relatively good.
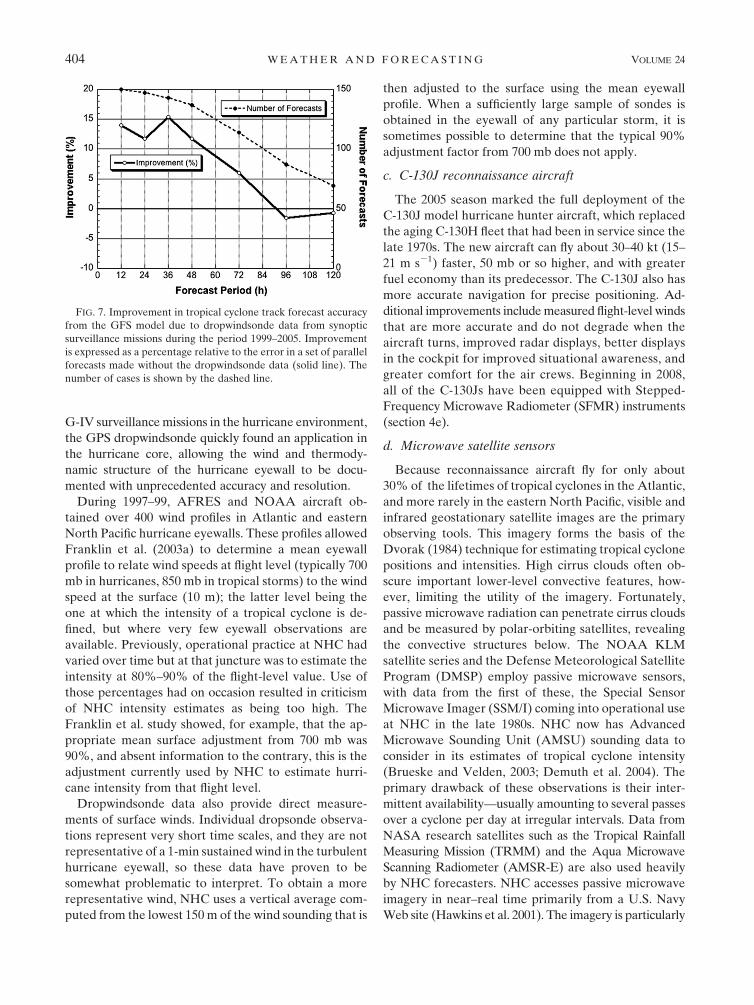
Less progress is seen with intensity forecasts, how-
ever, as illustrated in Fig. 6. There has been virtually no
change in the accuracy of intensity forecasts since 1990,
and only a modest improvement in skill. (The anoma-
lously low skill of the 2006 forecasts is attributed to a
relatively small sample of forecasts and extremely low
decay-SHIFOR errors.) The slow rate of improvement
in intensity forecast accuracy and skill, and the partic-
ularly large errors that can occur in episodes of rapid
intensification, have prompted NHC to elevate this
deficiency to its top priority for the tropical meteorology
research community.
More comprehensive verification procedures and re-
sults are given by Franklin (2008).
4. Advances in observing systems
Scientific, technical, and administrative advances en-
abled recent and ongoing changes in NHC products and
FIG. 3. Mean NHC official track forecast error for Atlantic basin
tropical storms and hurricanes, by decade, for the period 1970–
2008.
FIG. 4. Recent trends in NHC official track (a) forecast error and
(b) skill for the Atlantic basin (all tropical cyclones).
402 W E A T H E R A N D F O R E C A S T I N G VOLUME 24
services. NWS Next-Generation Radar (NEXRAD)
systems began coming into operations in the early 1990s.
They have provided several capabilities anticipated by
Sheets (1990), including improved center location and
intensity estimates for tropical cyclones near the shore,
and helpful rainfall estimates. This section describes
some newer observational systems used by NHC.
a. Surveillance missions with the Gulfstream-IV jetaircraft
Efforts to improve tropical cyclone track forecasts by
collecting special observations in the cyclone environ-
ment began with the NOAA Hurricane Research Divi-
sion’s (HRD) ‘‘synoptic flow’’ experiments in 1982
(Burpee et al. 1996). The success of this research pro-
gram led to NOAA’s procurement of a Gulfstream-IV
(G-IV) jet aircraft in 1996, and the initiation of opera-
tional ‘‘synoptic surveillance’’ missions in 1997. The G-
IV is a low-wing, twin-turbofan pressurized aircraft that
can fly at an altitude of 45 000 ft with a cruise speed of
440 kt (226 m s21) and a range of 3500–4000 n mi (White
et al. 1998). During these flights, global positioning
system (GPS) dropwindsondes (Hock and Franklin
1999) are released at regular intervals along the 8–9-h
flight track, measuring pressure, temperature, humidity,
and wind as they descend to the sea surface. During a
typical mission, the G-IV releases about 25 dropwind-
sondes. On occasion, a NOAA P-3 or a C-130 from the
53rd Weather Reconnaissance squadron of the U.S. Air
Force Reserve Command (AFRES) also releases sondes.
From 1997 through 2007, the G-IV flew 191 surveil-
lance missions around tropical cyclones (or precyclone
disturbances) posing a threat of U.S. hurricane landfall
generally within 2–3 days to maximize forecast accur-
acy during the times when watches and warnings are
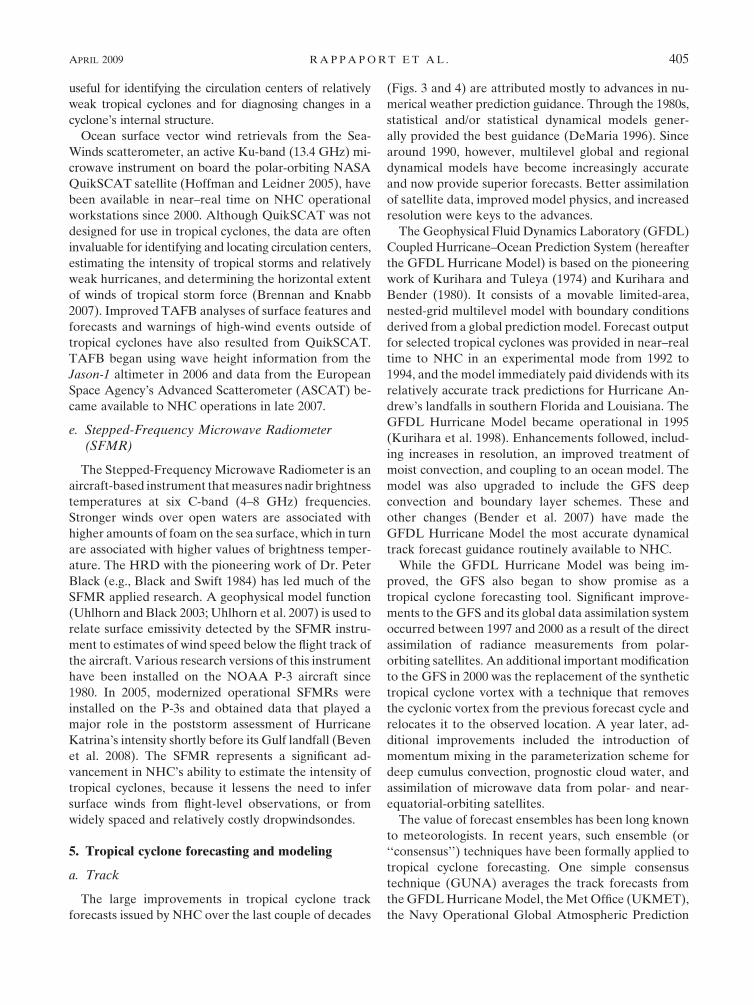
being issued. S. Aberson (2006, personal communication)
evaluated the impact of the dropwindsonde data on
tropical cyclone track forecasts using the NCEP Global
Forecast System (GFS) for surveillance missions occur-
ring during 1999–2005 (Fig. 7). Consistent with the goal
of improving the watch–warning process, improvements
are seen to be largest through 48 h, with the sondes
having little impact on longer-range forecasts.
b. GPS dropwindsondes
Part of the G-IV jet procurement activity in the mid-
1990s involved a redesign of the dropwindsonde, which
previously had used either Omega (Passi 1974) or loran
(Passi and Morel 1987) signals for navigation. As loran
signals were only available near land, and the Omega
network was being phased out, a new wind-finding solu-
tion was required. In an effort partially funded by NOAA,
the National Center for Atmospheric Research (NCAR)
developed a modernized sonde based on GPS technology
(Hock and Franklin 1999). In addition to its use during
FIG. 5. Sequence of 72-h NHC track forecast errors for Hurricane
Alberto (2000) made on the date shown. Horizontal solid and
dashed lines show average errors for Alberto and year, respectively.
FIG. 6. Recent trends in NHC official intensity forecast (a) error
and (b) skill for the Atlantic basin (all tropical cyclones).
APRIL 2009 R A P P A P O R T E T A L . 403
G-IV surveillance missions in the hurricane environment,
the GPS dropwindsonde quickly found an application in
the hurricane core, allowing the wind and thermody-
namic structure of the hurricane eyewall to be docu-
mented with unprecedented accuracy and resolution.
During 1997–99, AFRES and NOAA aircraft ob-
tained over 400 wind profiles in Atlantic and eastern
North Pacific hurricane eyewalls. These profiles allowed
Franklin et al. (2003a) to determine a mean eyewall
profile to relate wind speeds at flight level (typically 700
mb in hurricanes, 850 mb in tropical storms) to the wind
speed at the surface (10 m); the latter level being the
one at which the intensity of a tropical cyclone is de-
fined, but where very few eyewall observations are
available. Previously, operational practice at NHC had
varied over time but at that juncture was to estimate the
intensity at 80%–90% of the flight-level value. Use of
those percentages had on occasion resulted in criticism
of NHC intensity estimates as being too high. The
Franklin et al. study showed, for example, that the ap-
propriate mean surface adjustment from 700 mb was
90%, and absent information to the contrary, this is the
adjustment currently used by NHC to estimate hurri-
cane intensity from that flight level.
Dropwindsonde data also provide direct measure-
ments of surface winds. Individual dropsonde observa-
tions represent very short time scales, and they are not
representative of a 1-min sustained wind in the turbulent
hurricane eyewall, so these data have proven to be
somewhat problematic to interpret. To obtain a more
representative wind, NHC uses a vertical average com-
puted from the lowest 150 m of the wind sounding that is
then adjusted to the surface using the mean eyewall
profile. When a sufficiently large sample of sondes is
obtained in the eyewall of any particular storm, it is
sometimes possible to determine that the typical 90%
adjustment factor from 700 mb does not apply.
c. C-130J reconnaissance aircraft
The 2005 season marked the full deployment of the
C-130J model hurricane hunter aircraft, which replaced
the aging C-130H fleet that had been in service since the
late 1970s. The new aircraft can fly about 30–40 kt (15–
21 m s21) faster, 50 mb or so higher, and with greater
fuel economy than its predecessor. The C-130J also has
more accurate navigation for precise positioning. Ad-
ditional improvements include measured flight-level winds
that are more accurate and do not degrade when the
aircraft turns, improved radar displays, better displays
in the cockpit for improved situational awareness, and
greater comfort for the air crews. Beginning in 2008,
all of the C-130Js have been equipped with Stepped-
Frequency Microwave Radiometer (SFMR) instruments
(section 4e).
d. Microwave satellite sensors
Because reconnaissance aircraft fly for only about
30% of the lifetimes of tropical cyclones in the Atlantic,
and more rarely in the eastern North Pacific, visible and
infrared geostationary satellite images are the primary
observing tools. This imagery forms the basis of the
Dvorak (1984) technique for estimating tropical cyclone
positions and intensities. High cirrus clouds often ob-
scure important lower-level convective features, how-
ever, limiting the utility of the imagery. Fortunately,
passive microwave radiation can penetrate cirrus clouds
and be measured by polar-orbiting satellites, revealing
the convective structures below. The NOAA KLM
satellite series and the Defense Meteorological Satellite
Program (DMSP) employ passive microwave sensors,
with data from the first of these, the Special Sensor
Microwave Imager (SSM/I) coming into operational use
at NHC in the late 1980s. NHC now has Advanced
Microwave Sounding Unit (AMSU) sounding data to
consider in its estimates of tropical cyclone intensity
(Brueske and Velden, 2003; Demuth et al. 2004). The
primary drawback of these observations is their inter-
mittent availability—usually amounting to several passes
over a cyclone per day at irregular intervals. Data from
NASA research satellites such as the Tropical Rainfall
Measuring Mission (TRMM) and the Aqua Microwave
Scanning Radiometer (AMSR-E) are also used heavily
by NHC forecasters. NHC accesses passive microwave
imagery in near–real time primarily from a U.S. Navy
Web site (Hawkins et al. 2001). The imagery is particularly
FIG. 7. Improvement in tropical cyclone track forecast accuracy
from the GFS model due to dropwindsonde data from synoptic
surveillance missions during the period 1999–2005. Improvement
is expressed as a percentage relative to the error in a set of parallel
forecasts made without the dropwindsonde data (solid line). The
number of cases is shown by the dashed line.
404 W E A T H E R A N D F O R E C A S T I N G VOLUME 24
useful for identifying the circulation centers of relatively
weak tropical cyclones and for diagnosing changes in a
cyclone’s internal structure.
Ocean surface vector wind retrievals from the Sea-
Winds scatterometer, an active Ku-band (13.4 GHz) mi-
crowave instrument on board the polar-orbiting NASA
QuikSCAT satellite (Hoffman and Leidner 2005), have
been available in near–real time on NHC operational
workstations since 2000. Although QuikSCAT was not
designed for use in tropical cyclones, the data are often
invaluable for identifying and locating circulation centers,
estimating the intensity of tropical storms and relatively
weak hurricanes, and determining the horizontal extent
of winds of tropical storm force (Brennan and Knabb
2007). Improved TAFB analyses of surface features and
forecasts and warnings of high-wind events outside of
tropical cyclones have also resulted from QuikSCAT.
TAFB began using wave height information from the
Jason-1 altimeter in 2006 and data from the European
Space Agency’s Advanced Scatterometer (ASCAT) be-
came available to NHC operations in late 2007.
e. Stepped-Frequency Microwave Radiometer(SFMR)
The Stepped-Frequency Microwave Radiometer is an
aircraft-based instrument that measures nadir brightness
temperatures at six C-band (4–8 GHz) frequencies.
Stronger winds over open waters are associated with
higher amounts of foam on the sea surface, which in turn
are associated with higher values of brightness temper-
ature. The HRD with the pioneering work of Dr. Peter
Black (e.g., Black and Swift 1984) has led much of the
SFMR applied research. A geophysical model function
(Uhlhorn and Black 2003; Uhlhorn et al. 2007) is used to
relate surface emissivity detected by the SFMR instru-
ment to estimates of wind speed below the flight track of
the aircraft. Various research versions of this instrument
have been installed on the NOAA P-3 aircraft since
1980. In 2005, modernized operational SFMRs were
installed on the P-3s and obtained data that played a
major role in the poststorm assessment of Hurricane
Katrina’s intensity shortly before its Gulf landfall (Beven
et al. 2008). The SFMR represents a significant ad-
vancement in NHC’s ability to estimate the intensity of
tropical cyclones, because it lessens the need to infer
surface winds from flight-level observations, or from
widely spaced and relatively costly dropwindsondes.
5. Tropical cyclone forecasting and modeling
a. Track
The large improvements in tropical cyclone track
forecasts issued by NHC over the last couple of decades
(Figs. 3 and 4) are attributed mostly to advances in nu-
merical weather prediction guidance. Through the 1980s,
statistical and/or statistical dynamical models gener-
ally provided the best guidance (DeMaria 1996). Since
around 1990, however, multilevel global and regional
dynamical models have become increasingly accurate
and now provide superior forecasts. Better assimilation
of satellite data, improved model physics, and increased
resolution were keys to the advances.
The Geophysical Fluid Dynamics Laboratory (GFDL)
Coupled Hurricane–Ocean Prediction System (hereafter
the GFDL Hurricane Model) is based on the pioneering
work of Kurihara and Tuleya (1974) and Kurihara and
Bender (1980). It consists of a movable limited-area,
nested-grid multilevel model with boundary conditions
derived from a global prediction model. Forecast output
for selected tropical cyclones was provided in near–real
time to NHC in an experimental mode from 1992 to
1994, and the model immediately paid dividends with its
relatively accurate track predictions for Hurricane An-
drew’s landfalls in southern Florida and Louisiana. The
GFDL Hurricane Model became operational in 1995
(Kurihara et al. 1998). Enhancements followed, includ-
ing increases in resolution, an improved treatment of
moist convection, and coupling to an ocean model. The
model was also upgraded to include the GFS deep
convection and boundary layer schemes. These and
other changes (Bender et al. 2007) have made the
GFDL Hurricane Model the most accurate dynamical
track forecast guidance routinely available to NHC.
While the GFDL Hurricane Model was being im-
proved, the GFS also began to show promise as a
tropical cyclone forecasting tool. Significant improve-
ments to the GFS and its global data assimilation system
occurred between 1997 and 2000 as a result of the direct
assimilation of radiance measurements from polar-
orbiting satellites. An additional important modification
to the GFS in 2000 was the replacement of the synthetic
tropical cyclone vortex with a technique that removes
the cyclonic vortex from the previous forecast cycle and
relocates it to the observed location. A year later, ad-
ditional improvements included the introduction of
momentum mixing in the parameterization scheme for
deep cumulus convection, prognostic cloud water, and
assimilation of microwave data from polar- and near-
equatorial-orbiting satellites.
The value of forecast ensembles has been long known
to meteorologists. In recent years, such ensemble (or
‘‘consensus’’) techniques have been formally applied to
tropical cyclone forecasting. One simple consensus
technique (GUNA) averages the track forecasts from
the GFDL Hurricane Model, the Met Office (UKMET),
the Navy Operational Global Atmospheric Prediction
APRIL 2009 R A P P A P O R T E T A L . 405
System (NOGAPS), and the GFS. The power of this
consensus is remarkable; for example, during the period
2004–06, the 96-h GUNA track forecast was 18% more
accurate than the best performing of the four models in
GUNA (GFDL). Another approach is the ‘‘super-
ensemble’’ technique developed at the Florida State
University (Williford et al. 2003), in which past model
performance is used to determine how the component
models are combined. Additional work to exploit the
concept of a multimodel consensus, such as the predic-
tion of the consensus error, and the development of
corrections to the consensus track forecast to further re-
duce forecast errors has been done by Goerss (2007a,b).
To date, ensembles based on variations of a single dy-
namical model (such as the GFS ensemble forecast sys-
tem) have been less useful for tropical cyclone applica-
tions, although they may have utility at longer forecast
periods (see section 8).
b. Intensity
Apart from the climatology and persistence model
SHIFOR (e.g., Knaff et al. 2003), virtually no objective
guidance for tropical cyclone intensity was available in
1990. Since that time, two other models have come into
use at NHC. SHIPS was the first and became available
routinely in 1993. Later combined with an overland
decay model and renamed Decay-SHIPS (DeMaria
et al. 2005), this statistical–dynamical model uses envi-
ronmental factors (e.g., sea surface temperatures, ver-
tical wind shear) from the GFS as predictors through a
multiple-regression approach. SHIPS also includes a
rapid intensification index that provides an estimate of
the probability the storm will intensify by at least 30 kt
(15.4 m s21) in 24 h. Although the performance of
Decay-SHIPS continues to improve slowly on a regular
basis with the addition or substitution of new predictors,
the model has shown limited skill over SHIFOR.
One important limitation of statistical prediction is its
inherent difficulty in identifying outliers. Anticipating
the rapid intensification of a tropical cyclone (e.g., Opal
of 1995 in the Gulf of Mexico, or more recently 2004’s
Charley just prior to landfall in southwestern Florida)
has long been one of NHC’s greatest challenges. The
global dynamical models, so successful at forecasting
tropical cyclone track, lack the resolution and descrip-
tion of inner-core processes important to tropical cy-
clone intensity change. The GFDL Hurricane Model,
which does have the necessary resolution to simulate
some rapid changes in intensity, has lagged historically
the performance of Decay-SHIPS, indicating that dy-
namical intensity prediction has not yet surpassed sta-
tistical techniques—a transition that for track prediction
occurred 15–20 yr ago.
As noted earlier, there has been virtually no im-
provement in tropical cyclone intensity forecast accuracy
since 1990, and only a modest improvement in skill (Fig.
6). This has occurred despite significant improvements
in the quality of the intensity guidance available to
forecasters over this period. In contrast to track fore-
casting, where improvements in NHC official forecast
accuracy have been largely driven by improvements in
the guidance models, the objective intensity guidance
has not yet caught up with the skill of the human fore-
caster. Consequently, the quality of the guidance will
need to improve substantially before significant im-
provements in NHC intensity accuracy can be expected.
Section 8 below includes a discussion on how this might
occur.
c. Storm structure
NHC conveys the initial and forecast size of a tropical
cyclone by specifying ‘‘wind radii,’’ the maximum radial
extent of 34-, 50-, and 64-kt surface winds from the center
in each of four quadrants (i.e., northeast, southeast, etc.)
of a storm’s circulation. During the last two decades, a
number of new data sources or techniques have been
applied to the analysis of storm size, including GPS
dropsondes and the SFMR, as well as an improved un-
derstanding of how to adjust flight-level reconnais-
sance winds to the surface. These observations supple-
ment the traditional but sparse data obtained from ships,
ocean buoys, coastal platforms, and land-based stations.
QuikSCAT data are often useful for determining the
34-kt radii. Low-level GOES cloud-tracked winds and
wind speed retrievals from passive microwave radiome-
ters are also utilized, but to a lesser extent. In 2003, NHC
accepted for implementation a JHT project that esti-
mates tropical cyclone wind radii from AMSU data
(Demuth et al. 2004; Bessho et al. 2006).
Despite these advances, NHC has considered the ob-
servations inadequate in most cases to accurately and
fully analyze the two-dimensional surface wind in a
tropical cyclone. Of the instruments now available, only
the QuikSCAT provides a comprehensive view of the
circulation, but this instrument cannot reliably depict the
distribution of hurricane-force winds, and its sensitivity
to rain frequently makes determination of 34-kt wind
radii difficult and the estimate less reliable. Reconnais-
sance aircraft, essential as they are, are available for only
about 30% of Atlantic basin advisory packages (and
much less in the eastern North Pacific), and even in these
cases they sample a very small portion of the storm cir-
culation. Even in the best-sampled storms, significant
data gaps remain and make the operational issuance of a
fully two-dimensional surface wind analysis problematic.
406 W E A T H E R A N D F O R E C A S T I N G VOLUME 24
At present, NHC issues 34- and 50-kt wind radii fore-
casts out to 72 h, while the 64-kt radii are forecast out to
36 h. It also analyzes the radius of maximum wind
(RMW) to help initialize atmospheric and storm surge
models, but it does not forecast the RMW. Little objec-
tive guidance is available to assist the forecaster, al-
though global models such as the GFS appear to be able
to predict the gross structure of the tropical cyclone (i.e.,
discriminate between large and small circulations) and
may have some skill in forecasting the extent of tropical
storm force winds out to several days. Recently, two
climatology and persistence models for the prediction of
wind radii were developed by McAdie (2004) and Knaff
et al. (2007). These techniques now provide some guid-
ance for operational forecasting and eventually could
serve as a baseline to measure the skill of official and
model wind radii forecasts.
NHC began to include wind radii estimates in its
poststorm best tracks in 2004. Insufficient surface ob-
servations, however, make these estimates highly un-
certain and usually not possible to verify; a typical 64-kt
wind radius of 30 n mi could easily be in error by 50% or
more. In contrast, tropical cyclone intensity estimates
are believed to be accurate to within about 10%. Any
progress in forecasting storm structure will be difficult to
assess with current observational systems.
d. Storm surge
Storm surge, the anomalous rise in coastal water level
accompanying a cyclone, is the deadliest tropical cyclone
hazard in the United States. Following frequent surge-
related disasters, the NOAA/NWS began the Storm
Surge Research Project four decades ago to understand,
explain, and reduce the storm surge threat. In 1980 NHC
established its Storm Surge Unit to work with the NWS
Meteorological Development Laboratory (MDL, for-
merly the Techniques Development Laboratory) to de-
velop a numerical modeling approach known as the Sea,
Lake, and Overland Surges from Hurricanes (SLOSH;
Jelesnianski et al. 1992). Over the past quarter-century
this work has been supported by and closely coordinated
with the Federal Emergency Management Agency and
the U.S. Army Corps of Engineers.
Local and state emergency managers use SLOSH
model output to decide which populations to evacuate,
when, and by what routes. In its primary application,
several thousand runs of the model simulate the surge
associated with tropical cyclones of varying intensity,
size, forward speed, direction of motion, and landfall
point within a model ‘‘basin.’’ These thousands of sce-
narios are combined into composite maps known as
maximum envelopes of water (MEOWs) and maximum
of maxima (MOMs) to define the surge threat. MEOWs
and MOMs are primary inputs to the hurricane evacua-
tion studies and plans of coastal communities.
About 40 SLOSH basins span the U.S. Gulf and east
coasts, and cover Puerto Rico and the U.S. Virgin Is-
lands. The NWS revises SLOSH basins and simulations
when significant changes occur to the topography and
bathymetry (e.g., to levees and channels) of an area. For
example, annual revisions to levees in southern Louisi-
ana require a recalculation almost every year for that
basin. Carefully prepared light distance and ranging (li-
dar) data should provide cost-effective updated topog-
raphy and nearshore bathymetry for basin revisions.
Basin revisions are time consuming; under current pro-
cedures, a revision requires the modeling of about 15 000
hypothetical storms. Seventeen SLOSH basins have
been restudied since 2000, but new capabilities at NHC
are increasing the restudy rate.
While MEOWs are produced well in advance of a
storm event, SLOSH can also be used in real time. NHC
provides real-time storm surge guidance based on the
single, deterministic NHC forecast for a tropical cyclone.
These operational runs now begin about 24 h prior to the
storm’s forecasted landfall, and continue until the threat
of rising water ceases. Given accurate meteorological
forcing, SLOSH calculations are generally within about
20% of observed inundation (Jarvinen and Lawrence
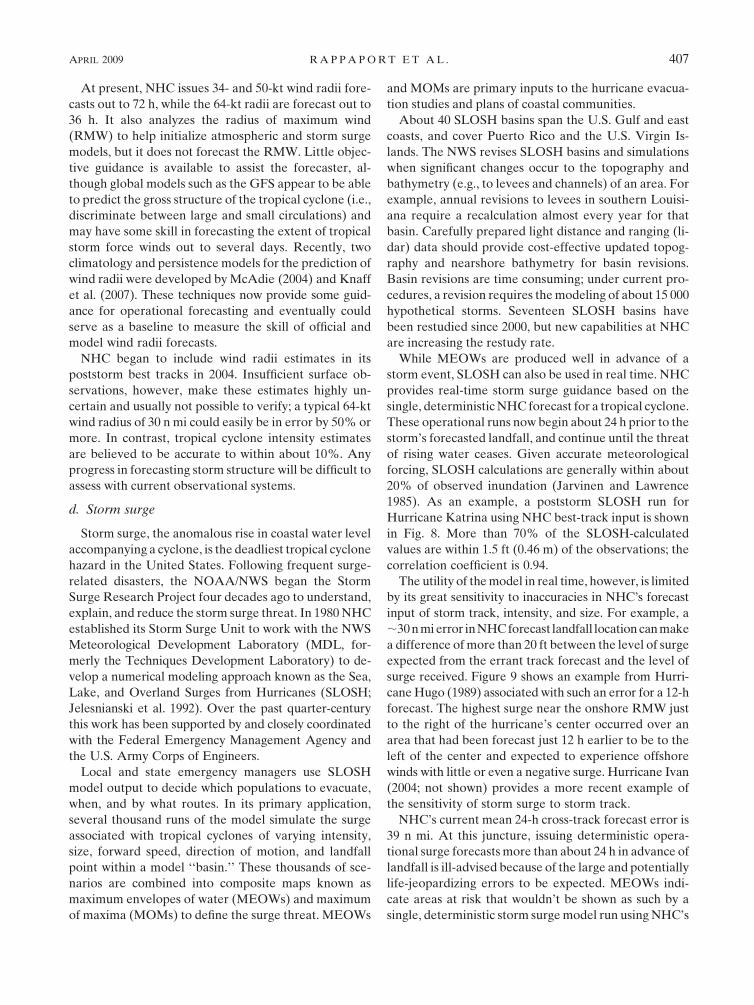
1985). As an example, a poststorm SLOSH run for
Hurricane Katrina using NHC best-track input is shown
in Fig. 8. More than 70% of the SLOSH-calculated
values are within 1.5 ft (0.46 m) of the observations; the
correlation coefficient is 0.94.
The utility of the model in real time, however, is limited
by its great sensitivity to inaccuracies in NHC’s forecast
input of storm track, intensity, and size. For example, a
;30 n mi error in NHC forecast landfall location can make
a difference of more than 20 ft between the level of surge
expected from the errant track forecast and the level of
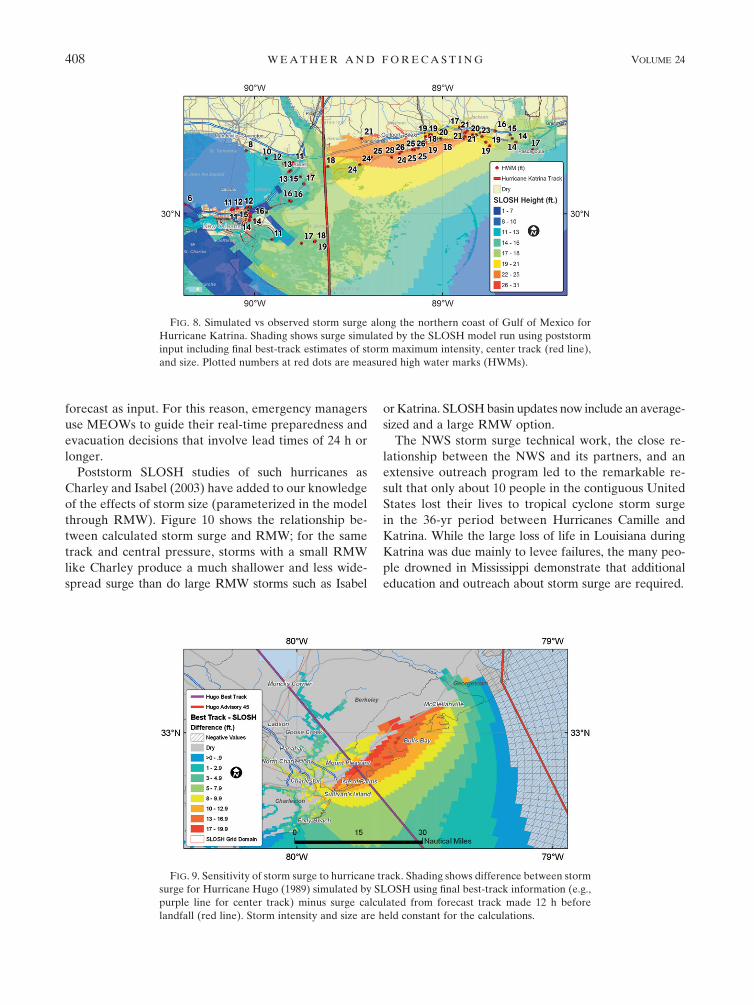
surge received. Figure 9 shows an example from Hurri-
cane Hugo (1989) associated with such an error for a 12-h
forecast. The highest surge near the onshore RMW just
to the right of the hurricane’s center occurred over an
area that had been forecast just 12 h earlier to be to the
left of the center and expected to experience offshore
winds with little or even a negative surge. Hurricane Ivan
(2004; not shown) provides a more recent example of
the sensitivity of storm surge to storm track.
NHC’s current mean 24-h cross-track forecast error is
39 n mi. At this juncture, issuing deterministic opera-
tional surge forecasts more than about 24 h in advance of
landfall is ill-advised because of the large and potentially
life-jeopardizing errors to be expected. MEOWs indi-
cate areas at risk that wouldn’t be shown as such by a
single, deterministic storm surge model run using NHC’s
APRIL 2009 R A P P A P O R T E T A L . 407
forecast as input. For this reason, emergency managers
use MEOWs to guide their real-time preparedness and
evacuation decisions that involve lead times of 24 h or
longer.
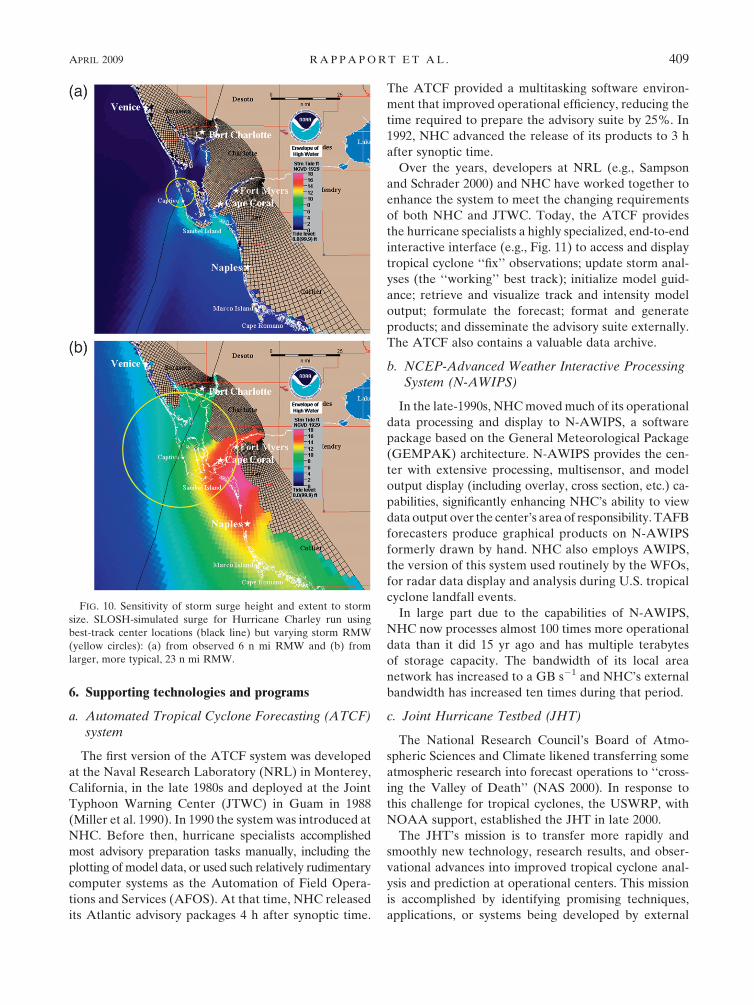
Poststorm SLOSH studies of such hurricanes as
Charley and Isabel (2003) have added to our knowledge
of the effects of storm size (parameterized in the model
through RMW). Figure 10 shows the relationship be-
tween calculated storm surge and RMW; for the same
track and central pressure, storms with a small RMW
like Charley produce a much shallower and less wide-
spread surge than do large RMW storms such as Isabel
or Katrina. SLOSH basin updates now include an average-
sized and a large RMW option.
The NWS storm surge technical work, the close re-
lationship between the NWS and its partners, and an
extensive outreach program led to the remarkable re-
sult that only about 10 people in the contiguous United
States lost their lives to tropical cyclone storm surge
in the 36-yr period between Hurricanes Camille and
Katrina. While the large loss of life in Louisiana during
Katrina was due mainly to levee failures, the many peo-
ple drowned in Mississippi demonstrate that additional
education and outreach about storm surge are required.
FIG. 8. Simulated vs observed storm surge along the northern coast of Gulf of Mexico for
Hurricane Katrina. Shading shows surge simulated by the SLOSH model run using poststorm
input including final best-track estimates of storm maximum intensity, center track (red line),
and size. Plotted numbers at red dots are measured high water marks (HWMs).
FIG. 9. Sensitivity of storm surge to hurricane track. Shading shows difference between storm
surge for Hurricane Hugo (1989) simulated by SLOSH using final best-track information (e.g.,
purple line for center track) minus surge calculated from forecast track made 12 h before
landfall (red line). Storm intensity and size are held constant for the calculations.
408 W E A T H E R A N D F O R E C A S T I N G VOLUME 24
6. Supporting technologies and programs
a. Automated Tropical Cyclone Forecasting (ATCF)system
The first version of the ATCF system was developed
at the Naval Research Laboratory (NRL) in Monterey,
California, in the late 1980s and deployed at the Joint
Typhoon Warning Center (JTWC) in Guam in 1988
(Miller et al. 1990). In 1990 the system was introduced at
NHC. Before then, hurricane specialists accomplished
most advisory preparation tasks manually, including the
plotting of model data, or used such relatively rudimentary
computer systems as the Automation of Field Opera-
tions and Services (AFOS). At that time, NHC released
its Atlantic advisory packages 4 h after synoptic time.
The ATCF provided a multitasking software environ-
ment that improved operational efficiency, reducing the
time required to prepare the advisory suite by 25%. In
1992, NHC advanced the release of its products to 3 h
after synoptic time.
Over the years, developers at NRL (e.g., Sampson
and Schrader 2000) and NHC have worked together to
enhance the system to meet the changing requirements
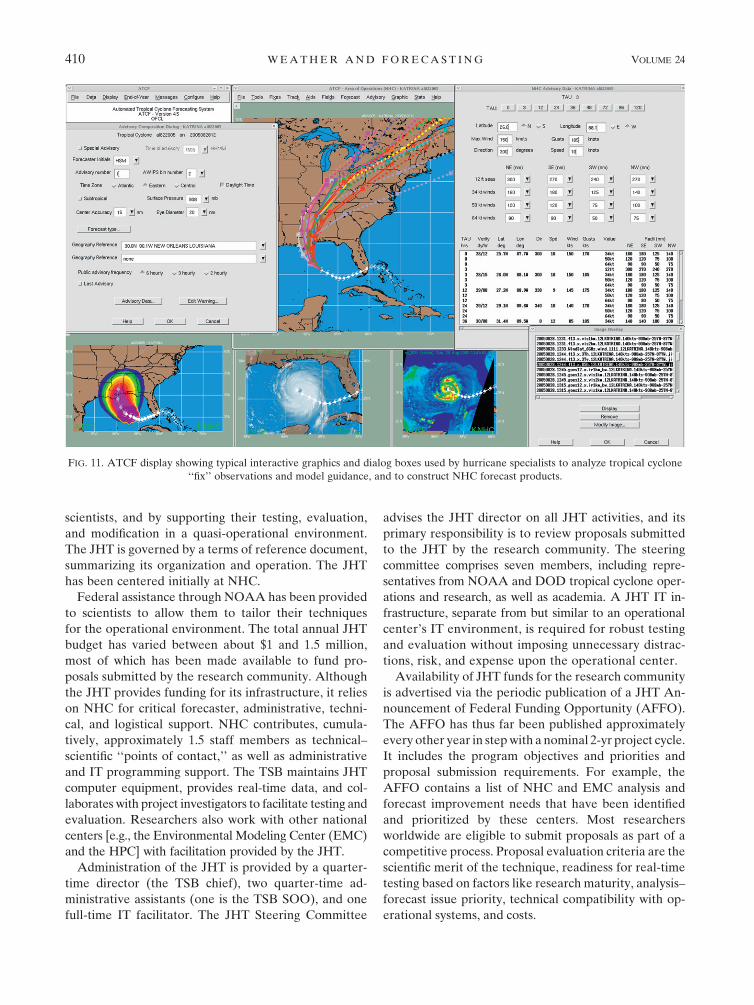
of both NHC and JTWC. Today, the ATCF provides
the hurricane specialists a highly specialized, end-to-end
interactive interface (e.g., Fig. 11) to access and display
tropical cyclone ‘‘fix’’ observations; update storm anal-
yses (the ‘‘working’’ best track); initialize model guid-
ance; retrieve and visualize track and intensity model
output; formulate the forecast; format and generate
products; and disseminate the advisory suite externally.
The ATCF also contains a valuable data archive.
b. NCEP-Advanced Weather Interactive ProcessingSystem (N-AWIPS)
In the late-1990s, NHC moved much of its operational
data processing and display to N-AWIPS, a software
package based on the General Meteorological Package
(GEMPAK) architecture. N-AWIPS provides the cen-
ter with extensive processing, multisensor, and model
output display (including overlay, cross section, etc.) ca-
pabilities, significantly enhancing NHC’s ability to view
data output over the center’s area of responsibility. TAFB
forecasters produce graphical products on N-AWIPS
formerly drawn by hand. NHC also employs AWIPS,
the version of this system used routinely by the WFOs,
for radar data display and analysis during U.S. tropical
cyclone landfall events.
In large part due to the capabilities of N-AWIPS,
NHC now processes almost 100 times more operational
data than it did 15 yr ago and has multiple terabytes
of storage capacity. The bandwidth of its local area
network has increased to a GB s21 and NHC’s external
bandwidth has increased ten times during that period.
c. Joint Hurricane Testbed (JHT)
The National Research Council’s Board of Atmo-
spheric Sciences and Climate likened transferring some
atmospheric research into forecast operations to ‘‘cross-
ing the Valley of Death’’ (NAS 2000). In response to
this challenge for tropical cyclones, the USWRP, with
NOAA support, established the JHT in late 2000.
The JHT’s mission is to transfer more rapidly and
smoothly new technology, research results, and obser-
vational advances into improved tropical cyclone anal-
ysis and prediction at operational centers. This mission
is accomplished by identifying promising techniques,
applications, or systems being developed by external
FIG. 10. Sensitivity of storm surge height and extent to storm
size. SLOSH-simulated surge for Hurricane Charley run using
best-track center locations (black line) but varying storm RMW
(yellow circles): (a) from observed 6 n mi RMW and (b) from
larger, more typical, 23 n mi RMW.
APRIL 2009 R A P P A P O R T E T A L . 409
scientists, and by supporting their testing, evaluation,
and modification in a quasi-operational environment.
The JHT is governed by a terms of reference document,
summarizing its organization and operation. The JHT
has been centered initially at NHC.
Federal assistance through NOAA has been provided
to scientists to allow them to tailor their techniques
for the operational environment. The total annual JHT
budget has varied between about $1 and 1.5 million,
most of which has been made available to fund pro-
posals submitted by the research community. Although
the JHT provides funding for its infrastructure, it relies
on NHC for critical forecaster, administrative, techni-
cal, and logistical support. NHC contributes, cumula-
tively, approximately 1.5 staff members as technical–
scientific ‘‘points of contact,’’ as well as administrative
and IT programming support. The TSB maintains JHT
computer equipment, provides real-time data, and col-
laborates with project investigators to facilitate testing and
evaluation. Researchers also work with other national
centers [e.g., the Environmental Modeling Center (EMC)
and the HPC] with facilitation provided by the JHT.
Administration of the JHT is provided by a quarter-
time director (the TSB chief), two quarter-time ad-
ministrative assistants (one is the TSB SOO), and one
full-time IT facilitator. The JHT Steering Committee
advises the JHT director on all JHT activities, and its
primary responsibility is to review proposals submitted
to the JHT by the research community. The steering
committee comprises seven members, including repre-
sentatives from NOAA and DOD tropical cyclone oper-
ations and research, as well as academia. A JHT IT in-
frastructure, separate from but similar to an operational
center’s IT environment, is required for robust testing
and evaluation without imposing unnecessary distrac-
tions, risk, and expense upon the operational center.
Availability of JHT funds for the research community
is advertised via the periodic publication of a JHT An-
nouncement of Federal Funding Opportunity (AFFO).
The AFFO has thus far been published approximately
every other year in step with a nominal 2-yr project cycle.
It includes the program objectives and priorities and
proposal submission requirements. For example, the
AFFO contains a list of NHC and EMC analysis and
forecast improvement needs that have been identified
and prioritized by these centers. Most researchers
worldwide are eligible to submit proposals as part of a
competitive process. Proposal evaluation criteria are the
scientific merit of the technique, readiness for real-time
testing based on factors like research maturity, analysis–
forecast issue priority, technical compatibility with op-
erational systems, and costs.
FIG. 11. ATCF display showing typical interactive graphics and dialog boxes used by hurricane specialists to analyze tropical cyclone
‘‘fix’’ observations and model guidance, and to construct NHC forecast products.
410 W E A T H E R A N D F O R E C A S T I N G VOLUME 24
After one or two years of testing, the conclusion of a
JHT project is followed by the submission of a final JHT
report to NHC’s director [and/or other operational
center(s) if applicable]. This report comes from the JHT
staff and is based on its evaluation and input from the
project scientist(s) and NHC’s points of contact. NHC’s
director makes the decision on whether or not to begin
the process of operational implementation of the tech-
niques resulting from the project. (Decisions on model
changes are made at NCEP, with NHC input.) The
NHC director’s decisions are based on an analysis of (a)
forecast or analysis benefit, (b) efficiency, (c) IT com-
patibility, and (d) sustainability.
Since the JHT’s inception, NHC and other operational
centers (e.g., EMC, HPC, and JTWC) have interacted
with scientists on 40 projects in three 2-yr rounds and, of
these, 31 have been implemented into operations, 4 were
not accepted, and 5 are undergoing additional testing.
Ten fourth-round projects are under way.
Some improvements in tropical cyclone monitoring
and prediction in recent years can be credited to the
successful implementation of JHT projects. For example,
Elsberry (2005) reported that the USWRP goal for re-
ducing tropical cyclone track forecast error by 20% over
a 5-yr period was in large part accomplished through
model advances sponsored by JHT funding. M. DeMaria
(2006, personal communication) attributes about a 5%–
7% improvement in the SHIPS intensity forecast tech-
nique to JHT work. Other contributions include accel-
erating development of the Hurricane Weather Research
and Forecast (HWRF) model (section 8), NHC’s new
wind speed probability products (section 7b), and ex-
tension of the coupling of the GFDL model to the east-
ern and central North Pacific through development of a
one-dimensional version of the Princeton Ocean Model.
Additional JHT information is available online
(www.nhc.noaa.gov/jht).
7. New products and services
In addition to expanding its area of responsibility,
extending its temporal forecast horizon, and providing
information in new ways, NHC has introduced many
new operational products since 1990. Most of these are
graphical, while some are gridded, some are textual, and
some are in new formats including Geographic Infor-
mation Systems (GIS) compatible. Among the newest
operational products is an experimental graphical tropical
weather outlook that serves as a companion to the text
outlook, and experimental probabilistic storm surge fore-
casts developed by the NWS MDL, available graphically
on NWS Web pages. The latter product uses SLOSH to
compute the surge from the official forecast track and
reasonable alternate possibilities. New TAFB products
include textual offshore waters forecasts and marine
weather discussions. TAFB has also added wind–wave
charts, wave period–swell direction charts, sea-state anal-
ysis maps, surface forecast charts, high wind and asso-
ciated seas charts, and marine ‘‘danger area’’ graphics.
In 2006, TAFB began generating experimental grids of
significant wave height out to 48 h.
Details on a few of the key new activities at NHC are
presented below.
a. Internet
With the capability of creating graphics in a more
timely and effective manner, NHC designed and launched
a Web site in the early 1990s as a way to quickly reach
more users. NHC’s Web content and prominence on the
Internet have grown enormously since the Web site (http://
www.nhc.noaa.gov, and now also http://www.hurricanes.
gov) was launched as a limited collection of pages created
and maintained by the TSB. In 1995, NHC enhanced
the Web site and hosted the service on a developmental
computer system sharing communications lines with NHC
operations. Hurricane Felix (8–25 August 1995) produced
250 000 hits per day and resulted in occasional Web site
crashes.
Since then, the Web site has steadily gained in pop-
ularity. A peak traffic count of 1.1 billion hits per day
occurred during Hurricane Wilma in October 2005, and
the Web site served 7.4 billion hits that year. The NWS
has upgraded the NHC Web site processing, capacity,
and redundancy to help meet the demand. Since 2004,
an outside vendor has hosted NHC’s Web site during
high-traffic periods. Enhancements include an NHC
backup Web server located at HPC.
NHC’s Web site has a history of integrating new
technologies. Web graphics were introduced in the
middle 1990s to show basic tropical cyclone character-
istics, strike probabilities, and tropical cyclone watches
and warnings. Additional graphics followed and now
account for about 80% of the traffic on the site. A trop-
ical cyclone advisory mailing list, introduced in 2001,
sends NHC advisories to over 60 000 subscribers, and
upward of 1 million messages are sent daily during
multiple tropical cyclone events. In 2002 the Web site
introduced the use of Really Simple Syndication (RSS)
feeds for newsreaders and mobile products for use on
handheld personal digital assistants (PDAs) and the
system was expanded in 2004 to include graphics.
Today, the Web site provides most of NHC’s opera-
tional text and graphical products from the HSU and
TAFB, product tutorials, an extensive historical archive,
climatology information, hurricane preparedness guides,
and links to federal and state emergency management
APRIL 2009 R A P P A P O R T E T A L . 411
agencies. It also has pages describing NHC’s forecast
process and forecast verification, and other frequently
requested hurricane information.
b. Tropical cyclone wind speed probabilities
NHC has long issued products intended to convey
uncertainties in the official forecast. A ‘‘strike’’ proba-
bility product for Atlantic basin cyclones was introduced
in 1983 (Sheets 1985). NHC also provides a graphic
showing watches and warnings, the track forecast, and
an associated ‘‘cone of uncertainty’’ based on recent error
statistics. Another product gives probabilities for the cy-
clone’s future maximum wind speed. In addition, the
tropical cyclone discussion text product describes the
reasoning and uncertainties associated with each forecast.
Recognizing the need to more clearly convey uncer-
tainties in its forecasts, NHC in 2006 began issuing
tropical cyclone surface wind speed probability products.
Figure 12 shows an example of one of these new pro-
ducts. The wind speed probabilities represent a major
advance over previous efforts, for the first time explic-
itly and objectively considering the combined uncer-
tainties in the forecasts of storm track, intensity, and
size. They indicate in text and graphical form site-
specific chances of experiencing sustained wind speeds
equal to or exceeding familiar thresholds (e.g., tropical
storm force and hurricane force), as well as guidance on
when those wind conditions are most likely to start. The
wind speed probabilities are intended to provide users
with information that enhances their ability to make
preparedness decisions specific to their own situations.
Positive feedback from the media and the emergency
management community indicates these products are
used along with other NHC products for decision mak-
ing and risk communication. The probabilities are also
available to users via the NWS National Digital Forecast
Database (NDFD), and WFOs use a form of the prob-
abilities in some of their products.
c. Best-track database
After the conclusion of each Atlantic and eastern
North Pacific tropical cyclone, the HSU prepares a final
best track, a subjectively smoothed representation of the
tropical cyclone’s location, intensity (as maximum sus-
tained surface wind speed), minimum sea level pressure,
and size over its lifetime at 6-hourly intervals. These
estimates are based on a comprehensive analysis of all
available observational data, generally gathered within
several weeks after the system’s conclusion, and they
differ frequently from operational estimates. Once
completed, the best tracks are added to HURDAT, the
historical tropical cyclone database. The data are also
archived in the ATCF. Currently, the HURDAT con-
tains best tracks from 1851 to the present for the Atlantic
basin (Jarvinen et al. 1984; Landsea et al. 2004a) and
from 1949 to the present for the eastern North Pacific
basin (Davis et al. 1984). The best-track data are used at
NHC for verification of forecasts and other internal
applications. They are also used extensively by the re-
search, academic, and insurance communities, as well as
by the media and the public.
Best-track files are not static, but are subject to re-
vision as new data or understanding comes to light.
Landsea (1993) and Neumann (1994), for example, docu-
mented many systematic and random errors in HURDAT.
In addition, through inspection of historical meteoro-
logical records and accounts, previously unknown trop-
ical cyclones can be identified as potential additions
to the database (Fernandez-Partagas and Diaz 1996).
Landsea et al. (2008) describe an ongoing HURDAT
reanalysis project dealing with these issues.
NHC’s Best Track Change Committee receives pro-
posed amendments to HURDAT and evaluates them
based on observational data and sound, contemporary
science. The committee has the authority to make offi-
cial changes to the best-track files. After approval by the
committee, the revised tropical cyclone database, a met-
adata file detailing individual changes for each tropical
cyclone, a ‘‘center fix’’ file of raw tropical cyclone ob-
servations, a detailed listing of U.S. landfalling tropical
storms and hurricanes, and comments of NHC’s Best
Track Change Committee are prepared. They are avail-
able online (http://www.aoml.noaa.gov/hrd/data_sub/re_
anal.html).
Recently, an extension of the Atlantic HURDAT from
1885 back through 1851 was completed, and a reassessment
was conducted for tropical cyclones already in HURDAT
for the period of 1886–1920 (Fernandez-Partagas and Diaz
1996; Landsea et al. 2008). These alterations added 274
new tropical cyclones and modified another 231 of the
517 total storms identified between 1851 and 1920.
Also of interest is a reanalysis of a more recent storm,
Hurricane Andrew (1992), based in part on new un-
derstanding of the wind structure in the hurricane eye-
wall (Franklin et al. 2003a). The reanalysis indicated
that Andrew’s maximum 1-min surface winds for much
of its lifetime were stronger than analyzed originally by
NHC. The HURDAT database was revised to show
Andrew at Saffir–Simpson hurricane scale category 5
status at its landfall in both the northern Bahamas and
in southeastern Florida (Landsea et al. 2004b).
d. Partnerships, outreach, and education
Former NHC Director Max Mayfield stated ‘‘the
battle against the hurricane is won outside the hurricane
season,’’ and the tragic loss of life from Katrina reminds
412 W E A T H E R A N D F O R E C A S T I N G VOLUME 24
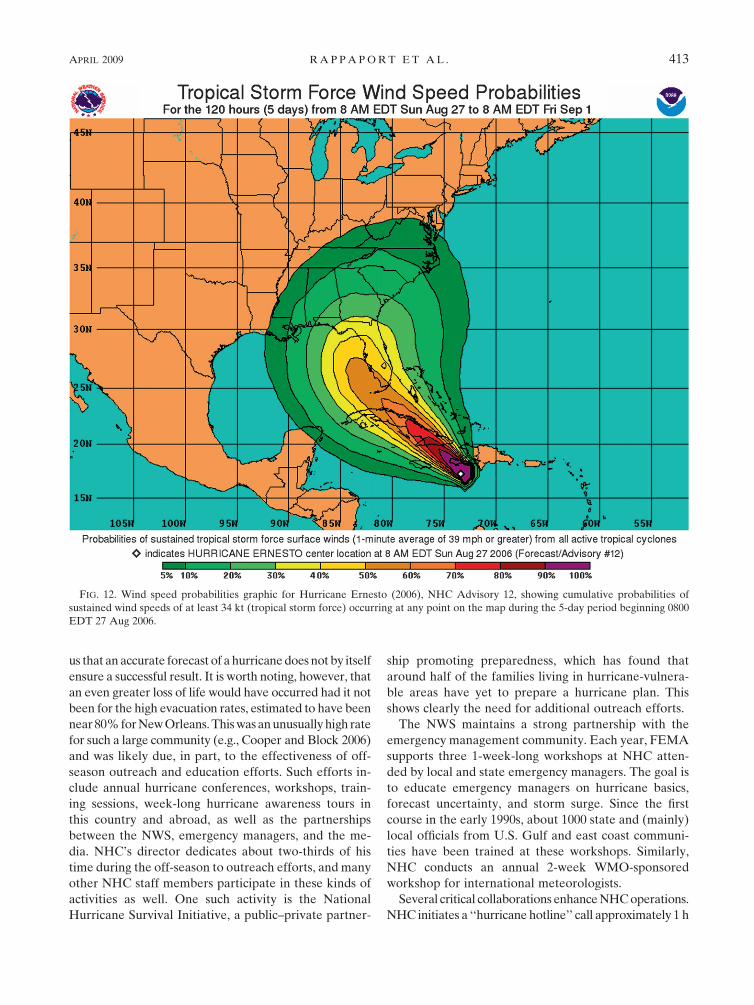
us that an accurate forecast of a hurricane does not by itself
ensure a successful result. It is worth noting, however, that
an even greater loss of life would have occurred had it not
been for the high evacuation rates, estimated to have been
near 80% for New Orleans. This was an unusually high rate
for such a large community (e.g., Cooper and Block 2006)
and was likely due, in part, to the effectiveness of off-
season outreach and education efforts. Such efforts in-
clude annual hurricane conferences, workshops, train-
ing sessions, week-long hurricane awareness tours in
this country and abroad, as well as the partnerships
between the NWS, emergency managers, and the me-
dia. NHC’s director dedicates about two-thirds of his
time during the off-season to outreach efforts, and many
other NHC staff members participate in these kinds of
activities as well. One such activity is the National
Hurricane Survival Initiative, a public–private partner-
ship promoting preparedness, which has found that
around half of the families living in hurricane-vulnera-
ble areas have yet to prepare a hurricane plan. This
shows clearly the need for additional outreach efforts.
The NWS maintains a strong partnership with the
emergency management community. Each year, FEMA
supports three 1-week-long workshops at NHC atten-
ded by local and state emergency managers. The goal is
to educate emergency managers on hurricane basics,
forecast uncertainty, and storm surge. Since the first
course in the early 1990s, about 1000 state and (mainly)
local officials from U.S. Gulf and east coast communi-
ties have been trained at these workshops. Similarly,
NHC conducts an annual 2-week WMO-sponsored
workshop for international meteorologists.
Several critical collaborations enhance NHC operations.
NHC initiates a ‘‘hurricane hotline’’ call approximately 1 h
FIG. 12. Wind speed probabilities graphic for Hurricane Ernesto (2006), NHC Advisory 12, showing cumulative probabilities of
sustained wind speeds of at least 34 kt (tropical storm force) occurring at any point on the map during the 5-day period beginning 0800
EDT 27 Aug 2006.
APRIL 2009 R A P P A P O R T E T A L . 413
prior to the advisory release deadline or whenever a
special advisory has been prepared to discuss prelimi-
nary forecast information with its government partners.
Participants include WFOs and NWS River Forecast
Centers; rainfall and tornado experts from the HPC and
Storm Prediction Center, respectively; OPC; NWS na-
tional and regional headquarters; and meteorologists at
some U.S. Naval sites [e.g., at the navy’s Norfolk facility
(Naval Maritime Forecast Activity, formerly Atlantic
Meteorology and Oceanography Command)] and at
NASA. It is important to note that WFO meteorologists
contribute their local expertise when they pass the in-
formation on to emergency managers and other local
officials in their areas of responsibility.
The NWS and FEMA together created the Hurricane
Liaison Team (HLT) in 1995. The HLT partnership
ensures access by emergency managers to forecast in-
formation they need to make decisions. Once activated,
one or more emergency managers are sent to NHC to
support hurricane response operations through the
rapid exchange of critical information between NHC
and emergency managers at all levels of government.
The HLT establishes and facilitates daily video tele-
conferences and more frequent audio teleconferences
during landfall threats; responds to emergency manage-
ment questions and concerns; directs weather-related
questions to NHC, HLT NWS meteorologists and hy-
drologists, or WFOs; and relays emergency management
issues to the NWS. The NWS provides meteorological
briefings for FEMA and other federal agencies, and state
emergency operation centers. Department of Homeland
Security staff and the White House sometimes participate
in these briefings.
During a U.S. hurricane landfall threat, NHC can ac-
tivate a media pool, providing access to television sta-
tions and networks across the nation. Briefings seek to
highlight storm information, indicate potential impacts,
and provide perspective. NHC’s Web graphics are also
an important part of this communications process.
In 2004–05, NHC’s director and deputy director each
gave more than 1000 live television briefings (mostly in
the form of 4-min time slots) during landfall threats. On
occasion, some NHC senior hurricane specialists give
these briefings. NHC staff also provides many thousands
more briefings via telephone. These briefings help NHC
and its media partners deliver a consistent message,
which behavioral scientists say is key to ensuring that
people respond quickly and appropriately to approach-
ing threats (Mileti 1999). Sheets (1990) discussed two
cases where information conflicting with NHC’s official
forecast led to problems with community preparations.
Freshwater floods from rainfall present the primary
tropical cyclone threat to life in inland areas (Rappaport
2000). The NCEP director in 2005 assigned lead re-
sponsibility for U.S. tropical cyclone precipitation fore-
casts appearing in NHC public advisories to the HPC.
With a few special exceptions, NHC transfers respon-
sibility to HPC for the entire public advisory when a
cyclone weakens to a tropical depression over the main-
land United States or Mexico and still poses a threat for
heavy rain and flash floods affecting the United States.
The HPC also serves as the backup office for the HSU.
OPC backs up TAFB. NHC has backup responsibilities
for the Central Pacific Hurricane Center, OPC, WFO
Honolulu, and the Aviation Weather Center over the
areas indicated in Fig. 1.
All of these collaborations help ensure the best possi-
ble outcome during hurricanes and other weather events.
8. Forecast for the forecast
Atlantic tropical cyclones have killed an estimated
one-third to one-half million people since the discovery
of the New World, including more than 25 000 in the
United States (cf. Rappaport and Fernandez-Partagas
1995; Blake et al. 2007). Today, more than 50% of the
U.S. population lives along the coast (Crossett et al.
2004), and annual average U.S. property losses incurred
from hurricanes have jumped to more than $20 billion
[see data since 2000 in Table 3a of Blake et al. (2007)].
By 2010, the population density near the U.S. shore is
projected to rise to around 400 people per square mile
(NAS 2004), putting increasing numbers of people and
their property at risk from tropical cyclones. It is clear
that our nation’s increasing vulnerability to tropical cy-
clone hazards must be met with significant further ad-
vances in the nation’s hurricane program.
The roughly 80% evacuation rate estimated for Hur-
ricane Katrina provides a measure of the progress of the
nation’s hurricane program enterprise. The 20% who
stayed behind, on the other hand, can give us insight into
the challenges faced by NHC and its partners, especially
to the extent that their decisions to stay reflect that they
1) did not receive the forecast information, 2) received
forecast products of inadequate accuracy or breadth,
3) did not understand the forecast information or its
implications, and/or 4) did not believe the information.
Addressing these issues requires improvements in all
areas of the hurricane program. For forecasting, better
tropical cyclone genesis, track, wind intensity, storm
surge, and rainfall predictions are necessary, along with
better ways to depict the threats. Some of NHC’s highest
priority specific near-term needs include the following:
guidance for tropical cyclone intensity change, with the
highest priority for the onset, duration, and magni-
tude of rapid intensification and weakening events;
414 W E A T H E R A N D F O R E C A S T I N G VOLUME 24
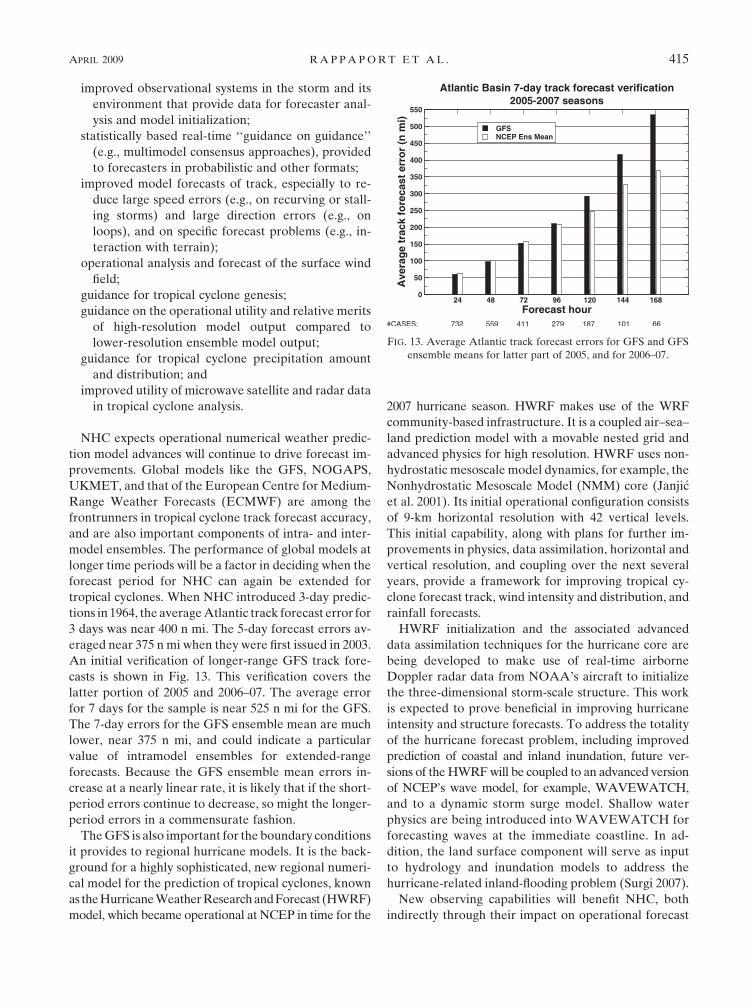
improved observational systems in the storm and its
environment that provide data for forecaster anal-
ysis and model initialization;
statistically based real-time ‘‘guidance on guidance’’
(e.g., multimodel consensus approaches), provided
to forecasters in probabilistic and other formats;
improved model forecasts of track, especially to re-
duce large speed errors (e.g., on recurving or stall-
ing storms) and large direction errors (e.g., on
loops), and on specific forecast problems (e.g., in-
teraction with terrain);
operational analysis and forecast of the surface wind
field;
guidance for tropical cyclone genesis;
guidance on the operational utility and relative merits
of high-resolution model output compared to
lower-resolution ensemble model output;
guidance for tropical cyclone precipitation amount
and distribution; and
improved utility of microwave satellite and radar data
in tropical cyclone analysis.
NHC expects operational numerical weather predic-
tion model advances will continue to drive forecast im-
provements. Global models like the GFS, NOGAPS,
UKMET, and that of the European Centre for Medium-
Range Weather Forecasts (ECMWF) are among the
frontrunners in tropical cyclone track forecast accuracy,
and are also important components of intra- and inter-
model ensembles. The performance of global models at
longer time periods will be a factor in deciding when the
forecast period for NHC can again be extended for
tropical cyclones. When NHC introduced 3-day predic-
tions in 1964, the average Atlantic track forecast error for
3 days was near 400 n mi. The 5-day forecast errors av-
eraged near 375 n mi when they were first issued in 2003.
An initial verification of longer-range GFS track fore-
casts is shown in Fig. 13. This verification covers the
latter portion of 2005 and 2006–07. The average error
for 7 days for the sample is near 525 n mi for the GFS.
The 7-day errors for the GFS ensemble mean are much
lower, near 375 n mi, and could indicate a particular
value of intramodel ensembles for extended-range
forecasts. Because the GFS ensemble mean errors in-
crease at a nearly linear rate, it is likely that if the short-
period errors continue to decrease, so might the longer-
period errors in a commensurate fashion.
The GFS is also important for the boundary conditions
it provides to regional hurricane models. It is the back-
ground for a highly sophisticated, new regional numeri-
cal model for the prediction of tropical cyclones, known
as the Hurricane Weather Research and Forecast (HWRF)
model, which became operational at NCEP in time for the
2007 hurricane season. HWRF makes use of the WRF
community-based infrastructure. It is a coupled air–sea–
land prediction model with a movable nested grid and
advanced physics for high resolution. HWRF uses non-
hydrostatic mesoscale model dynamics, for example, the
Nonhydrostatic Mesoscale Model (NMM) core (Janji�c
et al. 2001). Its initial operational configuration consists
of 9-km horizontal resolution with 42 vertical levels.
This initial capability, along with plans for further im-
provements in physics, data assimilation, horizontal and
vertical resolution, and coupling over the next several
years, provide a framework for improving tropical cy-
clone forecast track, wind intensity and distribution, and
rainfall forecasts.
HWRF initialization and the associated advanced
data assimilation techniques for the hurricane core are
being developed to make use of real-time airborne
Doppler radar data from NOAA’s aircraft to initialize
the three-dimensional storm-scale structure. This work
is expected to prove beneficial in improving hurricane
intensity and structure forecasts. To address the totality
of the hurricane forecast problem, including improved
prediction of coastal and inland inundation, future ver-
sions of the HWRF will be coupled to an advanced version
of NCEP’s wave model, for example, WAVEWATCH,
and to a dynamic storm surge model. Shallow water
physics are being introduced into WAVEWATCH for
forecasting waves at the immediate coastline. In ad-
dition, the land surface component will serve as input
to hydrology and inundation models to address the
hurricane-related inland-flooding problem (Surgi 2007).
New observing capabilities will benefit NHC, both
indirectly through their impact on operational forecast
FIG. 13. Average Atlantic track forecast errors for GFS and GFS
ensemble means for latter part of 2005, and for 2006–07.
APRIL 2009 R A P P A P O R T E T A L . 415

models, and directly as applied by the forecasters. With
the increasing emphasis on oceanic contributions to
tropical cyclone forecasting, it should be expected that
additional sensors measuring routinely, for example,
oceanic heat content and other surface and subsurface
conditions will also likely provide important informa-
tion (e.g., Mainelli et al. 2008). So might other sensors
and platforms currently under consideration (e.g., un-
manned aerial systems) or not yet envisioned.
NOAA plans to implement a new generation of op-
erational polar and geostationary satellites early in the
next decade. The new polar system (the National Polar-
Orbiting Operational Environmental Satellite System;
NPOESS) is a joint venture with the Department of
Defense. It will include a number of advanced instru-
ments with tropical cyclone applications. For example,
NPOESS will include microwave and infrared sensors
with vastly improved vertical and horizontal resolutions
to provide much more accurate temperature and mois-
ture profiles than are now possible. The next-generation
GOES satellites, beginning with GOES-R, will include
an advanced imager with more than three times the
number of channels, higher horizontal resolution, and
much faster scanning rates than current GOES satel-
lites. GOES-R will also include a lightning mapper,
which has potential application to intensity analysis and
prediction. The Joint Center for Satellite Data Assimi-
lation (LeMarshall et al. 2007) is a collaborative effort
between NOAA and NASA that will help to develop
the assimilation techniques needed to extract the in-
formation content for model initialization from these
and other new satellite systems.
NHC looks forward to the eventual deployment of
sensors to measure accurately and at high-resolution
the surface wind circulation (e.g., an operational next-
generation version of the QuikSCAT satellite), and
eventually the entire three-dimensional wind field in the
storm and its environment. Such a capability, along with
improved analysis and display tools, for example, in
storm-relative coordinates, and on AWIPS II, the
planned successor to AWIPS and N-AWIPS), would
improve tropical storm and hurricane watch–warning
issuances by enabling NHC to better analyze, forecast,
and verify the maximum intensity and specific wind
radii now contained in its advisories, and to extend the
forecast period of those radii to match the longer period
of NHC’s track forecasts. These data and improved
numerical models could also make it possible for NHC
to meet its long-desired objective of issuing operational
surface wind forecasts.
Storm surge remains a tremendous threat to life. New
ways of depicting the threat, like the probabilistic pro-
ducts mentioned in section 7, along with expected ad-
vances in atmospheric and associated surge models,
should some day make it possible to issue explicit storm
surge warnings for the U.S. coasts. Such warnings would
not necessarily be the same as current NWS warnings
based primarily on wind speed criteria. This may be
particularly effective in helping to better distinguish
between impact-specific threats and their associated
preparedness options in hurricanes (e.g., to promote
‘‘fleeing from the water but hiding from the wind’’).
The improvements in numerical model track forecasts
have enabled NHC in recent years to trim the average
length of its U.S. coastal hurricane warnings (Fig. 14),
while increasing lead time (M. DeMaria 2007, personal
communication). Further reductions in warning lengths
are desirable if they decrease ‘‘overwarning,’’ but should
not be made if they expose unwarned areas to hurricane
conditions. A review of recent U.S. hurricane warnings
indicates that a 25% decrease in warning length would
have resulted in hurricane conditions occurring outside
of hurricane-warned areas in several systems, including
Hurricane Ivan (2004). Consequently, additional major
reductions in warning size likely await significant fur-
ther improvements in model guidance. In the meantime,
NHC is working with JHT-funded scientists to look at
whether the placement and timing of these warnings can
be improved and made more objective by considering
output from NHC’s new wind speed probability programs.
NHC has pioneered within the NWS some new ways
for communicating information. When NHC introduced
its computer-generated tropical cyclone graphics during
a national television briefing announcing a hurricane
watch for the U.S. southeast coast for Hurricane Hugo
(1989), it marked a first for the NWS. That effort led to
NHC’s Web site graphics discussed in section 7a. Among
its current new activities, NHC has begun making ex-
perimental in-house probabilistic forecasts of tropical
cyclone genesis and probabilistic forecasts of rapid in-
tensification. It is also working toward providing the
remainder of its applicable information in GIS format,
expanding the availability of its products in gridded
format (especially for TAFB), and using Internet audio
and video podcasts for its hurricane briefings.
While NOAA has made significant strides in opera-
tional hurricane forecasting, there are areas that need
further advancements. In 2007, NOAA established the
Hurricane Forecast Improvement Project (HFIP). This
came in response to input from stakeholders and from
reports by the National Science Board (NSB), the Office
of the Federal Coordinator for Meteorology (OFCM),
and NOAA’s Science Advisory Board Hurricane In-
tensity Research Working Group (HIRWG) calling for
significant and accelerated improvements in hurricane
forecasts. The project is intended to unify hurricane
416 W E A T H E R A N D F O R E C A S T I N G VOLUME 24
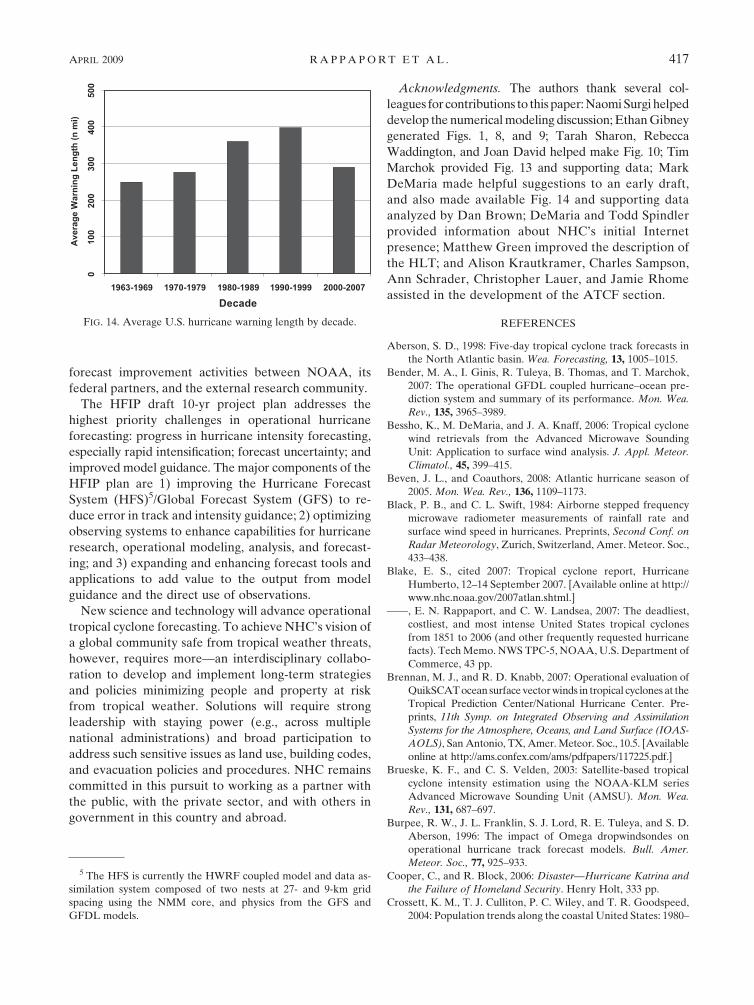
forecast improvement activities between NOAA, its
federal partners, and the external research community.
The HFIP draft 10-yr project plan addresses the
highest priority challenges in operational hurricane
forecasting: progress in hurricane intensity forecasting,
especially rapid intensification; forecast uncertainty; and
improved model guidance. The major components of the
HFIP plan are 1) improving the Hurricane Forecast
System (HFS)5/Global Forecast System (GFS) to re-
duce error in track and intensity guidance; 2) optimizing
observing systems to enhance capabilities for hurricane
research, operational modeling, analysis, and forecast-
ing; and 3) expanding and enhancing forecast tools and
applications to add value to the output from model
guidance and the direct use of observations.
New science and technology will advance operational
tropical cyclone forecasting. To achieve NHC’s vision of
a global community safe from tropical weather threats,
however, requires more—an interdisciplinary collabo-
ration to develop and implement long-term strategies
and policies minimizing people and property at risk
from tropical weather. Solutions will require strong
leadership with staying power (e.g., across multiple
national administrations) and broad participation to
address such sensitive issues as land use, building codes,
and evacuation policies and procedures. NHC remains
committed in this pursuit to working as a partner with
the public, with the private sector, and with others in
government in this country and abroad.
Acknowledgments. The authors thank several col-
leagues for contributions to this paper: Naomi Surgi helped
develop the numerical modeling discussion; Ethan Gibney
generated Figs. 1, 8, and 9; Tarah Sharon, Rebecca
Waddington, and Joan David helped make Fig. 10; Tim
Marchok provided Fig. 13 and supporting data; Mark
DeMaria made helpful suggestions to an early draft,
and also made available Fig. 14 and supporting data
analyzed by Dan Brown; DeMaria and Todd Spindler
provided information about NHC’s initial Internet
presence; Matthew Green improved the description of
the HLT; and Alison Krautkramer, Charles Sampson,
Ann Schrader, Christopher Lauer, and Jamie Rhome
assisted in the development of the ATCF section.
REFERENCES
Aberson, S. D., 1998: Five-day tropical cyclone track forecasts in
the North Atlantic basin. Wea. Forecasting, 13, 1005–1015.
Bender, M. A., I. Ginis, R. Tuleya, B. Thomas, and T. Marchok,
2007: The operational GFDL coupled hurricane–ocean pre-
diction system and summary of its performance. Mon. Wea.
Rev., 135, 3965–3989.
Bessho, K., M. DeMaria, and J. A. Knaff, 2006: Tropical cyclone
wind retrievals from the Advanced Microwave Sounding
Unit: Application to surface wind analysis. J. Appl. Meteor.
Climatol., 45, 399–415.
Beven, J. L., and Coauthors, 2008: Atlantic hurricane season of
2005. Mon. Wea. Rev., 136, 1109–1173.
Black, P. B., and C. L. Swift, 1984: Airborne stepped frequency
microwave radiometer measurements of rainfall rate and
surface wind speed in hurricanes. Preprints, Second Conf. on
Radar Meteorology, Zurich, Switzerland, Amer. Meteor. Soc.,
433–438.
Blake, E. S., cited 2007: Tropical cyclone report, Hurricane
Humberto, 12–14 September 2007. [Available online at http://
www.nhc.noaa.gov/2007atlan.shtml.]
——, E. N. Rappaport, and C. W. Landsea, 2007: The deadliest,
costliest, and most intense United States tropical cyclones
from 1851 to 2006 (and other frequently requested hurricane
facts). Tech Memo. NWS TPC-5, NOAA, U.S. Department of
Commerce, 43 pp.
Brennan, M. J., and R. D. Knabb, 2007: Operational evaluation of
QuikSCAT ocean surface vector winds in tropical cyclones at the
Tropical Prediction Center/National Hurricane Center. Pre-
prints, 11th Symp. on Integrated Observing and Assimilation
Systems for the Atmosphere, Oceans, and Land Surface (IOAS-
AOLS), San Antonio, TX, Amer. Meteor. Soc., 10.5. [Available
online at http://ams.confex.com/ams/pdfpapers/117225.pdf.]
Brueske, K. F., and C. S. Velden, 2003: Satellite-based tropical
cyclone intensity estimation using the NOAA-KLM series
Advanced Microwave Sounding Unit (AMSU). Mon. Wea.
Rev., 131, 687–697.
Burpee, R. W., J. L. Franklin, S. J. Lord, R. E. Tuleya, and S. D.
Aberson, 1996: The impact of Omega dropwindsondes on
operational hurricane track forecast models. Bull. Amer.
Meteor. Soc., 77, 925–933.
Cooper, C., and R. Block, 2006: Disaster—Hurricane Katrina and
the Failure of Homeland Security. Henry Holt, 333 pp.
Crossett, K. M., T. J. Culliton, P. C. Wiley, and T. R. Goodspeed,
2004: Population trends along the coastal United States: 1980–
FIG. 14. Average U.S. hurricane warning length by decade.
5 The HFS is currently the HWRF coupled model and data as-
similation system composed of two nests at 27- and 9-km grid
spacing using the NMM core, and physics from the GFS and
GFDL models.
APRIL 2009 R A P P A P O R T E T A L . 417

2008. Coastal Trends Report Services, NOAA/National Ocean
Service Management and Budget Office, 54 pp. [Available
online at http://www.oceanservice.noaa.gov/programs/mb/pdfs/
coastal_pop_trends_complete.pdf.]
Davis, M. A. S., G. M. Brown, and P. Leftwich, 1984: A tropical
cyclone data tape for the eastern and central North Pacific
basins, 1949–1983: Contents, limitations, and uses. NOAA
Tech. Memo. NWS NHC 22, 21 pp. [Available online at http://
www.nhc.noaa.gov/pdf/NWS-NHC-1988-22.pdf.]
DeMaria, M., 1996: A history of hurricane forecasting for the
Atlantic basin, 1920–1995. Historical Essays on Meteorology
1919–1995, J. R. Fleming, Ed., Amer. Meteor. Soc., 263–306.
——, M. Mainelli, L. K. Shay, J. A. Knaff, and J. Kaplan, 2005:
Further improvements to the Statistical Hurricane Intensity
Prediction Scheme (SHIPS). Wea. Forecasting, 20, 531–543.
——, J. A. Knaff, and J. Kaplan, 2006: On the decay of tropical
cyclone winds crossing narrow landmasses. J. Appl. Meteor.
Climatol., 45, 491–499.
Demuth, J. L., M. DeMaria, J. A. Knaff, and T. H. Vonder Haar,
2004: Evaluation of Advanced Microwave Sounding Unit
tropical-cyclone intensity and size estimation algorithms. J.
Appl. Meteor., 43, 282–296.
Dvorak, V. F., 1984: Tropical cyclone intensity analysis using sat-
ellite data. NOAA Tech. Rep. NESDIS 11, 47 pp.
Elsberry, R. L., 2005: Achievement of USWRP hurricane landfall
research goal. Bull. Amer. Meteor. Soc., 86, 643–645.
Fernandez-Partagas, J., and H. F. Diaz, 1996: Atlantic hurricanes
in the second half of the nineteenth century. Bull. Amer.
Meteor. Soc., 77, 2899–2906.
Franklin, J. L., cited 2008: National Hurricane Center forecast
verification. [Available online at http://www.nhc.noaa.gov/
verification.]
——, M. L. Black, and K. Valde, 2003a: GPS dropwindsonde wind
profiles in hurricanes and their operational implications. Wea.
Forecasting, 18, 32–44.
——, C. J. McAdie, and M. B. Lawrence, 2003b: Trends in track
forecasting for tropical cyclones threatening the United
States, 1970–2001. Bull. Amer. Meteor. Soc., 84, 1197–1203.
Goerss, J. S., 2007a: Prediction of consensus tropical cyclone track
forecast error. Mon. Wea. Rev., 135, 1985–1993.
——, cited 2007b: Prediction of consensus tropical cyclone track
forecast error and correctors to improve consensus tropical
cyclone tracks. USWRP Joint Hurricane Testbed Final Rep.,
18 pp. [Available online at http://www.nhc.noaa.gov/jht/05-
07reports/final_Goerss_JHT07.pdf.]
Gross, J. M., M. DeMaria, J. A. Knaff, and C. R. Sampson, 2004: A
new method for determining tropical cyclone wind forecast
probabilities. Preprints, 26th Conf. on Hurricanes and Tropi-
cal Meteorology, Miami, FL, Amer. Meteor. Soc., 11A.4.
[Available online at http://ams.confex.com/ams/pdfpapers/
75000.pdf.]
Hawkins, J. D., T. F. Lee, J. Turk, C. Sampson, J. Kent, and K.
Richardson, 2001: Real-time Internet distribution of satellite
products for tropical cyclone reconnaissance. Bull. Amer.
Meteor. Soc., 82, 567–578.
Hebert, P. J., and K. O. Poteat, 1975: A satellite classification
technique for subtropical cyclones. NOAA Tech. Memo.
NWS SR-83, National Weather Service, Fort Worth, TX, 25 pp.
Hock, T. F., and J. L. Franklin, 1999: The NCAR GPS drop-
windsonde. Bull. Amer. Meteor. Soc., 80, 407–420.
Hoffman, R. N., and S. M. Leidner, 2005: An introduction to the
near-real-time QuikSCAT data. Wea. Forecasting, 20, 476–
493.
Janji�c, Z. I., J. P. Gerrity Jr., and S. Nickovic, 2001: An alternate
approach to nonhydrostatic modeling. Mon. Wea. Rev., 129,
1164–1178.
Jarvinen, B. R., and C. J. Neumann, 1979: Statistical forecasts of
tropical cyclone intensity for the North Atlantic basin. NOAA
Tech. Memo. NWS NHC-10, 22 pp.
——, and M. B. Lawrence, 1985: An evaluation of the SLOSH
storm-surge model. Bull. Amer. Meteor. Soc., 66, 1408–
1411.
——, C. J. Neumann, and M. A. S. Davis, 1984: A tropical cyclone
data tape for the North Atlantic basin, 1886–1983: Contents,
limitations, and uses. NOAA Tech. Memo. NWS NHC 22,
Coral Gables, FL, 21 pp.
Jelesnianski, C. P., J. Chen, and W. A. Shaffer, 1992: SLOSH: Sea,
Lake, and Overland Surges from Hurricanes. NOAA Tech.
Rep. NWS 48, 71 pp.
Knaff, J. A., M. DeMaria, B. Sampson, and J. M. Gross, 2003:
Statistical, 5-day tropical cyclone intensity forecasts derived
from climatology and persistence. Wea. Forecasting, 18, 80–
92.
——, C. R. Sampson, M. DeMaria, T. P. Marchok, J. M. Gross, and
C. J. McAdie, 2007: Statistical tropical cyclone wind radii
prediction using climatology and persistence. Wea. Forecast-
ing, 22, 781–791.
Kurihara, Y., and R. E. Tuleya, 1974: Structure of a tropical cy-
clone developed in a three-dimensional numerical simulation
model. J. Atmos. Sci., 31, 893–919.
——, and M. A. Bender, 1980: Use of a movable nested-mesh model
for tracking a small vortex. Mon. Wea. Rev., 108, 1792–1809.
——, R. E. Tuleya, and M. A. Bender, 1998: The GFDL Hurricane
Prediction System and its performance in the 1995 hurricane
season. Mon. Wea. Rev., 126, 1306–1322.
Landsea, C. W., 1993: A climatology of intense (or major) Atlantic
hurricanes. Mon. Wea. Rev., 121, 1703–1713.
——, and Coauthors, 2004a: The Atlantic hurricane database re-
analysis project: Documentation for the 1851–1910 alterations
and additions to the HURDAT database. Hurricanes and
Typhoons: Past, Present and Future, R. J. Murname and K.-B.
Liu, Eds., Columbia University Press, 177–221.
——, and Coauthors, 2004b: A reanalysis of Hurricane Andrew’s
(1992) intensity. Bull. Amer. Meteor. Soc., 85, 1699–1712.
——, and Coauthors, 2008: A reanalysis of the 1911–20 Atlantic
hurricane database. J. Climate, 21, 2138–2168.
Le Marshall, J., and Coauthors, 2007: The Joint Center for Satellite
Data Assimilation. Bull. Amer. Meteor. Soc., 88, 329–340.
Mainelli, M., M. DeMaria, L. K. Shay, and G. Goni, 2008: Appli-
cation of oceanic heat content estimation to operational
forecasting of recent Atlantic category 5 hurricanes. Wea.
Forecasting, 23, 3–16.
McAdie, C. J., 2004: Development of a wind radii CLIPER model.
Preprints, 26th Conf. on Hurricanes and Tropical Meteorol-
ogy, Miami, FL, Amer. Meteor. Soc., 5D.7. [Available online
at http://ams.confex.com/ams/pdfpapers/75190.pdf.]
Mileti, D. S., 1999: Disasters by Design: A Reassessment of Natural
Hazards in the United States. Joseph Henry Press, 351 pp.
Miller, R. J., A. J. Schrader, C. R. Sampson, and T. L. Tsui, 1990:
The Automated Tropical Cyclone Forecasting System
(ATCF). Wea. Forecasting, 5, 653–660.
NAS, cited 2000: From research to operations in weather satellites
and numerical weather prediction: Crossing the Valley of
Death. The National Academies Board on Atmospheric Sci-
ences and Climate. [Available online at http://dels.nas.edu/
basc/reportDetail.php?link_id52199.]
418 W E A T H E R A N D F O R E C A S T I N G VOLUME 24
——, A geospatial framework for the coastal zone: National needs
for coastal mapping and charting (2004). The National
Academies Ocean Studies Board. [Available online at http://
www.nap.edu/books/0309091764/html.]
Neumann, C. B., 1972: An alternate to the HURRAN (hurricane
analog) tropical cyclone forecast system. NOAA Tech.
Memo. NWS SR-62, 24 pp.
Neumann, C. J., 1994: An update to the National Hurricane Center
‘‘Track Book.’’ Minutes of the 48th Interdepartmental Conf.,
Miami, FL, NOAA/Office of the Federal Coordinator for
Meteorological Services and Supporting Research, A-47–
A-53.
NWS, cited 2007: NWS directives system. [Available online at
http://www.nws.noaa.gov/directives/010/010.htm.]
OFCM, cited 2007: National Hurricane Operations Plan (NHOP).
Office of the Federal Coordinator for Meteorological Re-
search. [Available online at http://www.ofcm.gov/nhop/07/
pdf/entire-nhop07.pdf.]
Pasch, R. J., L. A. Avila, and J. L. Guiney, 2001: Atlantic hurricane
season of 1998. Mon. Wea. Rev., 129, 3085–3123.
Passi, R. M., 1974: Wind determination using Omega signal. J.
Appl. Meteor., 13, 934–939.
——, and C. Morel, 1987: Wind errors using the worldwide Loran
network. J. Atmos. Oceanic Technol., 4, 690–700.
Rappaport, E. N., 2000: Loss of life in the United States associated
with recent Atlantic tropical cyclones. Bull. Amer. Meteor.
Soc., 81, 2065–2073.
——, and J. Fernandez-Partagas, 1995: The deadliest Atlantic
tropical cyclones, 1492–1994. NOAA Tech. Memo. NWS
NHC-47, Coral Gables, FL, 41 pp.
Sampson, C. R., and A. J. Schrader, 2000: The Automated Tropical
Cyclone Forecasting System (version 3.2). Bull. Amer. Me-
teor. Soc., 81, 1231–1240.
Schleifstein, M., and J. McQuaid, cited 2002: Washing away.
Special report from The Times-Picayune. Part 2: The Big One.
[Available online at http://www.nola.com/washingaway.]
Sheets, R. C., 1985: The National Weather Service Hurricane
Probability Program. Bull. Amer. Meteor. Soc., 66, 4–13.
——, 1990: The National Hurricane Center—Past, present, and
future. Wea. Forecasting, 5, 185–232.
Surgi, N., cited 2007: Advanced hurricane prediction at NCEP’s
Environmental Model Center: The operational implemen-
tation of the HWRF. [Available online at http://www.ofcm.
gov/ihc07/linking_file_ihc07.htm.]
Uhlhorn, E. W., and P. G. Black, 2003: Verification of remotely
sensed sea surface winds in hurricanes. J. Atmos. Oceanic
Technol., 20, 99–116.
——, ——, J. L. Franklin, M. Goodberlet, J. Carswell, and A. S.
Goldstein, 2007: Hurricane surface wind measurements from
an operational Stepped Frequency Microwave Radiometer.
Mon. Wea. Rev., 135, 1370–1385.
White, S. R., J. D. McFadden, and J. L. Franklin, 1998: Atmo-
spheric observations with the NOAA Gulfstream IV-SP.
Preprints, 10th Symp. on Meteorological Observations and
Instrumentation, Phoenix, AZ, Amer. Meteor. Soc., 38–41.
Williford, C. E., T. N. Krishnamurti, R. Correa Torres, S. Cocke,
Z. Christidis, and T. S. Vijaya Kumar, 2003: Real-time mul-
timodel superensemble forecasts of Atlantic tropical systems
of 1999. Mon. Wea. Rev., 131, 1878–1894.
Willoughby, H. E., E. N. Rappaport, and F. D. Marks Jr., 2007:
Hurricane forecasting: The state of the art. Nat. Hazards Rev.,
8, 45–49.
WMO, 2006: Regional Association IV (North America, Central
America and the Caribbean) Hurricane Operational Plan.
WMO/TD-No. 494, Tropical Cyclone Programme Rep. TCP-
30, 98 pp.
APRIL 2009 R A P P A P O R T E T A L . 419


![[Locat00] Submarine Landslides Advances and Challenges](https://img.dokumen.tips/doc/110x75/5476f099b4af9f48248b4607/locat00-submarine-landslides-advances-and-challenges.jpg)