Embed Size (px)
Citation preview

The mitigation of information asymmetries: A research on
the effect of financial advisory on SME success in bank
financing
Master Thesis Business Administration
T.J. Faber
s0126608
University of Twente
August the 14th, 2013

i
“Forecasts may tell you a great deal about the forecaster;
they tell you nothing about the future.”
- Warren Buffet

ii
Abstract
An increasing amount of Dutch small and medium-sized Enterprises (SMEs) is having
trouble with acquiring bank finance. Bank finance is crucial to SMEs to seize new market
opportunities and anticipate on external stress. There is much debate in the literature about
the impact of SME advisers in general and on financial subjects. The role of business advisers is
to mitigate negative effects of information asymmetry. This paper contributes by testing the
relationship between the use of advice and the propensity of success in bank finance. Also
different sources of formal advice are tested for their influence on success in bank financing. A
logistic regression analysis from a sample of 44 respondents found no significant relationship
between the use of advice from (individual) formal sources and success in bank finance.
The academic contribution of this thesis constitutes of recent acquired data that reject
the statistical significance of the use of advice and success in bank finance. The practical
contribution is provided by the idea that entrepreneurs do not always benefit from the use of
external advisers.

iii
General Information
Author
Name Faber, T.J. BSc.
Student number s0126608
Address Javastraat 159, Enschede
Telephone number +31 (0) 6 20567461
E-mail [email protected]
Faculty Management and Governance
Course Business Administration
Track Financial Management
Supervisory committee
First supervisor Prof. Dr. Kabir, R.
Telephone number +31 (0) 53 489 3510
E-mail [email protected]
Second supervisor Dr. Huang, X.
Telephone + 31 (0) 53 489 3440
E-mail [email protected]
Company supervisor Drs. Vinke, B.J.
Telephone number +31 (0) 74 750 1485
E-mail [email protected]
Project information
Company Claassen, Moolenbeek & Partners
Address Jan Tinbergenstraat 316, Hengelo
Telephone number +31 (0) 74 750 1485
Fax +31 (0) 74 750 1510
Website www.cmenp.nl
University of Twente School of Management en Governance
Address Drienerlolaan 5, Enschede
Post address P.O. Box 217, 7500 AE, Enschede
Website www.mb.utwente.nl

iv
Table of Content
Abstract ............................................................................................................................ ii
General Information .......................................................................................................... iii
Table of Content ................................................................................................................ iv
Figures & Tables ............................................................................................................... vi
Chapter 1: Introduction ................................................................................................ 1
1.1 Research question ............................................................................................................................ 3
1.2 Small and medium-sized enterprises in Twente .............................................................................. 4
1.2.1 Defining SMEs ............................................................................................................................ 4
1.2.1 SMEs from Twente in a European and global perspective ........................................................ 5
1.3 Financing forms for SMEs ................................................................................................................. 6
1.4 Contribution of this research ........................................................................................................... 8
1.5 Claassen, Moolenbeek & Partners – the commissioning company ................................................. 9
1.6 Structure of the thesis ...................................................................................................................... 9
Chapter 2: Literature review and hypothesis development ..................................... 10
2.1 SMEs’ Capital structure .................................................................................................................. 11
2.1.1 Modigliani and Miller theorem ............................................................................................... 11
2.1.2 Pecking order theory ............................................................................................................... 12
2.1.3 Agency theory ......................................................................................................................... 13
2.2 Advisory services ............................................................................................................................ 17
2.2.1 Classification of advice ............................................................................................................ 18
2.2.2 Aspects of financial advice ...................................................................................................... 19
2.2.3 Impact of financial advice........................................................................................................ 20
2.3 The utilization of advisory services ................................................................................................ 22
2.3.1 Firm size as a predictor for advice ........................................................................................... 23
2.3.2 Firm age as a predictor for advice ........................................................................................... 25
2.4 Sources of financial advice ............................................................................................................. 26
2.4.1 Formal versus informal advice ................................................................................................ 26
2.4.2 Advice from accountants and business advisers ..................................................................... 26
v
Chapter 3: Methodology and data ............................................................................. 29
3.1 Survey method ............................................................................................................................... 29
3.1.1 Enhancement response rate ................................................................................................... 29
3.1.2 ThesisTools as a web survey .................................................................................................... 30
3.2 Regression analysis ......................................................................................................................... 31
3.2.1 Logit model in literature .......................................................................................................... 31
3.2.2 Logit model explained and applied ......................................................................................... 32
3.3 Variables ......................................................................................................................................... 34
3.3.1 Dependent variable ................................................................................................................. 34
3.3.2 Independent variables ............................................................................................................. 36
3.3.3 Control variables ..................................................................................................................... 36
Chapter 4: Results ...................................................................................................... 38
4.1 Data description ............................................................................................................................. 38
4.1.1 Response rate .......................................................................................................................... 38
4.1.2 Response descriptives ............................................................................................................. 40
4.2 Regression analyses........................................................................................................................ 43
Chapter 5: Conclusions and Discussion ................................................................... 46
5.1 Conclusion ...................................................................................................................................... 46
5.2 Representativeness of acquired survey data ................................................................................. 47
5.3 Validity of research......................................................................................................................... 48
5.4 Advice as mitigation for information asymmetry .......................................................................... 48
5.6 Recommendations for future research .......................................................................................... 49
References........................................................................................................................ 51
Appendix A: The survey1

vi
Figures & Tables
Figures
Figure 1.1: Development in demand for bank loans in the Netherlands (blue) and Eurozone (red) ........ 2
Figure 2.1: Conceptual framework hypothesis 1 ..................................................................................... 21
Figure 2.2: Conceptual framework for hypothesis 2 ................................................................................ 28
Figure 4.1: Distribution of survey responses (n=158) .............................................................................. 40
Figure 4.2: Distribution of useful responses (n=113) ............................................................................... 41
Figure 4.3: Reported used aspects of advice ........................................................................................... 42
Tables
Table 1.1: Perceived effort to acquire bank loan for Dutch SMEs ............................................................. 1
Table 1.2: EC SME classification ................................................................................................................. 4
Table 1.3: Comparison of Dutch SMEs and large firms in volume and economical contribution ............. 6
Table 1.4: Finance sources for Dutch SMEs ............................................................................................... 7
Table 2.1: Obliged financial publication by firm size................................................................................ 16
Table 2.2: Aspects of advisory service...................................................................................................... 20
Table 3.1: SME classification by credit application need ......................................................................... 35
Table 4.1: Survey results .......................................................................................................................... 39
1
Chapter 1: Introduction
In 2010 only 33% of the funding requests by Dutch small and medium sized enterprises
(SMEs) were accepted by banks (Verhoeven and Smit, 2011). The remaining 67% were unable
to acquire bank finance to seize market opportunities or to deal with external shocks. Among
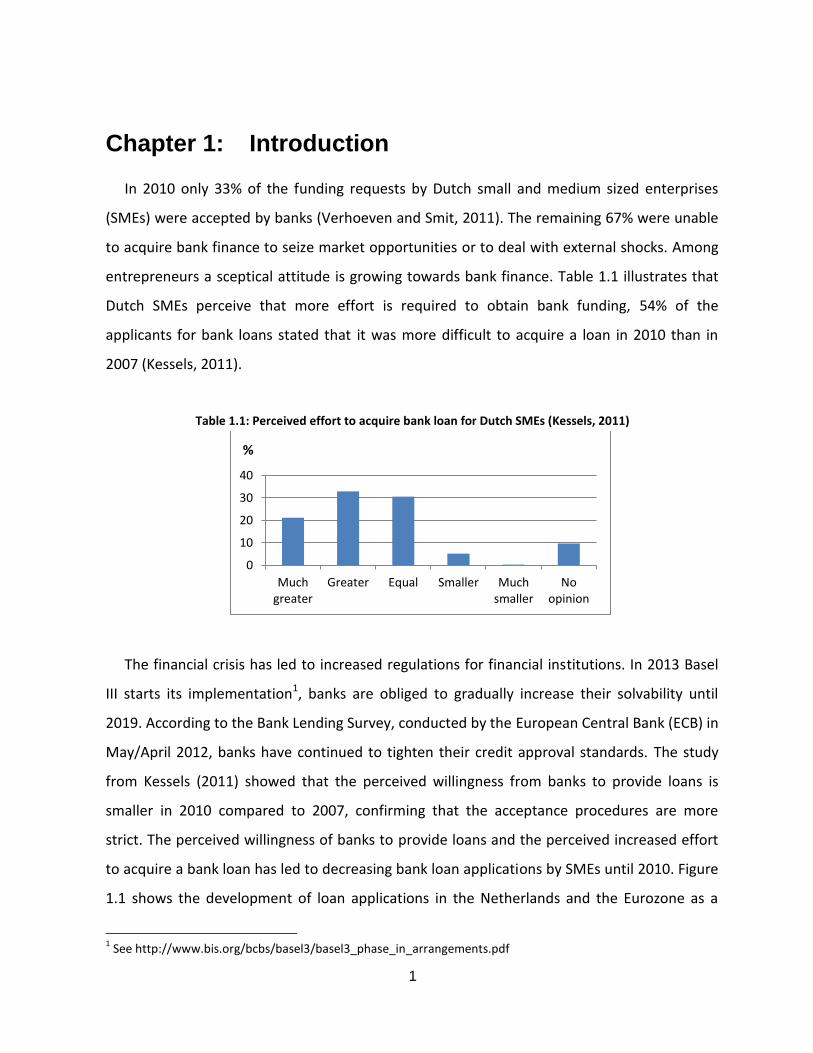
entrepreneurs a sceptical attitude is growing towards bank finance. Table 1.1 illustrates that
Dutch SMEs perceive that more effort is required to obtain bank funding, 54% of the
applicants for bank loans stated that it was more difficult to acquire a loan in 2010 than in
2007 (Kessels, 2011).
Table 1.1: Perceived effort to acquire bank loan for Dutch SMEs (Kessels, 2011)
The financial crisis has led to increased regulations for financial institutions. In 2013 Basel
III starts its implementation1, banks are obliged to gradually increase their solvability until
2019. According to the Bank Lending Survey, conducted by the European Central Bank (ECB) in
May/April 2012, banks have continued to tighten their credit approval standards. The study
from Kessels (2011) showed that the perceived willingness from banks to provide loans is
smaller in 2010 compared to 2007, confirming that the acceptance procedures are more
strict. The perceived willingness of banks to provide loans and the perceived increased effort
to acquire a bank loan has led to decreasing bank loan applications by SMEs until 2010. Figure
1.1 shows the development of loan applications in the Netherlands and the Eurozone as a
1 See http://www.bis.org/bcbs/basel3/basel3_phase_in_arrangements.pdf
0
10
20
30
40
Muchgreater
Greater Equal Smaller Muchsmaller
Noopinion
%

2
change in percentage. As shown in figure 1.1 the development in demand for bank loans in
the Netherlands are comparable with the Eurozone, the Dutch trend has some outliers which
might be caused by the relative small number of banks that participated in the bank lending
survey compared to the amount of participating European banks.
Figure 1.1: Development in demand for bank loans in the Netherlands (blue) and Eurozone (red) (EIM, 2011)
Another problem for SMEs is that bank loans for businesses have increased in cost
according to Verhoeven, Essen, Folkeringa, Ruis and Smit (2010). Rising interest rates and
adjusted risk profiles for lending businesses is the reason that the cost of debt finance
increased and, resulting in a lower demand for bank loans (Boonstra and Groeneveld, 2010).
On the other hand, commercial banks in Europe are able to lend for historical low rates (De
Boer, 2013). Then the question that rises is how problematic is this for Dutch SMEs?
The Dutch ‘Instituut voor Midden- en Kleinbedrijf’ introduced the IMK-index, showing the
trend of entrepreneurs in critical financial situations based on the number of entrepreneurs
that have had private help from local governmental organizations as described in the Benefits
(Self-employed) Decree2. The IMK-index was introduced in 2008 (index=100) and the average
2 The Benefits (Self-employed) Decree was accepted in 2003 in article 7 of the Invoeringswet Werk en Bijstand.
The decree is intended for entrepreneurs that temporarily lack capital to finance their needs but were rejected
for bank finance.

3
index of the first quarter in 2013 was 154, meaning an increase of 54% in entrepreneurs that
are in distress because of a lack of finance while they are assessed as creditworthy by the local
government.
To counteract this development Mees (2013) wrote: “it is evident how the financial sector
could have a positive impact, namely by providing much needed business financing.” The
availability of finance is especially important to SMEs in order to anticipate on unexpected
market opportunities or to resist external shocks (Rivaud-Danset, Dubocage and Salais, 1998).
The European Commission (EC) states that SMEs are the lifeblood of Europe’s economy
because the majority of new jobs are created by SMEs and they contribute to economic
growth and prosperity3. Furthermore, according to the EC, SMEs are crucial for the global
economy due to their ability to innovate and their flexibility in a changing business
environment.
1.1 Research question
Deakins, Jennings, and Mason (1997) were first to conclude that external advice is
positively related with the survival rate for start-up companies. After the publication of
Deakins et al. more authors focused on several implications of external advisory for SMEs (e.g.
Dyer & Ross, 2004). But the first authors who studied the effect of external advisory on credit
availability are Scott and Irwin (2009). With the data from a telephone survey Scott and Irwin
reported that the use of external advisers is related to the SME’s ability to raise bank finance
in the UK. This research aims to test the relationship between financial advisory and success in
bank finance for SMEs. The following research question is formulated:
“Does financial advisory enhance success in SME financing?”
Answering this question provides both managerial levers for capital seeking entrepreneurs
and scientific insights in how the problem of asymmetrical information is mitigated.
3 See http://ec.europa.eu/enterprise/policies/sme/files/docs/sba/sba_faq_en.pdf

4
1.2 Small and medium-sized enterprises in Twente
1.2.1 Defining SMEs
Throughout the world different definitions for SMEs exist. In 1971 the Bolton Committee
introduced a qualitative definition for small firms, namely that small firms are independent
businesses, managed by its owner or part-owners and having a small market share. The U.S.
Small Business Administration has a more quantitative definition; it treats all companies with
fewer than 500 employees as a SME4.
The definition for SMEs used in this study is in line with the Commission Recommendation
2003/361/EC. Amongst many more, Daskalaksis and Psillaki (2009)5 used the guidelines of the
EC as well. The EC defines micro -, small - and medium-sized enterprises, the group small and
medium sized enterprises (SMEs) includes all the above mentioned subcategories. The criteria
for the subcategories are presented in table 1.2. Since all subcategories are included in our
sample population, this study aims at firms with less than 250 employees, and with a turnover
that is not exceeding 50 million Euros or the annual balance sheet total does not exceed 43
million Euro (EC 2003/361/EC).
Table 1.2: EC SME classification
Enterprise category Headcount
(annual work unit)
Annual turnover
(million €)
Annual balance sheet
total (million €)
Micro
<10
≤2
or
≤2
Small <50 ≤10 or ≤10
Medium-sized <250 ≤50 or ≤43
4 See http://www.oecd.org/industry/smes/2090740.pdf 5 In 2003 the European Commission reviewed the SME criteria. Daskalaksis and Psillaki (2008) publication uses EC
definition originating from 1996 because their data is retrieved before the EC revised their criteria.
5
Within our population of SMEs there are three subpopulations, micro- , small- and
medium-sized enterprises. Micro enterprises are defined as companies that employ fewer
than 10 employees and whose annual turnover or annual balance sheet total does not exceed
2 million euros. Small firms are firms with less than 50 employees and an annual turnover and
annual balance sheet total of no more than 10 million euros. When a firm has less than 250
employees and annual turnover over less than 50 million euros or an annual balance sheet
total of 43 million euros it qualifies as a medium sized enterprise.
1.2.1 SMEs from Twente in a European and global perspective
Recent literature indicates that SMEs do not only provide the majority of employment, but
are also responsible for half of the gross domestic product (GDP) in developed countries
(Ayyagari, Beck, & Demirguc-Kunt, 2007). In the Organisation for Economic Co-operation and
Development countries the percentage of workforce working in SMEs is even 75% according
to Dietrich (2012). In the 27 member states of the European Union, in 2008, the percentage of
workforce working in SMEs was 67.5% and the 57.9% of the GDP was accounted by SMEs. The
Netherlands shows similar figures; in 2008 67.2% of the employment was in SMEs, which is
0.2% lower than the average of the 27 EU countries. The Dutch SMEs contribute above
average, in comparison with EU countries, to the GDP with 62.2%.
In total there were 537.000 Dutch companies in 2008 that classified as SMEs6, with
exclusion from financial organizations (Verhoeven et al., 2010). Data from Braaksma, Smit,
and Verhoeven (2011) reported the presence of even more Dutch SMEs. The volume and
economical contribution of SME’s in the Netherlands compared to large firms is displayed in
table 1.3.
6 Verhoeven et al. (2010) use an alternative definition for SME; firms with 100 employees or less are categorized
by Verhoeven et al. as SMEs. Therefore the number of Dutch SMEs is lower than the reported figures from
Braaksma, Smit, and Verhoeven (2011) who comply with the EC definition.

6
Table 1.3: Comparison of Dutch SMEs and large firms in volume and economical contribution (Braaksma, Smit,
and Verhoeven; 2011)
SME Percentage Large
Firms
Percentage
Number of firms (31-12-2009) (x1,000) 775 99% 5 1%
Revenues (bn. €) 386 43% 514 57%
Gross margin (bn. €) 175 49% 180 51%
Employees (FTE x1,000) 2,835 59% 1,960 41%
Number of employees (x1,000) 3,560 59% 2,434 41%
Profit (bn. €) 16 32% 34 68%
The scope of this research is limited to SMEs in the COROP area of Twente for data
collection purposes that are further discussed in section 3.1. The Netherlands is divided into
40 COROP7 regions. In Twente 68% of the workforce is placed in SMEs (Gessel-Dabekaussen,
2011) which is comparable to the European average of 67% (EC, 2010) but lower than the
reported share workplaces by Braaksma, Smit and Verhoeven (2011).
In the first section the need for capital is addressed, now that SMEs are defined and are
placed in an international context, the next section presents the ways SMEs finance their
activities.
1.3 Financing forms for SMEs
To finance their operations, SMEs can acquire funds from several sources; owner’s equity
and debt. Owner’s equity consists of the capital brought in by the owner(s) and retained
earnings. A formal definition of owner’s equity is the assets minus the liabilities. Note that the
owner is not necessarily the entrepreneur. Equity finance is an exchange of capital and a share
of a firm. According to Verhoeven et al. (2010) family and friends are the most commonly
reported source of external equity finance, approximately 80%, other than capital from the
7The commission Coördinatiecommissie Regionaal Onderzoeksprogramma introduced a new division of Dutch
regions in 1970. Twente is the 12th
(out of 40) COROP area and is situated in the eastern part of the Netherlands.

7
entrepreneur itself in the Netherlands. Other sources of equity, explained in Verhoeven et al.,
are informal investors, private equity funds, venture capitalist, seed capital funds and public
offering.
Table 1.4: Finance sources for Dutch SMEs (Verhoeven et al., 2010)
Source of finance
2008 2009
One or more banks 92% 87%
Family or friends 9% 7%
Suppliers 2% 1%
Informal investors 1% 2%
Venture capitalist or private equity
funds
<0.5% <0.5%
Governmental program (e.g. subsidies) <0.5% 11%
Other sources 4% <0.5%
In contrast with equity, debt finance does not lead to dilution of ownership, however the
entrepreneur has the obligation to repay the loan. As shown in table 1.4, the vast majority of
finance for SMEs in the Netherlands originated from banks (Braaksma et al., 2011). Banks
offer a variety of debt finance products for short-term (e.g. bank overdrafts and factoring),
medium-term (e.g. hire purchase, loans and leasing) and long-term (e.g. long term loans).
When banks provide debt, which is an interest-bearing loan, the bank has the possibility of
securitization by using collateral. In the case that the lender fails to pay its duties the lender
has the right to claim the collateral. Interest from loans is tax deductible, while paid dividends
to shareholders are not deductible. In the Netherlands corporate tax rate is 20% when
earnings before taxes (EBT) are less that €200,000, and 25% when EBT exceeds €200,000
(Dutch Wet op de vennootschapsbelasting).

8
1.4 Contribution of this research
The desired contribution of this study is that it aims to reveal implications of the use of
advice during the process of loan application by banks for SMEs. Identifying the effect of
advice on accessibility of bank finance provides SMEs more insight in the value of advice,
which is challenging to predetermine for SMEs.
It contributes to the current body of knowledge by testing the relationship between
external advisory and bank loan approval for SMEs in a Dutch region. Multiple authors in
England have already studied the relationship between advice and firm performance and
credit availability, because England introduced a government subsidized program for business
advice.8 The literature lacks evidence from the Netherlands. A logistic regression model with
contemporary local data from the region of Twente is used to test our hypotheses and
compare our findings with empirical evidence from other studies.
One could expect that the use of advice results in a higher propensity of acquiring bank
credit is trivial knowledge since more focus is applied to the process of loan application. The
expected triviality might be the reason for the existing research gap in Dutch literature.
However, bank employees do not necessarily reason the same way. For example, mr. J.T.
Haandrikman (district director corporate clients ABN Amro N.V., November 5th 2012) stated
that good entrepreneurs do not need external advisers and that it is a disadvantage in the
loan approval process, this implies that the relationship between business advice and success
in acquiring bank credit is negatively related.
8 Business Link was operational from 2004 to 2011 in England and was a government funded online portal for
access to local and regional advisors.

9
1.5 Claassen, Moolenbeek & Partners – the commissioning company
The study is commissioned by Claassen, Moolenbeek & Partners (CM&P). This company is a
specialized consulting firm and is active since 1983. At the moment of writing more than 100
independent CM&P partners are spread over 40 offices in the Netherlands. The four main
services offered by CM&P are:
1. Formulation en implementation of business plans
2. The composition of finance reports
3. Provide guidance by merger and acquisition
4. Interim- and project management
CM&P provide SMEs with advice on the managerial- and banking perspective. They receive
no commissions from banks, insurance companies or accountants to secure objective advice.
It is their vision that structured business plans provide managerial levers for entrepreneurs
and valuable insights, in combination with finance reports, for potential investors. Finance
reports explicate the need of a firm for (a certain type of) finance and the ability of a firm to
fulfil its forthcoming duties (for debt) or forecast its rate of return (equity). CM&P aims to
explore the effectiveness of business advice for SMEs in the loan application process.
1.6 Structure of the thesis
In the next section the relevant literature on SME finance and business advice is discussed
and hypotheses are developed. Then, in chapter 3, the methodology to answer the research
question is explained and the collected data is described. Chapter 4 presents the results of
this study. The last chapter is the discussion where conclusions are presented and their
limitations, implication and recommendation for future research are discussed.

10
Chapter 2: Literature review and hypothesis
development
There are several reasons to execute a well-structured literature review. First, it helps the
researcher to understand the current body of knowledge and to identify research gaps (Levy
& Ellis, 2006). A widely used method for systematic literature review is the three steps posed
by Webster and Watson (2002):
1. Identification of relevant articles in leading journals
2. Review their citations
3. Go forward by determining the citing rates of the articles found in step two
The quality of the articles is hereby seen as the amount of citations, what can also be seen
as the scientific impact. Recent articles do not have had the time to get cited, this does not
necessarily mean that these articles lack quality. When the literature is reviewed properly it
provides a clear view of the current body of knowledge.
This chapter discusses the relevant insights of the current literature regarding how the
availability of bank credit is influenced by advisory and the utilization of advice. The literature
review starts with a discussion of general theories explaining the capital structure of SMEs.
This general discussion is followed by an elaboration of the use of advice where after specific
sources of advice are described.

11
2.1 SMEs’ Capital structure
To finance their operations SMEs can acquire funds from several sources as discussed in
section 1.3. To study SME finance authors use leverage, which is commonly constructed as the
debt-to-equity ratio. Firms that use relatively more debt than equity are called ‘highly
leveraged’ and vice versa. The needs for finance throughout the ventures life cycle is
discussed by Leach and Melicher (2009). In the first stage, the development stage, firms need
seed financing to determine the commercial viability of a business opportunity. If so, the firm
requires start-up finance for the start-up stage, which enables the firm’s initial production and
sales. Next, during the survival stage, the firm’s possible shortfalls in cash need to be funded
by first round financing. This can be necessary when revenues are growing but do not cover
investments and expenses. Different kinds of firm can go through different number of rounds
that needs to be financed.
2.1.1 Modigliani and Miller theorem
The base of the theoretical discussion on capital structure is set up by Modigliani and Miller
(1958). After their publication, several other perspectives were developed. It was Modigliani
and Miller’s proposition that the value of a firm, in a perfect capital market (Miller 1988), is
independent from its capital structure. The perfect capital market is an efficient market and
lacks the costs of taxes, bankruptcy costs, agency costs and asymmetric information. The
Modigliani and Miller theorem was developed for large firms. Later Modigliani and Miller
admitted that when the tax deductibility of interest was considered, a relatively higher
leverage was preferred.
Pettit and Singer (1985) argue that not all aspects of a perfect capital market apply for
SMEs. The influence of tax consideration is limited because SMEs are less likely to generate
high profits and SMEs are therefore less likely to use debt for tax shields and, furthermore,
entrepreneurs have an adverse attitude towards losing control of the firm restricting their

12
willingness to obtain equity. Pettit and Singer’s restriction for SMEs implicate that the
Modigliani and Miller theorem is merely applicable to large firms than to SMEs.
2.1.2 Pecking order theory
Another perspective for the capital structure of firms is the pecking order theory, which
was initially described by Myers (1984) and Myers and Majluf (1984). The pecking order
suggests that there is a fixed order in how firms prefer to finance their activities. The firm will
first use internally generated funds to finance activities, if the internally generated funds are
insufficient debt finance is then preferred above new equity. The pecking order is caused by
the concept of asymmetric information, which states that the firm’s management have more
information about the firm relative to (potential) investors. Internal funds are preferred
because scrutiny, and its costs, is avoided. Because of lower information costs associated with
debt, debt finance is preferred over equity finance.
In contrast to the Modigliani and Miller theorem, the pecking order theory has been
emphasized to be applicable to SMEs (e.g. Ang, 1991; Holmes & Kent, 1991). According to
Sogorb-Mira (2005) there are two main reasons that make the pecking order pattern
applicable for SMEs. The first is that the opaqueness of SMEs, asymmetrical information, leads
to higher information costs. Higher information cost results in increased costs of financing.
The second reason is that SMEs’ management tends to maximize the control of their firm.
External finance means intrusion and dilution of ownership, therefore internal generated
funds are preferred (Hamilton & Fox, 1998; Holmes & Kent, 1991). If external funding is
required, debt results in a lower risk of losing control than equity finance. Recent work from
Mateev, Poutziouris, and Ivanov (2012) found similar results, the cash flow of firms in Central
and Eastern European SMEs are negatively related to the firms leverage. Mateev et al. suggest
that the pecking order theory is applicable to SMEs due to a lack of internal funds in contrast
to larger organizations.

13
2.1.3 Agency theory
The agency theory, as introduced by Jensen and Meckling (1976), has two assumptions.
First, that agents (e.g. SMEs management) and principals (e.g. banks) have contradicting
interests. The principal’s interest is a return on investment, while the agent is motivated by
private and economic benefits. And second, principals are not able to verify the action of the
agent because of information asymmetry. The risk that the entrepreneur acts in his own best
interest instead of the interest of the investor is recognized as the agency problem. Moral
hazard and adverse selection follow from agency problems.
Moral hazard occurs after the lending transaction, it refers to the principal’s inability to
control the agent’s behaviour due to asymmetrical information. The risk for the principal is
that the agent will act in his own interest. For instance, an entrepreneur can act
opportunistically because of high gains in a positive result, and losses are limited in the case of
negative result because other parties lose their investments when the firm defaults. When
information asymmetry between lender and borrower is mitigated, banks are more able to
control whether the management of a borrowing company acts in their interest, which is
fulfilling its financial duties to the bank (e.g. interest payment, maintaining agreed solvency
ratios). Collateral from the entrepreneur is also used to counteract moral hazard.
In contrast to moral hazard, adverse selection is caused by information asymmetry prior to
the transaction of lending (Amit, Glosten and Muller, 1990). When a lender lacks the certainty
of the provided information by the entrepreneur before entering into a contract, the lender is
unable to verify the creditworthiness of the potential investment and therefore the quality of
the investment (Van Osnabrugge, 1998). The seminal work of Akerlof (1970) describes how
asymmetric information induces agency costs. Akerlof states that buyers, in our case banks,
account for the possibility of low quality investments, but due to asymmetrical information
banks do not know the quality of a particular investment. This leads to a price adjustment for
the investment referred to as the adverse selection costs, and entrepreneurs with good
quality investment opportunities seek out for alternatives. In the loan application phase banks
collect information (e.g. business plans and financial statement) to determine the risk of
investment. Not all entrepreneurs possess the same level of ability to produce documents

14
that provides the lenders a clear view of the investment. The intended value of advisers is to
provide assistance for entrepreneurs and thereby mitigating the effects of asymmetrical
information.
The applicability of the agency theory on SMEs is determined by the extent the two afore
mentioned assumptions hold. SMEs have an incentive to take risk. They benefit from growth
while the lender is only repaid with the loan with interest and are exposed to SMEs
bankruptcy. In case of bankruptcy the personal wealth of firm owner(s), if included in the
finance agreement, limits the lenders opportunity to recover the invested capital. SMEs
incentive to take risk leads to contradicting interest from the agent and the principal, which is
in line with the first assumption.
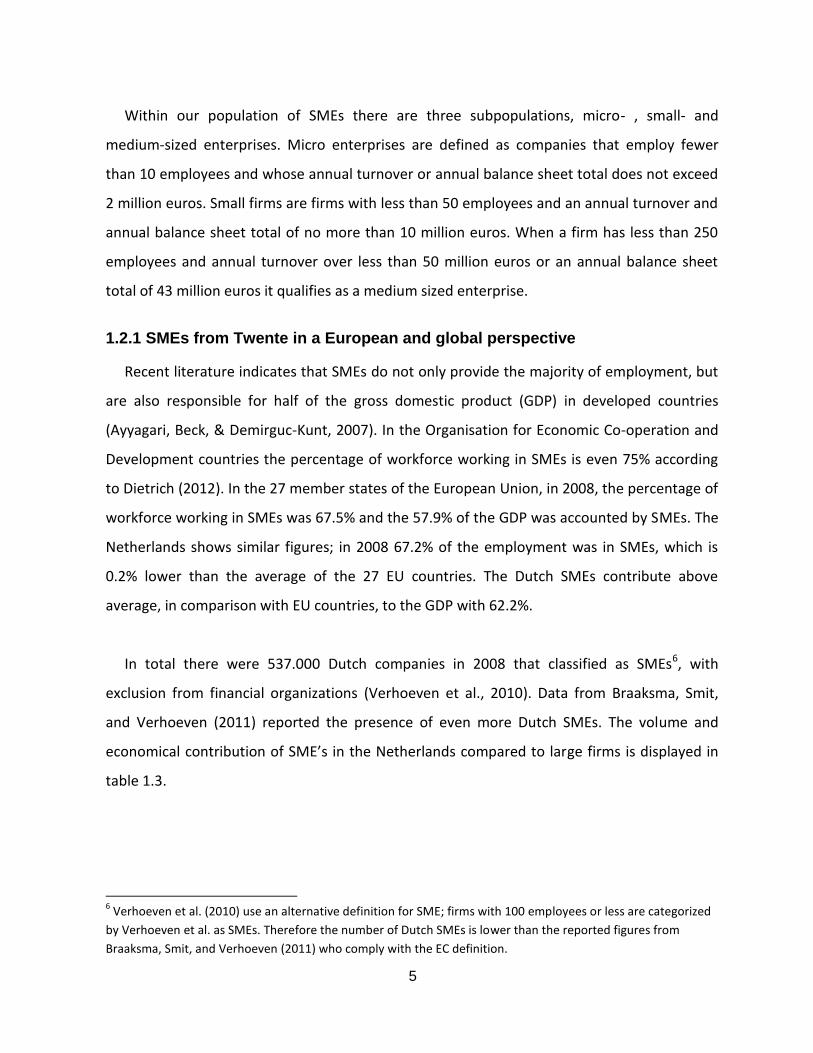
Furthermore, SMEs have limited obligations concerning publication of financial information
in the Netherlands9. In table 2.1 the obliged provided information is listed. Smaller firms are
obliged to provide less information than large firms.
The Dutch civil code (BW 2; Title 9; lid 396) states that the obliged small enterprise’s short
balance sheet at least contains: a balance sheet with its assets, current- and fixed assets
separated and liabilities. The fixed assets are divided into tangible -, intangible - and financial
assets, and the current assets are divided into stocks, accounts receivable, securities and cash
and accrued assets. The liabilities are required to be split into equity, provisions, debt and
accrued liabilities. Small enterprises also need to deposit the gross profit/loss and its
proportion to the same figure from the prior year. An explanation to the above-mentioned
posts is required, as well as changes in the revaluations reserve.
For medium-sized companies a more detailed deposit is demanded concerning the balance
sheet, their minimal requirements for the income statements are equal to those of small
companies (BW 2; Title 9; lid 397). The extended requirements for medium-sized enterprises
include the obligation to report:
9 As described in the Dutch Burgerlijk Wetboek Boek 2, titel 9, afdeling 11.

15
goodwill from third parties for intangible assets;
tangible assets into land and buildings, machinery and equipment, other fixed
assets such as tools and equipment, tangible fixed assets in progress and advance
payments on tangible assets and tangible assets that do not serve in the production
process;
financial assets into shares, share certificates and other forms of participation in
group companies, other investments, receivables from group companies and
receivables from other entities and companies that have a stake in the legal entity
or the entity which holds a participation;
receivable in the current assets into: receivables from group companies and
receivables from other entities and companies that have a stake in the legal entity
or the entity which holds a participation;
provision for tax liabilities that may arise after the year but must be allocated,
including the provision for taxes in appreciation over the acquisition or manufacture
may result in the year or a prior year and the provision for pension liabilities;
different types of the debts and their securitization: bonds, mortgage bonds and
other loans with separate disclosure of the convertible loans, debts to credit
institutions, liabilities to group companies, liabilities to legal entities and companies
that have a stake in the legal entity or the entity which holds a participation;
business purpose and the financial consequences of non-balance sheet
arrangements of the legal entity.
16
Table 2.1: Obliged financial publication by firm size10
Obliged publication Small
enterprise
Medium
sized
enterprise
Large
enterprise
Short balance sheet •
Simplified balance sheet •
Detailed balance sheet •
Simplified profit and loss account • •
Detailed profit loss account •
Limited explanation •
Detailed explanation • •
Annual report • •
Accountant statement • •
Statutory rules regarding the appropriation of
profit or loss
• •
Medium-sized – and large enterprises both need an audit. The controlling auditor can have
an unqualified opinion, qualified opinion, adverse opinion and a disclaimer of opinion
describing the rate of confidence the auditor has that the firm’s annual report resembles the
truth. The legally required data for the annual accounts for large firms are further extended
concerning their balance sheet, income statement and explanation. These are listed in the
Dutch civil code (BW 2, Title 9). Surprisingly, the firm size classification threshold for
publication obligations according to the civil code differs from the definition of the European
Commission11. Because of limited access to firm information by lenders, the second
assumption for the agency theory is also met for medium sized companies and to a further
extend to small – and micro companies.
10
source: chamber of commerce, http://www.kvk.nl/over-de-kvk/uw-inschrijving-bij-de-kamer-van-
koophandel/deponeren-jaarrekening/welke-gegevens-moet-u-in-de-jaarrekening-opnemen 11
Small firms have less than 50 employees on average, their annual turnover is less than €8.8 million and their
annual balance sheet total does not exceed €4.4 million. For medium sized companied the thresholds are
respectively 250; €35 million; and €17.5 million, firms exceeding these thresholds are classified as large firms. An
enterprise falls into a certain classification if two of the three criteria are met for two consecutive years.

17
In 2013 the obliged use of Standard Business Reporting (SBR) is introduced in the
Netherlands. SBR is enables different financial authorities, such as the tax authority and the
Chambers of Commerce, to access financial information about reporting firms. The SBR
program is adopted by several Dutch banks (ABN AMRO, ING and Rabobank). One of these
banks have started a pilot project for credit application with SBR12. With this new
development banks are able to acquire financial data that is also sent to different authorities,
which mitigates the second assumption of the agency theory, that the principal is not able to
verify the agent’s actions.
2.2 Advisory services
In the previous chapter it was shown that, according to the pecking order theory and the
agency theory, bank credit availability is hindered by information asymmetry. Persons who
can offer specialized skills and knowledge in one or more aspects that are relevant to the
company’s activities are defined as business advisers by Schaper and Jay (2003) and Bennet
and Robson (2004). Advisers can be referred to as individuals or organizations and can deliver
their intangible service verbally or provide published documentation (Stranger, 2004). Kent
(1994) and Schaper and Jay pointed out that the reason that firms use consultants is that they
provide knowledge and skill that the firm lacks. Consultants and (business) advisers are
interchangeably used terms.
In the process of credit application external business advisers provide aid for loan
application to mitigate the problem of asymmetric information (Lambrecht & Pirnay, 2005).
One of the aspects of advice, further discussed in section 2.2.2, is assistance in the process of
writing a business plan. In that aspect the adviser points out what information is valued by the
lender such as argumentation for forecasts, planned anticipation on potential threads but also
customer portfolio analysis. The reviewed literature studied different aspect of advisory
12
The ING started a pilot for credit applications up to €1 mln. (http://www.ing.nl/zakelijk/financieren/sbr/pilot-
voor-snellere-kredietaanvraag.aspx)

18
services. When authors did not specify a specific field of advisory it is referred to as business
advisory. The term financial advisory is used for advice for financial challenges.
The following section discusses the classification , aspects and impact of advisory services.
2.2.1 Classification of advice
Advisory services can be categorized into business management advisory and technical
advisory (Ndubisi, 2008). Business management advisory concerns marketing, accounting,
finance, information technology and auditing. While technical advisory is about R&D on
production technology; technical information of intellectual property; product innovation and
certification; incubator programs and assistance to technology start-ups. A similar
categorization was made by Abdullah (1999), namely management consultancy services and
quality control and design improvement services. The preparation of a business plan, the
establishment of an accounting system and cash budget and the financial viability study for
loan application are services from management consultancy. Quality control and design
improvement services include standard testing, registration for quality control, research and
development, technical extension and consultation. In consensus with Abdullah and Ahmed
and Latif (2012), Stranger (2004) states that advice can be related to management
consultancy and operational consultancy.
A distinction for business advisers made from the perspective of motivation is presented by
Johnson, Webber, and Thomas (2007), who claim that advisory services can be categorized as
market-based providers (private business consultants) and non-market providers (public
business consultants). Market-based consultancy firms (e.g. CM&P) are driven by commercial
reasons; these firms provide advice to generate revenues. While non-market providers (e.g.
Regionale Organisatie Zelfstandige Twente) are driven by non-financial factors; e.g. these
firms have a legal obligation to provide advice. SMEs use a consultant’s reputation, branding
and personal recommendations to choose an adviser (Bryson, 1997). The reputation is based
on the quality of advice, because market-based consultants are dependant from their
reputation market-based advisers are expected to be more concerned about their reputation.

19
Therefore market-based advisers are more motivated to put effort in the enhancement the
quality of their advice. The nature of the relationship between firm and adviser is another
aspect in perceived professionalism. The public business adviser lacks a contractual basis with
firms and therefore public advisers are seen as less professional (Mole, 2002).
2.2.2 Aspects of financial advice
Business management advisers provide several services that are related to credit
application. Lehtonen and Lahti (2009) identified aspects of business advisery services for
venture capitalist (VCs) that are listed in table 2.2. Even though the study of Lehtonen and
Lahti aimed at VCs only, most aspects are still applicable to the process of bank credit because
banks and VCs require identical information to assess risk and creditworthiness. Banks need
additional information whether collateral is included in the finance agreement, this
information is part of the business plan which is included in the first aspect of advice ‘writing
the business plan’. The second aspect to increase the chance of funding is ‘polishing the
business model/revenue plan’ including a strategic development in order to deliver a more
credible business proposal. When a firm’s credit proposal passes the first screening the firm
presents the plan to the bank, called the pitch. In this stage aspects of advice consist out of
‘coaching for the pitch’ and ‘assistance in negotiations’.
Some services, however, are not relevant to bank credit application because the process
for bank credit differs to the process of acquiring venture capital. The proposed aspect
‘Selecting VCs, corporate venture capitalists, foreign VCs and business angels’ is not relevant
because the different sources of equity capital is not as obvious as the presence of banks and
firms seek a fit with the VC’s, in contrast to banks, to enhance their professional network and
entrepreneurial skills. Another irrelevant aspect for bank credit is ‘Improving the valuation’.
During the aspect of business valuation improvement the adviser does not necessarily
increase the firm value. Instead the adviser provides arguments for an approximation of the
firm value. With more thorough calculations the entrepreneur has a more confident idea of
the share price, which is useful in negotiations when selling shares, i.e. in the case of VCs. In
the event of bank loan no shares of the firm are sold, leaving the aspect of ‘improving the

20
valuation’ irrelevant. Because the banks priority is the capability to repay the loan and interest
from free cash flow. Investors also value the free cash flow for dividends. However investors,
also in contrast to banks, gain also by an increase in the firm’s valuation.
Table 2.2: Aspects of advisory service
Writing the business plan
Polishing the business model/revenue plan
Coaching for the ‘pitch’
Assistance in negotiations
Decreasing the time it took to get funding
Thus, business advisers that provide management consultancy services ought to enhance
the availability of information during credit application. Van Caneghem and Van Campenhout
(2012) use a dataset from 79,097 Belgium SMEs to test the effect of the quantity and the
quality of SMEs information on the firm financial structure. They concluded that both the
quantity and the quality of provided information is positively related to SME leverage. Thus,
enhancement of the quality and the quantity of information increased the availability of debt
finance for SMEs, suggesting that it reduces perceived risk for financial institutions that may
lead to rejection for credit application. This is in line with the value of information suggested
by the ‘pecking-order’. However, Van Caneghem and Van Campenhout assumed that
information distribution precedes loan application. This relation between financial
information quality and the availability of external funds is also found by Sarapaivanich and
Kotey (2006).
2.2.3 Impact of financial advice
The effectiveness of business advisory for fund attraction was first studied by Hustedde
and Pulver (1992) showing that firms without external advice were more probable to fail in
obtaining equity finance. Where as Deakins et al. (1997) concluded that external advice is
21
positively related with the survival rate for start-up companies. The relationship between
business performance and the frequency of business advice was also studied by Dyer and Ross
(2004). But the first authors who studied the effect of external advisory on credit availability
from banks are Scott and Irwin (2009). With the data from a telephone survey Scott and Irwin
reported that the use of external advisers is related to the SME’s ability to raise bank finance
in the UK. From this study, as the authors acknowledge, no causal relationship was proven but
an association was found. Han and Benson (2010) on the other hand, provided evidence for
relationship between the perceived usefulness of business advice and the accessibility of
finance for SMEs based on a study on 2500 UK SMEs.
It is the agency theory’s proposition, see section 2.1.3, that banks and entrepreneurs have
opposing interests. The effect of adverse selection is that the investor does not provide credit
because the investor is unable to verify the information from the lender (Lahti, 2012). The
adviser is dependent on his reputation by banks and entrepreneurs and is therefore expected
to enhance the perceived reliability of the information provided to the banker.
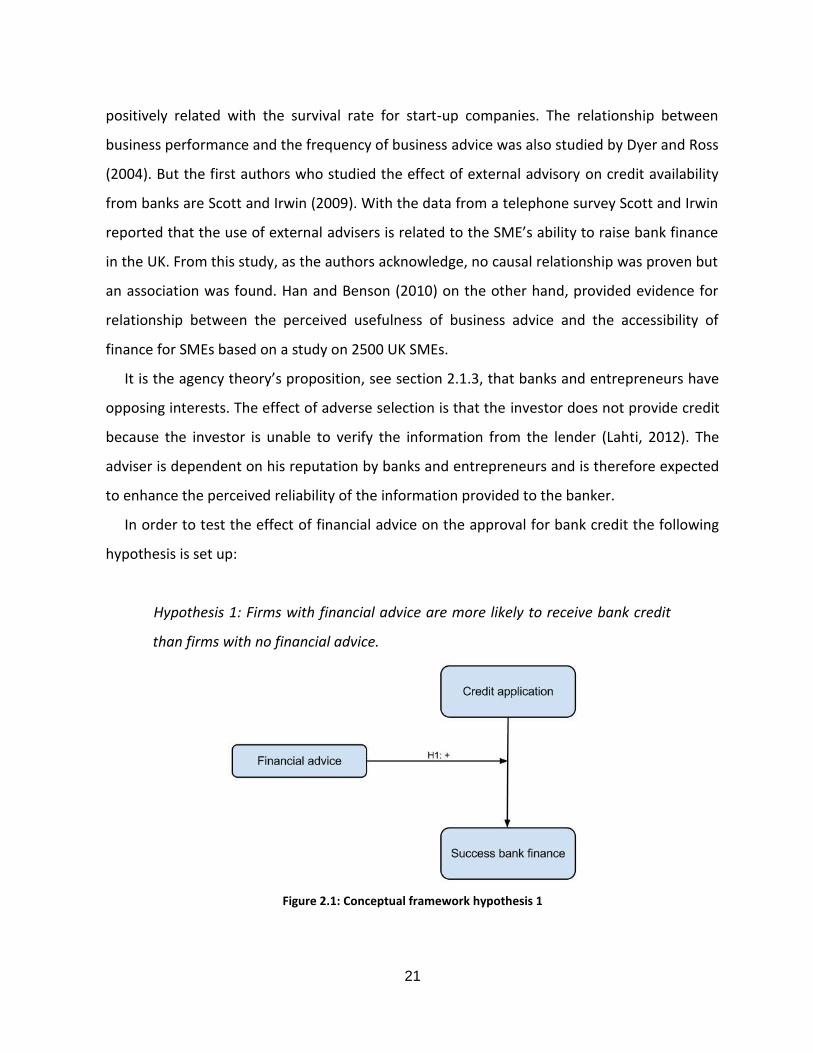
In order to test the effect of financial advice on the approval for bank credit the following
hypothesis is set up:
Hypothesis 1: Firms with financial advice are more likely to receive bank credit
than firms with no financial advice.
Figure 2.1: Conceptual framework hypothesis 1

22
Besides the agency perspective, another indication for a positive relationship for the first
hypothesis comes from Han and Benson (2010). Their findings are based on the construct
‘perceived’ usefulness, meaning that SMEs that the level of satisfaction with the performance
of the adviser have is positively related to the access to bank finance. The data Han and
Benson collected implied that support and advice are important factors to gain greater access
to finance in general. The found correlation between the use of external advice and the
accessibility to bank finance by Scott and Irwin (2009) is the second indicator of a positive
relationship.
Another study that suggests a positive relation is the study from Sheng, Rani and Shaikh
(2010) who state that the inability of providing information disclosures is seen as a weakness
in the loan application process, corresponding to the problem of information asymmetry from
the agency theory.
Not all authors are unanimous about the positive impact of business advisers. Mole, Hart,
Roper, Storey, and Saal (2007) argued, studying government supported advice, that external
advisers frequently lack understanding of the SME which requests help. In line with Mole
(2002) and Dyer and Ross (2007) found that SME advisers lack practical use, value for money
and understanding business processes.
2.3 The utilization of advisory services
Having presented the effect and categories of business advice from literature in the
previous section, the next section contains a representation of the contemporary literature on
determinants for the use of advisory services.
A study from Kool and Dewall (2002) measured the amount SMEs spend per employee
compared to large firms. They conclude that SMEs spend up to a threefold of the amount that
large firms spend, indicating that the fees for advisers do not limit the use of advice. Kool and
Dewall state that the use of advice is limited because the needed expertise and competencies

23
are available in the SME. Their instinct to be independent is another limiting factor for the use
of advice.
Lambrecht and Pirnay (2005) also found this reluctance from SMEs, concluding that the use
of external advisers may be conceived as a weakness of the entrepreneur. They found that
entrepreneurs only seek advice in the case of an acute problem that requires a urgent
solution and that vaguely formulated objectives result in excessively high expectations of the
consultants. The last limitation for successful advisory is the threat of a lack of
complementarity between entrepreneur and consultant, occurring when the expertise of the
entrepreneur and the adviser overlap and the adviser is unable to provide additional
knowledge and skills.
Looking at advice during the process of loan application not all of the above discussed
threads are applicable. Banks that see an investment opportunity but receive an (in their eyes)
insufficient elaborated loan application ask SMEs to revise their application (including
business plan). The superfluously of advisers during loan application is withdrawn when SMEs
are asked to revise. When SMEs use advisers to obtain financing the goal are clear however.
Variables that have commonly been reported correlated to the propensity of using
business advisers for SMEs are business size and business age. In the next paragraphs these
predicting variables for the use of advice are discussed.
2.3.1 Firm size as a predictor for advice
As the size of the firms increases, the complexity and quantity of challenges rises which
encourage them to seek advice (Johnson et al., 2007). Challenges can be caused by different
aspect of a growing organization. In respect to this study a relevant challenge for growing
firms is increasing bureaucratic requirements, such as increasingly extended annual report but
also loan applications. As the complexity of the firm increases banks require applicants to
identify those threats and a plan how the firm will react. Therefore firms require more

24
expertise as they grow. The growing need for expertise can be attracted in-house, with
additional employees, or external business advisers can be used.
Wood, Bryson, and Keeble (1993) also concluded that larger SMEs are significant more
likely to use external advice than smaller firms from their data from British SMEs, reasoning
that larger firms face problems that need external advisory. Bennett and Robson (1999) found
that different sources of advice show different patterns in relation to firm size and the extent
advice is used. The use advice from private sources in relation to firm size has an inverted U-
shaped distribution, in accordance with O’Farrel et al.’s findings. This relation has not been
found with public advisers, and advice from friends and relatives only declines as firm size
increases.
In the early stage of this discussion O’Farrell, Moffat, and Hitchens (1993) already
suggested that the relationship between the size of a firm and its tendency to use business
advisers is distributed as an inverted U-shape. This distribution indicates that business advice
is rarely used by micro enterprises, increasingly used my small and medium sized companies
but in a decreasing amount by large firms. The reason that large firms are less likely to use
advice than smaller firms is that larger firms have greater resources durability to remunerate
the cost of in-house expertise (Chandler, 1990). More recent evidence from Chinese SMEs for
this relationship was provided for this U-shaped distribution by Jiang and Hong (2009).
In contrast to O’Farrel et al. (1993); Jiang and Hong (2009); and Wood et al. (1993), Han
and Benson (2010) found little evidence that the propensity of using advice and firm size,
measured by total number of employees (p=0.13) and value of business assets (p=0.62) from
SMEs, is related. They argue that the contradicting findings from their study and previous
work are possibly caused by the used definition of business advice. While O’Farrel et al. use
general business advice, Han and Benson only assessed assistance in financial decision
making. Han and Benson reason that regardless of firm size, all firms have similar challenges
where they seek for advice on financial issues.
To investigate whether firm size is influential in the process of acquiring bank credit a
control variable is added to our regression model.

25
2.3.2 Firm age as a predictor for advice
As firms grow older, the need of financial expertise changes. Younger firms require aid for
initial business plans and investments, while older firms use advice for growth, survival or
performance optimization.
In the previous section the influence of firm size on the use of business advice was
discussed. O’Farrell et al. (1993) was one of the discussed articles, another predictor that
O’Farrel et al. studied was the age of a firm, which they found to be negatively related to its
tendency to use business advisers. The rationale behind the reduced need to seek business
advice as the firm ages is that with time the experience of the management accumulated. This
implicates that managers and/or owners of young SMEs require more feedback than
management in older firms (Robson and Bennett (1999).
Han and Benson (2010) found no relationship between firm age and the use of financial
assistance when they constructed the firm age as amount of years the firm has been
operating. However, Han and Benson also tested whether start-up companies (less than two
years old) where more likely to use advice than older firms. This relationship was proven to be
significant for younger entrepreneurs (p=-0.05), indicating that younger entrepreneurs need
assistance because they lack long-term experience.
On the other hand opposing the conclusions from O’Farrel et al. (1993) and Han and
Benson (2010), Schaper and Jay (2003) stated that older firms use more advisory services.
They provide evidence that there is a positive relationship between a firm’s age and its
propensity to use external advice. It is argued that more complex problems arise that need
external expertise in older firms than in young firms.
The influence of firm age is also tested by an added control variable. In section 3.3.3 a
further elaboration on control variables is given.

26
2.4 Sources of financial advice
According to Kent (1994) and Schaper and Jay (2003) SMEs use external expertise to
compensate for the lack of human capital. In the process of credit application several sources
of financial expertise are used. This chapter will continue with the review of different sources
of advice.
2.4.1 Formal versus informal advice
Amongst the sources of advice during the process of credit application entrepreneurs use
formal and informal sources of advice. Informal sources consist of friends, colleagues, and
bank employees (Han & Benson, 2010). Bank employees are considered as an informal source
because their role is the assessment of the creditworthiness of applicants and advice is not
charged (directly). Formal sources of advice originate from organizations whose role is to
provide advice to its clients, which are accountants and business advisers (Han & Benson,
2010). In the next section literature concerning advice from formal advisers is presented.
2.4.2 Advice from accountants and business advisers
The accountant’s primary task is to deliver an audit. The goal of external audit is that the
accuracy- and the non-existence of fraud in financial information are assured as well as the
going concern status of the firm (Tendeloo & Vanstraelen, 2008). Despite the double role
accountants have when they act as controller and as adviser, accountants are responsible for
a significant part of financial business advice Bennett and Robson (1999); Blackburn, Eadson,
Lefebvre, and Gans (2006); Scott and Irwin (2009).
From a survey in the UK Bennet and Robson (1999) conclude that the majority of advice
delivered to SMEs is originated from high trust specialists such as lawyers and accountants.
Bennet and Robson acknowledge the challenge for business consultants of breaking into the
advice market because specialist suppliers (e.g. accountants) can benefit from trust
originating from personal relationships and legal institutions, such as the obliged control by
accountants.

27
In the Netherlands an accountant is allowed to provide both audit and advice to the same
company at the same time, with an exception of Public Interest Entities (Wet op
accountantberoep). Public Interest Entities are organizations that have a social importance
due to its size or its function. Examples of these organizations are Dutch listed companies,
banks and insurance companies.
To measure the usefulness of various sources of financial advice given to SMEs Han and
Benson (2010) constructed a scale from 1 to 10 for the perceived usefulness for different
types of advisers. At a significance level of at least 5% it was found that the perceived value of
advice from accountant is higher than from business consultants. The firms choice to use
advice from an accountant is mere related to the quality of the relationship between the firm
and the accountant than its longevity (Gooderham, Tobiassen, Døving, & Nordhaug, 2004).
In contrast to Han and Benson (2010) it can be expected that business consultants possess
the expertise to deliver more value because they are more dedicated to providing advice,
since that is their sole purpose. This effect has been studied for advice for SMEs in the process
of acquiring venture capital by Lahti (2012). It was found that specialist advisers have a
relative high impact, which was measured by the rate of success in investment by venture
capitalists and entrepreneurs. The study from Lahti aimed at the process of acquiring venture
capital, and is therefore limited applicable in the current study. This means that the expected
higher impact rate for business consultants is also limited.
The second hypothesis tests the impact of different sources of advice. Based on findings
from Lahti (2012) and Han and Benson (2010) a positive effect is expected respectively for
hypothesis 2a and 2b. The group of ‘other’ advisers is introduced in order to test the use and
effect of formal advisers other than business consultants and accountants. Despite missing
empirical evidence, the concept of mitigation in information asymmetries also applies to this
group, which leads to the expectation of a positive relationship in H2c.

28
Hypothesis 2a: Firms with advice from business consultants are more likely to
receive bank credit than firms with no advice.
Hypothesis 2b: Firms with advice from accountants are more likely to receive
bank credit than firms with no advice.
Hypothesis 2c: Firms with advice from other sources than business consultants
and accountants are more likely to receive bank credit than firms with no
advice.
Figure 2.2: Conceptual framework for hypothesis 2
This chapter developed the hypotheses from the literature, in the next chapter the method
is presented how data is acquired and analysed to test these hypotheses where after the
result of the analysis is presented.

29
Chapter 3: Methodology and data
3.1 Survey method
It is the ambition of this study to use contemporary data from this region. The majority of
studies use international databases (e.g. SSBF, World Bank). The reason that this study collects
its own data is that the available databases, such as Reach do not contain information about
credit applications. The second reason is that the available data sets, such as ‘Reach’ and data
from the World Bank, lack a decent proxy for external financial advisory. In order to come to
valid conclusions data from a survey is required. Survey data was also used in financial
literature by De Jong and Van Dijk (2007) they stated that the use of survey data has
witnessed a revival in finance literature since the publication of Graham and Harvey (2001).
An economical argument refers to the use of web surveys instead of a mailing, which enables
the researcher to contact a large part of the targeted population at low costs. Data is collected
from the sample population from events that occurred in the past three years, which is in line
with the SSBF and De Jong and Van Dijk (2007).
3.1.1 Enhancement response rate
The response rate for a survey is considered as the greatest challenge, specific information
is required to contact respondents (Cooper & Schindler, 2008). Bartholomew and Smith
(2006) argue that social networks effects survey responses from CEOs from small firms
positively. In the region of Twente there are several networks active. The following networks
are tied to the CM&P company and are used to enforce response rates: Stichting Industiële
Kring; Verbond Nederlandse Ondernemingen - Nederlands Christelijke Werkgeversbond;
Twentse Ondernemers Sociëteit; and three chapters of Business Network International.
Bartolomew and Smith also found that research conducted in the same region leads to higher
response rates. This pre-existing relationship is determined to have a positive influence on
response rate (C. Cook, Heath, & Thompson, 2000). The use of these networks might question

30
the representativeness of respondents. With an exception of Stichting Industiële Kring, all the
other networks consist of different firms in different sectors. In the used business networks
there might be representatives from large firms. Responses that originate from large firms are
discarded.
The survey is sent to firm owners or top management because they have the required
information to complete the survey. In questions 2,3 and 6 the possibility to response with
‘unknown’ is added, therefore respondents are not forced to give an (incorrect) answer when
the respondent does not possess the required information. Survey responses that are
incomplete or include unknown answers are also discarded.
The use of incentives, such as a lottery amongst respondents, has not been proven to be
related to higher response rates (Porter & Whitcomb, 2003). This finding is in line with more
studies, but Cook et al. (2000) stated that these studies are misleading because researches
that have low response rate introduce these incentives in a later stage. No incentive is
provided to respondents because literature has not indicated its effectiveness and, as
previously stated, this study has a constraint budget.
To maximize the response rate the recipients were informed about the research project,
that responses are held anonymous and that respondents could choose to be informed on the
findings of this research project if they filled in the contact information at the end of the
survey.
3.1.2 ThesisTools as a web survey
In another study on response rate on surveys Baruch and Holtom (2008) found that
response rate from electronic surveys are just as high as or higher than the paper variant.
This, combined with the previously mentioned economical argument, is the rationale of using
web-based surveys. A follow-up reminder, by telephone, will significantly enhance the
response rate (Cook et al., 2000). Since the participation of the CM&P company in the
networks mentioned above, these contact data are available.

31
The survey tool from ThesisTools is used, there is no limit in the amount of questions
and it is possible to pose questions dependent from given responses, called routing. Routing
prevents posing questions that are not applicable. Until 500 respondents this web-based
survey is free to use, when the responses exceed this amount, the researcher will happily pay.
ThesisTools has been used by numerous master theses (e.g. Bovenlander, 2012; Veerdonk,
2012).
3.2 Regression analysis
The results from the survey are dichotomous (dependent variable, independent variable
hypothesis 1 and the control variables) and categorical (independent variable hypothesis 2).
Therefore a linear regression model is not appropriate; it would lead to prediction outside the
range from 0 to 1 since the predictors are not restricted within this range. (DeMaris, 1995).
The limitation in range is caused by the minimum and maximum of the probability and
proportion that, by definition, fall between 0 and 1. Linear regression would extrapolate the
outcome outside that range resulting in a model with little predictive use (Lottes, DeMaris,
and Adler, 1996; Pampel, 2000).
The ordinary-least square regression for a linear model also assumes that variables are
normally distributed and that the error-terms are homoscedastic, meaning that the error
terms have the same variance. Both of these assumptions are violated in a model with
dichotomous independent variables (DeMaris, 1995).
The following section explains how the data in this study is analysed followed by a section
for the method of collecting data and section for the elaboration on the constructed variables.
3.2.1 Logistic regression model in literature
Logistic regression, also referred to as logit model, is used in numerous studies with a
dichotomous dependent variable or outcome. The logistic regression model’s advantage is
that predictors do not have to be distributed in a normal way. In this study the logistic

32
regression model is used because of its advantages for interpretation and because it is widely
used in the literature on SME finance. Prior studies in that used logistic regression in financial
research are i.e. Fatoki and Odeyemi (2010); Han and Benson (2010). Fatoki and Odeymi used
a logistic regression to test the relation between firm characteristics and access to debt
finance in South Africa. Han and Benson (2010) used a logistic regression to find relations
between firm characteristics, use of support and advice, and the relationship between advice
and accessibility to finance in the UK.
3.2.2 Logistic regression model explained and applied
The logistic regressions have the following assumptions (Warner, 2008): The outcome
variable is dichotomous; outcome score are independent of each other; the model must be
defined correctly (it should include all relevant predictors and no irrelevant predictor should
be included; and the categories of the outcomes are mutually exclusive. The distribution of
the error in the model can be normal distributed or logistic distribution leading to respectively
probit or logit models. The outcomes of probit and logit are highly similar, but logit models
have an advantage in mathematical tractability and interpretability (e.g. DeMaris, 1995).
The dichotomous variable always have values of 1 or 0, the binary models solve the
problem of bounded variables by using the log of the odds. The standard equation for logistic
regression model with dichotomous outcomes is (DeMaris, 1995):
Log (π/1-π) = α + β1X1+β2X2+…+βKXK.
The odds term (π/1-π) is the ratio of probabilities from the dichotomous outcomes13, in this
study the probability of acquiring a bank loan. This lead to the following odds: pbankloan/(1-
pbankloan). The odds results in an outcome ranging from 0 to ∞, and when the natural logarithm
13
The encyclopedia of research design (2010) suggest using the terms ‘outcomes’ and ‘predictors’ rather than
relatively dependent and independent variables.

33
(log) is taken from the odds the outcome ranges from -∞ to ∞, this study models the
dependant variable, success in bank finance, as log[pbankloan/(1-pbankloan)]. Since the log odds
results in a number between minus and plus infinity it can be modelled as a linear function of
our predictors.
The left-hand side of the equation, log (π/1-π), is discussed above. On the right-hand side
there are k=1, 2,…, K predictors XK with associated coefficients βK, plus α which is a constant.
The predictors that are tested for correlation with Y are in this study the use of formal advice
from consultants, accountants and other sources, in our model these predictors are coded
respectively AdvCons; AdvAcc; and AdvOther. The control variables are coded FirmAge,
SmallFirm and MediumsizedFirm.
The models that are tested are as following:
Hypothesis 1:
Hypothesis 2:
The result of the analysis is an odd, exp(odd) is the odds ratio. Comparing the propensity of
acquired bank credit versus the propensity of not acquired bank credit.

34
In order to test the appropriateness of our proposed model and the acquired data a Chi-
squared test will be done (Salkind, 2010; Warner, 2008). The chi-squared test compares the
likelihood ratios of the estimated model with a model with a constant. The difference
between these two ratios is the chi-squared value, where a high value of Chi-squared means a
high level of appropriateness. The critical level of chi-squared to determine the significance of
the test depends on the accepted level of confidence and degrees of freedom (df). In this
study an accepted level of confidence is p<0.05. The first hypothesis has 1 degrees of freedom
and the second hypothesis has 3 degrees of freedom. Using the two-tailed p-value the
significance of the separate variable is determined. The statistical output will also present
odds ratios and the value of the betas.
3.3 Variables
This chapter presents the operationalization of the dependent variables and the
independent variables that are tested by our hypothesis. Next, the dependent and the
independent variables are constructed. The dependant variable is the phenomenon that is
attempted to be proven correlated with the independent variables, and therefore withholds
predictive capacity.
3.3.1 Dependent variable
The dependent variable is the approval of credit for SMEs from banks. Firms are classified
as ‘non-borrower’ when no credit application was done. Firms that requested credit and were
granted that credit by a bank are ‘approved borrower’. ‘Denied borrowers’ are those firms
that applied for credit but did not receive credit. When a firm was in need of credit the past
three years but did not apply for credit, because it feared rejection, is it classified as
‘discouraged borrower’ (Cole, 2012).

35
Table 3.1: SME classification by credit application need (Cole, 2009, p. 101)
Non-borrower The firm did not apply for a loan during the previous three years
because the firm did not need credit.
Discouraged borrower The firm did not apply for a loan during the previous year because
the firm feared rejection, even though it needed credit.
Denied borrower The firm did apply for a loan during the previous three years but
was denied credit by its prospective lender(s).
Approved borrower The firm did apply for a loan during the previous three years and
was granted credit by its prospective lender(s).
Credit applications, or the absence of credit application, from the past three years are
assessed, following Cole (2012) and all publications are based on data from the Survey of
Small Business Finance.
Success in bank finance is constructed as a ‘yes’ (=1) response to the seventh question of
the survey: “After your application, did you receive a loan offer for one or more banks that you
accepted?” (see appendix 1 for the entire survey). A ‘no’ response (=0) categorizes the
respondent as a denied firm (Cole, 2009). Lenders that applied for micro finance were
excluded from the sample. Hustedde and Pulver (1992) used a threshold from $100,000. In
this study a threshold of €50,000 is used because entrepreneurs with a need for micro
financing can apply for credit by Qredits14.
Important to note is that the ‘rejected borrowers’ and ‘discouraged borrowers’ groups may
be under represented due to survivorship bias, firms that were in need of credit and did not
get bank finance may have gone bankrupt. Firms that applied only for microfinance were
treated as non-borrowers.
14
Qredits is a partnership of ABN AMRO, ING Netherlands, Rabobank Netherlands, Triodos Bank and Bank of
Dutch Municipalities and is made possible thanks to the financial support of the Ministry of Economic Affairs,
Agriculture and Innovation, the Ministry of Social Affairs and Employment and the Fund working on Housing.
36
3.3.2 Independent variables
For the first hypothesis the effect of advice on loan availability is tested. The advice
variable is the yes (=1) or no (=0) response from the survey whether the firm paid for financial
advisory in the process of credit application different aspects (as shown in table 2.2), which is
question eleven from the used survey. Respondent were asked to fill in for each aspect
whether they: used advice from a business consultants, - an accountants, - another source or
did not pay for advice in order to test hypothesis 2. When no advice was used, all independent
variables are valued as 0 and this is the reference variable. The criterion ‘paid’ advice rules out
informal advice that can interpreted in multiple ways.
3.3.3 Control variables
Our analysis aims to reveal the relationship between advice and success in bank finance.
The implementation of control variables tests whether the measured effect is caused by other
variables. The debate in the literature is presented in section 2.3.1 and 2.3.2 concerning the
use of advice and respectively firm size and firm age, therefore these variables are also
inserted in our regression model to ensure that our model is not exposed to an omitted
variable bias.
The size of a firm can be constructed in various ways. Authors have constructed this
variable for example as the value of business assets (e.g. Van Caneghem and Van
Campenhout, 2010; Han and Benson, 2010; Johnson et al., 2007) and as the number of
employees (Bennet and Robson, 1999; Han and Benson, 2010; Johnson et al., 2007). This
study follows the construct of EC classification because the targeted respondents are
expected to know by heart in which classification they fall. Furthermore, the EC classification
is close to the classification used by the Dutch tax authority, as discussed in section 2.1.3. The
construct of the EC classification is chosen to enable us to test the influence of differing tax
rules concerning obliged information publication for the various business sizes. Likewise, the
study of Ahmed and Latif (2012) constructed firm size as locally defined classifications.

37
The second control variable, firm age, has been constructed as the (natural log) of
incorporation of the firm (e.g. Van Caneghem and Van Campenhout; 2010). Han and Benson
(2010) tested the influence of firm age with regard to the use of financial assistance. An
influence of firm age was only proven between starters and non-starters, the construct of
total operating years resulted in no relation. This study follows Han and Benson and controls
for the dummy variable whether a firm is a starter (less than 2 operating years) or not.
In this chapter it has been set out which variables are included in our models and how
these models are going to test the proposed hypotheses using logistic regression models. The
next chapter discusses the outcome of our analysis.

38
Chapter 4: Results
First, this chapter provides a representation of the collected data based on the method
described in the previous chapter. Then the results of the empirical tests, the logistic
regression, are shown.
4.1 Data description
4.1.1 Response rate
The method to motivate respondents, as described in the previous chapter, resulted in a
response of 158 respondents. A total of 426 entrepreneurs were sent a personal invitation to
participate in our survey. The theoretical maximum response rate is therefore 37%
(=158/426). In this survey it is a theoretical maximum because open invitations were sent to
LinkedIn groups for Entrepreneurs in Twente. A response rate of 50% is desirable for surveys
according to Babbie (2004), however the survey was sent to firm owners/managers. Baruch
(1999) reviewed the response rate from questionnaires sent to (top) management and
concluded that the average response rate was 36.1%. In this perspective our response rate is
not bad. The survey results are shown in table 4.1. in the chapter that follows the results are
interpreted.

39
Table 4.1: Survey results
Characteristic Frequency Percentage
Firm Size (n=113)
Micro 51 45%
Small 36 32%
Medium sized 26 24%
Startup company (n=113)
Yes 12 11%
No 101 89%
Borrower typology (n=113)
Non-borrowers 67 59%
Discourages borrower 2 2%
Denied borrower 8 7%
Approved borrower 36 32%
Use of advice (n=44)
Yes 27 61%
No 17 39%
Source of advice (n=27)
Accountant 16 59%
Business consultant 12 44%
Other 6 22%
Aspect of advice (n=27)
Writing the business plan 10 37%
Polishing the business model/revenue plan 14 52%
Coaching for the ‘pitch’ 23 85%
Assistance in negotiations 18 67%
Decreasing the time it took to get funding 11 41%
Other aspect 9 34%

40
4.1.2 Response descriptives
The entire group of responses included responses which are incomplete (n=10), included
unknown responses (n=10), had responses of firms which headquarter is not located in
Twente (n=12) and responses from firms that do not classify as a SME (n=11). After removal of
these responses the total useful sample size is 113 respondents. The distribution of responses
as described above is graphical displayed in figure 4.1.
Figure 4.1: Distribution of survey responses (n=158)
From our dataset 45% of the respondents work in a micro enterprise, 32% in a small
enterprise and 24%15 in a medium sized company. Compared to data from CBS (2010) relative
large part of the responses came from small and medium sized enterprises, CBS reported the
distribution of micro -, small - and medium sized firms as respectively 92%, 7% and 1%.
Concerning the age of firms, for the first control variable, the majority of the firms are
established companies, 11% reported to be a starter.
15
Rounding up caused the sum of the percentages to exceed 100%.
Useful responses
Incomplete responses
Responses with'unknown'
Non-Twente Responses
Non-SME responses

41
More than half the firms (59%) are classified as non-borrowers. When firms applied for
micro finance they are included in the non-borrower group (n=8). The second largest group is
the approved borrowers (32%), which consist of firms that received an offer from one or more
banks that the firm has accepted. In the case a firm did receive an offer from the bank, and
rejected it because the need for finance was expired they are treated as non-borrowers. The
third group, the denied borrower consisted of 7% and 2% of the respondent belonged to the
group discouraged borrower.
Only the data from responses that applied for bank finance are included, consisting out of
denied - and accepted borrowers (n=44).
Figure 4.2: Distribution of useful responses (n=113)
From the firms that applied for bank finance 61% used one or more formal advisory
services. Which is less than Bennett and Robson (1999), who found that 95% of their surveyed
firms (n=2547) used advice from at least one source. The difference can be explained in two
ways. First, Bennet and Robson included formal - and informal advice sources, while this study
Non-borrowers
Denied borrowers
Accpted borrowers
Discouraged borrowers

42
focuses only on formal advice. And second they surveyed in a British context when their
government supported advice via Business Link.
Accountants are the most reported source of advice (59%) followed by business
consultants (44%), and almost a quarter reported to have used another source for formal
advice (22%). The most commonly reported aspect that was advised for was coaching for the
pitch with 85%. The usage of the other aspects, in descending order, is assistance in
negotiations (67%); polishing the business model/revenue plan (52%); decreasing the time it
took to get funding (41%); writing the business plan (37%); and other aspects (34%)(see figure
4.3). The shown percentages indicate how often a specific aspect of advice was used from
respondent that reported to have used advice, since more than one aspect is optional the sum
of percentages exceed 100%.
Figure 4.3: Reported used aspects of advice
0%10%20%30%40%50%60%70%80%90%

43
4.2 Regression analyses
The next step is to use the collected data on the use of advice and the success in bank
finance in the logistic regression to analyse the proposed hypothesis.
In the logistic regression the dependent dichotomous variable is set to one if the firm
has received an offer from one or more banks that was accepted in the past three years, and
zero otherwise. In section 2.2.3 it was discussed that based on previous studies and the
agency theory it is expected that the use of advice is positively related to the propensity of
success in bank finance.
Table 4.2 presents the results of the logistic regression analysis. The reported figures
followed by the independent variables are the measured coefficients and the parenthesized
figures report the p-value of a two-tailed test. Model i and iv exclude both control variables,
and model ii and v only include de dummy variable ‘starter’ as a construct of firm age. These
models provide insight in the measured effect of advice without the implementation of all
control variables. The analysis to test our hypotheses uses the models that included both
control variables as in the proposed regression models in section 3.2.2.
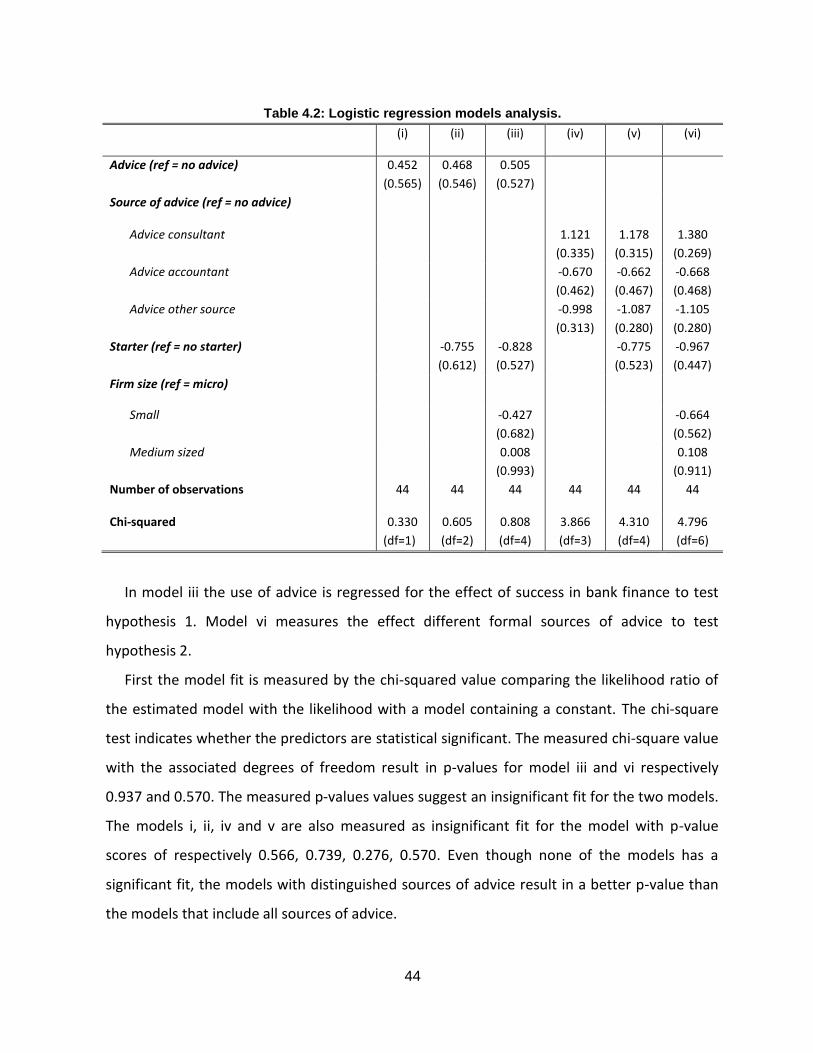
44
Table 4.2: Logistic regression models analysis.
(i) (ii) (iii) (iv) (v) (vi)
Advice (ref = no advice) 0.452
(0.565)
0.468
(0.546)
0.505
(0.527)
Source of advice (ref = no advice)
Advice consultant 1.121
(0.335)
1.178
(0.315)
1.380
(0.269)
Advice accountant -0.670
(0.462)
-0.662
(0.467)
-0.668
(0.468)
Advice other source -0.998
(0.313)
-1.087
(0.280)
-1.105
(0.280)
Starter (ref = no starter) -0.755
(0.612)
-0.828
(0.527)
-0.775
(0.523)
-0.967
(0.447)
Firm size (ref = micro)
Small -0.427
(0.682)
-0.664
(0.562)
Medium sized 0.008
(0.993)
0.108
(0.911)
Number of observations 44 44 44 44 44 44
Chi-squared 0.330
(df=1)
0.605
(df=2)
0.808
(df=4)
3.866
(df=3)
4.310
(df=4)
4.796
(df=6)
In model iii the use of advice is regressed for the effect of success in bank finance to test
hypothesis 1. Model vi measures the effect different formal sources of advice to test
hypothesis 2.
First the model fit is measured by the chi-squared value comparing the likelihood ratio of
the estimated model with the likelihood with a model containing a constant. The chi-square
test indicates whether the predictors are statistical significant. The measured chi-square value
with the associated degrees of freedom result in p-values for model iii and vi respectively
0.937 and 0.570. The measured p-values values suggest an insignificant fit for the two models.
The models i, ii, iv and v are also measured as insignificant fit for the model with p-value
scores of respectively 0.566, 0.739, 0.276, 0.570. Even though none of the models has a
significant fit, the models with distinguished sources of advice result in a better p-value than
the models that include all sources of advice.

45
It has been noticed that our models are statistically weak. A further analysis is given but the
low statistical significancy should be taken into account. The regression in results in the
following equations for respectively hypothesis 1 and 2:
The odds ratio is equal to exp (coefficient) and is a measure to indicate how or less the
probability is of the dependent variable when the scores of one independent variable is
compared. In the first hypothesis the coefficient for the use of advice is 0.505, resulting in a
odds ratio of 1.656 which in suggests that the acceptance of credit applications is 65.6%
higher for firms that used advice relative to firms that did not use advice. This effect was also
found by Lahti (2012) and Scott and Irwin (2009).
The odds ratios for advice from consultants, accountants or other sources are respectively
3.975, 0.935 and 0.33. The odd ratio of consultant indicates that the use of this source of
advice nearly quadruples the probability of acceptance for bank credit, while the other
sources seem to have a negative influence. These results are in line with the findings of Han
and Benson (2010) and Lahti (2012).
This paragraph has shown that the acquired data did not provide evidence that the use of
advice is correlated to the propensity of acquiring successful bank finance. The next chapter
discusses these outcomes.

46
Chapter 5: Conclusions and Discussion
This chapter provides an overall conclusion, insight in possible causes and implications for
our results and a discussion of our findings.
5.1 Conclusion
Using logistic regression on local data from the region of Twente no significant effect was
found between the use of advice and success in bank finance by SMEs. Therefore the first
hypothesis ‘Firms with financial advice are more probable to receive bank credit than firms
with no financial advice’ is not accepted. Our conclusion contradict findings from Scott and
Irwin (2009) and Han and Benson (2010), but our findings provide support for Dyer and Ross
(2004); Mole et al. (2007) who doubt the overall quality of business advisers.
No separate source of advice, in contrast to Lahti (2012), has been found (more)
correlated. This leads to the rejection second hypothesis, ‘Firms with advice from business
consultants are more probable to receive bank credit than firms with advice from other
sources’. The estimated coefficients of advice from business consultants, in contrast to other
sources, are positive in model ii to iv. The weak statistical significance withholds the
conclusion that advice from consultants is stronger related to success in bank finance for
SMEs than other sources of advice.
The rejection of both hypotheses from a sample of 44 respondents leads to the conclusion
that we found no relation between financial advisory and enhanced success in bank finance
for SMEs.

47
5.2 Representativeness of acquired survey data
Only 7% of the respondents from our survey were denied by banks. This is substantial less
than the 2010 SME rejection rate by banks as measured by CBS (2011), showing a rejection
rate of 22.5%. The relative low share of denied borrowers can have three causes.
The first possibility is that it reflects the population properly, implicating that the proposed
model is rejected on proper grounds - meaning that advice does not lead to more success in
bank finance. The second explanation is that our sample data are not representative for the
population. The used business networks and LinkedIn groups are considered to enable contact
a representative sample. A more plausible cause for unrepresentative data is the presence of
survivorship bias. Driven by Darwinian evolution, in a competitive environment, weaker do
not survive leading to bankruptcy., Survivorship bias is “…a potentially important issue in any
empirical financial research” (Gilbert & Strugnell, 2010, p. 31).
The problem with survivorship bias in relation to this study is that our method of data
collection was unable to collect denied borrowers that did not survive. The used business
network to contact potential respondents only consists out of survivors with the exception of
one respondent who was unwilling to participate in the survey. Respondents who are
contacted via LinkedIn were addressed at a personal title, when their firm did not survive they
could have provided non-survivor data.
Survivorship bias is caused by obtaining data from entrepreneurs, who are unlikely to
provide information about bankrupt enterprises. Cooperation with banks, which possess a
complete dataset on number of applications and acceptance of firms, would counteract on
the influence of survivorship bias. A challenge arises when the use of advice is to be coupled
with bank finance success rate because it requires firm specific data that contradicts the
anonymity of respondents.
A third explanation for possible unrepresentative data can be found in the quantity of
useful survey responses. From a total of 159 responses only 28% (n=44) was usable for the
empirical analysis. An increase in sample size would increase the possible representativeness
of our data.

48
5.3 Validity of research
The quality of our data can also influence the outcome. Responses of good quality reflect
the truth. Poorly posed questions, which are misunderstood by respondents, negatively
influence the dataset. The survey was pretested and adjustments were made, however this is
no guarantee for the absence of misinterpretations. All of the relevant and complete
responses in this research were treated as the truth, however no data was, and could be,
verified. All outcomes of this research are based on perceived elements from entrepreneurs.
Anonymity, used to enhance responses, obstructed verification of factual data. Omitting
anonymity enables researcher to add robustness, by using multiple sources of data.
Furthermore, it was assumed that respondent were able to correctly assess the use of
advice, the presence of a loan application and success in bank finance. If this assumption is
false the construct validity is threatened. Construct validity is the extent to which
operationalized variables cover the intended concepts (T. D. Cook & Campbell, 1979). Correct
perceived responses can harm the construct validity if the use of advice is an inappropriate
measure to counter information asymmetry and therefore selection costs.
5.4 Advice as mitigation for information asymmetry
From this study the conclusion is drawn that no relationship is proven. In section 5.2 the
thread of unrepresentative data is discussed. However, in the case that our obtained data is
representative there are two possibilities. Either the use of advice does not lead to an
increased propensity of success in bank finance, or our proposed model has omitted
influential variables.
The pecking order theory, as described in section 2.1.2, states that information asymmetry
results in enhanced information costs. Either the use of advice did not lead to a decrease in
information costs leading to a significant increase in success in bank finance, or these
information costs have reduced and other aspects limited success in bank finance. Other
aspects might include the focus on entrepreneurial independency, as mr Haandrikman stated.
49
In chapter 2.3 it was discussed that the use of advice is limited because the needed
expertise and competencies are available in the SMEs. This is in line with our finding that the
use of advice does not lead to a significant increased propensity of success in bank finance.
The study from ING (2000) stated that not all entrepreneurs need advisory services. Within
this line of reasoning we found that the most frequently used aspects of advice are coaching
for the pitch and assistance in negotiations, implicating that the contribution of advisers lies
merely in the knowledge of the process of loan application than improving business plans and
loan application reports.
This study lacked a proxy for the entrepreneur´s financial expertise to compare to effect of
advice on success in bank finance between entrepreneurs with - and without financial
expertise, as a construct for complementarity between adviser and entrepreneur Lambrecht
and Pirnay (2005).
A future threat for the use of advice is the SBR Program that is introduced in 2013 as
described in section 2.1.3. Following the current trend, banks are able to acquire financial data
in a standard format that is also used by authorities. Since it is obliged to report in the format
of SBR, the added value in the process of constructing a credit application decreases.
However, the credit applications solely based on SBR data are relevant for firm that have
shown to be creditworthy based on historical figures. For credit application based on future
plans advisers solely SBR data is insufficient.
5.6 Recommendations for future research
There are several recommendations for future research concerning the use of survey data
to determine the effect of advice on bank finance success. First, the quantity of data is a major
challenge when researchers collect data with a survey. The use of local business networks is
an effective way of acquiring responses from (top) management. To enhance responses more
business networks can be used such as other local chapter from Business Network
International, MKB Nederland, MKB Netwerkorganisatie and RedPeppers. Furthermore an

50
analysis of differences between Dutch COROP (as discussed is section 1.2.1) areas points out
whether research can be done on a larger scale since entrepreneurs are addressed nation-
wide without increasing costs. The second thread of the representativeness of our data can be
partially mitigated by increasing responses. But data collection that excludes survivorship bias
is recommended, meaning that data can be triangulated via data from banks or data
originates from banks who receive applications.
Furthermore we have discussed that our proposed relationship might vary with the
entrepreneurial characteristic of financial expertise. An increased dataset provides more
insight in the influence of that characteristic and the effect of advice for SMEs, and other
potentially intervening variables such as firm size and age.
The need for financial advice is possibly dependent on firm specific environment and
resources. Which is not necessarily trivial knowledge because businesses that possess
financial expertise were expected to reduce information asymmetry between entrepreneur
and the bank, reducing selection costs and thereby increasing the rate of accepted loan offers
by SMEs. But future researchers are recommended to test a contingency fit.
51
References
Abdullah, M. A. (1999). The accessibility of the government-sponsored support programmes
for small and medium-sized enterprises in Penang. Cities, 16(2), 83-92.
Ahmed, S. A. & Latif, I. A. (2012). The effectiveness of public advisory services: What are the
important factors? International Journal of Business and Management, 7(23), 19-30.
Akerlof, G. A. (1970). The market for “lemons”: Quality and the market mechanism. Journal of Economics Quarterly, 84, 488-500.
Amit, R., Glosten, L., & Muller, E. (1990). Entrepreneurial ability, venure investment and risk sharing. Management Science, 36(10), 1232-1245.
Ang, J. S. (1991). Small business uniqueness and the theory of financial management. The Journal of Small Business Finance, 1(1), 1-13.
Ayyagari, M., Beck, T., & Demirguc-Kunt, A. ( 2007). Small and Medium Enterprises across the Globe. Small Business Economics, 29(4), 415-434.
Babbie, E. (2004). The Practice of Social Research. Belmont: Thomson. Bartholomew, S., & Smith, A. D. (2006). Improving survey response rates from chief executive
officers in small firms: the importance of social networks. Entrepreneurship Theory and Practice, 30(1), 83-96.
Baruch, Y. (1999). Response rate in academic studies: A comparative analysis. Human Relations, 52, 421-438.
Baruch, Y., & Holtom, B. C. (2008). Survey response rate levels and trends in organizational research. Human Relations, 61, 1139-1160.
Bennet, R. J., & Robson, P. J. A. (2004). The role of trust and contract in the supply of business advice. Cambridge Journal of Economics, 28, 471-488.
Bennett, R. J., & Robson, P. J. A. (1999). The use of external business advice by SMEs in Britain. Entrepreneurship & Regional Development, 11(2), 155-180.
Blackburn, R., Eadson, W., Lefebvre, R., & Gans, P. (2006). SMEs, regulation and the role of the accountant (Vol. 96). London: ACCA.
Boer, de, M. 2013, May the 2nd. ECB verlaagt rente tot historisch lage 0,5%, Financeel Dagblad.
Boonstra, W. W., & Groeneveld, H. (2010). Fabels en feiten over de mkb-kredietverlening. Zoetermeer: Economisch Instituut voor het Midden- en Kleinbedrijf.
Bovenlander, A. (2012). Verbinding in de sportsector: Een onderzoek naar de relatie tussen tevredenheid en betrokkenheid van medewerkers in de sportsector. Master Thesis, University Twente, Enschede.
Braaksma, R., Smit, L., & Verhoeven, W. (2011). Financieringsmonitor 2011; Onderzoek naar de financier ing van het Nederlandse bedrijfsleven. Zoetermeer: Economisch Instituut voor het Midden- en Kleinbedrijf.
Bryson, J. R. (1997). Business service firms, service space and the management of change. Entrepreneurship & Regional Development: An International Journal, 9(2), 93-112.
Chandler, A. (1990). The enduring logic of industrial success. Harvard Business Review(March-April), 130-140.
Cole, R. A. (2012). Who needs credit and who gets credit? Evidence from the Surveys of Small Business Finances. Paper presented at the In Small Business in Focus: Finance.

52
Cook, C., Heath, F., & Thompson, R. (2000). A meta-analysis of response rates in web- or internet-based surveys. Educational & Psychological Measurement, 60(6), 821-836.
Cook, T. D., & Campbell, D. T. (1979). Quasi-experimentation: design and analysis for field settings. Chicago, Illinois: Rand McNally.
Cooper, D. R., & Schindler, P. S. (2008). Business Research Methods. New York: McGraw-Hill.
Daskalaksis, N., & Psillaki, M. (2009). Do country or firm factors explain capital structure? Evidence from SMEs in France and Greece. Applied Financial Economincs, 18, 87-97.
Deakins, D., Jennings, P., & Mason, C. M. (1997). Small firms : entrepreneurship in the nineties. London: Published on behalf of the Institute for Small Business Affairs by Paul Chapman Publishing.
DeMaris, A. (1995). A Tutorial in Logistic Regression. Journal of Marriage and the Family, 57, 956-968.
Dietrich, A. (2012). Explaining loan rate differentials between small and large companies: evidence from Switzerland. Small Business Economics, 38(4), 481-494.
Dyer, L. M., & Ross, C. R. (2004). Seeking advice in a dynamic and complex business environment: Impact on the success of small firms. Journal of Developmental Entrepreneurship, 13(2), 133-149.
Fatoki, O., & Odeyemi, A. (2010). Which New Small and Medium Enterprises in South Africa Have Access to Bank Credit. International Journal of Business and Management, 5(10), 128-136.
Gessel-Dabekaussen, G. v. (2011). Het midden- en kleinbedrijf naar regio. Den Haag. Gilbert, E., & Strugnell, D. (2010). Does survivorship bias really matter? An empirical
investigation into its effects on the mean reversion of share returns on the JSE (1984-2007). Investment Analysts Journal, 72(31-42).
Gooderham, P. N., Tobiassen, A., Døving, E., & Nordhaug, O. (2004). Accountants as Sources of Business Advice for Small Firms. International Small Business, 22(1), 5-22.
Graham, J. R., & Harvey, C. R. (2001). The theory and practice of corporate finance: Evidence from the field. Journal of Financial Economics, 61, 187-243.
Hamilton, R. T., & Fox, M. A. (1998). The Financing Preferences of Small Firm Owners. International Journal of Entrepreneurial Behaviour & Research, 4(3), 239-248.
Han, L., & Benson, A. (2010). The use and usefulness of financial assistance to UK SMEs. Environment and Planning C: Government and Policy, 28(3), 552-566.
Holmes, S., & Kent, P. (1991). An empirical analysis of the financial structure of small and large Australian manufacturing enterprises. The Journal of Small Business Finance, 1(2), 141–154.
Hustedde, R. J., & Pulver, G. C. (1992). Factors affecting equity capital acquisition: the demand side. Journal of Business Venturing, 7, 363-374.
Jensen, M. C., & Meckling, W. H. (1976). Theory of the firm: Managerial behavior, agency costs, and ownership structure. Journal of Financial Economics, 3(4), 305-360.
Jiang, Z. X., & Hong, F. (2009). An empirical study of usage of external business services by Chinese SMEs. Journal of Enterprise Information Management, 22(4), 423–440.
Johnson, S., Webber, D. J., & Thomas, W. (2007). Which SMEs use external business advice? A multivariate subregional study. Environment and Planning A, 39(8), 1981-1997.
Jong, de, A., & Van Dijk, R. (2007). Determinants of Leverage and Agency Problems: A Regression Approach with Survey Data. The European Journal of Finance, 13(6), 565-593.
Kent, P. (1994). Management advisory services and the financial performance of clients. International Small Business Journal, 12(4), 45-58.
Kessels, M. (2011). MKB’ers kunnen moeilijker geld lenen: Centraal Bureau voor Statistiek.

53
Kool, C. H. W. & Dewal, F.A. (2002). Ondernemers over adviseurs. Een grensoverschrijdende verkenning. Amsterdam: Economisch Bureau ING.
Lahti, T. (2012). The value-added contribution of advisors in the process of acquiring venture capital. International Small Business Journal, 1-20.
Lambrecht, J., & Pirnay, F. (2005). An evaluation of public support measures for private external consultancies to SMEs in theWalloon region of Belgium. Entrepreneurship and Regional Development, 17, 89-108.
Leach, J. C., & Melicher, R. W. (2009). Finance for Entrpreneurs (3 ed.). Mason: Cengage Learning.
Lehtonen, O., & Lahti, T. (2009). The role of advisors in the venture capital investment process. Venture Capital: An International Journal of Entrepreneurial Finance, 11(3), 229-254.
Levy, Y., & Ellis, T. J. (2006). A Systems Approach to Conduct an Effective Literature Review in Support of Information Systems Research. Informing Science, 9, 181-212.
Lottes, I. L., DeMaris, A., & Adler, M. A. (1996). Using and interpreting logistic regression: A guide for teachers and students. Teaching Sociology, 24(3), 284-298.
Mateev, M., Poutziouris, P., & Ivanov, K. (2012). On the determinants of SME capital structure in Central and Eastern Europe: A dynamic panel analysis. Research in International Business and Finance(28-51).
Miller, H. M. (1988). The Modigliani-Miller propositions after thirty years. The Journal of Economic Perspectives, 2(4), 99-120.
Mees, H. 2013, March 28th. Het nieuwe bankieren, Financieel Dagblad. Modigliani, F., & Miller, M. H. (1958). The Cost of Capital, Corporation Finance and the Theory
of Investment. The American Economic Review, 68(3), 433-443. Moha, A. A. (1999). The accessibility of the government-sponsored support programmes for
small and medium-sized enterprises in Penang. Cities, 16(2), 83-92. Mole, K. (2002). Business advisers' impact on SMEs: An agency theory approach.
International Small Business Journal, 2, 139-162. Mole, L., Hart, M., Roper, S., Storey, D., & Saal, D. (2007). Economic Impact Study of
Business Link Local Service. London: Department for Business Enterprise and Regulatory Reform.
Myers, S. C. (1984). The Capital Structure Puzzle. The Journal of Finance, 39(3), 575-592. Myers, S. C., & Majluf, N. S. (1984). Corporate financing and investment decisions when firms
have information that investors do not have. Journal of Financial Economics, 13(2), 187-221.
Ndubisi, N. O. (2008). In Ahmed, S.A. and Latif, I.A. (2012). The Effectiveness of Public Advisory Services: What are the Important Factors? International Journal of Business and Management, 7(23), 19-30.
O’Farrell, P. N., Moffat, L. A. R., & Hitchens, D. M. W. N. (1993). Manufacturing demand for business services in a core and peripheral region: does flexible production imply vertical disintegration of business services? Regional Studies, 27, 385-400.
Pampel, F. C. (2000). Logistic regression: a primer. California: Thousand Oaks. Pettit, R., & Singer, R. (1985). Small Business Finance: A Research Agenda. Financial
Management, 14(3), 47-60. Porter, S. R., & Whitcomb, M. E. (2003). The impact of contact type on web survey response
rates. Public Opinion Quarterly, 67(579-588). Rivaud-Danset, D., Dubocage, E., & Salais, R. (1998). Comparison between the Financial
Structure of SME versus Large Enterprise Using the BACH Data Base. Université Paris-Nord, Paris.

54
Salkind, N. J. (2010). Encyclopedia of Research Design (Vol. 2). California: Sage Publications Inc.
Sarapaivanich, N., & Kotey, B. T. (2006). he effect of financial information quality on ability to access external funds and performance of SMEs in Thailand. Journal of Enterprising Culture, 14(3), 219-239.
Schaper, M., & Jay, L. (2003). Which advisers do micro firms use? Some Australian evidence. Journal of Small Business and Enterprise Development, 10(2), 136-143.
Scott, J. M., & Irwin, D. (2009). Discouraged advisees? The influence of gender, ethnicity, and education in the use of advice and finance by UK SMEs. Environment and Planning C: Government and Policy, 27(2), 230-245.
Sheng, Y. T., Rani, N. S. A. & Shaikh, J.M. (2010). Impact of SMEs character in the loan approval stage. International Conference on Business and Economics
Research.Kuala Lumpur: IACSIT Press. Sogorb-Mira, F. (2005). How SME Uniqueness Affects Capital Structure: Evidence From A
1994–1998 Spanish Data Panel. Small Business Economics, 25, 447-457. Stranger, A. M. J. (2004). Gender comparative use of small business training and assistance:
a literature review. Education and Training, 46, 464–473. Tendeloo, B. v., & Vanstraelen, A. (2008). Earnings Management and Audit Quality in Europe:
Evidence from the Private Client Segment Market. European Accounting Review, 17(3), 447-469.
Van Caneghem, T., & Van Campenhout, G. (2012). Quantity and quality of information and SME financial structure. Small Business Economics, 39(2), 341-358.
Van Osnabrugge, M. (1998). The financing of entrepreneurial firms in the UK: A comparison of business angel and venture capitalist investment procedures. PhD thesis, Hertford College, Oxford
Veerdonk, P. A. J. v. d. (2012). High technology business-to-business partnerships: a research on the effect of complementary capabilities on innovativeness and internationalization. Master Thesis, University Twente, Enschede.
Verhoeven, W. H. J., Essen, C. V., Folkeringa, M., Ruis, A., & Smit, C. K. (2010). Het buffervermogen van het MKB. Zoetermeer: Economisch Instituut voor het Midden- en Kleinbedrijf.
Verhoeven, W. H. J., & Smit, C. K. (2011). Financiering van MKB bedrijven. Zoetermeer: Economisch Instituut voor het Midden- en Kleinbedrijf.
Warner, M. W. (2008). Applied statistics. California: Sage Publications Inc. Webster, J., & Watson, R. T. (2002). Analyzing the past to prepare for the future: Writing a
literature review. MIS Quarterly, 26(2), 13-23. Wood, P. A., Bryson, J., & Keeble, D. (1993). Regional patterns of small firm development in
the business services: evidence from the UK. Environment and Planning A, 25, 256-700.

Appendix A: The survey

1.
In welke categorie van grootte valt uw onderneming?
De Europese Commissie hanteert de volgende verdeling waarbij het criterium van de jaaromzet OF
balanstotaal overschreden mag worden.
Micro bedrijf: Minder dan 10 werknemers + jaaromzet of balanstotaal is minder dan 2 miljoen euro.
Klein bedrijf: Minder dan 50 werknemers + jaaromzet of balanstotaal is minder dan 10 miljoen euro.
Middelgroot bedrijf: Minder dan 250 werknemers + jaaromzet minder dan 50 miljoen euro of
balanstotaal niet meer dan 43 miljoen euro.
Groot bedrijf: de rest
Een bedrijf met 40 werknemers, 9 miljoen euro omzet per jaar en een balanstotaal van 11 miljoen
euro valt dus nog onder een 'klein bedrijf'. *
Micro bedrijf
Klein bedrijf
Middelgroot bedrijf
Groot bedrijf
2.
Ligt het hoofdkantoor van uw onderneming in Twente?
De volgende gemeenten liggen in Twente: Almelo, Borne, Dinkelland, Enschede, Haaksbergen,
Hellendoorn, Hengelo, Hof van Twente, Losser, Oldenzaal, Rijssen, Tubbergen, Twenterand,
Wierden *

Ja
Nee

3.
Is uw bedrijf te typeren als startende onderneming (jonger dan 2 jaar)? *
Ja
Nee
Onbekend
4.
Heeft uw bedrijf in de afgelopen 3 jaar één of meerdere financieringsaanvraag bij één
of meerdere banken ingediend?
Iedere vorm van kredietverstrekking door de bank wordt meegenomen, voorbeelden zijn: kort- of
langlopend krediet en de mogelijkheid tot roodstand. *
Ja
Nee
Onbekend
5.
Waarom heeft u geen financieringsaanvraag gedaan bij een bank?
Meerdere antwoorden zijn mogelijk
Er was geen behoefte voor een financiering
Er werd verwacht dat de financieringsaanvraag niet geaccepteerd werd door de bank

De financieringsbehoefte is voorzien door een andere instelling dan een bank
Anders

6.
Betrof (één van) de financieringsaanvraag of -aanvragen een financiering van meer dan
€50.000?
De grens van €50.000 (microkrediet)geldt per aanvraag of project, meerdere aanvragen van dan
€50.000 gelden als microkrediet en in dat geval dient u bij deze vraag Nee te antwoorden. *
Ja
Nee
Onbekend
7.
Bij hoeveel banken heeft uw onderneming een financieringsaanvraag gedaan? *
1 bank
2 banken
3 banken
4 banken of meer
8.
Hoeveel banken hebben een offerte uitgebracht in reactie op uw
financieringsaanvraag? *

Geen
1 banken
2 banken
3 banken
4 banken of meer
9.
Heeft u, na uw aanvraag, een financieringsvoorstel van de bank gekregen dat uw
bedrijf heeft geaccepteerd? *
Ja
Nee
Onbekend
10.
Wat is de reden dat u de offerte(s) niet geaccepteerd heeft?
Meerdere antwoorden zijn mogelijk bij deze vraag.
De bank bood ongunstige rentetarieven
De bank vroeg te veel zekerheden (zakelijk en/of prive)
Andere voorwaarden dan bovenstaand waren ongunstig
Er was geen behoefte meer aan een financiering
De financiering is gelukt bij een andere instelling dan de bank

Anders

11.
Heeft u, tijdens de aanvraag van de financiering bij de bank, gebruik gemaakt van
professioneel extern advies (waarvoor betaald is) voor de volgende aspecten?
Hier gaat het expliciet om advies waarvoor betaald is voor de adviserende dienst. Gaarne voor
iedere rij aangeven wat van toepassing is.
Geen Consultant Accountant Ande
rs
Opstellen van een
business plan
Verfijnen van
bedrijfsmodel/
inkomstenmodel
Voorbereiding van
het gesprek bij de bank
Aanwezigheid bij het
gesprek bij de bank
Het proces van
financiering versnellen
Ander(e) aspect(en)
Dank voor uw tijd!