Embed Size (px)
Citation preview

Observing Unobservables: Identifying Information
Asymmetries with a Consumer Credit Field
Experiment∗
Dean Karlan and Jonathan Zinman
September 24, 2008
∗Contact information: [email protected], [email protected]. We are gratefulto the National Science Foundation, BASIS/USAID, and the Bill and Melinda Gates Foun-dation for funding research expenses, and to the Lender for implementing the experimentand financing the loans. Thanks to Jonathan Bauchet and Karen Lyons for excellent re-search assistance. Thanks to four referees, the editor Costas Meghir, seminar participants,and numerous colleagues (in particular Gharad Bryan and Chris Udry) for helpful com-ments. Much of this paper was completed while Zinman worked at the Federal ReserveBank of New York (FRBNY), and we thank FRBNY– particularly Jamie McAndrews,Jamie Stewart,and Joe Tracy– for research support. The views expressed herein are thoseof the authors and do not necessarily reflects those of our funders, the FRBNY, or theFederal Reserve System.
1

Abstract
Information asymmetries are important in theory but difficult to identify in
practice. We estimate the presence and importance of hidden information and
hidden action problems in a consumer credit market using a new field experi-
ment methodology. We randomized 58,000 direct mail offers to former clients
of a major South African lender along three dimensions: (i) an initial “offer
interest rate” featured on a direct mail solicitation; (ii) a“contract interest
rate” that was revealed only after a borrower agreed to the initial offer rate;
and (ii) a dynamic repayment incentive that was also a surprise and extended
preferential pricing on future loans to borrowers who remained in good stand-
ing. These three randomizations, combined with complete knowledge of the
Lender’s information set, permit identification of specific types of private in-
formation problems. Our setup distinguishes hidden information effects from
selection on the offer rate (via unobservable risk and anticipated effort), from
hidden action effects (via moral hazard in effort) induced by actual contract
terms. We find strong evidence of moral hazard and weaker evidence of hidden
information problems. A rough estimate suggests that perhaps 13% to 21%
of default is due to moral hazard. Asymmetric information thus may help
explain the prevalence of credit constraints even in a market that specializes
in financing high-risk borrowers.

1 Introduction
Information asymmetries are important in theory. Stiglitz and Weiss (1981) sparked
a large theoretical literature on the role of asymmetric information in credit markets
that has influenced economic policy and lending practice worldwide Armendariz de
Aghion and Morduch (1995); Bebczuk (2003)). Theories show that information fric-
tions and ensuing credit market failures can create inefficiency at both the micro and
the macro level, via underinvestment (Banerjee and Newman (1993); Gale (1990);
Hubbard (1998); Mankiw (1986)), overinvestment (Bernanke and Gertler (1990);
De Meza and Webb (1987)), or poverty traps (Mookherjee and Ray (2002)). Many
policies have been put forth to address information asymmetry problems. A better
understanding of which information asymmetries are empirically salient is critical for
determining optimal remedies, if any.
But information asymmetries are difficult to identify in practice. Empirical evi-
dence on the existence and importance of specific information frictions is relatively
thin in general, and particularly so for credit markets (Chiappori and Salanie (2000)).
Distinguishing between hidden information and hidden action is difficult even when
precise data on underwriting criteria and clean variation in contract terms are avail-
able, as a single interest rate may produce independent, conflated selection and
incentive effects. For example, a positive correlation between loan default and a ran-
domly assigned interest rate, conditional on observable risk, could be due to adverse
selection ex-ante (those with relatively high probabilities of default will be more
likely to accept a high rate) or moral hazard ex-post (because those given high rates
have greater incentive to default).1
We test for the presence of distinct types of asymmetric information problems
using a new field experiment methodology that was implemented by a South African
1See Ausubel (1999) for a related discussion of the problem of disentangling adverse selectionand moral hazard in a consumer credit market. See, e.g.,Chiappori and Salanie (2000) on theanalogous problem in insurance markets. Insurance markets have been the subject of relativelyactive interplay between theoretical and empirical contributions, but recent papers on other marketshave also made important strides towards identifying the independent effects of adverse selectionand/or moral hazard; see, e.g., Cardon and Hendel (2001) on health insurance, and Shearer (2004)on labor contracts.
3

finance company that typically lends at 200% APR. Our design randomizes interest
rates independently along three dimensions: (i) the interest rate offered in a direct
mail solicitation, (ii) the actual interest rate on the loan contract, and (iii) the interest
rate offered on future loans. The design produces borrowers who select in at identical
rates and then face different repayment incentives going forward, and borrowers who
select in at different rates and then face identical repayment incentives.
Our theoretical model shows that this design can disentangle hidden information
from hidden action effects. This ability to disentangle ex-ante selection effects from
ex-post incentive effects is critical from a policy and practical perspective. For in-
stance, hidden information problems should motivate policymakers and lenders to
consider subsidies, loan guarantees, information coordination, and enhanced screen-
ing strategies. Hidden action problems should motivate policymakers and lenders
to consider legal reforms in the areas of liability and garnishment, and enhanced
dynamic contracting schemes.
The model also highlights an interesting limitation of the design for testing theory:
it can only isolate the effect of classic adverse selection (on risk type alone) if there
is no hidden action effect (i.e., no moral hazard in effort). Otherwise the design
identifies the reduced-form combination of any classic adverse selection effect and an
effect of selection on anticipated effort that may either reinforce or offset any classic
adverse selection.
Our empirical results indicate weak evidence of hidden information and strong
evidence of economically significant moral hazard. A rough estimate suggests that
moral hazard explains perhaps 13% to 21% of default in our sample. Information
asymmetries thus may help explain the prevalence of credit constraints even in a
market that specializes in financing high-risk borrowers at very high rates.
2 Market and Lender Overview
Our cooperating Lender operated for over 20 years as one of the largest, most prof-
itable micro-lenders in South Africa. It competed in a “cash loan” industry segment
that offers small, high-interest, short-term, uncollateralized credit with fixed monthly
4

repayment schedules to a “working poor” population.2
Cash loan borrowers generally lack access to traditional institutional sources such
as commercial banks. Cash loan sizes tend to be small relative to the fixed costs of
underwriting and monitoring them, but substantial relative to a typical borrower’s
income. For example, the Lender’s median loan size of R1000 ($150) was 32% of its
median borrower’s gross monthly income.
Cash lenders arose to substitute for traditional “informal sector” moneylenders
following deregulation of the usury ceiling in 1992, and they are regulated by the Mi-
cro Finance Regulatory Council (MFRC). Cash lenders focusing on the observably
highest-risk market segment typically make one-month maturity loans at 30% inter-
est per month. Informal sector moneylenders charge 30-100% per month. Lenders
targeting observably lower risk segments charge as little as 3% per month.3
Our cooperating Lender’s product offerings were somewhat differentiated from
competitors. It did not pursue collection or collateralization strategies such as direct
debit from paychecks, or physically keeping bank books and ATM cards of clients. Its
pricing was transparent and linear, with no surcharges, application fees, or insurance
premiums added to the cost of the loan. The Lender also had a “medium-maturity”
product niche, with a 90% concentration of 4-month loans (Web Appendix Table
1a). Most other cash lenders focus on 1-month or 12+-month loans. The Lender’s
normal 4-month rates, absent this experiment, ranged from 7.75% to 11.75% per
month depending on observable risk, with 75% of clients in the high risk (11.75%)
category.
Per standard practice in the cash loan market, essentially all of the Lender’s
underwriting and transactions were conducted face-to-face in its network of over 100
2Aggregate outstanding loans in this market segment equal 38% of non-mortgage consumercredit Department of Trade and Industry South Africa (2003).
3The cash loan market has important differences and similarities with ”traditional” microcredit(e.g., the Grameen Bank, or government or non-profit lending programs). In contrast to our setting,most microcredit has been delivered by lenders with explicit social missions that target groups offemale entrepreneurs, sometimes in group settings. On the other hand, the industrial organizationof microcredit is trending steadily in the direction of the for-profit, more competitive delivery ofindividual, untargeted credit that characterizes the cash loan market (Porteous (2003); Robinson(2002)). This push is happening both from the bottom-up (non-profits converting to for-profits) aswell as from the top-down (for-profits expanding into microcredit segments).
5

branches. Its risk assessment technology combined centralized credit scoring with
decentralized loan officer discretion. Rejection was prevalent even with a modal
rate of 200% APR; the Lender denied 50% of new loan applicants. Reasons for
rejection included unconfirmed employment, suspicion of fraud, poor credit rating,
and excessive debt burden.
Applicants who were approved often defaulted on their loan obligation, despite
facing several incentives to repay. Carrots included decreasing prices and increasing
future loan sizes following good repayment behavior. Sticks included reporting to
credit bureaus, frequent phone calls from collection agents, court summons, and
wage garnishments. Repeat borrowers had default rates of about 15%, and first-time
borrowers defaulted twice as often.
3 Experimental Design and Implementation
The sample frame consisted of 57,533 former clients4 with good repayment histories
from 86 predominantly urban branches. Everyone in the sample frame had borrowed
from the Lender within the past 24 months and did not have a loan outstanding
in the thirty days prior to the mailer. Web Appendix Tables 1a and 1b present
summary statistics on the sample frame and the sub-sample of clients who obtained
a loan in this study. The Lender assigns prior borrowers into “low,” “medium,” and
“high” risk categories, and this determines the borrower’s loan pricing and maturity
4Information asymmetries may be less prevalent among former clients than new clients if hiddentype is revealed through the lending relationship (Elyasiani and Goldberg (2004)). Hence there isreason to expect that a lender faces more adverse selection among new clients (those who have notpreviously done business with the firm). The Lender tried addressing this possibility by sendingsolicitations to 3,000 individuals from a mailing list purchased from a consumer database. Onlyone person from this list borrowed. Another list was purchased from a different vendor, and 5,000letters were sent without randomized interest rates. Only two people responded. The Lender hadno previous experience with direct mail solicitation to new clients, and concluded that the lack ofresponse was due to low-quality (fraudulent or untargeted) lists from the consumer database firms,or to consumer unfamiliarity with receiving a solicitation from a firm they have not done businesswith in the past. In general, unsolicited direct mail is not common in South Africa, but individualsare accustomed to receiving mail from firms with which they do business (e.g., the Lender mailssolicitations and monthly statements to prior and existing clients).
6

options under normal operations.
3.1 Experimental Design and Integrity
The experiment was conducted in three waves: July, September and October 2003.
In each wave clients were randomly assigned three interest rates conditional on their
observable risk category. Rate ranged from an upper bound of the prior interest rate
for each individual to a lower bound of 3.25% per month (see Web Appendix Tables
8 and 9 for details on the rate distributions). The offer rate rowas featured on the
direct mailer. The contract and future rates rc and rf were only revealed to clients
and loan officers if the client tookup the offer (i.e., applied), and after the loan officer
completed her initial underwriting (Web Appendix Figure 1 shows the experimental
operations, step-by-step).5
Our design contains built-in integrity checks for whether rc and rf were indeed
surprises: both client takeup and loan officer approve/reject decisions were uncorre-
lated with the surprise rates (Web Appendix Table 2, Columns 4 and 5). Nor were
there any instances of clients applying for the loan, being approved, and then not
taking out the loan. This fact further corroborates that the contract rate and dy-
namic repayment incentive were surprises; i.e., that borrowers made takeup decisions
with reference to ro only.
5,028 (8.7%) clients tookup the offer by applying for a loan. Clients applied by
entering a branch office and filling out an application in person with a loan officer.
Loan applications were taken and assessed as per the Lender’s normal underwriting
procedures. The loan application process took at most one hour, typically less.
Loan officers first updated observable information (current debt load, external credit
report, and employment information) and decide whether to offer any loan based on
their updated risk assessment. 4,348 (86.5%) of applicants were approved. Next loan
officers decided the maximum loan size and maturity for which applicants qualified.
5Web Appendix Table 2, Columns 1-3 shows that, as one would expect, the randomly assignedrates were essentially uncorrelated with baseline client characteristics, conditional on observablerisk. The prevalence of significant correlations (3 out of 45 cases) is what one would expect to occurby chance.
7

Each loan supply decision was made “blind” to the experimental rates; i.e., the
credit, loan amount, and maturity length decisions were made as if the individual
were applying to borrow at the normal rate dictated by her observable risk class.6
After clients choose an allowable loan size and maturity, special software revealed
rc in the 41% cases that it was lower than ro (otherwise no mention was made of a
potentially lower rate). Loan officers were instructed to present the lower contract
rate as simply what the computer dictated, not as part of a special promotion or
anything particular to the client. Due to operational constraints, clients were then
permitted to adjust their desired loan size following the revelation of rc. In theory,
endogenizing loan size in this fashion can work against identifying moral hazard on
the contract rate (since a lower rc strengthens repayment incentives ceteris paribus,
but might induce choice of a higher loan size that weakens repayment incentives). In
practice, however, only about 3% of borrowers who received rc < ro changed their
loan demand after rc was revealed.
Last, 47% of clients were randomly assigned and informed of a dynamic incentive
rf in which clients received the same low contract interest rate on all future loans for
one year as long as they remained in good standing with the Lender.7 This explicitly
raised the benefits of repaying the initial loan on time in the 98% of cases where the
contract rate was less than the Lender’s normal rate. The average discount embodied
in rc, and hence rf , was substantial: an average of 350 basis points off the monthly
rate. Moreover, the Lender’s prior data suggested that, conditional on borrowing
once, a client would borrow again within a year more than half the time. Clients not
receiving the dynamic incentive obtained rc for just the first loan (which had only a
4-month maturity in 80% of the cases). Clients were informed of rf by the branch
manager only after all paperwork had been completed and all other terms of the loan
were finalized.
6A lower interest rate normally would allow for a larger loan. This would work against identi-fying moral hazard on the interest rate, so we constrained the maximum allowable loan size to becalculated based on the normal, not experimental, interest rate.
7For operational reasons, the dynamic repayment incentive was randomized at the branch levelduring the first and second wave of the experiment, and at the individual level for the third wave.
8

3.2 Default Outcomes
Following execution of the loan contract we tracked repayment behavior using the
Lender’s administrative data.
In principle, a measure of default should summarize the true economic cost of
lending. In practice the true cost is very difficult to measure because of uncertainty
and fixed costs in originating, monitoring, and collections. Given these difficulties,
the Lender lacked a summary statistic for default, and instead relied on a range
of proxies for true costs (this is common practice). Consultation with the Lender
suggested focusing on three measures: (i) Monthly Average Proportion Past Due
(the average default amount in each month divided by the total debt burden); (ii)
Proportion of Months in Arrears (the number of months with positive arrearage
divided by the number of months in which the loan was outstanding); and (iii)
Account in Collection Status (typically, the Lender considered a loan in collection
status if there are three or more months of payments in arrears). Web Appendix
Table 1a presents summary statistics on these default measures. We also create a
summary index that aggregates across these three measures of default in order to
address the problem of multiple inference (Kling et al. (2007)).
3.3 Identification Strategy: Intuition
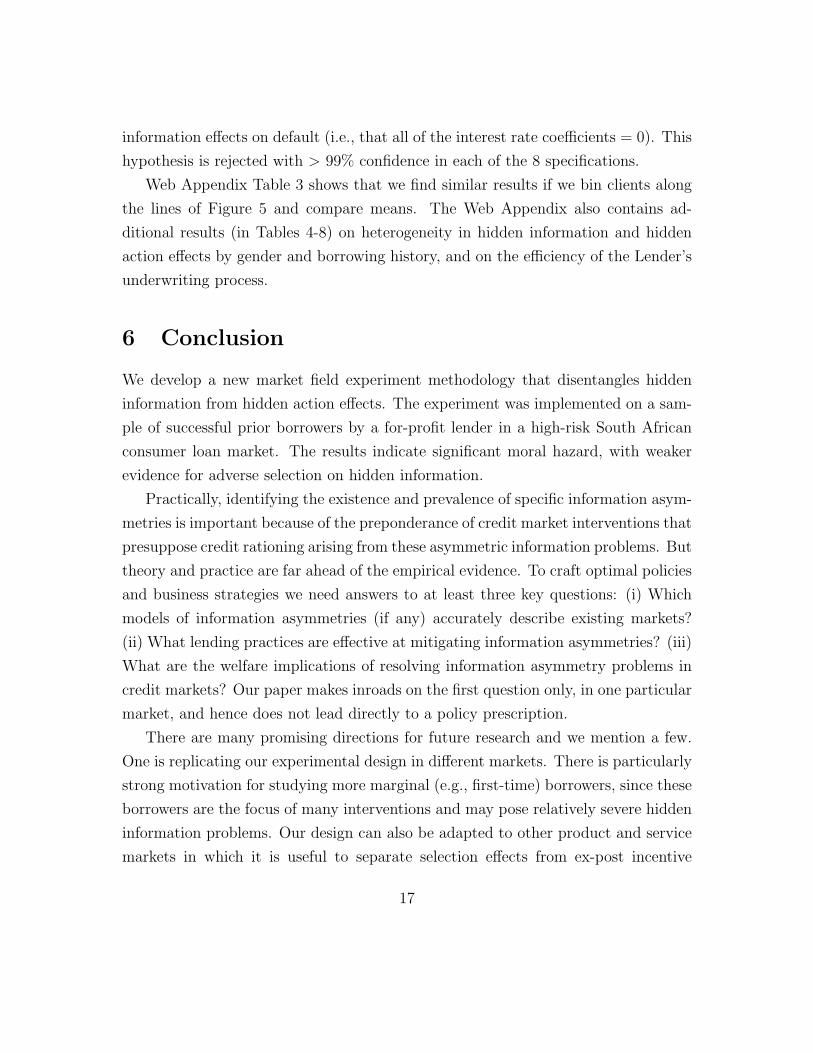
A stylized example, illustrated in Figure 5, captures the heart of our identification
strategy. Individuals decide whether to takeup at the solicitation’s offer rate ro, which
can be “high” or “low”. Of those that takeup at the high ro, some are randomly
surprised with a new lower contract interest rate rc, while the remainder continue to
receive the high rate (i.e., rc = ro). We identify any hidden information effect (the
combination of selection on risk and on anticipated effort induced through selection
on the offer rate) by considering the sample that received the low rc, and comparing
the repayment behavior of those who tookup at the high ro (cells 2 and 3 in the
Figure) with those who tookup at the low ro(cells 4 and 5). Because everyone in
this sample was randomly assigned identical contracts (i.e., low rc), but selected in
at varying, randomly assigned rates, any difference in repayment comes from hidden
9

information: from selection on unobservables induced by ro.
Similarly, we identify any effect of hidden action (moral hazard) by considering
the sample that tookup at the high ro, and comparing the repayment behavior of
those who received the high rc (cell 1) with those who received the low rc (cells
2 and 3). These borrowers selected in identically, but ultimately received randomly
different rc. Any difference in default comes from the resulting moral hazard. We also
identify moral hazard by comparing the repayment behavior of borrowers who both
selected in and contracted at identical rates, but face different dynamic repayment
incentives from randomly assigned future interest rates rf that are conditional on
repayment of the initial loan (cell 2 v. cell 3; cell 4 v. cell 5).
4 Theoretical Model and Identification Strategy
We now formalize what can be learned about the presence or absence of different
types of asymmetric information problems from empirical tests based on our design.
To do this, we provide a model of loan takeup and repayment in the presence of
hidden information (in the form of risky prospects and anticipated effort) and hidden
actions (in the form of realized effort). Our goal is not to put forward new theory that
incorporates both adverse selection and moral hazard and discusses their interplay
(e.g., Chassagnon and Chiappori (1997)), but rather to detail precisely what is meant
by each in this context. Models with similar features can be found in many sources
(e.g., Bardhan and Udry (1999)). Because the Lender decisions included in the
model are randomized, we only need to model borrower decisions. We do this in
three stages, following the experimental design:
1. The individual decides whether or not to borrow at an exogenously set offer
rate ro. In making this decision, the individual believes that any repeat loans
will be provided at the Lender’s normal interest rate r.
2. The Lender randomly lowers the interest rate for some borrowers to rc <
ro. With an independent randomization the Lender also lowers the repeat
borrowing rate to rf = rc < r for some borrowers. Given rc and rf the
10

borrower decides how much effort, e ∈ [e, e], to put into generating cash flows
to repay the loan.
3. Cash flows (i.e., project returns) are realized and the borrower decides whether
or not to repay the loan.
We define the borrower’s decision process as follows. Each individual has the
opportunity to invest in a project but is liquidity constrained and requires financing
of 1 from a single Lender to do so. We refer to “project” here in a broad sense that
includes household as well as entrepreneurial activities. Individuals are indexed by a
risk type θi ∈ [θ, θ]. The project either succeeds and returns Y (θi) or fails and returns
0. The probability of project success π(θi, e) is a function of the project risk type,
θi, and the effort put forth by the borrower, e ∈ [e, e]. Both risk type and effort are
observable to the borrower but incompletely observable to the Lender. The borrower
receives a monetary benefit to repaying the loan B(rf ) which is a decreasing function
of the future lending rate.
We assume that the borrower is risk neutral and we make the following assump-
tions regarding returns and repayment:
Assumption 1: Y (θi) > 1 + ro for all θi: if the project succeeds, the loan can be
repaid at the offer interest rate. If the project fails the loan can not be repaid
(this follows from the borrower’s liquidity constraint).
Assumption 2: ∂π(θi,e)∂e
> 0; ∂2π∂e2 < 0: the likelihood of project success is increasing
and concave in effort.
Assumption 3: ∂π(θi,e)∂θi
< 0: the likelihood of project success is decreasing in risk
type
Assumption 4: π(θi, e)Y (θi) = Y (e) for all θi: all risk types have the same expected
project return. This follows Stiglitz and Weiss (1981) and implies that projects
with a higher θi are “riskier” in terms of second order stochastic dominance.
It also implies, as we show below, that borrowers with higher θ choose a lower
effort level.
11

Assumption 5: B(rf ) ≥ 1+ ro for all relevant rf : there is no strategic default. We
make this assumption because we do not observe empirically why the borrower
repays or not (e.g., whether the project succeeds or fails) and hence can not
test separately for each of the possible channels through which hidden actions
affect repayment. So we use the model to focus on what can be learned about
moral hazard in effort under the assumption that borrowers repay if they are
able. An alternative interpretation (given our broad definition of “project”) is
that “effort” is a tractable way to model all borrower activities that impact
repayment.
We now turn to solving the three stages of the model. Consider a borrower using
backwards induction:
Stage 3 By Assumptions 1 and 5 the borrower repays if and only if the project
succeeds.
Stage 2 Knowing that she will repay if and only if the project succeeds, the bor-
rower chooses effort to solve:
maxe∈[eL,eH ]
π(θi, e)((Y (θi)− 1− rc + B(rf ))− e.
Effort is decreasing in rc given Assumption 2. This implies:
Hidden Action Effect 1 Effort is decreasing in rc given Assumption 2. A given set
of borrowers exerts less effort at higher contract interest rates than at lower contract
interest rates, holding constant offer and future interest rates. Thus repayment is
decreasing in rc.
Effort is also decreasing in rf given Assumptions 1, 2, and 5. This implies:
Hidden Action Effect 2 A given set of borrowers exerts less effort as the benefit
of repayment decreases, holding constant offer and contract interest rates. Thus
repayment is decreasing in rf .
12

Risk type, θi, also affects effort, with then affects repayment. To see this note
the borrower’s first order condition for optimal effort:
∂π(θi, e)
∂e(Y (θi)− 1− rc + B(rf )) = 1
Given Assumption 4, we can implicitly define optimal effort e as a function of rc,
B(rf ), and θi.
(1− Y ′(e(rc, B(rf ), θi))Y (θi)
Y ′(e(rc, B(rf ), θi))= B(rf )− 1− rc. (1)
Equation (1) implies that e(rc, B(rf ), θi) must be a decreasing function of θi, i.e.,
ceteris paribus, higher risk borrowers put in less effort. We use this finding below to
help interpret our third effect, the effect of the offer rate on repayment.
Stage 1 An individual decides to take up the offer if the expected return from
her project, given expected optimized effort at the offer interest rate, e(ro, B(r), θi),8
is greater than her next-best option (set to zero for simplicity, which is innocuous
because B, the benefit of repaying loans, is positive). That is, an individual borrows
from the Lender if and only if
π(θi, e(ro, B(r), θi))(Y (θi)− 1− ro + B(r))− e(ro, B(r), θi) ≥ 0 (2)
where e(ro, B(r), θi) is the optimal level of effort for an individual with project type
θi that borrows and expects to pay the offer interest rate, ro.
The left-hand side of (2) is increasing in riskiness, θi. To see this, note that the
envelope theorem implies that the increase in θi has no indirect effect through effort.
The only effect of increasing θi comes through the term π(θi, e), which has a negative
first derivative by Assumption 3. Consequently, for a given ro, either all borrowers
will take out a loan, or there will be a separation with those with a higher θi taking a
8In stage one the borrower evaluates optimal effort at the offer rate and standard future borrow-ing rate because any surprise rates have not yet been revealed (see Web Appendix Table 2 Column4 for corroborating evidence that takeup is uncorrelated with surprise rates).
13

loan. We define the implicit function θ(ro) as the θi below which individuals, offered
interest rate ro, do not borrow, i.e. the θi at which equation (2) equals zero. The
implicit function theorem implies that:
dθ(ro)
dro> 0. (3)
This partial derivative implies that higher offer interest rates lead to a riskier pool of
clients. Coupled with Assumption 4, this produces the classic Stiglitz-Weiss adverse
selection effect: a higher offer interest rate leads to a lower repayment rate.
Note however that Equation (3) is only true for a marginal change in ro. If we
consider a discrete change in ro the risk pool will change through two channels. One is
the classic Stiglitz-Weiss adverse selection effect. Two is an anticipated effort effect
that can not be signed theoretically without an additional assumption: although
we know from (1) that riskier clients exert less effort, we can only assert that the
anticipated effort effect here actually draws in riskier clients (and thereby reinforces
the classic adverse selection effect) by assuming that the cost of additional effort
at the discretely higher rate is greater than the benefit. So without that additional
assumption the net effect of ro on the risk pool and hence on repayment is ambiguous
in theory. Of course we will test the net effect empirically.
We label the net effect of roon repayment ”Hidden Information” because it only
exists if there is selection on unobservables prior to actual effort choice. More for-
mally:
Hidden Information Effect For any offer interest rate ro there exists a risk type
θ(ro) such that all individuals with θi > θ(ro) take out a loan and no individuals with
θi ≤ θ(ro) take out a loan. Whether repayment is increasing or decreasing in ro is
theoretically ambiguous and will be tested using the observation that the repayment
rate for borrowers with a higher θ is lower both because they are higher risk and
because they put in less effort. So if repayment is decreasing (increasing) in ro this
indicates that θ(ro) is increasing (decreasing) in ro.
It is important to note that what we learn about the nature of asymmetric in-
14
formation from the empirical test of how ro affects repayment depends on whether
we find either of the hidden action effects (i.e., on whether there is moral hazard
in effort). If there is no hidden action effect then the test identifies any effect of
classic adverse selection. If there is a hidden action effect then our test identifies
the reduced-form combination of any classic adverse selection effect and an effect of
selection on anticipated effort that may either reinforce or offset any classic adverse
selection. In this case the offer rate provides a one-sided test for hidden information:
if we find that ro affects repayment this is evidence of a hidden information problem
that works through either or both channels (classic adverse selection and/or selection
on anticipated effort). But if we find that ro does not affect repayment we might
be failing to identify offsetting effects of classic adverse selection and advantageous
selection on anticipated effort that can still have negative welfare consequences.9
In sum, our experimental design allow us, under the assumptions detailed above,
to differentiate between hidden information and hidden action effects that have theo-
retical and policy relevance. Below we present the empirical results and then discuss
implications in the Conclusion.
5 Results
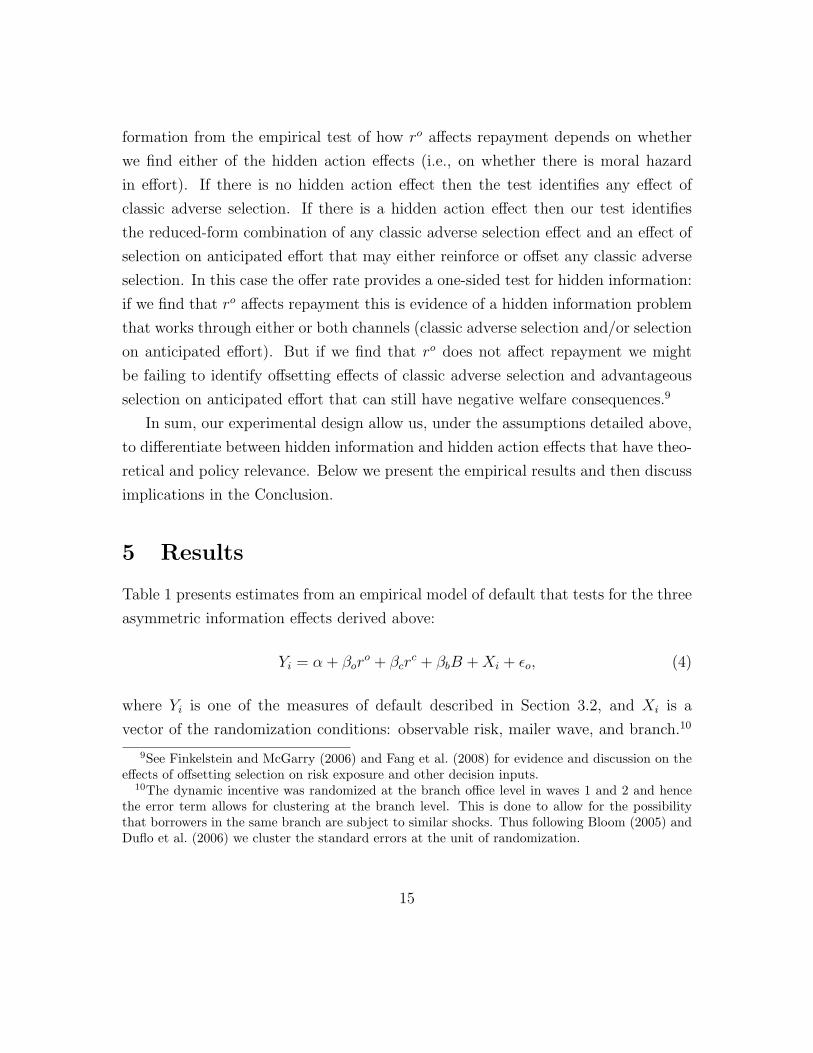
Table 1 presents estimates from an empirical model of default that tests for the three
asymmetric information effects derived above:
Yi = α + βoro + βcr
c + βbB + Xi + εo, (4)
where Yi is one of the measures of default described in Section 3.2, and Xi is a
vector of the randomization conditions: observable risk, mailer wave, and branch.10
9See Finkelstein and McGarry (2006) and Fang et al. (2008) for evidence and discussion on theeffects of offsetting selection on risk exposure and other decision inputs.
10The dynamic incentive was randomized at the branch office level in waves 1 and 2 and hencethe error term allows for clustering at the branch level. This is done to allow for the possibilitythat borrowers in the same branch are subject to similar shocks. Thus following Bloom (2005) andDuflo et al. (2006) we cluster the standard errors at the unit of randomization.
15

Adding controls for loan size and maturity does not change the results. We estimate
equation (4) on the entire sample of 4,348 individuals who obtained a loan. The
specifications in Table 1 vary only in how they measure default, and in whether the
dynamic repayment incentive B is measured as a binary variable (= 1 if rf= rc
on future loans conditional on good repayment of initial loan) or with binary and
continuous ( r − rf ) variables. Columns 1-6 estimate the effects of the randomly
assigned interest rates on default using individual default measures. Columns 7 and
8 use a summary index of the three default measures; these results are interpreted
as the average effect of the interest rate on default, in standard deviation units.
The first row of Table 1 presents estimates of βc, the effect of the contract rate on
default. This coefficient identifies any Hidden Action Effect 1, with βc > 0 indicating
moral hazard in effort on the contract rate. Seven out of the eight coefficients are
positive; the one marginally significant result (Column 3) implies that a 100 basis
point cut would reduce the average number of months in arrears by 3%.
The next row presents estimates of βb, the effect of the dynamic repayment incen-
tive on default. Every specification points to economically and statistically significant
moral hazard. Columns 1, 3, and 5 imply that clients assigned any dynamic incentive
defaulted an estimated 13 to 21 percent less than the mean. The summary index
test also finds a large and significant effect. Columns 2, 4 & 6 show that the effect is
increasing in and driven by the size of the discount on future loans, as each 100 basis
point decrease in rf reduces default by about 4% in the full sample. The second-
to-last row of the table shows that binary incentive and the size of the discount are
jointly significant in all specifications.
The next row presents estimates of βo, the effect of the offer rate on default.
Given the presence of moral hazard this coefficient identifies a net Hidden Informa-
tion Effect that is the combination of any classic adverse selection, and selection on
anticipated effort that may either reinforce or offset any classic adverse selection.
A positive (negative) coefficient indicates net adverse (advantageous) selection on
hidden information. The point estimates are positive in all eight specifications but
never significant.
The bottom row shows the F-test p-value for the null hypothesis of no asymmetric
16
information effects on default (i.e., that all of the interest rate coefficients = 0). This
hypothesis is rejected with > 99% confidence in each of the 8 specifications.
Web Appendix Table 3 shows that we find similar results if we bin clients along
the lines of Figure 5 and compare means. The Web Appendix also contains ad-
ditional results (in Tables 4-8) on heterogeneity in hidden information and hidden
action effects by gender and borrowing history, and on the efficiency of the Lender’s
underwriting process.
6 Conclusion
We develop a new market field experiment methodology that disentangles hidden
information from hidden action effects. The experiment was implemented on a sam-
ple of successful prior borrowers by a for-profit lender in a high-risk South African
consumer loan market. The results indicate significant moral hazard, with weaker
evidence for adverse selection on hidden information.
Practically, identifying the existence and prevalence of specific information asym-
metries is important because of the preponderance of credit market interventions that
presuppose credit rationing arising from these asymmetric information problems. But
theory and practice are far ahead of the empirical evidence. To craft optimal policies
and business strategies we need answers to at least three key questions: (i) Which
models of information asymmetries (if any) accurately describe existing markets?
(ii) What lending practices are effective at mitigating information asymmetries? (iii)
What are the welfare implications of resolving information asymmetry problems in
credit markets? Our paper makes inroads on the first question only, in one particular
market, and hence does not lead directly to a policy prescription.
There are many promising directions for future research and we mention a few.
One is replicating our experimental design in different markets. There is particularly
strong motivation for studying more marginal (e.g., first-time) borrowers, since these
borrowers are the focus of many interventions and may pose relatively severe hidden
information problems. Our design can also be adapted to other product and service
markets in which it is useful to separate selection effects from ex-post incentive
17

effects.
Another direction is to design tests that address the key confound discussed in the
theoretical section: selection processes can attract types who exert less unobserved
effort as well as types who are the innately more risky. Collecting supplemental data
on margins of effort and riskiness that are not typically observed by the principal
can help isolate these different selection channels (Fang et al. (2008); Finkelstein and
McGarry (2006)). Another approach to isolating adverse selection on risk would be
to study contexts where effort can be observed (e.g., settings where firms can closely
monitor employee actions and productivity).
Uncovering the actual nature and practical implications (if any) of asymmetric
information problems in credit markets will require theoretical as well as empirical
progress. We highlight a fundamental entangling of selection and effort, specifically
that selection processes may draw in individuals with different anticipated effort as
well as with different project risks. Thus the clean theoretical distinction between
adverse selection and moral hazard may not be identifiable empirically in many con-
texts. Salanie (2005) lauds the “constant interaction between theory and empirical
studies” (p. 221) that has characterized the closely related literature on insurance
markets. Comparably intense interactions would deepen our understanding of credit
markets, and field experiments can be a useful tool for testing and refining theories
as well as practice.
References
Armendariz de Aghion, B. and J. Morduch (1995): The Economics of Mi-
crofinance, Cambridge, Mass.: MIT Press.
Ausubel, L. M. (1999): “Adverse Selection in the Credit Market,” Working Paper,
Department of Economics, University of Maryland.
Banerjee, A. V. and A. F. Newman (1993): “Occupational Choice and the
Process of Development,” The Journal of Political Economy, 101, 274–298.
18

Bardhan, P. and C. R. Udry (1999): Development Microeconomics, Oxford UK:
Oxford University Press.
Bebczuk, R. N. (2003): Asymmetric Information in Financial Markets : Introduc-
tion and Applications, Cambridge, UK: Cambridge University Press.
Bernanke, B. and M. Gertler (1990): “Financial Fragility and Economic Per-
formance,” Quarterly Journal of Economics, 105, 87–114.
Bloom, H. S. (2005): “Randomizing Groups to Evaluate Place-Based Programs,”
in Learning More from Social Experiments: Evolving Analytical Approaches, ed.
by H. S. Bloom, NY: Russel Sage Foundation, chap. 4.
Cardon, J. H. and I. Hendel (2001): “Asymmetric Information in Health Insur-
ance: Evidence From The National Medical Expenditure Survey,” RAND Journal
of Economics, 32, 408–427.
Chassagnon, A. and P. A. Chiappori (1997): “Insurance Under Moral Hazard
and Adverse Selection: The Case of Pure Competition,” Working Paper, Laval -
Laboratoire Econometrie, No 28.
Chiappori, P. A. and B. Salanie (2000): “Testing for Asymmetric Information
in Insurance Markets,” Journal of Political Economy, 108, 56–78.
De Meza, D. and D. C. Webb (1987): “Too Much Investment: A Problem of
Asymmetric Information,” Quarterly Journal of Economics, 102, 281–292.
Department of Trade and Industry South Africa (2003): “Credit Law
Review,” Summary of Findings of the Technical Committee.
Duflo, E., R. Glennerster, and M. Kremer (2006): “Using Ramdomization
in Development Economics Research: A Toolkit,” Working Paper 333, National
Bureau of Economic Research.
Elyasiani, E. and L. G. Goldberg (2004): “Relationship Lending: A Survey of
the Literature,” Journal of Economics and Business, 56, 315–330.
19

Fang, H., M. P. Keane, and D. Silverman (2008): “Sources of Advantageous
Selection: Evidence from the Medigap Insurance Market,” Journal of Political
Economy, 116, 303–350.
Finkelstein, A. and K. McGarry (2006): “Multiple Dimensions of Private
Information: Evidence from the Long-Term Care Insurance Market,” American
Economic Review, 96, 938–958.
Gale, W. G. (1990): “Federal Lending and The Market for Credit,” Journal of
Public Economics, 42, 177–193.
Hubbard, R. G. (1998): “Capital Market Imperfections and Investment,” Journal
of Economic Literature, 36, 193–225.
Kling, J. R., J. B. Liebman, and L. F. Katz (2007): “Experimental Analysis
of Neighborhood Effects,” Econometrica, 75, 83–119.
Mankiw, N. G. (1986): “The Allocation of Credit and Financial Collapse,” Quar-
terly Journal of Economics, 101, 455–470.
Mookherjee, D. and D. Ray (2002): “Contractual Structure and Wealth Accu-
mulation,” American Economic Review, 92, 818–849.
Porteous, D. (2003): “Is Cindarella Finally Coming to the Ball? SA Micro Finance
in Broad Perspective,” Micro Finance Regulatory Council Working Paper.
Robinson, M. S. (2002): The Microfinance Revolution, Washington, DC: The
World Bank.
Salanie, B. (2005): The Economics of Contracts: A Primer, Cambridge, Mass.:
MIT Press.
Shearer, B. (2004): “Piece Rates, Fixed Wages and Incentives: Evidence from a
Field Experiment.” Review of Economic Studies, 71, 513–534.
Stiglitz, J. E. and A. Weiss (1981): “Credit Rationing in Markets with Imper-
fect Information,” American Economic Review, 71, 393–410.
20

TABLE 1: Empirical Tests of Hidden Information and Hidden Action: Full Sample
Dependent Variable:
Mean of dependent variable: 0.09 0.09 0.22 0.22 0.12 0.12 0 0
(1) (2) (3) (4) (5) (6) (7) (8)
0.005 0.002 0.006* 0.002 0.001 -0.001 0.014 0.004
(0.003) (0.004) (0.003) (0.004) (0.005) (0.005) (0.011) (0.013)
Dynamic Repayment Incentive Dummy (Hidden Action Effect 2) -0.019* -0.000 -0.028** 0.004 -0.025** -0.004 -0.080** -0.000
(0.010) (0.017) (0.011) (0.021) (0.012) (0.020) (0.032) (0.057)
Dynamic Repayment Incentive Size -0.005 -0.009** -0.006 -0.023*
(0.004) (0.004) (0.005) (0.013)
0.005 0.004 0.002 0.002 0.007 0.007 0.015 0.015
(0.003) (0.003) (0.003) (0.004) (0.005) (0.005) (0.011) (0.012)
Observations 4348 4348 4348 4348 4348 4348 4348 4348
Adjusted R-squared 0.08 0.08 0.14 0.15 0.06 0.06 0.10 0.11
Probability(both Dynamic Incentive variables = 0) 0.06 0.00 0.06 0.01
Probability(all 3 or 4 interest rate variables = 0) 0.0004 0.0005 0.0003 0.0012 0.0006 0.0016 0.0000 0.0001
Contract Rate (Hidden Action Effect 1)
Table 1. Empirical Tests of Hidden Information and Hidden Action Effects: Full Sample
OLS
Monthly Average
Proportion Past
Due
Standardized Index
of Three Default
Measures
Proportion of
Months in Arrears
Account in
Collection Status
* significant at 10%; ** significant at 5%; *** significant at 1%. Each column presents results from a single OLS model with the RHS variables shown and
controls for the randomization condtions: observable risk, month of offer letter, and branch. Adding loan size and maturity as additional controls does not
change the results. Robust standard errors in parentheses are corrected for clustering at the branch level. “Offer Rate” and “Contract Rate” are in monthly
percentage point units (7.00% interest per month is coded as 7.00). “Dynamic Repayment Incentive” is an indicator variable equal to one if the contract
interest rate is valid for one year (rather than just one loan) before reverting back to the normal (higher) interest rates. "Dynamic Repayment Incentive Size"
interacts the above indicator variable with the difference between the Lender's normal rate for that individual's risk category and the experimentally assigned
contract interest rate. A positive coefficient on the Offer Rate variable indicates hidden information, a positive coefficient on the Contract Rate or Dynamic
Repayment Incentive variables indicates hidden action (moral hazard).
The dependent variable in Columns (7) and (8) is a summary index of the three dependent variables used in Columns (1)-(6). The summary index is the
mean of the standardized value for each of the three measures of default.
Offer Rate (Hidden Information Effect)
21

FIGURE I: Some basic intuition for our identification strategy.
Figure 1. Basic Intuition Behind the Experimental Design
High Contract Rate
High Offer Rate
Low Offer Rate N/A
Some basic intuition for our identification strategy. Please see Section 3.3 of the text for details.
H
idd
en I
nfo
rmat
ion
Eff
ect
!
Hidden Action Effect 1
" # $
%
22