Embed Size (px)
Citation preview

The macroeconomic effects of development finance institutions in sub-Saharan Africa Isabella Massa, Max Mendez-Parra and Dirk Willem te Velde
Report
December 2016

Overseas Development Institute203 Blackfriars RoadLondon SE1 8NJ
Tel. +44 (0) 20 7922 0300 Fax. +44 (0) 20 7922 0399 E-mail: [email protected]
www.odi.org www.odi.org/facebook www.odi.org/twitter
Readers are encouraged to reproduce material from ODI Reports for their own publications, as long as they are not being sold commercially. As copyright holder, ODI requests due acknowledgement and a copy of the publication. For online use, we ask readers to link to the original resource on the ODI website. The views presented in this paper are those of the author(s) and do not necessarily represent the views of ODI.
© Overseas Development Institute 2016. This work is licensed under a Creative Commons Attribution-NonCommercial Licence (CC BY-NC 4.0).
Cover photo: © John Hogg/World Bank: Rossing Uranium Mine lies about 70km inland from Swakopmund close to the small town of Arandis. It was founded by amateur geologist Capt. Peter Louw in 1928 largley owned by the Rio Tinto Group (69% shares). In 2006 the mine produced about 7% of the world production of primary produced uranium. The mine is a long term supplier of uranium to the world nuclear power industry. Haul trucks being repaired and serviced at the workshop on the mine.

The macroeconomic effects of development finance institutions in sub-Saharan Africa 3
This paper is supported by Norfund; we are grateful for their support and comments. In particular, we would like to thank Kjell Roland, Ola Nafstad and Karoline Teien Blystad for guiding comments as well as participants of a seminar in Oslo on 24 February 2016. We further thank the development finance institutions for providing us with data. Jane Kennan provided helpful data analysis. Sheila Page provided peer review. Responsibility for the paper, including any potential errors, remains with the authors.
Acknowledgements

4 ODI Report
Abbreviations 7
Executive summary 8
1 Introduction 10
2 The macroeconomic effects of DFIs: a review of the evidence 11
2.1 Introduction 11
2.2 Channels of development impacts 12
3 Description of EDFI activities 23
4 The impact of DFIs in Africa: new evidence 31
4.1 Descriptive analysis 31
4.2 Econometric analysis 35
5 Conclusions 47
Contents

The macroeconomic effects of development finance institutions in sub-Saharan Africa 5
List of figures, tables and boxes
Figures
Figure 1: DFIs’ approach to promoting private sector development 11
Figure 2: Climate finance flows, 2013 20
Figure 3: EDFI portfolio and number of projects, 2005–2014 23
Figure 4: Distribution of EDFI portfolio by financial instrument, 2005–2014 24
Figure 5: Distribution of EDFI portfolio by sector, 2005–2014 25
Figure 6: Distribution of EDFI portfolio by geographical region, 2005 and 2014 27
Figure 7: EDFI portfolio and number of projects in SSA, 2005–2014 27
Figure 8: EDFI portfolio vs. IFC portfolio in SSA, 2014 28
Figure 9: EDFI new projects in SSA, 2005–2014 28
Figure 10: Development funding for SSA in 2014 29
Figure 11: Distribution of EDFI portfolio by financial instrument in SSA, 2005–2014 30
Figure 12: The increasing role of DFIs in supporting investment in Uganda 31
Figure 13: DFIs and other financial flows in Ghana 32
Figure 14: DFIs support the production of energy from renewable sources in Kenya 33
Figure 15: DFIs channel investments that support economic transformation in Burundi 34
Figure 16: Exports and DFIs in Swaziland 35
Figure 17: DFI investments and level of development in SSA, 2010 36
Figure 18: DFIs, aid and FDI in sub-Saharan Africa, 2010 37
Figure 19: DFIs’ investment as a share of GDP by country and DFI in selected sub-Saharan African
countries, 2013 38

6 ODI Report
Tables
Table 1: Relevance of DFI impacts on employment creation by sector 15
Table 2: Direct and indirect jobs supported by selected DFIs in 2014 15
Table 3: IFC case studies – jobs created 16
Table 4: Distribution of DFIs’ portfolio by financial instrument, 2014 24
Table 5: Distribution of DFIs’ portfolio/commitments by sector, 2014 26
Table 6: Distribution of DFIs’ portfolio by geographical region, 2014 30
Table 7: DFI investments data description 36
Table 8: Effects of DFI investments on economic growth 40
Table 9: Variables – descriptive statistics 41
Table 10: Effects of DFI investments on economic growth, adjusting for endogeneity 42
Table 11: Effects on gross fixed capital formation 44
Table 12: Effects on labour productivity 45
Table 13: Effects of aggregated DFI investments on growth, GFCF and labour productivity 46
Boxes
Box 1: Mandates of selected DFIs 11
The macroeconomic effects of development finance institutions in sub-Saharan Africa 7
Abbreviations
ACP African, Caribbean and Pacific
AfDB African Development Bank
BIO Belgian Investment Company
CDC UK Development Finance Institution
Cofides Compañía Española de Financiación del Desarrollo
CPI Climate Policy Initiative
Danida Danish International Development Agency
DEG Deutsche Investitions und Entwicklungsgesellschaft
DFI Development Finance Institution
EBRD European Bank for Reconstruction and Development
EDFI European DFI
EIB European Investment Bank
ELF Emergency Liquidity Facility
FAO Food and Agriculture Organization
FDI Foreign Direct Investment
FMO Dutch Development Bank
GDP Gross Domestic Product
GFCF Gross Fixed Capital Formation
GMM Generalised Method of Moments
IEG Independent Evaluation Group
IFC International Finance Corporation
IFU Industrialization Fund for Developing Countries
IOB Policy and Operations Evaluation Department
LDC Least Developed Country
LIC Low-Income Country
Norad Norwegian Agency for Development Cooperation
ODA Official Development Assistance
ODI Overseas Development Institute
OECD Organisation for Economic Co-operation and Development
OeEB Oesterreichische Entwicklungsbank
OLS Ordinary Least Squares
OPIC Overseas Private Investment Corporation
Proparco Société de Promotion et de Participation pour la Coopération Economique
SADEV Swedish Agency for Development Evaluation
Sifem Swiss Investment Fund for Emerging Markets
Simest Società italiana per le imprese all’estero
SMEs Small and Medium Enterprises
Sofid Sociedade para o Financiamento do Desenvolvimento
SSA Sub-Saharan Africa
UN United Nations
UNCTAD UN Conference on Trade and Development
US United States
WDI World Development Indicators

8 ODI Report
IntroductionDevelopment Finance Institutions (DFIs) contribute to global development by investing in the private sector. The resources they provide are intended to be additional to what the market can provide and to catalyse further investment. Their shareholders are increasingly expecting DFIs to do more. DFIs have an explicit role in the Addis Ababa Action Agenda on Financing for Development of July 2015 and are expected to provide part of the $100 billion climate finance agreed in the Paris climate change agreement of December 2015. DFIs are also increasingly important in macro financial terms.
However, despite their increased importance in global debates and developing economies, there is insufficient information to assess how well DFIs are meeting the ever-increasing expectations. DFIs have begun to assess their development impact by looking at project level and only very recently have they started to look beyond project level to develop guidelines to assess indirect effects. But, apart from a few recent studies, there have been no attempts to assess the macroeconomic impact of DFIs. Yet that is what the general public should be interested in: to what extent do DFIs create jobs, raise growth, increase use of renewable energy and crowd in local private sector investment?
This study 1) provides the most complete literature review to date on the macroeconomic effects of DFIs; 2) examines the data graphically and suggests DFIs can play a key role in kick-starting investment and renewable energy use in developing countries; and 3) collects country-specific DFI investment data in sub-Saharan Africa (SSA) and undertakes the most comprehensive econometric analysis of DFIs in SSA.
Reviewing the evidence on the macroeconomic impact of DFIs so farThe literature review covers a number of studies on the macro effects of DFIs, with impact areas encompassing economic growth, investment, jobs, labour productivity, tax revenues, poverty reduction, food security and renewable energy. In some areas, there is hardly any evidence, for example in relation to the direct impact on poverty. However, in other areas we know much more. Consider for example the following summary findings:
• Economic growth. A 10% increase in multilateral DFI investments leads to a 1.3% increase in growth in lower-income countries, compared with an increase of just 0.9% in higher-income countries.
• Investment. A 1 percentage point increase in DFI investments as a percentage of gross domestic product (GDP) leads to a 0.8 percentage point change in the investment-to-GDP ratio. Using actual DFI investments so far for 26 countries, DFIs have kept investment-to-GDP ratios at least 1.5 percentage points higher than would otherwise have been the case.
• Labour productivity. For each percentage point shift in the ratio of DFI investments over GDP, the effect of DFIs on labour productivity is found to be between 3.4% and 7.5% and statistically significant. Using the lower estimate, and plugging in actual DFI data, DFIs have increased labour productivity by at least 3% in 21 low- and middle-income countries. In Ghana, Kenya and Zambia the effects are found to be of the order of 2.3%.
These are powerful findings on the macro contribution of DFIs. The rest of the paper is focused on providing new estimates in SSA. We first consider how much European DFIs are already involved in SSA.
The EDFI portfolio in sub-Saharan Africa The consolidated portfolio of European DFIs (EDFIs) grew from €10.9 billion in 2005 to €32.9 billion in 2014, which represents an increase of 204%, or 13% per year. Some EDFI members specialised almost entirely in equity and quasi-equity in 2014 (i.e. CDC, SBI and, to a lesser extent, Norfund and Sifem). The majority of the committed portfolio of others (i.e. Proparco, BIO, Cofides and OeEB), on the other hand, is through loans. With the exception of Sofid, most do very little in guarantees. EDFIs as a whole invest mostly in financial services and infrastructure. In 2014, 50% (€16.3 billion) of the total consolidated portfolio was invested in the financial sector (mainly in investment funds and banks); the share invested in infrastructure was equal to 24% (€7.9 billion, of which €5.4 billion in power).
The total value of new EDFI investments in SSA has nearly tripled, from €0.9 billion in 2005 to €2.3 billion in 2014. In 2014, EDFI investments represented 5% of foreign direct investment (FDI) and 7% of aid in SSA. If we also take into account multilateral DFIs (International Finance Corporation (IFC), European Investment Bank (EIB) and African Development Bank (AfDB)), then DFIs’ investments represented 16% of FDI and 22% of aid in SSA. Some DFIs are more geared than others towards SSA countries. Swedfund and Sofid invested 64% and 58%, respectively, of their 2014 total portfolio in SSA, followed by Norfund (47%) and Finnfund (44%). It is worth
Executive summary

The macroeconomic effects of development finance institutions in sub-Saharan Africa 9
noting that the total exposure in SSA of 10 out of the 15 EDFI members is higher than that of the multilateral IFC, which in 2014 invested 17% of its committed portfolio in SSA economies.
New empirical evidence We first provide a number of graphical presentations that illustrate how DFIs’ investments appear to be related to increased (private sector) investment in Ghana and Uganda, renewable energy use in Kenya and labour productivity in Swaziland.
We then collect data on DFI-committed investments at country level for SSA. We use these data to estimate the effects of DFIs on macroeconomic variables, and find the following:
• Economic growth. The effect of DFI investments on the rate of GDP per capita growth is positive for all DFIs and significant for IFC, DEG, CDC and the Overseas Private Investment Corporation (OPIC). Pooling DFIs, we find a significant positive effect on the GDP per capita growth rate. If the DFI/GDP ratio increases by 1% (which is approximately $15 billion for the whole of SSA), per capita growth increases by 0.24% on average. This would, however, require a tripling of current levels of DFI investment.
• Investment. There is a positive effect of DFIs on gross fixed capital formation (GFCF). This effect is significant for IFC, EIB, OPIC, Norfund and the ‘Rest of the DFIs’. Pooling DFIs, we find no significant effect on investment. However, the experience in cases such as Ghana and Uganda suggests DFI investments have pulled new FDI and domestic investment into their economies.
• Labour productivity. In general, the effects tend to be small. Only the investments made by the IFC, OPIC and Norfund have had a positive and significant effect on changes in labour productivity. Pooling DFIs, we find a positive and significant effect on labour productivity. If DFI/GDP increases by 1%, labour productivity increases by 0.27% on average.
• Renewable energy use. DFI investments have helped increase the use of renewable energy in Kenya, with investments in alternative generation technologies beyond hydro-electrical power.
Key messages
• The portfolio of investments by EDFIs in SSA quadrupled between 2005 and 2014 and amounted to €9 billion in 2014. EDFI investment is equivalent to 5% of foreign direct investment and 7% of aid to SSA.
• DFIs are increasingly expected to contribute to economic growth, economic transformation, investment, poverty reduction, food security and renewable energy use.
• The evidence reveals important positive and significant effects of DFIs on economic growth, investment and productivity. But this evidence is very patchy, limited to specific countries, specific DFIs or estimation techniques.
• DFIs contribute significantly to the achievement of development goals. If the DFI/gross domestic product ratio increases by 1% (or by some €10 billion), per capita incomes increase by, on average, 0.24% and labour productivity by 0.27%.

10 ODI Report
Development Finance Institutions (DFIs) contribute to global development by investing in the private sector. The resources they provide aim to be additional to what the market can offer and to catalyse further investment. Typical projects supported by DFIs generate jobs, provide access to finance, promote the use of renewable energy and, in aggregate, contribute to economic growth and hence reduce poverty. Their shareholders are increasing their demands on DFIs. DFIs have an explicit role in the Addis Ababa Action Agenda on Financing for Development of July 2015 and are expected to provide part of the $100 billion climate finance as agreed in the Paris climate change agreement of December 2015. DFIs are increasingly important in macro terms – for example the invested portfolio of European DFIs (EDFIs) increased from €11 billion in 2005 to €33 billion in 2014.
However, despite their increased importance in global debates, we lack sufficient information to assess how well DFIs are meeting ever-increasing expectations. DFIs have begun to assess their development impact by looking at the project level; only very recently have they started to look beyond this and develop guidelines to assess indirect effects (IFC, 2013; te Velde, 2015). Apart from recent studies by Massa (2011), te Velde (2011) and Jouanjean and te Velde (2013), no studies assess the macroeconomic
impact of DFIs. Yet this is what the general public should be interested in: to what extent do DFIs create jobs, raise growth, increase use of renewable energy and crowd in local private sector investment?
This study addresses the gap in three ways. First, it provides the most complete literature review to date on the macroeconomic effects of DFIs. This provides a range of interesting findings, pointing to a number of positive studies but also highlighting shortcomings. Second, it examines the data graphically and suggests DFIs can play a key role in kick-starting investment and renewable energy use in developing countries. Third, it collects country-specific DFI investment data in sub-Saharan Africa (SSA) and undertakes the most comprehensive econometric analysis of DFIs in the region.
The structure of this paper is as follows. Section 2 reviews the evidence of the impact of DFIs in a range of areas: economic growth and investment, job creation and labour productivity, tax revenues, poverty reduction, food security, service delivery, and climate change mitigation/adaptation and environmental sustainability. Section 3 provides background data on DFIs. Section 4 provides new empirical estimations of the effects of DFIs in SSA, first graphically and then using a range of econometric techniques. Section 5 concludes.
1. Introduction

The macroeconomic effects of development finance institutions in sub-Saharan Africa 11
2.1 IntroductionThe core field of activity of multilateral and bilateral DFIs is the financing of private sector projects in developing and emerging economies (Gössinger and Raza, 2011). Their mandates, indeed, reflect the conviction that the private sector plays a crucial role in fostering economic, social and environmental development (see Box 1). DFIs play a key part in fostering development in beneficiary countries by encouraging private sector development investments.Dalberg (2010) argues that, in promoting private sector development, DFIs are guided by three principles (Figure 1):
1. Additionality: DFIs invest in countries and sectors where usually commercial investors/banks would not because of the high risks involved.
2. Catalytic effects: finance provided by DFIs helps attract and mobilise the involvement of other private investors both directly (i.e. through the mobilisation of other investor capital) and indirectly (i.e. through helping local markets build strong foundations for commercial activity).
3. Sustainability: finance provided by DFIs allows country governments to realise projects that foster socioeconomic development, thus reducing dependency on aid.
The section surveys the existing literature on the impacts of multilateral and bilateral DFIs and develops a conceptual framework of the impacts of DFIs. Source papers include professional journal articles, refereed
research studies, policy briefs, DFI and project evaluations and country case studies. Where information is scarce or not available at all, anecdotal evidence is taken into account. Because DFIs are changing fast in today’s environment, we use mostly sources published over the past decade, except where articles are needed specifically for their historical relevance and perspective on broad issues relating to DFIs.
2. The macroeconomic effects of DFIs: a review of the evidence
Figure 1: DFIs’ approach to promoting private sector development
Source: Adapted from Dalberg (2010).
Promoting private sector development
European DFI approach
What it means
• Investing in underserved geographies, sectors and segments, e.g.
– LDCs, Africa, post conflict and conflict states – Financial sector, agribusiness etc – SMEs
• Demonstrating to other investors how to conduct investments in high risk environments
• Being the first movers in underdeveloped sectors
• Mobilizing other investors
• Building sustainable and growing sources of tax income for governments
• Promoting responsible governance, human rights environmental standards, etc
Additional – Going where other investors don’t
Catalytic – Paving the way for others to follow
Sustainable – Reducing the dependence on aid
Box 1: Mandates of selected DFIs
IFC: ‘The purpose of the Corporation is to further economic development by encouraging the growth of productive private enterprise in member countries, particularly in the less developed areas’Proparco: ‘was founded on the belief that the private sector plays a major role in the economic and social development of the South’OPIC: ‘mobilizes private capital to help address critical development challenges’DEG: ‘… we promote the expansion of the private sector – as the driving force of development’FMO: ‘helps stimulate the private sector. A healthy private sector fuels the economy by… generating lasting development impact’
Note: This is not an exhaustive list. Some examples are provided but there are other DFIs that recognise employment creation as a priority objective.
Source: IFC, Proparco, OPIC, DEG and FMO websites.

12 ODI Report
2.2 Channels of development impactsAs mentioned above, the activities and operations of DFIs are closely associated with the concept of private sector development. In what follows, we shed light on some of the key development challenges that DFIs may address by fostering the private sector, thus succeeding in promoting development. In particular, we focus on the following areas of impact:
• economic growth and investment • job creation and labour productivity • tax revenues • poverty reduction • food security • service delivery • climate change mitigation/adaptation
environmental sustainability.
2.2.1 Impact on economic growth and investment
The private sector is widely recognised as a critical driver of economic growth. Therefore, by encouraging private sector development, DFIs may promote economic growth. Nevertheless, in the literature there is still a very limited amount of studies that look at the empirical link between DFIs and growth.
Massa (2011) examines the relationship between DFI investments and economic growth in a number of selected economies for the period 1986–2009. The focus of the study is on investments realised by multilateral DFIs, including the International Finance Corporation (IFC), the European Bank for Reconstruction and Development (EBRD) and the European Investment Bank (EIB), in countries with very different income levels and in different sectors. The study assesses the effects of multilateral DFI investments on growth by distinguishing between income categories of countries (lower-income countries versus higher-income countries) and sectors (i.e. agribusiness, financial sector, industry and infrastructure). It uses the Generalised Method of Moments (GMM) method for panel data analyses.
The results of the quantitative analysis show investments by multilateral DFIs enhance growth: a 10% increase in multilateral DFI investments increases incomes by about 1.5%. However, the magnitude of the impact of DFI investments on growth is not uniform throughout all countries, as it differs depending on the level of income in recipient economies. In particular, multilateral DFI investments have a stronger impact on growth in lower-income than in higher-income countries. Indeed, a 10% increase in multilateral DFI investments leads to a 1.3% increase in incomes in lower-income countries, compared with an increase of just 0.9% in higher-income countries. The findings of the sectoral analysis also show that multilateral DFI investments directed to infrastructure provide the largest impact
on economic growth, followed by investments in the industry and agriculture sectors. A 10% increase in multilateral DFI investments is found to increase growth by roughly 0.8% in the infrastructure sector, 0.4% in the industry sector and 0.2% in the agribusiness sector. Splitting the sample into lower-income countries and higher-income countries highlights that the strategic importance of the considered sectors of investment differs depending on the stage of development of the recipient country. In lower-income economies, multilateral DFI investments in agriculture and infrastructure play the most significant role in promoting economic growth. Higher-income countries, on the other hand, benefit much more from multilateral DFI investments targeting the industry sector in addition to those directed to infrastructure.
Te Velde (2011) examines the evidence of the impacts of DFIs on growth during periods of crisis. In particular, he argues that during (and after) the 2008–2009 financial crisis, the reduction in commercial bank investments in developing countries was, in some cases, replaced by investments from DFIs, which therefore contributed to supporting economic recovery in crisis-affected countries (e.g. the IFC’s Infrastructure Crisis Facility). Nevertheless, te Velde (2011) highlights that not all DFIs were able to be counter-cyclical during the global financial crisis. Indeed, while EDFI portfolios increased by 14% in 2009 (compared with 12% in 2008 and 21% in 2007), there was no growth in the case of the IFC (in euros).
The growth-enhancing role of DFIs in periods of crisis is also recognised by Dalberg (2010), who argues that DFIs played an important role in sustaining growth in the developing world, and especially in African countries, during the global financial crisis when these economies were experiencing a dramatic reduction in investments by the private sector. DFIs succeeded in doing this in three ways:
• Acting counter-cyclically: while private sector investments fluctuated greatly, DFIs maintained a level of investment similar to that in previous years. EDFIs’ African portfolio, for example, increased by about 10% from 2007 to 2008.
• Back-stopping financial institutions: DFIs supported the functioning of the private sector by replacing the services of commercial banks, which were driven out by risk factors or liquidity shortages.
• Acting as stabiliser: DFIs played a crucial role in stabilising investments in developing countries, through their role as investment partners.
Dalberg (2010) also notes that an additional strength of DFIs in periods of crisis is that they can introduce new products and services quickly to respond to market needs. For example, during the global financial crisis, Norfund was able to quickly approve a €2.7 million loan to the Emergency Liquidity Facility (ELF) to enable Latin American microfinance institutions to better cope with liquidity problems stemming from the crisis. Nevertheless,

The macroeconomic effects of development finance institutions in sub-Saharan Africa 13
Dalberg (2010) highlights a number of factors that made DFIs unable to respond sufficiently to the needs of the market. In particular, certain DFIs were constrained by operational rules on increasing the maximum level of equity participation or on increasing the percentage of total lending to individual projects. Swedfund was able to receive quickly additional capital injections in 2009 to counteract the financial crisis, but it was difficult for most DFIs to get funding for this purpose at short notice. Moreover, multilateral DFIs such as the IFC received additional funding relatively quickly but existing procedures impeded fast disbursements.
On its website, EIB reports that, during the Eurozone crisis, it provided support to economic recovery in Europe through €60 billion in additional lending over the period 2013–2015. 1
Through a systematic review of the literature on DFI infrastructure projects, Spratt and Ryan-Collins (2013) find evidence of DFIs’ additionality for growth – that is, of the fact that DFI activities (in infrastructure) support growth. In particular, the authors find DFIs boost economic growth by actively seeking to influence 1) project design and, to a lesser extent, 2) policy features. In other words, DFIs’ impact on growth by selecting growth-enhancing projects, such as those that remove or alleviate growth bottlenecks (e.g. constraints on productivity, international trade, physical infrastructure, etc.), generate employment and government fiscal revenues, produce knowledge and technology transfer or mobilise investment in green energy or energy efficiency. Moreover, DFIs affect growth by influencing a country’s legal and regulatory framework as well as public sector capacity, although this is more challenging, as most bilateral DFIs do not have a mandate to change these policy features. Spratt and Ryan-Collins highlight that, to maximise DFIs’ growth impact, it is important to devote greater resources to project screening and appraisal. Indeed, there is evidence that inadequate understanding of the policy or political context before committing to a project translates into disappointing outcomes for design and policy additionality for growth.
To our knowledge, the above studies are the only existing empirical evidence addressing specifically the relationship between DFIs and economic growth. There are, however, a few papers looking at the impact of DFIs on certain factors such as knowledge and technology transfer, which in the literature are recognised as key mechanisms for economic growth.
Namusonge (2004), for example, investigates the role of three Kenyan DFIs (i.e. the Industrial Development Bank, the Industrial and Commercial Development Corporation and Kenya Industrial Estates) in the transfer of technological capabilities in small and medium enterprises (SMEs) in Kenya – a recognised channel through which DFIs may encourage private sector development and as a consequence, economic growth (IFC, 2011). The method used is to review
reports and interview a selected number of stakeholders (i.e. project officers and top management officials of the considered three DFIs as well as client enterprises), and then analyse qualitatively and quantitatively the collected information to determine the success rates of projects financed by DFIs. The findings of the research show DFIs play an important role in transferring two types of skills: production capabilities (i.e. skills and knowledge needed for operating and improving a plant) and investment capabilities (i.e. pre-investment and project execution skills and knowledge). In particular, it found that, in Kenya:
• 84% of the entrepreneurs acquired production capability through financing from the DFIs.
• 74% of the entrepreneurs acquired investment capabilities thanks to DFI investments.
• The DFIs did not assist 79% of the entrepreneurs in acquiring minor change capability (i.e. ability to improve and continuously adapt a firm’s products and processes).
DEG (2016) also shows through various case studies that its investments contribute to developing local skills in the private sector, thus producing substantial benefits for stakeholders (in particular private companies, employees, suppliers, clients and the local community), and having an overall positive impact on local economies:
• In China, DEG has helped HAPE, a toy manufacturer, to develop a standardised training programme for its workforce and wood suppliers. This experience shows how investing in education of the workforce, along the value chain and within the community, can help bridge local skills gaps, with positive long-run effects.
• In India, DEG has supported a German producer of welding machines that established a collaboration agreement with the Don Bosco Centre, an experienced provider of technical vocational courses, in Pune in order to train workers to qualify as service technicians for welding machines. The availability of well-trained service technicians is recognised as a key success factor for market entry in India, and the investment is expected to translate into positive economic and social impacts for the local economy.
• In Bangladesh, DEG supported a producer of leather goods to develop a comprehensive training programme that provides technical training not only for its own production facility but also for two local tanneries. The training was desperately needed, since more than 90% of the suppliers’ employees suffer from occupational diseases. The programme helped improve health and safety, with positive impacts on working conditions as well as production.
1 See http://www.eib.org/about/index.htm

14 ODI Report
A number of DFI (project) evaluations also point to the role played by DFI investments in promoting knowledge and technology transfer. An evaluation of the Industrialization Fund for Developing Countries (IFU) conducted by the Danish International Development Agency (Danida, 2004) reports that ‘human capital investments through training and involvement of local staff and changed management regimes have been key features of the Danish enterprises’ activities’ supported by IFU. ‘Technology transfer, in terms of technical equipment and procedures, transparent and open management principles and corporate governance… as well as quality control and monitoring are mentioned as impacts of the Danish enterprises’.
Moreover, an evaluation of the Least Developed Country (LDC) Infrastructure Fund conducted by the Policy and Operations Evaluation Department (IOB) of the Dutch Development Cooperation Ministry of Foreign Affairs (IOB, 2009) also highlights that construction of the drinking water treatment plant in Sudan financed by the Dutch Development Bank (FMO) enhanced technical skills of local employees at the construction site as well as those of Khartoum State Water personnel.
An evaluation of Swedfund International conducted by the Swedish Agency for Development Evaluation (SADEV, 2008) finds that some type of transfer of knowledge and business practice took place in 21 out of 44 studied investments. For 15 investments, there was insufficient information, while for eight no knowledge or business practice transfer was found. Transfer of knowledge and business practice includes examples of industry specific training as well as more general training in accounting, management, sales and marketing. If a trend can be discerned in this, it is that the larger the company is, the more dedicated it is to these types of activities. It is, however, symptomatic that even companies that have been established in developing countries for many years are often still dependent on expatriate expertise for the management of the company. How much focus there has been on education and knowledge transfer also generally varies substantially between but also within the same sectors.
The evaluation also finds Swedfund’s investments had a smaller impact in terms of technology transfer than in terms of knowledge transfer. Indeed, in just 13 (compared with 21 in the case of knowledge and business practice transfer) of the 44 studied investments some type of technology transfer was found.
An evaluation of Norwegian business-related assistance conducted by the Norwegian Agency for Development Cooperation (Norad, 2010) reports that, in Bangladesh, the company Scancement funded by Norfund introduced new technology (i.e. Portland composite) into the country; this requires less clinker and is therefore cheaper.
An important channel through which DFIs affect growth is by raising gross fixed capital formation (GFCF). Te Velde (2011) argues that DFI support is now equivalent to a quarter of official development assistance (ODA), and
finds there are 26 developing countries where the (average of) IFC, EIB and the UK Development Finance Institution (CDC) together make up between 2% and 12% of total domestic investment. Using standard regression analyses, and based on data for EIB, EBRD, IFC and CDC from 1985 onwards (depending on data availability), he finds DFIs have indeed raised investment (GFCF) in recipient countries compared with the constructed counterfactual. A 1 percentage point increase in DFI as a percentage of gross domestic product (GDP) would lead to a 0.8 percentage point change in the investment ratio. Hence, for 26 countries, DFIs have kept investment-to-GDP ratios more than 1.5 percentage points higher than would otherwise have been the case.
2.2.2 Impact on job creation and labour productivity
The private sector is the major employer and creator of jobs. Indeed, in developing countries, 90% of jobs are in the private sector (World Bank, 2005) and nine out of 10 employment opportunities are created by private enterprises (Runde, 2014). Therefore, by fostering private sector development, DFIs play a critical role in enhancing job creation, which is recognised as one of their top priority objectives and is also used as a key indicator to measure DFIs’ development impact (see Massa, 2013). The Let’s Work initiative has begun to bring DFIs together to measure the impact they have on job creation (te Velde, 2015).
According to Massa (2013), DFIs promote employment through four main channels:
• Additionality: by focusing on their mandate on additionality, DFIs help increase the volume of economic activity in a country, and as a consequence create employment.
• Demonstration effects: DFIs’ projects can demonstrate the potential of new types of investment, thus leading to further investments by the private sector, which in turn lead to more economic activities and more employment creation.
• Technical change: DFIs contribute to knowledge enhancement through a number of channels, including capacity-building and technical assistance, changes in business regulatory environments and the uptake of environmental, social and corporate governance standards in business practices. Such support fosters better managerial and innovation capabilities, which increase firms’ potential to grow and invest in technology and skills, with possible consequent employment opportunities.
• Forward and backward linkages: DFIs can support firms’ (e.g. manufacturing firms), which have both forward and backward linkages in an economy – that is, manufacturers need inputs from suppliers (backward linkages) but can also sell their products to distributors

The macroeconomic effects of development finance institutions in sub-Saharan Africa 15
(forward linkages). By supporting growth in these firms, they may produce both forward and backward effects, which in turn will also affect employment.
Through these channels, three types of employment are created:
• direct jobs: jobs created within firms supported by DFIs • indirect jobs: jobs created in supplier/distributor
companies linked to DFI-supported firms • induced jobs: jobs resulting from increased
consumption by direct and indirect employees within DFI-supported firms.
The relevance of these types of jobs created differs markedly by sector. Indeed, Massa (2013) and Jouanjean and te Velde (2013) argue that in the manufacturing sector most of the jobs created by DFI investments are direct jobs, whereas in the tourism and infrastructure sectors indirect and induced jobs, respectively, represent the largest share of jobs created (Table 1).
In the literature, there seems to be a consensus that measuring the precise impact of DFIs on employment creation is a challenging task (see IFC, 2013; Massa, 2013). Several DFIs in their institutional publications report
information on the number of direct and to some extent indirect jobs created in client companies (see Table 2).
Dalberg (2010) highlights that, up to 2010, EDFI member investments had directly led to the creation of around 422,000 jobs and indirectly to about 1.3 million jobs. The study also found that every €1,000 spent on an EDFI member project resulted in the creation of 0.08 direct jobs and 0.27 indirect jobs.
By using a production function approach and assuming DFI investments help to increase GFCF within project countries and that DFI investments cause an increase in GDP, which, in turn, increases employment, Jouanjean and te Velde (2013) estimate the direct and indirect employment effects of 2007 investments of a selected set of DFIs (EIB, CDC, IFC, Proparco, DEG and EBRD) at national level. The results show DFI investments have helped create 2.6 million jobs in over 70 developing countries. The numbers of jobs created have varied among DFIs from 1.3 million by the EIB, 1.2 million by IFC and 0.1 million by CDC, reflecting the amounts invested. The authors also argue that, if DFIs ceased to invest, there would be 2.6 million fewer jobs.
Five case studies on projects financed by the IFC also highlight that DFI investments generate significant direct jobs (mostly skilled) as well as indirect jobs (accounting for a large share of unskilled and semi-skilled jobs compared with direct jobs) (Table 3).2
Table 1: Relevance of DFI impacts on employment creation by sector
Source: Massa (2013).
Sector of DFI investment Direct job effects Indirect job effects Induced job effects
Manufacturing Very important Potentially important Less important
Tourism Medium important Very important Less important
Infrastructure Less important Temporary Very important
Agriculture Very important Less important Less important
Table 2: Direct and indirect jobs supported by selected DFIs in 2014
Note: (*) Figures based on 82% of the projects financed in Africa and
South Asia in 2014.
Source: BIO (2014); CDC (2014); DEG (2014); Proparco (2014).
DFI Direct jobs Indirect jobs
Proparco 150,700 97,100
DEG 190,000 653,000
BIO 17,000 70,000
CDC* 533,001 284,000
Table 3: IFC case studies – jobs created
Direct jobs Indirect jobs Sector, country
Mriya 2,505 7,390 Agribusiness, Ukraine
PRAN 294 2,198 Agribusiness, Bangladesh
Ecogreen 177 3,646 Chemicals, Indonesia
OCL 293 7,156 Cement, India
Safal 4,200 24,000 Steel, Africa
Source: Adapted from Kumar and Abdo (2012).
2 See micro case studies in manufacturing, agribusiness, and services, available at http://www.ifc.org/wps/wcm/connect/topics_ext_content/ifc_external_corporate_site/idg_home/job-creation-prelim-findings

16 ODI Report
Nevertheless, IFC (2013) argues that, in order to estimate DFIs’ job creation effects in an economy, besides direct and indirect jobs, other factors should be considered: 1) induced jobs; 2) second-order growth effects; and 3) net job creation.
There is evidence that induced jobs created by DFI-supported firms are significant. For example, a study conducted by Kapstein et al. (2012a) to assess the impact of IFC financing in Ghana found IFC’s investments in the country had led to 13,200 induced jobs. In a similar way, Kapstein et al. (2012b) found IFC financing in Jordan created 3,800 induced jobs. In its 2014 annual review, CDC reports that 82% of the projects financed over the year in Africa and South Asia led to 126,000 new induced jobs as workers spend a portion of their wages on local goods and services (CDC, 2014).
Second-order growth effects refer to jobs created thanks to a given DFI investment that help relieve a crucial growth constraint. For example, DFI investments can lead to more reliable power, which allows firms to produce more and more efficiently, thus increasing employment. Two studies attempt to measure second-order growth effects stemming from DFI investments. In particular, a study by Datta et al. (2013) shows the construction of power transmission lines in India and Bhutan by a joint venture company supported by the IFC (Powerlinks Transmission Limited) generated significant second-order growth effects in addition to direct, indirect and induced jobs. It is estimated that, because of increased power supply, 75,000 jobs were generated in six years, while the enhanced reliability of the supply of power led to an additional 1,600 jobs in West Bengal over the same time period.
Moreover, Scott et al. (2013) study the impacts on employment of the Bugoye small hydropower project in Uganda. By using a production function estimated from the most recent World Bank Enterprise Survey data and estimating a multiplier using expenditure and employment data, the authors find second-order growth effects (as well as induced jobs) are more significant than direct and indirect effects.3 Some DFIs are also making an attempt to measure the second-order growth effects of their overall investments. CDC, for example, computes that 388 projects financed in Africa and South Asia in 2014 led to the creation of 843,000 new jobs through increased supply of power and finance (CDC, 2014).
Net job creation refers to jobs created (or expected to be created) minus jobs destroyed (or expected to be destroyed) as a result of a given project in the economy (IFC, 2013). In other words, it accounts for job losses experienced in competing firms during the project. For example, a Food and Agriculture Organization (FAO) and EBRD (2011) study reports that the creation of modern retailers in Poland, Bulgaria and Romania led to job losses in competitors that more than offset the number of jobs created by the creation of the modern retail stores. In a similar way, Basker (2005) finds that, in the US, for every
100 jobs added by introducing modern retail stores, 50 were lost in competing enterprises over the next five years. IFC (2013) highlights that measuring net job creation effects is very difficult since it requires knowing the relative elasticity of the job supply.
Next to investigating the impact of DFI investments on the different types of jobs created, few existing research studies have also focused on assessing the impact of DFIs on the quality of labour (e.g. high labour productivity or labour standards). Jouanjean and te Velde (2013) examine the effects of DFI investments on labour productivity using a panel of 62 developing countries over a period of six to 11 years and implementing various econometric techniques ranging from ordinary least squares (OLS) to panel data and treatment effects methodologies. The study finds a significant effect of DFIs on labour productivity in several regressions using various measures of DFI activity. In particular, using the OLS equation, for each percentage point shift in the ratio of DFIs over GDP, the effect of DFIs on labour productivity is found to be 3.4% and statistically significant. Using the equation that controls for selection bias, the effect is also found to be significant and equal to 7.5%. Using the lower estimate, the authors find DFIs have increased labour productivity by at least 3% in 21 low- and middle-income countries. In Ghana, Kenya and Zambia, the effects are found to be in the order of 2.3%. The treatment effect on labour productivity is found to range between 0 and 15% while the average treatment effect is found to be around 6%.
Ebert and Posthuma (2010) examine the impact of DFIs on the quality of jobs created of 16 global, regional and bilateral DFIs with integrated labour provisions (that is, ‘(i) any labour standard which establishes minimum working conditions, terms of employment or worker rights, (ii) any norm on the protection provided to workers under national labour law and its enforcement, as well as (iii) any framework for implementation and monitoring of these issues’) in their investment policies. The authors started from the observation that, over the past two decades, an increasing number of DFIs (including IFC, OPIC, IFU, FMO, OeEB and DEG, among others) have put in place complex procedures to implement labour provisions in their operations. For example, the IFC enhanced monitoring of client companies to ensure they comply with IFC Performance Standards, or provided technical assistance to boost capacity-building on labour provisions. The study then describes a number of cases in which a positive impact of DFIs’ labour policies on working conditions has been found. For example, in the case of a Brazilian airline, IFC’s labour provisions helped end anti-union activities (see also Bakvis and McCoy, 2008). Moreover, in the case of a Ugandan construction union, IFC labour policies contributed to making the company apply a collective agreement (see also Murie, 2009). A number of additional successful cases in Nigeria, Nicaragua and Turkey related to IFC’s interventions are also reported.
3 See CDC and ODI (2016) for a discussion on the limitations of the studies by Datta et al. (2013) and Scott et al. (2013).

The macroeconomic effects of development finance institutions in sub-Saharan Africa 17
2.2.3 Impact on tax revenues
The private sector is recognised as a crucial provider of tax revenues that governments in developing countries may use to provide vital public goods such as infrastructure, health and education. Therefore, DFIs may have an important impact on taxes by promoting private sector development.
Gathering evidence on the fiscal contributions of DFIs is rather simple since tax revenue is one of the key quantitative indicators several DFIs use to measure their development impact. From a careful analysis of a selected sample of institutional publications of different DFIs, it emerges that empirical evidence points to a significant impact of DFIs on tax revenues:
• BIO states that projects approved in 2014 contribute around €2.3 million in government revenues thanks to direct investments in SMEs and infrastructure (BIO, 2014).
• DEG claims its projects generated €663 million in 2014 (DEG, 2014).
• Proparco states that its 2014 investments will generate €537 million in additional government tax revenues per year (Proparco, 2014).
• CDC reports that in 2014 $2.34 billion in tax revenues were generated by financed projects in Africa and South Asia (CDC, 2014).
Different types of sources in the literature seem to confirm DFIs’ positive impact on government revenues. Indeed, a case study on the OLKARIA III project in Kenya, which was funded by DEG jointly with other partners and aimed at expanding capacity of the geothermal power plant, reveals that DFIs’ investments generated €5 million through tax revenues and royalties – a notable amount given Kenya’s budget deficit of -3.5% of GDP (Dalberg, 2010). Moreover, a 2004 evaluation of IFU highlights that the financed projects lay the basis for improved government revenues (Danida, 2004). A paper by Wetherill (2010) sheds light on the role of DFIs not only in increasing tax revenues but also in improving the management of such incomes. According to the author, this is particularly true and relevant in oil countries, where DFIs have the power to alleviate the issue of the resource curse by providing technical assistance.
Notwithstanding the successes described above, some research studies in the literature stress that the potential of DFIs to raise tax revenues is threatened by the fact that these institutions often support investments routed through secrecy jurisdictions, thus leading to significant losses of tax revenues to developing countries (see, among others, Bracking et al., 2010 and Kwakkenbos and Romero, 2013). Vervinckt (2014) looks at investments of three multilateral DFIs and 14 bilateral DFIs, and reports that:
• At the end of 2013, 75% of CDC fund investments went through tax havens. Between 2000 and 2013 these amounted to $3.8 billion.
• At the beginning of June 2014, more than 70% of BIO’s investment funds were domiciled in secrecy jurisdictions. These amounted to $207 million.
• At the end of 2013, 28% of Norfund’s investments were channelled through tax heavens. These amounted to $339 million.
• At the end of 2012, at least 15% of DEG’s investments were channelled through tax havens.
Vervinckt also highlights that most DFIs have adopted internal standards on the use of tax havens but these policies are not ambitious enough since they rely heavily on the ratings put forward by the Organisation for Economic Co-operation and Development (OECD) Global Forum on Transparency and Exchange of Information for Tax Purposes, which appear to have severe limitations. Moreover, DFIs’ due diligence procedures usually do not require their investee companies to report on a country-by-country basis on taxes paid and other indicators of economic performance, and most DFIs feature a severe lack of portfolio transparency. Of course, DFIs need appropriate tax jurisdictions to leverage private sector capital, and forcing other routes may ultimately mean fewer investments and lower tax revenues.
2.2.4 Impact on poverty reduction
Increased private investment is often associated with declining rates of poverty, but the effects are often indirect. Although the mission statements of several multilateral and bilateral DFIs claim helping people to escape poverty and improve their lives is a priority of their investments, Spratt and Ryan-Collins (2013) undertake a thorough literature survey on infrastructure investments and find little evidence to support the proposition that DFIs seek to influence project design and the policy context to increase direct poverty impacts. Indeed, among the 86 priority studies covered, just four examples were found of evidence of DFI projects resulting in direct poverty reduction outcomes, and all were funded in part by non-commercial financing. Moreover, none of the reviewed studies suggested that DFIs ‘are actively engaged with public sector capacity building with respect to poverty reduction, or that they aim to influence policy so as to: (i) Encourage pro-poor institutional and regulatory reform; (ii) Support the engagement of poor and vulnerable stakeholders during project planning’ (ibid.)
These findings are in line with the outcomes of an evaluation of 481 IFC projects over the period 2000–2010 conducted by IEG (2011). This finds that only 13% of the reviewed projects had objectives with an explicit focus on poor people, and 87% of these included interventions that engaged poor people directly through employment or provision of goods and services. Moreover, just 14% of the assessed projects included mechanisms for targeting poor people directly, mainly geographic targeting mechanisms (i.e. targeting project outputs to areas where poor people live).
Lemma (2015) and Spratt and Ryan-Collins (2013) provide a possible explanation for the limited focus by

18 ODI Report
DFIs on their impact on poverty. According to these authors, it is challenging for DFIs to deliver direct poverty impacts since their mandates, financial structure and skills are not designed to enable this.
It is worth noting, however, that the indirect effects of DFIs can be considerable. DFI investments for specific projects can lead to employment creation and as a consequence, to positive impacts on poverty. Dangelmaier (2012), for example, assesses the impact of a DEG project company in China that cultivates organically grown rice, freeze-dried organic vegetables and organic fruits, and claims the ‘project company contributes to eradicating poverty (MDG 1) through the creation of approximately 500 new jobs’. Nevertheless, it should be noted that it is not always the case that employment creation contributes to poverty reduction (Bortes et al., 2011). Indeed, the creation of highly skilled jobs in poor countries with a low-skilled labour force may have minimal effects on poor people. Moreover, the jobs created by DFIs’ investments may not benefit the poor because of significant rigidities in labour markets in developing economies. In some of their project assessments, DFIs also do not look specifically at incomes resulting from jobs created through their investments, making it even more difficult to assess the contribution of employment to poverty reduction.
2.2.5 Impact on food security
In the context of high and volatile food prices, growing demand for animal protein and biofuels, increasing water scarcity and constrained food trade, food security has become a key global challenge. Given that it is the private sector that produces, processes and distributes most of the food consumed in the world, DFIs can play a key role in enhancing food security by encouraging private sector development.
Empirical evidence on DFI impacts on food security is provided mainly in the form of case studies. For example, the EBRD (2011) reports that the Private Sector for Food Security Initiative (launched in 2011) facilitates private sector investment in order to increase food production by enabling a better business environment through policy dialogue, technical assistance and global coordination. Moreover, in 2010, the EBRD provided finance and technical assistance to Georgian enterprises and the result was that harvested volumes almost doubled compared with the previous year, and the cost of production decreased (ibid.).
In its annual review, CDC (2014) reports a number of country case studies showing the successful impact of the DFI on food security:
• In Sierra Leone, affected by the Ebola crisis, CDC together with Standard Chartered provided new loans to local trading companies involved in the import and distribution of key food staples (e.g. rice, flour, sugar, cooking oil and beverages, etc.), thus playing a critical role in supporting food security in the country.
• In 2013, in Nigeria, CDC provided a loan facility to support the development of a new urea-based fertiliser
plant. Next to other positive impacts, this investment is expected to improve farm yields and agricultural productivity, which are critical to Nigeria’s long-term food security.
There is also evidence of positive effects of IFC investments on food security. The IFC (2015) reports that:
• In Kenya, a $7 million loan helped Vegpro Group increase its production by buying fruit and vegetables from 4,000 small-scale farmers, thus enhancing food security in the region.
• In Brazil, IFC’s financing to Asa Alimentos helped the poultry and pork producer enhance its production capacities, thus increasing food availability for 3.5 million people by 2017.
• In Mexico, a $10 million loan helped Acuagranjas Dos Lagos expand its fish farming and processing operations, thus helping address increasing demand for tilapia in Mexico and in global markets, and reducing pressure on wild fish stocks amid three decades of steadily growing global fish consumption.
In addition to the case studies, a study by Faye et al. (2013) assesses the impacts of DFI investments in the agribusiness sector in Africa on food security. In particular, the authors argue that large-scale agribusiness projects in African countries are likely to reduce the amount of land available for small-scale farmers, and, given the continent’s low agricultural productivity per land unit, reduced access to land will translate into lower agricultural output, with severe implications for food security. The situation is worsened because recent increases in food prices have increased the vulnerability of many African households to food insecurity. According to Faye et al., DFI investments may have a positive impact on food security by enhancing local crop productivity through training provided to local farmers and the introduction of high-yield varieties and fertilisers. In such a way, they may foster local production even if farmers have small lots of land. This approach was applied to the Addax Bioenergy Project in Sierra Leone financed by the African Development Bank (AfDB). The project involved the cultivation of sugarcane using 10,000 ha of land for the production of ethanol and therefore it could have threatened farmers’ access to land. In order to overcome this potential negative consequence, the project promoted the introduction of high-yield rice varieties and the creation of farmer field schools, with the objective of improving farmer skills in the use of modern inputs such as fertilisers and in compost-making. Thanks to this, local food security was protected.
2.2.6 Impact on service delivery
The private sector plays a key role in providing essential services such as infrastructure, health, education and finance. World Bank President Jim Yong Kim claimed that, without private sector investment, ODA ‘won’t fund the critical investments needed… to meet developing

The macroeconomic effects of development finance institutions in sub-Saharan Africa 19
countries’ growing infrastructure needs’ (Jim, 2013). Therefore, by fostering and leveraging private sector investment, DFIs contribute to enhancing the provision of essential services in the developing world.
A thorough systematic literature survey conducted by Spratt and Ryan-Collins (2013) confirms that DFIs may help enhance the provision of infrastructure, particularly in low-income countries (LICs) and in less commercially attractive sectors, through financial additionality and to a lesser extent through demonstration effects. Indeed, according to the authors, DFIs are able to:
(a) supply long-term finance, which is often essential for infrastructure but frequently unavailable in LICs;
(b) mitigate project risk, particularly in the early stages, thus leveraging additional finance by improving the attractiveness of deals (again, this is often crucial in LICs); and
(c) provide and leverage finance counter-cyclically, either lending when private investors will not, or retaining positions when the private sector would pull out (this is less likely in good times).
Moreover, the authors highlight that DFIs can leverage private sector investments in the infrastructure sector by providing an example of success (demonstration effects). However, the existing evidence on DFIs’ demonstration effects is rather limited, given the too recent introduction of DFIs’ impact evaluation systems as well as the difficulty of proving causality. It is also highlighted that demonstration effects are complicated because private investors do not enjoy the same advantages that make it possible for DFIs to realise their investments (e.g. to borrow and lend on highly favourable terms).
The importance of DFIs in providing the much-needed infrastructure in developing countries is stressed in a keynote speech by Governor of the Central Bank of Nigeria, Sanusi Lamido Sanusi (2012). This highlights that Nigeria requires over $10 billion annually over the next 10 years to fill the infrastructure gap; looking at the experience of DFIs in India and Brazil, the governor argues that DFIs in Nigeria may play a key role in responding to the country’s infrastructure needs but they need to be granted operational autonomy, as well as to improve corporate governance and business models, increase capitalisation and enhance capacity building. This is in line with the findings of the study by Bolaji Adesoye and Abdulmaliq Atanda (2012).
Moreover, Wetherill (2010) sheds light on the financial additionality potential of DFIs operating in the oil and gas upstream infrastructure sector in Africa. In particular, the author argues that, in a sector characterised by the participation of several different investors, DFIs can produce the greatest impacts by investing in selected projects with higher risks and higher development returns – namely, projects in emerging producer countries (e.g. Ghana, Sierra Leone and Uganda, among others) and projects sponsored by smaller, independent and indigenous firms operating in emerging or established producer countries.
Several country case studies reported by the different DFIs seem to confirm that DFIs play a key role in providing services ranging from infrastructure to health, education and finance in developing countries. Covering the results of these numerous case studies is beyond the scope of this paper. Therefore, we refer the interested reader to the DFIs’ institutional publications (e.g. annual reports) and websites for detailed information on the outcomes of the case studies.
Nevertheless, existing evaluations of DFIs/DFI projects lead to more mixed results in terms of the impact of DFIs on service delivery. For example, an evaluation of 12 projects (three in Bangladesh, four in Tanzania, two in Mozambique, one each in Benin, Togo and Sudan) supported by the FMO’s LDC Infrastructure Fund reports that in six cases the fund did not have a catalytic impact and in four cases it was also not additional (IOB, 2009). For the other cases, the assessment of the catalytic and additionality impact was positive, meaning the intervention of FMO through the LDC Infrastructure Fund made possible projects that otherwise would not have been financed. Moreover, a 2008 evaluation of Swedfund finds that the considered investments did not contribute to the development of financial markets, but quite a few of them have played a key role in developing new infrastructure, such as a road, a port and cold storage facilities (SADEV, 2008).
2.2.7 Impact on climate change mitigation/adaptation and environmental sustainability
Climate change is one of the greatest threats the world is facing, and large amounts of financial resources are needed to respond to this challenge. The Global Commission on New Climate Economy (2015) estimates that total investments needed to adapt to climate change range from $300 to $400 trillion for the coming 15 years. The private sector is crucial for successful climate change mitigation and adaptation initiatives, since it may support businesses that follow new paths of energy efficiency, develop new technologies for decreasing the carbon footprint and contribute to the creation and use of adequate environmental technologies. By encouraging private sector development, DFIs may help address climate change issues and promote environmental sustainability.
According to Cochran et al. (2015a), DFIs can have an impact on climate change mitigation/adaptation and environmental sustainability through three channels:
1. Supporting low-carbon, climate-resilient development models: DFIs can encourage and facilitate the shift of public and private investments towards low-carbon, climate-resilient projects, as well as foster changes in regulatory frameworks. More precisely, DFIs can play a crucial role by:
a) facilitating access to capital and overcoming market failures
b) assisting in developing national, regional and local development strategies and regulatory frameworks coherent with a low-carbon transition

20 ODI Report
c) working with local banks and financial institutions in the establishment of green credit lines.
2. Mainstreaming adaptation: DFIs can contribute to ensuring climate risks are systematically taken into account in investment decisions and that adequate adaptation measures are undertaken.
3. Integrating financial risk and appropriately valuing investments: DFIs can play a role in improving the integration of climate (physical) and carbon (regulatory) risks into investment decision-making and selecting investments.
Empirical evidence shows DFIs are key in facilitating global public climate finance flows. Cochran et al. (2015b) report that, in 2013, DFI climate financing (i.e. financing provided by international multilateral and bilateral institutions as well as by national development finance institutions) amounted to $126 billion (38% of total climate finance flows). This is in line with numbers reported by the Climate Policy Initiative (CPI, 2014), as shown in Figure 2.
Moreover, a 2015 report authored by the European Development Finance Institution members (EDFI, 2015) highlights that, over the period 2009–2014, EDFI climate financing quadrupled, moving from €517 million in 2009 to €2,167 million in 2014, for a cumulative total of €6,174 million. A total of 31% of this amount was directed to hydropower projects, 18% to wind, 11% to solar, 6% to bio-fuel/mass and 2% to geothermal projects.
In the literature, the evidence on impacts of DFIs on climate change and environmental sustainability is provided mainly in the form of assessments of specific projects and initiatives through case studies, and information is spread among DFIs’ institutional publications and websites. For example, EDFI (2015) reports that the Interactive Climate Change Facility established by EDFI members in 2011 to finance renewable energy and clean energy projects has contributed to reducing carbon emissions by almost 2 million tonnes per year and installing 1,147 MW of additional renewable energy capacity. Moreover, the $55 million investment by Proparco to finance the expansion of Azito Energie, a thermal power plant in Côte d’Ivoire, is expected to meet roughly half of Côte d’Ivoire’s power consumption
Figure 2: Climate finance flows, 2013
Source: CPI (2014).

The macroeconomic effects of development finance institutions in sub-Saharan Africa 21
needs, reducing greenhouse gas emissions annually by approximately 400,000 tonnes of CO2.
5 The DEG’s $18.5 million investment will fund the expansion of the Solar Park La Huayca in Chile, which will increase production capacity from 1.4 MW to 30.5 MW, thus avoiding emissions of 24,500 tonnes of CO2 per year compared with power generation with conventional technologies.6 Furthermore, the IFC Cleaner-Production Initiative in Bangladesh, which aims to make the country’s garment industry more sustainable and globally competitive, helped textile factories save $1 million and reduce water consumption by 75 million litres. 7
A number of studies have assessed the impact of DFIs on climate change and environmental sustainability. Some examine the environmental impacts of environmental (and social) standards and related procedures promoted by DFIs in their funded projects. Wetherill (2010), for example, finds evidence of positive impacts on the field of environmental (and social) standards introduced in projects in the oil and gas sector in Africa, such as those promoted by IFC in the Tullow Oil project in Ghana. An evaluation of IFC’s activities conducted by IEG (2007) also finds that companies funded by the IFC that adopted environmental (and social) standards were more likely to deliver sustainable environmental (and social) impacts. The evaluation of the LDC Infrastructure Fund conducted by IOB (2009) finds evidence of positive environmental impacts of DFI investments in renewable energy. In particular, the assessed Mtwara/Artumas integrated gas to power project in Tanzania funded by FMO is found to have led to a CO2 reduction of 784,000 MT per year.
Research studies assessing DFIs’ impacts on climate change at the macro level are almost nonexistent. To our knowledge, there is just one study of this type, conducted by te Velde (2011), which examines the impact of energy efficiency projects funded by a selected sample of DFIs. In particular, the author runs regressions on the effects of DFIs on energy efficiency, expressed as energy use (kg of oil equivalent) per $1,000 GDP (constant 2005 purchasing power parity). His results show IFC and EBRD are leading to greater energy efficiency, while there are no such effects for EIB and CDC for the particular sample.
Notwithstanding the successful achievements reported above, Cochran et al. (2015a) stress that, in order to allow DFIs to fully address climate change issues and promote environmental sustainability, it is important to:
• reduce the dependence of DFIs’ operations on policy orientations
• enhance coordination in climate initiatives between donor and recipient governments
• enhance concerted and coordinated action between DFIs at the local level to avoid counterproductive competition and overlapping.
2.2.8 Conclusions
The literature review has covered a number of studies on the macro effects of DFIs, ranging from economic growth to investment, jobs, labour productivity, tax revenues, poverty reduction, food security and renewable energy. While in some areas there is close to no evidence of the impacts of multilateral and bilateral DFIs, such as in relation to the direct impact on poverty, in other areas we know much more. Consider, for example, the following summary:
• DFI investments have a positive and significant impact on economic growth, especially in lower-income countries, where a 10% increase in DFI investments is found to lead to a 1.3% increase in growth. This implies DFIs are an important engine for growth in poor economies, and therefore they may play an important role in sustaining growth in periods of crisis when private sector investments experience dramatic contractions, as was the case during the global financial crisis and Eurozone crisis.
• Channels through which DFIs affect growth in beneficiary countries include knowledge and technology transfer, as well as investment. Indeed, several DFI investments are found to contribute to developing local skills and to keeping investment-to-GDP ratios at levels significantly higher than would otherwise have been the case. A 1 percentage point increase in DFI as a percentage of GDP leads to a 0.8 percentage point change in the investment-to-GDP ratio. Using actual DFI so far for 26 countries, DFIs have kept investment-to-GDP ratios at least 1.5 percentage points higher than would otherwise have been the case.
5 http://www.proparco.fr/Accueil_PROPARCO/notre-action/PageCacheeAnte2011/Tous-les-projets/financer-l-efficacite-energetique-en-cote-d-ivoire
6 https://www.deginvest.de/International-financing/DEG/Presse/Pressemitteilungen/Pressemitteilungen-Details_181120.html
7 http://ifcext.ifc.org/IFCExt/Pressroom/IFCPressRoom.nsf/0/3F39F8701FDB88378525792C004BBC1E

22 ODI Report
• DFIs play a critical role in enhancing both the quantity and the quality of jobs. DFI investments create direct, indirect and induced jobs; increase employment by helping relieve crucial constraints on firms’ production (e.g. limited power supply); and increase labour productivity – for each percentage point shift in the ratio of DFIs over GDP, the effect of DFIs on labour productivity is found to be between 3.4% and 7.5%. Using the lower estimate, and plugging in actual DFI data, DFIs have increased labour productivity by at least 3% in 21 low- and middle-income countries. In Ghana, Kenya and Zambia, the effects are found to be of the order of 2.3%. There is also evidence of a positive impact of DFIs’ labour policies implemented in their investment operations on working conditions in beneficiary countries.
• DFIs have a significant positive impact on government revenues, which in developing countries are essential to provide vital public goods such as infrastructure, health and education.
• DFIs play a key role in enhancing food security as well as in providing essential services such as infrastructure, health, education and finance in developing countries.
• DFIs can exert positive effects on climate change mitigation/adaptation and environmental sustainability, for example by facilitating the shift of investments towards low-carbon, climate-resilient projects and ensuring climate risks are taken into account in investment decisions and adequate adaptation measures are undertaken.
In the rest of this paper, we collect and describe relevant data for DFIs and examine the country-level impact of their investments.
7 http://ifcext.ifc.org/IFCExt/Pressroom/IFCPressRoom.nsf/0/3F39F8701FDB88378525792C004BBC1E

The macroeconomic effects of development finance institutions in sub-Saharan Africa 23
As we have seen, DFIs affect global development in many ways. We now turn to describe the activities of EDFI with a view to examining their relevance. EDFI’s consolidated portfolio has experienced sustained growth over the past decade, reaching €32.9 billion in 2014, which represents an increase of €22 billion (204% overall, or 13% per year) compared with 2005 (Figure 3).8 EDFI’s number of projects has also grown steadily from about 3,000 in 2005 to more than 4,000 in 2014, although in recent years there have been some declines, possibly as a result of the 2008–2009 global financial crisis and the more recent Eurozone crisis. Indeed, the number of projects fell by 6% in 2009 and even more remarkably by 24% in 2013.
EDFI uses different investment instruments ranging from loans to equity/quasi-equity and guarantees. As shown in Figure 4, in 2005 EDFI members used mainly loans for their investments. Indeed, 52% of the consolidated portfolio was invested in loans, compared with 41% in equity and quasi-equity and 7% in guarantees. While guarantees have always represented the smallest share of EDFI’s committed portfolio over the period 2005–2014, investments in equity and quasi-equity have increased steadily since 2006 and now surpass loans. In 2014, 50% of the consolidated committed portfolio was through equity and quasi-equity.
3. Description of EDFI activities
8 Figures are based on all the 15 EDFI members: BIO, CDC, Cofides, DEG, Finnfund, FMO, IFU, Norfund, OeEB, Proparco, SBI, Sifem, Simest, Sofid, Swedfund.
Figure 3: EDFI portfolio and number of projects, 2005–2014
Note: Number of projects on right-hand axis.Source: Authors’ elaboration on data provided by EDFI.
35
30
25
20
15
10
5
0 0
500
1,000
1,500
2,000
2,500
3,000
3,500
4,000
4,500
5,000
2005
Total portfolio (in bn euro)
Tota
l por
tfolio
(in
bn e
uro)
No of projects
No o
f pro
ject
s
2006 2007 2008 2009 2010 2011 2012 2013 2014

24 ODI Report
There is a certain degree of heterogeneity among the 15 EDFI members in terms of financial instruments used (see Table 4). Some members specialise almost entirely (although not exclusively) in equity and quasi-equity in 2014 (i.e. CDC, SBI and to a lesser extent Norfund and Sifem). The majority of the committed portfolio of others (i.e. Proparco, BIO, Cofides and OeEB) is through loans. On the other hand, with the exception of Sofid, most do very little in guarantees. It is worth highlighting that investments by multilateral DFIs (i.e. IFC and EBRD) through equity and quasi-equity are significantly smaller compared with those of most of their bilateral counterparts. Moreover, guarantees still represent the second most used financial instrument of some multilateral DFIs, such as IFC.
EDFI members invest in a wide variety of sectors, ranging from the financial sector to infrastructure, agribusiness, industry/manufacturing and services (Figure 5). EDFI as a whole invests mostly in financial services and infrastructure. In 2014, 50% (€16.3 billion) of the total consolidated portfolio was invested in the financial sector (mainly in investment funds and banks); the share invested in infrastructure was equal to 24% (€7.9 billion, of which €5.4 billion was invested in power).
Notes: (*) distribution of IFC’s 2014 commitments; (**) distribution of EBRD’s 2014 gross disbursements.Source: Authors’ elaboration on data provided by EDFI.
Table 4: Distribution of DFIs’ portfolios by financial instrument, 2014
DFI Quasi & equity Loans Guarantees
Bilateral DFis
BIO 30% 70% 0%
CDC 92% 5% 3%
Cofides 34% 66% 0%
DEG 46% 54% 0%
Finnfund 62% 38% 0%
FMO 41% 55% 4%
IFU 61% 38% 1%
Norfund 84% 15% 0%
OeEB 23% 64% 13%
Proparco 17% 82% 0%
SBI 92% 8% 0%
Sifem 84% 16% 0%
Simest 56% 44% 0%
Sofid 0% 40% 60%
Swedfund 57% 42% 1%
Multilateral DFIs
IFC* 13% 44% 42%
EBRD** 18% 72% 0%
Figure 4: Distribution of EDFI portfolio by financial instrument, 2005–2014
Source: Authors’ elaboration on data provided by EDFI.
14
16
18
12
10
8
6
4
2
02005
Billio
n eu
ro
Quasi & equity Loans Guarantees
2006 2007 2008 2009 2010 2011 2012 2013 2014

The macroeconomic effects of development finance institutions in sub-Saharan Africa 25
Figure 5: Distribution of EDFI portfolio by sector, 2005–2014
Note: Number of projects on right-hand axis.Source: Authors’ elaboration on data provided by EDFI.
2468
1012141618
0 02004006008001,0001,2001,4001,6001,800
Total portfolio (in bn Euro)
Tota
l por
tfolio
(in
bn E
uro)
No of projects
No o
f pro
ject
s
Fina
ncia
l sec
tor
Infra
cstru
ctur
e
Agrib
usin
ess
Indu
stry
/Man
ufac
turin
g
Serv
ices
Othe
r

26 ODI Report
Individual DFIs have developed specific areas of expertise, as shown in Table 5. Among the bilateral EDFI members, Sifem invests exclusively in the financial sector, which is also the largest area of activity of CDC. Infrastructure is the main area of activity for Cofides and Norfund, whereas Simest and SBI operate mainly in industry and manufacturing. Agribusiness is the second largest area of activity for SBI. Sofid is the only institution to focus mostly on services. For the multilateral DFIs, infrastructure and the financial sector appear to be the two key areas of activity. EIB and AfDB direct the majority of their investments to infrastructure, whereas EBRD focuses mainly on providing financial access to the private sector.
In terms of geographical distribution, in 2014 a large share of EDFI’s portfolio was invested in African, Caribbean and Pacific (ACP) countries (including South Africa), which represented about 30% of the total consolidated portfolio, followed by South Asia (13%) and South America (11%) (Figure 6). Moreover, ACP countries were also those that experienced the greatest increase in EDFI’s allocated portfolio (€6.9 billion) compared with 2005, followed by South Asia (€3.6 billion).
Notes: (*) Bank Group loan and grant approval by sector in 2014; (--) not applicable/information not available.Source: Authors’ elaboration on data provided by EDFI. Annual or financial reports of IFC, AfDB, EBRD and EIB.
Table 5: Distribution of DFIs’ portfolios/commitments by sector, 2014
DFI Financial sector Infrastructure Agri-business Industry/ manufacturing
Services Other
Bilateral DFIs
BIO 64% 23% 6% 5% 0% 1%
CDC 93% 3% 1% 1% 2% 0%
Cofides 5% 43% 10% 35% 7% 0%
DEG 46% 22% 4% 20% 2% 8%
Finnfund 37% 32% 11% 18% 1% 0%
FMO 37% 34% 7% 5% 0% 17%
IFU 19% 20% 17% 35% 0% 9%
Norfund 37% 57% 6% 0% 0% 0%
OeEB 75% 21% 2% 1% 0% 1%
Proparco 54% 30% 7% 3% 5% 0%
SBI 0% 4% 33% 52% 7% 3%
Sifem 100% 0% 0% 0% 0% 0%
Simest 0% 7% 6% 73% 9% 4%
Sofid 0% 0% 8% 37% 55% 0%
Swedfund 37% 29% 1% 29% 0% 4%
Multilateral DFIs (commitments)
IFC 20% 14% 6% 6% -- --
AfDB ** 18% 56% 11% 1% -- --
EBRD 31% 24% -- 26% -- --
EIB (external) 41% 59% -- -- -- --
In 2014, among ACP countries, SSA economies were the main beneficiaries of EDFI’s portfolio. Indeed, in 2014, EDFI’s allocation to SSA countries amounted to almost €9 billion, four times the value in 2005 (€2.4 billion) (Figure 7). The largest share (67%) of EDFI’s total portfolio invested in SSA was allocated by FMO, Proparco and CDC. In 2014, SSA’s share of EDFI’s portfolio represented about 27% of the EDFI’s consolidated portfolio (compared with 21% in 2005), thus representing the largest regional share in EDFI’s total portfolio. Notably, the number of projects continued to increase in 2008–2009 notwithstanding the global financial crisis, but experienced a decline of more than 40% in 2013, at the time of the Eurozone crisis.

The macroeconomic effects of development finance institutions in sub-Saharan Africa 27
Note: Number of projects on right-hand axis. Note also that in 2014 EDFI’s portfolio allocated to SSA countries was bigger than the IFC’s committed portfolio directed to the same region.Source: Authors’ elaboration on data provided by EDFI.
Figure 7: EDFI portfolio and number of projects in SSA, 2005–2014
Figure 6: Distribution of EDFI portfolio by geographical region, 2005 and 2014
Source: Authors’ elaboration on data provided by EDFI.
123456789
10
0
2014 2005
ACP
MEN
A
Med
iterra
nean
Co
untri
es
Sout
h Am
eric
a
Cent
ral A
mer
icca
Sout
h-Ea
st A
sia
Sout
h As
ia
Chin
a
Cent
ral a
nd E
aste
rn
Euro
pe CIS
Russ
ia
Othe
r
Billio
n eu
ro
7
8
9
10
6
5
4
3
2
1
0 0
200
400
600
800
1,000
1,200
1,400
2005
Total portfolio (in bn euro)
Tota
l por
tfolio
(in
bn e
uro)
No of projects
No o
f pro
ject
s
2006 2007 2008 2009 2010 2011 2012 2013 2014
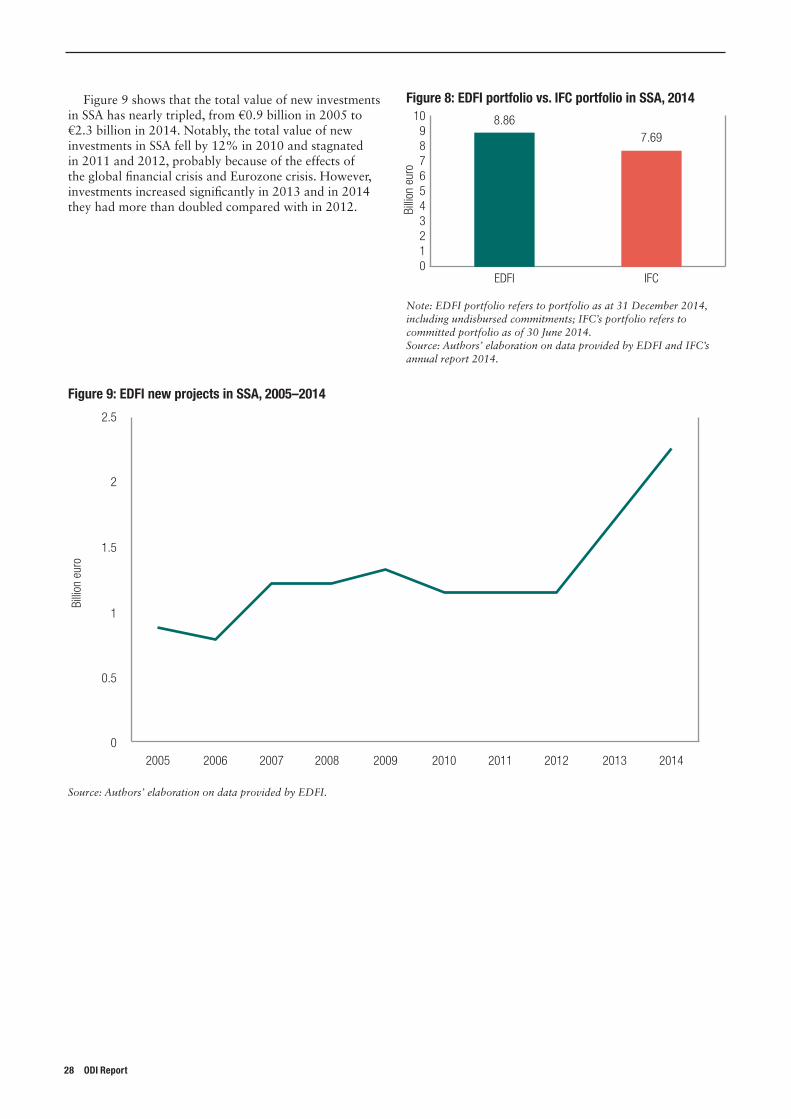
28 ODI Report
Figure 9 shows that the total value of new investments in SSA has nearly tripled, from €0.9 billion in 2005 to €2.3 billion in 2014. Notably, the total value of new investments in SSA fell by 12% in 2010 and stagnated in 2011 and 2012, probably because of the effects of the global financial crisis and Eurozone crisis. However, investments increased significantly in 2013 and in 2014 they had more than doubled compared with in 2012.
Note: EDFI portfolio refers to portfolio as at 31 December 2014, including undisbursed commitments; IFC’s portfolio refers to committed portfolio as of 30 June 2014.Source: Authors’ elaboration on data provided by EDFI and IFC’s annual report 2014.
Figure 8: EDFI portfolio vs. IFC portfolio in SSA, 2014
Figure 9: EDFI new projects in SSA, 2005–2014
Source: Authors’ elaboration on data provided by EDFI.
0
0EDFI
Billio
n eu
ro
8.867.69
IFC
123456789
10
0.5
1
1.5
2
2.5
2005
Billio
n eu
ro
2006 2007 2008 2009 2010 2011 2012 2013 2014

The macroeconomic effects of development finance institutions in sub-Saharan Africa 29
By comparing EDFI’s investments in SSA with foreign direct investment (FDI) and aid directed to the same region, it emerges that in 2014 EDFI’s investments represented 5% of FDI and 7% of aid (Figure 10). However, if we also take into account investments realised by multilateral DFIs (IFC, EIB and AfDB), then DFIs’ investments represented 16% of FDI and 22% of aid (Figure 10) in SSA.
As Table 6 shows, among EDFI members there are some institutions that are more geared than others towards SSA countries. Indeed, in 2014, Swedfund and Sofid invested 64% and 58%, respectively, of their 2014 total portfolio in SSA followed by Norfund (47%) and
Finnfund (44%). It is worth noting that total exposure in SSA of 10 out of the 15 EDFI members is higher than that of the multilateral IFC, which in 2014 invested 17% of its committed portfolio in SSA economies. Other DFIs, such as Cofides, were more prone to invest in Central and South America (53%).
In terms of financial instruments, since 2006 EDFI’s operations in SSA have been realised mainly through equity and quasi-equity, as shown in Figure 11. In 2014, 51% of EDFI’s total portfolio in SSA came through equity and quasi-equity, compared with 47% realised through loans.
Figure 10: Development funding for SSA in 2014
Source: Authors’ elaboration based on World Development Indicators (WDI) and reports by DFIs.
10,000
20,000
30,000
40,000
50,000
60,000
0EDFIs
US$
milli
on
Multilateral DFIs All DFIs (EDFIs + Multilaterals)
RDI (2013) AID (2013)

30 ODI Report
Table 6: Distribution of DFIs’ portfolios by geographical region, 2014
SSA
Carib
bean
Paci
fic
Sout
h Af
rica
Nort
h Af
rica
Med
iterr
anea
n co
untr
ies
Mid
dle
East
Sout
h Am
eric
a
Cent
ral A
mer
ica
Sout
h-Ea
st A
sia
Sout
h As
ia
Chin
a
Cent
ral a
nd E
aste
rn E
urop
e
CIS
Russ
ia
Othe
rBIO 29% 0% 0% 0% 1% 0% 0% 4% 7% 9% 15% 0% 0% 0% 0% 35%
CDC 34% 0% 0% 1% 1% 0% 0% 3% 1% 5% 23% 9% 0% 0% 0% 24%
Cofides 4% 1% 0% 0% 2% 0% 1% 32% 21% 1% 7% 15% 6% 0% 4% 4%
DEG 18% 0% 0% 3% 2% 5% 1% 14% 12% 11% 14% 6% 1% 5% 4% 3%
Finnfund 44% 0% 0% 1% 0% 3% 0% 3% 11% 11% 8% 3% 0% 1% 5% 10%
FMO 29% 1% 0% 3% 0% 4% 0% 11% 9% 11% 14% 2% 2% 7% 1% 7%
IFU 28% 0% 0% 2% 7% 1% 1% 6% 1% 8% 8% 19% 2% 8% 6% 3%
Norfund 47% 0% 0% 0% 0% 0% 0% 18% 9% 21% 5% 0% 0% 0% 0% 0%
OeEB 9% 0% 0% 0% 0% 7% 0% 2% 12% 3% 15% 0% 15% 13% 2% 21%
Proparco 36% 3% 0% 2% 6% 12% 1% 12% 7% 5% 8% 1% 0% 1% 0% 7%
SBI 3% 0% 0% 0% 0% 0% 0% 3% 11% 7% 2% 11% 2% 0% 7% 54%
Sifem 15% 0% 0% 6% 8% 0% 1% 7% 9% 15% 11% 9% 6% 5% 0% 8%
Simest 1% 0% 0% 1% 3% 2% 4% 14% 4% 2% 4% 18% 1% 2% 8% 35%
Sofid 58% 0% 0% 10% 3% 0% 0% 22% 6% 0% 0% 0% 0% 0% 0% 0%
Swedfund 64% 0% 0% 1% 0% 0% 2% 0% 0% 1% 14% 4% 0% 4% 2% 6%
DFI
Source: Authors’ elaboration on data provided by EDFI.
Figure 11: Distribution of EDFI portfolio by financial instrument in SSA, 2005–2014
4
5
3
2
1
02005
Billio
n eu
ro
Quasi & equity Loans Guarantees
2006 2007 2008 2009 2010 2011 2012 2013 2014

The macroeconomic effects of development finance institutions in sub-Saharan Africa 31
This section provides new evidence of the effects of DFIs on different economic and social outcomes in SSA, including investment, economic growth, economic transformation and the use of renewable energy sources. It does this in two ways. We first use descriptive data analysis in specific countries and relate specific changes in outcome variables to changes in DFI investment (Section 4.1). We then test for the effects of DFIs on macroeconomic variables using econometric techniques (Section 4.2).
4.1 Descriptive analysisWe provide a number of graphical presentations that illustrate how investments of DFIs appear to be related to more investment in Ghana and Uganda, renewable investment in Kenya and labour productivity in Swaziland.
4.1.1 Gross fixed capital formation
We first examine whether DFIs help increase total investment (GFCF), using Uganda as an example. Figure 12 shows how aid, GFCF, FDI and DFI investment
(seven-year moving average) have evolved over time in Uganda. GFCF (measured as a share of GDP) has increased steadily since 1991, with an acceleration after 2006. By 2014, GFCF represented 29% of GDP. Interestingly, it is possible to identify different sources of finance. Aid (measured as a share of GDP) has been falling and FDI has been increasing. Importantly, DFIs have also increased their support to GFCF and are equivalent to 1% of GDP. Increases in DFIs have been followed by increases in investment.
A few examples illustrate the issue. Several DFIs’ activities in Uganda have focused on increasing electricity generation. For example, Norfund has invested in the Bugoye power plant, and CDC has been in partnership in the Uneme distribution network. Bujagali has also received significant DFI investment.
Investments in the power sector helped directly increase investment in Uganda. With DFI investments increasing, GFCF should increase when some of that DFI finance is used to build up fixed capital. However, DFIs have also crowded in more investments and had other indirect effects (Scott et al., 2013).
4. The impact of DFIs in Africa: new evidence
Figure 12: The increasing role of DFIs in supporting investment in Uganda
Source: Own calculations based on WDI, information provided from DFIs.
5 0.2
100.4
15
20
0.6
0.825
301
35 1.2
0 0
1991
1992
1993
1994
1995
1996
1997
1998
1999
2000
2001
2002
2003
2004
2005
2006
2007
2008
2009
2010
2012
2013
2014
GFCF
, aid
& F
DI/G
DP (%
)
DFI/G
DP (%
)DFI/GDP moving average (right axis)
GFCF/GDP (left axis)
Aid/GDP (left axis)
FDI/GDP (left axis)

32 ODI Report
The relationship between DFIs’ investment and GFCF is even more pronounced in the case of Ghana (see Figure 13). DFIs’ investments and FDI, in general, have supported the important increase in GFCF since the mid-2000s. At the same time, aid has reduced its share as a source of finance in Ghana. In fact, since 2008, FDI has surpassed aid as a source of finance for development. In addition, DFI investments represented almost half the value of aid in 2013. If this trend continues, DFI investments will be as high as aid (excluding humanitarian aid).
This confirms the importance of FDI and DFIs in financing development as countries increase their level of development and income. Aid is critical to finance basic infrastructure in the early stages of development. However,
aid alone cannot provide the required finance as the country grows and its economy becomes more complex. In Uganda and Ghana, FDI (and in particular DFIs) have become greater sources of finance.
A final issue to highlight is the considerable investments in oil and gas extraction and electricity generation in Ghana (e.g. the IFC provided some $315 million between 2009 and 2011). In addition, the Overseas Private Investment Corporation (OPIC) has agreed to provide $250 million to the construction of the Aboadze combined-cycle power generation plant.9 The availability of gas as a result of the investments in extraction has led to investments in power generation.
9 https://www.opic.gov/opic-action/featured-projects/sub-saharan-africa/amandi-energy-building-200-megawatt-power-plant-ghana
Figure 13: DFIs and other financial flows in Ghana
Source: Own calculations based on WDI, information provided from DFIs.
5 0.2
100.4
15
20
0.6
0.8
25
30
1
1.2
1.4
0 0
1991
1992
1993
1994
1995
1996
1997
1998
1999
2000
2001
2002
2003
2004
2005
2006
2007
2008
2009
2010
2012
2013
2014
GFCF
, aid
& F
DI/G
DP (%
)
DFI/G
DP (%
)
DFI/GDP moving average (right axis)
Private GFCF/GDP (left axis)
FDI/GDP (left axis)
ADI/GDP (left axis)

The macroeconomic effects of development finance institutions in sub-Saharan Africa 33
4.1.2 Renewable energy
DFIs have been particularly active in providing finance for renewable energy projects. They tripled their investment in renewable energy across the world between 2007 and 2011 (Griffith-Jones et al., 2012). Not only does the finance of DFIs use longer maturities, but also it is regarded as less risky by other financers. In the renewable energy projects, where risks are high and the project maturity is very long, DFIs have proved key in securing funds for these investments.
Figure 14, for example, shows that, as DFI investments (as a percentage of GDP) are growing in Kenya, the output from renewable sources in Kenya has also increased during the period. There have been important investments in renewable energy sources. This includes geo-thermal, wind power and hydro generation. For example, there has been significant investment in the Olkaria geothermal projects, which supply a significant share of electricity in Kenya.
Figure 14: DFIs support the production of energy from renewable sources in Kenya
Source: Own calculations based on WDI, information provided from DFIs.
5 0.1
10
15
20
25
30
35
40
45
50 1
0.9
0.8
0.7
0.6
0.5
0.4
0.3
0.2
0 0
1994
1995
1996
1997
1998
1999
2000
2001
2002
2003
2004
2005
2006
2007
2008
2009
2010
2011
2012
% o
f tot
al e
lect
ricity
out
put
% o
f GDP
DFI/GDP (moving average)
Electric output from renewable sources

34 ODI Report
Figure 15: DFIs channel investments that support economic transformation in Burundi
Source: Own calculations based on WDI, information provided from DFIs.
4.1.3 Labour productivity
Figure 15 shows the relationship between labour productivity in the manufacturing sector and DFI investment as a share of GDP in Burundi. Loans provided by the IFC, for example, may have contributed to the increase in labour productivity in the manufacturing sector.
4.1.4 Exports
DFI investments can help increase trade and diversify the export structure. Lack of access to finance and its high cost are a major constraint for SSA firms. Figure 16 shows that exports (measured as a share of GDP) and DFI investments have followed a similar evolution in the example of Swaziland. Exports are higher in a period when DFI investments were particularly high and decrease as soon as DFI investments begin to lose momentum. DFIs support exports in Swaziland.
0.1
00.005
0.01
0.015
0.02
0.025
0.03
0.035 0.9
0.8
0.7
0.6
0.5
0.4
0.3
0.2
0 -0.1
1993
1996
1995
1994
1997
1998
1999
2000
2001
2002
2003
2004
2005
2006
2007
2008
2009
2010
2011
2012
2013
Shar
e of
GDP
(%)
USD
thou
sand
s/w
orke
r
DFI/GDP (moving average - right axis)
Productivity in manufacturing (left axis)

The macroeconomic effects of development finance institutions in sub-Saharan Africa 35
4.2 Econometric analysisThe analysis presented so far has focused on the relationship between DFI investments and different economic outcomes in particular countries. In each case, we identified the simple correlations between DFI investment with investment, production of renewable energy, economic transformation and trade. However, this analysis provides only a partial description of the effects of DFI investments in SSA. Moreover, these graphical relationships do not take into account other developments that may have affected these outcomes. This section presents an econometric analysis that addresses these points. In doing so, it updates similar previous econometric analysis (te Velde, 2011). It focuses specifically on SSA countries and using more detailed data on individual DFIs.
4.2.1 Data
We have undertaken a significant data collection effort on country-specific investments by DFIs in SSA. Harmonised data on DFIs do not exist. For example, the OECD10 has created a database that attempts to fill this gap, but this has limited time, country and DFI coverage. EDFI publications provide data on investment by region but not by country. We requested information from DFIs on their operations and we have searched annual reports and websites for additional data. In addition, we have used a database previously used in Jouanjean and te Velde (2013). For the purpose of harmonisation, we have used committed investments rather than effectively disbursed investments. This is because the former tend to be the most common way of presenting the data by DFI. Table 7 shows the sources of DFI data.
Figure 16: Exports and DFIs in Swaziland
Source: Authors’ calculations based on WDI, information provided from DFIs.
10 http://www.oecd.org/dac/stats/development-finance-institutions-private-sector-development.htm
0.220
40
60
80
100
120 1.4
1.2
1
0.8
0.6
0.4
0 0
1996
1995
1994
1997
1998
1999
2000
2001
2002
2003
2004
2005
2006
2007
2008
2009
2010
2011
2012
2013
% D
FI/G
DP
% e
xpor
ts/G
DP
DFI/GDP (moving average - right axis)
Exports/GDP (left axis)

36 ODI Report
Figure 17: DFI investments and level of development in SSA, 2010
Source: Own calculations based on WDI, information provided from DFIs.
Data on economic variables have been taken from the World Bank’s World Development Indicators (WDI) and from the UN Conference on Trade and Development (UNCTAD) from the period 1990–2013. Bilateral aid data were obtained from the OECD. We have excluded humanitarian aid in the construction of the aid series.
Figure 17 presents country-specific data for DFI by level of income. DFI activities are significant in relative terms in certain countries. In the case of Cape Verde, Chad, Liberia and Mauritius, finance by DFIs is equivalent to more than 1.5% of total GDP. The relationship between DFIs and level of income in SSA is negative, suggesting that, for richer countries, the activities of DFIs become less important in relative terms.
By contrast, Figure 18 shows how FDI gains share in GDP as countries develop. At the same time, there is a negative relationship between share of aid in GDP and level of development. Aid decreases its share in development finance faster than DFI. In some cases, as we have seen in Ghana in Figure 13, FDI has surpassed aid as a source of development finance. Overall, we find the aid share is much higher in poorer countries, followed by the share of DFIs, whereas the share of FDI is higher in richer countries.
Note: Data were requested from all DFIs. BIO replied that they could not provide the data in the format required.
Table 7: DFI investments data description
DFI Time range Source
AfDB 2005–14 Annual reports
CDC 2004–14 Provided by DFI
DEG 1990–14 Jouanjean, te Velde. (2013)/annual reports
EIB 1990–14 Jouanjean, te Velde. (2013)/annual reports
Finnfund 2004–14 Provided by DFI
IFC 1990–14 Jouanjean et al. (2013)/annual reports
IFU 2005–14 Provided by DFI
Norfund 2005–14 Provided by DFI
OeEB 2008–14 Provided by DFI (DFI started in 2008)
OPIC 2002–14 Annual report/website
Proparco 2005–14 Annual report/website
Sifem 2008–14 Provided by DFI (DFI started in 2008)
Sofid 2004–14 Provided by DFI
Swedfund 2004–14 Provided by DFI
0.01
0.51
1.01
1.51
2.01
2.51
3.01
3.51
5 5.5 6 6.5 7 7.5 8 8.5 9 9.5 10
GDP per capita (in natural logs)
DFI fl
ow/G
DP (%
)

The macroeconomic effects of development finance institutions in sub-Saharan Africa 37
There is no specific pattern of DFIs across individual SSA countries. Figure 19 presents the composition in terms of DFI investments for the largest recipients. The IFC is the largest DFI in most of the countries. However, in some countries, such as Mali, Malawi, Mauritius and notably Zambia, it is not the main investor. Norfund has allocated a significant amount of investments in Kenya and Uganda.
Figure 18: DFIs, aid and FDI in sub-Saharan Africa, 2010
Source: Own calculations based on WDI, information provided from DFIs.
0.5 0
1 20
1.5 40
2 60
2.5 80
3 100
DFI
AID
FDI
Linear (DFI)
Linear (AID)
3.5 120
0 -20
5 5.5 6 6.5 7 7.5 8 8.5 9 9.5 10
DFI/G
DP (%
)
FDI &
AID
/GDP
(%)
GDP per capita (in natural logs)

38 ODI Report
(2)
(3)
4.2.2 Effects on economic growth
As discussed in Section 2.2.1, DFIs can have an important effect on economic growth. We use two approaches. The first approach estimates a simple equation:
Where yit is the natural log of the constant GDP per
capita of country i in time t.11 The use of natural logs allows for computing the growth rate using the difference operator. DFIjit is the j’s DFI investment in country i at time t, as a ratio of current GDP. This model allows for adjusting for some dynamic effects captured by the lag value of the GDP per capital growth rate. Xit is a vector that captures other sources of development finance. In particular,
• Aid: represented by aid (excluding humanitarian aid) as a ratio to current GDP
• FDI: represented by FDI as a ratio to current GDP.
We have fitted our model using four different specifications:
• FE: Fixed Effects • RE: Random Effects • FE-Time: Fixed Effects with time dummies • FE-Time-Other: Fixed Effects with time dummies and
other development finance variables.
We estimated the model separately for investments by IFC, EIB, AfDB, DEG, CDC, OPIC, Norfund, BDFI (rest of the bilateral DFIs) and all the DFIs. Sample sizes for each estimation differ based on the different availability of data for each DFI. Table 8 presents the results.
The effect of DFI activity on the rate of GDP per capita growth is positive in all cases. However, in only some of the DFIs the effect tends to be significant. This is the case for IFC, DEG, CDC and OPIC. In the rest of the cases, the effect is not significant.
In addition to this simple approach, we have followed a more complex method to estimate the effect of DFIs on the GDP per capita growth rate. Massa (2011) uses the GMM in panel data analyses originally presented by Arellano and Bond (1991) and subsequently developed by Arellano and Bover (1995) and Blundell and Bond (1998). Again, we use
where the variables have similar interpretation as in equation (1)
however, ui are the unobservable country-specific characteristics and is an error term. Differencing equation (2), we obtain:
Figure 19: DFIs’ investments as a share of GDP by country and DFI in selected SSA countries, 2013
Source: Own calculations based on WDI, information provided from DFIs.
(1)
11 The difference operator applied on natural log variables approximates the growth rate.
Togo
Burkina Faso
Rwanda
Mali
Malawi
Uganda
Ghana
Benin
Côte d’lvoire
Zambia
Liberia
Mauritius
Kenya
Mauritania
- 0.50 1.00 1.50 2.00 2.50 3.00 3.50
IFC AfDB EIB Poparco CDC DEG FMO OPIC Norfund Rest of DFIs

The macroeconomic effects of development finance institutions in sub-Saharan Africa 39
Country-specific characteristics given by ui vanish. One of the advantages of this approach is that we can use observations of the endogenous variable as our instrument. This allows us to treat our model as weakly endogenous and avoid the definition of instrumental variables.
In addition to the data presented above, we have included additional macroeconomic variables as control variables:
• Inflation (piit): The annual inflation rate. In principle, low inflation levels should reflect macroeconomic stability. This suggests that the higher the inflation, the lower the economic growth. However, in the specific context of SSA in the past 10 years, there has been high inflation (associated with high commodity price inflation) and strong economic growth. This implies that, in this case, it is unclear what effect would dominate.
• FDI (fdiit): There is a general agreement that FDI helps increase economic growth. However, it has been claimed that FDI is beneficial only when countries have developed sufficiently their financial markets (Alfaro et al., 2004). In the case of SSA, this link between FDI and economic growth may not be very strong, especially in those countries with the lowest income.
• Trade openness (tradeopit): The evidence associated with the effect of trade on economic growth is mixed. Trade has been generally considered as a major force to help countries adjust and transform their economies; however, in terms of its effects on the macro economy this relationship is disputed. Frankel and Romer (1999) and many others point to a positive effect, whereas Rodriguez and Rodrik (2001) considered that trade openness had no link with growth. However, in a context of economic growth fuelled by international prices, it is expected that trade openness will help partially capture the effect associated with the growth in prices.
• Government Consumption (GOVit): This captures the size of the government. There is a general tendency for government expenditure to be associated with lower economic growth. The evidence in its favour is strong in the case of developed countries, as Robert and Alexander (1990) and others point out. However, for developing countries, Devarajan et al. (1996) find government expenditure can actually boost economic growth.

40 ODI Report
Table 8: Effects of DFI investments on economic growth
Not
e: p
-val
ues
in b
rack
ets
* p<
0.10
, **p
<0.0
5, *
**p<
0.01
IF
CEI
BAf
DBDE
G
FE
REFE
-Tim
eFE
-Tim
e-Ot
her
FERE
FE-T
ime
FE-T
ime-
Othe
rFE
REFE
-Tim
eFE
-Tim
e-Ot
her
FERE
FE-T
ime
FE-T
ime-
Othe
r
Yt-1
0.16
2***
0.20
8***
0.15
3***
0.14
9***
0.16
9***
0.22
1***
0.15
9***
0.15
5***
0.10
0**
0.20
5***
0.09
9**
0.28
1***
0.14
7***
0.17
9***
0.13
0***
0.19
8***
(0
.000
)(0
.000
)(0
.001
)(0
.001
)(0
.000
)(0
.000
)(0
.001
)(0
.000
)(0
.035
)(0
.002
)(0
.034
)(0
.000
)(0
.000
)(0
.000
)(0
.002
)(0
.000
)
DFI
2.57
8***
2.18
3***
2.58
3***
2.75
7***
0.03
20.
267
0.23
00.
221
-0.2
01-0
.282
-0.0
70-0
.008
3.89
5*4.
197*
3.57
9*4.
912*
*
(0
.002
)(0
.003
)(0
.004
)(0
.005
)(0
.921
)(0
.376
)(0
.457
)(0
.487
)(0
.720
)(0
.466
)(0
.872
)(0
.977
)(0
.096
)(0
.070
)(0
.086
)(0
.034
)
Fdi
0.03
8
0.04
1*
0.02
6
0.04
2**
(0
.119
)
(0.0
88)
(0
.385
)
(0.0
14)
aid
0.00
1
0.00
7
-0.0
04
0.00
9
(0
.957
)
(0.5
68)
(0
.806
)
(0.1
71)
Cons
t1.
293*
**1.
261*
**0.
135
0.04
01.
445*
**1.
338*
**-0
.481
-0.7
071.
971*
**1.
749*
**2.
100*
**1.
389*
**1.
400*
**1.
362*
**0.
026
-0.1
16
(0
.000
)(0
.000
)(0
.845
)(0
.959
)(0
.000
)(0
.000
)(0
.547
)(0
.422
)(0
.000
)(0
.000
)(0
.000
)(0
.001
)(0
.000
)(0
.000
)(0
.972
)(0
.892
)
Obs
916
916
916
869
958
958
958
911
444
444
444
397
859
859
859
812
CDC
OPIC
Norfu
ndBD
FI
FE
REFE
-Tim
eFE
-Tim
e-Ot
her
FERE
FE-T
ime
FE-T
ime-
Othe
rFE
REFE
-Tim
eFE
-Tim
e-Ot
her
FERE
FE-T
ime
FE-T
ime-
Othe
r
Yt-1
0.10
4**
0.16
6***
0.10
7**
0.24
4***
0.11
1**
0.18
2***
0.11
7**
0.23
9***
0.10
1**
0.20
5***
0.20
8***
0.28
1***
0.10
2**
0.20
7***
0.20
9***
0.28
2***
(0
.020
)(0
.002
)(0
.018
)(0
.000
)(0
.036
)(0
.000
)(0
.038
)(0
.000
)(0
.035
)(0
.002
)(0
.003
)(0
.000
)(0
.035
)(0
.002
)(0
.002
)(0
.000
)
DFI
0.21
36.
982
2.86
2*4.
468*
2.96
54.
631*
0.41
6***
0.46
8*-2
.143
2.77
23.
134
0.67
50.
657
0.75
40.
476
0.56
8
(0
.952
)(0
.226
)(0
.052
)(0
.069
)(0
.191
)(0
.061
)(0
.006
)(0
.079
)(0
.525
)(0
.351
)(0
.293
)(0
.829
)(0
.461
)(0
.383
)(0
.598
)(0
.525
)
fdi
0.04
5
0.0
61**
*
0.02
70.
026
(0.1
17)
(0
.006
)
(0.3
59)
(0.3
67)
aid
-0
.008
-0
.017
-0
.004
-0.0
06
(0.5
66)
(0
.125
)
(0.7
95)
(0.7
07)
Cons
t2.
001*
**1.
831*
**2.
503*
**2.
463*
**1.
822*
**1.
673*
**0.
423
0.05
41.
982*
**1.
707*
**2.
462*
**2.
288*
**1.
922*
**1.
688*
**1.
703*
**1.
387*
**
(0
.000
)(0
.000
)(0
.000
)(0
.000
)(0
.000
)(0
.000
)(0
.470
)(0
.936
)(0
.000
)(0
.000
)(0
.000
)(0
.000
)(0
.000
)(0
.000
)(0
.000
)(0
.001
)
Obs
477
477
488
441
572
572
576
529
446
446
446
399
445
445
445
398

The macroeconomic effects of development finance institutions in sub-Saharan Africa 41
Table 9 presents the descriptive statistics of the variables used in the estimation. These overall effects are similar to those presented by Massa (2011), particularly those associated with lower-income countries.
Table 10 presents the estimation results. In terms of the control variables, the coefficients are ambiguous. FDI is not significant in any of the cases but inflation is significant and with the expected sign, especially in the estimations that cover a long period. There is a positive and significant coefficient on the trade openness variable across all estimations. This suggests that, particularly in past years, trade has been a major factor associated with growth in SSA economies. On the other hand, DFIs seem to play a role in economic growth once the effects of trade and commodity prices are controlled for. However, the effects differ depending on the DFI. The IFC, DEG and OPIC have positive and significant effects on economic growth. For the other DFIs, the effect is not significant. This might be explained by a higher frequency of no activity for these DFIs in comparison with the others.
Table 9: Variables – descriptive statistics
Variable Obs Mean Std. Dev. Min Max
Controls weighted by GDP (in natural logs)
GDP growth rate
823 1.088 1.033 -4.773 4.960
FDI 994 1.203 0.933 -2.230 4.678
GOV 1,001 2.712 0.431 1.114 4.256
PI 924 4.737 0.358 4.504 10.081
Tradeop 1,047 4.199 0.502 2.375 6.276
DFIs weighted by GDP (in natural logs)
IFC 1,072 0.078 0.167 0 1.482
EIB 1,073 0.107 0.250 0 2.165
AfDB 456 0.051 0.205 0 2.181
DEG 952 0.017 0.064 0 0.792
CDC 501 0.011 0.035 0 0.333
OPIC 591 0.015 0.114 0 1.973
Norfund 457 0.009 0.031 0 0.295
Rest of DFIs
456 0.042 0.124 0 1.149

42 ODI Report
Table 10: Effects of DFI investments on economic growth, adjusting for endogeneity
Note: p-values in brackets* p<0.10, **p<0.05, ***p<0.01
IFC
EIB
AfDB
DEG
AB
CD
AB
CD
AB
CD
AB
CD
y1-0
.218
**-0
.221
**-0
.225
**-0
.230
**-0
.184
*-0
.188
*-0
.203
**-0
.207
**-0
.189
-0.1
87-0
.214
-0.2
16-0
.169
-0.1
68-0
.181
*-0
.182
(0.0
42)
(0.0
35)
(0.0
34)
(0.0
38)
(0.0
79)
(0.0
69)
(0.0
44)
(0.0
49)
(0.1
93)
(0.1
89)
(0.1
17)
(0.1
14)
(0.1
14)
(0.1
14)
(0.0
86)
(0.1
01)
y2-0
.144
**-0
.142
**-0
.138
**-0
.127
*-0
.119
*-0
.116
*-0
.117
*-0
.108
-0.1
58**
-0.1
58**
-0.1
64**
-0.1
66**
-0.1
23*
-0.1
19*
-0.1
19*
-0.1
21*
(0.0
38)
(0.0
39)
(0.0
46)
(0.0
67)
(0.0
78)
(0.0
83)
(0.0
83)
(0.1
14)
(0.0
47)
(0.0
48)
(0.0
42)
(0.0
39)
(0.0
50)
(0.0
57)
(0.0
59)
(0.0
53)
DFI
0.46
1**
0.46
7**
0.43
1**
0.45
9**
0.16
40.
201
0.20
10.
201
0.29
30.
294
0.31
30.
322
1.10
2***
1.18
1***
1.01
4***
1.00
0***
-0.0
2-0
.01
-0.0
3-0
.02
(0.1
16)
(0.1
10)
(0.1
52)
(0.1
28)
(0.1
96)
(0.2
28)
(0.1
82)
(0.1
74)
(0.0
02)
(0.0
01)
(0.0
08)
(0.0
02)
Trad
eop
0.93
2***
0.91
1***
0.98
1***
1.05
0***
0.90
4***
0.86
9***
0.87
4***
0.96
3***
1.46
8***
1.43
8***
1.44
3***
1.41
4***
0.93
1***
0.92
5***
0.94
5***
0.99
0***
(0.0
05)
(0.0
04)
(0.0
02)
(0.0
02)
(0.0
05)
(0.0
04)
(0.0
04)
(0.0
02)
(0.0
00)
(0.0
00)
(0.0
00)
(0.0
01)
(0.0
04)
(0.0
02)
(0.0
02)
(0.0
03)
FDI
0.
088
0.09
90.
092
0.
100
0.10
20.
095
0.
107
0.09
80.
091
0.
089
0.09
00.
094
(0
.137
)(0
.114
)(0
.140
)
(0.1
24)
(0.1
39)
(0.1
67)
(0
.273
)(0
.356
)(0
.394
)
(0.1
56)
(0.1
80)
(0.1
61)
GOV
-0
.209
-0.1
69
-0.1
58-0
.126
0.
045
0.06
7
-0.1
27-0
.080
(0
.577
)(0
.621
)
(0.6
75)
(0.7
15)
(0
.897
)(0
.845
)
(0.7
23)
(0.8
06)
PI
-1.3
76*
-1
.488
*
0.15
1
-1.3
38
(0
.090
)
(0.0
58)
(0
.900
)
(0.1
13)
Obs
371
362
358
354
379
370
366
362
219
213
209
209
362
353
349
346
CDC
OPIC
Norfu
ndBD
FI
AB
CD
AB
CD
AB
CD
AB
CD
y1-0
.223
-0.2
18-0
.253
-0.2
55-0
.238
*-0
.238
*-0
.263
**-0
.271
**-0
.047
-0.2
18**
-0.2
68**
*-0
.270
***
-0.2
72-0
.271
-0.3
07*
-0.3
10*
(0.2
19)
(0.2
17)
(0.1
32)
(0.1
28)
(0.0
72)
(0.0
65)
(0.0
33)
(0.0
29)
(0.6
44)
(0.0
46)
(0.0
05)
(0.0
04)
(0.1
45)
(0.1
35)
(0.0
69)
(0.0
66)
y2-0
.154
-0.1
47-0
.161
-0.1
64*
-0.1
85**
-0.1
85**
-0.1
93**
-0.2
11**
*-0
.027
-0.0
64-0
.067
-0.0
67-0
.160
-0.1
53-0
.162
-0.1
63
(0.1
13)
(0.1
26)
(0.1
04)
(0.0
95)
(0.0
12)
(0.0
13)
(0.0
12)
(0.0
07)
(0.6
27)
(0.3
41)
(0.3
14)
(0.3
11)
(0.1
75)
(0.1
97)
(0.1
82)
(0.1
82)
DFI
1.23
11.
255
0.76
90.
706
0.36
3***
0.32
4***
0.22
8**
0.24
5**
-0.6
13-0
.736
-1.1
87-1
.039
0.28
40.
290
0.19
60.
183
(0.1
63)
(0.1
79)
(0.3
76)
(0.4
06)
(0.0
01)
(0.0
04)
(0.0
21)
(0.0
17)
(0.6
81)
(0.6
34)
(0.4
34)
(0.4
94)
(0.3
52)
(0.3
56)
(0.4
49)
(0.4
76)
Trad
eop
1.57
2***
1.50
2***
1.52
2***
1.49
8***
1.52
0***
1.40
0***
1.37
8***
1.35
4***
1.65
2***
1.64
0***
1.89
1***
1.90
0***
2.15
9***
2.10
8***
2.08
9***
2.01
0***
(0.0
00)
(0.0
00)
(0.0
00)
(0.0
01)
(0.0
00)
(0.0
00)
(0.0
00)
(0.0
02)
(0.0
03)
(0.0
02)
(0.0
01)
(0.0
02)
(0.0
00)
(0.0
00)
(0.0
01)
(0.0
01)
FDI
0.
109
0.09
20.
087
0.
116
0.10
40.
095
0.
119
0.16
60.
173
0.
098
0.09
80.
092
(0
.314
)(0
.412
)(0
.440
)
(0.2
33)
(0.3
19)
(0.3
70)
(0
.197
)(0
.118
)(0
.106
)
(0.2
88)
(0.3
39)
(0.3
83)
GOV
0.
259
0.28
3
0.21
50.
227
-0
.140
-0.1
39
0.05
60.
080
(0
.532
)(0
.488
)
(0.5
62)
(0.5
39)
(0
.791
)(0
.789
)
(0.9
02)
(0.8
59)
PI
-0.0
26
0.94
9
0.24
2
0.64
9
(0
.982
)
(0.4
87)
(0
.833
)
(0.5
42)
Obs
192
188
184
184
242
236
232
231
197
190
182
181
160
158
155
155

The macroeconomic effects of development finance institutions in sub-Saharan Africa 43
4.2.3 Effects on investment
Section 2.2.1 discussed the effects of DFIs on investment. In addition, Section 4.1 showed how DFIs in certain contexts have been associated with other investments. In this section, we present general evidence on the link between DFIs and investment in SSA countries. We used a simple model based on equation (1) above.
We use the same explanatory variables (Aid and FDI) to control for the effects of DFI investments on GFCF (as a ratio of GDP). Table 11 presents the estimation results. These models are similar to those presented above.
There is a general positive effect of DFIs on GFCF. This effect is positive and significant in the cases of the investments of IFC, EIB, OPIC, Norfund and the Rest of the DFIs. This means a generalisation of the result found previously. These results and those previously found
suggest the sector of investment may play an important role in boosting investment. Investments made in sectors with strong forward linkages such as electricity generation or the financial sector could improve the prospects of other financial projects that are affected by the relaxation of these constraints.
4.2.4 Effects on productivity
Table 12 presents the results of the estimations of the effects of each DFI on the change in labour productivity. In general, the effects tend to be small or non-significant. Only the investments made by the IFC, OPIC and Norfund have had a positive and significant effect on labour productivity. This might be explained by the sectors where these investments have been made.

44 ODI Report
Table 11: Effects on gross fixed capital formation
Not
e: p
-val
ues
in b
rack
ets
* p<
0.10
, **p
<0.0
5, *
**p<
0.01
IFC
EIB
AfDB
DEG
FERE
FE-T
ime
FE-T
ime-
Othe
rFE
REFE
-Tim
eFE
-Tim
e-Ot
her
FERE
FE-T
ime
FE-T
ime-
Othe
rFE
REFE
-Tim
eFE
-Tim
e-Ot
her
Y10.
608*
**0.
725*
**0.
594*
**0.
540*
**0.
612*
**0.
731*
**0.
590*
**0.
539*
**0.
387*
**0.
817*
**0.
333*
**0.
796*
**0.
640*
**0.
809*
**0.
612*
**0.
770*
**
(0.0
00)
(0.0
00)
(0.0
00)
(0.0
00)
(0.0
00)
(0.0
00)
(0.0
00)
(0.0
00)
(0.0
02)
(0.0
00)
(0.0
08)
(0.0
00)
(0.0
00)
(0.0
00)
(0.0
00)
(0.0
00)
DFI
3.88
8***
2.44
9**
2.21
7*1.
731
1.38
9**
1.37
3***
1.47
3**
1.21
2**
-0.4
54-0
.015
-0.5
80-0
.064
2.77
40.
676
0.72
5-0
.235
(0.0
08)
(0.0
29)
(0.0
87)
(0.1
26)
(0.0
12)
(0.0
00)
(0.0
14)
(0.0
12)
(0.5
48)
(0.9
73)
(0.4
69)
(0.8
69)
(0.3
32)
(0.8
15)
(0.7
77)
(0.9
37)
fdi
0.
144
0.14
4
0.06
4
0.09
1
(0
.188
)(0
.166
)
(0.4
27)
(0
.214
)
aid
0.
076*
**0.
073*
**
0.02
3
0.00
9
(0
.006
)(0
.005
)
(0.4
19)
(0
.470
)
Cons
t7.
687*
**5.
469*
**8.
040*
**7.
471*
**7.
701*
**5.
299*
**7.
928*
**7.
342*
**13
.997
***
4.31
6***
13.3
16**
*3.
405*
**7.
419*
**4.
027*
**7.
455*
**4.
161*
**
(0.0
01)
(0.0
00)
(0.0
01)
(0.0
00)
(0.0
00)
(0.0
00)
(0.0
00)
(0.0
00)
(0.0
00)
(0.0
00)
(0.0
00)
(0.0
02)
(0.0
00)
(0.0
00)
(0.0
00)
(0.0
00)
Obs
898
898
898
861
939
939
939
902
416
416
416
379
851
851
851
814
CDC
OPIC
Norfu
ndBD
FI
FERE
FE-T
ime
FE-T
ime-
Othe
rFE
REFE
-Tim
eFE
-Tim
e-Ot
her
FERE
FE-T
ime
FE-T
ime-
Othe
rFE
REFE
-Tim
eFE
-Tim
e-Ot
her
Y10.
383*
**0.
794*
**0.
333*
**0.
786*
**0.
412*
**0.
643*
**0.
375*
**0.
690*
**0.
388*
**0.
816*
**0.
826*
**0.
795*
**0.
388*
**0.
817*
**0.
826*
**0.
796*
**
(0.0
01)
(0.0
00)
(0.0
02)
(0.0
00)
(0.0
05)
(0.0
00)
(0.0
05)
(0.0
00)
(0.0
02)
(0.0
00)
(0.0
00)
(0.0
00)
(0.0
02)
(0.0
00)
(0.0
00)
(0.0
00)
DFI
-2.5
94-3
.787
-5.6
84*
0.10
96.
558*
*3.
452*
0.22
1-0
.356
6.64
2***
1.39
0-0
.446
-2.2
141.
753*
*1.
739*
*1.
684*
1.14
3
(0.7
50)
(0.7
11)
(0.0
61)
(0.9
80)
(0.0
31)
(0.0
73)
(0.5
57)
(0.4
45)
(0.0
07)
(0.6
68)
(0.9
12)
(0.7
31)
(0.0
33)
(0.0
48)
(0.0
58)
(0.2
16)
fdi
0.
084
0.
083
0.
064
0.
063
(0
.382
)
(0.3
95)
(0
.427
)
(0.4
32)
aid
0.
022
0.
038
0.
023
0.
019
(0
.483
)
(0.2
16)
(0
.422
)
(0.4
80)
Cons
t13
.925
***
4.80
3***
13.4
37**
*3.
780*
**12
.802
***
7.83
6***
11.2
74**
*3.
910*
**13
.863
***
4.30
6***
2.88
1***
3.02
5***
13.8
38**
*4.
210*
**3.
196*
**3.
397*
**
(0.0
00)
(0.0
00)
(0.0
00)
(0.0
06)
(0.0
00)
(0.0
00)
(0.0
00)
(0.0
00)
(0.0
00)
(0.0
00)
(0.0
02)
(0.0
01)
(0.0
00)
(0.0
00)
(0.0
02)
(0.0
02)
Obs
448
448
458
421
539
539
543
506
417
417
417
380
416
416
416
379

The macroeconomic effects of development finance institutions in sub-Saharan Africa 45
Table 12: Effects on labour productivity
IFC
EIB
AfDB
DEG
FERE
FE-T
ime
FE-T
ime-
Othe
rFE
REFE
-Tim
eFE
-Tim
e-Ot
her
FERE
FE-T
ime
FE-T
ime-
Othe
rFE
REFE
-Tim
eFE
-Tim
e-Ot
her
Y10.
168*
**0.
207*
**0.
169*
**0.
170*
**0.
176*
**0.
219*
**0.
175*
**0.
175*
**0.
095
0.18
9**
0.11
10.
209*
**0.
208*
**0.
260*
**0.
206*
**0.
254*
**
(0.0
00)
(0.0
00)
(0.0
00)
(0.0
01)
(0.0
00)
(0.0
00)
(0.0
00)
(0.0
01)
(0.2
11)
(0.0
10)
(0.1
15)
(0.0
03)
(0.0
01)
(0.0
00)
(0.0
01)
(0.0
00)
DFI
3.89
1***
3.36
7***
4.05
0***
4.07
5***
-0.3
31-0
.174
-0.0
82-0
.074
0.15
9-0
.005
0.25
50.
088
0.60
40.
826
1.02
41.
511
(0.0
00)
(0.0
01)
(0.0
00)
(0.0
00)
(0.6
06)
(0.7
73)
(0.8
92)
(0.9
05)
(0.8
37)
(0.9
93)
(0.6
86)
(0.8
39)
(0.8
81)
(0.8
53)
(0.8
00)
(0.7
28)
fdi
-0
.006
0.00
1
0.01
4
0.03
2
(0
.879
)(0
.976
)
(0.6
49)
(0
.217
)
aid
-0
.009
-0.0
03
0.05
1***
0.
008
(0
.530
)(0
.831
)
(0.0
08)
(0
.438
)
Cons
t0.
882*
**0.
861*
**1.
122
1.30
11.
241*
**1.
153*
**0.
602
0.65
91.
682*
**1.
478*
**1.
715*
**0.
927*
1.11
1***
1.03
3***
0.86
20.
576
(0.0
00)
(0.0
02)
(0.2
03)
(0.1
90)
(0.0
00)
(0.0
00)
(0.4
94)
(0.5
12)
(0.0
00)
(0.0
00)
(0.0
00)
(0.0
92)
(0.0
00)
(0.0
00)
(0.3
84)
(0.5
75)
Obs
843
843
843
842
884
884
884
883
381
381
381
380
798
798
798
797
CDC
OPIC
Norfu
ndBD
FI
FERE
FE-T
ime
FE-T
ime-
Othe
rFE
REFE
-Tim
eFE
-Tim
e-Ot
her
FERE
FE-T
ime
FE-T
ime-
Othe
rFE
REFE
-Tim
eFE
-Tim
e-Ot
her
Y10.
137*
0.22
5***
0.14
7**
0.23
6***
0.16
4**
0.24
0***
0.17
5***
0.25
8***
0.09
50.
188*
*0.
213*
**0.
208*
**0.
096
0.18
9**
0.21
5***
0.20
9***
(0.0
55)
(0.0
01)
(0.0
26)
(0.0
00)
(0.0
13)
(0.0
00)
(0.0
04)
(0.0
00)
(0.2
12)
(0.0
11)
(0.0
03)
(0.0
04)
(0.2
14)
(0.0
11)
(0.0
03)
(0.0
03)
DFI
-5.0
1213
.879
2.24
46.
109*
1.22
44.
286*
0.46
6**
0.68
7*-0
.972
5.45
35.
609
5.87
31.
573
1.29
80.
937
0.19
5
(0.5
71)
(0.2
02)
(0.4
00)
(0.0
74)
(0.6
12)
(0.0
88)
(0.0
47)
(0.0
55)
(0.8
37)
(0.2
59)
(0.2
20)
(0.1
49)
(0.2
73)
(0.2
69)
(0.4
56)
(0.8
90)
Fdi
0.
033
0.
068*
*
0.01
4
0.01
4
(0
.197
)
(0.0
11)
(0
.653
)
(0.6
43)
aid
0.
035*
-0
.003
0.
051*
**
0.05
0**
(0
.064
)
(0.8
96)
(0
.007
)
(0.0
13)
Cons
t1.
621*
**1.
297*
**1.
453*
0.86
81.
435*
**1.
254*
**0.
509
-0.0
531.
703*
**1.
433*
**1.
250*
**0.
508*
*1.
607*
**1.
406*
**1.
413*
**0.
930*
(0.0
00)
(0.0
00)
(0.0
77)
(0.3
65)
(0.0
00)
(0.0
00)
(0.5
29)
(0.9
55)
(0.0
00)
(0.0
00)
(0.0
00)
(0.0
35)
(0.0
00)
(0.0
00)
(0.0
05)
(0.0
90)
Obs
414
414
423
422
504
504
508
507
382
382
382
381
381
381
381
380

46 ODI Report
Growth rate GFCF Productivity
FE RE FE-Time FE-Time-Other
FE RE FE-Time FE-Time-Other
FE RE FE-Time FE-Time-Other
Yt-1 0.101** 0.205*** 0.207*** 0.280*** 0.388*** 0.818*** 0.826*** 0.796*** 0.094 0.192** 0.214*** 0.209***
(0.035) (0.002) (0.003) (0.000) (0.002) (0.000) (0.000) (0.000) (0.223) (0.010) (0.003) (0.004)
DFI 0.129 0.141 0.208** 0.239** 0.016 0.056 0.016 -0.097 0.266 0.278 0.363** 0.267*
(0.368) (0.249) (0.033) (0.027) (0.951) (0.779) (0.934) (0.700) (0.248) (0.152) (0.033) (0.090)
FDI 0.021 0.066 0.007
(0.493) (0.425) (0.806)
Aid -0.005 0.023 0.049***
(0.734) (0.401) (0.010)
Const 1.898*** 1.665*** 1.673*** 1.370*** 13.926*** 4.251*** 3.250*** 3.413*** 1.573*** 1.340*** 1.352*** 0.905*
(0.000) (0.000) (0.000) (0.001) (0.000) (0.000) (0.002) (0.002) (0.000) (0.000) (0.006) (0.098)
Obs 445 445 445 398 416 416 416 379 381 381 381 380
Table 13: Effects of aggregated DFI investments on growth, GFCF and labour productivity
Note: p-values in brackets* p<0.10, **p<0.05, ***p<0.01
4.2.5 Aggregated effects
Table 13 presents the aggregated results for all DFIs together. In these regressions, we have aggregated the investments of all DFIs into a single variable. This has limited the number of observations to the period 2005–2013.
The combined effect of all DFIs on the GDP per capita growth rate and on labour productivity is positive and significant. However, the average impact of DFI investments on GFCF is not significant. Nevertheless, as we have seen, in some cases DFIs have been associated with an increase in FDI and domestic investments.
4.2.6 Conclusions
This section has provided new empirical evidence on the effects of DFIs on the macro-economy of SSA countries. We first provided a number of graphs that illustrate how investments of DFIs appear to be related to increased (private sector) investment in Ghana and Uganda, renewable energy use in Kenya and labour productivity in Swaziland.
We then collected data on DFI committed investments at country level for SSA. We used these data to understand the effects on macroeconomic variables and find the following:
• Economic growth. The effect of DFI investments on the rate of GDP per capita growth is positive for all DFIs and significant for IFC, DEG, CDC and OPIC. Pooling DFIs, we find a significant and positive effect on the GDP per capita growth rate. If the DFI/GDP ratio increases by 1% (which is approximately $15 billion for the whole of SSA), per capita growth increases by 0.24% on average. This would, however, require a tripling of current levels of DFI investment.
• Investment. There is a positive effect of DFIs on GFCF. This effect is significant for IFC, EIB, OPIC, Norfund and the Rest of the DFIs. Pooling DFIs, we find no significant effect on investment. However, the experience in cases such as Ghana and Uganda suggests DFI investments have pulled new FDI and domestic investment into their economies.
• Labour productivity. In general, the effects tend to be small. Only the investments made by the IFC, OPIC and Norfund have had a positive and significant effect on labour productivity. Pooling DFIs, we find a positive and significant effect on labour productivity. If DFI/GDP increases by 1%, labour productivity increases by 0.27% on average.
• Renewable energy use. DFI investments have been associated with increases in the use of renewable energy in Kenya, with investments in alternative generation technologies beyond hydro-electrical power.

The macroeconomic effects of development finance institutions in sub-Saharan Africa 47
DFI investments are becoming increasingly important in providing development finance in SSA. Together with FDI (and domestic investment), loans and equity from DFIs can help transform economies and increase incomes. As SSA countries grow, they are meeting new challenges and constraints that aid grants alone will not be able to address. While aid is falling as a source of funding, DFIs and FDI are increasingly taking the lead in the development finance options.
DFI investments tend to be concentrated in loans and equity in the financial sector and in the provision of infrastructure, where investments in energy generation have been very important. Investments in these two sectors are important as they tackle some of the most important development constraints SSA countries face. DFIs have also been active in providing finance for investments in renewable energy production. DFIs are better prepared
to cope with the requirements of renewable energy investments projects with long maturity.
We have found a general positive and significant effect of DFI investment on economic growth and labour productivity, which confirms the transformational potential of these interventions. The effect is also present when the actions of certain individual DFIs are considered. This shows that some DFIs are effective in bringing growth and economic transformation. For example, investments made by the IFC, DEG, CDC, Norfund and OPIC have been effective.
The findings in this paper have wider implications. Shareholders expect DFIs to play a key role in global development. This paper shows that DFIs already have important effects on macroeconomic variables such as economic growth and labour productivity.
5. Conclusions

48 ODI Report
Alfaro, L., Chanda, A., Kalemli-Ozcan, S. and Sayek, S. (2004) ‘FDI and economic growth: The role of local financial markets’, Journal of International Economics 64(1): 89–112.
Arellano, M. and Bond, S. (1991) ‘Some test of specification for panel data: Monte Carlo evidence and an application to employment equations’, Review of Economic Studies 58(2): 277–97.
Arellano, M. and Bover, O. (1995) ‘Another look at the instrumental variable estimation of error-components models’, Journal of Econometrics 68(1): 29–51.
Bakvis, P. and McCoy, M. (2008) ‘Core labour standards and international organizations: What inroads has labour made?’ Briefing Papers 6. Genf: Friedrich Ebert Stiftung.
Basker, E. (2005) ‘Job creation or destruction? Labor-market effects of Wal-Mart expansion’, Review of Economics and Statistics 87: 174−83.
BIO (Belgian Investment Company) (2014) Annual report 2014. Brussels: BIO.Blundell, R. and Bond, S. (1998) ‘Initial conditions and moment restrictions in dynamic panel data models’, Journal of
Econometrics 87(1): 115–43.Bolaji Adesoye, A. and Abdulmaliq Atanda, A. (2012) ‘Development finance institutions in Nigeria: Structure, roles and
assessment.’ MPRA Paper 35839. Munich: University of Munich.Bortes, C., Sinha, S. and Grettve, A. (2011) How do DFIs measure the development returns to investment in private
enterprises? A review of the literature. London: Nathan Associates London Ltd.Bracking, S., Hulme, D., Lawson, D., Sen, K. and Wickramasinghe, D. (2010) Future directions of Norwegian
development finance. Manchester: IDPM and University of Manchester. CDC (UK Development Finance Institution) (2014) Annual review 2014. London: CDC. CDC (UK Development Finance Institution) and ODI (Overseas Development Institute) (2016) Development impact
evaluation. Evidence review. What are the links between power economic growth and job creation? London: CDC and ODI.
Cochran, I., Eschalier, C. and Deheza, M. (2015a) ‘Climate and development finance institutions: linking climate finance, development finance and the transition to low-carbon, climate-resilient economic models’, in I4CE Institute for Climate Economics, Mainstreaming low-carbon climate-resilient growth pathways into development finance institutions’ activities. Research project on the standards, tools and metrics to support transition to the low-carbon climate-resilient development models. Paris: I4CE Institute for Climate Economics.
Cochran, I., Eschalier, C. and Deheza, M. (2015b) Mainstreaming low-carbon climate-resilient growth pathways into investment decision-making – lessons from development financial institutions on approaches and tools. Belfast: Climate Northern Ireland. http://www.climatenorthernireland.org.uk/cmsfiles/2015.07.03_mainstreaming_lccr_background_paper_v9-4.pdf
CPI (Climate Policy Initiative) (2014) Global landscape of climate finance 2014. CPI. http://climatepolicyinitiative.org/publication/global-landscape-of-climate-finance-2014/
Dalberg (2010) The growing role of the development finance institutions in international development policy. Copenhagen: Dalberg Global Development Advisors.
Dangelmaier, U. (2012) Private sector as engine for employment and qualitative growth. KfW Position Paper. Bonn: KfW. https://www.deginvest.de/DEG-Englische-Dokumente/PDFs-Download-Center/Private-sector-as-engine-for-emplyment-and-qualitative-growth.pdf
Danida (Danish International Development Agency) (2004) Evaluation. The Industrialization Fund for Developing Countries, No. 104.O.14.Eval. Copenhagen: Danida. http://www.ifu.dk/dk/service/nyheder-og-publikationer/publikationer/evaluation
Datta, N., Timilsina, G., Khanna, M. and Casadevall Massuet, F. (2013) Linking power supply to jobs: Estimating employment effects of Powerlinks Transmission Limited project in India and Bhutan. Assessing Private Sector Contributions to Job Creation: IFC Open Source Study. Washington, DC: IFC.
DEG (2014) Annual report 2014. Financial statements and management report. Köln: DEG.DEG (2016) Bridging the skills gaps in developing countries. A practical guide for private-sector companies. Köln: DEG. Devarajan, S., Swaroop, V. and Zou, H.F. (1996) ‘The composition of public expenditure and economic growth’, Journal
of Monetary Economics 37(2): 313–44.Ebert, F.C. and Posthuma, A. (2010) Labour standards and development finance institutions: A review of current
policies and activities. Geneva: ILO International Institute for Labour Studies. www.ilo.org/wcmsp5/groups/public/---dgreports/---inst/documents/publication/wcms_192837.pdf
References

The macroeconomic effects of development finance institutions in sub-Saharan Africa 49
EBRD (European Bank for Reconstruction and Development) (2011) Private Sector for Food Security Initiative. http://www.ebrd.com/downloads/research/factsheets/foodsecurity.pdf
EDFI (2015) Investing for a greener future. EDFI members, October. Faye, I., Gajigo, O. and Mutambatsere, E. (2013), ‘Large scale agribusiness investments and implications in Africa:
Development finance institutions’ perspectives’, Working Paper 193. Kampala: African Development Group.FAO (Food and Agricultural Organization) and EBRD (European Bank for Reconstruction and Development) (2011)
Poland, Bulgaria, & Romania: Social impact of discount food retail in remote regions. FAO Investment Centre/EBRD Cooperation Programme Report 16, June.
Frankel, J.A. and Romer, D. (1999) ‘Does trade cause growth?’ American Economic Review, 89 (3): 379–99.Global Commission on New Climate Economy (2015) Better growth better climate. The new climate economy report.
Synthesis Report. Washington, DC: New Climate Economy.Gössinger, A. and Raza, W. (2011), ‘Bilateral development finance institutions in Europe: A comparative analysis of DEG,
CDC, FMO and Norfund with recommendations for development policies’, Working Paper 29. Wien: ÖFSE. Griffith-Jones, S., Ocampo, J.A. and Spratt, S. (2012) Financing renewable energy in developing countries: Mechanisms
and responsibilities. Brussels: EC.IEG (Independent Evaluation Group) (2007) IEG evaluation of IFC’s development results 2007: Lessons from 10 years
of experience. Washington, DC: IEG, World Bank. IEG (Independent Evaluation Group) (2011) Assessing IFC’s poverty focus and results. Washington, DC: IEG,
World Bank. IFC (International Finance Corporation) (2011) International finance institutions and development through the private
sector. A joint report of 31 multilateral and bilateral development finance institutions. Washington, DC: IFC.IFC (International Finance Corporation) (2013) IFC jobs study. Assessing private sector contributions to job creation
and poverty reduction. Washington, DC: IFC. http://www.ifc.org/wps/wcm/connect/0fe6e2804e2c0a8f8d3bad7a9dd66321/IFC_FULL+JOB+STUDY+REPORT_JAN2013_FINAL.pdf?MOD=AJPERES
IFC (International Finance Corporation) (2015) IFC, agribusiness, and food security. Washington, DC: IFC. http://www.ifc.org/wps/wcm/connect/ce3e29804a103b029fe3bfe54d141794/Agribusiness.pdf?MOD=AJPERES
IOB (Policy and Operations Evaluation Department) (2009) Evaluation. Investing in infrastructure. Evaluation of the LDC Infrastructure Fund. Evaluation 324. The Hague: IOB.
Jim, Yong Kim (2013) ‘Private sector investment is critical to end extreme poverty’. Oxfam. https://blogs.oxfam.org/en/blogs/13-10-28-private-sector-investment-critical-end-extreme-poverty
Jouanjean, M.A and te Velde, D.W. (2013) The role of development finance institutions in promoting jobs and structural transformation, A quantitative assessment. ODI Working and Discussion Papers. London: ODI.
Kapstein, E., Kim, R. and Eggeling, H. (2012a) Socio-economic impact of IFC financing in Ghana – an assessment of employment and value-added. Final Report. http://www.ifc.org/wps/wcm/connect/41792a804e351b8787f2af7a9dd66321/SEIA+IFC+Ghana_FINAL+REPORT_19Dec2012.pdf?MOD=AJPERES
Kapstein, E., Kim, R. and Eggeling, H. (2012b) Socio-economic impact of IFC financing in Jordan – an assessment of employment and value-added. Final Report. http://www.ifc.org/wps/wcm/connect/23d8a0804e351b4887e9af7a9dd66321/SEIA+IFC+Jordan_FINAL+REPORT_19Dec2012.pdf?MOD=AJPERES
Kumar, R. and Abdo, H. (2012) Indirect job creation among IFC clients: Findings from micro case studies and MAS. Washington, DC: Development Impact Department, IFC. http://www.ifc.org/wps/wcm/connect/a3d90b004cf855d686e5c7f81ee631cc/Jobs+study+microcase+studiesctober+4final.pdf?MOD=AJPERES
Kwakkenbos, J. and Romero, M.J. (2013) ‘Engaging the private sector for development: The role of development finance Institutions?’ In ÖFSE (ed.), Private sector development – Ein neuer Businessplan für Entwicklung? Wien: ÖFSE. http://www.oefse.at/fileadmin/content/Downloads/Publikationen/Oepol/Artikel2013/2_Kwakkenbos_Romero.pdf
Lemma, A. (2015) ‘Development impact of DFIs: What are the impacts and how they are measured?’ Paper prepared for the Economic and Private Sector Professional Evidence and Applied Knowledge Services Helpdesk Request, February 2015. http://r4d.dfid.gov.uk/pdf/outputs/EPS/Development-Impact-of-DFIs.pdf
Massa, I. (2011) Impact of multilateral development finance institutions on economic growth. ODI Research Reports. London: ODI.
Massa, I. (2013) A brief of the role of development finance institutions in promoting jobs and productivity change. ODI Research Reports. London: ODI.
Murie, F. (2009) ‘BWI strategies to promote decent work through procurement: The example of the Bujagali Dam project in Uganda.’ GURN Discussion Paper 9. Geneva: ILO.
Namusonge, G.S. (2004) ‘The role of development financial institutions in the acquisition of technological capabilities by small and medium enterprises in Kenya.’ Working Paper 41. Nairobi: ATPS. http://www.atpsnet.org/Files/working_paper_series_41.pdf
Norad (Norwegian Agency for Development Cooperation) (2010) Evaluation of Norwegian Business-related Assistance. Bangladesh case study. Report 5/2010 – Study. Oslo: Evaluation Department, Norad. https://www.norad.no/globalassets/import-2162015-80434-am/www.norad.no-ny/filarkiv/vedlegg-til-publikasjoner/evaluation-of-norwegian-business-related-assistance-bangladesh-case-study.pdf

50 ODI Report
Proparco (2014) Proparco at a glance. Investing in a sustainable future. Paris: Proparco. Robert, W. and Alexander, J. (1990) ‘Growth: Some combined cross-sectional and time series evidence from OECD
countries’, Applied Economics 22(9): 1197–204.Rodriguez, F. and Rodrik, D. (2001) ‘Trade policy and economic growth: A skeptic’s guide to the cross-national
evidence’, Macroeconomics Annual 2000 15: 261–338.Runde, D. (2014) ‘Development finance institutions come of age’, Forbes/Opinion, 17 October. http://www.forbes.com/
sites/danielrunde/2014/10/17/development-finance-institutions-come-of-age-dfi/#74a5f3016e52 SADEV (Swedish Agency for Development Evaluation) (2008) Evaluation of Swedfund International. An analysis
of private sector development impacts. Report 2008:3. Stockholm: SADEV. http://www.oecd.org/derec/sweden/swedfund.pdf
Sanusi Lamido Sanusi (2012) ‘The role of development finance institutions in infrastructure development: What Nigeria can learn from BNDES and the Indian Infrastructure Finance Company’. Keynote Address, Third ICRC PPP Stakeholders Forum, 18 July. http://www.cenbank.org/out/speeches/2012/gov_ppp%20stakeholder%20forum_160712.pdf
Scott, A., Darko, E., Seth, P. and Rud, J.-P. (2013) Job creation impact study: Bugoye Hydropower Plant, Uganda. Report prepared for the Private Infrastructure Development Group. London: ODI.
Spratt, S. and Ryan-Collins, L. (2013) ‘Development finance institutions and infrastructure: Findings from a systematic review of evidence for development additionality’, Great Insight 2(4), page 4-5.
te Velde, D.W. (2011) The role of development finance institutions in tackling global challenges. London: ODI. te Velde, D.W. (2015) ‘DFIs should work together to measure job impacts,’ World Bank Jobs and Development blog.
http://blogs.worldbank.org/jobs/dfis-should-work-together-measure-job-impactsVervinckt, M. (2014) Going offshore. How development finance institutions support companies using the world’s most
secretive financial centres. Brussels: Eurodad report. http://www.eurodad.org/files/pdf/5457b8e273cfa.pdf Wetherill, C. (2010) ‘Additionality of development finance institutions (DFIs) in upstream oil and gas in Africa.’
Working Paper 114. Tunis: African Development Bank Group.World Bank (2005) World development report 2005: A better investment climate for everyone. Washington, DC:
World Bank.


52 ODI Report
ODI is the UK’s leading independent think tank on international development and humanitarian issues.
Readers are encouraged to reproduce material from ODI Reports for their own publications, as long as they are not being sold commercially. As copyright holder, ODI requests due acknowledgement and a copy of the publication. For online use, we ask readers to link to the original resource on the ODI website. The views presented in this paper are those of the author(s) and do not necessarily represent the views of ODI.© Overseas Development Institute 2016. This work is licensed under a Creative Commons Attribution-NonCommercial Licence (CC BY-NC 4.0).
All ODI Reports are available from www.odi.org
Cover photo: © John Hogg/World Bank: Rossing Uranium Mine lies about 70km inland from Swakopmund close to the small town of Arandis. It was founded by amateur geologist Capt. Peter Louw in 1928 largley owned by the Rio Tinto Group (69% shares). In 2006 the mine produced about 7% of the world production of primary produced uranium. The mine is a long term supplier of uranium to the world nuclear power industry. Haul trucks being repaired and serviced at the workshop on the mine.
Overseas Development Institute203 Blackfriars Road London SE1 8NJTel +44 (0) 20 7922 0300 Fax +44 (0) 20 7922 0399
odi.org