Embed Size (px)
Citation preview

Journal of Hydrology (2008) 355, 148–163
ava i lab le at www.sc iencedi rec t . com
journal homepage: www.elsevier .com/ locate / jhydro l
The impact of climate change on the water resourcesof Hindukush–Karakorum–Himalaya region underdifferent glacier coverage scenarios
M. Akhtar a,*, N. Ahmad a, M.J. Booij b
a Institute of Geology, University of the Punjab, Lahore, Pakistanb Department of Water Engineering and Management, University of Twente, Enschede, The Netherlands
Received 20 April 2007; received in revised form 20 February 2008; accepted 16 March 2008
00do
KEYWORDSRegional climatemodel;Delta changeapproach;HBV model;Climate change;Glacier coverage;Hindukush–Karakorum–Himalaya region
22-1694/$ - see front mattei:10.1016/j.jhydrol.2008.03
* Corresponding author. Tel.E-mail address: akhtarme@
r ª 200.015
: +92 42yahoo.c
Summary This paper presents estimates of water resources changes in three river basins inthe Hindukush–Karakorum–Himalaya (HKH) region associated with climate change. Thepresent climate (1961–1990) and future climate SRES A2 scenario (2071–2100) are simu-lated by the PRECIS Regional Climate Model at a spatial resolution of 25 · 25 km. TwoHBV models (i.e. HBV-Met and HBV-PRECIS) are designed to quantify the future discharge.HBV-Met is calibrated and validated with inputs from observed meteorological data whileHBV-PRECIS is calibrated and validated with inputs from PRECIS RCM simulations for the cur-rent climate. The future precipitation and temperature series are constructed through thedelta change approach in HBV-Met, while in HBV-PRECIS future precipitation and tempera-ture series from PRECIS RCM are directly used. The future discharge is simulated for threestages of glacier coverage: 100% glaciers, 50% glaciers and 0% glaciers. Generally temper-ature and precipitation shows an increase towards the end of 21st century. The efficienciesof HBV-Met during calibration and validation are higher compared to the HBV-PRECIS effi-ciencies. In a changed climate, discharge will generally increase in both models for 100%and 50% glacier scenarios. For the 0% glacier scenario, HBV-Met predicts a drastic decreasein water resources (up to 94%) in contrast to HBV-PRECIS which shows only a decrease up to15%. Huge outliers in annual maximum discharge simulated through HBV-Met indicate thathydrological conditions are not predicted perfectly through the delta change downscalingapproach. The results for HBV-Met simply confirm that the quality of observed data in thisregion is poor. The HBV-PRECIS model results are indicative of the higher risk of flood prob-lems under climate change. The climate change signals in all three river basins are similarhowever, there are differences in the evaluated future water resources estimated throughHBV-Met, whereas in HBV-PRECIS the changes in water resources are similar. This showsthat the transfer of climate change signals into hydrological changes is more consistent
8 Elsevier B.V. All rights reserved.
9231251.om (M. Akhtar).

The impact of climate change on the water resources of Hindukush–Karakorum–Himalaya region 149
in HBV-PRECIS than in HBV-Met. One of the reasons of the poorer results of the delta changeapproach is that in this approach the frequency of rainy days is not changed and day to dayvariability in temperature is not correctly transferred. However more research is needed toevaluate the uncertainties in both downscaling approaches. Moreover, the dynamicaldownscaling approach needs to be tested with other RCMs and preferably to other riverbasins as well.
ª 2008 Elsevier B.V. All rights reserved.
Introduction
Pakistan’s economy is agro-based and highly dependent onthe large scale Indus irrigation system (Snow and Ice Hydrol-ogy Project, 1990). Water issues hold a unique place in Paki-stan’s policymaking history. It has generated significantheated debate and controversy for a very long time as illus-trated by issues such as the construction of the KalabaghDam and the unequal distribution of water resources amongthe provinces (Ghazanfar, 2007). Impacts of climate changeand climate variability on the water resources are likely toaffect irrigated agriculture and installed power capacity.Changes in flow magnitudes are likely to raise tensionsamong the provinces, in particular with the downstreamareas (Sindh province), with regard to reduced water flowsin the dry season and higher flows and resulting flood prob-lems during the wet season. Therefore, in Pakistan futurewater resources estimation under climate change is impor-tant for planning and operation of hydrological installations.
To investigate the impact of climate change on futurewater resources a hydrological model can be driven withthe output from a general circulation model (GCM) (Watsonet al., 1996). However, the spatial resolution of GCMs(about 250 km) might be too coarse for hydrological model-ing at the basin scale. One way to bridge this scale gap isthrough statistical downscaling (e.g. Wilby et al., 1999). Inmany hydrological studies (Bergstrom et al., 2001; Pillingand Jones, 2002; Guo et al., 2002; Arnell, 2003; Booij,2005) statistical downscaling of different GCMs has beenused to translate the assumed climate change into hydrolog-ical response. An alternative approach is dynamical down-scaling (e.g. Hay et al., 2002; Hay and Clark, 2003), inwhich a regional climate model (RCM) uses GCM output asinitial and lateral boundary conditions over a region of inter-est. The high horizontal resolution of a RCM (about 25–50 km) is more appropriate for resolving the small-scale fea-tures of topography and land use, that have a major influ-ence on climatological variables such as precipitation inclimate models. Moreover, the high resolution of the RCMis ideal to capture the variability of precipitation as inputto hydrological models (Gutowski et al., 2003). Recentapplications of this approach are presented by Kay et al.(2006a, b) and Leander and Buishand (2007).
To estimate the impact of climate change on river dis-charges different scenarios of the future meteorologicalconditions (e.g. temperature and precipitation) are usedas input to a hydrological model of a river basin to calculatethe corresponding discharges. Changes in downscaled tem-perature and precipitation series can be applied to observedtemperature and precipitation series by simple transforma-tion rules. We will refer to this approach as the delta change
approach (Hay et al., 2002). In the delta change approach,an expected mean temperature change is added to the ob-served temperature record to obtain a future temperaturetime series. Precipitation is usually multiplied by a fraction.However, the adjustment of precipitation in this way is notideal, as the results depend on the way in which the monthlyfactors are applied to the daily rainfall series (Reynardet al., 2001). Another way to estimate the future water re-sources is by using RCM outputs directly to force the hydro-logical model (Hay et al., 2002; Graham et al., 2007;Leander and Buishand, 2007). In these studies some biascorrections are made in the RCM outputs before using theminto hydrological models calibrated and validated with ob-served meteorological data. The direct use of RCM outputhas the potential advantage that more complex changes inthe probability density functions of the input variables ofhydrological models are taken into account. Akhtar et al.(2008) used the RCM outputs directly in the hydrologicalmodel and estimated the parameters of the hydrologicalmodel for each source of input, i.e. outputs from differentRCMs, separately.
One field of application of hydrological models is the cre-ation of runoff scenarios for different climate and glaciationconditions. However, glacier storage is not handled well bycurrent conceptual or physically-based hydrological models.Hence, holistic approaches to study and model glacier stor-age are of major importance to fully integrate glaciers intothe hydrological balance to be used for water resourcesand river flow predictions at all time scales (Jansson et al.,2003). During the 20th century, most of the world’s glaciershave shrunk (Paul et al., 2004; WGMS, 2002; Haeberli et al.,1999) and for a warming rate of 0.04 K a�1, without increasesin precipitation, few glaciers would survive until 2100. Onthe other hand, if the warming rate is limited to 0.01 K a�1
with an increase in precipitation of 10% per degree warming,it is predicted that overall loss would be restricted to 10–20% of the 1990 volume (Oerlemans et al., 1998). The gla-ciers of the Greater Himalaya are also retreating (Mastny,2000), although Hewitt (1998) reports the widespreadexpansion of the larger glaciers in the central Karakorum,accompanied by an exceptional number of glacier surges.
The aim of our study is to examine the impact of climatechange on the future water resources of three river basinsof the Hindukush–Karakorum–Himalaya (HKH) region underdifferent glacier coverage scenarios. To achieve this wemake use of the output of the RCM PRECIS nested withinthe GCM HadAM3P as input into the HBV hydrological modelto estimate the discharge of the three river basins in thepresent and future climate. The GCM uses the SRES A2greenhouse gas emission scenario for the simulation of thefuture climate. The study area is described in section

150 M. Akhtar et al.
‘Description of study area’. The climatological inputs andHBV hydrological model are briefly described in section‘Methodology’. The results of the PRECIS RCM present andfuture simulations and impacts of climate change on the dis-charge are presented in section ‘Results and discussion’. Fi-nally, the conclusions and recommendations are given insection ‘Conclusions and recommendations’.
Description of study area
Three river basins are selected for analysis: Hunza riverbasin, Gilgit river basin and Astore river basin. Table 1 lists
Table 1 Characteristics of study area
River basins
Hunza Gilgit Astore
Gauging station Dainyor Gilgit DoyianLatitude 35� 56 0 35� 56 0 35� 33 0
Longitude 74� 23 0 74� 18 0 74� 42 0
Elevation of gauging station (m) 1450 1430 1583Drainage area (km2) 13925 12800 3750Glacier covered area (km2) 4688 915 612% Glacier covered area 34 7 16Mean elevation (m) 4472 3740 3921% Area above 5000 m 35.8 2.9 2.8No. of meteorological stationsPrecipitation – 2 1Temperature – 2 1
No. of PRECIS grid points 12 10 4
Figure 1 Location of
some features of the study basins and Fig. 1 shows thelocation of the three river basins. These three river basinsare situated in the high mountainous HKH region with manypeaks exceeding 7000 m and contain a large area of peren-nial snow and ice. The HKH region is dominated by largeglaciers and there is a fivefold to tenfold increase in pre-cipitation from glacier termini (�2500 m) to accumulationzones above 4800 m. Maximum precipitation occurs be-tween 5000 and 6000 m (Hewitt, 1993). Most glaciers arenourished mainly by avalanche snow. Westerly circulationsand cyclonic storms contribute two third of high altitudesnowfall (Hewitt et al., 1989), while one third derives fromsummer snowfall mainly due to monsoon circulation(Wake, 1989). A huge loss of ice mass and glacier reces-sions are observed in almost all Karakorum glaciers formost of the 20th century until the mid 1990s. Since thenthere has been thickening and advances in many glaciersbut confined to the highest watersheds of the centralKarakorum (Hewitt, 2005). In spite of surge type behaviorof some glaciers in the HKH region (Diolaiuti et al., 2003),some others (e.g. the Baltoro glacier) are stable during thelast 100 years (Mayer et al., 2006) and glaciers located invalleys are declining. A shift to a positive mass balancemay be taking place, in accordance with weather-stationrecords and gauging stations that show reduced runofffrom the most heavily glacierized Hunza basin (Fowlerand Archer, 2006; Archer and Fowler, 2004). However,the suddenness of the changes in glaciers and their con-finement to the highest watersheds suggests that thermaland hydrological thresholds being crossed that triggerdown slope redistribution of ice by normal as well as surg-ing flow, with or without mass balance changes (Hewitt,2007).
three river basins.

The impact of climate change on the water resources of Hindukush–Karakorum–Himalaya region 151
Seasonal snow melt and melting of glacial ice are bothlarge contributors in the discharge of the selected three riv-ers. In most winters, 80–90% of the area becomes snow cov-ered (Snow and Ice Hydrology Project, 1990). Climaticvariables are strongly influenced by altitude. The HKH re-gion receives a total annual rainfall of between 200 and500 mm, but these amounts are derived from valley-basedstations and not representative for elevated zones. High-altitude precipitation estimates derived from accumulationpits runoff above 4000 m range from 1000 mm to more than3000 mm. These estimates depend on the site and time ofinvestigation, as well as on the method applied (Wingeret al., 2005).
Methodology
Climatological input
Observed dataDaily observed meteorological data from the Gilgit and As-tore meteorological stations are selected for the Gilgitand Astore river basins. There is no meteorological stationin the Hunza river basin, therefore neighboring Skardumeteorological station is used for calibration and validationof HBV. The observed discharge data for the three river ba-sins are available at the outlets of the basins. The length ofthe records in the three river basins is not the same andthere are some missing years in the discharge data. There-fore, in some cases the calibration and validation periodsin the three river basins are not same (see Table 3 in section‘Calibration and validation of HBV model’).
Regional climate model outputsThe RCM used in this study is PRECIS developed by the HadleyCentre of the UK Meteorological Office. The PRECIS RCM isbased on the atmospheric component of the HadCM3 climatemodel (Gordon et al., 2000) and is extensively described inJones et al. (2004). The atmospheric dynamics module ofPRECIS is a hydrostatic version of the full primitive equationsand uses a regular longitude–latitude grid in the horizontaland a hybrid vertical coordinate. For this study, the PRECISmodel domain (Upper Indus basin) has been set up with a hor-izontal resolution of 25 · 25 km, as compared to Akhtar et al.(2008) who used a horizontal resolution of 50 · 50 km. Thedomain is roughly stretched over the latitude 26�–39�N andlongitude 67�–85�E. The HadAM3P global data set is usedto drive the PRECIS model. The horizontal resolution of theHadAM3P boundary data is 150 km and for the present and fu-ture climate, it covers the period 1960–1990 and 2070–2100, respectively (Wilson et al., 2005). For the future cli-mate, the SRES A2 greenhouse gas emission scenario is se-lected (Nakicenovic et al., 2000).
The first year in each PRECIS RCM experiment is consid-ered as a spin-up period and these data are not used inany analysis. After post processing of each PRECIS RCMexperiment the time series of temperature and precipita-tion are produced for further analysis.
Delta change approach to observed dataThe delta change approach has been used in many climatechange impact studies before (see e.g. Arnell, 1998; Gellens
and Roulin, 1998; Middelkoop et al., 2001). In this approach,the observed climate time series are adapted with esti-mated monthly climate changes from the PRECIS RCM. Theobservational database used for the delta change approachcovers the period 1981–1996. The future daily temperatureðTf;dailyÞ and daily precipitation ðPf;dailyÞ time series are con-structed by Eqs. (1) and (2), respectively
Tf;daily ¼ To;daily þ ðT f;monthly � Tp;monthlyÞ ð1Þ
Pf;daily ¼ Po;dailyPf;monthly
Pp;monthly
ð2Þ
where To;daily is the observed daily temperature, Po;daily is theobserved daily precipitation, T f;monthly is the mean monthlyPRECIS simulated future temperature, Tp;monthly is the meanmonthly PRECIS simulated present temperature, Pf;monthly isthe mean monthly PRECIS simulated future precipitationand Pp;monthly is the mean monthly PRECIS simulated presentprecipitation.
Depending on the source of input data, i.e. observedmeteorological data and PRECIS RCM simulations for the cur-rent climate, two HBVmodels (see Section ‘HBV hydrologicalmodel’) are calibrated and are hereafter referred to as HBV-Met and HBV-PRECIS, respectively. The climate change signalfrom the PRECIS RCM is transferred to HBV-Met through thedelta change approach whereas in HBV-PRECIS the futuresimulated temperature and precipitation series are useddirectly. The effect of climate change on river discharge issimulated for the current glacier extent (100% glacier sce-nario) and for two stages of deglacierisation, i.e. after anareal reduction by 50% (50% glacier scenario) and after com-plete melting (0% glacier scenario).
HBV hydrological model
For river discharge simulation, the hydrological model HBVof the Swedish Meteorological and Hydrological Institute(SMHI) is used (Bergstrom, 1995; Lindstrom et al., 1997).Using inputs from RCMs this model has reproduced the dis-charge fairly well for e.g. the Suir river in Ireland (Wanget al., 2006). HBV has been widely used in Europe and otherparts of the world in climate change studies (Liden and Har-lin, 2000; Bergstrom et al., 2001; Menzel and Burger, 2002;Booij, 2005; Menzel et al., 2006). This model is a semi-dis-tributed, conceptual hydrological model using sub-basinsas the primary hydrological units. It takes into accountarea-elevation distribution and basic land use categories(glaciers, forest, open areas and lakes). Sub-basins are con-sidered in geographically or climatologically heterogeneousbasins. The model consists of a precipitation routine repre-senting rainfall and snow, a soil moisture routine determin-ing actual evapotranspiration and controlling runoffformation, a quick runoff routine and a base flow routinewhich together transform excess water from the soil mois-ture zone to local runoff, a transformation function and arouting routine. A general description of the HBV model isgiven in SMHI (2005) and the application of HBV to theHKH region is extensively studied by Akhtar et al. (2008).
As input, the model needs the distribution of the basinarea by altitude and land use categories, where the glaci-ated parts have to be treated as a separate land use classand glacier mass balance is determined for each elevation

152 M. Akhtar et al.
zone. For running the daily model, the only required dataare daily means of temperature and daily total precipitation(potential evapotranspiration is calculated using a simpli-fied version of Thornthwaite’s equation with temperatureas input). Daily discharge is needed for calibration. Param-eters of the HBV model are calibrated using a manual cali-bration procedure (SMHI, 2005). In previous HBV studies,much experience has been gained in parameter estimation,which is used to acquire the range of parameters in ourstudy (Uhlenbrook et al., 1999; Krysanova et al., 1999;SMHI, 2005; Booij, 2005). A univariate sensitivity analysis
-30-25-20-15-10-505
10
JAN FEB MAR APR MAY JUM
Tem
pera
ture
(ºC
)
Future temperatur
(a) Hunza river basin
-25-20-15-10-505
101520
JAN FEB MAR APR MAY JUM
Tem
pera
ture
(ºC
)
Future temperatur
(b) Gilgit river basin
-20-15-10-505
101520
JAN FEB MAR APR MAY JUM
Tem
pera
ture
(ºC
)
Future temperatur
(c) Astore river basin
Figure 2 Mean annual cycle of temperature over (a) Hunza river bPRECIS for present (1961–1990) and future (2071–2100) day climat
is performed to assess the sensitivity of the discharge re-gime to the parameters. For the three river basins, param-eters GMELT (glacier melting factor), FC (maximum soilmoisture storage), PERC (percolation from upper to lowerresponse box), TT (threshold temperature), DTTM (valueadded to TT to reach threshold temperature for snowmelt),and CFMAX (factor for snow melt) are found to be most sen-sitive and there is a strong interdependence among theseparameters. Therefore, a multivariate sensitivity analysisis performed to calibrate the parameters of the HBV-METand HBV-PRECIS models for each river basin.
N JUL AUG SEP OCT NOV DEConth
e Present temperature
N JUL AUG SEP OCT NOV DEConth
e Present temperature
N JUL AUG SEP OCT NOV DEConth
e Present temperature
asin (b) Gilgit river basin (c) Astore river basin as simulated withe (�C).

The impact of climate change on the water resources of Hindukush–Karakorum–Himalaya region 153
In order to assess the performance of the model, theNash–Sutcliffe efficiency coefficient NS (Nash and Sutcliffe,1970) and the relative volume error RE are commonly calcu-lated by Eqs. (3) and (4):
NS ¼ 1�Pi¼N
i¼1 ½Q sðiÞ � Q oðiÞ�2Pi¼N
i¼1 ½Q oðiÞ � �Q o�2ð3Þ
RE ¼ 100
Pi¼Ni¼1 ½Q sðiÞ � Q oðiÞ�Pi¼N
i¼1Q oðiÞð4Þ
where i is the time step, N is the total number of time steps,Qs represents simulated discharge, Qo is observed discharge
0
2
4
6
8
10
JAN FEB MAR APR MAY JUN
M
Pre
cipi
tatio
n (m
m/d
ay)
Future precipitation
0
1
2
3
4
5
6
7
JAN FEB MAR APR MAY JUN
M
Pre
cipi
tatio
n (m
m/d
ay)
Future precipitation
0
2
4
6
8
10
JAN FEB MAR APR MAY JUN
M
Pre
cipi
tatio
n (m
m/d
ay)
Future precipitation
Figure 3 Mean annual cycle of precipitation over (a) Hunza river bPRECIS for present and future day climate (mm/day).
and �Q o is the mean of Qo over the calibration/validationperiod. For a favorable model performance, the efficiencyNS should be as high as possible (maximum value of 1) andthe RE value should be close to zero.
Results and discussion
Changes of temperature and precipitation during2071–2100
For three river basins, the mean annual cycles of tempera-ture and precipitation for the present and future climate
JUL AUG SEP OCT NOV DEC
onth
Present precipitation
(a) Hunza river basin
JUL AUG SEP OCT NOV DEC
onth
Present precipitation
(b) Gilgit river basin
JUL AUG SEP OCT NOV DEC
onth
Present precipitation
(c) Astore river basin
asin (b) Gilgit river basin (c) Astore river basin as simulated with

154 M. Akhtar et al.
simulated with PRECIS are presented in Figs. 2 and 3,respectively. These indicate a general increase in tempera-ture and precipitation during the period 2071–2100. Thewarming is uniformly distributed over the three river basins.Both in the present and future simulated climate the highesttemperature is reached in the month of July and lowesttemperature is observed during the month of January. Table2 presents the seasonal changes in temperature and precip-itation in the three river basins with climate change. Theannual mean temperature rise by the end of the century isup to 4.8 �C. The warming is stronger during the winter sea-son compared to the summer season.
PRECIS estimates a rise in annual mean precipitation (upto 19%) by the end of the 21st century. The increase in precip-itation is observed in all seasons. Generally, the changes inprecipitation during the summer season are larger than dur-ing the winter season. This is because of the fact that theHKH region receives a very small amount of precipitation dur-ing the summer season and a small absolute increase in sum-mer precipitation compared to winter precipitation gives alarger percentual precipitation change during the summer.The mean annual precipitation changes in the Hunza (19%),Gilgit (21%) and Astore (13%) river basins are similar. Thegeneral increase in temperature and precipitation is consis-tent with the projected increase in temperature and precip-itation in neighboring areas such as southwest China andnorthwest India (Yinlong et al., 2006; Kumar et al., 2006).
Calibration and validation of HBV model
Table 3 presents the efficiencies, relative volume error andmean observed and simulated discharge for the two HBV
Table 3 Performance of two HBV models during calibration and
River basin Calibration
Period �Qo m3/s �Q s m3/s N
HBV-Met Hunza 1981–1990 306.5 306.5 0Gilgit 1981–1990 266.8 266.9 0Astore 1981–1990 133.4 133.4 0
HBV-PRECIS Hunza 1971–1980 370.6 369.8 0Gilgit 1961–1970 288.7 288.6 0Astore 1975–1983 120.6 121.6 0
The NS values are for daily model runs.
Table 2 Seasonal changes of mean temperature and precipitatioriver basins relative to 1961–1990
River basins Temperature change (�C)
Annual Winter Sum
Hunza 4.5 4.8 4.2Gilgit 4.8 4.8 4.8Astore 4.5 4.7 4.4
(Summer = April–September; Winter = October–March).
models during calibration and validation periods for thethree river basins. The average simulated discharge andaverage observed discharge is equal during the calibrationperiod for each HBV model and for each river basin andconsequently the relative volume error is zero. Generaltesting of conceptual models (Rango, 1992) has shown thatNS values higher than 0.8 are above average for runoffmodeling in glaciated catchments. Therefore, model effi-ciencies during calibration are satisfactory for the twoHBV models. The efficiencies of HBV-Met are higher thanthose of HBV-PRECIS. Since the calibration period for thetwo models are different and the efficiency values highlydepend on the time period for which the model is run,the smaller efficiency of HBV-PRECIS might be due to theevents that are not captured by the model during that per-iod. During the validation period NS values, RE values andvisual inspection of hydrographs (Figures are not given)show that performance of the two HBV models is satisfac-tory. The values of the performance criteria show that dur-ing the validation period overall performance of HBV-Met(e.g. 0.71 < NS < 0.91) is somewhat better compared tothe calibration period (e.g. 0.67 < NS < 0.86), while overallperformance of HBV-PRECIS during validation (e.g.0.58 < NS < 0.72) is somewhat less compared to the calibra-tion period (e.g. 0.74 < NS < 0.82). Although in this studywe used PRECIS RCM outputs at 25 km resolution (for UpperIndus Basin domain) yet on average the efficiency of HBV-PRECIS is similar to that of Akhtar et al. (2008) achievedby using PRECIS RCM outputs at 50 km resolution (for SouthAsia domain). This shows that increasing the resolution ofdata does not necessarily increase the efficiency of thehydrological model.
validation in different river basins
Validation
S RE % Period �Qo m3/s �Q s m3/s NS RE %
.86 0 1990–1996 281.1 275.1 0.91 �2
.83 0 1990–1996 295.6 256.7 0.77 �13
.67 0 1990–1996 171.2 152.3 0.71 �11
.74 0 1981–1990 306.5 364.9 0.72 19
.82 0 1981–1990 266.8 264.8 0.72 0
.79 0 1983–1990 140.5 109.5 0.58 �22
n under SRES A2 scenario from PRECIS in 2071–2100 over three
Precipitation change (%)
mer Annual Winter Summer
19 27 1021 19 2413 1 25

The impact of climate change on the water resources of Hindukush–Karakorum–Himalaya region 155
Future annual discharge cycle
Fig. 4 shows the mean annual discharge cycle simulated byHBV-Met for the present and future climate for three stagesof glacier coverage: 100% glaciers, 50% glaciers and 0% gla-ciers. The amplitude of the annual discharge cycle is in-creased in a changed climate under the 100% glacierscenario. Snow melting starts one month earlier and dis-charge rises towards its peak in summer (August). However,
0
500
1000
1500
2000
JAN FEB MAR APR MAY JU
Dis
char
ge (
m3 /s
)
Future Discharge-100% glacia
Future Discharge-0% glaciatio
(a) Hunza river basin
0200400600800
100012001400
JAN FEB MAR APR MAY JU
Dis
char
ge (
m3 /s
)
Future Discharge-100% glacia
Future Discharge-0% glaciatio
(b) Gilgit river basin
0
100
200
300
400
500
JAN FEB MAR APR MAY JU
Dis
char
ge (
m3 /s
)
Future Discharge-100% glaciat
Future Discharge-0% glaciation
(c) Astore river basin
Figure 4 Annual discharge cycle simulated by HBV-Met for the prethree river basins.
this case has to be regarded as a hypothetical one becausefuture 100% glacier extent is not realistic with climatechange. If the glacierised area is reduced by 50%, snowmeltstill begins one month earlier and discharge is increased dur-ing March, April and May in the Astore river basin, while it isdecreased in the Hunza and Gilgit river basins in this period.The discharge under 50% glacier scenario is also increased inSeptember and October in the Hunza river basin. The qual-itative changes in monthly runoff for the 0% glacier scenario
N JUL AUG SEP OCT NOV DEC
Month
tion Future Discharge-50% glaciation
n Present simulated discharge
N JUL AUG SEP OCT NOV DEC
Month
tion Future Discharge-50% glaciation
n Present simulated discharge
N JUL AUG SEP OCT NOV DEC
Monthion Future Discharge-50% glaciation
Present simulated discharge
sent climate and future climate for three stages of glaciation for

156 M. Akhtar et al.
are more controversial. The discharge is reduced drasticallyin all three river basins. HBV-Met shows that the major con-tribution in these river basins is because of glacial melt,although the exact contribution is not known.
Fig. 5 shows the mean annual discharge cycle simulatedby HBV-PRECIS for the present and future climate for threestages of glacier coverage: 100% glaciers, 50% glaciers and0% glaciers. The amplitude of the seasonal discharge cycle
0
500
1000
1500
2000
JAN FEB MAR APR MAY JU
Dis
char
ge (
m3 /s
)
Future Discharge-100% glacia
Future Discharge-0% glaciatio
(a) Hunza river basin
0200400600800
100012001400
JAN FEB MAR APR MAY JU
Dis
char
ge (
m3 /s
)
Future Discharge-100% glacia
Future Discharge-0% glaciatio
0
100
200
300
400
500
JAN FEB MAR APR MAY JU
Dis
char
ge (
m3 /s
)
Future Discharge-100% glaciat
Future Discharge-0% glaciation
(b) Gilgit river basin
(c) Astore river basin
Figure 5 Annual discharge cycle simulated by HBV-PRECIS for thefor three river basins.
is increased in a changed climate under the 100% glacierscenario as well. Snowmelt starts one month earlier, i.e.it starts in March. There is an increase in river dischargethroughout the year and in all river basins. The highest peakis observed in July. For the 50% glacier scenario the dis-charge is increased during March–July while during Au-gust–October the shape of the hydrograph is generally thesame as in the present climate. After complete reduction
N JUL AUG SEP OCT NOV DEC
Month
tion Future Discharge-50% glaciation
n Present simulated discharge
N JUL AUG SEP OCT NOV DEC
Month
tion Future Discharge-50% glaciation
n Present simulated discharge
N JUL AUG SEP OCT NOV DEC
Month
ion Future Discharge-50% glaciation
Present simulated discharge
present climate and future climate for three stages of glaciation

Table 4 Mean relative change in future discharge (2071–2100) in a changed climate relative to the present discharge(1961–1990) for three glaciations stages and for three riverbasins
Model Riverbasin
Mean change in discharge (%)
100% glacier 50% glacier 0% glacier
HBV-Met Hunza 88 10 �65Gilgit 70 �12 �94Astore 48 �12 �72
HBV-PRECIS Hunza 59 21 �15Gilgit 60 24 �12Astore 41 13 �15
The impact of climate change on the water resources of Hindukush–Karakorum–Himalaya region 157
of the glaciers, snowmelt still starts one month earlier andthere is an increase in discharge during March–May. There isa considerable decrease in discharge during July–September.
Table 4 presents the mean relative changes in futuredischarge (2071–2100) in a changed climate relative tothe present discharge (1961–1990) for the three glacia-tions stages and for three river basins. There is a big dis-crepancy between the results of changes in dischargesimulated by HBV-Met and HBV-PRECIS. Under the 100%glacier scenario both models predict an increase in waterresources. However the increase is higher in HBV-Metcompared to HBV-PRECIS. Under the 50% glacier scenarioHBV-Met predicts an increase in the discharge in the Hunzariver basin, while in the Gilgit and Astore river basins thedischarge is expected to decrease. HBV-PRECIS predictsan increase in all river basins under the 50% glacier sce-nario. Without glaciers, HBV-Met predicts a drasticdecrease in the discharge (65–94%) in all river basins,whereas HBV-PRECIS predicts about a 15% decrease inthe discharge. There is neither forest nor any major lakepresent in the three river basins and glaciers and fields(area without forest) are considered as the only two landuse classes in the hydrological model framework. There-fore, the effect of complete melting of glaciers on thehydrological cycle will depend on the degree of glaciationin the river basins and response of the river basins to cli-mate change. For instance looking at the similar patternsof climate change in the three river basins the highly gla-ciated Hunza river is expected to react more severely com-pared to the least glaciated Gilgit river basin. However,HBV-Met shows that more drastic changes are expectedin the Gilgit river basin compared to the Hunza river basin.This is may be because of the inaccurate transfer of cli-mate change signals through the delta change approach.The decrease in discharge predicted by HBV-PRECIS is con-sistent with the complete melting of glaciers, because thenet annual ice losses due to wastage of glaciers representsbetween 12% and 15% of the annual water yield from melt-ing ice (Hewitt et al., 1989). The transfer of climatechange signals into hydrological changes seems to be moreconsistent in HBV-PRECIS. The temperature and precipita-tion changes are almost similar in all three river basins.The resulting changes in water resources conditions under
all glaciation scenarios are also more similar in HBV-PRECIScompared to HBV-Met. Although these basins have similargeology and hydrology, there is a chance that due to po-tential biases in PRECIS RCM simulated temperature andprecipitation series for the current climate, the parame-ters of HBV-PRECIS are adjusted in such a way that the im-pacts on water resources are similar. However,transferring the climate change signals to the hydrologicalmodel through the direct use of RCM simulations preservesfuture extremes which is an advantage over the deltachange approach (Graham et al., 2007).
Future discharge peaks
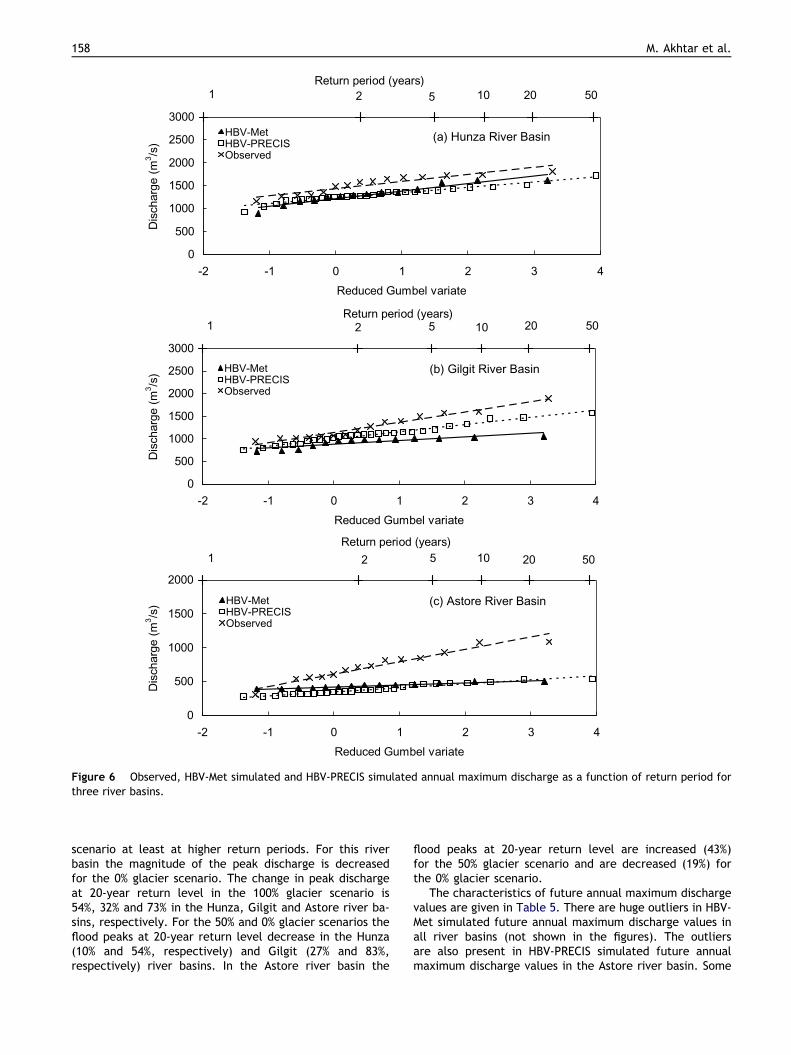
Extreme value analysis based on the Gumbel extreme valuedistribution is carried out to estimate the impact of climatechange on floods for three river basins with two HBV mod-els and for three glaciation stages. For this, the maximumdischarge per hydrological year is determined from bothmeasured and simulated discharge series of three river ba-sins. Fig. 6 shows the extreme value distribution of floodsderived from observed discharge data and simulated dis-charge data from HBV-Met and HBV-PRECIS. Observed dis-charge data from the period 1981–1996, simulateddischarge data for HBV-Met from the period 1981–1996and simulated discharge data for HBV-PRECIS from the per-iod 1961–1990 are used. Since the extreme discharge re-turn values are influenced by the period of study, it isdifficult to compare the observed extreme values withHBV-PRECIS simulated extreme values. Moreover, observedand HBV-Met simulated extreme values are based on rela-tively few extreme flood events, which makes the extrapo-lation to large return periods highly susceptible to errors.Anyhow, the general trend of present day simulated annualmaximum discharge from both HBV models is an underesti-mation at all return levels. The highest differences be-tween observed and modeled extreme discharges arefound in the Astore river basin.
The flood frequency results under climate change forthree glacier stages estimated through HBV-PRECIS andHBV-Met models are presented in Figs. 7 and 8, respec-tively. In all river basins, HBV-PRECIS shows an increasein flood magnitude for all return periods under climatechange in the 100% and 50% glacier scenarios. The magni-tude of flood frequency under climate change in the 0% gla-cier scenario is increased in the Hunza and Gilgit riverbasins whereas in Astore river basin it is comparable withthe current magnitude of floods at least at higher returnperiods. The change in peak discharge at 20-year returnlevel in the 100% glacier scenario is 68%, 36% and 34% inthe Hunza, Gilgit and Astore river basins, respectively.These results are consistent with the study of Milly et al.(2002) who found an overall increase in flood peaks duringthe twentieth century and this trend is expected to con-tinue in the future. HBV-Met predicts an increase in floodmagnitude for all return period under climate change inthe Hunza and Gilgit river basins for the 100% glacier sce-nario whereas for the 50% and 0% glacier scenarios, themagnitude of peak discharges is decreased. The flood fre-quency is increased in the Astore river basin for the 100%glacier scenario for all return periods and for 50% glacier
1 2 5 10 20 50Return period (years)
1 2 5 10 20 50
1 2 5 10 20 50Return period (years)
0
500
1000
1500
2000
2500
3000
-2 -1 0 1 2 3 4Reduced Gumbel variate
Dis
char
ge (m
3 /s) (a) Hunza River Basin
0
500
1000
1500
2000
2500
3000
-2 -1 0 1 2 3 4Reduced Gumbel variate
Dis
char
ge (m
3 /s) (b) Gilgit River Basin
0
500
1000
1500
2000
-2 -1 0 1 2 3 4Reduced Gumbel variate
Dis
char
ge (m
3 /s) HBV-Met
HBV-PRECISObserved
HBV-MetHBV-PRECISObserved
HBV-MetHBV-PRECISObserved
(c) Astore River Basin
Return period (years)
Figure 6 Observed, HBV-Met simulated and HBV-PRECIS simulated annual maximum discharge as a function of return period forthree river basins.
158 M. Akhtar et al.
scenario at least at higher return periods. For this riverbasin the magnitude of the peak discharge is decreasedfor the 0% glacier scenario. The change in peak dischargeat 20-year return level in the 100% glacier scenario is54%, 32% and 73% in the Hunza, Gilgit and Astore river ba-sins, respectively. For the 50% and 0% glacier scenarios theflood peaks at 20-year return level decrease in the Hunza(10% and 54%, respectively) and Gilgit (27% and 83%,respectively) river basins. In the Astore river basin the
flood peaks at 20-year return level are increased (43%)for the 50% glacier scenario and are decreased (19%) forthe 0% glacier scenario.
The characteristics of future annual maximum dischargevalues are given in Table 5. There are huge outliers in HBV-Met simulated future annual maximum discharge values inall river basins (not shown in the figures). The outliersare also present in HBV-PRECIS simulated future annualmaximum discharge values in the Astore river basin. Some

0500
1000150020002500300035004000
-2 -1 0 1 2 3 4Reduced Gumbel variate
Dis
char
ge (m
3 /s)
(a) Hunza River Basin
1 2 5 10 20 50Return period (years)
0
500
1000
1500
2000
2500
3000
-2 -1 0 1 2 3 4Reduced Gumbel variate
Dis
char
ge (m
3 /s)
(b) Gilgit River Basin
1 2 5 10 20 50Return period (years)
0
500
1000
1500
-2 -1 0 1 2 3 4Reduced Gumbel variate
Dis
char
ge (m
3 /s)
Future-100% glaciation Future-50% glaciationFuture-0% glaciation Present simulated
Future-100% glaciation Future-50% glaciationFuture-0% glaciation Present simulated
Future-100% glaciation Future-50% glaciationFuture-0% glaciation Present simulated
(c) Astore River Basin
1 2 5 10 20 50Return period (years)
Figure 7 HBV-PRECIS simulated annual maximum discharge as a function of return period for current and changed climate forthree glacier stages for three river basins.
The impact of climate change on the water resources of Hindukush–Karakorum–Himalaya region 159
of these outliers in both HBV-Met and HBV-PRECIS may bebecause of the high variability of runoff due to the smallsize of the river basin. The outliers in HBV-Met are ex-plained by the fact that in each river basin only one mete-orological station is used for temperature and precipitationinput into HBV-Met. Observed precipitation is considered asareally averaged precipitation but actually point precipita-
tion. Unfortunately, sufficient precipitation stations arenot available to assess the areally averaged basin scale pre-cipitation in a right way. Consequently, observed precipita-tion shows too much variability and extreme behavior.Parameters are estimated under too variable and extremeconditions. For example in Hunza river basin at Skardumeteorological station there are three heavy rainfall spells

1 2 5 10 20 50Return period (years)
1 2 5 10 20 50Return period (years)
1 2 5 10 20 50Return period (years)
0500
1000150020002500300035004000
-2 -1 0 1 2 3 4Reduced Gumbel variate
Dis
char
ge (m
3 /s) (a) Hunza River Basin
0
500
1000
1500
2000
2500
3000
-2 -1 0 1 2 3 4Reduced Gumbel variate
Dis
char
ge (m
3 /s) (b) Gilgit River Basin
0
500
1000
1500
-2 -1 0 1 2 3 4Reduced Gumbel variate
Dis
char
ge (m
3 /s) (c) Astore River BasinFuture-100% glaciation Future-50% glaciation
Future-0% glaciation Present simulated
Future-100% glaciation Future-50% glaciationFuture-0% glaciation Present simulated
Future-100% glaciation Future-50% glaciationFuture-0% glaciation Present simulated
Figure 8 HBV-Met simulated annual maximum discharge as a function of return period for current and changed climate for threeglacier stages for three river basins.
160 M. Akhtar et al.
in the month of October 1987 (average rainfall is 37.0 mmin October, 1987 while the climate normal for October is6.4 mm). When we use climate change scenarios derivedfrom PRECIS (in October there is an increase in precipita-tion of 57%) HBV-Met gives extremely high peaks in October1987 (an increase in mean discharge of 289% in October1987). Therefore, the quality of input data used in HBV-Met seems to be too poor to simulate extreme dischargebehavior.
The modeled changes in flood frequency under climatechange are just estimations that are based on simulationsusing input data from only one RCM run, using one emissionscenario and one single GCM for the boundary data. OtherGCMs could result in quite different flood frequency predic-tions. Despite all uncertainties, the behavior of peak dis-charges predicted by the two HBV models supports thedirect use of RCM output as input to hydrological models inthis area.

Table 5 Characteristics of future annual maximum discharge simulated by two HBV models in a changed climate for the threeglaciations stages and for three river basins
Model River basin Glaciation scenario
Means (m3/s) Standard deviation (m3/s)
100% 50% 0% 100% 50% 0%
HBV-PRECIS Hunza 2052.5 1738.0 1391.9 272.2 294.9 266.5Gilgit 1540.5 1351.6 1186.0 261.1 288.1 276.6Astore 549.8 (613.3) 473.9 (536.2) 394.7 (451.7) 321.3 (465.3) 324.1 (462.2) 305.6 (429.2)
HBV-Met Hunza 2123.7 (2837.4) 1140.3 (1887.7) 249.9 (915.5) 265.1 (2775.9) 169.4 (2899.3) 203.5 (2585.1)Gilgit 1400.2 (1430.5) 688.3 (709.9) 42.9 (53.5) 120.0 (165.0) 65.9 (104.8) 47.3 (61.3)Astore 566.2 (591.7) 377.8 (401.0) 207.9 (231.3) 99.5 (137.6) 121.2 (147.3) 82.5 (120.5)
The values in parentheses are for future annual maximum discharge with outliers.
The impact of climate change on the water resources of Hindukush–Karakorum–Himalaya region 161
Conclusions and recommendations
The PRECIS RCM present climate and future SRES A2 climatescenarios presented in this paper include detailed regionalinformation (25 · 25 km) and is very important for climateimpact assessment in various sectors. This paper includesonly the basic aspects of simulated present and future cli-mate (i.e. future changes in temperature and precipita-tion). Generally, temperature and precipitation shows anincrease towards the end of the 21st century spread monot-onously over the three river basins. There are several uncer-tainty sources in the PRECIS RCM simulations which are notdiscussed here. However, we plan to evaluate and quantifythese uncertainties in this region in PRECIS RCM simulationsin our future work.
In a changed climate, HBV does not calculate the newglacier area size automatically. To bridge this deficiency,we have used three glacier coverage scenarios as appliedby Hagg et al. (2007) while modelling the hydrological re-sponse to climate change in glacierized Central Asiancatchments. However, future glacier extent may be pre-dicted separately by using a simple hypsographic modellingapproach (e.g. Paul et al. 2007). The use of such a pre-dicted future glacier extent in HBV would give a more real-istic hydrological change. To quantify the future waterresources, the delta change approach is used for HBV-Met and direct use of PRECIS RCM data is done for HBV-PRECIS. There are differences in the results of both ap-proaches. In a changed climate, the discharge will gener-ally increase both in HBV-PRECIS and HBV-Met in the100% glacier scenario (up to 60% and 88%, respectively)and in the 50% glacier scenario (up to 24% and 10%, respec-tively). For the 0% glacier scenario under climate change, adrastic decrease in water resources (up to 94%) in HBV-Metis present, whereas HBV-PRECIS shows a decrease up to15%.
There are huge outliers in annual maximum dischargesimulated with HBV-Met. This shows that the prediction ofhydrological conditions through the delta change approachis not ideal in the HKH region. HBV-PRECIS provides resultson hydrological changes that are more consistent withRCM changes. This shows that the climate change signalsin HBV-PRECIS are transmitted more realistically than inHBV-Met. Therefore, the direct use of RCM outputs in a
hydrological model may be an alternative in areas wherethe quality of observed data is poor. The direct use ofRCM outputs (HBV-PRECIS model) has shown that the magni-tude of annual maximum flood peaks is likely to increase inthe future. Hence, overall results are indicative of a higherrisk of flood problems under climate change. The modeledchanges in future discharge and changes in flood frequencyunder climate change are not conclusive because more re-search is needed to evaluate the uncertainties in this ap-proach. Moreover, this technique needs to be tested withother RCMs and preferably to river basins in other parts ofthe world as well.
Acknowledgements
Part of this study was completed at ICTP, Trieste, Italy,which provided funding for two months fellowship for thiswork. The Higher Education Commission of Pakistan has alsoprovided financial funding. The authors would like to thankthe PRECIS team at Hadley Centre, Met Office, UK, for theircomments and suggestions during the PRECIS simulations.The boundary data of different GCMs have been kindly sup-plied by David Hein on behalf of Hadley Centre, Met Office,UK. The daily river discharge data and meteorological datahave been taken from WAPDA, Pakistan and Pakistan Mete-orological Department, respectively. The authors also thankthe HBV support team at SMHI for their useful commentsand suggestions during the study.
References
Akhtar, M., Ahmad, N., Booij, M.J., 2008. Use of regional climatemodel simulations as input for hydrological models for theHindukush–Karakorum–Himalaya region. Hydrology and EarthSystem Sciences Discussions 5, 865–902.
Archer, D.R., Fowler, H.J., 2004. Spatial and temporal variations inprecipitation in the upper Indus Basin, global teleconnectionsand hydrological implications. Hydrology and Earth SystemScience 8, 47–61.
Arnell, N.W., 1998. Climate change and water resources in Britain.Climatic Change 39, 83–110.
Arnell, N.W., 2003. Relative effects of multi-decadal climaticvariability and changes in the mean and variability of climate

162 M. Akhtar et al.
due to global warming: future streamflow in Britain. Journal ofHydrology 270, 195–213.
Bergstrom, S., 1995. The HBV model. Chapter 13 of Computermodels of watershed hydrology. Water Resource Publications,443–476.
Bergstrom, S., Carlsson, B., Gardelin, M., Lindstrom, G., Petters-son, A., Rummukainen, M., 2001. Climate change impacts on therunoff in Sweden-assessments by global climate models, dynam-ical downscaling and hydrological modelling. Climate Research16, 101–112.
Booij, M.J., 2005. Impact of climate change on river floodingassessed with different spatial model resolutions. Journal ofHydrology 303, 176–198.
Diolaiuti, G., Pecci, M., Smiraglia, C., 2003. Liligo Glacier,Karakoram, Pakistan: a reconstruction of the recent history ofa surge-type glacier. Annals of Glaciology 36, 168–172.
Fowler, H.J., Archer, D.R., 2006. Conflicting signals of climatechange in the upper Indus Basin. Journal of Climate 19, 4276–4293.
Ghazanfar, M., submitted for publication. Kalabagh Dam and theWater Debate in Pakistan. Lahore Journal of Policy Studies.
Gellens, D., Roulin, E., 1998. Streamflow response of Belgiancatchments to IPCC climate change scenarios. Journal ofHydrology 210, 242–258.
Gordon, C.C., Cooper, C., Senior, C.A., Banks, H., Gregory, J.M.,Mitchell, J.F.B., Wood, R.A., 2000. The simulation of SST, seaice extents and ocean heat transport in a version of the Hadleycentre coupled model without flux adjustment. Climate Dynam-ics 16, 147–168.
Graham, L.P., Andreasson, J., Carlsson, B., 2007. Assessing climatechange impacts on hydrology from an ensemble of regionalclimate models, model scales and linking methods-a case studyon the Lule River basin. Climatic Change 81, 293–307.
Guo, S., Wang, J., Xiong, L., Yin, A., Li, D., 2002. A macro-scale andsemi-distributedmonthly water balancemodel to predict climatechange impacts in China. Journal of Hydrology 268, 1–15.
Gutowski, W.J., Decker, S.G., Donavon, R.A., Pan, Z., Arritt, R.W.,Takle, E.S., 2003. Temporal-spatial scales of observed andsimulated precipitation in central US climate. Journal of Climate16, 3841–3847.
Haeberli, W., Frauenfelder, R., Hoelzle, M., Maisch, M., 1999. Onrates and acceleration trends of global glacier mass changes.Geografiska Annaler 81, 585–591.
Hagg, W., Braun, L.N., Kuhn, M., Nesgaard, T.I., 2007. Modelling ofhydrological response to climate change in glacierized CentralAsian catchments. Journal of Hydrology 332, 40–53.
Hay, L.E., Clark, M.P., 2003. Use of statistically and dynamicallydownscaled atmospheric model output for hydrologic simula-tions in three mountainous basins in the western United States.Journal of Hydrology 282, 56–75.
Hay, L.E., Clark, M.P., Wilby, R.L., Gutowski, W.J., Leavesley,G.H., Pan, Z., Arritt, R.W., Takle, E.S., 2002. Use of regionalclimate model output for hydrological simulations. Journal ofHydrometeorology 3, 571–590.
Hewitt, K., Wake, C.P., Young, G.J., David, C., 1989. Hydrologicalinvestigations at Biafo Glacier, Karakoram Himalaya: an impor-tant source of water for the Indus River. Annals of Glaciology 13,103–108.
Hewitt, K., 1993. The altitudinal distribution of Karakoram geo-morphic processes and depositional environments. In: Shroder,Jr., J.F., (Ed.), Himalaya to the Sea: geology, geomorphologyand the Quaternary. NY, Routledge, pp. 159–183.
Hewitt, K., 1998. Glaciers receive a surge of attention in theKarakoram Himalaya. EOS, Transactions. American GeophysicalUnion 79, 104–105.
Hewitt, K., 2005. The Karakoram anomaly? Glacier expansion andthe elevation effect, Karakoram Himalaya. Mountain Researchand Development 25, 332–340.
Hewitt, K., 2007. Tributary glacier surges: an exceptional concen-tration at Panmah Glacier, Karakoram Himalaya. Journal ofGlaciology 53, 181–188.
Jansson, P., Hock, R., Schneider, T., 2003. The concept of glacierstorage: a review. Journal of Hydrology 282, 116–129.
Jones, R.G., Noguer, M., Hassell, D.C., Hudson, D., Wilson, S.S.,Jenkins, G.J., Mitchell, J.F.B., 2004. Generating High ResolutionClimate Change Scenarios Using PRECIS. Met Office HadleyCentre, Exeter, UK, p. 40.
Kay, A.L., Jones, R.G., Reynard, N.S., 2006a. RCM rainfall for UKflood frequency estimation. I. Method and validation. Journal ofhydrology 318, 151–162.
Kay, A.L., Jones, R.G., Reynard, N.S., 2006b. RCM rainfall for UKflood frequency estimation. II. Climate change results. Journalof hydrology 318, 163–172.
Krysanova, V., Bronstert, A., Muller-Wohlfeil, D.I., 1999. Modellingriver discharge for large drainage basins: from lumped todistributed approach. Hydrological Sciences Journal 44, 313–331.
Kumar, R.K., Sahai, A.K., Kumar, K.K., Patwardhan, S.K., Mishra,P.K., Revadekar, J.V., Kamala, K., Pant, G.B., 2006. High-resolution climate change scenarios for India for the 21stcentury. Current Science 90, 334–345.
Leander, R., Buishand, T.A., 2007. Resampling of regional climatemodel output for the simulation of extreme river flows. Journalof Hydrology 332, 487–496.
Liden, R., Harlin, J., 2000. Analysis of conceptual rainfall-runoffmodelling performance in different climates. Journal of Hydrol-ogy 238, 231–247.
Lindstrom, G., Johansson, B., Persson, M., Gardelin, M., Bergstrom,S., 1997. Development and test of the distributed HBV-96 model.Journal of Hydrology 201, 272–288.
Mastny, L., 2000. Melting of Earth’s Ice Cover Reaches New High.World Watch Institute, Washington, DC, <www.Worldwatch.org/alerts/000306.html>.
Mayer, C., Lambrecht, A., Belo, M., Smiraglia, C., Diolaiuti, G.,2006. Glaciological characteristics of the ablation zone ofBaltoro glacier, Karakoram, Pakistan. Annals of Glaciology 43,123–131.
Menzel, L., Burger, G., 2002. Climate change scenarios and runoffresponse in the Mulde catchment (Southern Elbe, Germany).Journal of Hydrology 267, 53–64.
Menzel, L., Thieken, A.H., Schwandt, D., Burger, G., 2006. Impactof climate change on the regional Hydrology-Scenarios-Basedmodelling studies in the German Rhine Catchment. NaturalHazards 38, 45–61.
Middelkoop, H., Daamen, K., Gellens, D., Grabs, W., Kwadijk,J.C.J., Lang, H., Parmet, B.W.A.H., Schadler, B., Schulla, J.,Wilke, K., 2001. Impact of climate change on hydrologicalregimes and water resources management in the Rhine Basin.Climatic Change 49, 105–128.
Milly, P.D.C., Wetherald, R.T., Dunne, K.A., Delworth, T.L., 2002.Increasing risk of great floods in a changing climate. Nature 415,514–517.
Nash, J.E., Sutcliffe, J.V., 1970. River flow forecasting throughconceptual models 1: a discussion of principles. Journal ofHydrology 10, 282–290.
Nakicenovic, N., Alcamo, J., Davis, G., de Vries, B., Fenhann, J.,Gaffin, S., Gregory, K., Grubler, A., Jung, T.Y., Kram, T., LaRovere, E.L., Michaelis, L., Mori, S., Morita, T., Pepper, W.,Pitcher, H., Price, L., Riahi, K., Roehrl, A., Rogner, H-H.,Sankovski, A., Schlesinger, M., Shukla, P., Smith, S., Swart, R.,van Rooijen, R., Victor, N., Dadi, Z., 2000. IPCC Special Reporton Emission Scenarios, Cambridge University Press, Cambridge,United Kingdom and New York, NY, USA.
Oerlemans, J., Anderson, B., Hubbard, A., Huybrechts, Ph.,Johannesson, T., Knap, W.H., Schmeits, M., Stroeven, A.P.,van de Wal, R.S.W., Wallinga, J., Zuo, Z., 1998. Modelling the

The impact of climate change on the water resources of Hindukush–Karakorum–Himalaya region 163
response of glaciers to climate warming. Climate Dynamics 14,267–274.
Paul, F., Maisch, M., Rothenbuhler, C., Hoelzle, M., Haeberli, W.,2007. Calculation and visualisation of future glacier extent in theSwiss Alps by means of hypsographic modelling. Global andPlanetary Change 55, 343–357.
Paul, F., Kaab, A., Maisch, M., Kellenberger, T., Haeberli, W., 2004.Rapid disintegration of Alpine glaciers observed with satellitedata. Geophysical Research Letters 31, L21402. doi:10.1029/2004GL02081.
Pilling, C.G., Jones, J.A.A., 2002. The impact of future climatechange on seasonal discharge, hydrological processes andextreme flows in the upper Wye experimental catchment, mid-Wales. Hydrological Processes 16, 1201–1213.
Rango, A., 1992. Worldwide testing of the snowmelt runoff modelwith applications for predicting the effects of climate change.Nordic Hydrology 23, 155–172.
Reynard, N.S., Prudhomme, C., Crooks, S.M., 2001. The floodcharacteristics of large UK rivers: potential effects of changingclimate and land use. Climatic Change 48, 343–359.
SMHI., 2005. Integrated hydrological modelling system (IHMS),Manual version 5.6, SMHI, Norrkoping.
Snow and Ice Hydrology Project, 1990. Snow and Ice HydrologyProject, Upper Indus Basin, Overall. Report, WAPDA- IDRC-Wilfrid Laurier University, p. 179.
Uhlenbrook, S., Seibert, J., Leibundgut, C., Rodhe, A., 1999.Prediction uncertainty of conceptual rainfall-runoff modelscaused by problems in identifying model parameters andstructure. Hydrological Sciences Journal 44, 779–797.
Wake, C.P., 1989. Glaciochemical investigations as a tool fordetermining the spatial and seasonal variation of snow accumu-lation in the Central Karakorum, Northern Pakistan. Annals ofGlaciology 13, 279–284.
Wang, S., McGrath, R., Semmler, T., Sweeney, C., Nolan, P., 2006.The impact of the climate change on discharge of Suir rivercatchment (Ireland) under different climate scenarios. NaturalHazards and Earth System Sciences 6, 387–395.
Watson, R.T., Zinyowera, M.C., Moss, R.H., 1996. Climate Change1995: Impacts, Adaptations, and Mitigations of climate change.Cambridge University Press, 889 pp.
WGMS, 2002. World Glacier Monitoring Service, Glacier MassBalance Data 2000/01, <www.geo.unizh.ch/wgms/>.
Wilby, R.L., Hay, L.E., Leavesley, G.H., 1999. A comparison ofdownscaled and raw GCM output: implications for climatechange scenarios in the San Juan River Basin, Colorado. Journalof Hydrology 225, 67–91.
Wilson, S., Hassell, D., Hein, D., Jones, R., Taylor, R., 2005.Installing and using the Hadley Centre regional climate model-ling system, PRECIS (version 1.4), Met Office Hadley Centre,Exeter, UK.
Winger, M., Gumpert, M., Yamout, H., 2005. Karakorum–Hinduk-ush–western Himalaya: assessing high-altitude water resources.Hydrological Processes 19, 2329–2338.
Yinlong, X., Xiaoying, H., Yong, Z., Wantao, L., Erda, L., 2006.Statistical Analysis of climate change scenarios over China in the21st century. Advances in Climate Change Research 2, 50–53.