Embed Size (px)
Citation preview

Journal of Financial Economics 69 (2003) 5–50
The great reversals: the politics of financialdevelopment in the twentieth century$
Raghuram G. Rajan*, Luigi Zingales
The University of Chicago Graduate School of Business, 1101 E. 58th St., Chicago, IL 60637, USA
Abstract
The state of development of the financial sector does not change monotonically over time.
In particular, by most measures, countries were more financially developed in 1913 than in
1980 and only recently have they surpassed their 1913 levels. To explain these changes, we
propose an interest group theory of financial development where incumbents oppose financial
development because it breeds competition. The theory predicts that incumbents’ opposition
will be weaker when an economy allows both cross-border trade and capital flows. This theory
can go some way in accounting for the cross-country differences in, and the time-series
variation of, financial development.
r 2003 Elsevier Science B.V. All rights reserved.
JEL classification: G100; G180; G200; G380; O160; P000
Keywords: Financial markets; Growth; Politics; Financial development; Reversals; Trade; Capital flows
$This paper is a development of some ideas in a previous working paper entitled ‘‘The Politics of
Financial Development.’’ We thank the Bradley Foundation, the George J. Stigler Center for the Study of
the Economy and the State, the Center for Research in Securities Prices, the Kauffman Foundation, and
the World Bank for funding support. Rajan also thanks the National Science Foundation and M.I.T. for
research support. Claudio Callegari, Henrik Cronqvist, Shola Fafunso, Isidro Ferrer, Jorg Kukies, Roger
Laeven, Jamers Mello, Galina Ovtcharova, Nahid Rahman, Sofia Ramos, Ruy Ribeiro, Amir Sasson, and
Elfani Wen provided excellent research assistantship and Arnoud Boot, Pratip Kar, Claus Parum, Kristian
Rydqvist, and Elu Von Thadden provided invaluable help. We benefited from comments by Lucian
Bebchuk, Stijn Claessens, Peter Hogfeldt, Louis Kaplow, Colin Mayer, Mark Ramseyer, Eric Rasmussen,
Mark Roe, Andrei Shleifer, Richard Sylla, and an anonymous referee.
*Corresponding author. Tel.: +1-773-702-4437; fax: +1-773-834-8172.
E-mail address: [email protected] (R.G. Rajan).
0304-405X/03/$ - see front matter r 2003 Elsevier Science B.V. All rights reserved.
doi:10.1016/S0304-405X(03)00125-9

1. Introduction
There is a growing body of evidence indicating that the development of a country’sfinancial sector greatly facilitates its economic growth (e.g., Demirguc-Kunt andMaksimovic, 1998; King and Levine, 1993; Jayaratne and Strahan, 1996; Rajan andZingales, 1998a). Why then do so many countries still have underdeveloped financialsectors?The simple answer, and one favored by many economists, is the absence of
demand. Certainly demand is a prime driver of financial development, but it cannotbe the only explanation. Demand (as proxied for by level of industrialization oreconomic development) cannot explain why countries at similar levels of economicdevelopment differ so much in the level of their financial development. For instance,why was France’s stock market much bigger as a fraction of its gross domesticproduct (GDP) than markets in the United States in 1913, even though the per capitaGDP in the United States was not any lower than France’s? It is hard to imagine thatthe demand for financing in the United States at that time was inadequate. At thetime, the demand for more, and cheaper, credit was a recurrent theme in politicaldebates in the United States, and it was among the most industrialized countries inthe world even then.An alternative explanation is that there are structural impediments to supply rising
to meet demand. Perhaps a country does not have the necessary levels of socialcapital (Guiso et al., 2000) or ‘‘savoir faire’’ to create a viable financial sector (e.g.,Bencivenga and Smith, 1991; Greenwood and Jovanovic, 1990). Or perhaps it hasnot inherited the right legal, cultural, or political system. In particular, the seminalwork of La Porta et al. (1997, 1998) shows that countries with a Common Law originseem to have better minority investor protection, and furthermore, these countrieshave more highly developed equity markets. There has been some debate as to theprecise channel through which a country’s institutional inheritance affects itsfinancial development (e.g., Berglof and Von Thadden, 1999; Coffee, 2000; Holmenand Hogfeldt, 2000; La Porta, et al., 1999a, 1999b; Rajan and Zingales, 1999; Stulzand Williamson, 2001). Some question whether the influence of certain forms of CivilLaw heritage can be distinguished from the influence of a Common Law heritage(e.g., Beck et al., 1999). Yet, there is a burgeoning literature suggesting that acountry’s ‘‘structure’’ matters.There are other implications, however, of structural theories of financial
development. For instance, once a country has overcome the structural impediments,the supply of finance should rise to meet demand. In other words, we should not seemeasures of financial development waxing and waning independent of demand.Similarly, conditional on demand, the relative position of different countries shouldnot change dramatically over time. If some countries have a system that is pre-disposed towards finance, that pre-disposition should continue to be relatively strongsince structural factors are relatively time-invariant.To test these implications, we collect various indicators of financial development
for developed countries over the twentieth century. By most measures, countrieswere more financially developed in 1913 than in 1980 and only recently have they
R.G. Rajan, L. Zingales / Journal of Financial Economics 69 (2003) 5–506

surpassed their 1913 levels. Furthermore, even after controlling for the differentlevels of industrialization, the pattern across countries is quite different from the1990s. In 1913, France’s stock market capitalization (as a fraction of GDP) wasalmost twice that of the United States (0.78 vs. 0.39) even though the French CivilCode has never been friendly to investors (La Porta et al., 1998). By 1980, roles hadreversed dramatically. France’s capitalization was now barely one-fourth thecapitalization in the United States (0.09 vs. 0.46). And in 1999, the two countriesseem to be converging (1.17 vs. 1.52). More generally, in 1913, the main countries ofcontinental Europe were more developed financially than the United States. What isespecially interesting is that indicators of financial development fell in all countriesafter 1929, reaching their nadir around 1980. Since then, there has been a revival offinancial markets.In fact, in contrast to the findings of La Porta et al. (1997) for the 1990s, we find
that countries with Common Law systems were not more financially developed in1913. There is some indication that these differences had to do with differences infinancial infrastructure. Tilly (1992) indicates that corporate share issues in Germanyin the beginning of the Twentieth Century were greater than in England. He suggeststhis is because of the ‘‘paucity of information and relatively weak financial controlson the operations of company founders and insiders’’ (p. 103) in England. Thecommon wisdom today is the reverse, that German corporations are much lesstransparent than corporations in the United Kingdom, as reflected by their lowerscores on accounting standards.The disruption in demand caused by the Great Depression and World War II are
not sufficient to explain the reversal in financial markets. The economies of thehardest-hit countries recovered within a decade or two. Why did it take financialmarkets until the late 1980s to stage a recovery? Moreover, such a delay was not seenafter the World War I.All this is not to suggest that structural theories are incorrect, but that they are
incomplete. A theory with a more variable factor is needed to explain both the time-series variation in financial development as well as the cross-sectional differences. Inour view, the strength of political forces in favor of financial development is a majorvariable factor. The challenge for such a theory is to identify who is opposed tosomething as economically beneficial as financial development. We believe thatincumbents, in the financial sector and in industry, can be hostile to arm’s lengthmarkets. This is because arm’s length financial markets do not respect the value ofincumbency and instead can give birth to competition. There are occasions, however,when the incentives, or the ability, of incumbents to oppose development is muted.In particular, we argue that when a country’s borders are open to both trade andcapital flows, we see the opposition to financial development will be most muted anddevelopment will flourish.Of course, the decision to open to trade and capital flows is also partly political.
This raises two questions. First, why do some countries become more open thanothers, or open up at some times rather than at others—do the incumbents notoppose opening up? And second, how can we provide evidence of a causal link ratherthan simply a correlation: How can we argue that the link between openness and
R.G. Rajan, L. Zingales / Journal of Financial Economics 69 (2003) 5–50 7

financial development should be interpreted as one causing the other rather thansimply as evidence that incumbents who favor openness also favor financialdevelopment?Let us answer the first question first. Some countries have no choice. Because they
are small, or because they are close to other countries, they are likely to have moretrade. Therefore, these countries are likely open for reasons that are not political.Also, even if the decision is political, countries’ decisions whether to open up arelikely strategic complements. If important parts of the world are open, then naturalleakages across borders (the gray trade, smuggling, under-invoicing, over-invoicing,etc.) are likely to be high and make it hard for a country to remain closed. Moreover,groups that are in favor of openness (for example, exporters) are likely to gain inprospective profitability and strength relative to those who rely on controls, and theyare likely to have more success in pressing for openness (e.g., Becker, 1983). Theeconomic importance of other countries that are open can be thought of as largelyexogenous to a country’s domestic politics.These observations suggest ways to test whether openness has a causal effect.
First, in examining the link between trade openness and financial development, weinstrument trade openness with a measure of natural openness (largely based on acountry’s distance from its trading partners) developed by Frankel and Romer(1999). We thus focus on the exogenous component of a country’s trade. Becausedistance matters less for capital, we do not have a similar instrument for cross-bordercapital flows. But precisely because capital is more mobile, the strategiccomplementarities in cross-border capital flows are likely to be stronger. So wecan use world-wide cross-border capital flows over time as an exogenous measure ofwhether countries are more open to capital flows. International capital mobility ishigh both in the beginning and towards the end of the twentieth century for mostcountries. Thus, we test in the cross-section of countries if financial development ispositively correlated with the exogenous component of a country’s openness to trade(correcting for the demand for finance), both in the beginning of the century andtowards the end of the century, and it is.By contrast, in the intermediate periods (from the 1930s to the 1970s) when cross-
border capital flows had dwindled to a trickle for a variety of reasons, we find thattrade openness did not have as strong a positive correlation (if at all) with financialdevelopment. These findings suggest that it takes the combination of openness inproduct and financial markets to mute incumbent incentives to oppose financialdevelopment. They also suggest a rationale for why indicators of financialdevelopment fell between the 1930s and the 1970s. Cross-border flows, especiallyof capital, were relatively small, so incumbents could oppose financial developmentwithout constraints.We are, of course, not the first to point to the influence of private interests on
financial development, though our focus is quite different from previous work.Jensen (1991) argues that legislation motivated by potential targets crimped themarket for corporate control even while it was having salutary effects on USindustry. Kroszner and Strahan (1999) explain the timing of financial liberalizationacross states in the United States in the 1970s and 1980s with variables that relate to
R.G. Rajan, L. Zingales / Journal of Financial Economics 69 (2003) 5–508

the power of private interest groups. Morck et al. (2000) find that the share prices ofheir-controlled Canadian firms fell on news that the Canada–US free-tradeagreement would be ratified. One reason they suggest is that the treaty had aprovision for greater capital market openness, which would reduce the advantageheir-controlled firms had from access to capital. Bebchuk and Roe (1999) argue thatcorporate governance regimes will be strongly influenced by the initial positions ofowners. Our paper is related to all these in that we also emphasize the role of privateinterests in retarding financial development, but we differ in that we attempt to findgeneral patterns across countries.We will postpone a discussion of the other related literature until we present the
theoretical reasoning and tests. The rest of the paper is as follows. Section 2 describeshow we collect the data and presents measures of financial-sector development indifferent countries at various points in the twentieth century. Section 3 presents ourinterest group theory of why some countries develop their financial systems (andothers not) and argues why this could explain the reversals in the data. Section 4 testsboth the time-series and cross-sectional implications of this theory. Section 5concludes.
2. Evolution of financial development over the twentieth century
We are faced with two problems in analyzing the historical evolution of financialdevelopment over the twentieth century. First, it is difficult to obtain reliable sourcesfor historical information about financial markets. In Appendix A, we describe howwe deal with this problem. The second problem is how to measure financialdevelopment.
2.1. What do we mean by financial development?
The right measure would capture the ease with which any entrepreneur orcompany with a sound project can obtain finance, and the confidence with whichinvestors anticipate an adequate return. Presumably, also, a developed financialsector can gauge, subdivide, and spread difficult risks, letting them rest where theycan best be borne. Finally, it should do all this at low cost.In our view, the most important word in the above definition is ‘‘any.’’ In a perfect
financial system, it will be the quality of the underlying assets or ideas that willdetermine whether finance is forthcoming, and the identity of the owner (to theextent it is orthogonal to the owner’s capability of carrying out the project) will beirrelevant. Because our focus is on how easy it is to raise finance without priorconnections or wealth, our measures of financial development will emphasize theavailability of arm’s length market finance (and if the data were available, theavailability of non-relationship-based bank finance).This choice is not innocuous. In some financial systems, capital is easily available
for anyone within a circle of firms and financiers, but it does not percolate outside(e.g., Hellwig, 2000; Rajan and Zingales, 1998b). Most investment opportunities
R.G. Rajan, L. Zingales / Journal of Financial Economics 69 (2003) 5–50 9

originate within this closed group, and this group can undertake more daringinvestment than would be possible in an economy with more widespread access. Wewould not deem this economy to be financially developed. In a sense, we adopt theSchumpeterian view that a critical role of finance is creative destruction, and this ispossible only if there is a constant flow of capital into new firms and out of old firms.Our definition of development then suggests different ratios of the size of arm’s
length markets to the size of the economy as our measures of financial development.For example, measures include ratios such as equity market capitalization to GDP,volume of equity issues to gross fixed-capital formation, or number of listed firms topopulation in millions. While they are no doubt crude proxies, these ratios broadlycapture a country’s level of financial sophistication and they are standard in theliterature. For the sake of comparison, we will also report a measure of thedevelopment of the banking sector.
2.2. Various measures of financial development
Let us now describe the various indicators of financial development we use.
2.2.1. Banking sector
We use the ratio of deposits (commercial banks plus savings banks) to GDP as ameasure of the development of the banking sector. One shortcoming is that thismeasure captures only the liability side of banks, ignoring differences in thecomposition of the banks’ assets. Another shortcoming is that this measure cannotindicate if banks operate as a cartel, forming a closed shop to new industrialentrants. Despite this shortcoming, the measure has the virtue that it is available fora long time-series and for a large cross-section of countries. In more recent periods,we have domestic credit from the private sector to GDP, which will be our measureof banking-sector development.
2.2.2. Equity issues
One measure of the importance of equity markets is the fraction of investmentsthat are funded through equity issues. The proxy we use is the ratio of equity issuesby domestic corporations to gross fixed capital formation (GFCF) during the year.Ideally, we would have liked to normalize corporate equity issues by the amount ofcorporate investments, but this datum is not consistently available. In interpretingthe results, therefore, it is important to realize that our measure will tend tounderestimate the level of financial development of countries where agriculture(which does not enter in corporate investments but does enter in total investments) ismore significant. It will also tend to underestimate the level of financial developmentin the earlier part of the century, when corporate investments were a smaller fractionof total investments.Another drawback of this measure stems from the well-known cyclicality of equity
issues. A disproportionate amount of equity issues are concentrated during boomyears (Choe et al., 1993). This can bias cross-country comparisons to the extent stockmarket booms are not contemporaneous across economies. It also biases the
R.G. Rajan, L. Zingales / Journal of Financial Economics 69 (2003) 5–5010

time-series comparisons if one of the reference years is a boom year. To minimize theproblem, we average issues over a number of years when we have easy access toannual data.
2.2.3. Capitalization
A more stable measure of the importance of the equity market is the total stockmarket capitalization. A drawback is this measure captures the amount of equitylisted, not the amount of equity raised. Thus, the presence of few companies thathave greatly appreciated in value can give the impression of an important equitymarket even when the amount of funds raised in the market is tiny. On the positiveside, however, this measure is less cyclical than the previous one and thus is better formaking comparisons across countries and across time periods.In measuring both equity issues and stock market capitalization we restrict
ourselves whenever possible to domestic companies. At the beginning of thetwentieth century, London and Paris attracted foreign listings. More recently, NewYork attracts many foreign listings. We are especially interested, however, in how acountry’s financial and legal institutions help domestic industries raise funds, and assome have argued (e.g., Kennedy, 1989), the financial sector’s ability to fundforeigners may not imply an ability to fund domestic firms. Moreover, our focusreduces the possibility of mechanical correlations in our tests. This is why we limitourselves to domestic companies.
2.2.4. Number of companies listed
A final indicator of the importance of equity markets is the number of publiclytraded domestic companies per million of population. This is a measure that is nottainted by fluctuations in stock market valuations and possible mismeasurement ofthe level of GDP. This also suggests a drawback. It could be too slow-moving ameasure to fully capture high frequency changes in the environment. Also, themeasure will be affected by the process of consolidation as well as by thefragmentation of the industrial structure. Countries with a more concentratedindustrial structure will have fewer, but larger, companies and thus might score lowaccording to this measure. Since concentration will reflect, only in part, limitedaccess to finance, this measure will be a noisy proxy for what we want to capture.One indicator that is missing from our list is the volume of securities traded.
Unfortunately, the way volume is recorded (even today) is quite controversial. TheFederation Internationale Bourses Valeurs (FIBV) classifies data on volume tradedinto two groups: trading system view (TSV) and regulated environment view (REV).The TSV system counts as volume only those transactions which pass through theexchange’s trading floor, or which take place on the exchange’s trading floor. TheREV system includes in volume all the transactions subject to supervision by themarket authority, with no distinction between on- and off-market transactions. Asthe FIBV warns, comparisons are not valid between stock exchanges belonging todifferent groups, because the numbers differ substantially depending on methodused. For example, in Paris, according to the TSV method the volume of equitytraded in 1999 was $770,076 million, while the REV method suggests a volume four
R.G. Rajan, L. Zingales / Journal of Financial Economics 69 (2003) 5–50 11

times greater ($2,892,301 million). Given the magnitude of the difference and theimpossibility of obtaining consistent data both across countries and over time, wechose to disregard this indicator.In sum, any indicator has its own drawbacks. This is the reason why they should
be looked at together to get a better sense of the development of a country’s financialstructure.
2.3. Stylized facts
In Table 1, we report the average value of our four indicators of financialdevelopment for the period 1913–1999. The countries in our sample are those forwhich we could get pre-World War II financial market data. Since the availability ofdata on financial development has exploded recently, we include all the countrieswhose data we can get in our tests for the most recent years. For every indicator wereport both the average across all available observations and the average for thecountries with observations throughout the sample period. In Tables 2–5 we reportthe value of each indicator for each country. An examination of these tables suggeststhe following facts.
2.3.1. Financial systems were highly developed in 1913
Regardless of the way we measure, the average level of financial development in1913 is quite high, comparable to that in 1980 or 1990. The average ratio of depositsto GDP in 1913 is very similar to that in 1980 (see Table 1). The absence of anupward trend reflects the fact that countries depend less on banks and more onfinancial markets as they develop economically. But the data on the capitalization ofthe stock market (Tables 1 and 3) suggest that in most countries equity markets werebigger relative to GDP in 1913 than in 1980. Only by the end of the 1990s do theyseem to exceed their 1913 level.Equity issues also an important source of funds for corporate investments than
1980 (and even 1990) for most countries whose data we have (see Tables 1 and 4).This is particularly noteworthy when we recognize that the 1913 figures are biaseddownwards relative to the 1990 ones, because we normalize by Gross Fixed CapitalFormation, and corporate investments represent a much smaller proportion ofGFCF in 1913 than in 1990.Most countries have the same number of listed companies per million people in
1913 as in 1980 (see Tables 1 and 5). In some countries, even with the explosion offinancial markets during the late 1990s, the 1913 level has not been surpassed.While, in general, the richest countries had highly developed financial sectors in
1913, the degree of development does vary widely. The level of economicdevelopment explains only 14% of the cross-country variation in the deposit-to-GDP ratio and it is not even statistically significant in explaining the level of equitymarket capitalization. For example, in 1913 Argentina shows about the same percapita GDP as Germany and France, but its level of deposits is only about two-thirds that of France and Germany. Similarly, our data show that in 1913
R.G. Rajan, L. Zingales / Journal of Financial Economics 69 (2003) 5–5012

Table1
Evolutionofthedifferentindicatorsoffinancialdevelopment
Wholesampleindicatesanaverageacrossallthecountrieswehavedata
for.Constantsampleindicatesanaverageacrosscountriesforwhichwehavedata
everyyear.Depositsto
GDPistheratioofcommercialandsavingsbankdepositsto
GDP.Stock
marketcapto
GDPistheratiooftheaggregatemarketvalue
ofequityofdomesticcompaniesdivided
byGDP.Numberofcompaniesto
populationistheratioofnumberofdomesticcompanieswhoseequityispublicly
traded
inadomesticstock
exchangeto
thecountry’spopulationinmillions.Equityissuesto
GFCFistheratiooffundsraised
throughpublicequityofferings
(both
initialpublicofferingsandseasoned
equityissues)bydomesticcompaniesto
grossfixed
capitalform
ation.Nisthenumberofobservations.Sourcesare
intheData
Appendix,whichisavailableonrequestfrom
theauthors.
Depositsto
GDP
Stock
marketcapto
GDP
No.ofcompaniesto
population
Equityissues
toGFCF
Year
Whole
NConstant
sample
(N=20)
Whole
NConstant
sample
Whole
NConstant
sample
Whole
NConstant
sample
(N=7)
1913
0.38
22
0.40
0.57
22
0.40
28.68
22
24.00
0.12
12
0.13
1929
0.49
21
0.51
0.60
11
0.53
33.80
14
27.75
0.35
15
0.34
1938
0.45
21
0.46
0.58
13
0.57
30.12
13
27.69
0.13
12
0.10
1950
0.33
22
0.34
0.30
14
0.27
38.63
16
23.80
0.06
11
0.03
1960
0.31
22
0.33
0.47
18
0.44
31.85
19
22.38
0.07
16
0.05
1970
0.31
22
0.33
0.49
19
0.42
23.66
19
21.22
0.06
16
0.02
1980
0.34
22
0.35
0.26
22
0.25
26.70
21
23.71
0.03
18
0.03
1990
0.41
21
0.40
0.57
21
0.51
22.18
22
23.21
0.05
20
0.05
1999
0.46
21
0.45
1.02
23
1.08
26.30
22
24.46
0.13
20
0.18
R.G. Rajan, L. Zingales / Journal of Financial Economics 69 (2003) 5–50 13

Argentina’s per capita GDP was three times as big as Japan’s, but the relative size ofits equity market was only one-third of Japan’s.
2.3.2. Countries most advanced in 1913 do not necessarily stay advanced
By our measures, countries that were financially developed in 1913 do notnecessarily continue to be so. In 1913, equity issues appear more important inFrance, Belgium, and Russia than in the United States. Thus, by this measure, somecontinental European markets seem at least as developed as the US market at thattime. The data on market capitalization in Table 3 confirm this impression. Whilethe UK had a high capitalization in 1913, Belgium, France, Germany, and Swedenwere all ahead of the United States. Recent studies highlight the distinction betweenCivil Law continental European economies and Common Law Anglo-Americaneconomies, but the early data do not confirm this. In fact, this distinction seems to bea post-World War II phenomenon implying financial markets in Civil Law countries
Table 2
Evolution of the ratio of deposits to GDP
Deposits to GDP is the ratio of commercial and savings deposits divided by GDP. Until 1990 the source is
Mitchell (1995). We extrapolate the 1999 data from the 1994 data in Mitchell using the rate of growth of
deposits as reported in International Financial Statistics published by the International Monetary Fund.
Year
Country 1913 1929 1938 1950 1960 1970 1980 1990 1999
Argentina 0.29 0.36 0.36 0.30 0.22 0.19 0.28 0.07 0.24
Australia 0.37 0.45 0.45 0.69 0.43 0.38 0.29 0.42 0.49
Austria 1.12 0.37 0.33 0.21 0.28 0.31 0.62 0.73 0.70
Belgium 0.68 0.48 0.69 0.44 0.35 0.40 0.39 0.38 0.85
Brazil 0.12 0.16 0.21 0.20 0.15 0.12 0.17
Canada 0.22 0.13 0.16 0.17 0.13 0.37 0.47 0.49 0.61
Chile 0.16 0.15 0.09 0.10 0.06 0.07 0.07 0.12 0.19
Cuba
Denmark 0.76 0.46 0.39 0.32 0.27 0.25 0.28 0.55 0.54
Egypt 0.17 0.17 0.14 0.31 0.67 0.51
France 0.42 0.44 0.36 0.24 0.30 0.33 0.45 0.42 0.47
Germany 0.53 0.27 0.25 0.15 0.23 0.29 0.30 0.32 0.35
India 0.04 0.09 0.12 0.08 0.08 0.09 0.08 0.09 0.09
Italy 0.23 0.21 0.31 0.23 0.81 0.54 0.59 0.40 0.28
Japan 0.13 0.22 0.52 0.14 0.21 0.33 0.48 0.51 0.53
Netherlands 0.22 0.32 0.52 0.28 0.28 0.26 0.25 0.73 0.69
Norway 0.65 0.89 0.56 0.52 0.43 0.49 0.30 0.50 0.49
Russia 0.21
South Africa 0.09 0.09 0.16 0.18 0.18 0.16 0.12 0.16 0.21
Spain 0.07 0.24 0.24 0.33 0.37 0.53 0.44 0.66 0.71
Sweden 0.69 0.69 0.73 0.59 0.54 0.50 0.48 0.40 0.39
Switzerland 0.93 1.08 1.13 0.79 0.78 0.69 0.69 0.54 0.66
UK 0.10 2.88 1.34 0.67 0.32 0.22 0.14 0.33 0.39
US 0.33 0.33 0.44 0.40 0.30 0.25 0.18 0.19 0.17
R.G. Rajan, L. Zingales / Journal of Financial Economics 69 (2003) 5–5014

appear to have declined more between 1913 and the early 1990s (though the gap hasnarrowed since).Another way of seeing the change in patterns is to compute the correlation
between indicators of financial development at different points in time. Using theSpearman rank correlation test, we find a correlation of 0.4 between capitalization toGDP in 1913 and capitalization to GDP in 1999. We reject the hypothesis that thetwo distributions across countries are independent at the 10% level (21 observa-tions). The cross-country pattern of financial development in 1999 is positivelycorrelated with that in 1913. However, this is not true a decade earlier. Thecorrelation of the 1913 data with 1990 and 1980 data is lower (0.21 in 1990, �0.07 in1980), and we cannot reject the hypothesis that the distributions are independent.By way of comparison, consider the cross-country correlation of per-capita GDP
measured at two different points in time. Using the Spearman rank correlation test,we find a correlation of 0.55 between per-capita GDP in 1913 and per-capita GDP in1999 (independence rejected at the 1% level with 22 observations). The correlation ofthe 1913 data with 1990 and 1980 data is equally high (0.62 for 1990, 0.73 for 1980).
Table 3
Evolution of stock market capitalization over GDP
Stock market capitalization to GDP is the ratio of the aggregate market value of equity of domestic
companies to GDP. Sources are in the Data Appendix, which is available on request from the authors.
Year
Country 1913 1929 1938 1950 1960 1970 1980 1990 1999
Argentina 0.17 0.05 0.03 0.11 0.15
Australia 0.39 0.50 0.91 0.75 0.94 0.76 0.38 0.37 1.13
Austria 0.76 0.09 0.03 0.17 0.17
Belgium 0.99 1.31 0.32 0.23 0.09 0.31 0.82
Brazil 0.25 0.05 0.08 0.45
Canada 0.74 1.00 0.57 1.59 1.75 0.46 1.22 1.22
Chile 0.17 0.12 0.00 0.34 0.50 1.05
Cuba 2.19
Denmark 0.36 0.17 0.25 0.10 0.14 0.17 0.09 0.67 0.67
Egypt 1.09 0.16 0.01 0.06 0.29
France 0.78 0.19 0.08 0.28 0.16 0.09 0.24 1.17
Germany 0.44 0.35 0.18 0.15 0.35 0.16 0.09 0.20 0.67
India 0.02 0.07 0.07 0.07 0.07 0.06 0.05 0.16 0.46
Italy 0.17 0.23 0.26 0.07 0.42 0.14 0.07 0.13 0.68
Japan 0.49 1.20 1.81 0.05 0.36 0.23 0.33 1.64 0.95
Netherlands 0.56 0.74 0.25 0.67 0.42 0.19 0.50 2.03
Norway 0.16 0.22 0.18 0.21 0.26 0.23 0.54 0.23 0.70
Russia 0.18 0.11
South Africa 0.68 0.91 1.97 1.23 1.33 1.20
Spain 0.17 0.41 0.69
Sweden 0.47 0.41 0.30 0.18 0.24 0.14 0.11 0.39 1.77
Switzerland 0.58 0.50 0.44 1.93 3.23
UK 1.09 1.38 1.14 0.77 1.06 1.63 0.38 0.81 2.25
US 0.39 0.75 0.56 0.33 0.61 0.66 0.46 0.54 1.52
R.G. Rajan, L. Zingales / Journal of Financial Economics 69 (2003) 5–50 15

Thus over long periods, the relative ranking of countries according to financialdevelopment seems more volatile than ranking according to economic development.
2.3.3. Indicators of financial development fall then rise between 1913 and 1999
The most striking fact that emerges from Table 1 is that indicators of financialdevelopment fall considerably and then rise again. It is not easy to define preciselywhere the indicators start falling, but the data suggest that the turning point issomewhere in the 1930s or 1940s.It is worth noting that the decline in indicators is not limited to the countries that
lost the war, although it is more pronounced for such countries. It is not even seenonly in countries involved in the war, since we see it in Sweden, Argentina, andBrazil. Finally, it cannot be attributed to a decline in the standard of living, sinceduring the period (from 1938 to 1950) the average per-capita GDP in 1990 dollarsincreased from $4,036 to $4,644.
Table 4
Evolution of fraction of gross fixed-capital formation raised via equity
Amount of funds raised through public equity offerings (both initial public offerings and seasoned equity
issues) by domestic companies divided by gross fixed capital formation. Sources are in the Data Appendix,
which is available on request from the authors.
Year
Country 1913 1929 1938 1950 1960 1970 1980 1990 1999
Argentina 0.01 0.01 0.10 0.02
Australia 0.13 0.19 0.09 0.05 0.05 0.09 0.24
Austria 0.07 0.04 0.07 0.00 0.07 0.03
Belgium 0.23 0.85 0.03 0.09 0.08 0.03 0.01 0.06
Brazil 0.20 0.19 0.19 0.06 0.01 0.07
Canada 1.34 0.02 0.03 0.03 0.01 0.04 0.01 0.07
Chile
Cuba
Denmark 0.03 0.01 0.01 0.08 0.09
Egypt 0.31
France 0.14 0.26 0.03 0.02 0.04 0.04 0.06 0.02 0.09
Germany 0.07 0.17 0.06 0.00 0.04 0.02 0.01 0.04 0.06
India 0.00 0.00 0.00 0.08
Italy 0.07 0.26 0.03 0.02 0.08 0.02 0.04 0.04 0.12
Japan 0.08 0.13 0.75 0.15 0.03 0.01 0.02 0.08
Netherlands 0.38 0.61 0.45 0.02 0.02 0.00 0.01 0.10 0.67
Norway 0.05 0.01 0.04 0.06
Russia 0.17
South Africa 0.33 0.08 0.10 0.14
Spain 0.01 0.33 0.08 0.11 0.07 0.03 0.06 0.10
Sweden 0.08 0.34 0.06 0.01 0.03 0.00 0.00 0.03 0.10
Switzerland 0.03 0.02 0.02
UK 0.14 0.35 0.09 0.08 0.09 0.01 0.04 0.06 0.09
US 0.04 0.38 0.01 0.04 0.02 0.07 0.04 0.04 0.12
R.G. Rajan, L. Zingales / Journal of Financial Economics 69 (2003) 5–5016

While we cannot also date the recovery in indicators precisely, the turning pointlies somewhere in the 1970s or 1980s. Over the 1980s and 1990s, for the countriesreporting throughout, the average ratio of deposits to GDP increased by 35%, theaverage ratio of stock market capitalization to GDP increased four times, as did thefraction of GFCF raised via equity. The number of listed domestic companies showsa more modest increase (30%).
3. An interest group theory of financial development
We now describe a parsimonious theory to explain broad patterns in the data. Inessence, our theory suggests why financial development can differ so much betweencountries at similar levels of economic and industrial development. It also suggests areason for reversals. No doubt, the specifics of each country will differ and thetheory, on occasion, can seem a caricature, but this is the price we have to pay forparsimony.
Table 5
Evolution of number of listed companies per million people
The number of listed companies per million people is the number of domestic companies whose equity is
publicly traded in a domestic stock exchange divided by the population in millions. Sources are in the Data
Appendix, which is available on request from the authors.
Year
Country 1913 1929 1938 1950 1960 1970 1980 1990 1999
Argentina 15.29 26.78 15.58 9.85 5.54 3.63
Australia 61.74 76.92 84.88 122.05 93.72 68.53 63.89 64.91
Austria 38.72 42.62 30.06 16.29 13.34 12.05 8.74 12.57 12.02
Belgium 108.7 55.09 42.60 38.39 22.85 18.50 14.33
Brazil 12.43 9.85 5.17 41.02 4.32 4.06 3.86 3.18
Canada 14.65 66.61 62.43 55.20 50.52 42.99 130.13
Chile 20.62 44.52 38.72 23.78 16.32 19.03
Cuba 12.69
Denmark 38.22 54.86 85.25 81.28 75.75 52.14 42.54 50.18 44.80
Egypt 16.58 13.44 10.58 1.76 11.01 13.71
France 13.29 24.64 26.20 18.34 15.98 13.99 15.05
Germany 27.96 19.73 10.91 13.22 11.33 9.07 7.46 6.53 12.74
India 0.82 1.81 2.59 3.13 0.00 0.00 3.11 7.31 6.48
Italy 6.32 6.40 3.11 2.70 2.79 2.46 2.36 3.82 4.54
Japan 7.53 16.65 19.48 9.15 8.35 15.19 14.80 16.76 20.00
Netherlands 65.87 95.48 21.42 15.95 15.12 17.39 15.14
Norway 33.51 41.50 45.98 37.98 37.10 37.90 44.53 44.80 49.62
Russia 2.02 0.81
South Africa 69.05 60.93 51.39 42.48 20.75 15.86
Spain 25.20 10.96 22.25
Sweden 20.64 16.36 14.93 12.83 14.04 13.18 12.39 14.14 31.46
Switzerland 61.53 67.80 55.46 52.47 51.74 58.72 78.03 49.61 34.01
UK 47.06 47.22 29.63 31.11
US 4.75 9.72 9.16 8.94 9.33 11.48 23.11 26.41 28.88
R.G. Rajan, L. Zingales / Journal of Financial Economics 69 (2003) 5–50 17

3.1. The necessity for government intervention
The essential ingredients of a developed financial system include the following:(1) respect for property rights, (2) an accounting and disclosure system thatpromotes transparency, (3) a legal system that enforces arm’s length contractscheaply, and (4) a regulatory infrastructure that protects consumers, promotescompetition, and controls egregious risk-taking.No doubt, private arrangements could go some way in achieving all this. But the
government has the ability to coordinate standards and enforce non-monetarypunishments such as jail terms. Such power gives it some advantage in laying out andpolicing the ducts in which financial plumbing will go. For instance, a number ofstudies suggest that the mandatory disclosures required by the Securities Act of 1933did improve the accuracy of pricing of securities (e.g., Simon, 1989). Given thatgovernment action is needed for financial development, the focus of our inquiry thenshifts to when there is a political will to undertake these actions.
3.2. The political economy of financial development
Financial development is so beneficial that it seems strange that anyone wouldoppose it. However, financial development is not always win-win. It could pose athreat to some.Consider, for instance, established large industrial firms in an economy, a group
we will call industrial incumbents. In normal times, these incumbents do not requirea developed financial system. They can finance new projects out of earnings (as mostestablished firms do) without accessing external capital markets. Even when theirbusiness does not generate sufficient cash to fund desired investments, they can usethe collateral from existing projects and their prior reputation to borrow. Suchborrowing does not require much sophistication from the financial system. Even aprimitive system will provide funds willingly against collateral. Because of theirprivileged access to finance in underdeveloped financial systems, incumbents enjoy apositional rent. Anybody else who starts a promising business has to sell it to theincumbents or get them to fund it. Thus, not only do incumbents enjoy some rents inthe markets they operate in, but they also end up appropriating most of the returnsfrom new ventures.These rents will be impaired by financial development. Better disclosure rules and
enforcement in a developed financial market will reduce the relative importance ofincumbents’ collateral and reputation, while permitting newcomers to enter andcompete away profits.Similar arguments apply to incumbent financiers. While financial development
provides them with an opportunity to expand their activities, it also strikes at theirvery source of comparative advantage. In the absence of good disclosure and properenforcement, financing is typically relationship-based. The financier uses connectionsto obtain information to monitor loans, and uses various informal levers of power tocajole repayment. The key, therefore, to the ability to lend is relationships with thosewho have influence over the firm (managers, other lenders, suppliers, politicians, etc.)
R.G. Rajan, L. Zingales / Journal of Financial Economics 69 (2003) 5–5018

and the ability to monopolize the provision of finance to a client (either through amonopoly over firm-specific information, or through a friendly cartel amongstfinanciers). Disclosure and impartial enforcement tend to level the playing field andreduce barriers to an entrance into the financial sector. The incumbent financier’s oldskills become redundant, while new ones of credit evaluation and risk managementbecome necessary. Financial development not only introduces competition, whichdestroys the financial institution’s rents and relationships (e.g., Petersen and Rajan,1995), it also destroys the financier’s human capital.1
In sum, a more efficient financial system facilitates entry, and thus leads to lowerprofits for incumbent firms and financial institutions. From the perspective ofincumbents, the competition-enhancing effects of financial development can offsetthe other undoubted benefits that financial development brings. Moreover, marketstend to be democratic, and they particularly jeopardize ways of doing business thatrely on unequal access. Thus, not only are incumbents likely to benefit less fromfinancial development, they can actually lose. This would imply that as a collective,incumbents have a vested interest in preventing financial development. They mayalso be small enough (e.g., Olson, 1965; Stigler, 1971) to organize successfully againstfinancial development. In doing so, they will rely on other incumbent groups (such asorganized labor). Previous studies show such groups benefit from an economy withlimited competition. For example, Salinger (1984) and Rose (1987) provide evidencethat unions share in rents from industrial concentration.Critical to the above arguments is that financial development aids the entrance of
new firms, thus enhancing competition. There is some evidence for this. In acomparative study of the textile industry in Mexico and Brazil around the beginningof the twentieth century, Haber (1997) shows that Brazil, following its politicalrevolution, liberalized finance, and saw the textile industry grow faster and becomeless concentrated than the Mexican textile industry. Porfirio Diaz, the Mexicandictator during this period, was much more a prisoner of incumbent interests.Mexico’s financial markets remained underdeveloped during his regime, with theconsequence that Mexico’s textile industry, while starting out larger and relativelymore competitive, had less opportunities for entry, and ended up smaller and moreconcentrated than Brazil’s.Studies of larger samples of countries support the idea that financial development
facilitates the entry of newcomers. Rajan and Zingales (1998a) find that the growthin the number of new establishments is significantly higher in industries dependenton external finance when the economy is financially developed. In a study of tradecredit in transitional economies, Johnson et al. (2000) find that an importantconsequence of an effective legal system is that a firm offers more trade credit to newtrading partners. Firms that believe in the effectiveness of the legal system are alsomore likely to seek out new trading partners.
1One could also argue for the existence of political incumbents. The relationship between financial
development and political incumbency is less clear-cut.
R.G. Rajan, L. Zingales / Journal of Financial Economics 69 (2003) 5–50 19
3.3. Financial repression is not the only way to protect incumbent rents
Financial underdevelopment is not the only barrier to newcomers. Incumbentswith political influence could restrict or prevent entry into their industry directlythrough some kind of licensing scheme. There are, however, reasons why some preferfinancial underdevelopment to more direct barriers.First, direct-entry restrictions often require very costly enforcement. Enforcement
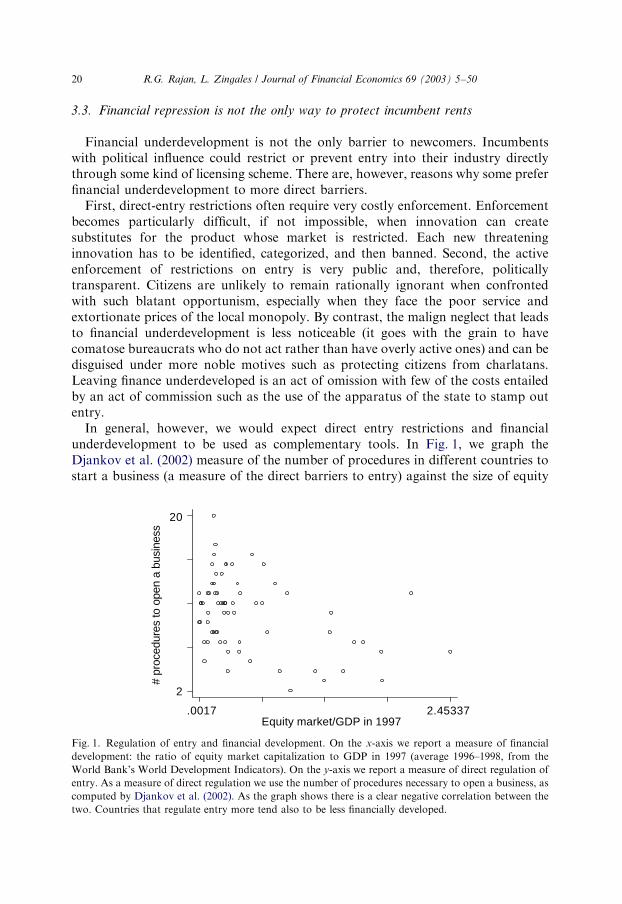
becomes particularly difficult, if not impossible, when innovation can createsubstitutes for the product whose market is restricted. Each new threateninginnovation has to be identified, categorized, and then banned. Second, the activeenforcement of restrictions on entry is very public and, therefore, politicallytransparent. Citizens are unlikely to remain rationally ignorant when confrontedwith such blatant opportunism, especially when they face the poor service andextortionate prices of the local monopoly. By contrast, the malign neglect that leadsto financial underdevelopment is less noticeable (it goes with the grain to havecomatose bureaucrats who do not act rather than have overly active ones) and can bedisguised under more noble motives such as protecting citizens from charlatans.Leaving finance underdeveloped is an act of omission with few of the costs entailedby an act of commission such as the use of the apparatus of the state to stamp outentry.In general, however, we would expect direct entry restrictions and financial
underdevelopment to be used as complementary tools. In Fig. 1, we graph theDjankov et al. (2002) measure of the number of procedures in different countries tostart a business (a measure of the direct barriers to entry) against the size of equity
# pr
oced
ures
to o
pen
a bu
sine
ss
Equity market/GDP in 1997.0017 2.45337
2
20
Fig. 1. Regulation of entry and financial development. On the x-axis we report a measure of financial
development: the ratio of equity market capitalization to GDP in 1997 (average 1996–1998, from the
World Bank’s World Development Indicators). On the y-axis we report a measure of direct regulation of
entry. As a measure of direct regulation we use the number of procedures necessary to open a business, as
computed by Djankov et al. (2002). As the graph shows there is a clear negative correlation between the
two. Countries that regulate entry more tend also to be less financially developed.
R.G. Rajan, L. Zingales / Journal of Financial Economics 69 (2003) 5–5020

markets relative to GDP in that country. The correlation is significantly negative,and regression estimates (not reported) show that it persists after correcting for thelevel of GDP. Financial underdevelopment does seem present along with otherbureaucratic barriers, and this suggests a common purpose.
3.4. What determines outcomes?
In an industrialized economy, incumbent industrialists and financiers ordinarilywould have enough political power, because of their large economic weight andsmall numbers, to collectively decide the development of the economy’s financialsector. In earlier times, the landed gentry could have been more powerful in manydeveloped countries than the ‘‘commercial’’ interests. How their power waned is amatter beyond the scope of this paper (though see Rajan and Zingales (2003) for oneaccount). So financial development will take place only when the country’s politicalstructure changes dramatically, or when the incumbents want development to takeplace.By creating a fresh power structure, political change can foster anti-incumbent
institutions, one of which is financial infrastructure. For example, a number of newmortgage banks and institutions like the Credit Mobilier were supported by thegovernment of Louis Napoleon after its coming to power in 1848. They were meantas a counter to the Bank of France and the Rothschilds who were thought to besympathetic to the deposed monarchy (e.g., Cameron, 1961). More recently, Weberand Davis (2000) find that a country’s transition to a multi-party democracyincreases its estimated rate of creation of a stock exchange by 134% during thesubsequent 3 years.If, however, we examine a period of relatively little structural political change, we
should see finance develop faster when both financial and industrial incumbents willit to do so and slower when both are against it. When one of these powerful groups isfor development and the other is against, predictions are more ambiguous.Incumbent incentives are powerfully affected by competition, especially that
emanating from outside their political borders, which they cannot control. Thedegree to which a country’s borders are open to both the flow of trade and capital isthus likely to matter. Of course, an important question is what causes a country to beopen. We will address this shortly. But first let us examine how incumbent incentivescan altered by cross-border competition.
3.5. Financial development and openness
Consider a country that is open to trade. While foreign markets bring opportunity,openness also brings foreign competitors to domestic markets. Foreign entry drivesdown domestic rents. Lower profits means established firms have lower internal cashflow, making them more dependent on external finance. At the same time, outsideopportunities (or the need to defend domestic markets against superior foreigntechnologies) increase the need for incumbents to invest more.
R.G. Rajan, L. Zingales / Journal of Financial Economics 69 (2003) 5–50 21

Unfortunately, the need for external finance need not translate into reforms thatimprove transparency and access in the financial system. In fact, given their greaterneed for finance, industrial incumbents can press for greater financial repression sothat the available finance flows their way. Financial incumbents can also be unwillingto accept the increased competition in the financial sector (from greater transparencyand access) in exchange for the additional industrial clientele that reforms generate.It may be far more profitable to support the existing relationships with industrialincumbents and ply them with greater amounts of capital they now need.Industrial incumbents can also petition the government for loan subsidies in the
face of foreign competition, instead of improving the quality of the domesticfinancial system. Selective government intervention can further reduce thetransparency of, and the access to, the financial system. Thus openness to tradeflows (i.e., industrial sector openness) alone may not be enough to convince either, orboth, dominant interest groups to support financial development.Consider next the possibility of cross-border capital flows (or financial openness)
alone. Free access to international capital markets will allow the largest and best-known domestic firms to tap foreign markets for funds. But in the absence ofdomestic or foreign competition in product markets, these firms will have little needto access external funds. And given the state of information asymmetries acrossmarkets, it is unlikely that small domestic firms are financed directly by foreigninvestors. If potential domestic entrants are not financed by foreigners, industrialincumbents will still retain an incentive to keep entrants at bay by opposing financialdevelopment. The domestic financial sector will see its sizeable profits fromproviding finance and services to the largest industrial firms diminish as these firmsthreaten to tap foreign financial markets and institutions. It will face the oppositionof domestic industrial incumbents if it tries to liberalize access and improvetransparency. So cross-border capital flows alone are unlikely to convince both ourinterest groups to push for financial development.It is when both cross-border trade flows and capital flows are unimpeded that
industrial and financial incumbents will have convergent incentives to push forfinancial development. Industrial incumbents, with depleted profits and the need fornew investment, will need funds to meet foreign challenges. But with free cross-border capital flows, the government’s role in directing credit to incumbents willbecome more circumscribed. As product markets become more competitive, the risksin, and information requirements for, lending will increase. The potential for largeerrors from the centralized direction of credit will increase. Moreover, the ability ofthe government to provide large subsidized loans to favored firms will decrease asmobile capital forces governments to maintain macro-economic prudence. Forexample, Loriaux (1997), provides a description of the constraints on Frenchintervention in domestic credit in the 1980s. The government’s role in the financialsector will diminish.The healthiest industrial incumbents will tap the now open foreign markets for
finance. These firms, able to compete in international markets, may not be muchworried, or affected, by domestic entry, and thus may not oppose domestic financialdevelopment. While the not-so-healthy industrial incumbents can be the hardest hit
R.G. Rajan, L. Zingales / Journal of Financial Economics 69 (2003) 5–5022
by foreign product market competition, there are reasons why they, too, will notoppose financial development and in fact support it. They will need finance. Andtheir existing financiers will be reluctant to lend to them on the old cozy terms.Because of product market competition, these firms will now be much less profitable,while needing much more investment. Moreover, competition in financial marketswill make long-term relationships, through which the traditional financier could havehoped to recover investments, more difficult. Both factors would combine to makefinance more difficult. Difficulty in financing will lead these firms to push for greatertransparency and access so that their own access to finance improves. Unlike the casewhen the country is only open to capital flows, industrial incumbents now will alsopush for financial development. The accompanying threat of domestic industrialentry will now seem relatively minor, given the competitive state of product markets.Moreover, as the domestic financial sector loses some of its best clients, domestic
financial institutions will want to seek new clients among the unborn or youngerindustrial firms that hitherto did not have the relationships to obtain finance. Sincethese clients will be riskier, and less well known, financial institutions will have noalternative but to press for improved disclosure and better contract enforcement. Inturn, this leveling of the playing field will create the conditions for more entry andcompetition in the financial sector.An example of such a virtuous circle is provided by Rosenbluth (1989). As the
most reputable Japanese exporters escaped their financial system in the 1980s to raisearm’s length finance from the Euromarkets, Japanese banks were forced to changetheir practices. One beneficial outcome is that access to the Japanese corporate bondmarkets, that hitherto had been tightly controlled by the banks, is now liberalized.Other influences will kick in over time. As the domestic financial incumbents
improve their skills, they will seek to compete abroad. As they look for new clientsoutside, they will be forced as a quid pro quo to increase access for foreigners anddismantle domestic regulations that give them their privileged competitive positions.For example, the German government banned lead underwriting of Deutschmarkbonds by Japanese financial institutions until Japan agreed in 1985 to allow foreignsecurities firms to act as lead underwriters for Euroyen bonds (e.g., Rosenbluth,1989). Foreign financial firms that enter the domestic market are another powerfulconstituency for financial development. Since they are not part of the domestic socialand political networks, they would prefer transparent arm’s length contracts andenforcement procedures to opaque negotiated arrangements. It is not a coincidencethat these are the very requirements of would-be domestic entrepreneurs who arealso outsiders to the domestic clubs.
4. A test of the private interest theory of financial development
Direct measures of the political power of interest groups and their ability toinfluence outcomes are controversial at best. The following example should illustratethe problems. French financial liberalization was kicked off in 1983 by a Socialistgovernment. Socialists do not seem to be an interest group that would push for
R.G. Rajan, L. Zingales / Journal of Financial Economics 69 (2003) 5–50 23

liberalization. A more detailed examination of the facts (e.g., Helleiner, 1994)suggests that there was a liberalizing faction in the French Socialist party, led byPrime Minister Pierre Mauroy and Finance Minister Jacques Delors, whose handwas strengthened by France’s increased trade integration into the EuropeanCommunity. This faction argued that liberalization was necessary to preserve tradeand won the day. How could one ever hope to capture the strength of such factionsin a large sample cross-country study without a subjective country-by-countryexercise?Our theory, however, does lead to some indirect, but more objective, tests.
According to it, incumbent interests are least able to coordinate to obstruct orreverse financial development when a country is open to both trade and capitalflows. When a country is open to neither, they coordinate to keep finance under heel.Matters are unlikely to be much better when a country is open only to capital flowsor only to trade. In the former case, incumbent industrial interests can hold backfinancial development, fearful of the domestic competition that might be financed. Inthe latter case, both industrial and financial incumbents want to strengthen existingfinancial relationships to combat the foreign threat. Free access and transparency arelikely to get short shrift at such times.
4.1. A test
To test the theory, we need a measure of financial development. The amount offunds raised from arm’s length financial markets or the amount of credit offered bycompetitive banking systems could be measures (albeit crude) of financialdevelopment. Unfortunately, we do not know how competitive the banking systemis. Instead, we only have measures of the quantity of deposits. The banking systemcould be concentrated and captive to incumbent interests, dominated by state ownedbanks, or just plain inefficient. Therefore, we prefer to use the size of the arm’s lengthfinancial markets as our measure of development. This also accords well with theview that arm’s length markets will emerge only when financial infrastructure such asdisclosure requirements (e.g., Sylla and Smith, 1995) and investor protection arereasonably developed (e.g., La Porta et al., 1998). Meanwhile banks can exist evenwhen infrastructure is primitive (e.g., Rajan and Zingales, 1998b).The obvious test would be to regress measures of financial development against
measures of openness. But we are immediately faced with another issue. A country’sopenness to trade and capital flows is also a matter of government policy, liable toinfluence by different interest groups. A large literature (e.g., Gourevitch, 1986;Rogowski, 1989; O’Rourke and Williamson, 1999) suggests that the decision to openup or close down an economy to trade is a political one, based on the relativestrengths of the sectors that stand to gain or lose from openness. This creates apotential problem. A country may open to trade when it sees opportunity, yet is alsolikely to be a time that financial markets expand. A correlation between tradeopenness and the size of financial markets can simply reflect a common driving force(opportunity) rather than a causal relationship. In independent work Svaleryd andVlachos (2002) explore the Granger causality between openness and financial
R.G. Rajan, L. Zingales / Journal of Financial Economics 69 (2003) 5–5024

development. While they find evidence that openness can cause financial develop-ment, they do not find evidence in the opposite direction.We have a way to deal with this problem when we consider openness to trade as
the explanatory variable. For we can instrument trade openness with measures of acountry’s natural propensity to trade—because of its small size or its proximity totrading partners. If the exogenous component of trade correlates with financialdevelopment, we can be more confident that openness indeed causes financialdevelopment.Openness to capital flows is more problematic. First, the extent to which capital
flows into a particular country may directly reflect the sophistication of its financialsystem. Moreover, unlike with trade, no obvious instruments present themselves.The mobility of capital, however, suggests a way out.The decision to open up to capital flows is likely to be a strategic complement.
When the rest of the world is open, it is both more difficult for a country to preventcross-border capital movement and less attractive for it to do so. It is more difficultto prevent capital movements because the openness of the rest of the world makes iteasier for domestic agents to expatriate funds to a safe haven or borrow funds fromit, despite domestic controls. These leakages are especially likely for countries thatare more open to trade. In open countries, funds can be transferred throughunderinvoicing or overinvoicing of trade, transfer pricing between units of amultinational, etc. A country can also find controlling capital flows unattractivewhen others are open. Its domestic financial institutions can find themselves at acomparative disadvantage. For example, a domestic exchange may not be able toprovide as much liquidity as exchanges in other countries that are open to capitalmovements. In fact, competition between New York, London, and Tokyo to becomeglobal financial centers was responsible for the rapid demise of capital controls inthese countries after the collapse of Bretton Woods (e.g., Helleiner, 1994).Given all this, for each individual country the decision to allow capital to flow
across its borders is strongly influenced by overall global conditions, which can beregarded as exogenous to specific domestic political considerations. And there isconsiderable variation in the flow of capital across borders during the twentiethcentury. Consider the mean absolute value of current account over GDP over five-year intervals for a sample of fourteen developed countries as calculated by Taylor(1998) and extended by us until 1999. This indicator suggests international capitalmobility remained high only up to 1930s (3.8% before World War I and 3.2% in the1920s, dropping to 1.6% in the 1930s). Following the Depression and the BrettonWoods agreement, capital movement remained severely curtailed till the 1980s(oscillating around 1.4%). The United States opened up in the mid 1970s, UnitedKingdom and Japan in 1980, while the countries of Continental Europe only in thelate 1980s. As a result, the indicator rose to 2.1% in the 1980s and 2.6% in the 1990s.In what follows, we will instrument openness to trade to get an exogenous
measure, while we will use the variation in global capital flows over time as anexogenous measure of a country’s variation in openness to capital flows. Let us nowframe the hypothesis. In periods of high capital mobility, countries that conduct a lotof foreign trade are also likely to have well-developed capital markets. Countries that
R.G. Rajan, L. Zingales / Journal of Financial Economics 69 (2003) 5–50 25

conduct little trade are unlikely to have developed capital markets (they are open ononly one dimension). So
(1) For any given level of demand for financing, a country’s domestic financial
development should be positively correlated with trade openness at a time when the
world is open to cross-border capital flows.Changes in capital mobility over time give us the data to test the other dimension ofour theory:
(2) The positive correlation between a country’s trade openness and financial
development should be weaker when worldwide cross-border capital flows are low.
We will need a proxy for the demand for financing. Bairoch (1982) computes anindex of industrialization across a group of countries for a number of years. Theindex number in a year reflects a country’s absolute level of industrialization in thatyear, with England in 1900 set at one hundred. The index is calculated on the basis ofdata on per-capita consumption of manufactured goods and from the sectoraldistribution of labor. The index is computed in two stages, with the data for the UKcalculated in the first stage and the relative importance, sector by sector, of othercountries calculated in the second stage. There are measurement issues with anyindex, but this one seems well accepted among economic historians. Bairoch’s indexis our preferred control for the demand for financing whenever it is available. This isbecause GDP is a poorer proxy for the demand for financing in earlier years, whenmuch of GDP was generated by agriculture. We will use per-capita GDP whenBairoch’s numbers are not available, though sectoral differences between countriesat very different levels of development will add noise.To test the first hypothesis, we examine the correlation between openness and
financial development in 1913, the earliest date for which we have data for a sizeablenumber of countries, and 1996–1998, the last period for which we have data. Capitalflows are relatively free in both periods.
4.2. Financial development in 1913
Consider first financial development in 1913, a period of relatively free capitalflows and varying degrees of openness to trade. We present summary statistics andpairwise correlations in Table 6 Panels A and B. Equity market capitalization toGDP is positively correlated with Bairoch’s index of industrialization (0.58,p=0.01), with openness (0.33, p=0.19), and negatively correlated with tariffs onmanufacturing (�0.37, p=0.15). Its correlation with the interaction (between theindex of industrialization and openness) is both high and very significant (0.67,p=0.002).In Table 7, Panel A, the ratio of stock market capitalization to GDP is our
measure of financial development. As the estimates in Column (i) show, moreindustrialized countries have more developed financial markets. More relevant toour hypothesis, more open countries have more developed financial markets, but dueto the small number of observations, this effect is not statistically significant at
R.G. Rajan, L. Zingales / Journal of Financial Economics 69 (2003) 5–5026

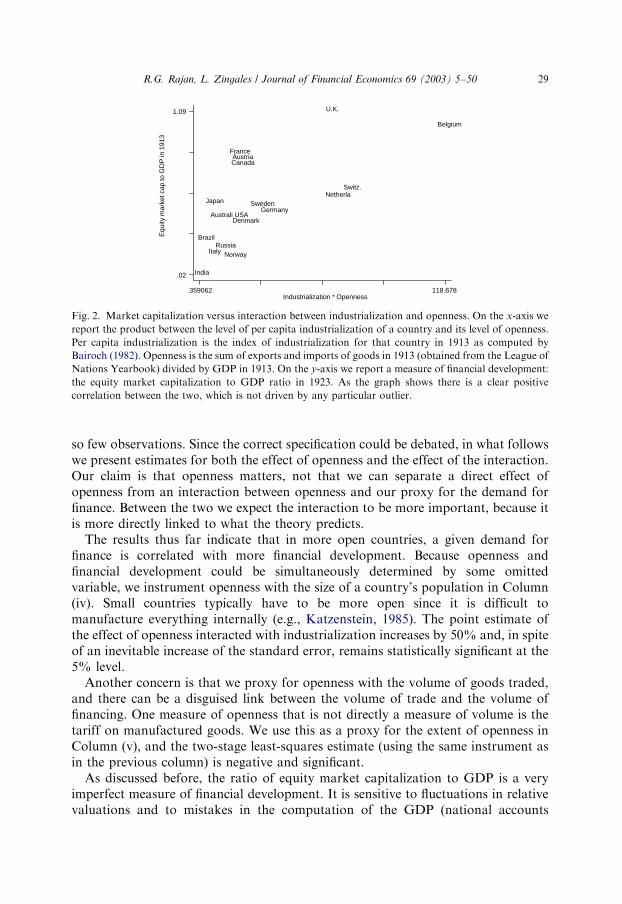
conventional level. Our hypothesis, however, is that for any given level, moreopenness should lead to more financial development. Therefore, in column (ii) weinclude the interaction between openness and the index of industrialization, which isour proxy for the demand for finance. The coefficient estimate for the interactionterm is highly statistically significant ð p ¼ 0:034Þ: The magnitude of the effect is alsolarge. A one standard deviation increase in the interaction term increases the ratio ofstock market capitalization to GDP by 50% of its standard deviation. Since we haveso few observations, we plot the data in Fig. 2 to show the result is not driven byoutliers.We can try to tell the effect of openness (apart from the effect of openness working
through demand) by including both the level of openness and the interaction term inColumn (iii). It turns out that only the interaction has a positive coefficient estimate,and the explanatory power of the specification in Column (ii) is not enhanced byincluding openness. The magnitude of the interaction coefficient is higher than inColumn (ii) but its standard error also goes up. The problem is that openness and theinteraction are highly correlated (=0.69), so it is hard to tell their effects apart with
Table 6
Summary statistics
Equity market cap./GDP is the equity market capitalization of domestic companies to GDP in 1913.
Issues to GDP is the sum of equity and bond issues by domestic firms in 1912 to GDP in 1913. Per Capita
Industrialization is the index of industrialization for that country in 1913 as computed by Bairoch (1982).
Openness is the sum of exports and imports of goods in 1913 (obtained from the League of Nations
Yearbook) divided by GDP in 1913. Tariffs are import duties as a percentage of special total imports
(1909–1913) obtained from Bairoch (1989).
Mean Standard
deviation
Minimum Maximum Observations
Panel A. Summary statistics
Equity market capital/GDP 0.490 0.294 0.02 1.09 18
Issues to GDP in 1912 0.022 0.015 0.002 0.055 17
Per capita industrialization 49.5 37.08 2 126 18
Openness (trade volume/GDP) 0.59 0.51 0.11 2.32 18
Tariffs 13.0 9.5 0.4 37.4 17
Interaction of per capita
industrialization and openness
29.1 31.1 0.36 118.67 18
Panel B. Pairwise correlations between variables (significance in parentheses)
Equity market
cap to GDP
Per capita
industrialization
Openness
(trade volume/GDP)
Tariffs
Per capita industrialization 0.58
(0.01)
Openness (trade volume/GDP) 0.33 0.01
(0.19) (0.98)
Tariffs �0.37 �0.24 �0.37(0.15) (0.35) (0.15)
Interaction of per capita 0.67 0.55 0.69 �0.37industrialization and openness (0.00) (0.02) (0.00) (0.15)
R.G. Rajan, L. Zingales / Journal of Financial Economics 69 (2003) 5–50 27

Table 7
Financial development and openness in 1913
In Panel A the dependent variable is equity market capitalization of domestic companies to GDP in 1913,in Panel B it is the number of listed companies per million of population in 1913, and in Panel C it is thetotal amount of securities issued to GDP, which is the sum of equity and bond issues by domestic firms in1912 to GDP. Per Capita Industrialization is the index of industrialization for that country in 1913 ascomputed by Bairoch (1982). Openness is the sum of exports and imports of goods in 1913 (obtainedfrom the League of Nations Yearbook) divided by GDP in 1913. Tariffs are import duties as a percentageof special total imports (1909–1913) obtained from Bairoch (1989). Coefficient estimates for per capitaindustrialization, its interaction with openness, and the corresponding standard errors are multipliedby one thousand. Columns (iv)–(v) report instrumental variable estimates, where the instrument foropenness is population size. All the regressions include a constant, whose coefficient is not reported.Standard errors are in parentheses. (*) indicates significance at the 10% level, (**) at the 5% level, (***) atthe 1% level.
Dependent variable Equity market capitalization/GDP
(i) (ii) (iii) (iv) (v)
Panel A. Equity market capitalization/GDPPer capita industrialization 4.61*** 2.42 2.11 1.55 8.77**
(1.52) (1.71) (2.25) (2.05) (3.18)Openness 0.18 �0.04
(0.11) (0.19)Interaction of per-capita 4.76** 5.44 6.62**industrialization and openness (2.03) (3.69) (3.08)Interaction of per-capita �0.38*industrialization and tariffs (0.22)Adjusted R2 0.37 0.45 0.42Observations 18 18 18 18 17
Panel B. Number of domestic companies listed/million population
Dependent variable No. of companies/million population
(i) (ii) (iii) (iv) (v)
Per-capita industrialization 215.8 �210.6 �199.5 �252.0* 927.7**(133.6) (116.0) (152.8) (137.0) (442.3)
Openness 38.8*** �1.5(9.6) (12.7)
Interaction of per-capita 924.1*** 899.8*** 1012.8***industrialization and openness (138.1) (250.8) (206.0)Interaction of per-capita �60.9**industrialization and tariffs (29.9)Adjusted R2 0.50 0.74 0.72Observations 18 18 18 18 17
Panel C. Total securities issued/GDP
Dependent variable Securities issued/GDP
(i) (ii) (iii) (iv) (v)
Per-capita industrialization 0.17 0.02 �0.09 �0.02 0.52**(0.10) (0.10) (0.12) (0.11) (0.22)
Openness 0.01 �0.01(0.01) (0.01)
Interaction of per-capita 0.33** 0.56** 0.41**industrialization and openness (0.11) (0.19) (0.17)Interaction of per-capita �0.03*industrialization and tariffs (0.01)Adjusted R2 0.14 0.39 0.44Observations 17 17 17 17 17
R.G. Rajan, L. Zingales / Journal of Financial Economics 69 (2003) 5–5028
so few observations. Since the correct specification could be debated, in what followswe present estimates for both the effect of openness and the effect of the interaction.Our claim is that openness matters, not that we can separate a direct effect ofopenness from an interaction between openness and our proxy for the demand forfinance. Between the two we expect the interaction to be more important, because itis more directly linked to what the theory predicts.The results thus far indicate that in more open countries, a given demand for
finance is correlated with more financial development. Because openness andfinancial development could be simultaneously determined by some omittedvariable, we instrument openness with the size of a country’s population in Column(iv). Small countries typically have to be more open since it is difficult tomanufacture everything internally (e.g., Katzenstein, 1985). The point estimate ofthe effect of openness interacted with industrialization increases by 50% and, in spiteof an inevitable increase of the standard error, remains statistically significant at the5% level.Another concern is that we proxy for openness with the volume of goods traded,
and there can be a disguised link between the volume of trade and the volume offinancing. One measure of openness that is not directly a measure of volume is thetariff on manufactured goods. We use this as a proxy for the extent of openness inColumn (v), and the two-stage least-squares estimate (using the same instrument asin the previous column) is negative and significant.As discussed before, the ratio of equity market capitalization to GDP is a very
imperfect measure of financial development. It is sensitive to fluctuations in relativevaluations and to mistakes in the computation of the GDP (national accounts
Equ
ity m
arke
t cap
to G
DP
in 1
913
Industrialization * Openness.359062 118.678
.02
1.09
Austria
Belgium
Brazil
Canada
Switz.
Germany
Denmark
France
U.K.
India
Italy
JapanNetherla
NorwayRussia
Sweden
Australi USA
Fig. 2. Market capitalization versus interaction between industrialization and openness. On the x-axis we
report the product between the level of per capita industrialization of a country and its level of openness.
Per capita industrialization is the index of industrialization for that country in 1913 as computed by
Bairoch (1982). Openness is the sum of exports and imports of goods in 1913 (obtained from the League of
Nations Yearbook) divided by GDP in 1913. On the y-axis we report a measure of financial development:
the equity market capitalization to GDP ratio in 1923. As the graph shows there is a clear positive
correlation between the two, which is not driven by any particular outlier.
R.G. Rajan, L. Zingales / Journal of Financial Economics 69 (2003) 5–50 29
statistics were widely calculated only after WWII, all previous numbers are estimatescomputed in recent years). An alternative measure, which is immune to both thesecriticisms, is the ratio of the number of publicly listed companies to population. InPanel B of Table 7, we re-estimate the specifications in Table 7’s Panel with thisalternative dependent variable. The correlations are even stronger. Openness has apositive and significant correlation with development even when included alone.When both openness and openness interacted are included, the latter remainsstatistically significant at the 5% level.Finally, our measure of financial development captures only the size of the equity
market, even though the bond market plays an important role in some of thesecountries. Unfortunately, we were unable to obtain data for the size of the corporatebond market for the same set of countries. We did obtain data, however, from the1915 Bulletin of the International Institute of Statistics (IIS) in Vienna on the totalissues of public corporate securities (both equity and corporate bonds) by domesticfirms in a set of countries in 1912. The IIS sample is slightly different from our1913 sample (which we have put together from different sources for each country).We have checked that the data in the IIS sample seem accurate by comparingwith independent sources, and they do seem to represent net rather than grossissues.In Panel C of Table 7, we re-estimate the same specifications using total issues to
GDP in 1912 as dependent variable. As a denominator we use GDP rather thanGFCF to maximize the number of observations available. Here again, theinteraction between industrialization and openness has a positive and statisticallysignificant coefficient. A one-standard deviation increase in the interaction termincreases the ratio of total issues to GDP by 68% of its standard deviation.
4.3. Financial development in the late 1990s
Regardless of the measure used, openness seems to have facilitated financialdevelopment in 1913. The paucity of observations, however, is worrisome. But ourhypothesis suggests the results should also be present in recent times, when cross-border capital flows have regained the levels they had reached in the early part of thetwentieth century.In Table 8, we re-estimate the specifications in Table 7 using the largest cross-
section of data available today. We obtain data for market capitalization from theWorld Bank’s World Development Indicators, data on the number of domestic listedcompanies from the Emerging Market Factbook, and data on security issues fromBeck et al. (1999). Since Bairoch’s index of industrialization is not available, we useinstead the log of per-capital GDP in PPP dollar, also from the World Bank’s WorldDevelopment Indicators.To smooth the effects of the East Asian financial crisis we averaged the dependent
variable across three years (1996–1998). As Table 8’s Panel A (with dependentvariable equity market capitalization to GDP) shows, the results are very similar tothose in 1913. Openness has a positive and statistically significant effect on financialdevelopment. This is true both if we use openness directly (see Column (i)) and if we
R.G. Rajan, L. Zingales / Journal of Financial Economics 69 (2003) 5–5030
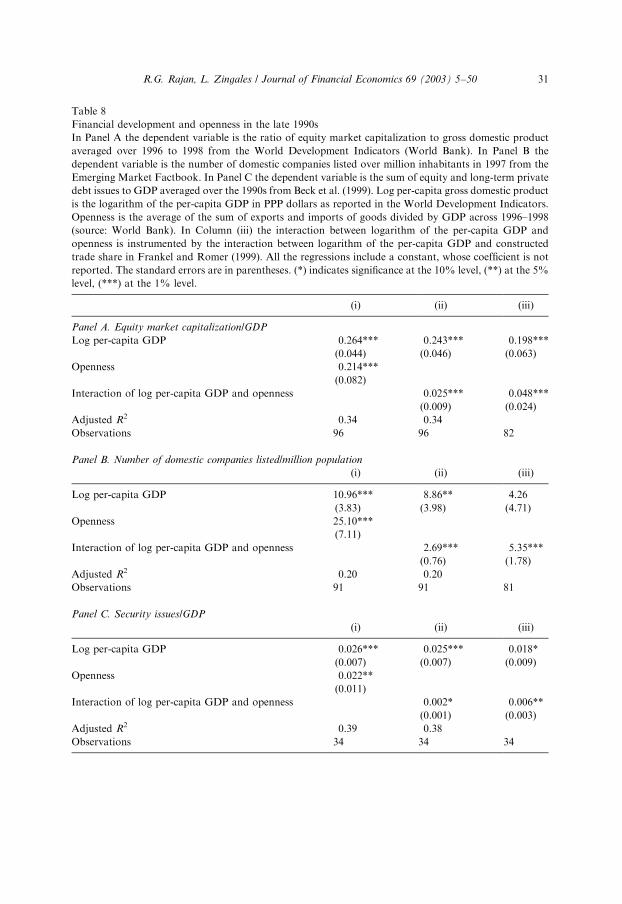
Table 8
Financial development and openness in the late 1990s
In Panel A the dependent variable is the ratio of equity market capitalization to gross domestic product
averaged over 1996 to 1998 from the World Development Indicators (World Bank). In Panel B the
dependent variable is the number of domestic companies listed over million inhabitants in 1997 from the
Emerging Market Factbook. In Panel C the dependent variable is the sum of equity and long-term private
debt issues to GDP averaged over the 1990s from Beck et al. (1999). Log per-capita gross domestic product
is the logarithm of the per-capita GDP in PPP dollars as reported in the World Development Indicators.
Openness is the average of the sum of exports and imports of goods divided by GDP across 1996–1998
(source: World Bank). In Column (iii) the interaction between logarithm of the per-capita GDP and
openness is instrumented by the interaction between logarithm of the per-capita GDP and constructed
trade share in Frankel and Romer (1999). All the regressions include a constant, whose coefficient is not
reported. The standard errors are in parentheses. (*) indicates significance at the 10% level, (**) at the 5%
level, (***) at the 1% level.
(i) (ii) (iii)
Panel A. Equity market capitalization/GDP
Log per-capita GDP 0.264*** 0.243*** 0.198***
(0.044) (0.046) (0.063)
Openness 0.214***
(0.082)
Interaction of log per-capita GDP and openness 0.025*** 0.048***
(0.009) (0.024)
Adjusted R2 0.34 0.34
Observations 96 96 82
Panel B. Number of domestic companies listed/million population
(i) (ii) (iii)
Log per-capita GDP 10.96*** 8.86** 4.26
(3.83) (3.98) (4.71)
Openness 25.10***
(7.11)
Interaction of log per-capita GDP and openness 2.69*** 5.35***
(0.76) (1.78)
Adjusted R2 0.20 0.20
Observations 91 91 81
Panel C. Security issues/GDP
(i) (ii) (iii)
Log per-capita GDP 0.026*** 0.025*** 0.018*
(0.007) (0.007) (0.009)
Openness 0.022**
(0.011)
Interaction of log per-capita GDP and openness 0.002* 0.006**
(0.001) (0.003)
Adjusted R2 0.39 0.38
Observations 34 34 34
R.G. Rajan, L. Zingales / Journal of Financial Economics 69 (2003) 5–50 31

interact it with our proxy for the demand for finance, the log of per capital GDP (seeColumn (ii)). A one-standard deviation increase in the interaction term correspondsto an increase in the ratio of stock market capitalization to GDP by 25% of itsstandard deviation. In spite of the very high correlation between openness and theinteraction between openness and log per-capita income, the larger cross-sectionallows us to distinguish the two, and it is the interaction that is positivelysignificantly correlated (estimates not reported).Frankel and Romer (1999) predict bilateral trade between two countries using an
expanded version of the gravity model of trade (where trade is a function of thedistance between the countries, their size, and whether they have a common border).Their constructed trade share, then, is simply the sum of these fitted values across allpossible trading partners and is a good instrument for trade (perhaps better thanpopulation) which is all that we have in 1913. When we use this instrument, theestimated coefficient almost doubles (see Column (iii)) and remains statisticallysignificant at the 1% level.We show these results hold for other measures of financial development. In Panel
B the dependent variable is the number of domestic companies listed per millioninhabitants in 1997, while in Panel C it is the sum of equity and long-term privatedebt issues to GDP. To deal with the cyclicality of equity and debt issues, we use anaverage across all the years during the 1990s that are available in Beck et al. (1999).These panels confirm the finding that financial development is higher for any level ofdemand when a country is more open.
4.3.1. Robustness
The greater availability of data at the end of 1990s allows us to explore therobustness of our results. La Porta et al. (1997) suggest that a better measure offinancial development than market capitalization is the amount of equity held byoutsiders. Using this measure of development, openness or openness interacted withGDP per-capita have a positive and statistically significant correlation with equityheld by outsiders (estimates not reported). Similarly, a good indicator of the abilityto raise external funds, and thus a measure of the development of a financial market,is the quality of the accounting standards, as measured by the Center forInternational Financial Analysis and Research. This measure is available only for39 countries, nevertheless openness alone and openness interacted with GDP per-capita are positively and statistically significantly correlated with it (estimates notreported).One might worry that there is a mechanical link between openness and financial
market development. We know that financial liberalization leads to an increase instock prices (e.g., Henry, 2000) and, thus, at least temporarily to an increase in theratio of stock market capitalization to GDP, which is one of our measures offinancial development. For example, a large trade deficit has to be financed throughcapital inflows. If domestic government assets are insufficient, and if foreign directinvestment is small, the inflows will be reflected in a larger private market forfinancial assets. Is the link we have found merely the flip side of a trade deficit? Were-estimate the basic specification using the ratio of trade surplus to GDP as a
R.G. Rajan, L. Zingales / Journal of Financial Economics 69 (2003) 5–5032

substitute for openness (estimates not reported). Trade surplus does not seem to becorrelated with domestic financial development. When we include the interaction ofopenness with log per-capita GDP, trade surplus loses statistical significance, whilethe interaction term remains positive and statistically significant.Another way of getting at this is to look at a form of financing that may not be
arm’s length (domestic bank credit) and is therefore less likely to be influenced byopenness. Openness does not seem to be statistically significantly correlated with theratio of domestic credit to the private sector to GDP (obtained from Beck et al.,1999). Thus there does not seem to be a mechanical link between openness andfinancing. Instead the link is to arm’s length financing (or we conjecture, if we couldmeasure it, competitive private credit).
4.4. Financial development over time
Our results thus far indicate that both before World War I and in the late 1990s,measures of financial development were higher in countries more open to trade. Ofcourse, many good institutions are associated with more trade. For example, Wei(2000) finds lower corruption in countries that trade more. But our secondhypothesis suggests that trade openness is particularly effective when it isaccompanied by capital mobility and offers a way of distinguishing our theoryfrom the more general observation that trade is good for institutions. Wehypothesize the correlation between trade openness and financial development tobe stronger in periods of high international capital mobility than in periods of lowmobility.To begin with, we estimate our basic regression (specification (ii) in Table 7, Panel
A) year by year. Unfortunately, we do not have Bairoch’s measure of per-capitaindustrialization over the entire period. Thus, the first seven cross-sections (for theyears 1913, 1929, 1938, 1950, 1960, 1970, and 1980) use Bairoch’s index as a proxyfor demand, while the last two use the logarithm of per capita GDP adjusted fordifference in the purchasing power parity (as computed by the World Bank).Consequently, the magnitude of the coefficient before 1980 and after 1981 are notdirectly comparable.As Table 9 shows, the interaction between openness and demand for finance has a
reliable and statistically significant positive correlation with financial developmentboth at the beginning and at the end of the sample (1913, 1929, and 1997), whichcorrespond to the periods of high international capital mobility. During the periodof low capital mobility, the effect is statistically insignificant or even negative whenwe measure financial development by the ratio of equity market capitalizationto GDP.To formally test whether the effect of openness is smaller during periods of low
capital mobility, we pool the different cross-sections. We first report the results forthe panel 1913–1980 in Table 10, Column (i), where Bairoch’s index is our measureof demand. The specification is the same as Column (iv) of Table 7, with theinclusion of an additional slope term for the years of low capital mobility and yearindicators. As an instrument for openness, we use the constructed trade shares
R.G. Rajan, L. Zingales / Journal of Financial Economics 69 (2003) 5–50 33

Table9
Financialdevelopmentandopennessover
time
Thedependentvariable
ineach
regressionisameasure
offinancialdevelopment(equitymarket
capitalto
GDPandnumber
ofcompaniesper
million
inhabitants).Theexplanatory
variablesareaconstant(coefficientnotreported),ameasureofindustrialization(coefficientsnotreported),andtheinteraction
betweenthismeasure
ofindustrializationandopenness(theonlycoefficientreported).Fortheperiod1913–1980themeasure
ofindustrializationisBairoch
(1982)’sindex
ofindustrialization,fortheperiod1981–1997itisthelogarithm
oftheper
capitaGDPin
PPPdollarsasreported
intheWorldDevelopment
Indicators.Coefficientestimatesfortheinteractionoftheper
capitaindustrializationindex
withopennessandthecorrespondingstandard
errors
are
multiplied
by1000.Standard
errorsare
inparentheses.Coefficientsin
bold
are
statisticallydifferentfrom
zero
atthe10%
level.
Dependentvariable
Year
1913
1929
1938
1950
1960
1970
1980
1981
1997
CoefficientofInteractionTerm
(Dem
and=
Index
ofIndustrialization)
CoefficientofInteractionTerm
(Dem
and=LogPer
CapitaGDP)
Equitymarketcapitalizationto
GDP
4.76
7.02
5.53
1.76
�1.90
�1.39
�0.65
0.036
0.046
(2.03)
(4.94)
(14.25)
(3.19)
(2.85)
(2.28)
(0.89)
(0.05)
(0.01)
Adjusted
R2
0.45
0.13
�0.14
�0.07
�0.14
�0.13
�0.09
0.56
0.46
N18
10
12
13
13
16
18
45
45
Number
ofCompaniesper
Million
924.1
1741.7
1627.5
552.3
190.6
128.5
35.7
1.78
2.71
(138.1)
(531.6)
(675.8)
(388.5)
(181.9)
(63.8)
(68.3)
(0.72)
(0.53)
Adjusted
R2
0.74
0.45
0.26
0.00
�0.07
0.17
�0.06
0.21
0.53
N18
12
12
15
14
15
18
49
49
R.G. Rajan, L. Zingales / Journal of Financial Economics 69 (2003) 5–5034

computed by Frankel and Romer (1999). While this instrument will be weaker as wego back in time because it is constructed based on country borders in the 1990s, allwe care about is that it be correlated with trade and not with financial development.We use population in Table 7 as an instrument because it is availablecontemporaneously in 1913, but we check that the results hold even when we usethe Frankel and Romer instrument. The interaction term is significantly positive,and the additional effect in periods of low capital mobility is significantly negative aspredicted.In Table 10, Column (ii), we report the results for the panel 1981–1997, where the
log of per-capita GDP is our measure of demand. The specification is the same asColumn (iii) of Table 8, with the inclusion of an additional slope term for the yearsof low capital mobility. Again, the interaction term is significantly positive, and theadditional effect in periods of low capital mobility is significantly negative aspredicted.As discussed earlier, Bairoch’s index is probably a better measure of demand for
finance in the early years than per-capita industrialization. Since we do not have it
Table 10
Financial development and variation in capital flows
The dependent variable is the ratio of equity market capitalization to gross domestic product measure in a
year. In Column (i), we pool the cross-sections from the following years: 1913, 1929, 1938, 1950, 1960,
1970, and 1980. In Column (ii), we pool the data averaged over 1980–1982 with the data averaged over
1996–1998. In Columns (iii) and (iv) we pool data for 1990 and 1999 with the data used for the estimates in
Column (i). All estimates are obtained by instrumental variables, where openness is instrumented by
constructed trade share in Frankel and Romer (1999). In the first column the proxy for demand for finance
is the index of industrialization for that country in that year as computed by Bairoch (1982) divided by one
thousand. In the other columns it is the logarithm of the per-capita GDP. Openness is the ratio of the sum
of exports and imports of goods to GDP that year. The indicator for low international capital mobility
equals one in the years from 1938–1980 and zero otherwise. The level of capital mobility is the mean
absolute level of current account to GDP in 14 countries as computed by Taylor (1998) and extended by us
to 1999. All regressions include a calendar year dummy. The standard errors, which are corrected for
possible clustering of the residual at a country level, are in parentheses. (*) indicates significance at the
10% level, (**) at the 5% level, (***) at the 1% level.
Sample period: 1913–1980 (i) 1981–1997 (ii) 1913–1999 (iii) 1913–1999 (iv)
Demand for finance 1.201 0.127** 0.143 0.145
(1.220) (0.054) (0.106) (0.108)
Interaction of demand
for finance and openness
6.549*** 0.062** 0.037 �0.162
(0.976) (0.024) (0.036) (0.097)
Interaction of demand for
finance and openness *dummy =1
if period of low international
�10.420*** �0.034** �0.077*
capital mobility (0.222) (0.015) (0.040)
Interaction of demand for finance 6.695**
and openness * level of international
capital mobility
(3.038)
Observations 100 90 151 151
R.G. Rajan, L. Zingales / Journal of Financial Economics 69 (2003) 5–50 35

for later years, the only panel we can estimate for all the years is one with log of per-capita GDP as a measure of demand. This is what we report in Column (iii). Theinteraction effect is positive (though not statistically significant) and it is significantlylower in years of low capital mobility.Finally, perhaps we should let the data define periods of low and high capital
mobility. In Column (iv), instead of multiplying by a dummy indicating periods oflow capital mobility, we multiply the interaction by the ratio of cross border flows toGDP in that year (obtained from Taylor, 1998). The coefficient estimates indicate, aspredicted, that the interaction is significantly higher in periods of high capitalmobility.We obtain qualitatively similar results to those in Table 10 (not reported) when we
use the ratio of number of domestic firms listed to million inhabitants as a measureof financial development or when we use openness rather than openness interactedwith demand.Overall, these results suggest that the positive correlation between openness
and financial development re-emerged, and became stronger, in the last two decadesof the Twentieth Century, in concert with the increased cross-border capitalmobility.
4.5. Summary of results
Overall, the results suggest that financial development is positively correlated withtrade openness in periods when cross-border capital flows are high, but less so, or notat all, when cross-border capital flows are low. This is consistent with our theory thatincumbents are most able to coordinate opposition to financial development whencross-border capital and trade flows ebb but not when they are vibrant. Of course,other theories could be consistent with our evidence. Nevertheless, when viewed inconjunction with the descriptive histories of financial development in the twentiethcentury (see below for examples), our theory seems to be an important part of theexplanation.The reversal in financial development in the data is then explained by the
diminution of cross-border capital flows that started during the Depression andcontinued post-World War II until the breakdown of the Bretton Woods agreement.Of course, this raises the question of why most countries collectively shut theirborders in the 1930s and 1940s and fully opened up again only recently. While acomplete explanation is beyond the scope of this paper, in what follows we try tosketch our main arguments.
4.6. Shutting and re-opening borders
In the 1930s openness fell victim to the Great Depression. The extremely high levelof unemployment created by the Great Depression increased the demand forgovernment intervention, which could not take place within the narrow margins ofdiscretion allowed by the Gold Standard. The Gold Standard simply did not allowgovernments to dislocate their budgets to provide social security and welfare support
R.G. Rajan, L. Zingales / Journal of Financial Economics 69 (2003) 5–5036

to the needy (e.g., Eichengreen, 1996) even if they wanted to. When the politicaldemand for some form of support became irresistible, country after countryabandoned the Gold Standard and devalued its currency. This reaction triggered around of competitive devaluations between trade partners. To minimize theeconomic consequences of these competitive devaluations most governmentsintroduced tariffs. Hence, the Great Depression ignited a chain reaction beyondthe control of any single country, which almost inevitably led to protectionism. Tobetter understand why this took place in the 1930s, however, we have to analyze thechanged political and social conditions after WWI.
4.6.1. The rising political demand for insurance
In the open developed economies in the beginning of the twentieth century, therole of the government was relatively small. Government expenditure as a fraction ofGDP was only 12.7% in 1913 for a sample of 17 developed countries, compared to45.6% in 1996 (e.g., Tanzi and Schuknecht, 2000). Part of the reason for therelatively small role played by the government was that it did not provide insuranceto the people to the extent it now does. Only 20% of the labor force in westernEurope had some form of pension insurance in 1910, and only 22% had healthinsurance (vs. 93% and 90% respectively in 1975).Before World War I, there were a number of reasons why the government played
such a small role in social insurance. The prevailing liberal belief in the relentlesslogic of the market suggested it was unwise for governments to interfere.Intervention, it was thought, would only prolong the pain. The rigidity of the GoldStandard system prevented governments from running large deficits. Last but notleast, the poorer sections of society (the workers, the small farmers, and theunemployed) were not organized and had little political voice (e.g., Maier, 1987;Eichengreen, 1996).World War I and the Great Depression, which followed a decade after, were huge
consecutive political and economic shocks, which combined to create an organizeddemand for insurance and triggered a coordinated response by governments.Labor was organized by the war. The senseless carnage of a war that left all its
main protagonists worse off led many to doubt the caliber and motives of theirpolitical leaders and discredited the pre-war free-market consensus. The trenchesduring the war served as classrooms where the working class absorbed radical ideas.Labor, with its newly found ideas and organization, gave notice even in the 1920sthat it would no longer continue unquestioningly to absorb the costs of adjustmentto the rigors of the Gold Standard.The onset of the Depression immensely increased the size of economic adjustments
countries would have to undergo to stay on the Gold Standard. Classical liberaleconomics indicated the cure to falling output was a steep fall in wages. This wassimply not acceptable to labor. Faced with increasing resistance from labor,politicians saw little reward in paying a political price to adhere to the GoldStandard. With little thought for the collective consequences, they also startederecting barriers to imports in an attempt to trade their way out of depression. Aseveryone attempted to beggar their neighbors, trade and capital flows ceased.
R.G. Rajan, L. Zingales / Journal of Financial Economics 69 (2003) 5–50 37

Clearly, incumbents were not idle in the policy debates in the 1930s. Equallyclearly, many of them welcomed the descent into autarky, for it strengthened theirpositions. But it would be incorrect to claim that broad policy was shaped primarily,or even largely, by these interests. The Depression had affected too many people forbusiness as usual to prevail. For example, in Sweden, labor and agrarian interestscame together in 1932 in what has been termed the ‘‘cow trade.’’ Labor acceptedhigher food prices and price supports in return for stable wages, policies for fullemployment, and social services. The business interests opposed this coalition atfirst, but became more accommodating when the party representing labor, the SocialDemocrats, became stronger in the election of 1936.Economic policy in the developed democracies was thus broadly a response to the
large, across-the-board, adverse shock affecting the uninsured masses. Autarkyallowed the governments to implement various insurance schemes that may havebeen more difficult had the economies been open and the Gold Standard in place.The increase in insurance coverage was significant. Over 56% of the workforce inwestern Europe was covered by pension insurance by 1935 and 47% had healthinsurance coverage. Unemployment insurance was introduced for the first time in anumber of countries, including the United States, during the Depression.Incumbents used the protection afforded by autarky to mould policies in their
own favor. Thus, Japan, for example, moved from an economy with a flourishingfinancial market, and a competitive banking system, to an economy withsmall financial markets and a concentrated banking system. These moves had thesupport of the government, which felt it could better control resource allocationif funds were channeled largely through the banks. The reversal in opennessprovided the conditions under which financial markets could be, and indeed were,repressed (see Rajan and Zingales (2003) for a more detailed account).
4.6.2. Why did financial markets take so long to recover?
The disruption to international trade caused by the two wars and the GreatDepression was significant. While the average degree of export openness(merchandise exports as a percentage of GDP) was 8.2 in 1913, it was just 5.2 in1950 (e.g., O’Rourke and Williamson, 1999, p. 30). In contrast to much of thedeveloped world, the United States emerged from World War II with its industrieslargely intact and highly competitive. Clearly, it had a strong incentive to press foropen trade since its markets were likely to expand. Meanwhile, its wartime role as the‘‘Arsenal of Democracy’’ gave it the political clout to press its agenda. But in returnfor agreeing to free trade, other developed countries wanted some restrictions oncross-border capital flows.The rationale was clear. If capital were allowed to flow freely, it would hamper the
ability of governments to provide the various kinds of insurance that wasincreasingly being expected of them by their citizens, especially given the terriblestate of post-war government finances. Thus the argument for controlling capitalflows and the second-class status accorded to finance in the post-war economicorder. As Keynes was one of the architects of the Bretton Woods agreement, whichset the stage for the post-war international order. He said (cited in Helleiner, 1994,
R.G. Rajan, L. Zingales / Journal of Financial Economics 69 (2003) 5–5038

p. 164): ‘‘Not merely as a feature of the transition but as a permanent arrangement,the plan accords every member government the explicit right to control all capitalmovements. What used to be heresy is now endorsed as orthodoxy.’’This should be contrasted with the general desire of countries after World War I to
return to the Gold Standard and thus reduce barriers to capital flow. If openness totrade is, by itself, insufficient to force financial development, then the restrictions oncapital movements after WWII can explain why financial markets did not take offeven though trade expanded. After all, they recovered rapidly after WWI. Eventhough the toll taken by the wars was admittedly very different, an important part ofthe explanation must be that there was no Bretton Woods after World War Iendorsing capital controls.
4.6.3. The end of capital controls
The breakdown of the Bretton Woods system (e.g., Eichengreen, 1996, for a lucidexposition of the causes), led to the dismantling of capital controls, and could havebeen the precipitating factor for financial development across the world. Startingwith the Euromarkets, spreading to the United States, and then moving to Europeand Japan, cross-border capital flows went from a trickle to a torrent. Accounts ofthe process by which this happened suggest that the cross-border flows increaseddespite, rather than because of, the efforts of domestic interest groups (e.g.,Helleiner, 1994). Given the growing volume of trade, it was simply too difficult tocontrol the potential leakage of capital, especially when there were countries abroadwhere the money could be deposited.By the end of the 1980s, controls had effectively been removed throughout western
Europe, Scandinavia, and Japan. The competition generated by trade and freeinternational capital movements forced a modernization of the financial system anda progressive withdrawal of the State from the economy, through privatization in theindustrial and banking sectors. This then would explain the other leg of the reversal.Before we go further, let us take a look at two case studies.
4.7. The case of Japan
Japan, as our data suggest, was making rapid strides to developing a strongfinancial sector before World War I. Until 1918, there were no restrictions on entryinto banking, provided minimum capital requirements were met. There were over2,000 banks in 1920. The five large Zaibatsu (translated as financial cliques) banksaccounted for only 20.5% of the deposits before the war, and there were many smallbanks. (Aoki et al., 1994; Hoshi and Kashyap, 2001).As a result of increased competition in the post-World War I years and the Great
Tokyo Earthquake in 1923, which caused damage estimated at an incredible 38% ofGDP, more and more banks became troubled. This gave the government the excuseto enact regulations promoting mergers in the name of stability. By 1945, there wereonly 65 banks, and the share of Zaibatsu banks in total deposits had increased to45.7%. (Aoki et al., 1994).
R.G. Rajan, L. Zingales / Journal of Financial Economics 69 (2003) 5–50 39

At the same time as the banking system was becoming more concentrated, thegovernment’s control over it was increasing. This became especially pronounced asthe government sought to direct funds towards supplying the war against China in1937. With the Temporary Fund Adjustment Act in 1937 and the Corporate ProfitsDistribution and Fund Raising Act in 1939, the government, through the IndustrialBank of Japan, assumed control of financing. All security issuances and lendingdecisions above a certain amount had to be approved by the government, and thosethat were not related to the war effort were typically not approved. Further Actssimply strengthened the government’s control and this culminated in the designatedlending system by which each munitions company was designated a major bankwhich would take care of all its credit needs. By the end of the war, the bankingsystem was not only concentrated, but well and truly under the control of thegovernment.The accompanying demise of the arm’s length financial markets was aided and
abetted by the banks. In 1929, 26% of the liability side of large Japanese firm balancesheets consisted of bonds while only 17% was bank debt (see Teranishi, 1994). Asbond defaults increased as a result of the earlier crisis and depression, a group ofbanks together with trust and insurance companies seized on the poor economicconditions to agree in 1931 to make all subsequent bond issues secured in principle.This immediately made it harder for their clients to issue public debt. With theacquiescence of the Ministry of Finance, the agreement was formalized in 1933through the formation of a Bond Committee. The Committee determined whichfirms could issue bonds, on what terms, and when. All bonds were required to becollateralized, and banks were to serve as trustees for the collateral in exchange for asubstantial fee. Giving banks the responsibility for determining firms’ right to accessthe public bond markets was like giving a fox who resided in a chicken coop the rightto determine which chickens could leave. Hoshi and Kashyap (2001) add furthersupport to the claim that this was a cartel by the observation that security housesthat were not part of the 1931 agreement started competing fiercely for underwritingbusiness and continued to underwrite unsecured bonds. Thus the market itself didnot appear to develop a distaste for unsecured bonds. The obvious outcome was thata flourishing bond market was killed off. By 1936, bonds were down to 14% whilebank debt was up to 24% of the liability side. By 1943, 47 percent of liabilities werebank debt while only 6% were bonds.Japan illustrates yet another point. Entrenched hierarchies have the power to
defend themselves. For example, despite their best efforts to break up bank-firmestablished during the period of militarization, the post-war American occupyingforces could not prevent them re-emerging as the Keiretsu or main bank system (e.g.,Hoshi and Kashyap (2001), though see Miwa and Ramseyer (2002) who suggest acontrary view that Keiretsus are fiction). Similarly, the Bond Committee, set upostensibly to improve the quality of bond issuance during the Depression, surviveduntil the 1980s. Even as Japanese industrial firms invaded the rest of the world in the1970s, their bond markets remained miniscule, and Hitachi, an AA credit, wasdenied the ability to issue unsecured bonds. It was only in the early 1980s, asJapanese firms decided to borrow abroad in the Euromarkets rather than depend on
R.G. Rajan, L. Zingales / Journal of Financial Economics 69 (2003) 5–5040

their antiquated financial system that Japanese banks had to loosen theirstranglehold. The powers of the bond committee were eventually curtailed, not bya far-seeing government, but by the forces of outside competition.
4.8. Why not the United States?
As with any large sample study, there are exceptions. The United States undertooka variety of market-friendly actions including passing legislation requiring greaterdisclosure in financial markets, setting up the Securities and Exchange Commission,and passing the Glass Steagall Act, which brought more competition amongfinancial institutions by breaking up the universal banks. Was the United States anexception to the trend at this time?First, it is possible to overstate the extent to which the legislation was market
friendly. The National Recovery Administration, which was set up under the NewDeal, sought to fix prices in industry in order to eliminate ‘‘ruinous’’ competition,while Regulation Q attempted to do the same thing in the banking sector. The USgovernment defaulted on the Gold Clause to the detriment of creditors, and thesanctity of contracts (e.g., Kroszner, 1999). Markets and competition were notseriously affected in the long run. This was not for the want of effort by the NewDeal politicians. But legislative zeal in the United States was also tempered by checksimposed by the judiciary, a characteristic of Common Law countries (though it wasthe independent judiciary rather than Common Law that was the source of thecheck). Roosevelt’s primary method of intervention, the National RecoveryAdministration, was declared unconstitutional by the Supreme Court (Kennedy,1999, p. 328). When the Supreme Court eventually became more pliant after threatsto pack its bench with government supporters, Congress became more nervous aboutgrowing executive powers, and growing threats to property, and became the mainobstacle to proposed New Deal legislation (Kennedy, 1999, p. 341).Checks and balances are not sufficient to explain the pro-market legislation. Of
course, the legislation was not as pro-market as it is often made out to be. Mahoney(2001) argues that the ostensibly pro-market and pro-competitive Securities Act of1933 and the Glass Steagall Act, were really protection in disguise for establishedinvestment bankers. Various aspects of the Securities Act reduced price competitionamong investment bankers, while the Glass Steagall Act forced commercial banksout of the underwriting business. Mahoney provides evidence that the Securities Actincreased concentration in the underwriting business.Nevertheless, even if private interests were at work, the United States did not go
the way of Japan. In part, the private interests were more fragmented. Investmentbanks did not see eye to eye with commercial banks, nor did large banks formcommon cause with small banks. The variety of conflicting private interests and thevariety of political support they could count on at both the state and national level,more than any other factor, could have been the reason why outcomes in the UnitedStates were not more anti-competitive. There was no way markets could be closeddown without hurting some powerful faction in the financial sector.
R.G. Rajan, L. Zingales / Journal of Financial Economics 69 (2003) 5–50 41

So this then leaves us with the final question. Why were there so many differentgroups within the financial sector? Roe (1994) suggests an answer. He claims thatthere has always been an undercurrent of opposition in the United States to anyonegetting overly powerful in the financial sector. Whether it be the setting up of theFederal Reserve to undercut the power of JP Morgan, the Glass Steagall Act tocurtail the power of large universal banks, or the refusal of the Federal Reserve toact to save Drexel Burnham, the United States has managed to cut powerfulfinanciers down to size. Perhaps it was its ability to ensure even in normal times thatno small group of incumbents ever became really powerful that enabled the UnitedStates to pass through crisis relatively unscathed.
4.9. How does structure matter?
Since the work of La Porta et al. (1997, 1998), there has been some debate overwhy the legal origin of a country appears to matter so much for financial markets.Some suggest it reflects the inherent superiority of Common Law over Civil Law forfinancial transactions and investor protection. Others argue it matters because itreflects something about a country’s culture, religion, or politics (e.g., Acemoglu etal., 2001; Beck et al., 1999; Berglof and Von Thadden, 1999; La Porta et al., 1999;Rajan and Zingales, 1999; Stulz and Williamson, 2001).Our finding that financial markets in countries with a Civil Law system were not
less developed than those in countries with Common Law in 1913 and in 1929 butonly after World War II suggests a deeper look at the underlying mechanism for whylegal origin seems to matter.Rajan and Zingales (1999) argue that many complex legal constructs that first
emerged in Common Law, such as limited liability, were readily imitated by CivilLaw countries. In fact, they argue, when the government has a will, Civil Lawcountries have a greater ability to translate governmental policy into law becauselaws emanate from the center rather than evolving through judicial decisions. Privateinterests therefore have a greater chance of seeing their agenda enacted in a CivilLaw country.One reason is simply that if the governance system is more centralized, it is easier
for small private interests to capture it. If, in addition, the legal system is importantfor validating and enforcing new policy, the Civil Law system is again easier tocapture. The focus of influence activity in a Civil Law country only has to be thelegislator. By contrast, the judiciary in a Common Law country can restrain a newpolitical climate, and because it is dispersed and subject to local influences, is lesseasy to capture.A second reason is that Common Law evolves at the periphery, and innovates
around legislative or administrative roadblocks set up by the center. In England, forinstance, after the Bubble Act placed constraints on the incorporation of limitedliability companies in 1720 (primarily to bolster the position of companies that werealready incorporated), Common Law courts continuously evolved their owninterpretation of which companies did not contravene the spirit of that law. It wasprecisely to overcome this ability of the judiciary to defy the will of the center that
R.G. Rajan, L. Zingales / Journal of Financial Economics 69 (2003) 5–5042

Napoleon introduced the Civil Code as a way to prevail over judges still loyal to theAncien Regime.In summary, in a Civil Law country, it is easier for a small group representing
private interests, such as large incumbent industrialists and financiers to influence theimplementation of friendly policies. This need not be all bad. When these privateinterests are aligned with the national interests, good policy can also be implementedquickly. But when interests are misaligned, matters can become much worse.Empirically, this would suggest that Civil Law countries went further in repressingfinancial markets when borders closed down (explaining the La Porta et al. findingsin the mid-1990s), but have also begun developing them again as borders haveopened up again in recent years (explaining the convergence seen in the most recentdata). In summary, structure might matter, not so much in directly favoring ordisfavoring financial development, but in filtering the impact of interest groups andthe forces that affect their incentives.The data seem to support this view. In Table 11 Columns (i) and (ii) regress the
change in the stock market capitalization for a country between 1913 and thebreakdown of Bretton Woods (1970) against the changes in its per-capita income inconstant dollars and an indicator for Civil Law. Both when we compute change as achange in level and as a change in percentage, the coefficient estimate for the CivilLaw indicator is strongly negative, suggesting that stock markets in Civil Lawcountries did indeed fall by more over the period of the reversal. In Columns (iii) and(iv), the dependent variable is the change in stock market capitalization for a countrybetween the beginning of Bretton Woods’s breakdown (1970) and the end of oursample period (1999). In this case, the coefficient estimate for the Civil Law indicatoris strongly positive, suggesting that stock markets in Civil Law countries did indeedrecover by more in recent times.While certainly not a test, this evidence suggests that structure may have been
found to matter for financial development in recent papers because Civil Lawsystems can have more exaggerated reactions to changes in private interests. Arelated finding is that a country’s cultural heritage plays the strongest role when thecountry is shielded from foreign competition and private interests can reignunhindered. Stulz and Williamson (2001) find that the correlation between creditorrights and religion weakens when a country is more open to trade. If we comparesystems at a time of transition, we come away with the impression that structure hasa strong influence on levels of development even though it has more of an influenceon rates of change.
4.10. Related literature
Our view that institutional differences between countries serve to modify theimpact of private interests offers a different view of convergence across countriesthan Coffee (2000). In his view, financial development will take place throughchanges in practices when a constituency emerges that demands it. Much later, theformal legal system will adapt to reflect these demands. Thus he attributes theconvergence to Anglo-Saxon norms of corporate governance practices in continental
R.G. Rajan, L. Zingales / Journal of Financial Economics 69 (2003) 5–50 43

Europe to the privatization in the 1980s, which created a constituency of minorityshareholders. We differ primarily in that we attribute a strong role to privateinterests (not just for, but also against, development) and potentially, a role forstructure in modifying the influence of private interests.Before concluding this section, we must note two other explanations for the
reversals. Roe (1999) suggests that corporations in continental Europe became moreclosely held because of the potential for higher agency costs there as a result of pro-labor legislation passed in the 1920s and 1930s. This diminished the size of publicmarkets. While we do believe that the shrinkage of public equity markets and thepassage of pro-labor legislation were coincident in some countries, his theory doesnot account for the greater government intervention and cartelization witnessed inmany countries, or for the demise of corporate bond markets in some.Pagano and Volpin (2000) develop a model in which entrepreneurs, who have
already raised finance, want low investor protection (so as to indulge in privatebenefits) and get the support of workers by promising them high employmentprotection. This model of incumbent interests (entrepreneurs who already havefinance) is similar to ours. It suggests a different explanation for the correlation Roefinds by saying that incumbent industrialists bribed workers with pro-workerlegislation to go along with anti-finance legislation. Our emphasis on openness as amodifying influence is different, and it helps us explain both pro-market and anti-market legislation.
Table 11
Openness and legal system over time
In the first two columns the dependent variable is the change in the ratio of equity market capitalization to
gross domestic product between 1913 and 1970 (in the first column, it is the absolute change, in the second,
the % change). In the next two columns the dependent variable is the change in the ratio of equity market
capitalization to gross domestic product between 1970 and 1999 (in the third column, it is the absolute
change, in the fourth the % change). In the first two columns the proxy for the change in the demand for
finance is the change in the index of industrialization for that country in that year as computed by Bairoch
(1982) divided by 1000. In the next two columns the proxy for the change in demand for finance is the
change in the logarithm of the per-capita GDP in PPP dollars as reported in the World Development
Indicators. The indicator for Civil Law is one in countries with Civil Law and is zero otherwise. All
regressions include calendar year indicators. The standard errors, which are corrected for possible
clustering of the residual at a country level, are in parentheses. (*) indicates significance at the 10% level,
(**) at the 5% level, (***) at the 1% level.
Change in stock market
capitalization/GDP over the
1913–1970 period
Change in stock market
capitalization/GDP over the
1970–1999 period
Changes in level Percent change Changes in level Percent change
Change in demand for finance 0.655 �2.270** �0.398 �3.650(0.792) (1.063) (1.014) (3.687)
Civil law indicator �0.745*** �1.551*** 0.762* 3.207**
(0.165) (0.221) (0.393) (1.428)
R2 0.57 0.77 0.10 0.16
Observations 16 16 18 18
R.G. Rajan, L. Zingales / Journal of Financial Economics 69 (2003) 5–5044

5. Conclusion
We see four contributions of this work. The first is to show the reversal in financialmarkets, a finding inconsistent with pure structural theories of financial marketdevelopment. The second is to add a new fact, which is that trade openness iscorrelated with financial market development, especially when cross-border capitalflows are free. The third is to argue that these findings are consistent with interestgroup politics being an important factor in financial development across countries.The last is to suggest that a county’s institutions might slow or speed-up interestgroup activities. This might indicate that institutions matter, though the way theymatter might primarily be in tempering interest group activities.If our understanding of the impediments to financial development is correct, then
it suggests that the exhortations by international development institutions tocountries to develop institutions to aid economic growth are not be enough. It is notthat the cognoscenti in developing countries are not aware that the country needsgood institutions, it is simply that too many interests will lose out if the institutionsare developed (e.g., Olson, 1982). More emphasis needs to be placed on establishingpolitical pre-conditions for institutions.More thought has to be given then to how interest groups can be reined in.
Openness clearly will help. Policies that tend to promote efficient, competitiveindustries rather than inefficient, rent-seeking ones will also tend to pave the way forinstitutional development, as will public awareness of the hidden costs of policiesthat ostensibly promote economic stability. Finally, insurance schemes that willsoften the impact of economic adversity on individuals will help ward off an anti-market reaction. How such policies fit together clearly requires more thought andsuggests ample scope for further research. In further work, Rajan and Zingales(2003) provide a preliminary effort.
Appendix A. Important notes on data collection
A.1. Historical differences in reporting data
A formidable challenge, specific to the historical nature of our analysis, is thedifficulty in obtaining reliable sources for historical information about financialmarkets. Primary sources are often lost or inaccessible, while secondary sources arecontradictory or repeat uncritically the same primary sources. To further complicateour task, the type of information statisticians and governing bodies of stockexchanges were interested in at the beginning of the twentieth century seems quitedifferent from the ones we are interested in today (this seems a topic worthy of aseparate study). We discuss some of these differences because they help shed somelight on the different perceptions of the nature and role of financial instruments atthat time.A number that is often reported is the total nominal value of securities
outstanding in a country. This joins together not only stocks and corporate bonds,
R.G. Rajan, L. Zingales / Journal of Financial Economics 69 (2003) 5–50 45

but also Government bonds, making the number difficult to interpret. The clubbingof information on corporate bonds and stocks, which is pervasive even in the UnitedKingdom, probably the most sophisticated financial market at that time, reflects thesimilarity of these two instruments at that time. The use of preferred stock paying afixed dividend was widespread. Also, common stock paid very high dividends,making them more similar to bonds. One consequence of the high dividend payoutratio was that most stocks traded fairly closely to their nominal value. In fact, stockprices in many countries were quoted as a percentage of their nominal value. Thus,even from an investor’s point of view, bonds and stocks were perceived as very closesubstitutes.A second problem is that the official statistics at the beginning of the twentieth
century report the total universe of corporations existing at that time, rather then thesubset of those that are publicly traded. To make the numbers more comparableacross time, we classify companies as publicly traded only if the firm is quoted duringthe year. Even with this requirement, we may still have very infrequently traded stock.A final problem comes from the existence of regional exchanges. At the beginning
of the century, not only was trading more fragmented across exchanges, but so waslisting. For example, the Banco do Brazil is listed in the Rio Stock Exchange but notin San Paulo. Companies listed only in Osaka represent a considerable portion of thetotal companies listed in Japan. Most extreme is Germany, probably as aconsequence of the delayed political reunification. In 1913 Germany had ninemajor stock exchanges and Berlin represented only about 50% of the totalcapitalization.Data for regional (or secondary) stock exchanges are especially challenging.
Since many have disappeared or have been absorbed by the main exchange, theytend not to be well documented. We try, as best as possible, to reconstruct ameasure that includes all the major stock exchanges, eliminating double listing.When this is not possible for the date of interest, we compute the ratio of thecapitalization of the secondary exchanges to main exchange at the earliest dateavailable and then use this ratio to extrapolate backwards the value of theseexchanges. Since the importance of regional exchanges has gone down over time, thisprocedure clearly biases downwards the estimate of the total stock marketcapitalization in countries with fragmented stock markets. This should be kept inmind in the analysis.
A.2. Stock market capitalization and number of companies listed
Our starting point was the official publication of the stock exchanges as well asthose of the Federation Internationale des Bourses Valeurs (FIBV). These provideextensive information only starting in 1980. Official publications of individual stockexchanges often go back only to WWII. When these are not available, we useinformation contained in private guides to stock exchanges. Only for Japan and theUnited States did we find official publications before WWII.To assess the importance of the equity market in 1913 we rely on two approaches.
Whenever possible we secure a copy of a stock exchange handbook in 1913 (or the
R.G. Rajan, L. Zingales / Journal of Financial Economics 69 (2003) 5–5046

closest year before 1913). Using the handbook we identify the number of domesticcompanies listed, the number of shares of each company, and the price per share. Wethen compute the total stock market capitalization as the sum of the product of pricetimes the number of shares. We were able to do this for Australia, Brazil, Canada,Cuba, Denmark, Germany, Italy, Netherlands, Russia, Sweden, Switzerland, theUnited Kingdom, and the United States.A second source was various issues of the Bulletin of the International Institute of
Statistics (IIS). Starting in the late nineteenth century, statisticians from all over theworld met every year for a conference. This association formed a special group tocompute the importance of security markets in different countries. Unfortunately,many of the reports club together stocks and bonds but we do obtain somedisaggregate information for some countries.
A.3. Data on equity issues
Data on equity issues are relatively easier to get for the pre-WWII period than forthe period immediately after the war. For example, the League of Nations statisticsinclude this information, even though it is not contained in more modernpublications like the United Nations Statistics or the Financial Statistics of the
International Monetary Fund. This could reflect the greater importance attributed tothis information before World War II. When not available from official statistics, wegather this information from financial newspapers of that time such as theEconomist, Commercial and Financial Chronicle, Deutsche Oekonomiste, etc.
A.4. Data on deposits and national accounts data
Data on deposits, national income, and gross fixed-capital formation come fromMitchell (various issues). Mitchell’s data are available until the mid-1990s. Weextrapolate this to 1999 for deposits by using the growth rate of deposits from theIMF’s International Financial Statistics. For national accounts, we use the datafrom the NBER website whenever available. Post WWII national accounts datacome from the IMF’s International Financial Statistics. We indicate whenever datacome from a different source. A comprehensive data appendix is available onrequest.
References
Acemoglu, D., Johnson, S., Robinson, J., 2001. The colonial origins of comparative development: an
empirical study. American Economic Review 91, 1369–1401.
Aoki, M., Patrick, H., Sheard, P., 1994. The Japanese main bank system: introductory overview. In: Aoki,
M., Patrick, H. (Eds.), The Japanese Main Bank System: Its Relevance for Developing and
Transferring Economies. Oxford University Press, New York, pp. 3–50.
Bairoch, P., 1982. International industrialization levels from 1750 to 1980. Journal of European Economic
History 11, 269–334.
R.G. Rajan, L. Zingales / Journal of Financial Economics 69 (2003) 5–50 47

Bairoch, P., 1989. European trade policy, 1815–1914. In: Mathias, P., Pollard, S. (Eds.), The
Cambridge Economic History of Europe, Vol. VIII. Cambridge University Press, Cambridge,
England.
Bebchuk, L., Roe, M., 1999. A theory of path dependence in corporate ownership and governance.
Stanford Law Review 52, 127–170.
Beck, T., Demirguc-Kunt, A., Levine, R., 1999. A new database on financial development and structure.
Unpublished Working Paper 2784. The World Bank, Washington.
Becker, G., 1983. A theory of the competition among pressure groups for political influence. The
Quarterly Journal of Economics 98, 371–400.
Bencivenga, V., Smith, B., 1991. Financial intermediation and endogenous growth. Review of Economic
Studies 58, 195–209.
Berglof, E., Von Thadden, E.L., 1999. The changing corporate governance paradigm: implications for
transition and developing countries. Unpublished working paper. Stockholm School of Economics,
Stockholm, Sweden.
Cameron, R., 1961. France and the Economic Development of Europe, 1800–1914. Princeton University
Press, Princeton, NJ.
Choe, H., Masulis, R., Nanda, V., 1993. Common stock offerings across the business cycle: theory and
evidence. Journal of Empirical Finance 1, 3–31.
Coffee, J., 2000. Convergence and its critics: what are the preconditions to the separation of ownership and
control? Unpublished working paper, Columbia University, New York.
Demirguc-Kunt, A., Maksimovic, V., 1998. Law, finance, and firm growth. Journal of Finance 53,
2107–2138.
Djankov, S., La Porta, R., Lopez-de-Silanes, F., Shleifer, A., 2002. The regulation of entry. Quarterly
Journal of Economics 117, 1–37.
Eichengreen, B., 1996. Globalizing Capital: A history of the international monetary system. Princeton
University Press, Princeton, NJ.
Frankel, J.A., Romer, D., 1999. Does trade cause growth? American Economic Review 89, 379–399.
Gourevitch, P., 1986. Politics in Hard Times: Comparative Responses to International Economic Crises.
Cornell University Press, Ithaca, NY.
Greenwood, J., Jovanovic, B., 1990. Financial development, growth, and the distribution of income.
Journal of Political Economy 98, 1076–1107.
Guiso, L., Sapienza, P., Zingales, L., 2000. The role of social capital in financial development.
Unpublished working paper 7563, NBER, Cambridge, MA.
Haber, S., 1997. Financial markets and industrial development. A comparative study of government
regulation, financial innovation, and industrial structure in Brazil and Mexico, 1840–1930. In:
Haber, S. (Ed.), How Latin America Fell Behind: Essays on the Economic Histories of Brazil and
Mexico. Stanford University Press, Stanford, CA, pp. 1800–1914.
Helleiner, E., 1994. From Bretton Woods to global finance: a world turned upside down. In: Stubbs, R.,
Underhill, G. (Eds.), Political Economy and the Changing Global Order. Oxford University Press,
Toronto, pp. 244.
Hellwig, M., 2000. On the economics and politics of corporate finance and corporate control. In: Vives, X.
(Ed.), Corporate Governance: Theoretical and Empirical Perspectives. Cambridge University Press,
Cambridge, England, pp. 95–136.
Henry, P.B., 2000. Stock market liberalization, economic reform, and emerging market equity prices.
Journal of Finance 55, 529–564.
Holmen, M., Hogfeldt, P., 2000. A law and finance analysis of initial public offerings. Unpublished
working paper, University of Chicago.
Hoshi, T., Kashyap, A., 2001. Corporate Finance and Government in Japan. M.I.T. Press, Cambridge,
MA.
Jayaratne, J., Strahan, P.E., 1996. The finance-growth nexus: evidence from bank branch deregulation.
Quarterly Journal of Economics 111, 639–670.
Jensen, M., 1991. Corporate control and the politics of finance. Continental Bank Journal of Applied
Corporate Finance 4, 13–33.
R.G. Rajan, L. Zingales / Journal of Financial Economics 69 (2003) 5–5048

Johnson, S., McMillan, J., Woodruff, C., 2000. Courts and relational contracts. Unpublished working
paper, M.I.T, Cambridge, MA.
Katzenstein, P., 1985. Small States in World Markets: Industrial Policy in Europe. Cornell University
Press, Ithaca, NY.
Kennedy, D., 1999. Freedom from fear: The American people in depression and war, 1929–1945. In:
Oxford History of the United States. Oxford University Press, New York.
Kennedy, W., 1989. Industrial Structure, Capital Markets, and the Origins of British Economic Decline.
Cambridge University Press, Cambridge, England.
King, R., Levine, R., 1993. Finance and growth: schumpeter might be right. The Quarterly Journal of
Economics 108, 681–737.
Kroszner, R., 1999. Is it better to forgive than to receive? Evidence from the abrogation of gold indexation
clauses in long-term debt during the Great Depression, Unpublished working paper. The University of
Chicago, Chicago.
Kroszner, R., Strahan, P., 1999. What drives deregulation? Economics and politics of the relaxation of
bank branching restrictions. Quarterly Journal of Economics 114, 1437–1467.
La Porta, R., Lopez-de-Silanes, F., Shleifer, A., Vishny, R., 1997. The legal determinants of external
finance. Journal of Finance 52, 1131–1150.
La Porta, R., Lopez-de-Silanes, F., Shleifer, A., Vishny, R., 1998. Law and finance. Journal of Political
Economy 106, 1113–1155.
La Porta, R., Lopez-de-Silanes, F., Shleifer, A., Vishny, R., 1999a. The quality of government. Journal of
Law, Economics, and Organization 15, 222–279.
La Porta, R., Lopez-de-Silanes, F., Shleifer, A., Vishny, R., 1999b. Investor protection: origins,
consequences, and reform. Unpublished Working Paper 7428, NBER, Cambridge, MA.
Loriaux, M., 1997. Capital Ungoverned. Cornell University Press, Ithaca, NY.
Mahoney, P. G., 2001. The political economy of the Securities Act of 1933. Journal of Legal Studies 30.
Maier, C., 1987. In Search of Stability. Cambridge University Press, Cambridge, England.
Mitchell, B., 1995. International Historical Statistics. Stockton Press, London.
Miwa, Y., Ramseyer, J.M., 2002. The myth of the main bank: Japan and comparative corporate
governance. Law and Social Inquiry 27, 401–424.
Morck, R., Strangeland, D., Yeung, B., 2000. Inherited wealth, corporate control, and economic growth:
the canadian disease? In: Morck, R.K. (Ed.), Concentrated Capital Ownership. University of Chicago
Press, Chicago.
Olson, M., 1965. The Logic of Collective Action. Harvard University Press, Cambridge, MA.
Olson, M., 1982. The Rise and Decline of Nations: Economic growth, Stagflation, and Social Rigidities.
Yale University Press, New Haven.
O’Rourke, K., Williamson, J., 1999. Globalization and History: The Evolution of a Nineteenth Century
Atlantic Economy. MIT. Press, Cambridge, MA.
Pagano, M., Volpin, P., 2000. The political economy of corporate governance. Unpublished working
paper, Harvard University, Cambridge, MA.
Petersen, M., Rajan, R., 1995. The effect of credit market competition on lending relationships. Quarterly
Journal of Economics 110, 407–443.
Rajan, R., Zingales, L., 1998a. Financial dependence and growth. The American Economic Review 88,
559–586.
Rajan, R., Zingales, L., 1998b. Which capitalism? Lessons from the East Asia crisis. Journal of Applied
Corporate Finance 11, 40–48.
Rajan, R., Zingales, L., 1999. The politics of financial development. Unpublished working paper,
University of Chicago, Chicago.
Rajan, R., Zingales, L., 2003. Saving Capitalism from the Capitalists. Crown Business Division of
Random House, New York.
Roe, M., 1994. Strong Managers and Weak Owners: The Political Roots of American Corporate Finance.
Princeton University Press, Princeton, NJ.
Roe, M., 1999. Political preconditions to separating ownership from corporate control. Unpublished
working paper, Columbia Law School, New York.
R.G. Rajan, L. Zingales / Journal of Financial Economics 69 (2003) 5–50 49

Rogowski, R., 1989. Commerce and Coalitions: How Trade Affects Domestic Political Arrangements.
Princeton University Press, Princeton, NJ.
Rose, N., 1987. Labor rent sharing and regulation: evidence from the trucking industry. Journal of
Political Economy 95, 1146–1178.
Rosenbluth, F., 1989. Financial Politics in Contemporary Japan. Cornell University Press, Ithaca, NY.
Salinger, M., 1984. Tobin’s q, unionization, and the concentration-profits relationship. The Rand Journal
of Economics 15, 159–170.
Simon, C., 1989. The effect of the 1933 securities act on investor information and the performance of new
issues. American Economic Review 79, 295–318.
Stigler, G., 1971. The theory of economic regulation. Bell Journal of Economics and Management Science
2, 3–21.
Stulz, R., Williamson, R., 2001. Culture, openness, and finance. Unpublished Working Paper 8222,
NBER, Cambridge, MA.
Svaleryd, H., Vlachos, J., 2002. Market for risk and openness to trade: how are they related? Journal of
International Economics 57, 369–395.
Sylla, R., Smith, G., 1995. Information and capital market regulation in Anglo-American finance. In:
Bordo, M., Sylla, R. (Eds.), Anglo-American Financial Systems: Institutions and Markets in the
Twentieth Century. Irwin Publishers, Burr Ridge, IL.
Tanzi, V., Schuknecht, L., 2000. Public Spending in the twentieth century: a global perspective. Cambridge
University Press, Cambridge, England.
Taylor, A., 1998. Argentina and the world capital market: saving, investment, and international capital
mobility in the Twentieth Century. Development and Economics 57, 147–184.
Teranishi, J., 1994. Loan syndication in war-time Japan and the origins of the main bank system. In: Aoki,
M., Patrick, H. (Eds.), The Japanese Main Bank System: Its Relevance for Developing and
Transferring Economies. Oxford University Press, New York.
Tilly, R., 1992. An overview of the role of large German banks up to 1914. In: Cassis, Y. (Ed.), Finance
and Financiers in European History 1880–1960. Cambridge University Press, Cambridge, England.
Weber, K., Davis, G., 2000. The global spread of stock exchanges 1980–1998. Unpublished working
paper, University of Michigan.
Wei, S., 2000. Natural openness and good government. Unpublished Working Paper 7765, NBER,
Cambridge, MA.
R.G. Rajan, L. Zingales / Journal of Financial Economics 69 (2003) 5–5050