Embed Size (px)
Citation preview

S-036 (10/2008) 12122018.1711 Page 1 of 1
2019 Regular Session The Florida Senate
COMMITTEE MEETING EXPANDED AGENDA
APPROPRIATIONS SUBCOMMITTEE ON EDUCATION
Senator Stargel, Chair
Senator Diaz, Vice Chair
MEETING DATE: Wednesday, December 12, 2018
TIME: 1:30—3:00 p.m. PLACE: Pat Thomas Committee Room, 412 Knott Building
MEMBERS: Senator Stargel, Chair; Senator Diaz, Vice Chair; Senators Baxley, Book, Flores, Montford, Pizzo, and Simmons
TAB BILL NO. and INTRODUCER BILL DESCRIPTION and
SENATE COMMITTEE ACTIONS COMMITTEE ACTION
1
Introduction of Members and Staff
Discussed
2
Subcommittee Overview
Presented
3
Member Discussion
Other Related Meeting Documents

No Meeting
Materials Available

Appropriations Subcommittee on Education
Overview
1

Overview
• Budgets within Education
• Education Funding Summary
• Historical Student Enrollment and Funding for the Major Education Systems
2

3
PreK‐12 Budgets
• Early Learningo School Readiness Programo Voluntary Prekindergarten Program
• Florida Education Finance Program (FEFP) – Public School Funding
• Non‐FEFP Programs ‐ major issues include Best and Brightest Program, Gardiner Scholarship, Schools of Hope, Reading Scholarship, Feis Guardian Program, and the Florida School for Deaf and Blind
• Education Media and Technology (public broadcasting)
• Federal Programs
• State Board of Education (includes assessment budget)

4
Higher Education Budgets
• District Workforce (school district tech centers)• Florida Colleges• State Universities • Student Financial Assistance (state and federal)• Private Colleges and Universities (includes EASE and ABLE)
• Vocational Rehabilitation and Blind Services• Board of Governors

Education Funding Summary
5

Total Education Funds by Policy Area2018‐19 Appropriations
(Includes local funds – no FCO)
Percent of Total
Public Schools70%
Public Schools Workforce
2%
Community Colleges
6%
State Universities
15%
Student Financial Aid
2%
Early Learning3%
Other Education
2%
Total
Public Schools $23,661,191,650
State Universities $5,080,830,300
Colleges $2,019,035,258
Early Learning $1,089,445,026
Student Financial Aid $841,225,298
Other Education $717,341,495
Workforce Education $526,940,868
Total $33,936,009,895
6

Total Fixed Capital Outlay (FCO) Funds by Policy Area2018‐19
Sector/Entity State Sources Local Sources1,2 Total
Public Schools $267,619,236 $4,035,135,934 $4,302,755,170
Charter Schools $156,640,632 $156,640,632
State Universities $159,783,259 $58,323,679 $218,106,938
Colleges $78,535,725 $98,462,906 $176,998,631
District Workforce $1,250,000 $1,250,000
Other $12,146,661 $12,146,661
7
1 School district local funds include revenues from local ad valorem, ½ or 1 cent Sales Surtax, and Impact Fees2 College and university local funds include the latest estimated revenues from capital improvement fees.
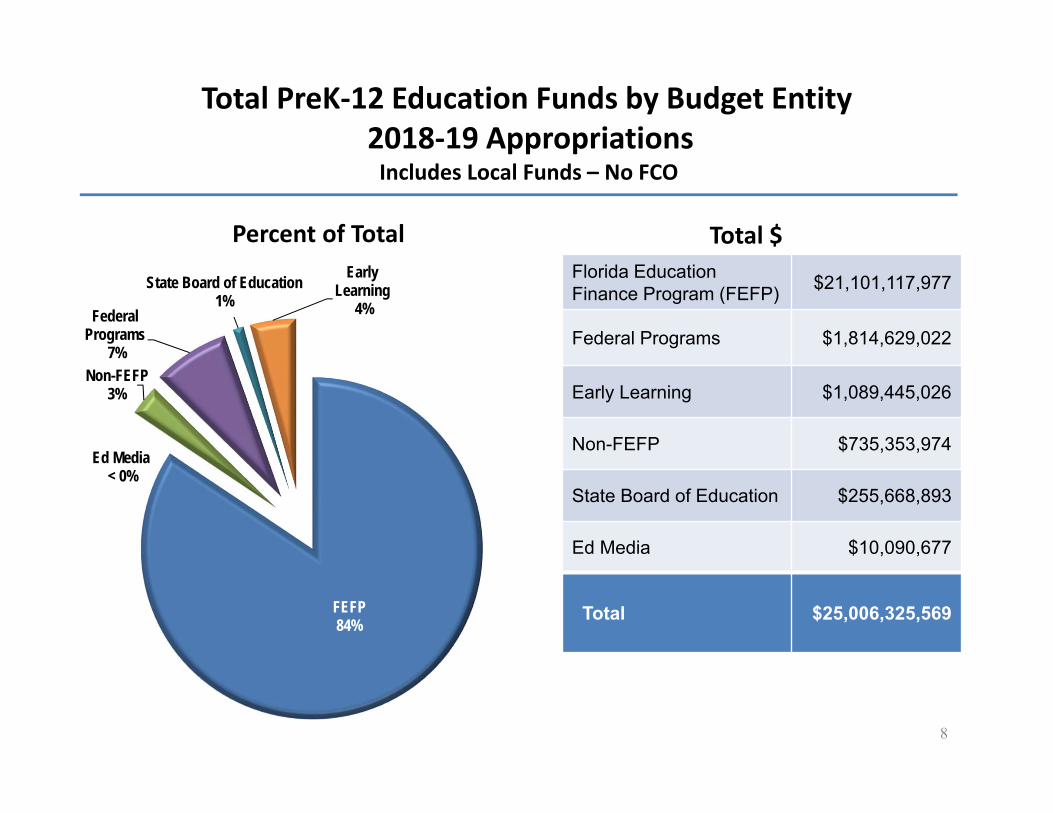
Total PreK‐12 Education Funds by Budget Entity2018‐19 AppropriationsIncludes Local Funds – No FCO
Percent of Total
FEFP84%
Ed Media< 0%
Non-FEFP3%
Federal Programs
7%
State Board of Education1%
Early Learning
4%
Total $Florida Education Finance Program (FEFP) $21,101,117,977
Federal Programs $1,814,629,022
Early Learning $1,089,445,026
Non-FEFP $735,353,974
State Board of Education $255,668,893
Ed Media $10,090,677
Total $25,006,325,569
8

PreK‐12 Education Funds• State Funds (53%)
– General Revenue– Educational Enhancement Trust Fund (lottery and gaming)– State School Trust Fund (abandoned property)– Fee‐supported trust funds
• Federal Funds (10%)– Title I (for Economically Disadvantaged)– Individuals with Disabilities Education Act (IDEA)– Child Care Development Fund (CCDF for School Readiness)– Other federal funds (including funds for Principal and Teacher Training; English
Language Acquisition; and Assessments)
• Local Funds (37%)– FEFP local funds (Required and Discretionary Local Effort)
9

Total Higher Education Funds by Policy Area2018‐19 Appropriations
(Includes local funds – no FCO)
Percentage of Total
State Universities57%
Community Colleges23%
Workforce Education
6%
Student Financial Aid9%
Private Colleges
3%
Vocational Rehabilitation
2%
Blind Services
1% Board of Governors
0%
Total $
State Universities $5,080,830,300
Community Colleges $2,019,035,258
Student Financial Aid $841,225,298
Workforce Education $526,940,868
Vocational Rehabilitation $224,615,860
Private Colleges $169,095,325
Blind Services $58,384,960
Board of Governors $9,556,457
Total $8,929,684,326
10

Higher Education Funds
• State Funds (65%)– General Revenue– Educational Enhancement Trust Fund (lottery and gaming)– Fee-supported trust funds
• Federal Funds (4%)– Federal Rehabilitation Trust Funds– Other federal funds
• Local Funds (31%)– Student tuition and fees
11

Historical Funding And Student Enrollment Information ‐Early Learning Programs
12

2018-19 Early LearningAppropriations
Percent of Total
Voluntary PreK37%
School Readiness
61%
Admin & Support
2%Total $
Voluntary Prekindergarten $398,444,762
School Readiness $666,711,185
Admin/Support $24,289,079
Total $1,089,445,026
13

2009-10 2010-11 2011-12 2012-13 2013-14 2014-15 2015-16 2016-17 2017-18 2018-19
FTE 142,435 150,356 159,435 158,509 155,311 151,742 154,424 154,271 153,871 157,419
Voluntary PrekindergartenFunding (Millions) & FTE
$379.80$398.70 $392.30 $390.87 $381.46 $383.70 $388.76 $389.89 $396.81 $398.44
2009-10 2010-11 2011-12 2012-13 2013-14 2014-15 2015-16 2016-17 2017-18 2018-19
State Funds FTE Enrollment
14

Voluntary PrekindergartenBase Student Allocation (BSA) History
$2,500
$2,560
$2,677
$2,575 $2,575 $2,562
$2,383 $2,383 $2,383
$2,437 $2,437 $2,437 $2,437 $2,437
School Year BSA
15
Summer BSA : 2008-09 & 2009-10 = $2,190; 2010-11 = $2,179; 2011-12 thru 2013-14 = $2,026; 2014-15 thru 2018-19 = $2,080

School Readiness Funding HistoryState and Federal $ in Millions
$146.87 $159.24 $157.96 $156.94 $157.04
$457.04 $472.85 $494.39 $507.73 $533.96
2014‐15 2015‐16 2016‐17 2017‐18 2018‐19
State Funds Federal Funds
$609.91$632.09
$664.67$652.35$691.00
16
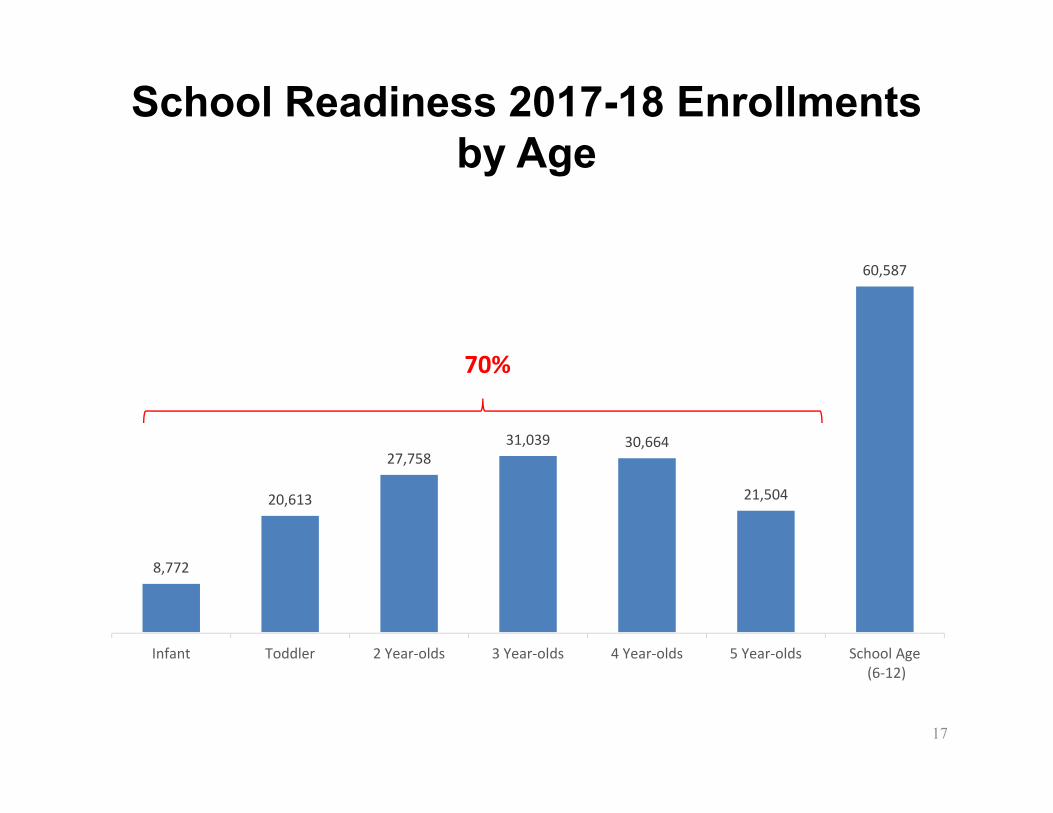
School Readiness 2017-18 Enrollments by Age
8,772
20,613
27,75831,039 30,664
21,504
60,587
Infant Toddler 2 Year‐olds 3 Year‐olds 4 Year‐olds 5 Year‐olds School Age (6‐12)
70%
17

Historical Funding And Student Enrollment Information ‐
Public Schools
18
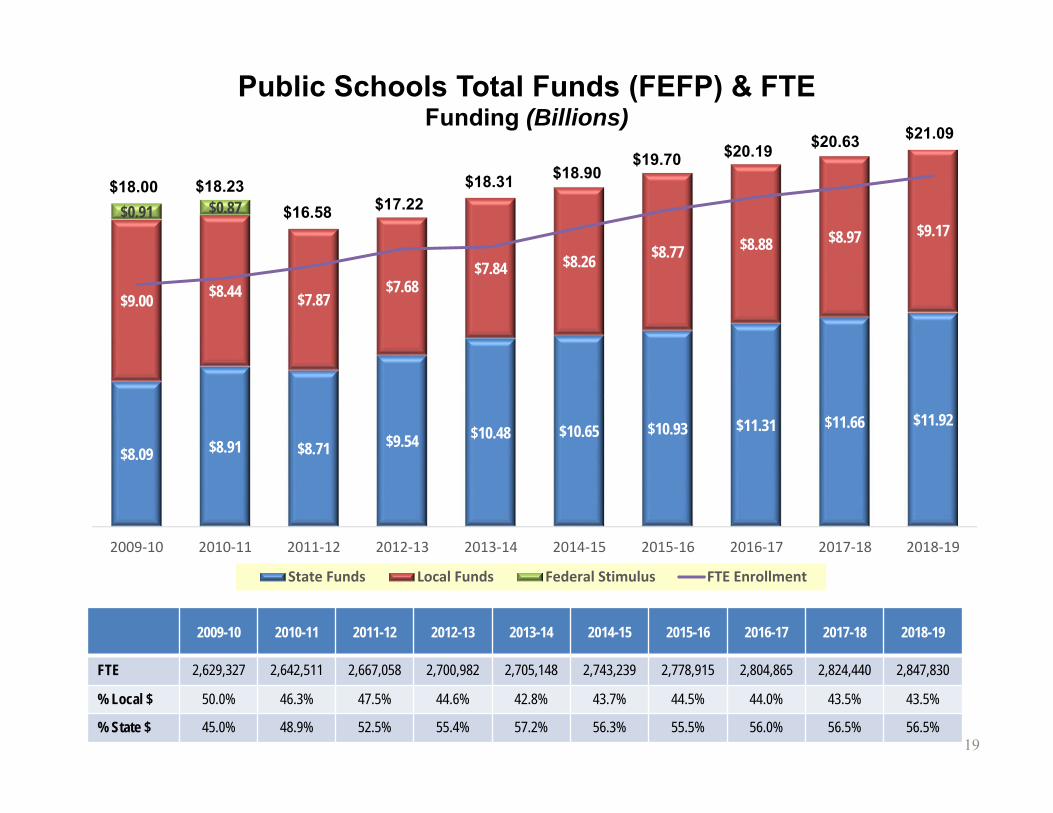
2009-10 2010-11 2011-12 2012-13 2013-14 2014-15 2015-16 2016-17 2017-18 2018-19
FTE 2,629,327 2,642,511 2,667,058 2,700,982 2,705,148 2,743,239 2,778,915 2,804,865 2,824,440 2,847,830
% Local $ 50.0% 46.3% 47.5% 44.6% 42.8% 43.7% 44.5% 44.0% 43.5% 43.5%
% State $ 45.0% 48.9% 52.5% 55.4% 57.2% 56.3% 55.5% 56.0% 56.5% 56.5%
Public Schools Total Funds (FEFP) & FTEFunding (Billions)
$8.09 $8.91 $8.71 $9.54 $10.48 $10.65 $10.93 $11.31 $11.66 $11.92
$9.00 $8.44 $7.87$7.68
$7.84 $8.26 $8.77 $8.88 $8.97 $9.17$0.91 $0.87
2009‐10 2010‐11 2011‐12 2012‐13 2013‐14 2014‐15 2015‐16 2016‐17 2017‐18 2018‐19
State Funds Local Funds Federal Stimulus FTE Enrollment
$18.90$19.70 $20.19 $20.63 $21.09
$18.00 $18.23$16.58 $17.22
$18.31
19

Public Schools Funds (FEFP) per FTE
$3,077 $3,371 $3,266 $3,534 $3,873 $3,881 $3,933 $4,032 $4,128 $4,186
$3,424 $3,196$2,952
$2,843$2,897 $3,010 $3,157 $3,165 $3,177 $3,221
$345 $330
2009‐10 2010‐11 2011‐12 2012‐13 2013‐14 2014‐15 2015‐16 2016‐17 2017‐18 2018‐19
State Funds Local Funds Fed Stimulus
$6,217 $6,377$6,769 $6,891
$7,090 $7,197 $7,305 $7,407
$6,897$6,847$330
20

Public Schools (FEFP) Funds per FTE Percent Increase (GAA)
0.41% 0.02%
-7.96%
2.41%
6.34%
2.61% 3.00%
1.00% 1.39% 1.39%
2009‐10 2010‐11 2011‐12 2012‐13 2013‐14 2014‐15 2015‐16 2016‐17 2017‐18 2018‐19
21

Public Schools (FEFP) Total Funds Increase in GAA ($ Millions)
$5.1 $111.3
($1,354.6)
$597.1
$1,054.5
$574.8
$779.9
$458.2 $455.0 $484.8
2009‐10 2010‐11 2011‐12 2012‐13 2013‐14 2014‐15 2015‐16 2016‐17 2017‐18 2018‐19
22

Public Schools Fixed Capital OutlayFunding (Millions)
Excludes Charter Schools and Lab Schools
2014‐15 2015‐16 2016‐17 2017‐18 2018‐19
PECO Maintenance & Repair $53.0 $50.0 $74.9 $49.9 $49.9
CO & DS (Motor Vehicle License $) $25.4 $30.1 $53.3 $66.0 $66.0
Special Facilities (Small Districts) $59.7 $80.9 $75.4 $50.8 $33.4
School Hardening Grants $88.5
Other $4.0 $.6 $9.3 $.3 $29.8
State $ Total $142.0 $161.6 $212.9 $167.1 $267.6
1.5 Mill Ad Valorem (less Charter School $) $2,156.3 $2,340.9 $2,509.7 $2,703.3 $2,886.3
Sales Surtax (School District or Municipal) $556.6 $621.6 $742.8 $813.0 $837.5
Impact Fees $251.4 $265.3 $329.7 $283.6 $311.3
Local $ Total $2,964.4 $3,227.8 $3,582.2 $3,799.9 $4,035.1
Grand Total $ $3,106.4 $3,389.4 $3,795.1 $3,967.0 $4,302.7
23

Non‐FEFP Budget Breakout2018‐19 Appropriations
Percent of Total
Best & Brightest32%
Schools of Hope 19%
Gardiner18%
School Guardians
9%
FSDB 7%
Mentoring & School Instr
9%
Teacher/Admin Support 2%
Exceptional Ed 3%
Reading Scholarship
1%
Program $
Best and Brightest Scholarship $233,950,000
Schools of Hope $140,000,000
Gardiner Scholarship Program $128,336,000
School Guardian Program $67,500,000
Mentoring/School & Instructional Enhancements $65,201,704
Florida School for the Deaf & Blind (FSDB) $53,508,999
Exceptional Education Grants $19,826,524
Teacher/Admin Support $17,030,747
Reading Scholarship $10,000,000
Total $735,353,974
24
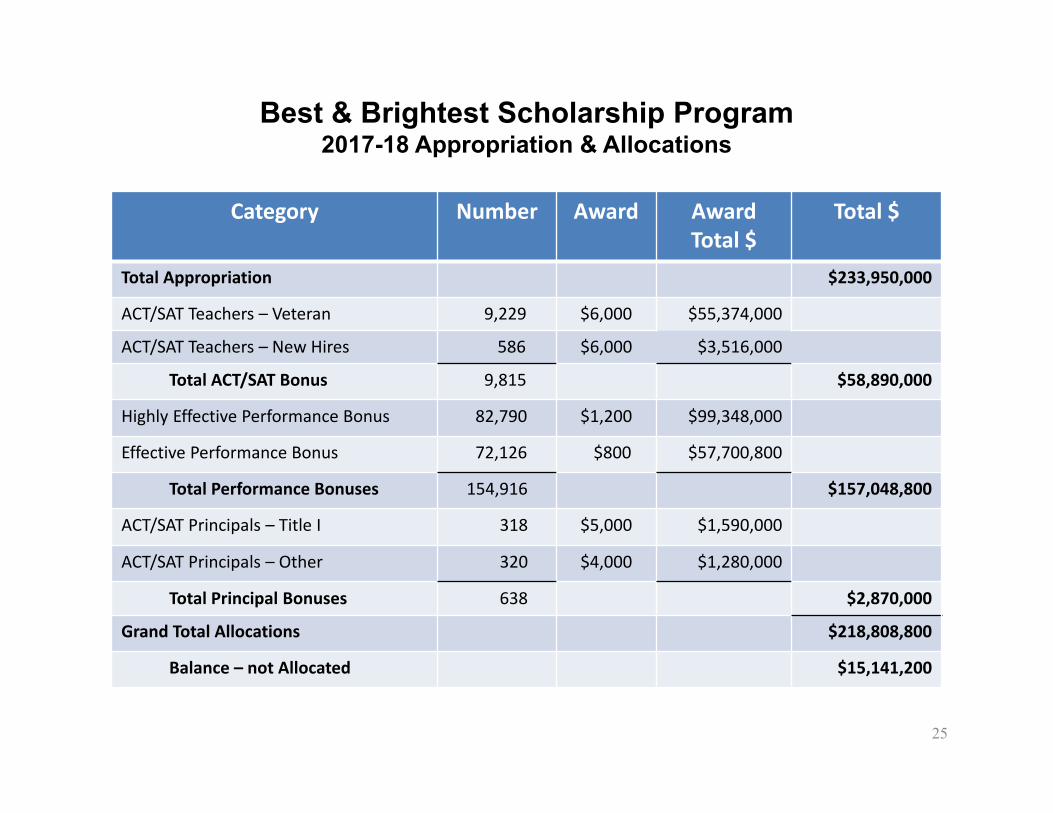
Best & Brightest Scholarship Program2017-18 Appropriation & Allocations
Category Number Award Award Total $
Total $
Total Appropriation $233,950,000
ACT/SAT Teachers – Veteran 9,229 $6,000 $55,374,000
ACT/SAT Teachers – New Hires 586 $6,000 $3,516,000
Total ACT/SAT Bonus 9,815 $58,890,000
Highly Effective Performance Bonus 82,790 $1,200 $99,348,000
Effective Performance Bonus 72,126 $800 $57,700,800
Total Performance Bonuses 154,916 $157,048,800
ACT/SAT Principals – Title I 318 $5,000 $1,590,000
ACT/SAT Principals – Other 320 $4,000 $1,280,000
Total Principal Bonuses 638 $2,870,000
Grand Total Allocations $218,808,800
Balance – not Allocated $15,141,200
25

2015-16 2016-17 2017-18 (Yr. 1 of 3)Scholarship Category Number Award Number Award Number Award
ACT/SAT Teachers – Veteran 4,479 $8,256 6,641 $6,817 9,229 $6,000
ACT/SAT Teachers – New Hires 853 $8,256 547 $6,817 586 $6,000
Highly Effective Teachers 82,790 $1,200
Effective Teachers 72,126 $800
ACT/SAT Principals – Title I 318 $5,000
ACT/SAT Principals – Other 320 $4,000
Best & Brightest Scholarship ProgramFunding (Millions), Recipients, & Award Amounts
$44 $49 $58.89
$157.05
$2.87$15.14
2015‐16 2016‐17 2017‐18
ACT/SAT Teachers
Highly Effectve/Effective Teachers
ACT/SAT Principals
Unallocated Funds
2017‐18Approp. =$234 MTotal Spent =$219 M
26
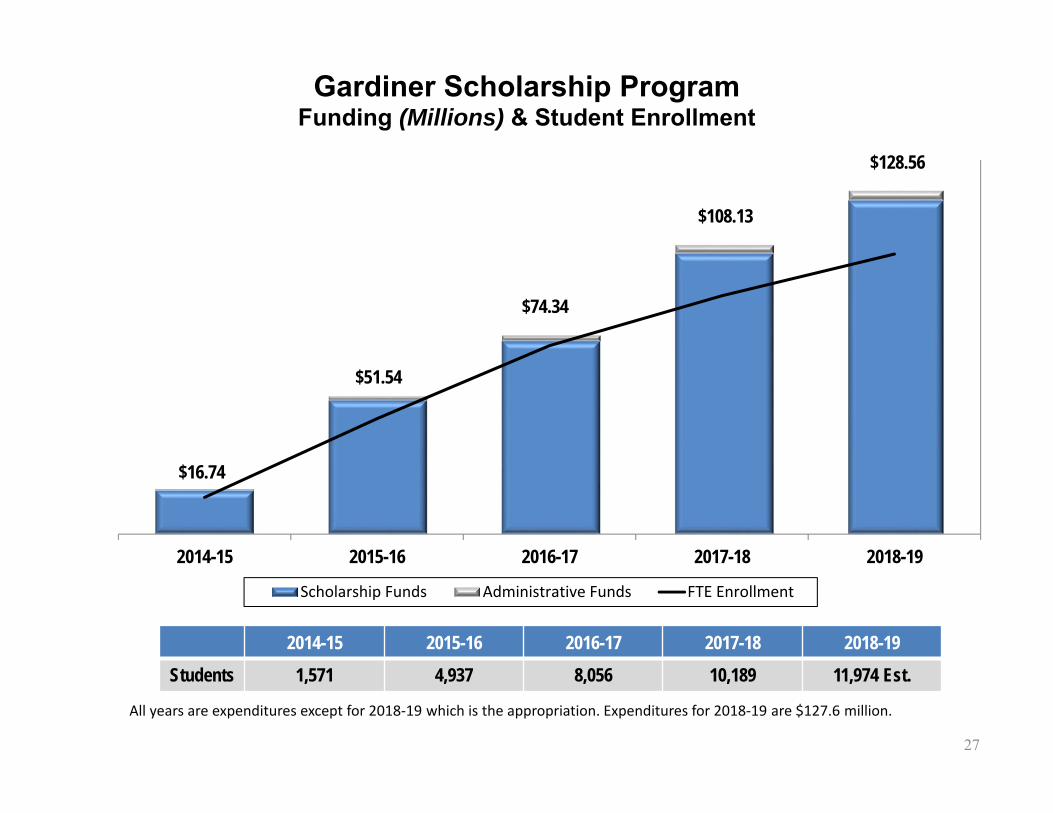
2014-15 2015-16 2016-17 2017-18 2018-19Students 1,571 4,937 8,056 10,189 11,974 Est.
Gardiner Scholarship ProgramFunding (Millions) & Student Enrollment
$16.74
$51.54
$74.34
$108.13
$128.56
2014-15 2015-16 2016-17 2017-18 2018-19
Scholarship Funds Administrative Funds FTE Enrollment
27
All years are expenditures except for 2018‐19 which is the appropriation. Expenditures for 2018‐19 are $127.6 million.

Historical Funding and Student Enrollment Information ‐
District Workforce, Colleges, and Universities
28

District Workforce Education Funding & FTE$ Millions
$358.1 $352.7 $374.5 $374.5 $376.5 $374.5 $369.5 $369.5 $366.3 $370.8
$37.2 $37.6$45.7 $47.1 $47.2 $48.9 $48.3 $46.7 $43.3 $43.8
$24.5 $22.0
2009‐10 2010‐11 2011‐12 2012‐13 2013‐14 2014‐15 2015‐16 2016‐17 2017‐18 2018‐19
State Funds Student Fees Federal Stimulus FTE Enrollment
$420.2 $421.6 $423.7 $423.4 $416.2$412.3$419.8 $417.8 $409.6 $414.6
29
2009-10 2010-11 2011-12 2012-13 2013-14 2014-15 2015-16 2016-17 2017-18 2018-19
FTE 91,325 85,733 68,347 63,351 65,462 71,120 68,084 70,693 68,105 68,105

30
District Workforce Education ‐ CAPE Incentive Funds History
1,505
3,282
4,901
6,2695,960 5,960$1,000.00 $1,000.00
$918.18
$717.82
$0.00
$755.03
$0.00
$200.00
$400.00
$600.00
$800.00
$1,000.00
$1,200.00
0
1,000
2,000
3,000
4,000
5,000
6,000
7,000
2013‐14 2014‐15 2015‐16 2016‐17 2017‐18 2018‐19
Fundable Industry Certifications Funds Per Certification
$5,000,000 $5,000,000 $4,500,000$4,500,000 $4,500,000$0

Florida College System Funding & FTE$ Millions
$967.3 $1,031.1 $1,023.5 $1,051.8 $1,105.4 $1,137.4 $1,180.3 $1,239.0 $1,210.0 $1,227.0
$795.4$855.0 $893.2 $873.3 $852.0 $845.2 $839.0 $811.9 $792.0 $792.0
$83.3$83.0
2009‐10 2010‐11 2011‐12 2012‐13 2013‐14 2014‐15 2015‐16 2016‐17 2017‐18 2018‐19
State Funds Student Fees Federal Stimulus FTE Enrollment
$1,916.7 $1,925.1 $1,957.4 $1,982.6 $2,050.9$1,969.1
$1,846.0
$2,019.2 $2,002.0 $2,019.0
31
2009-10 2010-11 2011-12 2012-13 2013-14 2014-15 2015-16 2016-17 2017-18 2018-19
FTE 362,630 375,292 372,050 350,109 340,556 334,178 327,992 320,900 320,043 321,477

32
$2,668 $2,747 $2,751 $3,004 $3,246 $3,404 $3,598 $3,861 $3,781 $3,817
$2,194 $2,278 $2,401 $2,494
$2,502 $2,529
$2,558 $2,530 $2,475 $2,464 $230
$221
2009‐10 2010‐11 2011‐12 2012‐13 2013‐14 2014‐15 2015‐16 2016‐17 2017‐18 2018‐19
Community College System Funds Per FTE
State, Local, and Federal Funds
State Funds Student Fees Other Trust Funds
$5,246
$6,156$5,933
$5,498$5,152
$5,748
$6,281$6,256$6,391
$5,092

33
12,934 14,329 15,281 16,130 16,552
219,129 220,047 218,863 214,971 215,229
77,786 79,027 82,881 75,789 75,539
30,707 20,775 16,305 14,010 12,723
2013-14 2014-15 2015-16 2016-17 2017-18
Community College FTE by Program Type2013-14 through 2017-18
Bachelor Degee Associate in Arts Workforce Programs Developmental Education
340,556 327,992334,178320,043320,900

34
Florida College System ‐ CAPE Incentive Funds History
1,212
8,426
10,726
12,267
14,697
17,636$1,000.00
$593.40
$466.16
$815.20
$680.41
$567.01
$0.00
$200.00
$400.00
$600.00
$800.00
$1,000.00
$1,200.00
0
2,000
4,000
6,000
8,000
10,000
12,000
14,000
16,000
18,000
20,000
2013‐14 2014‐15 2015‐16 2016‐17 2017‐18 2018‐19
Fundable Industry Certifications Funds Per Certification
*
* 2018 19 fundable certifications and funds per certification are estimated based on prior year growth rates.
$5,000,000 $5,000,000 $10,000,000$5,000,000 $10,000,000$10,000,000

Florida College System ‐ Performance Funds History
$20,000,000
$30,000,000 $30,000,000 $30,000,000
$20,000,000
$30,000,000 $30,000,000 $30,000,000
2015-16 2016-17 2017-18 2018-19
State Investment Institutional Investment
$40,000,000
$60,000,000 $60,000,000 $60,000,000

Fiscal Year
2009-10 2010-11 2011-12 2012-13 2013-14 2014-15 2015-16 2016-17 2017-18 2018-19
FTE 277,579 287,093 293,666 295,882 293,519 294,777 299,484 305,556 311,328 316,312 36

37
$7,457 $7,568 $6,804
$5,851
$7,825 $8,460 $8,784 $9,180 $9,591 $9,823
$4,251 $4,541 $5,041
$5,828
$6,141 $6,314
$6,352 $6,406
$6,288 $6,188 $581 $512
2009‐10 2010‐11 2011‐12 2012‐13 2013‐14 2014‐15 2015‐16 2016‐17 2017‐18 2018‐19
State University System Funds Per FTEState, Local, and Federal $
State Funds per FTE Stdent Fees Per FTE Federal Stimulus Per FTE
$12,620
$15,136$14,774
$11,679$11,845
$13,966
$16,011$15,878$15,587
$12,289

38

39
Overall Performance Funding Rankings & Scores
2014‐15 2015‐16 2016‐17 2017‐18 2018‐19
Rank SUS Score Rank SUS Score Rank SUS Score Rank SUS Score Rank SUS Score
1 UF 42 1 UF 44 1 UCF 84 1 UF 95 1 UF 93
2 USF 37 2 USF 42 1 FAU 84 2 USF 84 2 FIU 90
3 UCF 34 3 UCF 39 3 UF 82 3 UWF 82 3 FSU 86
3 FIU 34 4 FGCU 38 4 USF 79 4 FSU 81 3 USF 86
5 FSU 33 5 FIU 37 5 FIU 76 5 UCF 78 3 UWF 86
6 FGCU 30 5 FAU 37 6 FSU 68 6 NCF 75 6 FAU 84
7 UNF 29 5 UWF 37 7 FGCU 67 7 FAU 72 7 UCF 77
7 FAMU 29 8 FSU 36 8 FAMU 65 8 FIU 68 8 FGCU 75
9 NCF 25 8 UNF 36 9 NCF 59 9 FGCU 66 8 NCF 75
10 FAU 24 10 NCF 35 10 UWF 57 10 FAMU 65 10 FAMU 72
11 UWF 21 11 FAMU 26 11 UNF 56 11 UNF 58 11 UNF 68

40
2014-15 2015-16 2016-17 2017-18 2018-19 TotalFAMU 5,541,681 - 11,509,132 - - 17,050,813 FAU - 11,366,318 25,346,748 19,395,004 20,553,876 76,661,946 FGCU 3,297,844 4,940,666 8,010,396 - 9,264,349 25,513,255 FIU 13,912,467 16,251,603 25,253,750 27,468,290 39,996,601 122,882,711 FSU 16,426,934 24,945,913 35,574,608 38,547,492 51,607,104 167,102,051 NCF - - - 2,469,535 - 2,469,535 UCF 16,757,792 23,829,291 39,301,181 35,692,230 37,522,699 153,103,193 UF 22,453,117 31,424,964 47,695,822 55,061,011 57,631,857 214,266,771 UNF 4,510,490 6,947,962 - - - 11,458,452 USF 17,099,675 24,416,844 32,308,363 45,396,585 37,650,670 156,872,137 UWF - 5,876,439 - 20,969,853 10,772,844 37,619,136
100,000,000 150,000,000 225,000,000 245,000,000 265,000,000 985,000,000
State University System Performance FundingState Investment Allocation History

41
University of Florida
Florida State University
University of South Florida
University of Central Florida
University of South Florida
FY 2013‐14 $15.0 $15.0FY 2013‐14
(Online Institute) $5.0 $0.0FY 2014‐15 $5.0 $5.0FY 2015‐16 $1.6 $1.6FY 2016‐17 $13.5 $13.5 $5.0 $5.0FY 2017‐18 $17.3 $17.3 $8.7 $8.7FY 2018‐19 $6.2 $6.2 $6.2 $1.5
TOTAL $63.5 $58.5 $6.2 $15.2 $13.7Grand Total
Preeminent & Emerging PreeminentState Research Universities
Funding History (In Millions)*
$151
**Emerging Preeminence was established in FY 2016‐17.
Emerging Preeminence**
*Funding history includes recurring funds only.
Preeminence

Historical Funding and Student Enrollment Information ‐
Student Financial Assistance
42

State Student Financial AssistanceFY 2018‐19 Highlights
• Bright Futures - $519.7 million, funded almost entirely from the Educational Enhancement Trust Fund (Lottery and Slots). Most awards have been recoupled to pay a percentage of tuition and fees (100% for FAS and 75% for FMS).
• Need-based Aid (FSAG) - $269.4 million - average award is $1,382; maximum award is $2,610.
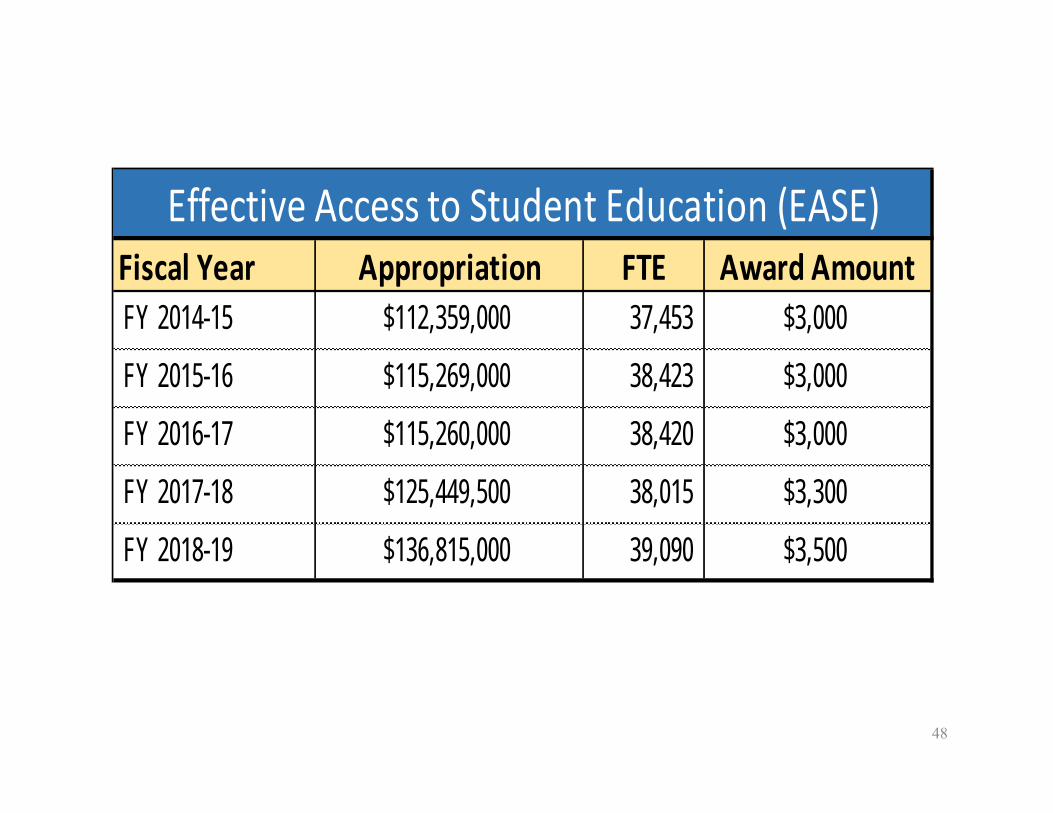
• Effective Access to Student Education (EASE)- $136.8 million - $3,500 per student at all eligible non-profit institutions.
• Access to Better Learning and Education (ABLE) Grants- $6.3 million - $3,500 per student at participating for-profit institutions.
• Benacquisto Scholarship Program - $17 million - approximately $14,100 per student. Expanded to out-of-state high school graduates beginning in 2018-19, with estimated award of approximately $20,700 per student.
• Note: FY 2018-19 estimates on the following slides are based on the August 2018 Student Financial Aid Estimating Conference. New estimates will be available in December.
43

Florida Bright Futures Scholarship ProgramFunding and Awardee History
53,800 51,75144,846 41,142
24,321 24,677 25,36431,193 32,100
179,076174,047
162,980153,800
128,545
110,802
96,806 94,124 96,260
$437.3
$350.0$329.4
$309.4
$266.2$239.8
$217.4
$397.3
$519.7
2010‐11 2011‐12 2012‐13 2013‐14 2014‐15 2015‐16 2016‐17 2017‐18 2018‐19(projected)
Initial Awardees Total Awardees Appropriation (in millions)44

Benacquisto Scholarship ProgramFunding and Awardee History
201266 249 308 342
201
451
665
928
1,080
$4,870,820
$8,379,932
$12,926,139
$14,282,138
$17,044,724
2014‐15 2015‐16 2016‐17 2017‐18 2018‐19 (projected)
Initial Scholars Total Scholars Apprporiation
45
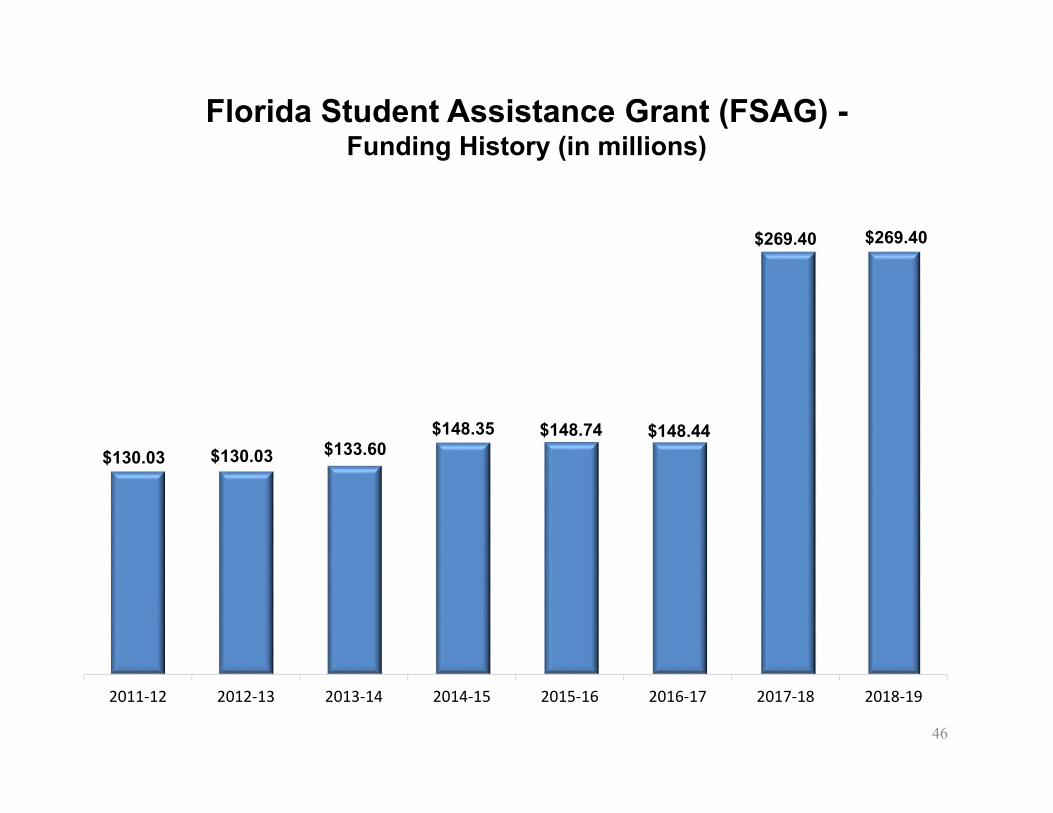
Florida Student Assistance Grant (FSAG) -Funding History (in millions)
46
$130.03 $130.03 $133.60$148.35 $148.74 $148.44
$269.40 $269.40
2011‐12 2012‐13 2013‐14 2014‐15 2015‐16 2016‐17 2017‐18 2018‐19

Florida Student Assistance Grant (FSAG) -Funded and Unfunded Student History
47
117,660 (60%
121,458 (57%
119,992 (57%)
131,827 (50%)
133,394 (57%) 122,508
(53%)
194,867 (74%)
80,052 91,188 92,266
132,539 100,861 107,446
67,208 197,712
212,646 212,258
264,366
234,255 229,954
262,075
2011-12 2012-13 2013-14 2014-15 2015-16 2016-17 2017-18
Disbursed Students Eligible Undisbursed Students Total Eligible Students
48
Fiscal Year Appropriation FTE Award Amount FY 2014-15 $112,359,000 37,453 $3,000
FY 2015-16 $115,269,000 38,423 $3,000
FY 2016-17 $115,260,000 38,420 $3,000
FY 2017-18 $125,449,500 38,015 $3,300
FY 2018-19 $136,815,000 39,090 $3,500
Effective Access to Student Education (EASE)

49
Fiscal Year Appropriation FTE Award Amount FY 2014-15 $5,689,500 3,793 $1,500 FY 2015-16 $5,673,000 3,782 $1,500 FY 2016-17 $5,056,500 3,371 $1,500 FY 2017-18 $6,832,500 2,733 $2,500 FY 2018-19 $6,338,500 1,811 $3,500
Access to Better Learning and Education (ABLE)

50
$104.9
$259.3
$43.5 $30.9$57.5
$178.0
$87.1
$152.3 $146.0$112.6
$25.7
$49.3
$13.8$7.0
$44.4
$37.6
$35.0
$61.8$45.6
$47.8
2009‐10 2010‐11 2011‐12 2012‐13 2013‐14 2014‐15 2015‐16 2016‐17 2017‐18 2018‐19
SUS Projects SUS Maintenance
$37.9
$122.1$130.6
PECO State University System Funding$ Millions
$308.6
$57.3
$101.9
$215.6 $214.1
$191.6
$160.4
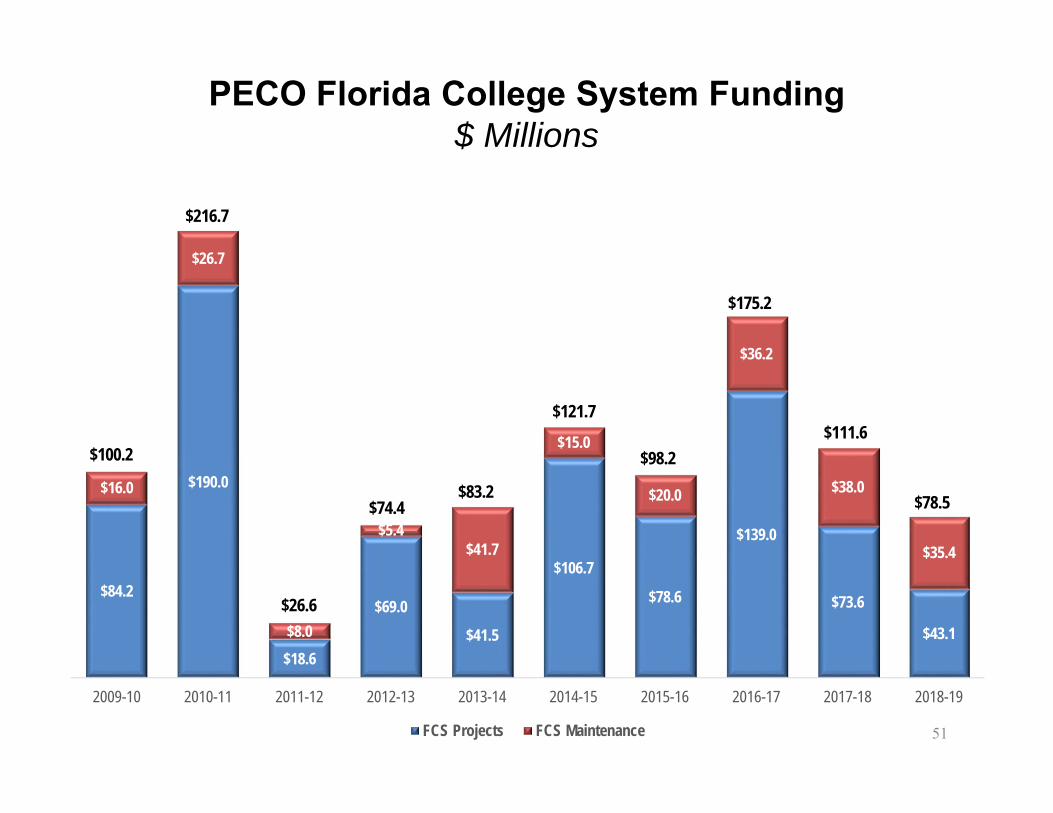
PECO Florida College System Funding$ Millions
51
$84.2
$190.0
$18.6
$69.0
$41.5
$106.7
$78.6
$139.0
$73.6
$43.1
$16.0
$26.7
$8.0
$5.4$41.7
$15.0
$20.0
$36.2
$38.0
$35.4
2009-10 2010-11 2011-12 2012-13 2013-14 2014-15 2015-16 2016-17 2017-18 2018-19
FCS Projects FCS Maintenance
$100.2
$216.7
$26.6
$74.4$83.2
$121.7
$98.2
$175.2
$111.6
$78.5


No Meeting
Materials Available

SENATOR LAUREN BOOK 32nd District
THE FLORIDA SENATE
Tallahassee, Florida 32399-1100
COMMITTEES: Children, Families, and Elder Affairs, Chair Appropriations Appropriations Subcommittee on Education Appropriations Subcommittee on Health and Human Services Health Policy Rules JOINT COMMITTEE: Joint Legislative Budget Commission
MEMORANDUM
REPLY TO: 967 Nob Hill Road, Plantation, Florida 33324 (954) 424-6674 202 Senate Building, 404 South Monroe Street, Tallahassee, Florida 32399-1100 (850) 487-5032
Senate’s Website: www.flsenate.gov
BILL GALVANO DAVID SIMMONS President of the Senate President Pro Tempore
To: Chair Kelli Stargel
From: Senator Lauren Book
Subject: Excusal Letter for Committee Meeting
Date: December 7, 2018
Chair Stargel:
I write you to respectfully request an excused absence from the Senate Appropriations
Subcommittee on Education on Wednesday, December 12, 2018.
Next week, I will be attending the Marjory Stoneman Douglas High School Public Safety
Commission meetings in Tallahassee. The meetings will be taking place concurrently with our
scheduled committee meeting.
The meetings next week culminate the Commission’s year-long work since the passage of SB 7026
last legislative session. The Commission will be finalizing the findings and recommendations for
the report to the Legislature.
Thank you for your consideration of this request.
Sincerely,
Senator Lauren Book, District 32

CourtSmart Tag Report Room: KN 412 Case No.: Type: Caption: Senate Appropriations Subcommittee on Education Judge: Started: 12/12/2018 1:34:28 PM Ends: 12/12/2018 1:52:29 PM Length: 00:18:02 1:34:30 PM Call to Order 1:35:06 PM Roll Call 1:35:16 PM Chair Stargel 1:36:16 PM Senator Simmons 1:36:48 PM Senator Diaz 1:37:04 PM Senator Montford 1:38:03 PM Senator Pizzo 1:38:16 PM Senator Baxley 1:39:25 PM Tim Elwell, Staff Director Education Appropriations 1:40:31 PM Chair Stargel 1:41:26 PM Tim Elwell 1:48:55 PM Chair Stargel 1:49:51 PM Marie-Claire Leman-Public School Parent 1:52:14 PM Chair Stargel - Meeting Adjourned