Embed Size (px)
Citation preview

H02-1
THE FERRITIC STAINLESS STEEL FAMILY: THE APPROPRIATE ANSWER TO NICKEL VOLATILITY ?
J. Charles1, J.D. Mithieux2, P.O. Santacreu2, L. Peguet2
1ArcelorMittal Stainless, France, 2ArcelorMittal R&D, France
Abstract Due to recent nickel price volatality, ferritic stainless steels – having no or very low nickel content – can be very interesting to stainless steels users. Although ferrite is the most common structure in steel, it represents only about 26% of the total stainless steel production nowadays. The paper presents the ferritic stainless steel family: mechanical properties of the grade including drawability as well as corrosion resistance properties. Experimental data of the newly developed 20% Cr ferritic grade are discussed and compared to the properties of existing 200 and 300 series grades. High temperature properties of ferritic stainless steels designed for exhaust systems are also presented. Introduction Stainless steels are ‘stainless’ because their chromium content – minimum 10.5% – gives them remarkable resistance to wet corrosion and high temperature oxidation. Ferritic grades, containing only chromium and possibly other elements (Mo, Ti, Nb, etc.), are well known as cost savings materials since most of them have no expensive nickel additions. Furthermore, the chromium content can be optimized taking into account a very wide range of applications: from 10.5 to 29%. Chromium content of austenitic grades is generally kept in the 17-18% range because of austenitic phase stability considerations (lower or increased Cr content in 300-series austenitic grades requires further increase of expensive Ni to stabilize the austenitic phase). Standard ferritic grades such as 409, 410 and 430 are readily available all over the world. Very successfully used in important applications, such as washing-machine drums and exhaust systems, they actually have much broader application potential, in numerous fields. More recently developed ferritic grades, such as 439 and 441 meet an even wider range of requirements. They can be formed into more complex shapes and joined using most conventional joining methods, including welding. In material selection decisions, these grades are often weighed against 304 austenitic grades. The addition of molybdenum enhances the resistance of ferritic stainless steels to localised corrosion (434, 436). Grade 444 is even considered at least equal to austenitic grade 316 in most of the cases when considering corrosion resistance properties. Superferritic grades have also been developed since many years. Their very high chromium content (25-29%) with additional Ni and Mo alloying make them well-known highly corrosion resistant products albeit restricted to marginal applications. This is due to their high sensitivity to embrittling phase transitions. Recently, newly developed ferritic grades with the aim to replace 304 austenitic grades have been introduced into the market. Their chromium content lies in the 20-22% range and they are free of expensive nickel or molybdenum additions. The grades are stabilized by minor additions of Ti/Nb/Cu.
703

H02-1
The recent volatility of Ni has brought the 400 series under the spotlights. A key note lecture devoted to new developments, properties and applications of ferritic grades seemed to be more than welcome in the scientific program of the Stainless Steel Science and Market 2008, Helsinki international conference. Stainless Families and Alloying Costs
Figure 1. Schaeffler diagram Figure 2. Market share of various stainless steel families Although the Schaeffler diagram (Figure 1) is mainly used for welded structures, it is very useful to illustrate the different areas of stability of stainless steel microstructures. The classical austenitic grades – the so called 300 series – contain generally 8-10% Ni while the more (Cr and Mo) alloyed grades require even more Ni to stabilise the austenitic phase. The most popular stainless steel –304 – is one of the lowest alloyed grades of the austenitic area (not including nitrogen alloyed grades). 316 grade having 2% Mo content is considered as the standard alloyed austenitic stainless steel for corrosion resistance properties. Until 2003, austenitic grades 304 and 316 represented together about 70% of the total stainless steel production. (Figure 2). With the extreme volatility of alloying element costs, new grades have recently been introduced in the market. (Figures 3 to 6) These grades are also austenitic grades, but with partial replacement of Ni by combined Mn and N additions. Their share in stainless steel production has recently increased to more than 10%. The Asian market is particularly involved in this booming development. A paper about the recent developments of the 200 series in general and the introduction of a particular 200 series grade (with VDEh designation 1.4618) is presented at this conference too. The grade is designed to feature nearly equivalent properties to the 304 grade.(1)
Figure 3. Cr and Ni price evolution in latest years
LME Ni Evolutions
4 000 $/T
9 000 $/T
14 000 $/T
19 000 $/T
24 000 $/T
29 000 $/T
34 000 $/T Chromium Evolutions
0.2 $/lb
0.3 $/lb
0.4 $/lb
0.5 $/lb
0.6 $/lb
0.7 $/lb
0.8 $/lb
0.9 $/lb
02 03 04 05 06
02 03 04 05 06
52 000 $/T 04/2007
09/2007
ISSF data
704

H02-1
58%
8%
1%1%
11%
7%
11%2%1%
304316>Mo AUST200OLD200NEW
12CR FERR17CR FERRMo FERRDUPLEX
Figures 4 and 5. Stainless worldwide crude production in 2004 by grades. Another family is also growing, particularly for the most severe corrosion resistance applications: the duplex grades. Despite their very attractive features – combining high mechanical properties with corrosion resistance – they still account for less than 1% of the total stainless steel production. More recently, the development of the lean duplex grades and duplex cold rolled products were introduced. This may have a significant effect on duplex growth in the near future. Ferritic stainless appears to be the most effective answer to nickel volatility. Their market share has grown in the recent past and they represent already about 30% of total stainless steel production. They represent a significant cost saving advantage. Moreover, many grades have been developed in order to optimize corrosion resistance or mechanical properties. Because of welding aspects and toughness properties, they are mainly restricted to thinner gauges even if they often show cost saving potential (Figure 6). They cover a very wide area of applications.
0
1000
2000
3000
4000
5000
6000
7000
8000
1 2 3 4 5
304L316L210123042205250743043944543444420120417 5 Cu15 1 Cu
Figure 6. Raw material cost models (real figures observed from 2004 to2007). The ferritic grades Ferritic grades may be classified into five groups – three families of standard grades and two of “special” grades. By far the greatest current use of ferritics, both in terms of tonnage and number of applications, is centered around the standard grades (Figure 7). Table 1 presents the chemical composition of the most relevant ferritic stainless steels.
Ni Mo Cr 1 6 7 0,8 2 10 17 1 3 14 35 1,5 4 30 40 1,5 5 52 42 1,5
705

H02-1
Figure 7. Ferritic stainless steels families Group 1: 10-14% Cr (type 409/410L) has the lowest chromium content of all stainless steels. Figures 8 and 9 present the effects of Cr, Ni and C/N alloying on phase stability. Clearly the stable austenite domain (“gamma loop”) which is observed around 1000-1200°C is extended by nickel or carbon (or nitrogen) additions while chromium additions stabilize the ferritic phase. As a result, stainless steel with a minimum of 13% Cr, no Ni and extra low interstitial elements (C/N) may present a fully ferritic structure at all temperatures.
Figures 8 and 9. Fe-Ni-Cr and Fe-Cr-C phase diagrams. When reducing Cr and/or increasing C+N, the grade, when heated, undergoes a ferrite/austenite transformation. Grain refining treatments can be performed and the grades having a stable austenitic loop may undergo martensitic transformation when quenched to room temperature. Several investigators have studied the influence of alloying elements on the Ms temperature (4,5,6) . In the case of 12% Cr steels, table 1 gives the change in Ms per weight percent of element added, the value for the base alloy being 300°C. Table 1 also presents the effect of alloying elements on the Ac1 temperature (temperature at which the austenite starts to form on heating). C and N appear to have no significant effect on Ac1 temperature in 12% Cr grades. Table 1. Effects of alloying elements on the Ac1 and Ms temperatures of 13% Cr ferritic steels.
Element C Mn Mo Cr Ni W SiChange in Ms (°C)
per % addition -475 -33 -21 -17 -17 -11 -11
Ni Co Si C Al Mo VChange in Ac1(°C)
per % addition -30 -25 -5 0 30 35 50
706

H02-1
The mechanical properties of 12-13% Cr alloys are closely related to the carbon and nitrogen contents. This is particularly the case for quenched products from the gamma loop. Figure 10 shows hardness values obtained on austenitized 13% Cr samples, oil quenched at 0°C and stress relieved at 200°C. Hardness clearly increases with carbon content. Hardness is even higher than that of C-Mn steels with the same amount of carbon due to simultaneous Cr solid-solution hardening effects and lower Ms temperature which reduce the self-tempering effects. Higher quenching temperatures make it possible to further increase the hardness by enhancing the dissolution of carbides which further contributes to increase the carbon content in solid solution. At higher quenching temperatures, beyond 1150°C, the hardness can fall due the formation of delta ferrite and for the highest carbon content grade, the presence of retained austenite. Obviously, ferritic 12-14% Cr grades with sufficient ductility can only be produced by an optimum heat treatment and a stringent control of chemistry including interstitial elements (carbon/nitrogen) or in the fully annealed condition. This group can be ideal for non- or lightly corrosive environments or applications where slight localised rust is acceptable. Type 409 was originally designed for automotive exhaust system silencers (exterior parts in non-severe corrosive environments). Type 410L is often used for containers, buses and coaches and, recently, LCD monitors frames. Group 2: 14-18 Cr % (type 430) is the most widely used family of ferritic alloys. Most of the industrial grades have between 16 and 18% Cr. AISI 430 is the most widely used ferritic stainless steel. Its typical composition, by weight, is 16-18% Cr, <0.08% C. In order to increase the ductility, the actual carbon content, particularly in the case of thin sheet, is often much lower, typically in the range 0.02 to 0.05%. Nitrogen is generally of the order of 0.030%, but can be significantly reduced. Figure 11 illustrates the influence of combined carbon and nitrogen contents on the iron-chromium equilibrium diagram. It can be seen that for common (C+N) values, (typically 0.08%), the high temperature structure consists of two phases (austenite + ferrite), the maximum level of austenite being obtained at about 1100°C. Consequently, after fast cooling to room temperature from the high temperature mixed austenite/ferrite region, the microstructure of the alloy will transform into a mixed ferrite/martensite microstructure. It is necessary to temper anneal the martensite to restore the ductility. Tempering can be carried out at a temperature below Ac1. Final heat treatment is closely linked to the chemistry of the grade. The final microstructure generally presents a mixed ferrite/carbides microstructure. The highest density of carbides being related to carbon content and the former austenitic grains enriched in carbon when heat treated occurs in the duplex ferrite/austenite region. The carbon enrichment of the austenite versus ferrite results from higher carbon solubility in austenite versus ferrite.
Figure 10. Effects of carbon content on mechanical properties of 13% Cr stainless after water quenching and 200°C stress relieving heat treatment.
707

H02-1
16-18% Cr ferritic grades are known to present potentially brittle microstructures when welded. This is explained by the combined negative effects of grain coarsening at very high temperature in the HAZ close to the fusion line, possible martensitic transformation in the austenitized areas and/or intergranular carbide precipitations (Figure 11).
Figure 11. Fe-Cr-C phase diagram and Fe-17Cr ferritic welded structure. Having a higher chromium content, Group 2 grades show higher resistance to corrosion and behave more like austenitic grade 304. In situations, where corrosion resistance is less of a concern, these grades are suitable to replace type 304 and are usually sufficiently alloyed for indoor applications. Type 430 is often substituted for type 304 in household utensils, dishwashers, pots, pans and decorative panels. Group 3: 14-18% Cr + stabilization elements (Ti, Nb, Zr...) includes types 430Ti, 439, 441, etc. During solidification and cooling, Ti, Nb, Zr additions in steels tie up carbon and/or nitrogen in the form of highly stable compounds. Carbides and nitrides are precipitated leaving the ferritic structure with much lower carbon / nitrogen contents in solid-solution. As a result, the 16-18% Cr stabilized grade often has a fully ferritic microstructure at all temperatures. The amount and nature of stabilization elements can be optimized taking into account the requested in-service properties. Specific improvements in functional properties such as drawability, pitting corrosion resistance, high temperature strength, creep resistance, may be achieved by adding the appropriate alloying elements and selection of one or more stabilization elements. Typically, stability of the carbides increases from NbC, TiC to ZrC, the latter being extremely stable at high temperature. Mixed TiC/NbC are preferred for pitting corrosion resistance, the NbC compound is the carbide of choice in order to obtain creep resistance properties... The minimum amount of Ti or Nb is generally included in a range of 6 to 8 times (x) the C+N content. Of course the C+N content is optimized for specific applications. For room temperature applications, carbon content is typically kept at the lowest possible level (taking into account economical considerations) so that the amount of expensive Ti, Nb can be reduced and a fully stabilized microstructure still be maintained. Ti and Nb are the most popular stabilization elements. They have strong affinities with other residual elements such as oxygen and sulphur and act as intrinsic ferrite forming elements of the steel microstructure. As a major consequence of this, the steel is fully ferritic at all temperatures and Cr-carbide precipitations are inhibited, particularly in the HAZ (prevention of intergranular corrosion along depleted Cr areas). Furthermore, the nature of inclusions (oxides, nitrides, sulphides) and precipitations (carbides, carbonitrides, phosphides, intermetallic phases…) is different from that of the basic non-stabilized 17% Cr steel (Figure 12).
708

H02-1
Figure 12.Type of precipitations observed in a 17 Cr ferritic stabilized grade.
Compared with Group 2, these grades show better weldability and formability than 430 grade. Their behaviour is, in most cases, equivalent to that of 304 austenitic grades. Typical applications include sinks, heat exchanger tubes (the sugar industry, energy, etc.), exhaust systems (longer life than with type 409) and the welded parts of washing machines. Group 3 grades can even replace type 304 in applications where this grade is overspecified. The best in-service wet corrosion resistance properties are observed for the highest Cr content (17-18% Cr) and a mixed Nb / Ti stabilization effect. Group 4: 10-18% Cr and Mo content higher than 0.5% includes types 434, 436, 444, etc. These grades are molybdenum alloyed, for extra corrosion resistance. Cr content is mainly in the 17-18% range. Due to the increase of ferrite forming elements (Mo), these grades present a fully ferritic microstructure and most of them are fully stabilized by Ti and/or Nb additions. The grades are also more sensitive to intermetallic phase precipitations (χ, σ ) when heated to high temperatures. Brittle behaviour may occur if improperly heat treated or after long term use at high temperatures. Nevertheless, since Cr content is kept at a relatively low level, those grades show satisfactory structural stability and welding properties. Typical applications include hot water tanks, solar water heaters, visible parts of exhaust systems, electric kettle and microwave oven elements, automotive trim and outdoor panels, etc. Type 444’s corrosion-resistance can be similar to that of type 316. Group 5: Cr content higher than 18% and not belonging to other groups, includes types 446, 445, 447 etc. Those grades traditionally have molybdenum additions, for extra wet corrosion resistance. Having most often 25-29% Cr and 3% Mo, these grades are superior to type 316 with respect to this property. They are very sensitive to embrittlement due to intermetallic phase precipitations and are very difficult to weld. Their uses are restricted to thin gauges (mainly below 2 mm). Extra low carbon + nitrogen are required to ensure sufficient structure stability. Ni additions are considered (2-4%) to increase toughness properties. Nickel has controversal effects since Ni simultaneously reduces the brittle/ductile transition temperature and enhances phase precipitation kinetics which decrease the ductility. The high Cr and Mo containing grades are called superferritics. The new generation of superferritics is designed to have an extra low interstitial content thanks to specific melting procedures. The grades are designed to replace titanium in the most severe corrosion resistance applications (including nuclear power station condensors and seawater exchanger tubes, geothermal, desalination…). Only marginal worldwide production numbers are reported. More recently, a new family of ferritic grades has been developed. They are designed to replace 304 grade and generally contain about 20% Cr. Since they are Mo-free, they can be considered as the best alternative to Ni and Mo price volatility. For corrosion resistance properties and weldability the grades are fully stabilized by mixed Ti/Nb/Cu additions. The grades present attractive properties for an extremely wide range of applications.
709
H02-1
Group 5 also contains a family of grades developed for exhaust applications, including grades containing exotic additions such as high Al (2-5%) and Ce, Y,... but also a 19Cr-2Mo-Nb grade designed for high temperature applications. Due to its high resistance to scaling, this grade is particularly well designed for exhaust manifold applications. Physical and mechanical properties Physical properties of ferritic stainless steels The most obvious difference between ferritic stainless and austenitic properties is their ferromagnetic behavior at room temperature and up to a critical temperature known as the Curie point, temperature typically in the range of 650-750°C at which the magnetic order disappears. Magnetism has nothing to do with corrosion resistance which is closely linked to chemical composition (Cr, Mo ...). Moreover, corrosion resistance is almost independent from the microstructure (not considering the specific case of stress corrosion cracking where ferritic structure is an advantage or crevice corrosion propagation rate where nickel plays a beneficial role). The popular link between magnetism and poor corrosion resistance results from an inappropriate comparison i.e. comparing a ferritic grade with lower Cr content (13-16%) with the austenitic 304 grade (18%). In fact, the magnetism of ferritic grades is one of the material’s major assets in some applications. This includes advantages ranging from the ability to stick memos on the refrigerator door to storing knives and other metallic implements. Indeed, it is also an essential property for ferritic stainless uses in applications dealing with induction heating such as the familiar pans and other cookware for “induction” cooking. In those applications, magnetic materials are requested to generate heat from magnetic energy. Ferritics’ lower thermal expansion coefficient combined with their improved thermal conductivity often provides a key advantage to ferritics over austenitics when considering applications involving heat transfer. Typical physical properties of ferritic stainless compared to austenitics are presented in Table 2 Table 2. Physical properties of ferritic stainless steels
710

H02-1
Mechanical Properties Table 3. Typical mechanical properties of ferritic stainless grades
Mechanical properties of ferritic grades are presented in Table 3. Ferritics have generally lower elongation and strain hardening properties than austenitics. As for plain carbon steels, ferritic stainless steels in the annealed state present a yield point followed by a stress drop on the stress/strain curves. This behavior is caused by the breakaway of pinned dislocations and enables a “true yield stress” to be defined. It is accompanied by the formation of localized deformation bands named “Piobert-Lüders” bands. As a result, after plastic deformation on annealed samples, surface defects may be observed. In the case of deep drawing, they are called “stretcher strains” or “worms”. It can be avoided partially by stabilisation or by a skin pass operation which introduce “fresh” dislocations in the structure. Ferritic stainless exhibit a non-uniform texture which leads to heterogeneous mechanical behaviour. Phenomena such as “earing” as well as “roping” (sometimes called “ridging”) are observed. Roping (Figure 13) generally occurs during deep drawing and involves the formation of small ondulations elongated in the tensile direction. Those defects must be eliminated during finishing. The stabilized ferritics steels are less sensitive to roping than basic AISI 430 grade. In practice, optimization of process parameters makes it possible to significantly attenuate this phenomenon. Deep drawing performance is determined by the limit drawing ratio (LDR),
Figure 13. Deep drawn cup of AISI 430 grade showing “roping” phenomenon.
711

H02-1
which is well correlated with the mean strain ratio. Ferritics have higher LDR values than austenitics, which makes them particularly suitable for deep drawing applications. The main stress ratio may be optimized in ferritic stainless by process cycle parameters including slab microstructure control and cold rolling parameters preceding the final heat treatment. In industrial practice, for a single cycle cold rolling process, values of 1.8-1.9 LDR are obtained for a conventional 430 grade.
Figure 14. LDR and dome height values of several ferritic and 304 austenitic grades. The LDR may reach values higher than 2.1 for optimized process including a two step cold rolling process (Figure 14). Stabilization (by Ti, Nb addition…) of ferritic stainless steel induces a significant modification in the crystalline texture leading to a sharp improvement of the strain ratio. Improved LDR values are observed. The performance regarding pure deep drawing aside, ferritic grades are inferior to austenitics in pure stretch forming. “Dome height” refers to the maximum degree of deformation – of a blank undergoing stretching – before “necking”. Dome height (K50, in mm) values of ferritic and 304 austenitic grades are presented (Figure 14). In practice, industrial forming operations involve a combination of both drawing and stretch-forming deformation, in a series of “passes”. Forming limit curves are a useful guide to assess maximum deformation before failure, in both deep drawing and stretching processes. These curves define local deformations during and after forming in terms of two principal “true strains”: longitudinal (“major strain”) and transverse (“minor strain”). The curves plot the effects of the various combinations of these two strains, up to the point of fracture. Typical results obtained for ferritics and 304 grade are presented (Figure 15). Ferritics clearly have less combined forming properties than austenitics. For the most severe forming conditions, the switch from austenitics to ferritics may need some design optimisation with shape modifications of the most critical areas.
712
H02-1
Figure 15. Forming limit curves of ferritic and 304 stainless grades. Wet Corrosion Resistance Properties Localised corrosion resistance Pitting and crevice corrosion resistance are one of the major issues regarding material selection in aqueous solutions. Pitting corrosion resistance is one of the key properties for material selection in neutral, oxidizing conditions typically observed in halogen (Cl, F...) containing solutions. Seawater and brine solutions even with few additions of salt (cooking) are the most common in service conditions related to pitting corrosion. Pitting corrosion resistance is clearly linked to the PREN value (% Cr + 3.3% Mo + 16% N). In the case of ferritics nitrogen additions are kept to minimum values in order to avoid nitride precipitations. Only Cr and Mo play a positive role. Typical data are presented in Figure 16 (pH 6.6, 0.02 M NaCl, 23°C). Of course, an increase of temperature or salinity will reduce the pitting corrosion resistance. No effect of structure – ferritic or austenitic – on the pitting corrosion resistance properties can be observed. Chemical composition and cleanliness are the most important parameters when considering pitting corrosion resistance. Sulfur content, particularly, must be kept at a very low level to obtain sufficient pitting corrosion resistance properties.
Figure 16. Pitting corrosion resistance properties (critical pitting potential) of several stainless steels. Pitting potentials are plotted versus PREN value. (solution: 0.02 M NaCl, 23°C pH=6.6).
713

H02-1
Crevice corrosion is specific to confined zones, such as under a joint or under deposits. The acidity may increase locally triggering the destruction of the passive film. Test results performed in a 2M NaCl solution at room temperature with different pH show that depassivation of the stainless grades is directly related to their composition i.e. Cr and Mo content. No clear effect of structure – ferrite or austenite – is reported. Electrochemical examination shows that when the pH drops to levels lower than the depassivation pH, current density increases. Clearly ferritic stainless presents higher current density than austenitics. This confirms the in-service properties: where initiated, crevice corrosion propagates very quickly in ferritic structures. Repassivation mechanisms almost never occur in ferritic grades in such acidic conditions. Clearly, standard ferritic grades are not to be used in acidic solutions and crevice-like configurations have to be avoided. Optimum design of equipment is of utmost importance. Figure 17. Crevice corrosion resistance data. Tests performed in a 2M NaCl solution at room temperature. Intergranular corrosion resistance The most sensitive structure to intergranular corrosion is the HAZ of welded structures. Carbides generally precipitate at grain boundaries and consequently in the case of chromium carbides, chromium depletion areas may form. This is a well known mechanism in austenitic steels. For ferritics, diffusion mechanisms are enhanced and as solubility limits of interstitial elements are very low compared to austenitics, carbides and nitrides will precipitate when the structure is cooled down. In case of non-stabilized grades, chromium diffuses quickly to re-enrich the depleted zones. This is the case in most annealed industrial products. Nevertheless in many cases the as-welded structure – particularly the HAZ – of non stabilized steels remains sensitive to intergranular corrosion. For ferritic welded structures, Ti or Nb stabilized grades are strongly recommended (Figure 18).
1 1.5 2 2.5 3 pH.
200
150
100
50
304
444 430 409
Cr, Mo
Ni(Mo)
1 1.5 2 2.5 3 pH.
200
150
100
50
µA/cm2
304
NaCl 2M
444 430430Ti 409
Cr, Mo
Ni(Mo)
Temp.: 23 °C: 23 °C
1 1.5 2 2.5 3 pH.
200
150
100
50
304
444 430 409
Cr, Mo
Ni(Mo)
1 1.5 2 2.5 3 pH.
200
150
100
50
µA/cm2
304
NaCl 2M
444 430430Ti 409
Cr, Mo
Ni(Mo)
Temp.: 23 °C: 23 °C
1.41.51.6
1.9
1.71.8
2.02.2
2.5
2.32.4
pH
443
444445
441430Ti
430
GRADE
304
316
301
GRADE1.41.51.6
1.9
1.71.8
2.02.2
2.5
2.32.4
pH
443
444445
441430Ti
430
GRADE
304
316
301
GRADE
714

H02-1
Stress corrosion cracking resistance In comparison to austenitics, the ferritic stainless steels are generally considered to resist better to stress corrosion cracking.in chloride containing environments. However, their resistance is not limitless. Their cracking potential is generally higher than the free corrosion potential. This is related to their deformation mode and relatively poor capacity to repassivate. The risk of cracking mainly appears in concentrated acidic environments. In neutral media, the ferritic steels can generally be used. Development of high temperature ferritic stainless steel grades Despite their lower mechanical properties at high temperature compared to those of austenitic grades, ferritic grades exhibit a better resistance to the cyclic oxidation and thermal fatigue and present lower coefficients of thermal expansion [3,4]. Niobium addition improves high temperature mechanical properties significantly, an addition of half a percent or more of molybdenum allows to reach a good resistance in severe internal or external corrosion conditions. Consequently, ferritic grades are well adapted to exhaust system applications (Figure 19). The increase of the exhaust gas temperature beyond 800°C made the use of titanium stabilized 12% Cr grades (AISI 409, EN 1.4512) impossible and lead to the use of high temperature resistant ferritic grades containing 17% Cr and stabilized by both Ti and Nb (AISI 441 EN 1.4509). In such a grade, an excess of niobium improves the mechanical properties at high temperatures, in particular its creep resistance and its thermal fatigue resistance.
Figure 19. Example of a ferritic stainless steel exhaust Manifold, made of deep drawn clam-shells (Benteler). A maximal service temperature of 950°C can be reached. On the other hand, the ferritic grades are known to have a lower forming capacity, often illustrated by their moderate elongation (maximal
Figure 18. Intergranular.corrosion resistance of 17CrTi steels, determined by the sulfuric acid/copper sulfate test on TIG weld seams in 1mm thick sheets
715
H02-1
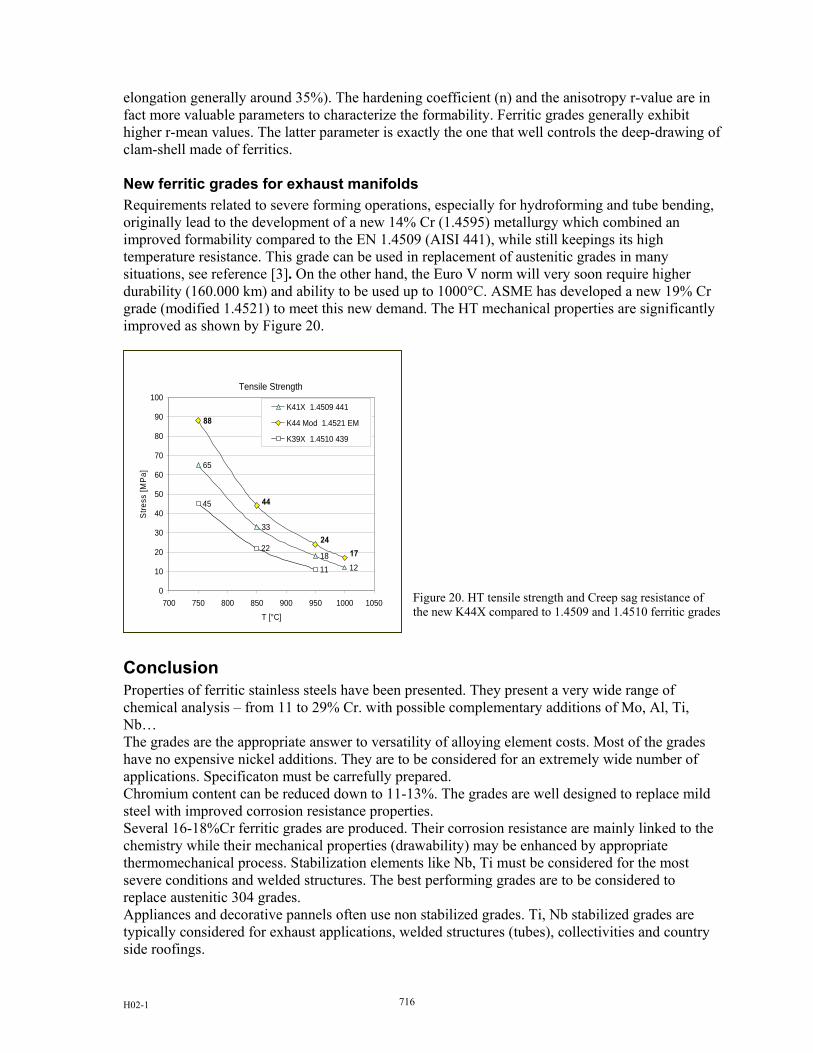
elongation generally around 35%). The hardening coefficient (n) and the anisotropy r-value are in fact more valuable parameters to characterize the formability. Ferritic grades generally exhibit higher r-mean values. The latter parameter is exactly the one that well controls the deep-drawing of clam-shell made of ferritics. New ferritic grades for exhaust manifolds Requirements related to severe forming operations, especially for hydroforming and tube bending, originally lead to the development of a new 14% Cr (1.4595) metallurgy which combined an improved formability compared to the EN 1.4509 (AISI 441), while still keepings its high temperature resistance. This grade can be used in replacement of austenitic grades in many situations, see reference [3]. On the other hand, the Euro V norm will very soon require higher durability (160.000 km) and ability to be used up to 1000°C. ASME has developed a new 19% Cr grade (modified 1.4521) to meet this new demand. The HT mechanical properties are significantly improved as shown by Figure 20.
Figure 20. HT tensile strength and Creep sag resistance of the new K44X compared to 1.4509 and 1.4510 ferritic grades
Conclusion Properties of ferritic stainless steels have been presented. They present a very wide range of chemical analysis – from 11 to 29% Cr. with possible complementary additions of Mo, Al, Ti, Nb… The grades are the appropriate answer to versatility of alloying element costs. Most of the grades have no expensive nickel additions. They are to be considered for an extremely wide number of applications. Specificaton must be carrefully prepared. Chromium content can be reduced down to 11-13%. The grades are well designed to replace mild steel with improved corrosion resistance properties. Several 16-18%Cr ferritic grades are produced. Their corrosion resistance are mainly linked to the chemistry while their mechanical properties (drawability) may be enhanced by appropriate thermomechanical process. Stabilization elements like Nb, Ti must be considered for the most severe conditions and welded structures. The best performing grades are to be considered to replace austenitic 304 grades. Appliances and decorative pannels often use non stabilized grades. Ti, Nb stabilized grades are typically considered for exhaust applications, welded structures (tubes), collectivities and country side roofings.
Tensile Strength
65
33
1812
88
45
22
11
44
2417
0
10
20
30
40
50
60
70
80
90
100
700 750 800 850 900 950 1000 1050
T [°C]
Stre
ss [M
Pa]
K41X 1.4509 441
K44 Mod 1.4521 EM
K39X 1.4510 439
716
H02-1
For the most severe conditions 20% Cr ferritics have to be considered to replace 304 grades. New grades have been recently designed. They offer new opportunities to replace austenitics in wet corrosion applications and high temperature applications. Mo containing ferritics are to be considered for the most severe conditions. 444 grade has corrosion resistance properties close to 316 austenitic grades. The super-ferritics grades having 25% Cr minimum have only marginal applications and are very difficult for manufacturing and transformation. Ferritic grades are a hole family presenting in most of the applications an alternative solution to 301, 304 and 316 austenitic grades. Their weaknesses are brittleness for the thicker gauges and reduced formability when compared to austenitics. In most of the cases complementary work on modeling, design of the finishing products provides further possibilities to switch from austenitics to ferritics. Ferritics will continue to grow since they have a unique combination of properties and cost advantages. Learning curve will provide confidence in there uses. References [1] References ISSF document: “The ferritic solution / The essential guide to ferritic stainless
steels”, 2007 [2] P. Lacombe, B. Baroux and G. Beranger: “Stainless Steels”, les éditions de Physique, Les
Ulis, 1993 [3] L. Antoni and B. Baroux: “Cyclic oxidation behaviour of stainless steels – appliation to the
automotive exhaust lines”, La Revue de métallurgie-CIT Février 2002, pp.178-188. [4] P.O. Santacreu et al.: “Study of the thermal fatigue of stainless steels and its application to
the life prediction of automotive exhaust line components”, 3rd Int. Congress on Thermal Stresses, Thermal Stresses ’99, June 13-17, 1999, Cracow, Poland, Eds J.J. Skrzypek and R.B. Hetnarski, pp.245-48.
[5] F. Chassagne et al: “Development of a Nb stabilized 15% Cr ferritic stainless steel for the hot part of the automotive exhaust systems”, Proceeding of the 4th European Stainless Steel Science and Market congress, Paris, 2002.
[6] Jan Van Herle et al.: “Ferritic Steel (18% Cr) with and without Ceramiccoating for Interconnect Application in SOFC”, Proceedings of the Second European Fuel Cell Technology and Applications Conference EFC 2007, December 11-14, 2007, Rome, Italy
717

H02-1
GROUP 1
AISI,ASTM Standard Ref.C Si Mn P S Cr Mo Ti Nb Cu Al N Ni
403(M) 0,15 0,50 1,00 0,04 0,03 11,5-13,0 JIS SUS4030,12-0,17 1,00 1,00 0,04 0,015 12,0-14,0 EN 1.4024
405,00 0,08 1,00 1,00 0,04 0,03 11,5-14,5 0,1-0,3 0,60 UNS S405000,08 1,00 1,00 0,04 0,015 12,0-14,0 EN 1.40000,08 1,00 1,00 0,04 0,015 12,0-14,0 0,1-0,3 EN 1.40020,08 1,00 1,00 0,04 0,03 11,5-14,5 0,1-0,3 JIS SUS405
409 L 0,03 1,00 1,00 0,04 0,02 10,5-11,7 6x(C+N)-0,5 0,17 0,03 0,50 UNS S409100,03 1,00 1,00 0,04 0,02 10,5-11,7 8x(C+N)-0,5 0,10 0,03 0,50 UNS S409200,03 1,00 1,00 0,04 0,02 10,5-11,7 0,03 0,50 UNS S409300,03 1,00 1,00 0,04 0,02 10,5-11,7 0,05-0,2 0,18-0,4 0,03 0,50 UNS S409450,03 1,00 1,00 0,04 0,02 10,5-11,7 6x(C+N)-0,75 0,03 0,5-1,0 UNS S409750,03 1,00 1,50 0,04 0,015 10,5-12,5 0,03 0,3-1,0 EN S409770,03 1,00 1,00 0,04 0,015 10,5-12,5 6x(C+N)-0,65 0,50 EN 1.45120,08 0,70 1,50 0,04 0,015 10,5-12,5 0,05-0,35 0,5-1,5 JIS 1.45160,03 1,00 1,00 0,04 0,03 10,5-11,75 6xC-0,75 0,60 SUH409L
10%-14%C 410(M) 0,08-,015 1,00 1,00 0,04 0,03 11,5-13,5 0,75 UNS S410000,08-0,15 1,00 1,50 0,04 0,015 11,5-13,5 0,75 EN 1.4006
0,15 1,00 1,00 0,04 0,03 11,5-13,5 JIS SUS410
410 L 0,03 1,00 1,50 0,04 0,03 10,5-12,5 0,03 1,50 UNS S410030,03 1,00 1,00 0,04 0,03 12,0-13,0 9(C+N)-0,6 0,03 0,50 UNS S410450,04 1,00 1,00 0,045 0,03 10,5-12,5 0,10 0,6-1,10 UNS S410500,03 1,00 1,00 0,04 0,03 11,0-13,5 JIS SUS410L
0,03 1,00 1,50 0,04 0,015 10,5-12,5 0,3-1,0 EN 1.4003
410S(M) 0,08 1,00 1,00 0,04 0,03 11,5-13,5 0,60 UNS S410080,08 1,00 1,00 0,04 0,03 11,5-13,5 0,60 JIS SUS4105
420J1(M) 0,16-0,25 1,00 1,00 0,04 0,03 12,0-14,0 JIS SUS420J10,16-0,25 1,00 1,50 0,04 0,015 12,0-14,0 EN 1.4021
420J2(M) 0,26-0,40 1,00 1,00 0,04 0,03 12,0-14,0 JIS SUS420J20,26-0,35 1,00 1,50 0,04 0,015 12,0-14,0 EN 1.40280,36-0,42 1,00 1,00 0,04 0,015 12,5-14,5 EN 1.40310,43-0,5 1,00 1,00 0,04 0,015 12,5-14,5 EN 1.4034
[0,08+8x(C+N)]-0,75
Chemical component (maximum weight %)
GROUP 2
AISI,ASTM Standard Ref.
C Si Mn P S Cr Mo Ti Nb Cu Al N Ni420 0,08 1,00 1,00 0,045 0,03 13,5-15,5 0,2-1,2 0,3-0,5 1,0-2,5 UNS S42035
0,08 1,00 1,00 0,04 0,015 13,5-15,5 0,2-1,2 0,3-0,5 1,0-2,5 EN 1.4589
429 0,12 1,00 1,00 0,04 0,03 14,0-16,0 UNS S429000,12 1,00 1,00 0,04 0,030 14,0-16,0 JIS SUS429
429J1(M) 0,25-0,40 1,00 1,00 0,04 0,03 15,0-17,0 JIS SUS429J1
14%-18%Cr 430 0,12 1,00 1,00 0,04 0,03 16,0-18,0 0,75 UNS S430000,08 1,00 1,00 0,04 0,015 16,0-18,0 EN 1.40160,12 0,75 1,00 0,04 0,03 16,0-18,0 JIS SUS430
1,4017 0,08 1,00 1,00 0,04 0,015 16,0-18,0 1,2-1,6 EN 1.4017
440(M) 0,6-0,75 1,00 1,00 0,04 0,030 16,0-18,0 JIS SUS440A
Chemical component (maximum weight %)
718

H02-1
GROUP 3
AISI,ASTM Standard Ref.
C Si Mn P S Cr Mo Ti Nb Cu Al N Ni430J1L 0,025 1,00 1,00 0,04 0,03 16,0-20,0 8x(C+N)-0,8 0,3-0,8 0,025 JIS SUS430J1L
430LX 0,03 0,75 1,00 0,04 0,03 16,0-19,0 0,60 JIS SUS430LX
439 0,03 1,00 1,00 0,04 0,03 17,0-19,0 [0.2+4x(C+N)]-1.10 0,15 0,03 0,50 UNS S430350,05 1,00 1,00 0,04 0,015 16,0-18,0 [0.15+4(C+N)]-0.8 EN 1.4510
14%-18%cr 0,03 1,00 1,00 0,04 0,03 17,0-19,0 0,15 0,03 0,50 UNS S43932stabilised 0,03 1,00 1,00 0,04 0,015 17,5-18,5 0,1-0,6 [0,3+(3xC)] UNS S43940
0,03 1,00 1,00 0,04 0,015 16,0-17,5 0,35-0,55 EN 1.45900,025 0,50 0,50 0,04 0,015 16,0-18,0 0,3-0,6 EN 1.45200,020 1,00 1,00 0,04 0,015 13,0-15,0 0,2-0,6 EN 1.4595
430TI 0,05 1,00 1,00 0,40 0,015 16,0-18,0 0,60 EN 1.4511
441 0,03 1,00 1,00 0,04 0,03 17,5-18,5 0,1-0,6 9xC+0,3-1 1,00 UNS S.441000,03 1,00 1,00 0,04 0,015 17,5-18,5 0,1-0,6 3xC+0,3-1 EN 1.4509
0,1-1,0
[0.2+4x(C+N)]-0,75
Chemical component (maximum weight %)
GROUP 4
AISI,ASTM Standard Ref.
C Si Mn P S Cr Mo Ti Nb Cu Al N Ni Other415 0,05 0,60 0,5-1,0 0,03 0,03 11,5-14,0 0,5-1,0 UNS S41500
434 0,12 1,00 1,00 0,04 0,03 16,0-18,0 0,75-1,25 UNS S434000,08 0,75 0,80 0,04 0,015 16,0-18,0 0,9-1,4 EN 1.41130,08 1,00 1,00 0,04 0,015 16,0-18,0 0,8-1,4 [7x(C+N)+0,1]-1,0 0,04 EN 1.45260,12 1,00 1,00 0,04 0,03 16,0-18,0 0,75-1,25 JIS SUS 434
436 0,12 1,00 1,00 0,04 0,03 16,0-18,0 0,75-1,25 0,025 UNS S436000,025 1,00 1,00 0,04 0,015 16,0-18,0 0,9-1,4 0,3-0,6 EN 1.45130,025 1,00 1,00 0,04 0,03 16,0-19,0 0,75-1,25 0,025 JIS SUS 436 L
Added Mo 1,4419(M) 0,36-0,42 1,00 1,00 0,04 0,015 13,0-14,5 0,6-1,0 EN 1,4419
1,4110(M) 0,48-0,60 1,00 1,00 0,04 0,015 13,5-15,0 0,5-0,8 V≤0,15 EN 1,4110
1,4116(M) 0,45-0,55 1,00 1,00 0,04 0,015 14,0-15,0 0,5-0,8 0,1≤V≤0,2 EN 1,4116
1,4122(M) 0,33-0,45 1,00 1,50 0,04 0,015 15,5-17,5 0,8-1,3 ≤1,0 EN 1,4122
1,4313(M) ≤0,05 0,70 1,50 0,04 0,015 12,0-14,0 0,3-0,7 ≥0,02 3,5-4,5 EN 1,4313
1,4418(M) ≤0,06 0,70 1,50 0,04 0,015 15,0-17,0 0,8-1,5 ≥0,02 4,0-6,0 EN 1,4418
436J1L 0,025 1,00 1,00 0,04 0,03 17,0-20,0 0,4-0,8 0,025 JIS SUS 436 J1L
444 0,025 1,00 0,7-1,5 0,04 0,03 17,5-19,5 1,75-2,5 1,00 UNS S444000,025 1,00 1,00 0,04 0,015 17,0-20,0 1,8-2,5 0,03 EN 1.45210,025 1,00 1,00 0,04 0,03 17,0-20,0 1,75-2,5 0,025 JIS SUS 444
0,2+4(C+N)-0.84x(C+N)+0,15-0,8
8x(C+N)-0,8
8x(C+N)-0,8
8x(C+N)-0,8
8x(C+N)-0,8
Chemical component (maximum weight %)
AISI,AST
M Standard Ref.C Si Mn P S Cr Mo Ti Nb Cu Al N Ni
445 0,02 1,0 1,0 0,04 0,012 19,0-21,0 10x(C+N)-0,8 0,3-0,6 0,03 0,6 UNS S44500
445J1 0,025 1,0 1,0 0,04 0,03 21,0-24,0 0,7-1,5 0,025 JIS SUS445J1
445J2 0,025 1,0 1,0 0,04 0,03 21,0-24,0 1,5-2,5 0,025 JIS SUS 445J2
Others 446 0,06 0,75 0,75 0,04 0,02 25,0-27,0 0,75-1,5 0,2-1,0 0,20 0,04 UNS S446260,01 0,4 0,4 0,02 0,02 25,0-27,5 0,75-1,5 0,05-0,02 0,20 0,015 0,5 UNS S446270,025 0,75 1,0 0,04 0,03 24,5-26,0 3,5-4,5 0,035 3,5-4,5 UNS S446350,03 1,0 1,0 0,04 0,03 25,0-28,0 3,0-4,0 0,04 1,0-3,5 UNS S446600,01 0,4 0,4 0,03 0,02 25,0-27,5 0,75-1,5 0,015 0,5 JIS SUS XM27
447 0,01 0,2 0,3 0,025 0,02 28,0-30,0 3,5-4,2 0,15 0,02 0,15 (C+N) 0,025 UNS S447000,03 1,0 1,0 0,04 0,03 28,0-30,0 3,6-4,2 0,045 1,0 UNS S447350,025 1,0 1,0 0,03 0,01 28,0-30,0 3,5-4,5 [4x(C+N)+0,15]-0,8 0,045 EN 1.45920,01 0,4 0,4 0,03 0,02 28,5-32,0 1,5-2,5 0,015 JIS SUS 447J1
448 0,01 0,2 0,3 0,025 0,02 28,0-30,0 3,5-4,2 0,15 0,02 2-2,5 (C+N) 0,025 UNS S44800
[0.2+4(C+N)]-0,806x(C+N)-1,0
6x(C+N)-1,0
Chemical component (maximum weight %)
719

H02-1
720

H02-2
CORROSION RESISTANCE OF POWDER SINTERED FERRITIC STAINLESS STEELS
S.A. Cruz, R. Poyato, A. Paul, J.A. Odriozola
Universidad de Sevilla, Spain
Abstract It is well known that the mechanical properties and corrosion resistance of sintered metals and ceramics strongly depend on the porosity and grain size of the final material. These depending on the sinterisation process used. In this work AISI-410L ferritic stainless steels specimens have been prepared using spark plasma sintering process. Commercial powders of ferritic stainless steel with large particle size have been mechanically treated in a ball mill to further reduce their grain size. Milling conditions have been optimised to have the lowest grain size attainable by this technique. Also some samples where alloyed with carbon microfibres in order to obtain a composite. All the samples were oxidised at high temperatures to compare their behaviour. Characterisation of the microstructure of these alloys indicates that fully dense material can be fabricated from powder mixtures. These materials have a very small grain. In the case of the ceramic metal composites, the microstructure is formed by acicular metallic reinforcements whose size and distribution can be controlled by means of pressure and temperature High temperature corrosion experiments show that the cermet with 2% carbon microfibres, will suffer strong oxidation due to the absence of a passive layer. Introduction Reduced activation ferritic martensitic (RAFM) steels are one of the main candidates as structural material for the first wall and breeder blanket for fusion reactors. Usually RAFM steels are fabricated by high temperature isostatic pressing (HIP) of metallic powders. However, the use of HIP technologies has disadvantages: the materials are not fully dense and high temperatures account for grain growth. Spark Plasma Sintering process (SPS) (1) might be an alternative to this technique. The main advantage of SPS is the possibility of obtaining fully dense bodies at low temperature and with short sintering times, resulting in a decrease in grain growth, grain sizes of dense bodies are similar to those of the initial mixtures, and hence in enhanced mechanical properties and corrosion resistance (2). Hydrogen and helium are physisorbed on carbonaceous materials (carbon nanotubes, active carbon and carbon microfibres). Carbon microfibres have the highest capacity reported for hydrogen storage in conventional systems (65.5 wt. %) (3). The design of RAFM steels containing carbon microfibres may result in materials with enhanced creep properties which would result in higher service temperatures while favoring hydrogen paths which would lead to lower swelling during service and embrittlement decrease.
721

H02-2
As a first approach we study processing parameters of conventional ferritic steel with carbon microfibres as a tool for understanding the effect of these parameters in grain size, second phase formation and properties modifications. Experimental method AISI 410L metallic powders (Goodfellow) and GANF carbon microfibres (kindly provided by Grupo Antolín, Spain) was used in this work. In order to decrease and homogenise the metal grain size the metal powders were ball milled using a Retsch PM 4 planetary ball mill for 100 hours either alone or mixed with carbon microfibres (2w/w%). Milling times over 100 hours did not result in a further decrease in steel crystallite size. The resulting powders after ball milling were characterized by XRD and SEM. The XRD experiments were performed on a D-500 SIEMENS DIFRACTOMER using CuKα radiation. Crystallite average size was calculated using the Scherrer formula. SEM images were obtained in a JEOL 5400 electron microscope to which an OXFORD LINK EDX spectrometer was coupled. A SPS-515S instrument form SYNTEX Inc. was used for sintering the specimens. Two samples were prepared by heating at 900ºC for 10 minutes either at 25 MPa or 50 MPa. The sintered stainless steels specimens were characterized using AFM, X-ray and SEM. AFM images were taken in contact mode using silicon nitride (NP-20) AFM probes and a NanosCope III instrument (Veeco Instruments GmbH, Mannheim, Germany). Metallographic studies were carried out in a Leica DC300 microscope. The isothermal oxidation of each sample was carried out at 900ºC in a thermobalance (SETARAM TGDTA-92) during 24 hours under synthetic air. Thermogravimetric measurements were performed with a sensitivity of 0.01 mg and temperature control of ±0.01 °C. The temperature rate between room temperature and 900 ºC was 100 °C min-1. Results and Discussion The ball milling process produces a homogenization in sizes together with a decrease in the particle size. Figure 1 shows SEM images of the starting powders after 100 hours milling. The presence of carbon microfibres cannot be assessed since their diameter 20-80 nm is smaller than the microscope resolution.
Figure 1. SEM image of powder after 100 hours ball milling: A) Commercial AISI 410L; B) AISI 410L/carbon microfibres mixture. The milling process results in broadening of the diffraction lines of the ferrite phase, figure 2, indicating a considerable decrease of the steel crystallite size. After 100 hours milling the grain size is 2.2 nm according to the Scherrer method. The addition of GANF microfibres slightly reduces the crystallite sizes that after 100 hours milling is 1.9 nm. The carbon microfibres act as
A B
722

H02-2
a process control agent reducing the extent of cold welding and hence inhibiting agglomeration that results in smaller crystallite size, table 1. Table 1. Sintering conditions and crystal size for the alloys studied in this work.
Alloy FWHM º2θ Crystal size (A) 410L 0.1335 65.0258 --
25-900 0.5038 64.7938 254 50-900 0.4467 64.9061 300
25-900+C 0.3951 64.9016 359 50-900+C 0.4099 64.8973 340
30 40 50 60 70 80
2 theta, deg
AISI 410L
410L-100h
410L+C-100h
Ferrite
Inte
nsity
, a.u
Figure 2. X-ray of powder resulting of milling, 410L, 410L+C (microfibres) and the commercial AISI 410L before the milling process. The figure 3 show the X-ray diagrams for the stainless steels sintered with Spark Plasma. Obviously, the additions of microfibres to the matrix increment the amount of carbide precipitates. The increment of pressure during the sintering process reduces the amount of carbide formation. Also the sintering pressure has a great influence in the final density of the alloys as can be seen in table 2. Table 2. Sintering pressure and apparent density of the alloys prepared for this work.
Alloy Pressure (MPa) Density (%) 410 25 82.5 410 50 91
410+C 25 88.5 410+C 50 96
SEM images of a polished transversal section of the steels obtained by the SPS sintering of 410L and 410L+C alloys are show in the figure 4. The increment in the pressure reduces the pore density in the material. Additionally, the presence of carbon microfibres in the ferritic matrix decreases the porosity the final material. EDX microanalysis shows that the chromium content is higher in the darkest areas.
723

H02-2
30 40 50 60 70 80
2 theta, deg
Ferrite
410L+C-50MPa
410L+C-25MPa
410L-50MPa
410L-25MPa
Fe-Cr Carbides
Inte
nsity
, a.u
Figure 3. X-ray of sintered samples with Spark Plasma: AISI 410L with microfibres and without them for 25 MPa and 50 MPa of pressing.
Figure 4. SEM image of polished transversal section of the steels obtained by the following sintering conditions: A) 410-900ºC-25MPa. B) 410-900ºC-50MPa. C) 410+C-900ºC-25MPa. D) 410+C-900ºC-50MPa The figure 5 shows optical microscopy images of the sintered steels after etching with nital 5% to reveal their microstructure. The four samples are completely ferritic with small grain size that cannot be resolved using this technique. The alloys with carbon microfibres show a microstructure formed by Cr-Fe rich carbides and carbon microfibres (dark areas) and acicular grains of a metallic alloy that has an average composition of 20% Cr, 80% Fe as measured by EDX. The light density of the carbon microfibres makes a volume partition between the metal and the carbon of about 50%-50%. The materials thus prepared can be regarded as ceramic-metal composites, cermets with ceramic matrix of Fe-Cr carbides and carbon microfibres and a metallic reinforcement of elongated Fe-Cr alloy. The AFM lateral force image shows a picture of the surface structure. Lateral force microscopy is especially useful for samples made of several different compounds, showing only a shallow topography but large differences in friction behaviour. Figure 6 shows that, in the presence of carbon microfibres, the alloy have much larger metallic grains (with acicular form) and the contrast of the lateral force images is higher than the ones for alloys without carbon. It seems
A B
C D
724

H02-2
that a new phase is formed in the presence of carbon and that higher pressures inhibit the growth of the metallic reinforcement phase.
Figure 5. Microstructure of the alloys in figure 4 after etching with nital 5%. A) 410-900º-25MPa. B) 410-900º-50MPa. C) 410+C-900º-25MPa. D) 410+C-900º-25MPa
Without C
With C
25 MPa 50 MPa
Figure 6. AFM Lateral Force image of at 900º C. Comparing the oxidation behaviour of 410-900ºC-50MPa with 410+C-900ºC-50MPa, the steel without microfibres have a parabolic kinetic of oxidation. The thermal difusion of Cr allow the formation of Cr2O3 and produces a compact passive layer that controls the isothermal oxidation kinetic. The presence carbon microfibres has aduoble effect on the oxidation kinetics. First lower Cr is available for the formation of the passive layer so that this restriction in the difusion of Cr will lead to a higher oxidation rate. Second, the oxidation od the carbon in the microfibres will
725

H02-2
follow a faster oxidation kinetic. The combination of those two proscesses gives a total linear oxidation kinetics as can be seen in figure 7.
0 10000 20000 30000 40000 50000 60000 70000 800000,0
0,1
0,2
0,3
0,4
0,5
0,6
0,7
0,8
Wei
ght g
ain
by o
xida
tion,
mg/
mm
2
Time, seg
410+C-900ºC-50
410-900ºC-50
Figure 7. Weight gain by the oxidation at 900ºC for 24h in synthetic air. Conclusions The spark plasma sintering process is a valuable tool for the preparation of metals and ceramic-metal composites based on ferritic stainless steels. Characterisation of the microstructure of these alloys indicates that fully dense material can be fabricated from powder mixtures. These materials have a very small grain, with sizes bellow 100 nm. In the case of the cermets, the microstructure is formed by acicular metallic reinforcements whose size and distribution can be controlled by means of pressure and temperature. High temperature corrosion experiments show that the cermet with 2% carbon microfibres, will suffer strong oxidation due to the absence of a passive layer. Acknowledgement The authors thank J. Feliu and M.F. Suarez from the electrochemistry department of the Universitat d` Alacant for their help in the AFM experiments. References [1] M. Omori. Mater. “Sintering, consolidation, reaction and crystal growth by the spark
plasma system (SPS)”. Sci. Eng. A 287 (2000) 183-188. [2] Z.A. Munir, U.Anselmi-Tamburini. “The effect of electric field and pressure on the
synthesis and consolidation of materials: A review of spark plasma sintering method.” J. Mater. Sci. 41 (2006) 763-777.
[3] R. Andreani, M. Gasparotto. “Overview of fusion nuclear technology in Europe”. Fus. Eng. Des. 61-62 (2002) 27-36.
[4] F.L.Darkim, P. Malbrunot, G.P. Tartaglia. “Review of hydrogen storage by adsorption in carbon nanotubes”. Int. J. Hydrogen Energy. 27 (2002) 193-202.
[5] A. Paúl, E. Alves, L.C. Alves, C. Marques, R. Lindau, J.A Odriozola. “Microstructural characterization of Eurofer-ODS RAFM steel in the normalized and tempered condition and after thermal aging in simulated fusion conditions”. Fus. Eng. Des.75-79 (2005) 1061-1065.
[6] A.Szymanska, D. Oleszak, A. Grabias, M. Rosinski, K. Sikorski, J. Kazior, A. Michalski, K. Kurzydlowski. “Phase transformations in ball milled AISI 316L stainless steel powder and the microstructure of steel obtained by its sintering”. Rev. Adv. Mater. Sci. 8 (2004) 143-146.
726

H02-3
IMPROVING THE RIDGING IN AISI 430 FERRITIC STAINLESS STEEL STABILIZED WITH NIOBIUM
T.R. Oliveira, M.A. Cunha, I.N. Gonçalves
ArcelorMittal Inox Brasil S.A. (ex. Acesita S. A.), Brazil
Abstract The typical ridging in 430Nb is undulation like (large ridging), very different from the typical ridging observed in non stabilized 430 grade (narrow ridging). The main cause is the casting structure, where the boundaries of columnar grains are filled with niobium carbonitrides and niobium in solid solution, disturbing recrystallization during the hot rolling process. It induces the formation of grain colonies with poor recrystallization inside, that lead to large bands of different mechanical behavior in the cold rolled sheet. High contents of niobium in solid solution increase ridging in 430Nb. Consequently, the reduction of the stabilization to the minimum necessary to avoid the presence of carbon and nitrogen in solid solution resulted in better recrystallization and lower ridging level. The present AISI 430 stabilized with niobium is suitable for deep-drawing application such as sinks and others kitchen utensils. Introduction When submitted to deformation such as tensile deformation or drawing, cold rolled ferritic stainless steel (FSS) sheets tend to present the defect named ridging or roping, negatively affecting the visual aspect of the pieces. When ridging occurs, grinding and polishing operations become necessary, increasing production cost. Figure 1 displays the macroscopic aspect of the phenomenon.
a) b) Figure 1. a) Typical ridging of an AISI 430 ferritic stainless steel on a rectangular sink and the b) undulation like appearance (large ridging). Along the years, several researchers have proposed different mechanisms to explain this phenomenon, but there is still no definite consensus on the subject. A common point, however, is that ridging is linked to the plastic anisotropy of the body-centered cubic structure and to the heterogeneity of texture in the steel sheet. The studies show the existence of colonies of grains
727

H02-3
with different plastic behavior, as a way to explain the macroscopic characteristics of ridging. In other words, the initial texture and its spatial distribution are the decisive factors in the formation of ridging in these materials. WU et al. [1,2] and SINCLAIR [3] have recently proposed a model, supported by experimental data and modeling, where orientations with severe positive and negative shearing are responsible for the ridging. In the nineties, Acesita developed an AISI 430 ferritic stainless steel (16% Cr) stabilized with niobium, called 430Nb, seeking to obtain better mechanical properties (mainly drawability) and better brightness. It is produced through continuous hot band annealing, which eliminates the low productivity box annealing process. The typical chemical composition of this steel is shown in Table 1. Table 1. Chemical composition of 430Nb steel (% in weight).
Cr Mn Si C N Nb 16.20 0.20 0.30 0.02 0.02 0.35
In 2003, the 430Nb steel had a high level of ridging after 15% of tensile deformation, showing around 80% above the limit that was considered suitable for the most demanding applications (level 1.3). For these applications, such as sinks and some types of tableware, an intermediate annealing process was necessary (double cold rolling) for improving ridging performance, however with additional cost and greater lead-time. In order to reduce the level of ridging in these steels in the direct cold rolling process, several studies were carried out to characterize the defect, to understand ridging formation mechanisms and to find ways to eliminate or reduce such occurrences. Development Kinds of Ridging It was found, initialy, that there were different types of ridging and not just one type, varying according with steel grade and the processing conditions. There is a narrow ridging, regularly spaced from 1 to 2 mm, crest to crest, and large ridging or undulations, with greater crest to crest distances and less regularly spaced (Figure 1b). In general, the 430 steels presented the ridging in the following way:
- 430 Steel not stabilized: light and medium undulations and continuous narrow ridging - 430Nb Steel direct reduction: strong undulations and light narrow ridging - 430Nb Steel via intermediate annealing: light undulations and absence of narrow ridging
A clear difference among the materials could be observed, where the 430Nb via intermediate annealing was the most suitable material for demanding applications and the 430Nb via direct rolling was the material with more problems to be solved, with the main focus on the large ridging. The typical narrow ridging, common on non stabilized 430, was not a problem for the 430Nb steel. Characterization of Hot and Cold Rolled Sheets Due to the addition of niobium and to the low content of interstitials, the 430Nb steel is 100% ferritic in all temperatures. Its process in the hot rolling mill is based on two stages: the first allows the recristalization during rougher rolling and the second the accumulation of strain during Steckel rolling. This strain accumulated on hot rolling allows the subsequent recristalization of the material in the continuous hot coil annealing stage.
728

H02-3
Samples of several hot and cold rolled coils were characterized by optical microscopy (Figure 2) and SEM, mainly by the EBSD technique. After hot rolling, the steel presented a heterogeneous microstructure throughout the thickness, with elongated and deformed grains mainly in the center of the thickness. During hot band annealing recrystalization takes place, resulting in equiaxed grains along the thickness. The ASTM grain size is 7-6 at the edge and 5-6 in the center. The presence of niobium carbonitrides distributed in the ferritic matrix can be observed, which tend do be elongated in the rolling direction. This distribution is not altered by hot band annealing.
After hot rolling
After hot band
annealing
Figure 2. Microstructure of Hot Rolled 430Nb analyzed by optical microscopy, Vilella etching, DL x DN plane. The EBSD microtexture analysis revealed a strong gradient of orientations along the thickness after hot rolling. Close to the surface, presence of shear textures can be observed, mainly Goss {110}<001> and Copper {112}<111> components. These textures are formed due to the shearing brought about by the friction of the work rolls with the surface of the sheet during hot rolling. The shearing effect is null in the center of the thickness, and the material undergoes only plane strain. As a consequence, typical plane strain textures of body-centered- cubic materials develop in this area, with strong presence of alpha fiber {hkl}<110> and a smaller fraction of gamma fiber {111}<uvw>. After annealing, the texture gradient can once again be noticed, with greater shearing texture close to the surface and the presence of alpha and gamma fibers in the center, however with a more intense gamma fiber. After the final annealing, the sheets usually show a homogeneous microstructure throughout the thickness, with ASTM grain size around 8/9. EBSD orientation maps show that the texture is composed mainly of gamma fiber, with a small percentage of {001}<uvw> and {101}<uvw> fibers. That is the expected texture for ferritic steels with 17% Cr, after cold rolling and final annealing. The 430Nb steel presents high area fraction of gamma fiber, around 55%, typical of stabilized steels, which conveys high drawability to the material. The texture banding phenomenon, usually linked to ridging formation, is not easily observed in these materials. As the gamma fiber intensity is high and almost homogeneously distributed, the texture bands are almost imperceptible. That brings about homogeneous mechanical behavior to the material, with narrow ridging of low amplitude. The reason for the low level of narrow ridging of 430Nb steels was the strong intensity of gamma fiber, low banding and a more homogeneous mechanical behavior. However, no microstructural characteristic was found to explain the large ridging. To try and explain large ridging formation, modeling was done seeking to correlate the microtexture with the normal anisotropy (Lankford coefficient r). None of the simulations were successful in explaining the phenomenon. It should be mentioned that the most currently accepted theory about ridging regards the transverse shear as the main mechanism for the ridging/undulations formation, as predicted by WU et al. and SINCLAIR. However, models that take into account transverse shearing were not yet used to analyze the data produced in the present study.
729

H02-3
Influence of Hot Rolling Parameters A study was carried out seeking to evaluate the influence of the macrostructure of the slab (columnar and equiaxed grains) in the 430Nb ridging. Samples coming from columnar and equiaxed slabs were used. The samples were reheated at two temperatures (1050 and 1250°C) and two soaking times (15 and 60 minutes). Afterwards, they were hot rolled at 860ºC and coiled at 700ºC. Samples coming from the slab with totally equiaxed structure presented the best ridging results. These samples were most affected by reheating temperature and soaking time and the best results were obtained at 1250°C with longer reheating time. No clear correlation was observed between the microstructure of the samples after cold rolling and annealing and the ridging levels. All samples presented final microstructure with recrystallized equiaxial grains, although samples coming from columnar grains presented a heterogeneous microstructure throughout the thickness. Chemical Composition Influence Through the direct correlation of the ridging level with the content of alloying elements, mainly niobium, carbon and nitrogen, it was not possible to identify any clear trend. It was necessary to first understand the mechanism of action of these elements in the microstructure. That was done by Oliveira [2003], who showed that niobium in solid solution (not combined with carbon or nitrogen) has a strong effect to reduce or even prevent recrystallization during hot deformation and during annealing processes. Niobium strongly segregates in the grain boundaries, hindering or slowing boundary migration by drag effect. The precipitates also have pronounced effect on grain boundary migration and recrystallization. The ∆Nb (niobium in solid solution) was determined using the equation:
∆Nb = %Nb –7.74 x %C - 6.64 x %N
A more direct way to evaluate ∆Nb is through the Stabilization index (S), defined as: [S = %Nb/(%C + % N)]. The correlation then showed that ridging increases with the stabilization index - ∆Nb (Figure 3a).
67,6
79,7
54,2
63,2
1,86
1,75
1,64
1,53
50
55
60
65
70
75
80
85
< 9.5 9.5 - 10.5 10.5 - 11.5 > 11.5Stabilization
%
1,3
1,4
1,5
1,6
1,7
1,8
1,9
Ave
rage
Rid
ging
% > 1.3Average
Better
0
10
20
30
40
50
60
70
80
90
100
J/03 A J O
J/04 A J O
J/05 A J O
J/06 A J O
Figure 3. a) Correlation between ridging and Stabilization. b) Evolution of ridging level above the limit considered
suitable for most demanding applications. After the identification of the effect of niobium in solid solution on the ridging level, measures were taken to reduce it. The stabilization range of 430Nb steel was reduced, and the most serious cases, with high content of niobium in solid solution were eliminated (high stabilization idexes).
a) b)
730

H02-3
The graph in Figure 3b shows the evolution of ridging in the last years. There was a reasonable improvement in relation to the 2003 level. The production via intermediate annealing was gradually reduced with ridging level improvement via direct cold rolling. The intermediate annealing route is currently used only for the most severe applications. Mechanism of “Large” Ridging Formation The 430Nb steel shows a slab structure that is almost 100% columnar and ferritic structure from solidification to the room temperature. Metallographic analyses of slab samples showed the presence of strong precipitation of niobium carbonitrides along the grain boundaries. The precipitation takes place during cooling of the slabs after continuous casting. As niobium has low solubility in ferrite, it tends to segregate in the grain boundaries and form precipitates in these areas when the precipitation temperature is reached. In another study that was carried out to evaluate the microstructure evolution between hot rolling passes in the Steckel mill, using transfer bar samples, it was observed that columnar grains appear in the surface (Figure 4). As deformation proceeds, these grains tend to be no longer detected by optic microscopy, and the microstructure becomes homogeneous. It is interesting to observe that, even though the starting material was the transfer-bar, traces of the columnar slab structure could be observed after roughing. In a more detailed analysis of the area with grains of columnar aspect close to the surface, a strong concentration of precipitates was observed along the grain boundaries, blocking their free migration. Although there was no diret measurement, it is believed that niobium in solid solution was also segregated in the grain boundaries, also contributing to hinder boundary migration.
a) b) Figure 4. Metalography of the surface (DLxDT). Vilella Etch, DL horizontal. a) before 2° pass b) before 4° pass. Based on the microstructural analyses and the reheating temperature effect a mechanism of “large” ridging formation was proposed. After slab solidification there is a strong precipitation in the columnar grain boundaries. Even after hot rolling and the evolution of the original grain structure with deformation, there would be still traces of the original grains, which could be an indication of recristalization only inside the grains. In this case, recrystallization takes place inside each original grain, once the interface, that is full of niobium carbonitrade and niobium in solid solution, blocks the progression of the recrystallized grains inside the deformed neighboring grains. In this way, the influence of the original grains is much greater, and the microstructure fragmentation and the formation of more random texture reduced. That is schematically shown in Figure 5. As a final consequence, grain colonies with similar orientations occur in the hot rolled sheets. These colonies will produce bands of similar mechanical behavior after cold rolling and annealing, generating the large ridging.
Aligned precipitates
731
H02-3
Figure 5. Scheme of microstructural evolution of columnar grains. An important factor is the columnar grains texture, usually a {001}<uvw> type, that has high recovery capacity and difficult recrystallization, and so would tend to be maintained along the hot rolling process. There are several evidences that corroborate this hypothesis. The first and most important one is that this kind of large ridging does not occur, or only occurs at low level, at stainless producers that use Electro-Magnetic Stirring during the continuous casting operation. Under this condition, around 50% of equiaxed grains and smaller columnar grains are obtained, significantly increasing the grain boundary area and reducing the precipitate density in the boundaries. The reduced precipitate density, combined with larger strain accumulation for equiaxed grains, increase the probability of a more efficient recrystallization during hot rolling, reducing or eliminating the large bands with similar orientations. As a consequence, the “large” ridging is reduced or eliminated in the Cold Rolled sheets. The microstructure evolution in this case is schematically shown in Figure 6. The formation of large ridging would occur due to the evolution of the original columnar grains and the influence of the precipitate in their boundaries.
Figure 6. Scheme of microstructural evolution of slab with 50% of equiaxial grains. This study helped the decision to purchase an Electro-Magnetic Stirrer for ArcelorMittal Inox Brasil, which should be started by the end of 2007. Conclusions The typical ridging in 430Nb was undulation like (large ridging), very different from the typical ridging observed in non stabilized 430 grade (narrow ridging). The main cause of this type of ridging is the casting structure, where the boundaries of columnar grains are filled with niobium carbonitrides and niobium in solid solution, disturbing recrystallization during the hot rolling
732

H02-3
process. It induces the formation of grain colonies with poor recrystallization resulting in bands of different mechanical behavior in the cold rolled sheets. High contents of niobium in solid solution increase the ridging level in these steels. This is related to the effect on recrystallization during the hot rolling and subsequent annealing steps. As a consequence, the stabilization was reduced to the minimum enough to avoid the presence of carbon and nitrogen in solid solution. The AISI 430 stabilized with niobium has now a low ridging tendency. This ferritic grade is suitable for drawing application such as sinks and others kitchen utensils, which were normally made in 304 in the Brazilian and South America markets. References [1] WU, P. D.; JIN, H.; SHI, Y.; LLOYD, D. J. “Analysis of ridging in ferritic stainless steels
sheet.” Materials Science and Engineering, A423, p. 300-305, 2006. [2] WU, P. D.; LLOYD, L. J.; HUANG, Y. “Correlation of ridging and texture in ferritic
stainless steels sheet.” Materials Science and Engineering, 2006. [3] SINCLAIR C.W. “A re-examination of potential models for ridging of ferritic stainless
steel.” Department of Metals and Materials Engineering, University of British Columbia. 2002.
[4] OLIVEIRA, T. R. « Effet du niobium et du titane sur la déformation à chaud d’aciers inoxydables ferritiques stabilisés. » PhD Thesis. Ecole des Mines de Saint Etienne, France, 2003.
733

H02-3
734

H02-4
THE MICROSTRUCTURAL EVOLUTION OF 3CR12 FROM HOT MILL TO FINAL ANNEAL
D. Smith
Columbus Stainless Pty. Ltd., South Africa
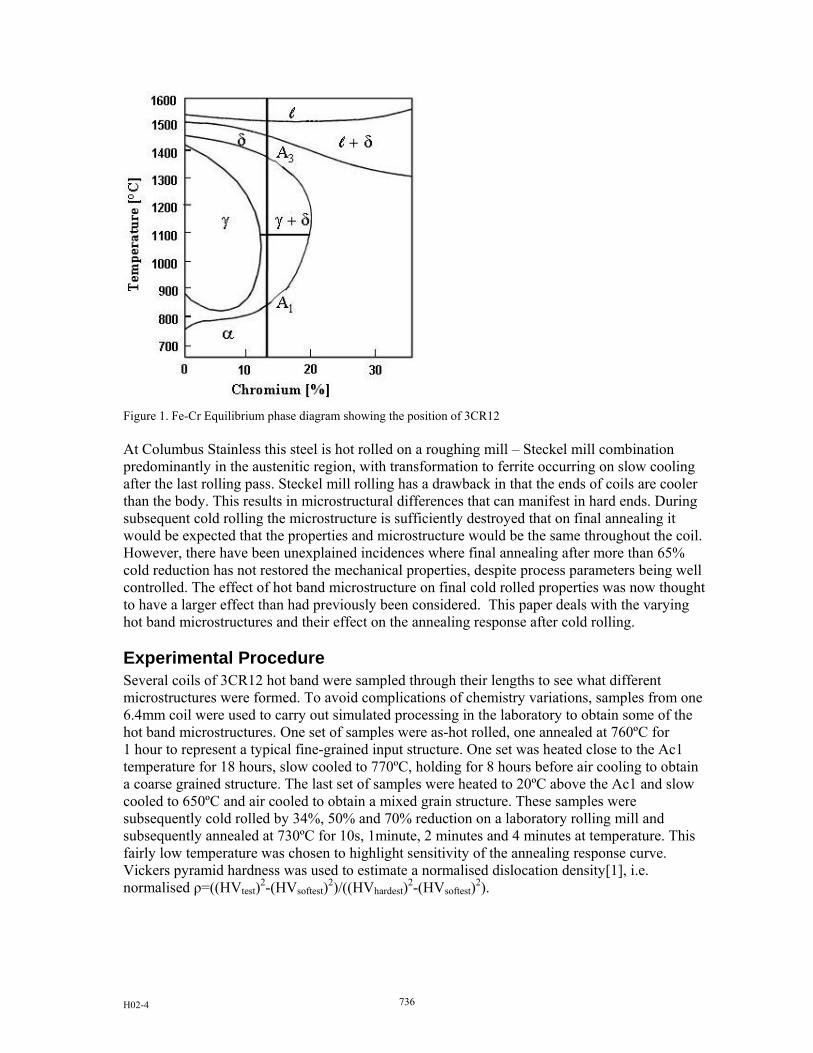
Abstract Hot rolling on a roughing mill – Steckel mill combination results in temperature gradients at the coil ends. 3CR12 is 12%Cr steel that is rolled in a dual phase austenite/ferrite region. This results in the formation of a range of hot band microstructures. These are illustrated and explained in terms of phase transformations during hot rolling, strain gradients and strain rates. The different hot rolled microstructures have a large influence on the annealing response of the final cold rolled product. A large grain structure at hot band results in a significantly faster annealing response of the cold rolled product. This has been explained by texture differences occuring due to phase transformations during hot rolling. The effect of cold reduction on annealing response of 3CR12 follows established rules. Temperature control and pass reductions during hot rolling must, therefore, be closely controlled to produce a consistent cold rolled product. Introduction The 12% Chromium steel designated 3CR12 is a utility corrosion resisting steel extensively used in the mining industry to fill the gap between galvanised carbon steel and the higher alloyed 18% chromium steels. The design of the steel is such that it transforms substantially to austenite above 800ºC, i.e. it lies within the gamma loop as illustrated in figure 1. This is important for welding applications by refining the heat-affected zone structure.
735
H02-4
Figure 1. Fe-Cr Equilibrium phase diagram showing the position of 3CR12 At Columbus Stainless this steel is hot rolled on a roughing mill – Steckel mill combination predominantly in the austenitic region, with transformation to ferrite occurring on slow cooling after the last rolling pass. Steckel mill rolling has a drawback in that the ends of coils are cooler than the body. This results in microstructural differences that can manifest in hard ends. During subsequent cold rolling the microstructure is sufficiently destroyed that on final annealing it would be expected that the properties and microstructure would be the same throughout the coil. However, there have been unexplained incidences where final annealing after more than 65% cold reduction has not restored the mechanical properties, despite process parameters being well controlled. The effect of hot band microstructure on final cold rolled properties was now thought to have a larger effect than had previously been considered. This paper deals with the varying hot band microstructures and their effect on the annealing response after cold rolling. Experimental Procedure Several coils of 3CR12 hot band were sampled through their lengths to see what different microstructures were formed. To avoid complications of chemistry variations, samples from one 6.4mm coil were used to carry out simulated processing in the laboratory to obtain some of the hot band microstructures. One set of samples were as-hot rolled, one annealed at 760ºC for 1 hour to represent a typical fine-grained input structure. One set was heated close to the Ac1 temperature for 18 hours, slow cooled to 770ºC, holding for 8 hours before air cooling to obtain a coarse grained structure. The last set of samples were heated to 20ºC above the Ac1 and slow cooled to 650ºC and air cooled to obtain a mixed grain structure. These samples were subsequently cold rolled by 34%, 50% and 70% reduction on a laboratory rolling mill and subsequently annealed at 730ºC for 10s, 1minute, 2 minutes and 4 minutes at temperature. This fairly low temperature was chosen to highlight sensitivity of the annealing response curve. Vickers pyramid hardness was used to estimate a normalised dislocation density[1], i.e. normalised ρ=((HVtest)2-(HVsoftest)2)/((HVhardest)2-(HVsoftest)2).
736

H02-4
Results and Discussion Hotband microstructures A large variety of microstructures were observed on the hot band coils. Samples from the body of the coils all had the typical fine grained, pancaked microstructure associated with 3CR12 hot rolled in a predominantly austenitic phase field with some ferrite present (figure 2). The coil ends, however, had a variety of microstructures. One of these exotic microstructures consisted of a coarse, equi-axed structure at the surface that suddenly transformed to a fine grained, pancake structure in the centre (figure 2). Another common microstructure consisted of a generally coarse-grained equi-axed/pancake structure throughout the thickness (figure 3). Yet another common microstructure was of a mixed fine and very coarse grained structure (figure 3). There were of course, mixtures of all of these structures.
Figure 2. Normal fine grained pancake hotband structure on left (500x magnification) and example of a coarse grain surface with fine grain centre on the right (50x magnification).
Figure 3. Coarse grained hotband on the left (100x magnification). Mixed grain structure on the right (200x magnification). The coarse grained microstructures were formed when the last pass was rolled in the ferritic region, but still fairly close to the Ac1 temperature. This resulted in quite a lot of grain growth, which typically occurs only at temperatures close to the Ac1 for this steel type. The mixed grain structure is a result of finishing just above the Ac1 in the dual phase region, but where austenite is not the dominant phase. In this case the austenite transforms to fine grained ferrite and the prior ferrite grains merely grow. The coarse grain surface with the sudden transition to a fine grained, pancake structure is testament to the combined effects of strain and temperature. A high shear strain componant occurs during hot rolling at the surface, extending to about the quarter
737

H02-4
band. It is postulated that the surface is colder due to roll cooling but the strain is highest. This would tend to increase the transformation rate, the Ac1 and the ferrite start temperature. The centre, being hotter but with lower strain, remains austenitic. Slow cooling after rolling allows the surface ferrite grains to grow and the austenitic centre to transform to fine-grained ferrite. An illustration of the effects of temperature and strain through the strip thickness is given in figure 4.
Figure 4. Suggested influence of parameter changes through thickness of hot rolled coil during rolling. Effect of hot rolled structure on cold rolled annealing The starting Vickers hardness of the 6.4mm input material and the cold rolled hardness are tabled below. The input microstructures shown in figure 5. Table 1. Hardness change during cold rolling of different starting structures.
Gauge and % Cold Reduction Start Microstructure 6.4mm/0% 4.2mm/34% 3.2mm/50% 1.9mm/70%
As hot rolled 199 247 255 282 Coarse grain 144 227 239 257 Coarse and fine grain 143 230 240 264 Fine grain annealed 170 242 250 273
Temperature
Roll chill effect
Strain – high shear com
ponent at surface
Ac1 and Ferrite start
due to strain variation
Transformation rate
Fraction of Ferrite
T eAc1 Fs Tr %Fe
738

H02-4
Figure 5. Clockwise from top left: As hot rolled (500x magnification); coarse grain (200x magnification); mixed grain (200x magnification); normal hot rolled and annealed (500x magnification). The relative degrees of softening after cold rolling by 34%, 50% and 70% and isothermal annealing at 730ºC using the normalised dislocation density are plotted in figure 6. It is evident that the incoming hot band structure has a large influence on the annealing behaviour after cold rolling. Contrary to what is expected, the finer grain structures of the as-rolled and the as-rolled and annealed at 760ºC samples have a considerably slower annealing response than the large grained microstructures. It is also noted that the minimum hardness threshold is higher on the fine grained input structures. Reasons for this are considered to be due to hot rolled texture differences and shear band formation in the large grains during cold deformation [1,3,4]. Although the coarse grained and mixed grained starting structures were contrived in the laboratory, their response to annealing is considered to be similar to such structures formed after actual hot rolling. As the coils are slow cooled at less than 10ºC/minute from hot finishing temperatures, they self anneal. The crystallographic textures of both laboratory and plant structures are assumed to be similar.
Normalised Dislocation Density vs Time at 730CAs Hot Rolled
0
0.2
0.4
0.6
0.8
1
0 1 2 3 4 5
Time(min)
Den
sity 34% Reduction
59% Reduction70% Reduction
Normalised Dislocation Density vs Time at 730CCoarse Structure
0
0.2
0.4
0.6
0.8
1
0 1 2 3 4 5
Time(min)
Dens
ity 34% Reduction50% Reduction70% Reduction
Normalised Dislocation Density vs Time at 730C
Mixed Structure
0
0.2
0.4
0.6
0.8
1
0 1 2 3 4 5
Time(min)
Den
sity 34% Reduction
50% Reduction70% Reduction
Normalised Dislocation Density vs Time at 730CNormal Annealed Structure
0
0.2
0.4
0.6
0.8
1
0 1 2 3 4 5
Time(min)
Dens
ity 34% Reduction50% Reduction70% Reduction
Figure 6. Annealing response after cold reduction of different incoming hot band microstructures.
739
H02-4
In 17%Cr ferritic hot band that is rolled at lower temperatures with short interpass times, a strong {001}<110> texture component is observed, which is attributed to recovery rather than recrystallisation. This texture component is also pronounced in the centre regions of 10-16% Cr steels containing some austenite during rolling. This α-fibre texture is prone to undergo recovery rather than recrystallisation. These steels, when rolled in the dual phase region, have a strong ζ-fibre (Goss) texture with orientations between {011}<112> and {011}<100> at the surface. This texture is more prone to recrystallisation. Recrystallisation nucleation is dependant on the stored energy. The order of stored energy within the major textures increases from {100}<011> through {110}<001> to {111}<uvw>. The α-fibre textures tend to remain after cold reduction[5]. During annealing after cold rolling the {111}<uvw> component strengthens. To change the α-fibre texture in the strip to the {111}<uvw> component requires more stored energy i.e. higher reductions. In 17%Cr low C+N steels, cold reductions of 35% resulted in deformation bands in large ferritic grains[3]. Nucleation from grain boundaries is favourable for the development of {100}<011> textures, but due to the large grains there are relatively few grain boundary sites. Nucleation for recrystallisation at deformation bands is then predominant. Deformation bands form during cold rolling because of lattice rotation from a meta-stable orientation to a more stable orientation. The meta-stable {110}<001> orientation in the hot rolled strip splits during cold rolling into two twin-related {111}<112> orientations. But at the interface of the {111} orientations there can be a small amount of remnant {110}<001> texture, which is a region of high stored energy. Nucleation for recrystallisation, therefore, occurs more rapidly in these regions giving a greater time for growth of this texture before impingement occurs and thus allowing {110}<001> to become the major component of the recrystallisation texture. With increasing cold reduction the {110} component decreases and the {111} increases. Thus at high reductions the {111} texture predominates. The {110} component decreases with reduction because deformation band nucleation becomes less favourable and in-situ nucleated {111} is favoured. This is in comparison with 17%Cr high C+N where austenite is present during hot rolling and a pancaked structure results where the predominant texture component is the {100}. This is compared with the {110} in the purely ferritic, large grained structure just described. Hence the slower annealing response of the material hot finished in the predominantly austenite phase field. The final grain structure of 70% cold rolled, fully annealed material consists of fine grained equi-axed ferrite in all cases, being only slightly coarser from the coarse-grained incoming hot band. Conclusion The hot rolled microstructure of 3CR12 is very sensitive to finish rolling conditions. Microstructures range from a fine grained pancake structure to that of a very coarse grained structure, with mixtures of both occurring in parts of coils. The fine grained pancake structures are more prevalent at hotter finishing temperatures where the microstructure is mainly austenitic. The coarse grained structures are considered to form when the last pass is on a mainly ferritic microstructure, i.e. close to the Ac1 temperature. A very simple model is used to explain the variation of through gauge microstructures, taking into consideration temperature and strain gradients and variation in the Zener parameter. The influence of the hot band microstructure on the cold rolled properties and final annealing response is marked. The harder incoming hot band results in a harder cold band at any given reduction. As per the basic rules of recrystallisation, the higher the cold reduction the faster the annealing response. In contradiction to another basic rule of recrystallisation, the coarse grained hot band structure had a much faster recrystallisation response. This has been attributed to hot
740

H02-4
band texture differences due to the transformations occurring during and after the last rolling pass. It also appears that these texture differences influence the mechanical property thresholds. References [1] D. Liu, A.O. Humphreys, M.R. Toroghinezhad, J.J. Jonas. “The deformation
microstructure and recrystallisation behaviour of warm rolled steels”, ISIJ International, Vol.42, No.7, 2002, pp.751-759
[2] E.L. Brown, A.J. De Ardo, J.H. Bucher: “The microstructure of hot rolled high strength low alloy steel austenite”, The hot deformation of austenite, AIME,1977. Editor JB Balance, pp 250-265
[3] D.B. Lewis, F.B. Pickering: “Development of recrystallisation textures in ferritic stainless steels and their relationship to formability”, Metals Technology, Vol.10, 1983, pp264-273
[4] D. Raabe: “Overview on basic types of hot rolling textures of steels”, Materials Technology, Steel Reasearch, 74, No.5, 2003
[5] P. Juntunen, A. Kyrolainen, P. Karjalainen: “Effects of hot band annealing and cold rolling reduction on texture and plastic anisotropy of 12Cr-Ti ferritic stainless steels”, Stainless Steels ’99, Science and Market, 1999
741

H02-4
742

H02-5
BEHAVIOUR OF FERRITIC STAINLESS STEEL AT HIGH TEMPERATURE
M.A. Heredia1, C. Luna1, J.F. Almagro1, O. Sanz2, A. Paúl2, J.A. Odriozola2
1ACERINOX S.A., Spain, 2Universidad de Sevilla-CSIC, Spain
Abstract In this work, different ferritic stainless steels (containing Ti and/or Nb) have been treated at high temperatures in aggressive environments. Three different environments were studied: synthetic air, carburizing gas (60%CO-11.5%CO2-26%H2-2.5%H2O at 650ºC) and oxidizing gas as pre-treatment (2.5%H2O in air at 900ºC). The presence of pits on the studied ferritic stainless steel under used carburizing conditions has not been observed. Both steels form iron and chromium oxide layer that protects the surface. The steel with greater amount of titanium in its composition, EN 1.4510, forms titanium oxide when is oxidized in dry air and with water, and it remains during carburizing process. Introduction Ferritic stainless steels are simpler and more economical than austenitic ones since they are less alloyed. Some of them were developed for automobile exhaust systems. Others are used in domestic appliances, pottery, inner decoration, etc. The increasing prices of raw materials in last years together with rising production of emerging markets (China or India) lead European producers to look for alternative solutions to austenitic stainless steels. Nevertheless, the new and different applications require a deep knowledge of the materials to be used in the specific conditions, so a systematic study should be carried out to determine the most suitable application for each type of steel. One of the most interesting studies is to determine materials behaviour at high temperature in different environments reproducing real conditions of industrial processes, such as combustible cells and gas or alcohol reformers. These processes often involve the creation of a synthesized gas (syngas) stream consisting of a mixture of CO, H2 and H2O with lower levels of CO2 and some CH4. When such gas mixtures are present in the process stream in the critical temperature range of about 400° to 800°C, the phenomenon of carburization and metal dusting can potentially be a severe corrosion problem [1–6]. Carburization is an internal carbide formation, occurring at high temperatures and low carbon activities ac < 1, which leads to embrittlement, cracking and loss of oxidation resistance [1, 2]. Metal dusting is a disintegration of metals to a dust of carbon (C) and metal particles, occurring in syngas (CO/H2) and hydrocarbons at C activities ac < 1 and at 400–800ºC [2-6]. Different dusting mechanisms have been observed for nickel (Ni) and iron (Fe) based alloys [7,8,9]. In Fe, and steels, the instable carbide M3C (M = Fe; Ni) (cementite) is formed, which after graphite nucleation decomposes (M3C → 2M + C) by inward growth of graphite. The cementite layer is a diffusion barrier for further C ingress increasing ac, while nucleation of graphite on the surface causes decrease of ac → 1. The metal atoms migrate through the graphite and agglomerate to form metal nanoparticles (≈20 nm), which further catalyze C deposition from
743

H02-5
the gas phase (i.e., often growth of C-filaments from the metal particles). In this work, different ferritic stainless steels (containing Ti and/or Nb [11-13]) have been treated at high temperatures in aggressive environments, such as mixtures of CO2, CO, H2 and H2O. Experimental Two ferritic stainless steels were tested. They have been cold-rolled, annealed and pickled. The chemical compositions of the tested steels and alloys are listed in Table 1. Table 1. Chemical composition of the tested alloys (mass %)
Alloy(EN) Si Mn Ni Cu Cr P Ti Nb C N Al V 1.4509 0.639 0.379 0.212 0.084 17.52 0.024 0.183 0.411 0.021 0.023 0.043 0.100 1.4510 0.614 0.225 0.154 0.076 16.39 0.021 0.568 0.002 0.018 0.018 0.101 0.122
Treatment in air EN 1.4509 and EN 1.4510 ferritic stainless steels have been used for high temperature treatment in air. From the original sheets, specimens of 20 mm x 10 mm x 2 mm have been obtained. Before the treatment, they have been polished with SiC paper up to grit #1000, cleaned, dried and passivated in air. The tests have been carried out in a SETARAM TAG 24 S16 thermobalance in flowing synthetic air at 1 bar pressure, the samples heated up to 1173 K at 100 K.min-1. After 70 hours treatment, they have been cooled down to room temperature. The samples were subsequently examined using X-ray diffraction (XRD), SIEMENS D5000, and field emission scanning electron microscopy (FEG-SEM), ZEISS ULTRA 55. Treatments in carburizing environments EN 1.4509 and EN 1.4510 ferritic stainless steels have been used for treatments in more aggressive environments. The test specimens were similar to the previous ones (2 x 20 x 20 mm). Initially the sheets were pickled with 15% HF/ 40% HNO3 solution at 60ºC during 2 min and rinsed with water, and later were passivated with 60% HNO3 at 60ºC during 1 min and rinsed with water. Finally, the sheets were dried at 100ºC during 30 min. One set of specimens was hung in an alumina boat and exposed at 650ºC to flowing carburizing Gas 1 that consisted of 60%CO-11.5%CO2-26%H2-2.5%H2O. The carbon activity of Gas 1 was 8 at 650ºC, calculated from the reaction CO + H2 = C + H2O according to equation (1) formulated by Grabke [5]. Gas 2 consisted of 2.5% H2O and 97.5% H2/O2, and contained the same amount of water as Gas 1, but without the carbon containing species. Gas 2 was used to slightly oxidize the alloy surface at 900ºC during 22 h. In order to study the initial stages of metal dusting, the analysis was carried out after 24 and 48 h of exposure of specimens. After exposure period, the weight change was determined after removal of the coke in an ultrasonic bath. The samples were subsequently examined using X-ray diffraction (XRD), scanning electron microscopy (SEM), and Raman Spectroscopy. Results and discussion Oxidation After the heat treatment, the thermogravimetric curves of both steels show potential trends and can be fitted by the mathematical equation: ∆W/S = atb, being a = 0.458 and b = 0.115 for EN-1.4509 and a = 0.326 and b = 0.404 for EN-1.4510. In Figure 1, these two curves are shown. The total weight gains are 0,85 mg.cm-2 and 1,65 mg.cm-2, respectively. In EN-1.4510, spallation
744

H02-5
on cooling is observed. After heat treatments, X-Ray Diffraction of both materials has been performed. EN-1.4509 shows AB2O4 and M2O3 signals, being A,B = Fe, Ti, Mn, Cr and M = Cr, Fe. EN-1.4510 shows Ti-rich oxide signals (FeTiO3), together with base material ones, confirming spallation (Figure 2). Through FEG-SEM, protective octahedral oxides (AB2O4 type) are observed in EN-1.4509 sample, while Ti-rich oxides are observed in the case of EN-1.4510 sample. (Figure 3); in this case the sample shows the typical appearance of the steel after spallation, bright areas correspond to the nude metal (shown in Figure 2).
-10 0 10 20 30 40 50 60 70 80
0.0
0.2
0.4
0.6
0.8
1.0
1.2
1.4
1.6
1.8
2.0
dm /
s (m
g/cm
2 )
tiempo (h)
EN 1.4510y = a*x^bChi^2/DoF = 0.00009R^2 = 0.99943a = 0.32608b = 0.4043
EN 1.4509y = a*x^bChi^2/DoF = 0.00001R^2 = 0.99961a = 0.11527 b = 0.45809
Figure 1. TG diagrams of EN-1.4509 and EN-1.4510 after heat treatment at 1173 K, 70 h.
Figure 2. X-Ray Diffractograms of EN-1.4509 and EN-1.4510 after heat treatment at 1173 K, 70 h.
Figure 3. FEG-SEM micrograph of EN 1.4509, left and EN 1.4510, right, surfaces after oxidation during 70 h. Carburization Without oxidation pre-treatment Figures 4 and 5 show the Raman and XRD spectra of the ferritic stainless steels exposed to carburizing gas during 24 and 48 h. The Raman spectra show similar pattern although the intensities of spectra differ. This pattern consists of peaks at about 1600 and 1345 cm−1, which are bands of graphite. The peak around 1600 cm−1 is related to the crystallinity of carbonaceous materials (G band) [10]. The peak around 1345 cm−1 appears in the case of finite crystal size and imperfection of carbonaceous materials and the former is called as D band. It can also be seen that on EN 1.4509 carburized surface during 48h, the ID/IG is 0.96. However, on EN 1.4510 is 1.50. These data suggests that EN 1.4509 forms CNTs/carbon nanosheet with better graphitization degree.
Time (h)
745

H02-5
The peaks of Raman spectra of both alloys, at about 340 and 690 cm-1 indicate the presence of magnetite (Fe3O4), as well as very weak peaks at about 400 and 600 cm-1 in the spectrum for the oxide films generated attributable to hematite (Fe2O3). The formation of chromium oxide scale is observed by the peaks at 295 and 550 cm-1. These results show that the structure of oxide films is predominantly magnetite, and that the oxidation of alloy surface and graphite formation are higher at longer carburization process. These results are consistent with the results obtained by XRD (Figure 5). Fe3O4, Fe2O3 y Cr2O3 were the three main oxides identified. Nevertheless, it can be observed the formation of iron carbide at 61.8 on the EN 1.4510 stainless steel exposed during 48h. The large peaks at 45.5 65.5 and 83.6 are due to the stainless steel substrate.
300 600 900 1200 1500 1800
Raman Shift, cm-1
Inte
nsity
, a.u
.
EN 1.4509
20 30 40 50 60 70 80 902θIn
tens
ity, a
.u.
EN 1.4509
300 600 900 1200 1500 1800
Raman Shift, cm-1
Inte
nsity
, a.u
.
EN 1.4016
20 30 40 50 60 70 80 90
2θ
Inte
nsity
, a.u
.
EN 1.4510
Figure 4. Raman spectra of the ferritic stainless steel exposed to carburizing test: 24h and 48h. ( Graphite, Cr2O3, Fe3O4, α-Fe2O3)
Figure 5. XRD spectra of the ferritic stainless steel exposed to carburizing test: 24h and 48h. ( Alloy, (Cr,Fe)2O3, Fe3O4, IronCarbide)
The SEM micrographs in Figure 6, shows that carbonaceous materials were fibres or carbon nanotubes and, in the left micrograph, the beginning of the formation of such carbon nanotubes on the surface of the EN 1.4510 steel is observed.
Figure 6. SEM micrograph of EN 1.4510 surface after carburization during 48h. Micrographs in Figures 7 and 8 show the surface morphology of EN 1.4509 and 1.4510 exposed to carburizing gas during 48h. In EN 1.4509, alloy changes on the surface morphology were not
A B
746

H02-5
observed. Nevertheless, in the Figure 7.C, at higher magnification, rich in niobium and titanium grains were observed covering the whole surface.
Figure 7. Surface morphology of EN 1.4509 before (A) and after exposed at GAS 1 during 48h (B and C). Figures 8 B and C (at higher magnification) show the presence of external continuous scale layer with almost complete coverage of the underlying substrate. Two different zones were observed. The roughest zone with smaller grains, was richer in titanium that the one with greater grains. Nevertheless, the roughest zone was poorer in chromium.
Figure 8. Surface morphology of EN 1.4510 before (A) and after exposed at GAS 1 during 48h (B and C). With oxidation pre-treatment Figures 9 and 10 show the Raman and XRD spectra of the ferritic stainless steels exposed first to Gas 2 during 22 h (oxidation pre-treatment) and, after, to Gas 1 for 48 h. The Raman and XRD spectra of the stainless steels exposed to oxidizing Gas show formation of iron oxides (Fe3O4, Fe2O3 and FeO2) and Cr2O3. Nevertheless, there are differences between studied steels. Oxidized EN 1.4510 steel presents formation of TiO2.SEM analysis of oxidized EN 1.4509 surface did not show any change. Nevertheless, in the surface morpholgy of oxidized EN 1.4510 (Figure 10-A-1), the presence of a external continuous scale layer in the grain boundaries (rich in titanium) and in grains (rich in chromium) is observed. When the oxidized stainless steels are exposed to carburizing gas during 48 h, carbon nanotubes formation is observed. The Raman spectra show peaks at about 1600 and 1345 cm−1, bands of graphite (Figure 9). The presence of iron oxides and Cr2O3 is observed in both steels (Figures 9 and 10). In addition, the titanium oxide is observed on EN 1.4510 surface after the carburizing treatment. SEM images of the carburized EN 1.4510 show a smoother surface morphology than the oxidized only one (Figure 11). Nevertheless, it is possible to observe the presence of great crystals (rich in titanium) (Figure 11-A-2).
A B C
A B C
747

H02-5
300 600 900 1200 1500 1800
Raman Shift, cm-1
Inte
nsity
, a.u
.
EN 1.4509
20 30 40 50 60 70 80 90
Inte
nsity
, a.u
.
2θ
EN 1.4509
300 600 900 1200 1500 1800
Raman Shift, cm-1
Inte
nsity
, a.u
.
EN 1.4510
20 30 40 50 60 70 80 90
Inte
nsity
, a.u
.
2θ
EN 1.4510
Figure 9. Raman spectra of the ferritic stainless steel after different gas atmosphere exposition: 22h Gas 2, and a 22h Gas 2 + 48h Gas 1. ( Graphite, Cr2O3,
Fe3O4, α-Fe2O3, γFeO2, TiO2)
Figure 10. XRD spectra of the ferritic stainless steel after different gas atmosphere exposition: 22h Gas 2, and adcd22h Gas 2 + 48h Gas 1. ( Alloy, (Cr,Fe)2O3,
Fe3O4, Iron Carbide, TiO2)
Figure 11. Surface morphology of the steels exposed at GAS 2 during 22 h (1) and the steels exposed first to Gas 2 and after to GAS 1 during 48 h (2); EN 1.4509 (A) and EN 1.4510 (B). Conclusions In conclusion, we investigated the behaviour of ferritic stainless steels in different gases at high temperature. EN 1.4509 can be considered as a material with a suitable behaviour in air without humidity at 1173 K. Metal dusting is initiated by the presence of carbides. The growth and oxidizing of those carbides, lead to local-scale damage processes and to preferential internal carburization around carbide particles. Nevertheless, the presence of pits on the studied ferritic stainless steel under carburizing conditions has not been observed. Both steels form iron and
100µm
100µm
100µm
100µm
A-1 A-2
B-1 B-2
748

H02-5
chromium oxide layer. The steel with greater amount of titanium in its composition, EN 1.4510, forms titanium oxide when is oxidized with or without water, and it remains during carburizing process. References [1] A. Schnaas, H.J. Grabke, Oxid. Met. 12 (1978) 387 [2] A. Rahmel, H.J. Grabke, W. Steinkusch, Mater. Corr. 49 (1998) 221. [3] J.C. Nava Paz, H.J. Grabke, Oxid. Met. 39 (1993) 437. [4] H.J. Grabke, R. Krajak, J.C. Nava Paz, Corr. Sci. 35 (1993) 1141. [5] H.J. Grabke, Mater. Corr. 49 (1998) 303. [6] H.J. Grabke, E.M. Müller-Lorenz, Mater. Corr. 49 (1998) 317. [7] H.J. Grabke, R. Krajak, J.C. Nava Paz, Corr. Sci. 35 (1993) 1141. [8] E. Pippel, J.Woltersdorf, R. Schneider, Mater. Corr. 49 (1998) 309. [9] C.M. Chun, T.A. Ramanarayanan, J.D. Mumford, Mater. Corr. 50 (1999) 634. [10] F. Tuinstra and J. Koenig, J. Chem. Phys. 53 (1970)1126. [11] A.J. DeArdo, C.I. Garcia, M. Hua, G. Tither and K. Hulka. “Ferritic Stainless Steel – The
metallurgical background and benefits of dual stabilization.” [12] John F. Grubb. “Stabilization of high-chromium, Ferritic Stainless Steels.” Proceeding of
International Conference on Stainless Steels, 1991, Chiba, ISIJ. [13] A.J. DeArdo. “Niobium in Ferritic Stainless Steels.” Basic Metals Processing Research
Institute Department of Materials Science and Engineering. University of Pittsburgh, USA.
749

H02-5
750

H02-6
MICROSTRUCTURAL DEVELOPMENT OF 17% CHROMIUM FERRITIC STAINLESS STEELS FOR ELECTROMAGNETIC ACTUATION:
EXPERIMENTS AND MODELLING
N. Meyer1,3, Y. Bréchet1, M. Véron1, O. Geoffroy2, M. Mantel3, P.E. Dubois3
1SIMaP Metal Physics Group, France, 2Néel Institue, France, 3Ugitech Research, France
Abstract Recovery and recrystallization of 430 and 430Nb grades are investigated and modelled with the aim to have a better control of microstructure formation in the last annealing step. In a second part, the microstructural influence on magnetic properties in static and dynamic conditions is studied on thick sample geometry. New considerations arise in the choice annealing treatments for reducing magnetic losses. Introduction Improving the response-time of fuel injection valves is a well-know strategy to reduce car consumption and to limit noxious emission gas. This exciting challenge has often been tackled from the technological approach but progress could also come from microstructural optimization. The response-time of an electromagnetic actuator is indeed controlled by magnetic properties such as permeability or losses in dynamic condition that are highly microstructure dependent. 17%Cr ferritic stainless steel (430) was chosen for this application because of its corrosion resistance. This latter can even be improved by Niobium stabilization (430Nb) to avoid intergranular corrosion [1]. In this study our aim is two-fold: first, understand annealing processes on 430 and 430Nb in order to have a better control of microstructure formation, and second, understand the influence of microstructure on magnetic losses. After a rapid presentation of the materials considered and the experiments performed, annealing processes are studied experimentally and modelled. Then, on selected microstructural states, the influence of an annealing treatment on the static BH loop and on magnetic losses is discussed. Materials and experimental methods Composition The compositions of 430 and 430Nb grades considered in this study are reported in table 1. Table 1. composition of the two grades considered
grade (AISI) C +N C r N b Mn Si430 < 0,05 16,1 < 0,004 0,4 0,35
430Nb < 0,03 16,2 0,27 0,32 0,35
751

H02-6
Initial state These alloys were received from Ugitech SA after hot rolling and a further heat treatment of martensite regression in the case of alloy 430. In initial state, the microstructures of both grades have similar 30 µm grain size but have very different precipitates location. In alloy 430Nb precipitates are homogeneously distributed whereas in 430 alloy a strong precipitation at grain boundaries and within former martensitic bands is found (see Fig 1)
a b Figure 1. optical micrographs of 430Nb (a) and 430 (b) in initial state Microstructure formation and characterization From these initial states, 20% conventional deformations in tension are performed at 410.3 − s-1 strain rate and followed by annealing in salt bath furnace at two temperatures 750°C and 850°C for various time treatments. Softening kinetics were followed by hardness measurements with a load of 1 Kg in the centre of the rod. The obtained results are compared with microstructure evolution observed by optical microscopy after tint etching at 75°C in a solution containning 110 mL H2O, 12 mL H2SO4, 4 mL HF and 0.1 mL HNO3. Fine interaction between grain boundary and precipitates was investigated by TEM on foils thinned by electropolishing in a mixture containting 90% vol. acetic acid and 10% vol. perchloric acid under 30V. Magnetic characterizations Six toroidal samples of rectangular section were spark cut from the 20% deformed 430Nb wire. Three of them A, B and C were kept in the deformed state to study the effect of the thickness for a given microstructure. The other toroids D, E and F were annealed to obtain very different microstructures (see Table 2). Magnetic characterizations were conducted by fluxmetric measurement under sine waveform excitation (see [2] for more details on this device). Measurements of the B-H loop were carried out for three different peak inductions 0.5 T, 1 T and 1.5 T and various excitation frequencies ranging from 0.5 Hz to 400 Hz. Table 2. heat treatments performed on toroidal samples for magnetic characterizations
Denomination Section Annealing Cooling A Small (1 x 3 mm2) - - B Medium (2 x 3 mm2) - - C Large (3 x 3 mm2) - - D Large (3 x 3 mm2) 3 min at 850°C Air quenched E Large (3 x 3 mm2) 30 min at 850°C Air quenched F Large (3 x 3 mm2) 30 min at 850°C -10°C / min
Intergranular precipitates Intragranular
precipitates
752

H02-6
Microstructural evolution during annealing Experimental results Global softening kinetics are presented in Fig 2. After deformation, the two grades have similar hardness around 200 HV. Then, when time treatment is increased, hardness decreases under recovery and recrystallization processes.
- At 750°C, microstructural investigations revealed that for both grades, no recrystallization happened for treatment duration ranging from 1 min to one hour. The two grades exhibit similar recovery kinetics (Fig 2a).
- At 850°C, recrystallization was observed for both grades and had for consequence an increase in grain size (see Fig 3 a and b). For 430, the onset of recrystallization (indicated by an arrow in Fig 2b) is significantly delayed in comparison with 430Nb. In addition, primary recrystallization completes after 15min for 430Nb whereas a much slower primary growth kinetic is found for 430. For this latter grade, deformed grains are still observable after a treatment of 8h. Some of them are located within big recrystallized grains; they will be called island grains in the following (see Fig 3a)
a b
Figure 2. experimental points and model (lines) of softening kinetics for 430 and 430Nb at 750°C (a) and 850°C (b). Interaction between precipitation and grain boundary was investigated with TEM in 430 in a partially recrystallized state. Intergranular precipitates were found to hinder the bulging of the grain boundary in the deformed grain (see Fig3c).
a b c
Figure 3. optical micrographs of 430 and 430Nb after advanced recrystallization (a: 430 after 8 h at 850°C and b: 430Nb after 15 min at 850°C). c: TEM image showing interaction between intergranular precipitates and the grain boundary (GB). Interpretation and modelling In deformed state, the two grades differ mainly by their precipitation location. The fact that the onset of recrystallization is delayed for 430 although recovery kinetics are the same for the two
Intergranular precipitates
Bulging GB Island grains
753

H02-6
grades, is an evidence that intergranular precipitates of 430 are hindering nucleation of recrystallization more than homogeneous precipitates of 430Nb grade. For low deformation levels in ferritic steels, the nucleation mechanism is known to be strain-induced grain boundary migration (SIBM) [3]. In 430Nb, the area free to bulge will be given by the sub-grain size, whereas in 430 this area will be further limited by the interprecipitates distance as seen in Fig 3c. This pinning effect probably explains why the onset of recrystallization is delayed. An important difference can also be noted in primary growth mechanism of 430 and 430Nb. In 430Nb, since precipitate distribution is homogeneous, the moving grain boundary of a recrystallized grain experiences a constant Zener pressure. In 430, primary growth will be discontinuous: just after nucleation the moving grain boundary will invade quickly the neighbouring deformed grain, facing almost no obstacle, but it will be stopped at the next grain boundary by intergranular precipitates. Further growth will require a renucleation that will occur where interprecipitates distance is the larger. For these reasons, primary growth will be discontinuous and anisotropic for 430 whereas it will be continuous and isotropic for 430Nb. In this interpretation, island grains correspond probably to deformed grains associated to low stored energy or surrounded by finely spaced precipitates such as the re-nucleation criterion has never been achieved. The mechanisms of interaction between recrystallization and intergranular precipitates, proposed above, were implemented in a physically based model already accounting for the competition between recrystallization and recovery [4]. The results of the model are superimposed to experimental data in Fig 2. One can see that the modelled softening kinetics are in good agreement with experiments. Magnetic characterizations In this section, only 430Nb has been considered for studying the effect of heat treatment on magnetic properties. The microstructures selected have been presented in section 1, table 2. Experimental results In quasistatic conditions, one can see that the hysteresis loop is changed to a large extent by recovery and recrystallization processes but also by quenching. Schematically, annealing processes will reduce the coercive field (Fig 4a) whereas a quench will have no effect on coercive force but will modify largely the high field part of the curve (Fig 4b).
a b
Figure 4. Influence of annealing treatment on the B-H quasitatic loop (1 Hz – 1 T). a: effect of annealing treatment, b: effect residual stresses from quench. In dynamic conditions, the effect of the driving frequency on the magnetization processes is represented by the loss curves (see Fig 5). Total losses are an increasing function of frequency and, are attributed, for this range of frequency, to Eddy current damping. It is found
754

H02-6
experimentally that volumic losses are dependent on microstructure: the effect of a recovery annealing is deleterious from the point of view of magnetic losses when compared to deformed and recrystallized states (see Fig 5a). For recrystallized states, a quench is significantly lowering magnetic losses compared to a slow cooling treatment (see Fig 5b). The influence of geometry on volumic total losses was also emphasized experimentally. Losses are significantly reduced by a reduction of the specimen section (see Fig 5c)
a b
0 50 100 150 200 250 300 350 400
0
1000
2000
3000
4000
5000
6000
7000
8000
9000
Frequency (Hz)
Tota
l vol
umic
mag
netic
loss
es (J
/m3) exp 0.5 T
exp 1 T
exp 1.5 T
model 0.5 T
model 1 T
model 1.5 T
c d
Fig 5. loss curves, representing volumic energy loss per cycle as a function of excitation frequency. Graphs a and b show the influence of microstructure on losses at 1.5T peak induction. Graph c shows the influence of the toroid section on losses at 1.5T peak induction. Graph d shows losses modelling in the case of specimen A at 0.5, 1 and 1.5 T peak inductions. Interpretation and discussion In quasitatic conditions, the decrease of Hc with increasing annealing time is due to the decrease of the dislocation density for recovered state (specimen D), but also to the increase of grain size for recrystallized state (specimen E). Contrary to internal stresses from dislocations, quenching stresses are varying at the scale of the specimen (external regions of the specimen are in compression whereas centre regions are in tension [5]). Within a magnetic domain, the stress field induced by quenching is homogeneous and leads to an additionnal magneto-elastic energy whose gradient is zero. Thus, quenching stresses have no pinning effect, but they are at the origin of an additionnal anisotropy term and will change the high field part of the curve where rotation processes are dominant. In dynamic conditions, interpretation of losses dependence on microstructure requires a separation of total losses in the three usual contributions: hysteresis, classical and excess losses. In the following this separation is discussed. Hysteresis losses correspond to total losses when driving frequency tends to zero. This quantity characterizes the amount of irreversibility caused by domain wall displacement and, as a result, it
755
H02-6
has the same microstructural dependence as Hc. However, in our case, the relative importance of this contribution was found to be negligible (see Fig5). Classical losses are difficult to evaluate in the case of large section specimen in which shielding effects from Eddy currents cannot be neglected. A numerical approach is required and is being developped to interpret the results for this particular geometry. At present time, we can only conclude quantitatively for specimen A, where the flux penetration is homogeneous and analytic calculation of classical losses is possible. In this case, Bertotti’s modified model [6] provides a reasonable agreement with experimental data with excess loss contribution close to zero (see Fig 5d). This means that the relative importance of the excess losses in total losses is already negligeable for 1mm thick sample. This conclusion, in agreement with other studies [7], is even more valid for thicker samples with similar microstructure. In this framework, the influence of microstructure on losses shown in Fig 5a and 5b can be qualitatively understood. A microstructure associated to a square DC loop (eg. specimen F) with high permeability will get magnetized sequentially starting from the outer to the center of the specimen. The phase shift developed will be responsible for extra classical losses [7]. On the contrary, a more linear material (eg. specimen E, C) will have more homogeneous flux penetration and will get magnetized simultaneously in the outer and in the centre of the specimen and lower classical losses are recorded. For this reason, a rather low permeability can be interesting to limit dynamic losses in thick specimen under sine excitation waveform. Conclusions Annealing phenomena were studied in 430 and 430Nb grades. Low Nb stabilization was found to accelerate significantly the recrystallization kinetics due to a different precipitation location. A physically based model that accounts for the interaction between recovery recrystallization and precipitation was proposed and is in good agreement with experimental kinetics. The effect of microstructure on magnetic losses was investigated for 430Nb on thick samples close to the geometry of the actuator. Contrary to the case of thin slabs (0.2 mm) of transformer steels for which microstructural dependence of total losses is carried by hysteresis and excess losses terms, total losses of our bulk specimens are overwehlmed by the classical losses term which is found to depend on microstructure through permability. For this reason, a square static loop, characteristic of internal stress free specimen, will give rise to high total losses. It is possible to reduce these losses controling the permeability of the material with internal stresses from dislocation or more efficiently , resulting from quench. These qualitative interpretations need to be supported by a full modelling of flux penetration. References [1] M. Mantel, B. Baroux, D. Gex and P. Pedarre, Recrystallization ‘90, edited by T. Chandra,
The Minerals, Metals & Materials Society, 1990, pp. 345-351 [2] N. Meyer, Y Bréchet, M. Véron, M. Mantel, P.E. Dubois and O. Geoffroy,
Recrystallization and Grain Growth 2007, Materials Science Forum, Vol 558-559, 2007, pp. 253 – 258
[3] J.W.C. Dunlop, Y.J.M. Bréchet, L. Legras and H.S. Zurob, Journal of Nuclear Materials, Vol 366, Issues 1-2, 2007, pp. 178-186
[4] H. Réglé, HDR dissertation, Université Paris 13, 2005 [5] S. Ben, B. Aksakal, A. Ozel, International Journal of Mechanical Sciences, Vol 42, 2000,
pp. 2013-2029 [6] F. Fiorillo and A. Novikov, IEEE Transactions on Magnetics, Vol 26, 5, 1990, pp. 2904-
2910 [7] C. Appino, G. Bertotti, O. Bottauscio, F. Fiorillo, P. Tiberto, D. Binesti, J. P. Ducreux, M.
Chiampi, and M. Repetto, J. Appl. Phys., Vol. 79, 1996, pp. 4575-4577
756

H02-7
A COMPARATIVE STUDY OF PRECIPITATION EFFECTS DURING AGEING OF SUPERAUSTENITIC AND SUPERFERRITIC STAINLESS
STEELS
T. Koutsoukis, K. Konstantinidis, G. Fourlaris
National and Technical University of Athens, Greece
Abstract The purpose of this paper is to present the microstructural analysis results of commercial hot – rolled superaustenitic and experimental cold rolled superferritic grades, following prolonged ageing at various temperatures. The steels studied were S32654 and S31254 superaustenitic grades and a novel superferritic grade, subjected to either a 10% or a 20% cold rolling reduction and produced via the HIP method. The microstructure of the samples was studied following isothermal ageing at 650oC, 750oC, 850oC and 950oC for ageing times up to 1000h. The microstructure was assessed via SEM microscopy coupled with EDS microanalysis and XRD phase identification. The present study helped clarify the effect of high temperature exposure on the comparative precipitation sequences of both novel superaustenitic and superferritic stainless steels. The heat treatments performed indicate a number of phase transformations leading to precipitation of intermetallic phases taking place and a time – temperature regime was defined where care must be taken during the fabrication and use of these steels. Sigma (σ) and chi (χ) phases are the most important intermetallic phases forming. The mechanical properties were preliminary assessed via hardness testing and the hardness – ageing time curves were obtained. Introduction Superaustenitic and superferritic stainless steels are two of the most recent families of stainless steels developed for exhibiting a combination of enhanced corrosion resistance in aggressive media coupled with excellent mechanical properties. These novel grades, offer superior resistance to pitting and stress corrosion cracking, at sub – zero, room and elevated temperatures, combined with exceptional strength, formability and weldability characteristics, in a variety of aggressive environments where conventional stainless steels would be unsuitable for use. High performance stainless steels are prone to the formation of secondary phases and precipitates following ageing at elevated temperatures [1-5]. Molybdenum and nitrogen are two of the most interesting alloying elements present in these steel grades. Molybdenum is partly responsible for the formation of intermetallic phases, such as sigma, chi and the group of the Laves phases, especially when present in the steel composition together with nitrogen [4]. Superaustenitic stainless steels have many applications in pulp and paper industry, food, energy, chemical and oil industry such as in offshore and submarine environments. The most important alloying elements, in addition to chromium and nickel, are molybdenum and nitrogen. Both elements enhance corrosion resistance, especially when combined together and also improve the mechanical properties of the steel [6-10]. Superferritic stainless steels are designed to offer superior corrosion resistance when compared to conventional austenitic stainless steels, at lower
757
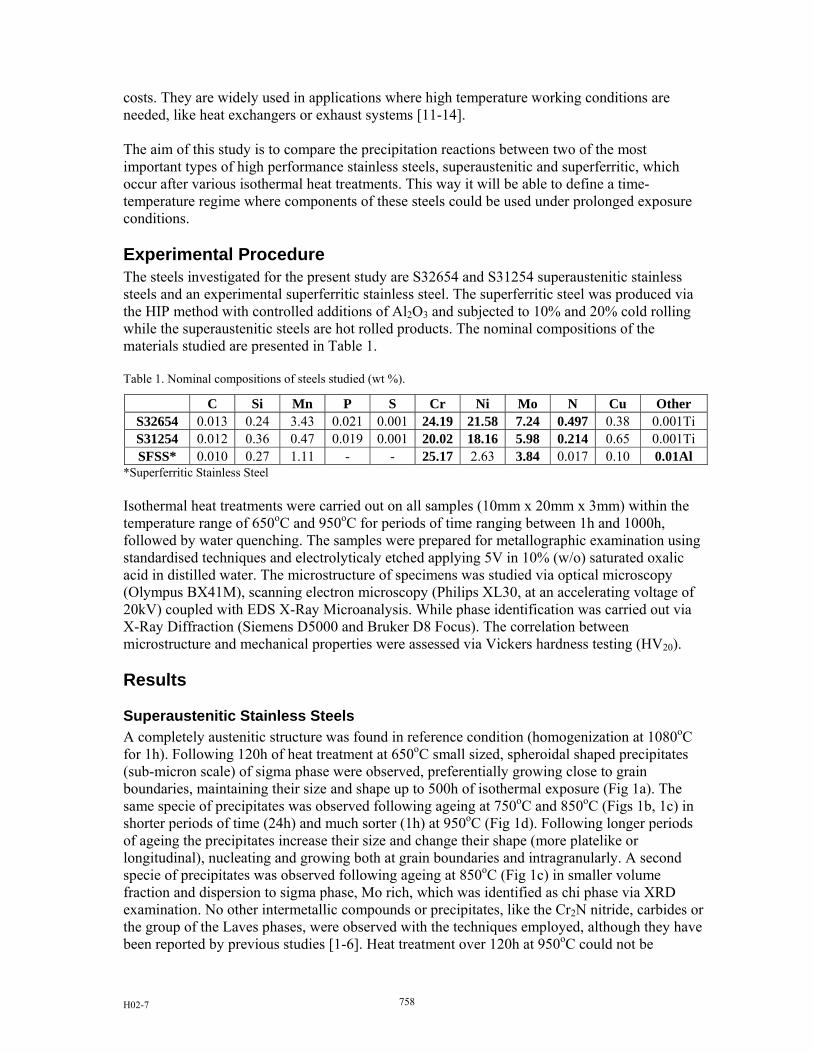
H02-7
costs. They are widely used in applications where high temperature working conditions are needed, like heat exchangers or exhaust systems [11-14]. The aim of this study is to compare the precipitation reactions between two of the most important types of high performance stainless steels, superaustenitic and superferritic, which occur after various isothermal heat treatments. This way it will be able to define a time-temperature regime where components of these steels could be used under prolonged exposure conditions. Experimental Procedure The steels investigated for the present study are S32654 and S31254 superaustenitic stainless steels and an experimental superferritic stainless steel. The superferritic steel was produced via the HIP method with controlled additions of Al2O3 and subjected to 10% and 20% cold rolling while the superaustenitic steels are hot rolled products. The nominal compositions of the materials studied are presented in Table 1. Table 1. Nominal compositions of steels studied (wt %).
C Si Mn P S Cr Ni Mo N Cu Other S32654 0.013 0.24 3.43 0.021 0.001 24.19 21.58 7.24 0.497 0.38 0.001Ti S31254 0.012 0.36 0.47 0.019 0.001 20.02 18.16 5.98 0.214 0.65 0.001Ti SFSS* 0.010 0.27 1.11 - - 25.17 2.63 3.84 0.017 0.10 0.01Al
*Superferritic Stainless Steel Isothermal heat treatments were carried out on all samples (10mm x 20mm x 3mm) within the temperature range of 650oC and 950oC for periods of time ranging between 1h and 1000h, followed by water quenching. The samples were prepared for metallographic examination using standardised techniques and electrolyticaly etched applying 5V in 10% (w/o) saturated oxalic acid in distilled water. The microstructure of specimens was studied via optical microscopy (Olympus BX41M), scanning electron microscopy (Philips XL30, at an accelerating voltage of 20kV) coupled with EDS X-Ray Microanalysis. While phase identification was carried out via X-Ray Diffraction (Siemens D5000 and Bruker D8 Focus). The correlation between microstructure and mechanical properties were assessed via Vickers hardness testing (HV20). Results Superaustenitic Stainless Steels A completely austenitic structure was found in reference condition (homogenization at 1080oC for 1h). Following 120h of heat treatment at 650oC small sized, spheroidal shaped precipitates (sub-micron scale) of sigma phase were observed, preferentially growing close to grain boundaries, maintaining their size and shape up to 500h of isothermal exposure (Fig 1a). The same specie of precipitates was observed following ageing at 750oC and 850oC (Figs 1b, 1c) in shorter periods of time (24h) and much sorter (1h) at 950oC (Fig 1d). Following longer periods of ageing the precipitates increase their size and change their shape (more platelike or longitudinal), nucleating and growing both at grain boundaries and intragranularly. A second specie of precipitates was observed following ageing at 850oC (Fig 1c) in smaller volume fraction and dispersion to sigma phase, Mo rich, which was identified as chi phase via XRD examination. No other intermetallic compounds or precipitates, like the Cr2N nitride, carbides or the group of the Laves phases, were observed with the techniques employed, although they have been reported by previous studies [1-6]. Heat treatment over 120h at 950oC could not be
758

H02-7
concluded due to the full oxidisation of the small samples employed in the present study. The hardness values versus ageing time are shown in Figure 2, for the superaustenitic steels studied.
Figure 1. Backscattered electron images showing precipitation of sigma and chi phase following ageing in a. S31254 at 650oC for 500h, b. S31254 at 750oC for 1000h, c. S32645 at 850oC for 500h and d. S32654 at 950oC for 120h.
100
200
300
400
500
600
0 100 200 300 400 500 600 700 800 900 1000Ageing Time (h)
Har
dnes
s (H
V)
S32654/650oC
S32654/750oC
S31254/750oC
S32654/850oC
S32654/950oC
S31254/850oC
S31254/650oCS31254/950oC
Figure 2. Evolution of hardness (HV) versus ageing time (h) for superaustenitic stainless steels S32654 and S31254. Superferritic Stainless Steel A ferritic structure with Al2O3 particles dispersed primarily at grain boundaries was found in the reference condition (10% and 20% cold rolled following receipt of the material). Following ageing at 650oC (Fig 3a) for 24h nucleation of a second phase was observed at grain boundaries. Following prolonged ageing times these precipitates, which were identified as sigma phase via XRD examination, have coarsened developing intragranularly or at grain boundaries. The same phase transformation was observed following heat treatment at 750oC and 850oC (Figs 3b, 3c) where faster transformation kinetics were noted. Ferrite transformation to sigma phase occurs following 24h or 1h of ageing at 750oC or 850oC, respectively, for both 10% and 20% cold rolled samples and sigma phase continues coarsening even following 500h of ageing. Ferrite transformation to sigma phase starts early at 950oC (following 1h of ageing), adopting rapid
a
σ
bσ
χ
c σ dσ
759

H02-7
coarsening rates (within few hours, Fig 3d). A second precipitate species, Mo rich, was observed dispersed mostly intragranularly but also within the grain boundaries following ageing at 650oC, 750oC or 850oC.This precipitate appears to be present simultaneously with sigma phase. Precipitation of this phase takes place following 24h to 500h of ageing, at 650oC or at 750oC for ageing times ranging from 1h to 200h at 850oC, while its presence was not observed, following ageing at 950oC. This phase could either be chi phase or some of the group of Laves phases but neither of these phases could be confirmed with the experimental techniques employed at the present study. The hardness values versus ageing time are shown in Figure 4, for all the superferritic steel studied.
Figure 3. Backscattered electron images showing precipitation of sigma and rich in Mo phase following ageing in a. 10% cold rolled SFSS at 650oC for 200h, b. 10% cold rolled SFSS at 750oC for 200h, c. 20% cold rolled SFSS at 850oC for 500h and d. 20% cold rolled SFSS at 950oC for 200h.
100
200
300
400
500
600
0 100 200 300 400 500 600 700 800 900 1000Ageing Time (h)
Har
dnes
s (H
V)
10%/650oC
10%/950oC
10%/850oC
10%/750oC
20%/650oC
20%/750oC
20%/850oC
20%/650oC
Figure 4. Evolution of hardness (HV) versus ageing time (h) for 10% and 20% cold rolled superferritic stainless steel.
a σ Mo rich
b
σ α
Mo rich
d σ α c
σα
760

H02-7
Discussion Transformation of austenite to sigma phase was observed following isothermal heat treatments at 650oC to 950oC for the superaustenitic grades, S32654 and S31254 studied. Sigma phase precipitations nucleate both inter and intragranularly. Precipitation takes place following 1h and 24h of ageing at 950oC or at 850oC, respectively, for S31254 and at slightly shorter intervals for S32654, due to its higher alloy content in Cr and Mo. Precipitation of sigma phase occurs at longer ageing times (in excess of 120h), following ageing at lower temperatures (750oC and 650oC), for both steel grades. High N contents could also retard sigma phase precipitation and lead to Cr2N nitride formation, which was not observed during the present study with the experimental techniques employed, although its formation has been reported by previous studies [4,6]. The higher the ageing temperature and the longer the ageing time, the coarser the sigma phase precipitates forming, reaching up to about 10µm in average size for the ageing temperatures and times employed in the present study. Nucleating in a more spherical shape, sigma phase particles become more longitudinal or platelike, following ageing above 750oC. A second species of precipitates Mo rich, was observed in the backscattered micrographs obtained on both grades, at a slightly larger amount in S31254, and was identified as chi phase. Chi phase precipitates are smaller sized than those of sigma phase and form at a lower volume fractions. As it can be seen in Figure 2, hardness testing of aged samples provided typical ageing curves for both superaustenitic steels. The same hardening behaviour is noticed for both steels, while the highest hardness values were attained at 750oC or 850oC. Precipitation of sigma phase initially leads to precipitation hardening in superaustenitic steels, reaching the maximum value when the combination of precipitate size and dispersion become optimum. Following coarsening of precipitates, hardness values are reduced. Phase transformation kinetics appear to be faster at higher temperatures (950oC), where completion of transformation is rapid, and much slower at lower temperatures (650oC), where the transformation reaction seems to be far from completion. Sigma phase formation in a ferritic matrix has different morphological characteristics when compared to that forming in an austenitic matrix. Nucleating mostly intragranularly, but also at grain boundaries, sigma phase forms following 24h of ageing at 650oC, 750oC or 950oC and following 1h of ageing at 850oC. Most sigma phase nuclei forming within the grains are observed at 650oC or 750oC rather than at 850oC, while these are almost absent following ageing at 950oC. Ageing temperature and time of exposure are proportional to increasing sigma phase volume fractions at all ageing temperatures with the exception of 950oC, which seems to be unchanged up to ageing times of 200h. A second precipitate species Mo rich, was also observed growing both intergranularly and intragranularly following 24h of ageing at 650oC, 750oC or 850oC, showing the tendency to preferably form or coarsen at grain boundaries, following longer periods of ageing. This phase could likely be one of the group of the Laves phases (possibly C phase) [1-3] or chi phase. This phase was not observed forming at 950oC, for the ageing times studied. Figure 4 shows the effect of secondary phases on the hardness of superferritic cold rolled steels. Higher hardness values are obtained due to sigma phase formation, coupled with Mo rich phase precipitation (precipitation hardening). The high temperature of 950oC seems to overcome the strengthening effects accomplished by work hardening, resulting in a reduction of hardness below that of the initial reference condition.
761

H02-7
Conclusions - Superaustenitic and superferritic stainless steels studied were found to be prone to
secondary phase formation following ageing within the temperature range of 650oC to 950oC. Sigma phase is the major phase observed, forming precipitates in superaustenitic steels and growing more massively in the superferritic material. Increasing the ageing temperature and ageing time results in increased volume fractions of sigma phase.
- The presence of chi phase was confirmed in both superaustenitic grades and precipitation of a phase Mo rich was observed in cold rolled superferritic steels, which is hypothesised to be either Laves or chi phase.
- Precipitation and/or transformation of secondary phases increase the hardness of all materials studied, except for both cold rolled superferritic steels aged at 950oC, where more factors seem to interfere the hardening procedure.
References [1] T.-H. Lee, S.-J. Kim, Y.-C. Jung, “Crystallographic Details of Precipitates in Fe-22Cr-
21Ni-6Mo-(N) Superaustenitic Stainless Steels Aged at 900oC”, Metallurgical and Materials Transactions A, vol. 31A, 2000, pp. 1713-1723.
[2] M. Svoboda, A. Kroupa, J. Sopousek, J. Vrest al, P. Miodownik, “Phase Changes in Superaustenitic Steels after Long-Term Annealing”, Z. Metallkd., vol. 95 (11), 2004, pp. 1025-1030.
[3] S. Heino, E. M. Knutson and B. Karlsson, “Precipitation behavior in heat affected zone of welded superaustenitic stainless steel”, Materials Science and Technology, 15, January 1999, pp. 101-108.
[4] Stefan Heino, “Role of Mo and W during sensitization of superaustenitic stainless steel – Crystallography and composition of precipitates”, Metallurgical and Materials Transactions A, 31Α, 2000, pp. 1893-1905.
[5] S.-J. Kim, T.-H. Lee, “Precipitation sequences in austenitic Fe-22Cr-21Ni-6Mo- (N) stainless steels”, Materials Science Forum, 318 – 320, 1999, pp. 109-114, Korea.
[6] S. Heino, E. M. Knutson and B. Karlsson, “Precipitation in a high nitrogen superaustenitic stainless steel”, Materials Science Forum, 318-320, 1999, pp. 143 – 148, Sweeden.
[7] G. Mori and D. Bauernfeind, “Pitting and Crevice Corrosion of Superaustenitic Stainless Steels”, Materials and Corrosion, 55, No. 3, 2004, pp. 164-173.
[8] R. Li, M. G. S. Ferreira, M. A. Anjos, R. Vilar, “Localized Corrosion of Laser surface cladded UNS S31254 Superaustenitic Stainless Steel on Mild Steel”, Surface and Coatings Technology, 88, December 1995, pp. 90-95.
[9] B. Wallen, M. Liljas, P. Stenvall: “Avesta 654 SMO – A new nitrogen-enhanced superaustenitic stainless steel”, Werkstoffe und Korrosion, 44, 1993, pp. 83-88.
[10] M. Tendo, Y. Tadokoro, K. Suetsugu, T. Nakazawa “Effects of Nitrogen, Niobium and Molybdenum on Strengthening of Austenitic Stainless Steel Produced by Thermo-MechanicalControl Process”, ISIJ International, 41 (No 3), 2001, pp. 262-267.
[11] P. G. Ng, E. Clarke, C. A. Khoo and G. Fourlaris, “Microstructural evolution during ageing of novel superferritic stainless steel produced by the HIP process”, Materials Science and Technology, 22 (7), July 2006, pp. 852-858.
[12] B. Chehab, Y. Brechet, J.-C. Glez, P.J. Jacques, J.-D. Mithieux, M. Verona and T. Pardoen, “Characterization of the high temperature tearing resistance using the essential work of fracture – Application to dual phase ferritic stainless steels”, Scripta Materialia, 55, August 2006, pp. 999-1002.
[13] Atsushi Miyazaki, Junichiro Hirasawa, Osamu Furukimi, “Development of High Heat-Resistant Ferritic Stainless Steel with High Formability, “RMH-1”, for Automotive
762

H02-7
Exhaust Manifolds by Optimizing Mo Composition Design”, Kawasaki Steel Technical Report, No 48, March 2003.
[14] Atsushi Miyazaki, Junichiro Hirasawa, Osamu Furukimi, “Ferritic Stainless Steel for Automotive Exhaust Systems – High Heat-Resistant Ferritic Stainless Steel for Automotive Exhaust Manifolds – “RMH-1”–”, JFE Technical Report, No 4, November 2004.
763

H02-7
764

H02-8
THE EFFECT OF HEAT TREATMENT PARAMETERS ON THE MICROSTRUCTURE OF MARTENSITIC STAINLESS STEEL AISI 420
L. Barlow, M. du Toit
University of Pretoria, South Africa
Abstract The effect of austenitising temperature on the microstructure and mechanical properties of two martensitic stainless steel alloys (containing 14.33% and 13.48% Cr, respectively) was examined with the aim of prescribing heat treatments resulting in minimal retained austenite and a hardness of between 610HV and 740HV (hardness on the Vickers scale) after quenching. The steels examined during the course of this investigation conform in composition to AISI type 420 martensitic stainless steel, except for the presence of approximately 0.13% V, and the addition of 0.62% Mo to one of the alloys. The effect of various austenitising heat treatments was examined by treating steel samples at temperatures between 1000ºC and 1200ºC, followed by quenching in oil. Optical and scanning electron microscopy was used to characterise the as-quenched microstructures, and hardness tests were performed to determine the effect of heat treatment on mechanical properties. The as-quenched microstructures were found to range from almost fully austenitic to largely martensitic after quenching, with varying amounts of carbide precipitates. As-quenched hardness values ranged from 700 HV to 270 HV, depending on the amount of retained austenite. Thermodynamic predictions (using the CALPHAD model) were used to explain these microstructures based on the solubility of the carbide particles in the matrix at various austenitising temperatures. The carbide particles were found to be mainly in the form of M7C3 at elevated temperatures, transforming to M23C6 on cooling. Introduction The steel considered in this investigation is a high-carbon AISI 420 martensitic stainless steel containing approximately 13-14 %Cr and 0.47 %C. Martensitic stainless steels are designed such that a martensitic structure is produced when the steel is quenched from the austenite phase field1. Due to the presence of alloying elements in the steel, however, the martensite transformation temperatures are depressed and retained austenite may be found in the as-quenched structure. Chromium, molybdenum and vanadium are alloying elements which reduce the austenite region, effectively raising the austenite transformation temperature on the iron-carbon phase diagram2. Molybdenum is also added to chromium steels to improve the mechanical properties and it raises the high-temperature strength of the steel6. Chromium and molybdenum, strong carbide-formers, combine with the carbon present to form Mo2C6 and M7C3 carbides3. Vanadium is also known to act as a carbide-former. These alloying elements increase the hardenability, temper resistance and high temperature hardness of steel4. Higher alloying element contents, however, depress the martensite transformation range, which increases the tendency for retained austenite in the as-quenched structures5. The austenitising
765

H02-8
temperature employed during heat treatment determines the partitioning of carbon and alloying elements between the austenite and carbide phases, with an increase in temperature leading to increased carbide dissolution, higher dissolved alloying element contents, and a reduction in the martensite start and finish temperatures. The objective of this investigation was to determine the optimum austenitising temperature range for two high-carbon AISI 420 stainless steels, with the aim of satisfying the requirements of minimal retained austenite content and hardness levels between 610HV and 740HV. Two heats of AISI 420 stainless steel were tested. The chemical compositions of the two heats were similar, except for the the addition of 0.62% molybdenum to one of the alloys. Experimental procedure The chemical compositions of the two alloys evaluated during the course of this investigation are given in Table 1. Table 1. The chemical composition of alloys 1 and 2 (weight percentage; balance Fe)
Alloy C Mn Si Cu Mo Cr Ni N V 1 0.472 0.62 0.41 0.1 0.623 14.33 0.22 0.0165 0.13 2 0.471 0.62 0.33 0.08 0.025 13.48 0.17 0.012 0.1 The steels were received in the spherodise annealed condition. The samples were austenitised for 5 minutes at 1000ºC, 1050ºC, 1100ºC, 1175ºC and 1200ºC, respectively, and then oil quenched. The as-quenched samples were mounted in black phenolic resin, ground, polished and etched using Beraha’s Reagent (20 ml HCl, 1 g potassium metabisulfite, 100 ml H2O). Optical micrographs and Secondary Scanning Electron Microscope (SEM) images were recorded. Vickers hardness values were measured with a 10 kg load, with the average of five readings being recorded. Thermodynamic predictions (using the CALPHAD model) were used to describe the microstructures based on the solubility of the carbide particles in the matrix at various austenitising temperatures, namely 1075ºC, 1100ºC, 1130ºC and 1175ºC. Experimental results and discussion Figure 1 shows the predicted CALPHAD phase diagrams of alloy 1 at four different austenitising temperatures. The asterix (*) on the diagram locates alloy 1 on the basis of its carbon and chromium contents.
766

Figure 1. Thermodynamic predictions (using the CALPHAD model) to determine the equilibrium phase diagram of alloy 1 at various austenitising temperatures. According to the diagram, the M7C3 solvus temperature is 1123ºC, whereas the predicted percentage carbides present in the alloy is 1.23% at 1075ºC and 0.62% at 1100ºC. These theoretical results were confirmed through heat treatment. Alloy 1 was austenitised at 1075ºC and 1100ºC, respectively. SEM images, shown in Figures 2a and b, confirm the presence of carbides at these temperatures. After austenitizing at 1075°C, alloy 1 is largely martensitic. Following austenitizing at 1175ºC, all the carbides in alloy 1 have dissolved, as shown in the SEM image in Figure 3a. It is also apparent in Figure 3b that the structure is largely austenitic with martensite lathes. The measured hardness values are shown in Table 2. It is evident that austenitizing alloy 1 at temperatures in the vicinity of the carbide dissolution temperature and above results in a significant decrease in hardness. This can be attributed to increased carbide dissolution during heat treatment, which raises the alloying element content of the austenite. This results in a decrease in the martensite start and finish temperatures and higher levels of retained austenite after quenching.
(a) (b)
Figure 2a. SEM image of alloy 1, austenitised at 1075ºC and oil quenched.
Figure 2b. SEM image of alloy 1, austenitised at 1100ºC and oil quenched.
767

H02-8
(a) (b)
Figure 3a. SEM image of alloy 1, austenitised at 1175ºC and oil quenched.
Figure 3b. Optical micrograph of alloy 1, austenitised at 1175ºC and oil quenched.
Table 2. The average Vickers hardness measurements of alloys 1 and 2.
Austenitising Temperature ºC HV10 – Alloy 1 HV10 – Alloy 2 1000 657 665 1050 695 665 1100 536 665 1175 287 554 1200 270 459
The CALPHAD phase diagram for alloy 2 (shown in Figure 4) predicts that the M7C3 carbides dissolve completely at temperatures exceeding 1110ºC and that the predicted percentage carbides present in alloy 2 is 0.91% at 1075 ºC and 0.27% at 1100ºC.
Figure 4. Thermodynamic predictions (using the CALPHAD model) to determine the equilibrium phase diagram of alloy 2 at various austenitising temperatures. The increased levels of chromium, vanadium and molybdenum in alloy 1 are instrumental in increasing the M7C3 solvus temperatures, and the 13ºC difference in temperature at which these carbides dissolve is ascribed to the additional alloying elements in alloy 1. In Figure 5a, a SEM image of alloy 2 austenitised at 1100ºC confirms that very few carbides remain undissolved in the steel. Figure 5b displays an optical micrograph, illustrating a structure consisting of retained austenite and martensite. An austenitising temperature of 1175ºC is sufficient to dissolve all carbides, but due to the lower alloying element content of the steel, the
768

martensite transformation range is not depressed to the same extent as in alloy 1 and the microstructure still contains a significant amount of martensite, in addition to retained austenite (Figure 6). A decrease in hardness is observed with an increase in austenitising temperature (Table 2), but the hardness does not decrease to the same extent as in alloy 1.
(a) (b)
Figure 5a. SEM image of alloy 2, austenitised at 1100ºC and oil quenched.
Figure 5b. Optical micrograph of alloy 2, austenitised at 1100ºC and oil quenched.
Figure 6. Micrograph of alloy 2, austenitised at 1175ºC and oil quenched. Conclusions For the application envisaged, a structure with minimal retained austenite and hardness values ranging between 610HV and 740HV is required by the steel producer. In the alloys tested, the presence of chromium, molybdenum and vanadium depresses the martensitic transformation temperatures of alloy 1 to such an extent that the amount of retained austenite present after austenitising at temperatures of 1100ºC and above is unacceptably high. High levels of retained austenite result in hardness values below the required hardness range after quenching. Alloy 2 exhibits higher hardness values and less retained austenite after austenitising at temperatures up to 1100ºC. Austenitising at 1100ºC results in an acceptable hardness level, even though the predicted carbide content is only 0.27%. Austenitising at higher temperatures results in a decrease in hardness, but not to the same extent as observed in alloy 1. This can be attributed to the lower alloying element content in alloy 2. The martensite transformation range is not depressed to the same extent as in alloy 1 on dissolution of the carbides and the microstructure contains a significant amount of martensite, in addition to retained austenite, after quenching. It can be concluded that high-carbon AISI 420 with lower levels of carbide-forming elements can be austenitised at temperatures up to approximately 1100ºC to achieve a structure with a hardness of between 610HV and 740HV and minimal retained austenite. An increase in the level of carbide-forming elements in the steel, however, limits the allowable austenitising temperature
769

H02-8
range to a maximum of 1050ºC to ensure that the required hardness and microstructure are achieved. References [1] William. F Smith, Principles of Materials Science and Engineering, 1996, p548 [2] Donald. S Clark and Wilbur. R Varney. Metallurgy for Engineers. 1965, p206 [3] William. F Smith, Principles of Materials Science and Engineering, 1996, p517 - 518 [4] Sidney. H Avner, Introduction to Physical Metallurgy, 1974, p360 [5] ]. F.B. Pickering, The Metallurgical Evolution of Stainless Steels, 1979, p 44 [6] R.A Higgins, Engineering Metallurgy, 1. Applied Physical Metallurgy, Fifth Edition,
1983, p318
770