Embed Size (px)
Citation preview
THESIS FOR THE DEGREE OF DOCTOR OF PHILOSOFY
Corrosion of Ferritic Stainless Steel Interconnects for Solid Oxide Cells
– Challenging Operating Conditions
Patrik Alnegren
Department of Chemistry and Chemical Engineering
CHALMERS UNIVERSITY OF TECHNOLOGY
Gothenburg, Sweden 2018
Corrosion of Ferritic Stainless Steel Interconnects for Solid Oxide Cells – Challenging Operating Conditions Patrik Alnegren ISBN: 978-91-7597-748-5
© Patrik Alnegren, 2018.
Doktorsavhandlingar vid Chalmers tekniska högskola Ny serie nr 4429 ISSN0346-718X
Department of Chemistry and Chemical Engineering Chalmers University of Technology SE-412 96 Göteborg Sweden Telephone + 46(0)31-722 1000
Cover: Schematic image of the content in this thesis. Solid oxide cells can be used for buffering intermittent electricity production by storing the energy as hydrogen fuel. Steel interconnects are key components which degrade during operation of solid oxide cell stacks due to corrosion. The corrosion mechanisms on such steels have been investigated in this thesis and an example of a type of oxide that can be formed is shown in the micrograph in the figure.
Printed by Chalmers Reproservice AB Göteborg, Sweden 2018
I
Corrosion of Ferritic Stainless Steel Interconnects for Solid Oxide Cells Challenging Operating Conditions Patrik Alnegren Department of Chemistry and Chemical Engineering Chalmers University of Technology
Abstract Solid oxide cells (SOC) have the potential to revolutionize electricity production by being able to both produce electricity with very high efficiency from a variety of fuels or to produce fuels from electricity and abundant raw materials such as water or carbon dioxide. Some material challenges remain to be solved before large-scale commercialization can be achieved. Interconnects made from ferritic stainless steels are key components in solid oxide cells, but the conditions within the cells cause them to degrade from high temperature corrosion.
This thesis seeks out the potentially demanding operating conditions for solid oxide cells and focuses on investigating the effect of changing the environment on the degradation of ferritic stainless steels. Tests in which steel coupons were exposed to different atmospheres were performed to simulate the degradation of an interconnect inside an operating solid oxide cell. The effect of operating solid oxide fuel cells in electrolysis mode was specifically investigated, which means that interconnects were exposed to pure oxygen instead of ambient air and higher steam content on the fuel side. It was found that at 850 °C, ferritic stainless steels with 18-26% chromium content did not oxidize faster when the oxygen pressure was increased. However, the microstructure of the formed oxide scales on the steels was found to depend on oxygen concentration which caused oxide spallation for some steels at lower oxygen pressures.
Experiments in hydrogen with high steam content, representing the other side of the interconnect, revealed an increase in the oxidation rate of the steel if the chromium content in the steel was too low, due to a change of the oxidation mechanism. Dilution of the same atmosphere with argon changed the oxidation mechanism to more protective behavior, which led to new insights in designing relevant simulated solid oxide cell fuel side conditions. It was also found that the oxidation rate of ferritic stainless steels in fuel side atmosphere can be significantly reduced by the physical vapor deposition (PVD) of cerium onto the surface. Even with applied cerium, however, steels with lower chromium content might still be at risk of rapid oxidation due to iron-rich oxide formation.
A close-to-reality atmosphere was also simulated by exposing a ferritic steel simultaneously to air on one side and hydrogen on the other, which resulted in severely accelerated corrosion at 600 °C. Areas of up to 30 µm thick iron oxide were formed on the air side after 1000 h and grew to cover most of the surface after 3000 h. This dual atmosphere effect was concluded to have an inverse relation to temperature since accelerated corrosion was not observed at 700 and 800 °C. In addition, it was found that the corrosion resistance could be improved if the steel was pre-oxidized in air before exposure to dual atmosphere.
Keywords: SOFC, SOEC, fuel cell, high temperature electrolysis, high temperature oxidation, interconnect, chromium volatilization, dual atmosphere
II
List of publications The thesis is based on the following papers:
I. P. Alnegren, M. Sattari, J. Froitzheim, J.-E. Svensson, Degradation of Ferritic Stainless Steels under Conditions used for Solid Oxide Fuel Cells and Electrolyzers at Varying Oxygen Pressures, Corros. Sci. 110 (2016).
II. P. Alnegren, M. S. Kiranmayee, J. Froitzheim, J.-E. Svensson, Influence of Absolute Pressure of H2/H2O on Corrosion of Ferritic Stainless Steel at 850 °C. (Manuscript)
III. P. Alnegren, Jan Grolig, J.-E. Svensson, J. Froitzheim, Reduced Oxidation of Ferritic Stainless Steels at 850 °C in high H2O/ H2 by Coating with Cerium. (Manuscript)
IV. P. Alnegren, M. Sattari, J.-E. Svensson, J. Froitzheim, Severe Dual Atmosphere Effect at 600 °C for stainless steel 441, J. Power Sources. 301 (2016) 170–178.
V. P. Alnegren, M. Sattari, J.-E. Svensson, J. Froitzheim, Temperature Dependence of Corrosion of Ferritic Stainless Steel in Dual Atmosphere at 600-800 °C J. Power Sources. 392 (2018) 129–138
Statement of the author’s contribution I was the main author for all papers. I did the majority of the experimental work in papers I, III, IV and V. In Paper I, IV and V Dr. Mohammad Sattari performed the TEM analysis and analysis of some of the ion milled cross sections. In Paper II, much of the experimental work was performed by M.Sc. Swathi Kiranmayee and I performed the majority of the microstructural analysis.
Related work P. Alnegren, J. Grolig, J. Ekberg, G. Göransson, J.-E. Svensson, Metallic Bipolar Plates for High Temperature Polymer Electrolyte Membrane Fuel Cells, Fuel Cells: 16 (2016), 39-45.
J. G. Grolig., P. Alnegren, J. Froitzheim, J.-E. Svensson, Copper Iron Conversion Coating for Solid Oxide Fuel Cell Interconnects, J. Power Sources. 297 (2015) 534–539.
P. Alnegren, J. Froitzheim, J.-E. Svensson, Degradation of Ferritic Steel Interconnects in SOEC Environments, ECS Transactions for SOFC XIII (2013) 57, 2261-2270.
III
Table of contents 1 Introduction ..................................................................................................................................... 1
1.1 Aim .......................................................................................................................................... 1
2 Fuel and electrolysis cells ................................................................................................................ 3
2.1 Fuel cells.................................................................................................................................. 3
2.2 Electrolysis cells ...................................................................................................................... 4
2.3 Solid oxide cells ...................................................................................................................... 5
2.3.1 Electrolyte ....................................................................................................................... 6
2.3.2 Electrodes ........................................................................................................................ 6
2.3.3 Interconnect ..................................................................................................................... 7
3 Corrosion ......................................................................................................................................... 9
3.1 Thermodynamics ..................................................................................................................... 9
3.2 Scale formation and growth................................................................................................... 11
3.2.1 Defects in oxide scales .................................................................................................. 12
3.2.2 Mechanical stresses in oxide scales ............................................................................... 13
3.3 Kinetics .................................................................................................................................. 16
3.3.1 Linear rate equation ....................................................................................................... 16
3.3.2 Parabolic rate equation .................................................................................................. 17
3.3.3 Factors affecting the rate constant ................................................................................. 17
4 Corrosion related to ferritic stainless steel interconnects .............................................................. 19
4.1 Chromium species volatilization ........................................................................................... 20
4.2 Alloying elements in ferritic stainless steel interconnects ..................................................... 22
4.2.1 Silicon and aluminum .................................................................................................... 22
4.2.2 Refractory elements (Nb, W, Mo) ................................................................................. 22
4.2.3 Titanium ........................................................................................................................ 23
4.2.4 Manganese ..................................................................................................................... 23
4.2.5 Reactive elements (RE) ................................................................................................. 23
4.3 Growth of chromia scales ...................................................................................................... 24
4.4 Dual atmosphere effect .......................................................................................................... 24
5 Experimental ................................................................................................................................. 27
5.1 Materials ................................................................................................................................ 27
5.2 Exposures .............................................................................................................................. 27
5.2.1 Oxygen exposures ......................................................................................................... 27
5.2.2 Fuel side exposures........................................................................................................ 29
5.2.3 Dual atmosphere exposures ........................................................................................... 31
IV
5.3 Analysis techniques ............................................................................................................... 32
5.3.1 Gravimetry ..................................................................................................................... 32
5.3.2 X-ray diffraction ............................................................................................................ 32
5.3.3 Scanning electron microscopy (SEM) ........................................................................... 33
5.3.4 Ion milling ..................................................................................................................... 34
5.3.5 Chromium quantification with UV/Vis spectrophotometer .......................................... 35
6 Results and discussion ................................................................................................................... 37
6.1 Oxygen dependence .............................................................................................................. 37
6.1.1 Oxidation rate ................................................................................................................ 37
6.1.2 Microstructure ............................................................................................................... 39
6.1.3 Chromium evaporation .................................................................................................. 44
6.2 Fuel side corrosion ................................................................................................................ 45
6.2.1 Influence of absolute pressure of H2 and H2O ............................................................... 46
6.2.2 Cerium-coated steels in fuel-side atmosphere ............................................................... 50
6.3 Dual atmosphere corrosion .................................................................................................... 55
6.3.1 Temperature effect......................................................................................................... 55
6.3.2 Comparison of single and dual atmosphere-exposed samples at 600 °C ...................... 57
6.3.3 Effect of pre-oxidation .................................................................................................. 62
6.3.4 Dual atmosphere mechanisms ....................................................................................... 63
7 Conclusions ................................................................................................................................... 67
8 References ..................................................................................................................................... 69

V
Acknowledgements I would like acknowledge my supervisor, Jan-Erik Svensson, for providing the opportunity to work within research. You have trusted me and always given me the freedom to pursue my ideas. The high degree of responsibility that you have given has made me more capable of managing projects, and for this, I thank you. My other supervisor, Jan Froitzheim, has always given me his time, support, and advice when I needed them. Despite my tendency to always question everything, you have still invited me to take part in important discussions. I have always enjoyed our discussions, and I even think they have made me slightly wiser. Thank you, Jan.
Thank you, Lars-Gunnar Johansson, for taking the time to discuss scientific questions.
I want to thank my former colleague and office mate, Jan Grolig, for all the discussions, crazy ideas, and all the fun and laughter. I really enjoyed the creative work atmosphere we had, from which my work has benefitted significantly. I also want to thank the other office members, Sebastian Sundqvist and Fredrik Hildor, for fun chats and for teaching me things I didn’t know.
Furthermore, my other colleagues (former and present) within the Fuel Cell Group, Claudia Göbel, Hannes Falk-Windisch, Maria Nikumaa, Mohammad Sattari, Gert Göransson, and Rakshith Sachitanand, are gratefully acknowledged. Thank you for all the good discussions and for making it fun to go to work!
I would also like to thank the rest of my colleagues at HTC and Environmental Inorganic Chemistry for creating a good work atmosphere by being helpful and friendly. Thanks to Sandra Gustafson and Christina Andersson for carrying out the all the important tasks that makes this group work. Special thanks to Vedad Babić for your support and good chats.
Thank you Itai Panas for the weekend entertainment. Your dedication to research has inspired me to follow my own ideas and to work a little bit harder.
I want to acknowledge Tobias Holt for taking good care of me during my visit period at Haldor Topsoe.
I also want to thank Mats W Lundberg, Robert Berg, and Jörgen Westlinder at Sandvik Materials Technology for good collaboration during these years.
To my family: Ylva, thank you for your endless support. This thesis was completed because of you. Astrid and Ivar, thank you for bringing more meaning to my life and for putting up with me during this stressful period. I also want to thank my parents and my sister for always helping me and for being there for me when I need you.
1
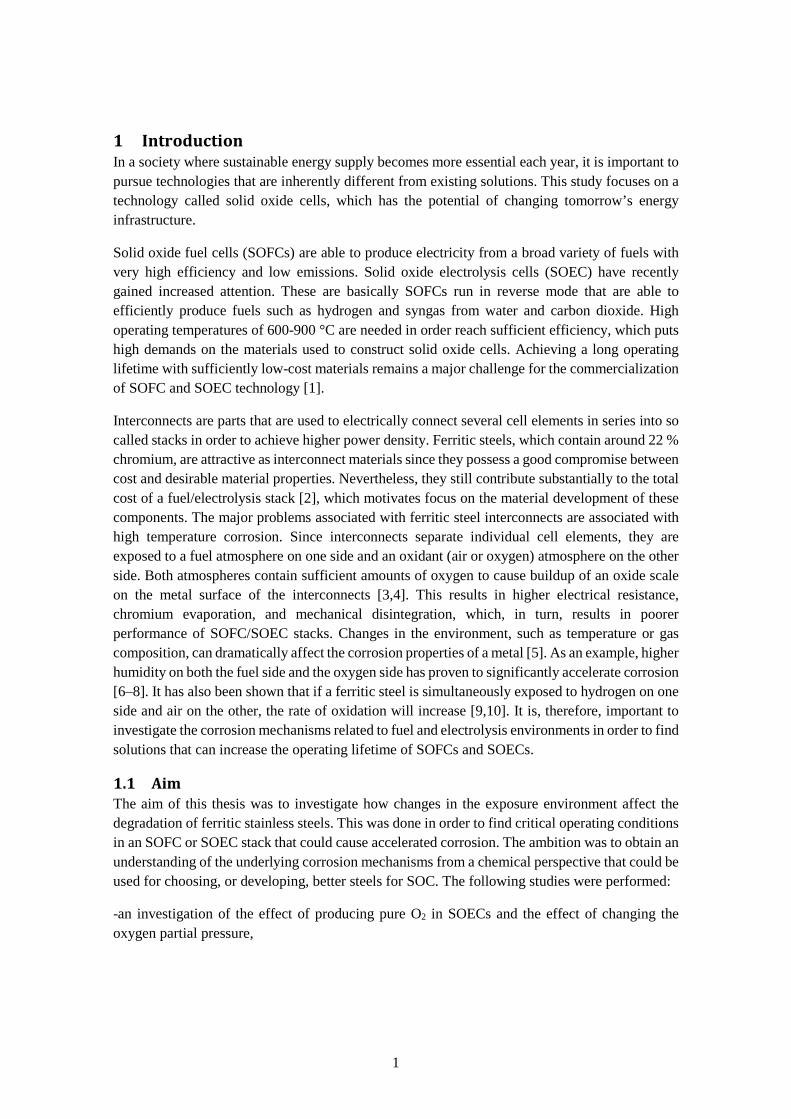
1 Introduction In a society where sustainable energy supply becomes more essential each year, it is important to pursue technologies that are inherently different from existing solutions. This study focuses on a technology called solid oxide cells, which has the potential of changing tomorrow’s energy infrastructure.
Solid oxide fuel cells (SOFCs) are able to produce electricity from a broad variety of fuels with very high efficiency and low emissions. Solid oxide electrolysis cells (SOEC) have recently gained increased attention. These are basically SOFCs run in reverse mode that are able to efficiently produce fuels such as hydrogen and syngas from water and carbon dioxide. High operating temperatures of 600-900 °C are needed in order reach sufficient efficiency, which puts high demands on the materials used to construct solid oxide cells. Achieving a long operating lifetime with sufficiently low-cost materials remains a major challenge for the commercialization of SOFC and SOEC technology [1].
Interconnects are parts that are used to electrically connect several cell elements in series into so called stacks in order to achieve higher power density. Ferritic steels, which contain around 22 % chromium, are attractive as interconnect materials since they possess a good compromise between cost and desirable material properties. Nevertheless, they still contribute substantially to the total cost of a fuel/electrolysis stack [2], which motivates focus on the material development of these components. The major problems associated with ferritic steel interconnects are associated with high temperature corrosion. Since interconnects separate individual cell elements, they are exposed to a fuel atmosphere on one side and an oxidant (air or oxygen) atmosphere on the other side. Both atmospheres contain sufficient amounts of oxygen to cause buildup of an oxide scale on the metal surface of the interconnects [3,4]. This results in higher electrical resistance, chromium evaporation, and mechanical disintegration, which, in turn, results in poorer performance of SOFC/SOEC stacks. Changes in the environment, such as temperature or gas composition, can dramatically affect the corrosion properties of a metal [5]. As an example, higher humidity on both the fuel side and the oxygen side has proven to significantly accelerate corrosion [6–8]. It has also been shown that if a ferritic steel is simultaneously exposed to hydrogen on one side and air on the other, the rate of oxidation will increase [9,10]. It is, therefore, important to investigate the corrosion mechanisms related to fuel and electrolysis environments in order to find solutions that can increase the operating lifetime of SOFCs and SOECs.
1.1 Aim The aim of this thesis was to investigate how changes in the exposure environment affect the degradation of ferritic stainless steels. This was done in order to find critical operating conditions in an SOFC or SOEC stack that could cause accelerated corrosion. The ambition was to obtain an understanding of the underlying corrosion mechanisms from a chemical perspective that could be used for choosing, or developing, better steels for SOC. The following studies were performed:
-an investigation of the effect of producing pure O2 in SOECs and the effect of changing the oxygen partial pressure,

2
- a study of the degradation of ferritic stainless steels in a simulated fuel side atmosphere with high humidity hydrogen and an investigation into reactive element coatings to improve corrosion resistance, and
- an investigation of the effect of simultaneously exposing a ferritic stainless steel to air on one side and to humid hydrogen on the other to mimic conditions in an SOFC stack.
3
2 Fuel and electrolysis cells
2.1 Fuel cells Electrolytes, which exhibit good ability to conduct ions and poor ability to conduct electrons enable the possibility to oxidize fuels and directly extract electrical energy from the resulting electric potential. This is the basic principle of fuel cells and they are therefore not limited by the Carnot cycle as for combustion of fuels. This gives them very high electrical efficiency as well as silent operation and low emissions. There are many different types of fuel cells and they are distinguished mainly by the type of electrolyte that they are based on. The chemical mechanism behind the conversion from chemical energy within a fuel to electric energy is usually governed either by the transport of hydrogen or oxygen ions through an electrolyte. For example some polymers, if hydrated with water, can conduct hydrogen ions. These type of fuel cells are called polymer electrolyte membrane fuel cells (PEMFC) and are the most common type of fuel cell. In solid oxide fuel cells (SOFC) the reaction instead occurs by means of the diffusion of oxygen ions through a solid oxide electrolyte. In order for the diffusion in a solid oxide to be fast enough, high temperatures of at least 500 °C are needed. For PEMFCs the operating temperature is limited to below 100 °C since the electrolyte otherwise becomes dehydrated. Other examples of fuel cell technologies are molten carbonate (MFCF), phosphoric acid (PAFC) and alkaline (AFC) fuel cells, named after their respective electrolytes. Due to the differing nature of electrolytes the operating conditions are different for different types of fuel cells. The technologies differ in terms of efficiency, operating life time, operating temperature, stability against thermal cycling, mechanical stability and resistance against fuel impurities. Each fuel cell technology is therefore used for different applications, depending on the needs [11].
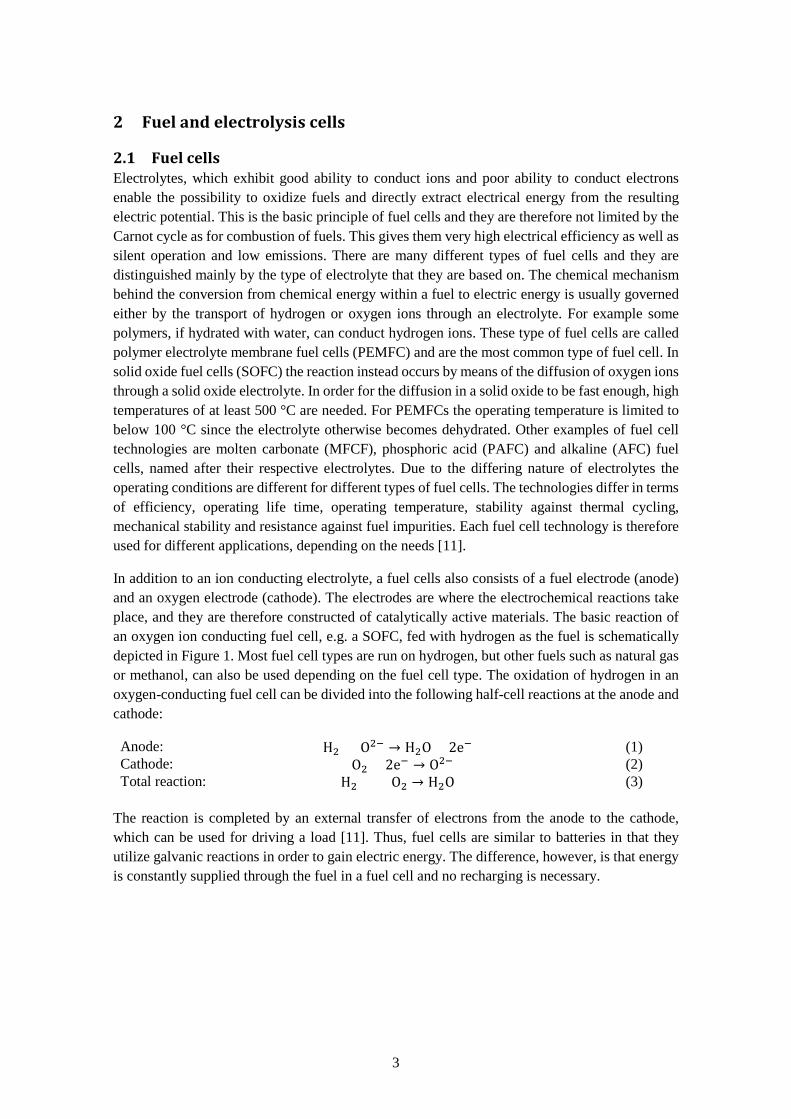
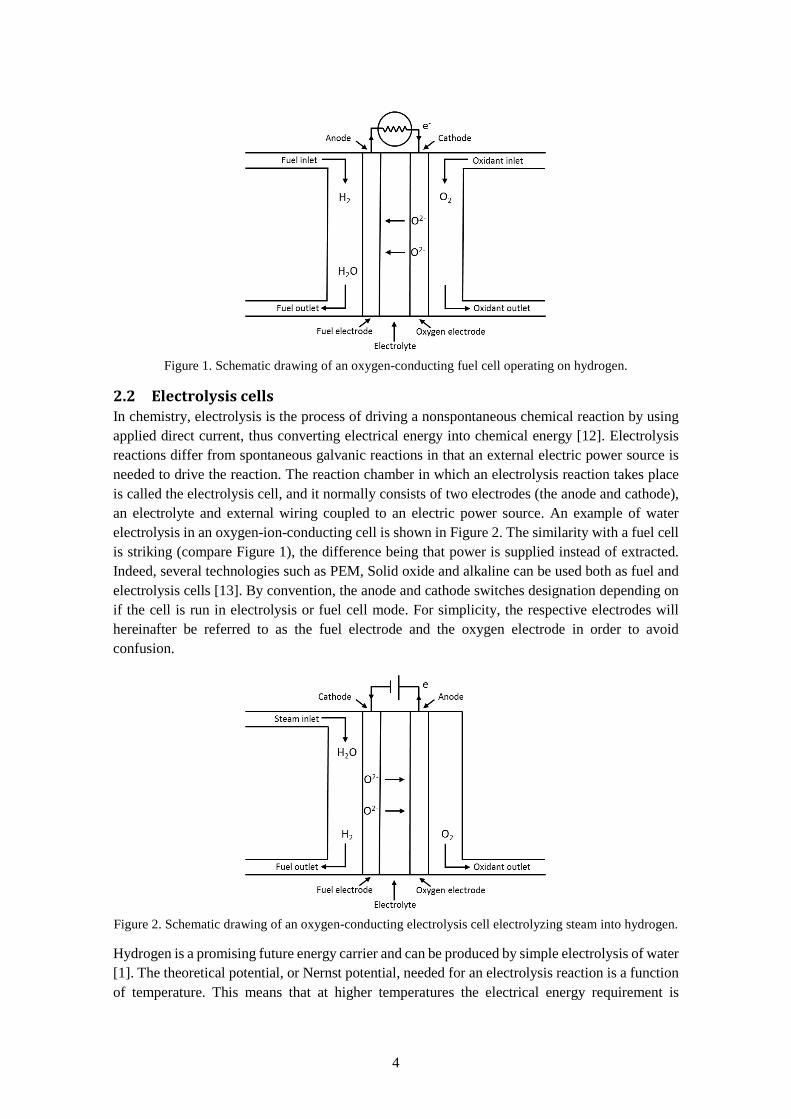
In addition to an ion conducting electrolyte, a fuel cells also consists of a fuel electrode (anode) and an oxygen electrode (cathode). The electrodes are where the electrochemical reactions take place, and they are therefore constructed of catalytically active materials. The basic reaction of an oxygen ion conducting fuel cell, e.g. a SOFC, fed with hydrogen as the fuel is schematically depicted in Figure 1. Most fuel cell types are run on hydrogen, but other fuels such as natural gas or methanol, can also be used depending on the fuel cell type. The oxidation of hydrogen in an oxygen-conducting fuel cell can be divided into the following half-cell reactions at the anode and cathode:
Anode: H2 + O2− → H2O + 2e− (1) Cathode: ½O2 + 2e− → O2− (2) Total reaction: H2 + ½ O2 → H2O (3)
The reaction is completed by an external transfer of electrons from the anode to the cathode, which can be used for driving a load [11]. Thus, fuel cells are similar to batteries in that they utilize galvanic reactions in order to gain electric energy. The difference, however, is that energy is constantly supplied through the fuel in a fuel cell and no recharging is necessary.
4
Figure 1. Schematic drawing of an oxygen-conducting fuel cell operating on hydrogen.
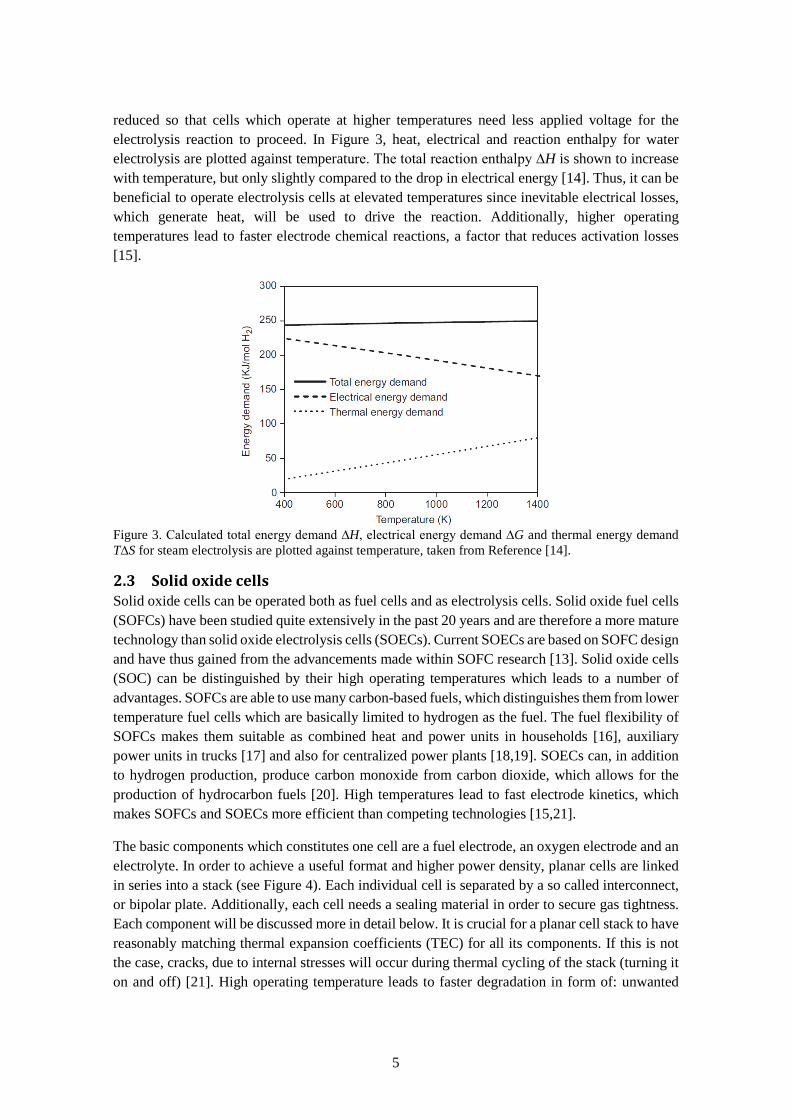
2.2 Electrolysis cells In chemistry, electrolysis is the process of driving a nonspontaneous chemical reaction by using applied direct current, thus converting electrical energy into chemical energy [12]. Electrolysis reactions differ from spontaneous galvanic reactions in that an external electric power source is needed to drive the reaction. The reaction chamber in which an electrolysis reaction takes place is called the electrolysis cell, and it normally consists of two electrodes (the anode and cathode), an electrolyte and external wiring coupled to an electric power source. An example of water electrolysis in an oxygen-ion-conducting cell is shown in Figure 2. The similarity with a fuel cell is striking (compare Figure 1), the difference being that power is supplied instead of extracted. Indeed, several technologies such as PEM, Solid oxide and alkaline can be used both as fuel and electrolysis cells [13]. By convention, the anode and cathode switches designation depending on if the cell is run in electrolysis or fuel cell mode. For simplicity, the respective electrodes will hereinafter be referred to as the fuel electrode and the oxygen electrode in order to avoid confusion.
Figure 2. Schematic drawing of an oxygen-conducting electrolysis cell electrolyzing steam into hydrogen.
Hydrogen is a promising future energy carrier and can be produced by simple electrolysis of water [1]. The theoretical potential, or Nernst potential, needed for an electrolysis reaction is a function of temperature. This means that at higher temperatures the electrical energy requirement is
5
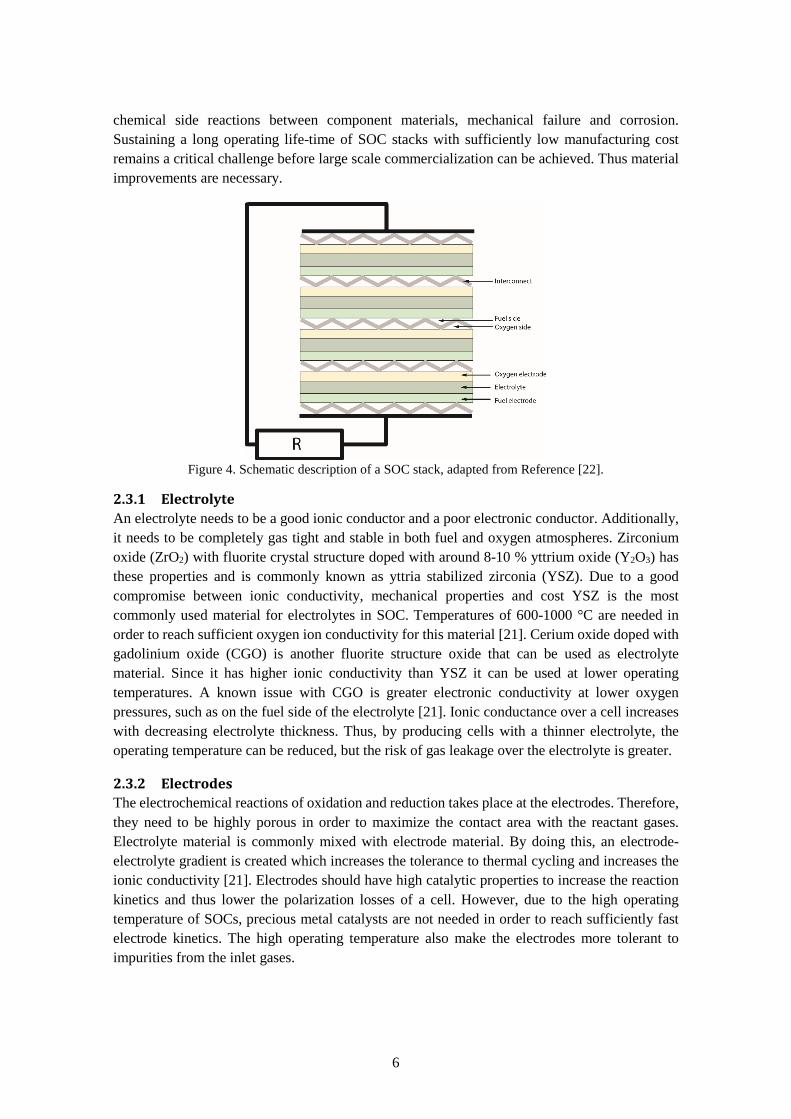
reduced so that cells which operate at higher temperatures need less applied voltage for the electrolysis reaction to proceed. In Figure 3, heat, electrical and reaction enthalpy for water electrolysis are plotted against temperature. The total reaction enthalpy ∆H is shown to increase with temperature, but only slightly compared to the drop in electrical energy [14]. Thus, it can be beneficial to operate electrolysis cells at elevated temperatures since inevitable electrical losses, which generate heat, will be used to drive the reaction. Additionally, higher operating temperatures lead to faster electrode chemical reactions, a factor that reduces activation losses [15].
Figure 3. Calculated total energy demand ∆H, electrical energy demand ∆G and thermal energy demand T∆S for steam electrolysis are plotted against temperature, taken from Reference [14].
2.3 Solid oxide cells Solid oxide cells can be operated both as fuel cells and as electrolysis cells. Solid oxide fuel cells (SOFCs) have been studied quite extensively in the past 20 years and are therefore a more mature technology than solid oxide electrolysis cells (SOECs). Current SOECs are based on SOFC design and have thus gained from the advancements made within SOFC research [13]. Solid oxide cells (SOC) can be distinguished by their high operating temperatures which leads to a number of advantages. SOFCs are able to use many carbon-based fuels, which distinguishes them from lower temperature fuel cells which are basically limited to hydrogen as the fuel. The fuel flexibility of SOFCs makes them suitable as combined heat and power units in households [16], auxiliary power units in trucks [17] and also for centralized power plants [18,19]. SOECs can, in addition to hydrogen production, produce carbon monoxide from carbon dioxide, which allows for the production of hydrocarbon fuels [20]. High temperatures lead to fast electrode kinetics, which makes SOFCs and SOECs more efficient than competing technologies [15,21].
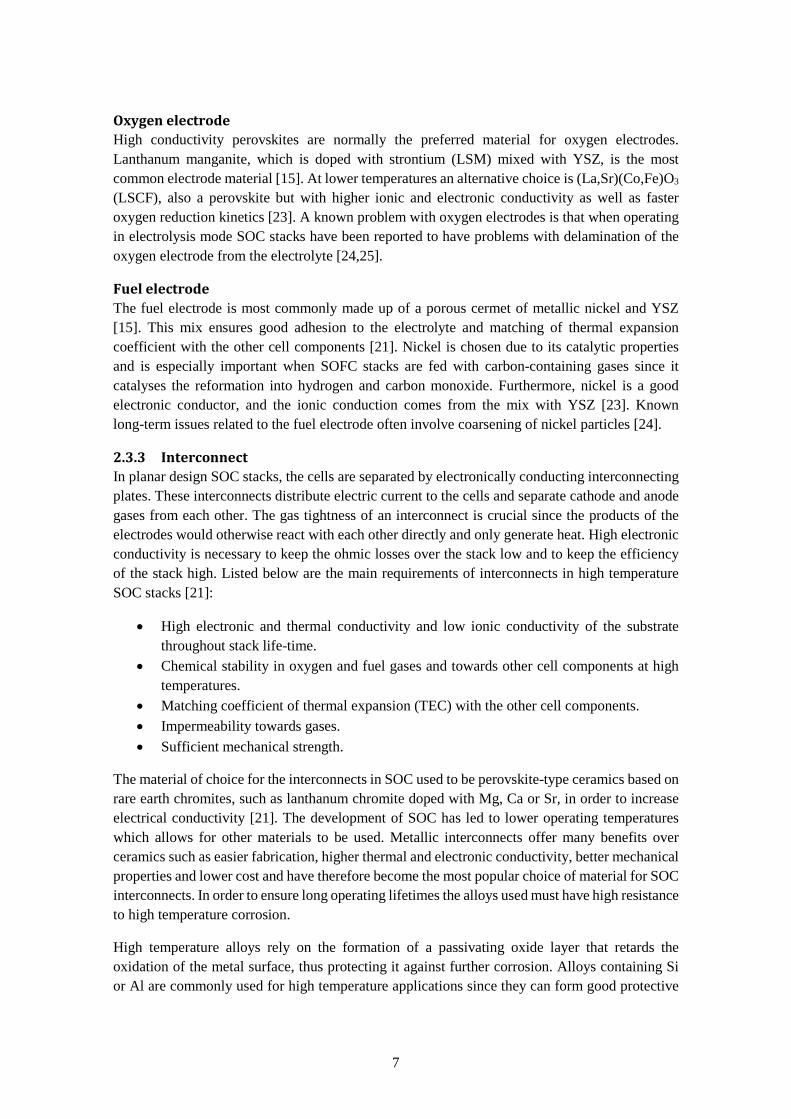
The basic components which constitutes one cell are a fuel electrode, an oxygen electrode and an electrolyte. In order to achieve a useful format and higher power density, planar cells are linked in series into a stack (see Figure 4). Each individual cell is separated by a so called interconnect, or bipolar plate. Additionally, each cell needs a sealing material in order to secure gas tightness. Each component will be discussed more in detail below. It is crucial for a planar cell stack to have reasonably matching thermal expansion coefficients (TEC) for all its components. If this is not the case, cracks, due to internal stresses will occur during thermal cycling of the stack (turning it on and off) [21]. High operating temperature leads to faster degradation in form of: unwanted
6
chemical side reactions between component materials, mechanical failure and corrosion. Sustaining a long operating life-time of SOC stacks with sufficiently low manufacturing cost remains a critical challenge before large scale commercialization can be achieved. Thus material improvements are necessary.
Figure 4. Schematic description of a SOC stack, adapted from Reference [22].
2.3.1 Electrolyte An electrolyte needs to be a good ionic conductor and a poor electronic conductor. Additionally, it needs to be completely gas tight and stable in both fuel and oxygen atmospheres. Zirconium oxide (ZrO2) with fluorite crystal structure doped with around 8-10 % yttrium oxide (Y2O3) has these properties and is commonly known as yttria stabilized zirconia (YSZ). Due to a good compromise between ionic conductivity, mechanical properties and cost YSZ is the most commonly used material for electrolytes in SOC. Temperatures of 600-1000 °C are needed in order to reach sufficient oxygen ion conductivity for this material [21]. Cerium oxide doped with gadolinium oxide (CGO) is another fluorite structure oxide that can be used as electrolyte material. Since it has higher ionic conductivity than YSZ it can be used at lower operating temperatures. A known issue with CGO is greater electronic conductivity at lower oxygen pressures, such as on the fuel side of the electrolyte [21]. Ionic conductance over a cell increases with decreasing electrolyte thickness. Thus, by producing cells with a thinner electrolyte, the operating temperature can be reduced, but the risk of gas leakage over the electrolyte is greater.
2.3.2 Electrodes The electrochemical reactions of oxidation and reduction takes place at the electrodes. Therefore, they need to be highly porous in order to maximize the contact area with the reactant gases. Electrolyte material is commonly mixed with electrode material. By doing this, an electrode-electrolyte gradient is created which increases the tolerance to thermal cycling and increases the ionic conductivity [21]. Electrodes should have high catalytic properties to increase the reaction kinetics and thus lower the polarization losses of a cell. However, due to the high operating temperature of SOCs, precious metal catalysts are not needed in order to reach sufficiently fast electrode kinetics. The high operating temperature also make the electrodes more tolerant to impurities from the inlet gases.
7
Oxygen electrode High conductivity perovskites are normally the preferred material for oxygen electrodes. Lanthanum manganite, which is doped with strontium (LSM) mixed with YSZ, is the most common electrode material [15]. At lower temperatures an alternative choice is (La,Sr)(Co,Fe)O3 (LSCF), also a perovskite but with higher ionic and electronic conductivity as well as faster oxygen reduction kinetics [23]. A known problem with oxygen electrodes is that when operating in electrolysis mode SOC stacks have been reported to have problems with delamination of the oxygen electrode from the electrolyte [24,25].
Fuel electrode The fuel electrode is most commonly made up of a porous cermet of metallic nickel and YSZ [15]. This mix ensures good adhesion to the electrolyte and matching of thermal expansion coefficient with the other cell components [21]. Nickel is chosen due to its catalytic properties and is especially important when SOFC stacks are fed with carbon-containing gases since it catalyses the reformation into hydrogen and carbon monoxide. Furthermore, nickel is a good electronic conductor, and the ionic conduction comes from the mix with YSZ [23]. Known long-term issues related to the fuel electrode often involve coarsening of nickel particles [24].
2.3.3 Interconnect In planar design SOC stacks, the cells are separated by electronically conducting interconnecting plates. These interconnects distribute electric current to the cells and separate cathode and anode gases from each other. The gas tightness of an interconnect is crucial since the products of the electrodes would otherwise react with each other directly and only generate heat. High electronic conductivity is necessary to keep the ohmic losses over the stack low and to keep the efficiency of the stack high. Listed below are the main requirements of interconnects in high temperature SOC stacks [21]:
• High electronic and thermal conductivity and low ionic conductivity of the substrate throughout stack life-time.
• Chemical stability in oxygen and fuel gases and towards other cell components at high temperatures.
• Matching coefficient of thermal expansion (TEC) with the other cell components. • Impermeability towards gases. • Sufficient mechanical strength.
The material of choice for the interconnects in SOC used to be perovskite-type ceramics based on rare earth chromites, such as lanthanum chromite doped with Mg, Ca or Sr, in order to increase electrical conductivity [21]. The development of SOC has led to lower operating temperatures which allows for other materials to be used. Metallic interconnects offer many benefits over ceramics such as easier fabrication, higher thermal and electronic conductivity, better mechanical properties and lower cost and have therefore become the most popular choice of material for SOC interconnects. In order to ensure long operating lifetimes the alloys used must have high resistance to high temperature corrosion.
High temperature alloys rely on the formation of a passivating oxide layer that retards the oxidation of the metal surface, thus protecting it against further corrosion. Alloys containing Si or Al are commonly used for high temperature applications since they can form good protective

8
oxide layers of SiO2 and Al2O3 respectively. However, silica and alumina forming alloys are not suitable as interconnect materials since these oxides have an electric conductivity that is too low, which would lead to a significant reduction in stack performance due to ohmic losses [3]. Chromium oxide (Cr2O3) has higher electrical conductivity than silica and alumina and is therefore the preferred passivating layer for metallic interconnects, even though its passivating properties are worse than that of silica and alumina.
There are large numbers of different commercial chromia-forming alloys, with nickel-based superalloys being the best performers at high temperatures [5]. However, due to restrictions in thermal expansion that must match other cell components, the choices are limited to ferritic stainless steels or chromium based alloys [4,26]. Between the two, ferritic stainless steel interconnects have lower cost and are easier to fabricate and are therefore the most commonly considered material for large-scale production of SOC stacks. Known problems with ferritic stainless steels are migration of chromium species and increased electric resistance during stack operation. To limit these issues protective coatings are applied [4,27].
9
3 Corrosion Corrosion is the process of deterioration of a material. The corrosion of metals is most commonly degradation caused by a reaction of the metal with oxygen, which causes the metal to gradually transform into metal oxide. All metals, except precious metals like gold, oxidize under ambient conditions and will eventually go back to a form similar to the ores they were originally refined from. The reason many metals seem to be unaffected under normal dry conditions is that they form thin invisible layers of metal oxide on the surface that protects the base metal from oxygen exposure. However, by diffusion of metal or oxygen ions through this layer, oxidation still occurs, although at a negligible pace. When temperature increases well over ambient temperature, reaction rates speed up exponentially and corrosion becomes a problem. At higher temperatures other problems, such as volatilization or melting of the protective oxide layer or cracking due to induced stresses in the material might occur. The following section will go through the fundamentals of high temperature corrosion of metals.
3.1 Thermodynamics At constant pressure, Gibb’s free energy (4) can be used to determine if a reaction is spontaneous or not at a certain temperature.
∆𝐺𝐺 = ∆𝐻𝐻 − 𝑇𝑇∆𝑆𝑆 (4) where G is Gibb’s free energy, H is the enthalpy, T is the temperature and S is entropy. If ΔG = 0, the reaction is in equilibrium, if ΔG > 0 the reaction is non-spontaneous and if ΔG < 0 the reaction is spontaneous. Gibb’s free energy can also be expressed in terms of the reaction quotient, Qp:
∆𝐺𝐺 = ∆𝐺𝐺° + 𝑅𝑅𝑇𝑇𝑅𝑅𝑅𝑅𝑄𝑄𝑝𝑝 (5) Where ΔG° is the free energy change when all species are in their standard states and R is the ideal gas constant. The oxidation of metal can be described as:
xM +y2
O2 ↔ MxOy (6) where M represents an arbitrary metal. By combining (5) and (6) one gets the following expression for Gibb’s free energy of the oxidation of a metal:
∆𝐺𝐺 = ∆𝐺𝐺° + 𝑅𝑅𝑇𝑇ln�
a�MxOy�
a(M)xa(O2)y2� (7)
where a is the thermodynamic activity of a specific species. The activity of pure solids, in this case the metal and its oxide, can be approximated as unity (a=1). When the reaction is in equilibrium ΔG is equal to zero and the equation can then be written as:
Δ𝐺𝐺° = −𝑅𝑅𝑇𝑇ln�
1
a(O2)y2� (8)
and if the oxygen activity is approximated as oxygen partial pressure this becomes [5,28]:
10
𝑝𝑝O2 = exp �∆𝐺𝐺°𝑅𝑅𝑇𝑇
2y� (9)
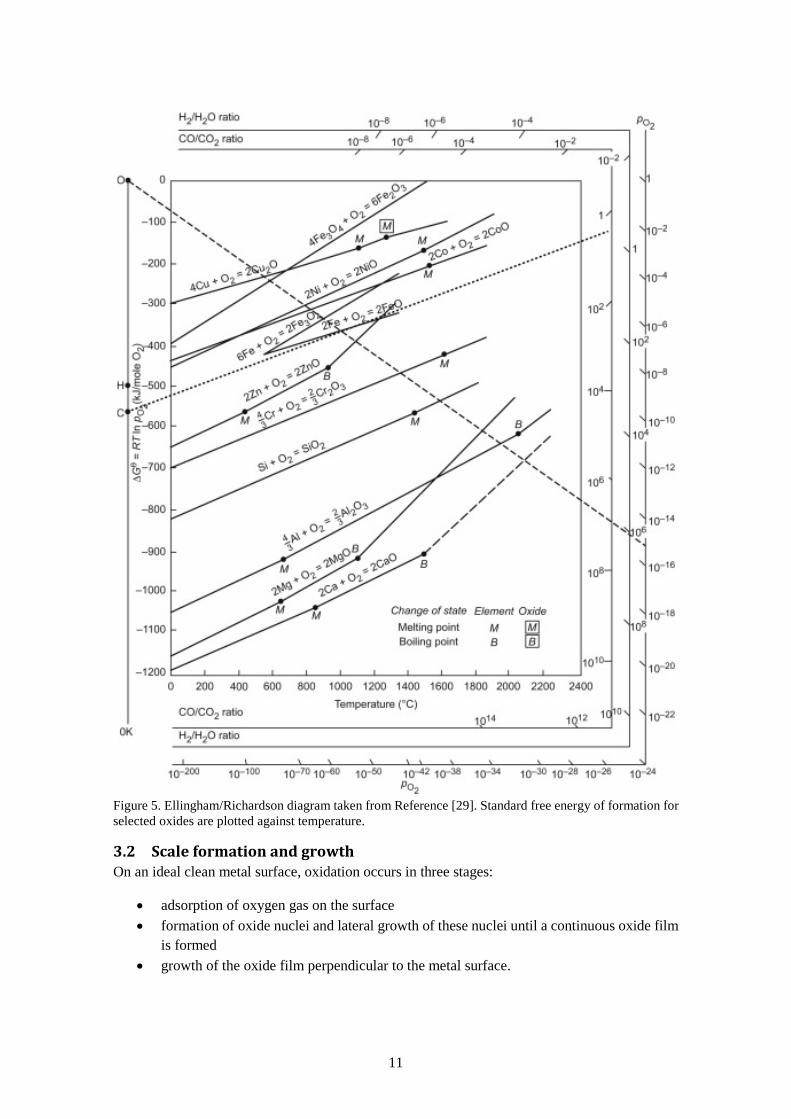
This equation allows one to calculate if a metal or oxide is thermodynamically stable or not at a certain temperature and oxygen partial pressure. The oxygen pressure where metal and oxide are in equilibrium is called dissociation pressure. At an oxygen partial pressure below the dissociation pressure the oxide is reduced to metal, and above the dissociation pressure the metal is oxidized. Ellingham and Richardson constructed a diagram representing this correlation (see Figure 5). In this diagram, the standard free energy of formation is plotted versus temperature. Additionally, there are guiding points and surrounding axes representing oxygen partial pressure that allows for quick calculation of the dissociation pressure by drawing lines from the guiding points through the temperature–metal intersection for a specific metal. The Ellingham/Richardson diagram can also be used for comparison between the stability of different metals and oxides. The lower the line is in the diagram, the more stable the oxide is, and consequently a metal is nobler the higher its line is in the diagram.
11
Figure 5. Ellingham/Richardson diagram taken from Reference [29]. Standard free energy of formation for selected oxides are plotted against temperature.
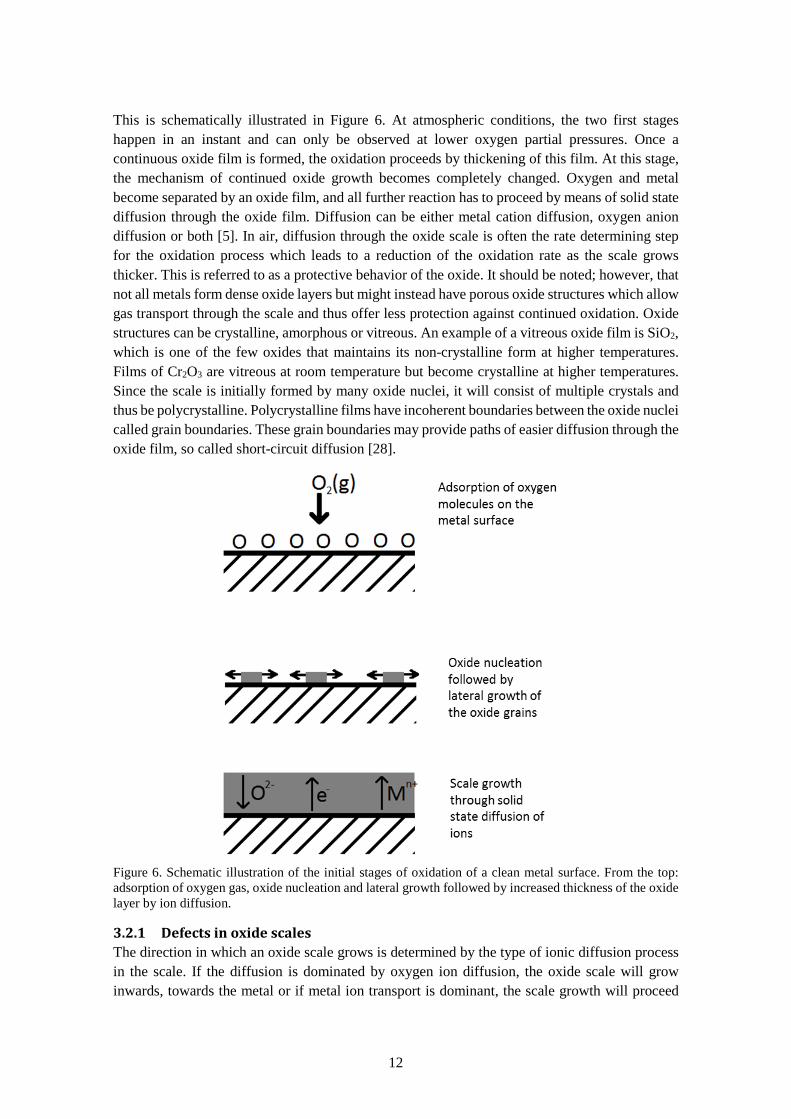
3.2 Scale formation and growth On an ideal clean metal surface, oxidation occurs in three stages:
• adsorption of oxygen gas on the surface • formation of oxide nuclei and lateral growth of these nuclei until a continuous oxide film
is formed • growth of the oxide film perpendicular to the metal surface.
12
This is schematically illustrated in Figure 6. At atmospheric conditions, the two first stages happen in an instant and can only be observed at lower oxygen partial pressures. Once a continuous oxide film is formed, the oxidation proceeds by thickening of this film. At this stage, the mechanism of continued oxide growth becomes completely changed. Oxygen and metal become separated by an oxide film, and all further reaction has to proceed by means of solid state diffusion through the oxide film. Diffusion can be either metal cation diffusion, oxygen anion diffusion or both [5]. In air, diffusion through the oxide scale is often the rate determining step for the oxidation process which leads to a reduction of the oxidation rate as the scale grows thicker. This is referred to as a protective behavior of the oxide. It should be noted; however, that not all metals form dense oxide layers but might instead have porous oxide structures which allow gas transport through the scale and thus offer less protection against continued oxidation. Oxide structures can be crystalline, amorphous or vitreous. An example of a vitreous oxide film is SiO2, which is one of the few oxides that maintains its non-crystalline form at higher temperatures. Films of Cr2O3 are vitreous at room temperature but become crystalline at higher temperatures. Since the scale is initially formed by many oxide nuclei, it will consist of multiple crystals and thus be polycrystalline. Polycrystalline films have incoherent boundaries between the oxide nuclei called grain boundaries. These grain boundaries may provide paths of easier diffusion through the oxide film, so called short-circuit diffusion [28].
Figure 6. Schematic illustration of the initial stages of oxidation of a clean metal surface. From the top: adsorption of oxygen gas, oxide nucleation and lateral growth followed by increased thickness of the oxide layer by ion diffusion.
3.2.1 Defects in oxide scales The direction in which an oxide scale grows is determined by the type of ionic diffusion process in the scale. If the diffusion is dominated by oxygen ion diffusion, the oxide scale will grow inwards, towards the metal or if metal ion transport is dominant, the scale growth will proceed
13
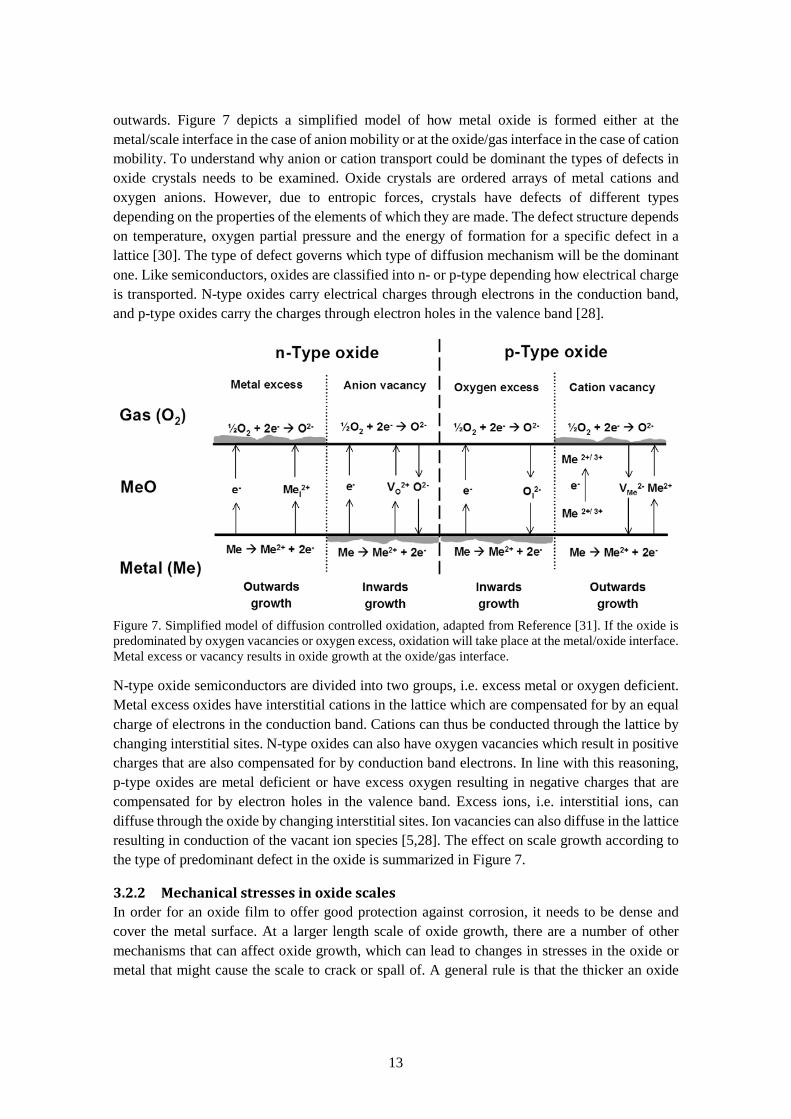
outwards. Figure 7 depicts a simplified model of how metal oxide is formed either at the metal/scale interface in the case of anion mobility or at the oxide/gas interface in the case of cation mobility. To understand why anion or cation transport could be dominant the types of defects in oxide crystals needs to be examined. Oxide crystals are ordered arrays of metal cations and oxygen anions. However, due to entropic forces, crystals have defects of different types depending on the properties of the elements of which they are made. The defect structure depends on temperature, oxygen partial pressure and the energy of formation for a specific defect in a lattice [30]. The type of defect governs which type of diffusion mechanism will be the dominant one. Like semiconductors, oxides are classified into n- or p-type depending how electrical charge is transported. N-type oxides carry electrical charges through electrons in the conduction band, and p-type oxides carry the charges through electron holes in the valence band [28].
Figure 7. Simplified model of diffusion controlled oxidation, adapted from Reference [31]. If the oxide is predominated by oxygen vacancies or oxygen excess, oxidation will take place at the metal/oxide interface. Metal excess or vacancy results in oxide growth at the oxide/gas interface.
N-type oxide semiconductors are divided into two groups, i.e. excess metal or oxygen deficient. Metal excess oxides have interstitial cations in the lattice which are compensated for by an equal charge of electrons in the conduction band. Cations can thus be conducted through the lattice by changing interstitial sites. N-type oxides can also have oxygen vacancies which result in positive charges that are also compensated for by conduction band electrons. In line with this reasoning, p-type oxides are metal deficient or have excess oxygen resulting in negative charges that are compensated for by electron holes in the valence band. Excess ions, i.e. interstitial ions, can diffuse through the oxide by changing interstitial sites. Ion vacancies can also diffuse in the lattice resulting in conduction of the vacant ion species [5,28]. The effect on scale growth according to the type of predominant defect in the oxide is summarized in Figure 7.
3.2.2 Mechanical stresses in oxide scales In order for an oxide film to offer good protection against corrosion, it needs to be dense and cover the metal surface. At a larger length scale of oxide growth, there are a number of other mechanisms that can affect oxide growth, which can lead to changes in stresses in the oxide or metal that might cause the scale to crack or spall of. A general rule is that the thicker an oxide
14
layer is, the larger the stresses acting on it are and the more likely it is to break. Below are some mechanisms that induces stress during oxide scale growth.
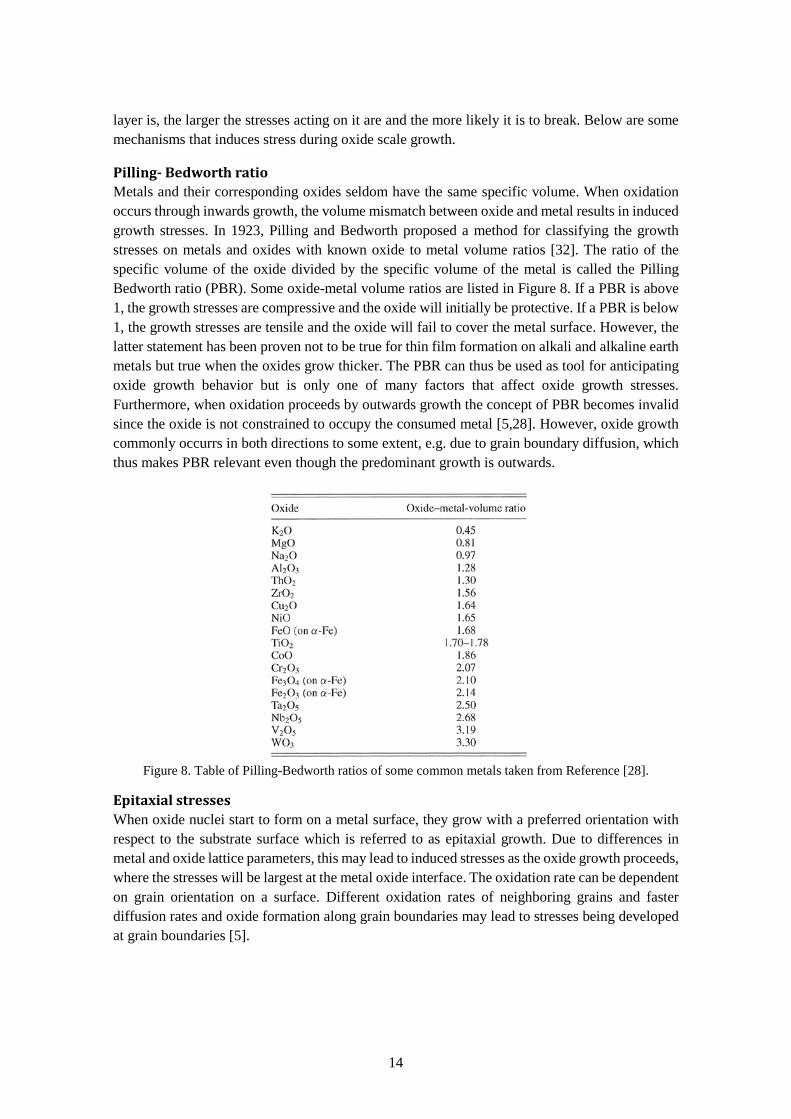
Pilling- Bedworth ratio Metals and their corresponding oxides seldom have the same specific volume. When oxidation occurs through inwards growth, the volume mismatch between oxide and metal results in induced growth stresses. In 1923, Pilling and Bedworth proposed a method for classifying the growth stresses on metals and oxides with known oxide to metal volume ratios [32]. The ratio of the specific volume of the oxide divided by the specific volume of the metal is called the Pilling Bedworth ratio (PBR). Some oxide-metal volume ratios are listed in Figure 8. If a PBR is above 1, the growth stresses are compressive and the oxide will initially be protective. If a PBR is below 1, the growth stresses are tensile and the oxide will fail to cover the metal surface. However, the latter statement has been proven not to be true for thin film formation on alkali and alkaline earth metals but true when the oxides grow thicker. The PBR can thus be used as tool for anticipating oxide growth behavior but is only one of many factors that affect oxide growth stresses. Furthermore, when oxidation proceeds by outwards growth the concept of PBR becomes invalid since the oxide is not constrained to occupy the consumed metal [5,28]. However, oxide growth commonly occurrs in both directions to some extent, e.g. due to grain boundary diffusion, which thus makes PBR relevant even though the predominant growth is outwards.
Figure 8. Table of Pilling-Bedworth ratios of some common metals taken from Reference [28].
Epitaxial stresses When oxide nuclei start to form on a metal surface, they grow with a preferred orientation with respect to the substrate surface which is referred to as epitaxial growth. Due to differences in metal and oxide lattice parameters, this may lead to induced stresses as the oxide growth proceeds, where the stresses will be largest at the metal oxide interface. The oxidation rate can be dependent on grain orientation on a surface. Different oxidation rates of neighboring grains and faster diffusion rates and oxide formation along grain boundaries may lead to stresses being developed at grain boundaries [5].
15
Compositional changes in the alloy or scale When alloys are oxidized, one element is usually preferentially oxidized which may lead to the depletion of this element and a local change in the composition of the alloy. Compositional changes in the alloy may lead to changes in the lattice parameters which may lead to stresses. Likewise, compositional changes in the oxide may also result in stresses.
Stresses induced by certain growth mechanisms When cation transport is predominant, voids and cavities may form at the metal/scale interface since metal is being transported to the oxide surface. Thin oxide films may initially deform and maintain contact with the metal, but as the film grows thicker more force is required to deform it and voids and cavities are formed. When an oxide film continues to grow stresses build up between the oxide and the metal. Additionally, when oxidation occurs through a mix of cation and anion diffusion, oxides may form within the oxide scale, which will result in growth through the thickening of the scale and lateral growth. Such growth induces larger stresses and may lead to cracking of the oxide film [5].
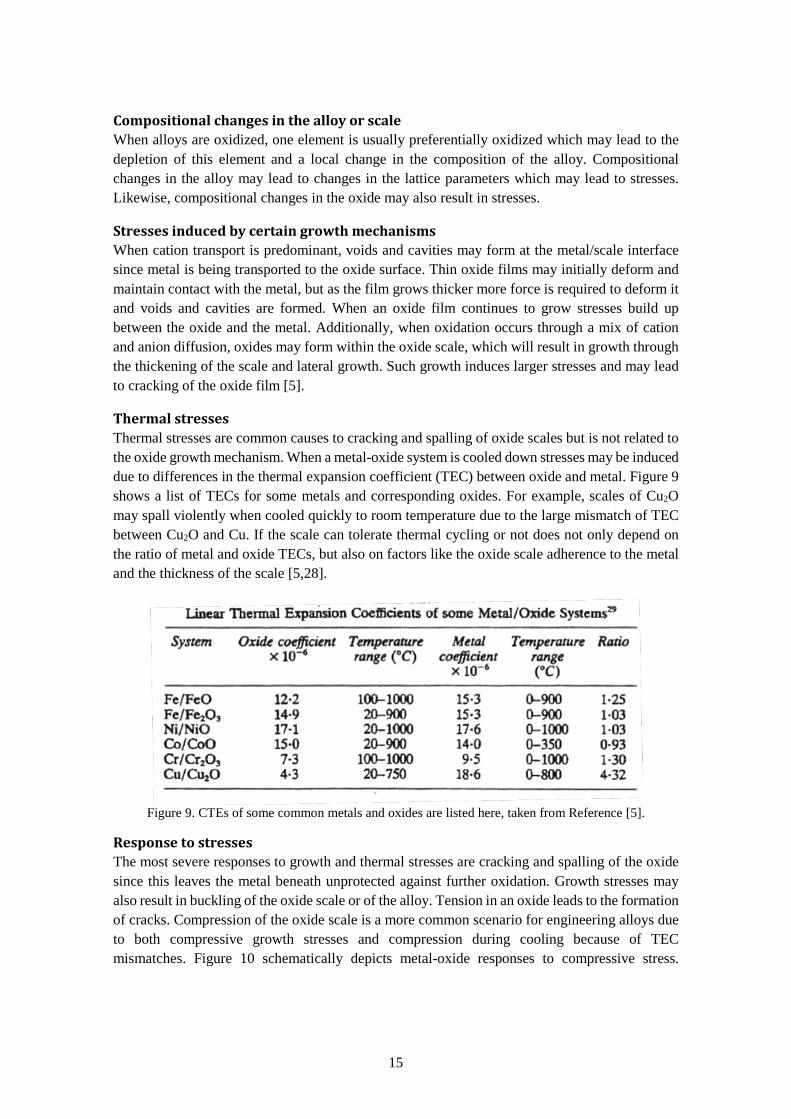
Thermal stresses Thermal stresses are common causes to cracking and spalling of oxide scales but is not related to the oxide growth mechanism. When a metal-oxide system is cooled down stresses may be induced due to differences in the thermal expansion coefficient (TEC) between oxide and metal. Figure 9 shows a list of TECs for some metals and corresponding oxides. For example, scales of Cu2O may spall violently when cooled quickly to room temperature due to the large mismatch of TEC between Cu2O and Cu. If the scale can tolerate thermal cycling or not does not only depend on the ratio of metal and oxide TECs, but also on factors like the oxide scale adherence to the metal and the thickness of the scale [5,28].
Figure 9. CTEs of some common metals and oxides are listed here, taken from Reference [5].
Response to stresses The most severe responses to growth and thermal stresses are cracking and spalling of the oxide since this leaves the metal beneath unprotected against further oxidation. Growth stresses may also result in buckling of the oxide scale or of the alloy. Tension in an oxide leads to the formation of cracks. Compression of the oxide scale is a more common scenario for engineering alloys due to both compressive growth stresses and compression during cooling because of TEC mismatches. Figure 10 schematically depicts metal-oxide responses to compressive stress.
16
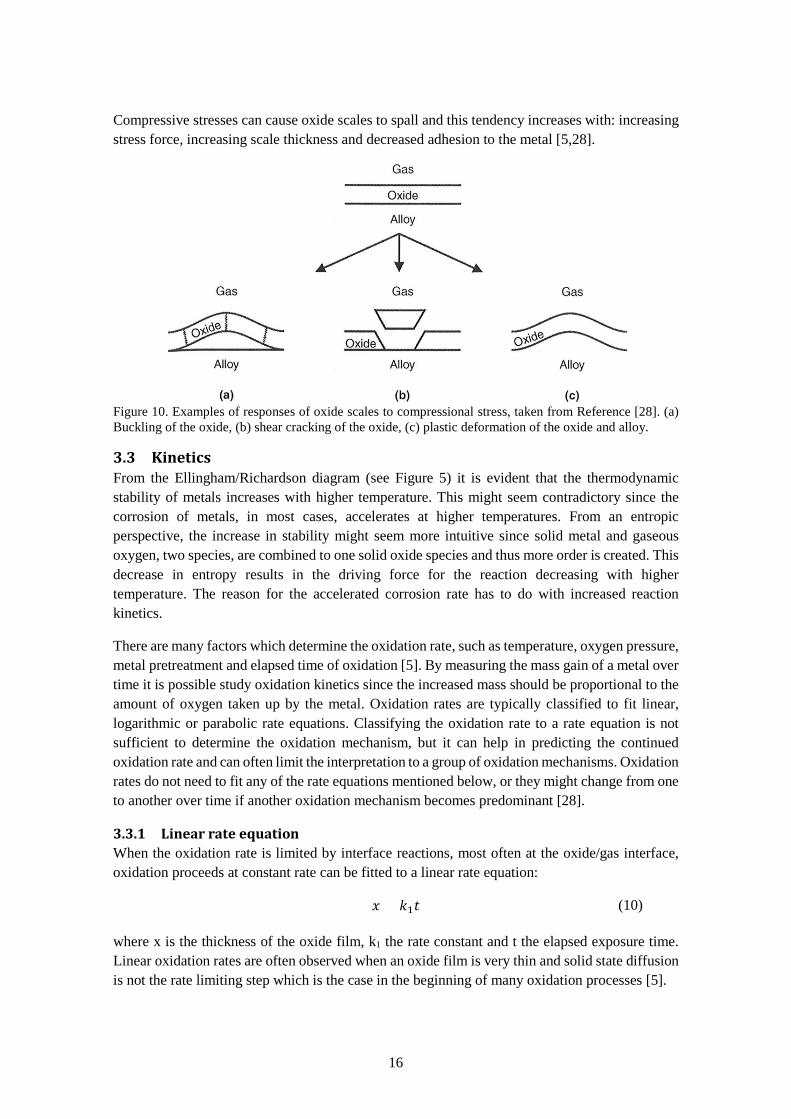
Compressive stresses can cause oxide scales to spall and this tendency increases with: increasing stress force, increasing scale thickness and decreased adhesion to the metal [5,28].
Figure 10. Examples of responses of oxide scales to compressional stress, taken from Reference [28]. (a) Buckling of the oxide, (b) shear cracking of the oxide, (c) plastic deformation of the oxide and alloy.
3.3 Kinetics From the Ellingham/Richardson diagram (see Figure 5) it is evident that the thermodynamic stability of metals increases with higher temperature. This might seem contradictory since the corrosion of metals, in most cases, accelerates at higher temperatures. From an entropic perspective, the increase in stability might seem more intuitive since solid metal and gaseous oxygen, two species, are combined to one solid oxide species and thus more order is created. This decrease in entropy results in the driving force for the reaction decreasing with higher temperature. The reason for the accelerated corrosion rate has to do with increased reaction kinetics.
There are many factors which determine the oxidation rate, such as temperature, oxygen pressure, metal pretreatment and elapsed time of oxidation [5]. By measuring the mass gain of a metal over time it is possible study oxidation kinetics since the increased mass should be proportional to the amount of oxygen taken up by the metal. Oxidation rates are typically classified to fit linear, logarithmic or parabolic rate equations. Classifying the oxidation rate to a rate equation is not sufficient to determine the oxidation mechanism, but it can help in predicting the continued oxidation rate and can often limit the interpretation to a group of oxidation mechanisms. Oxidation rates do not need to fit any of the rate equations mentioned below, or they might change from one to another over time if another oxidation mechanism becomes predominant [28].
3.3.1 Linear rate equation When the oxidation rate is limited by interface reactions, most often at the oxide/gas interface, oxidation proceeds at constant rate can be fitted to a linear rate equation:
𝑥𝑥 = 𝑘𝑘1𝑡𝑡 (10) where x is the thickness of the oxide film, k1 the rate constant and t the elapsed exposure time. Linear oxidation rates are often observed when an oxide film is very thin and solid state diffusion is not the rate limiting step which is the case in the beginning of many oxidation processes [5].
17
3.3.2 Parabolic rate equation When the oxidation rate is controlled by diffusion through the oxide scale it can often be fitted to a parabolic rate equation. This is often the case for many metals oxidized at high temperatures. In 1933, Wagner [33] proposed a model for oxidation at high temperatures derived from Fick’s law of diffusion. This model is based on a number of assumptions in which the most important assumptions are rate limiting diffusion through the scale and steady state conditions of oxygen partial pressures at the metal/oxide and oxide/gas interface. Ion flux through a medium under such conditions can be described by Fick’s first law of diffusion (11). The ion flux (j) is proportional to the chemical potential (Δµ) over the oxide scale with thickness (x).
𝑗𝑗 = −𝐷𝐷𝛥𝛥µ𝑥𝑥
(11)
Furthermore, scale growth rate can be described as the product of ion flux times the molar volume (Vox) of the formed oxide.
𝑑𝑑𝑥𝑥𝑑𝑑𝑡𝑡
= 𝑗𝑗 ∗ 𝑉𝑉𝑜𝑜𝑜𝑜 (12)
If Kp substitutes the product of the chemical potential, diffusion coefficient and molar volume, and if the expression is integrated, it yields a parabolic growth rate equation [5,34]:
𝑥𝑥2 = 𝐾𝐾𝑝𝑝𝑡𝑡 + 𝐶𝐶 (13)
3.3.3 Factors affecting the rate constant As with all chemical reactions, there are activation energies related to the oxidation of metals. An Arrhenius relationship between reaction rate constant and temperature can thus be assumed and the rate constant can be described by:
𝑘𝑘 = 𝑘𝑘0 exp �−𝑄𝑄𝑅𝑅𝑇𝑇
� (14)
where Q is the activation energy. In Wagner’s theory of parabolic oxidation the rate constant in this expression can be related to the self-diffusion coefficient of the ions in the oxide [5]. Depending on the conditions and the type of oxides, the oxygen partial pressure may also affect the rate constant of oxidation, since the defects of the oxide are in equilibrium with the oxygen in the atmopshere [28,35]. More stoichiometric oxides like Cr2O3 and Al2O3 have fewer defects and thus have lower diffusion rates than non-stoichiometric oxides like FeO and Fe2O3. Diffusion rate is also affected by the presence of grain boundaries and dislocations that offer alternative diffusion paths than lattice diffusion. This type of diffusion is called short-circuit diffusion and usually requires lower activation energy than lattice diffusion. Consequently, this is often the predominant diffusion mechanism at lower temperatures and as the temperature increases, lattice diffusion will become a larger part of the total ion flux through the oxide scale [5]. Higher rate constants have been observed in more fine grain oxide films due to the high amount of grain boundary diffusion paths. This also allows short-circuit diffusion to dominate at higher temperatures [28]. It should be mentioned here that predicting oxidation kinetics can be very difficult. Many parameters need to be considered, e.g. from an atomic scale with defect structure in the crystal lattice scale up to a macroscopic scale where mechanical properties of the scale can cause cracking or spallation.

18
Oxidation rates can dramatically change if another mechanism or chemical reaction becomes possible. Therefore caution should always be exercised when discussing models and predicting oxidation rates.
19
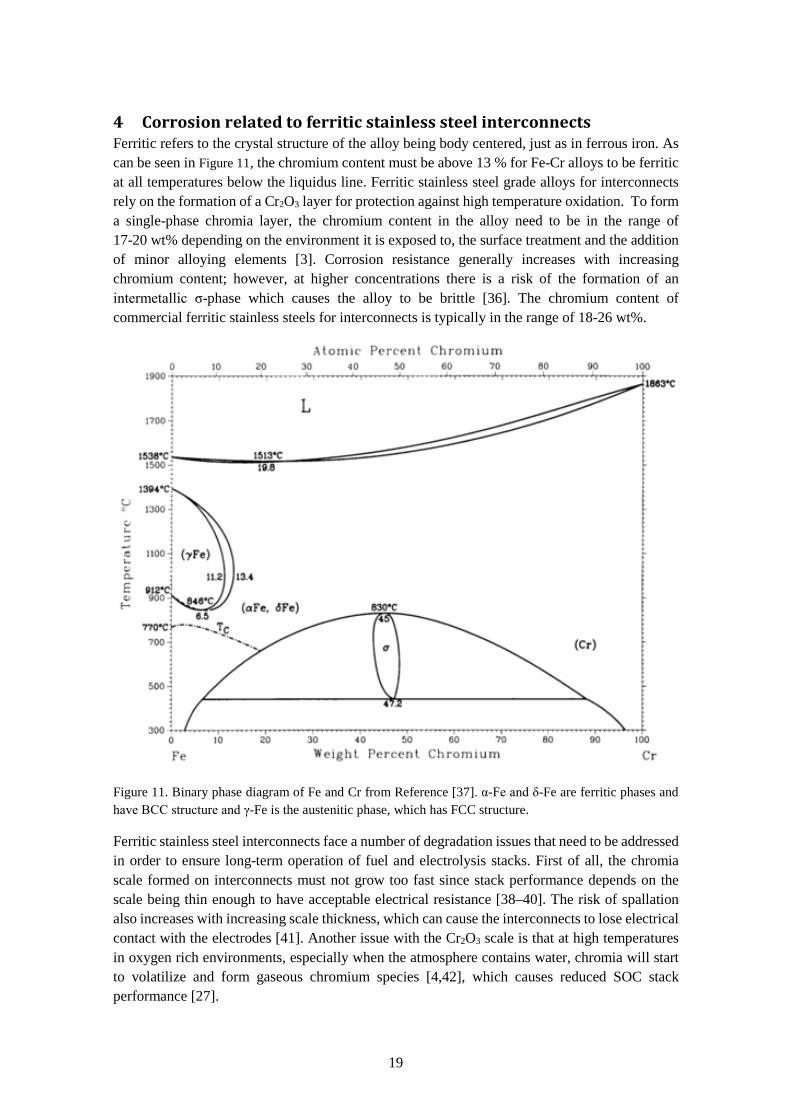
4 Corrosion related to ferritic stainless steel interconnects Ferritic refers to the crystal structure of the alloy being body centered, just as in ferrous iron. As can be seen in Figure 11, the chromium content must be above 13 % for Fe-Cr alloys to be ferritic at all temperatures below the liquidus line. Ferritic stainless steel grade alloys for interconnects rely on the formation of a Cr2O3 layer for protection against high temperature oxidation. To form a single-phase chromia layer, the chromium content in the alloy need to be in the range of 17-20 wt% depending on the environment it is exposed to, the surface treatment and the addition of minor alloying elements [3]. Corrosion resistance generally increases with increasing chromium content; however, at higher concentrations there is a risk of the formation of an intermetallic σ-phase which causes the alloy to be brittle [36]. The chromium content of commercial ferritic stainless steels for interconnects is typically in the range of 18-26 wt%.
Figure 11. Binary phase diagram of Fe and Cr from Reference [37]. α-Fe and δ-Fe are ferritic phases and have BCC structure and γ-Fe is the austenitic phase, which has FCC structure.
Ferritic stainless steel interconnects face a number of degradation issues that need to be addressed in order to ensure long-term operation of fuel and electrolysis stacks. First of all, the chromia scale formed on interconnects must not grow too fast since stack performance depends on the scale being thin enough to have acceptable electrical resistance [38–40]. The risk of spallation also increases with increasing scale thickness, which can cause the interconnects to lose electrical contact with the electrodes [41]. Another issue with the Cr2O3 scale is that at high temperatures in oxygen rich environments, especially when the atmosphere contains water, chromia will start to volatilize and form gaseous chromium species [4,42], which causes reduced SOC stack performance [27].
20
4.1 Chromium species volatilization Volatilized chromium species causes major problems when they are transported and condense at active sites on the oxygen electrodes of a cell, since this results in significant electrical losses and a reduction in cell efficiency [43]. The oxidation kinetics of the alloy is also affected, since volatilization leads to mass transfer of the oxide scale away from the substrate. At prolonged oxidation, the oxidation rate of the steel can change from parabolic to linear due to equilibrium between mass gain from oxidation and mass loss from evaporation [5]. Since chromium is transported away from the steel with the flowing gas stream, the depletion of chromium from the steel is accelerated, compared to when there is less chromium volatilization.
The main volatile species formed from evaporation of Cr2O3 in atmospheres containing O2 and H2O are CrO3 and CrO2(OH)2 [42]. These species are formed by the following reactions:
½ Cr2O3(s) + ¾ O2(g) = CrO3(g) (15)
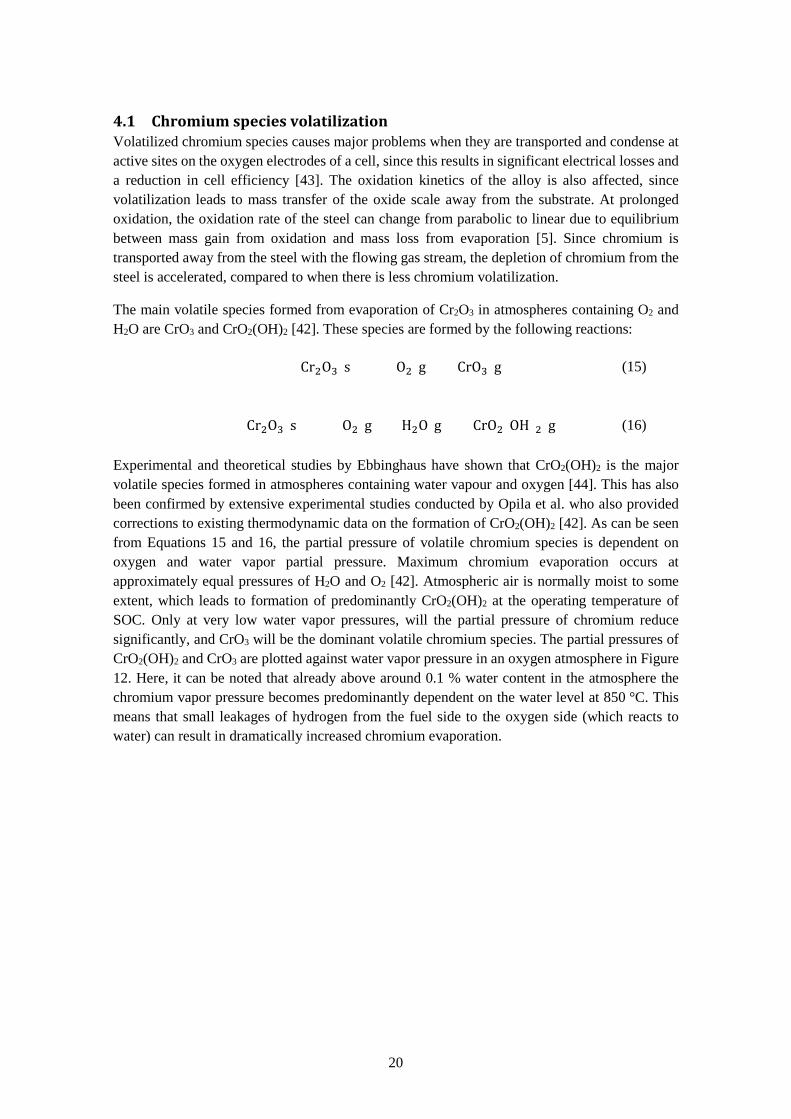
½ Cr2O3(s) + ¾ O2(g) + H2O(g) = CrO2(OH)2(g) (16) Experimental and theoretical studies by Ebbinghaus have shown that CrO2(OH)2 is the major volatile species formed in atmospheres containing water vapour and oxygen [44]. This has also been confirmed by extensive experimental studies conducted by Opila et al. who also provided corrections to existing thermodynamic data on the formation of CrO2(OH)2 [42]. As can be seen from Equations 15 and 16, the partial pressure of volatile chromium species is dependent on oxygen and water vapor partial pressure. Maximum chromium evaporation occurs at approximately equal pressures of H2O and O2 [42]. Atmospheric air is normally moist to some extent, which leads to formation of predominantly CrO2(OH)2 at the operating temperature of SOC. Only at very low water vapor pressures, will the partial pressure of chromium reduce significantly, and CrO3 will be the dominant volatile chromium species. The partial pressures of CrO2(OH)2 and CrO3 are plotted against water vapor pressure in an oxygen atmosphere in Figure 12. Here, it can be noted that already above around 0.1 % water content in the atmosphere the chromium vapor pressure becomes predominantly dependent on the water level at 850 °C. This means that small leakages of hydrogen from the fuel side to the oxygen side (which reacts to water) can result in dramatically increased chromium evaporation.
21
1E-4 1E-3 0.01
2.00E-009
4.00E-009
6.00E-009
8.00E-009
1.00E-008
1.20E-008
1.40E-008
1.60E-008
1.80E-008
2.00E-008
P
artia
l pre
ssur
e
log10(pH2O)
pCrO3
pCrO2(OH)2
Figure 12 Partial pressures of CrO3 and CrO2(OH)2 in equilibrium over Cr2O3 (s) at 850 °C in an air atmosphere as a function of water vapor contamination. The pressures have been calculated using thermodynamic data for CrO3 from Reference [44] and for CrO2(OH)2 from Reference [42].
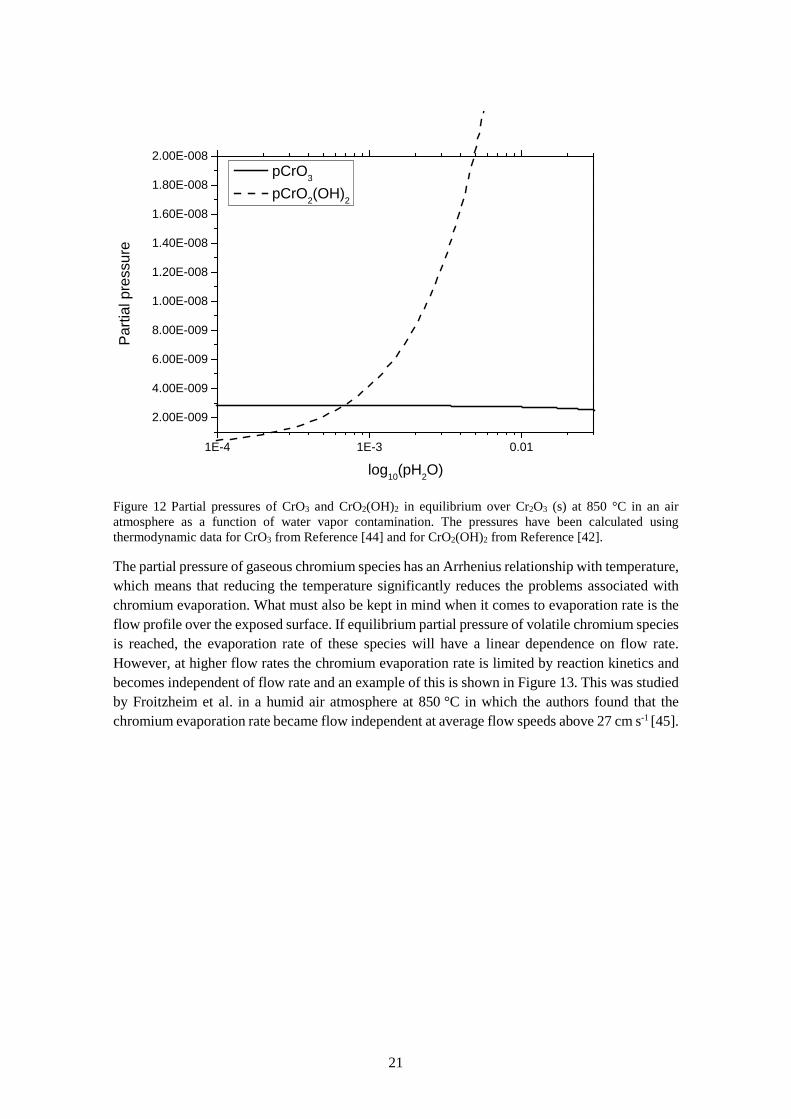
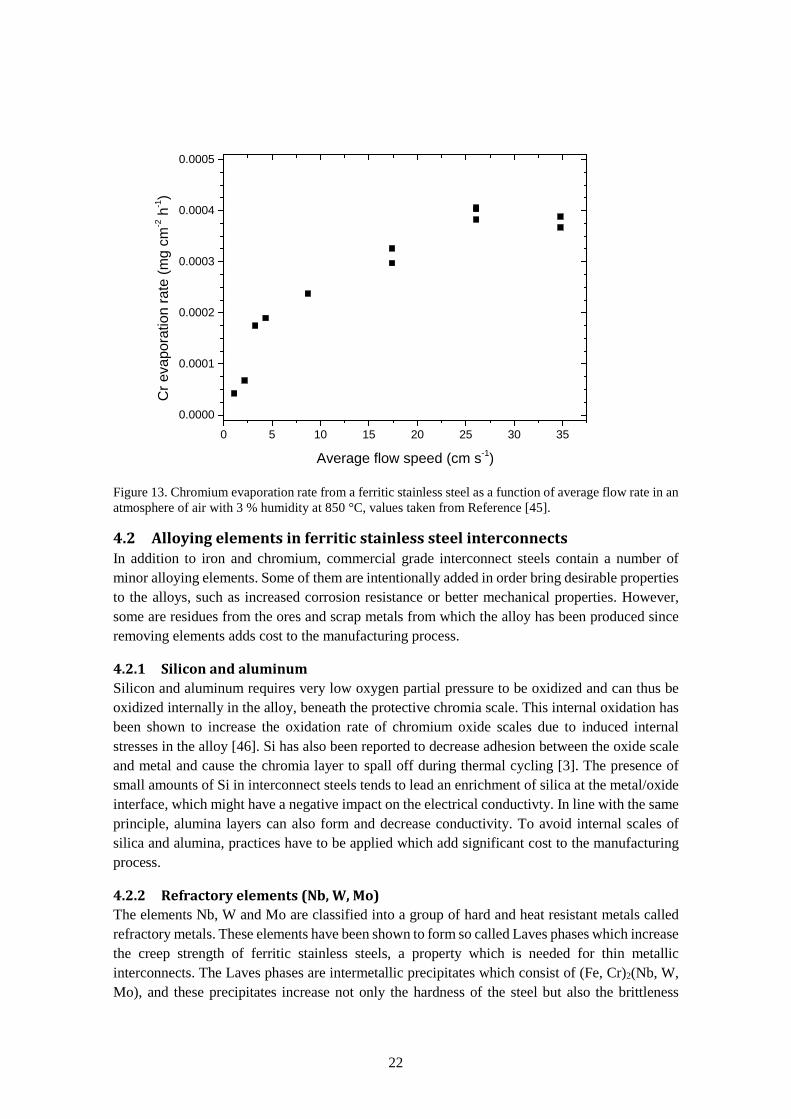
The partial pressure of gaseous chromium species has an Arrhenius relationship with temperature, which means that reducing the temperature significantly reduces the problems associated with chromium evaporation. What must also be kept in mind when it comes to evaporation rate is the flow profile over the exposed surface. If equilibrium partial pressure of volatile chromium species is reached, the evaporation rate of these species will have a linear dependence on flow rate. However, at higher flow rates the chromium evaporation rate is limited by reaction kinetics and becomes independent of flow rate and an example of this is shown in Figure 13. This was studied by Froitzheim et al. in a humid air atmosphere at 850 °C in which the authors found that the chromium evaporation rate became flow independent at average flow speeds above 27 cm s-1 [45].
22
0 5 10 15 20 25 30 35
0.0000
0.0001
0.0002
0.0003
0.0004
0.0005
Cr e
vapo
ratio
n ra
te (m
g cm
-2 h
-1)
Average flow speed (cm s-1)
Figure 13. Chromium evaporation rate from a ferritic stainless steel as a function of average flow rate in an atmosphere of air with 3 % humidity at 850 °C, values taken from Reference [45].
4.2 Alloying elements in ferritic stainless steel interconnects In addition to iron and chromium, commercial grade interconnect steels contain a number of minor alloying elements. Some of them are intentionally added in order bring desirable properties to the alloys, such as increased corrosion resistance or better mechanical properties. However, some are residues from the ores and scrap metals from which the alloy has been produced since removing elements adds cost to the manufacturing process.
4.2.1 Silicon and aluminum Silicon and aluminum requires very low oxygen partial pressure to be oxidized and can thus be oxidized internally in the alloy, beneath the protective chromia scale. This internal oxidation has been shown to increase the oxidation rate of chromium oxide scales due to induced internal stresses in the alloy [46]. Si has also been reported to decrease adhesion between the oxide scale and metal and cause the chromia layer to spall off during thermal cycling [3]. The presence of small amounts of Si in interconnect steels tends to lead an enrichment of silica at the metal/oxide interface, which might have a negative impact on the electrical conductivty. In line with the same principle, alumina layers can also form and decrease conductivity. To avoid internal scales of silica and alumina, practices have to be applied which add significant cost to the manufacturing process.
4.2.2 Refractory elements (Nb, W, Mo) The elements Nb, W and Mo are classified into a group of hard and heat resistant metals called refractory metals. These elements have been shown to form so called Laves phases which increase the creep strength of ferritic stainless steels, a property which is needed for thin metallic interconnects. The Laves phases are intermetallic precipitates which consist of (Fe, Cr)2(Nb, W, Mo), and these precipitates increase not only the hardness of the steel but also the brittleness
23
[47,48]. Increased niobium content in ferritic stainless steels has been shown to increase oxidation rate due to doping of the chromia scale [49]. However, in combination with silicon this effect is limited. Consequently, the addition of niobium increases the tolerance for silicon present in the alloy which limits the need for expensive refining steps [50]. The commercial interconnect alloys Crofer 22 H and Sanergy HT utilize this strategy.
4.2.3 Titanium Like aluminum and silicon, the presence of titanium in the alloy results in internal oxidation. The internal titanium oxide zone can have the beneficial effect of strengthening the near-oxide scale area and can prevent scale buckling [34]. Ti also reduces the contact resistance of the scale due to a doping effect of chromium oxide [51]. However, the diffusion of Cr ions also increases by this doping effect, which results in a higher growth rate of the chromia scale. Concentrations of Ti that are too high may also lead to spallation of the chromia scale [34].
4.2.4 Manganese Manganese has become a standard alloying element in commercial ferritic stainless steels for SOC interconnects. Manganese diffuses through the chromium oxide layer and results in a two-phase protective oxide layer with (Mn,Cr)3O4 spinel on top and Cr2O3 below [52]. This chromium manganese spinel substantially lowers the rate of evaporation of chromium species from the steel substrate [53]. In air atmosphere, alloyed Mn has been shown to accelerate oxidation of ferritic stainless steels, but reduces the oxidation rate in low-pO2 environment of H2/H2O [54].
4.2.5 Reactive elements (RE) Minor additions of oxygen-active elements, such as yttrium, hafnium, cerium, lanthanum and zirconium, are known to have very beneficial effects on the oxidation behavior of chromia-forming alloys [55]. In high temperature corrosion science these elements are often referred to as reactive elements. Small additions of these elements to a chromia forming alloy greatly increase the adherence of the chromia scale to the metal. Additionally, reactive elements significantly decrease the chromium oxide growth rate and enhance the selective oxidation of chromium, thus restricting the formation of iron oxides [28]. The latter effect makes it possible to use less chromium in alloys and yet form a protective chromia scale. The oxidation mechanism of chromium has been shown to be altered when reactive elements are present. Chromia is known to grow with mixed inward/outward diffusion of ions, but the presence of reactive elements seem to block the cation transport, resulting in mainly oxygen ion inward diffusion and a much lower oxidation rate [56]. Even though the reactive element effect has been known for more than 70 years, the mechanism behind it is still in debate. The effect has been studied extensively and suggested mechanisms include segregation of reactive elements to the oxide grain boundaries, which reduces cation transport, thus tying up sulfur which prevents it from accumulating at the scale/metal interface and weakening adhesion [5] . It has also been shown that reactive elements are effective both when added as metal or oxide dispersions to an alloy and even when applied to a metal or oxide surface [57]. As a consequence of reactive element doping the contact resistance of a metal interconnect can be improved. Studies with thin Ce coatings have shown that contact resistance decreases, compared to undoped alloys, due to the decreased growth rate and improved adhesion of the chromia scale [39,40,58].
24
4.3 Growth of chromia scales For a chromia layer to be protective, it must be continuous and cover the entire alloy surface. Thus, chromium needs to be preferentially oxidized over iron. Despite a higher affinity for oxygen, chromium must have sufficient activity for a continuous chromia scale to form. For the chromia scale to stay protective, the supply of chromium from the alloy needs to be faster than the consumption of chromium at the oxide scale in order to maintain a critical concentration of chromium [5,59–61]. Insufficient chromium content at the metal/oxide interface can result in the formation of more Fe-rich (Fe,Cr)2O3, which has much higher ionic conductivity than pure Cr2O3[31]. The failure of the chromia scale and iron oxide formation is commonly referred to as breakaway oxidation, and this leads to fast outward growing Fe oxide and fast inward growing Fe-Cr oxide.
Chromium oxide scales are generally considered to predominantly grow by means of the outward diffusion of chromium ions in dry atmospheres containing oxygen [35,62]. However, some inward diffusion of oxygen commonly occurs as well, which results in lateral growth in the outer regions of the oxide scale [63]. This results in induced stresses in the outer part of the scale, which may cause cracking and spallation of the scale from the metal [5]. At temperatures below 1000 °C, chromia is generally considered to be a p-type oxide that changes to an n-type at oxygen pressure close to its dissociation pressure [64,65]. P-type behavior in combination with predominantly chromium ion diffusion means that chromium vacancies can be expected to be the major point defects. Such p-type behavior should lead to increasing oxidation rates at higher oxygen pressure. However, the rate of oxidation has been reported in the literature to be weakly dependent on oxygen pressure [35,62]. Some suggested models that explain this behavior are based on the fact that chromia has an n-type behavior in low oxygen pressures, such as at the metal/oxide interface, and that this region is rate limiting for oxidation [62,66,67]. However, the mechanism behind the growth of chromia scales is not well understood, and there are conflicting findings in the literature. Furthermore, the mechanism of oxidation seems to change for chromia-forming alloys when water and/or hydrogen is present [7,68,69].
4.4 Dual atmosphere effect The effect of exposing a ferritic stainless steel sheet to air on one side and to hydrogen on the other side simultaneously, i.e. a similar environment to that which an interconnect inside an SOC stack would experience, has been studied by several authors in recent years [10,70,79–81,71–78]. Some authors have found that when exposed to such dual atmosphere conditions, compared to exposure to only air or wet hydrogen, oxidation accelerated on the air side of the steel samples. This effect has been speculated to be caused by the diffusion of hydrogen through the steel substrate, which interferes with the oxidation process on the air side of the sample. It has been shown that hydrogen can diffuse relatively fast through a steel sheet, and at 600 °C, a permeation rate in the order of mm h-1 can be expected [82]. Skilbred and Haugsrud have found increased hydrogen content in the oxide scale of the air side of a dual-atmosphere-exposed ferritic stainless steel at 800 °C [83]. The flux of hydrogen is initially expected to be determined by the thickness of the steel, but after oxidation and the formation of a Cr2O3 scale, the flux quickly becomes rate limited by the thickness of the chromia scale. Kurokawa et al. have measured four orders of magnitude lower permeability for hydrogen in the oxide scale formed on Fe16Cr compared to the hydrogen permeability in ferrite at 800 °C [84].
25
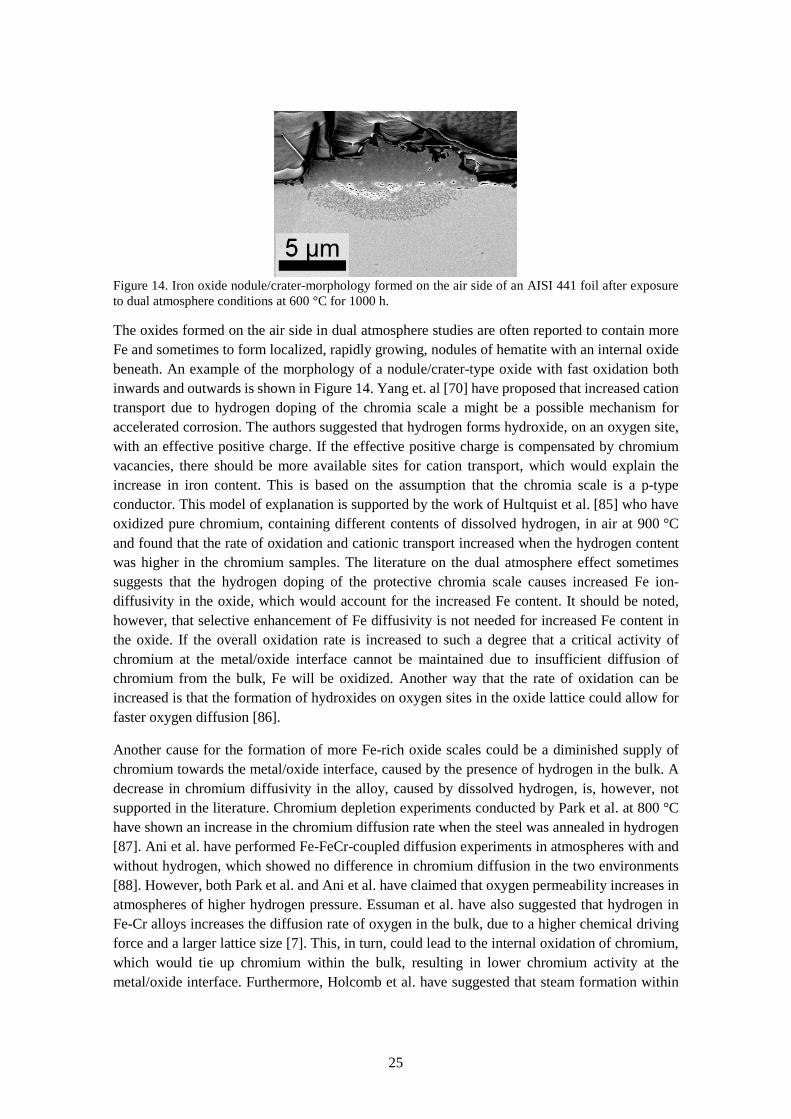
Figure 14. Iron oxide nodule/crater-morphology formed on the air side of an AISI 441 foil after exposure to dual atmosphere conditions at 600 °C for 1000 h.
The oxides formed on the air side in dual atmosphere studies are often reported to contain more Fe and sometimes to form localized, rapidly growing, nodules of hematite with an internal oxide beneath. An example of the morphology of a nodule/crater-type oxide with fast oxidation both inwards and outwards is shown in Figure 14. Yang et. al [70] have proposed that increased cation transport due to hydrogen doping of the chromia scale a might be a possible mechanism for accelerated corrosion. The authors suggested that hydrogen forms hydroxide, on an oxygen site, with an effective positive charge. If the effective positive charge is compensated by chromium vacancies, there should be more available sites for cation transport, which would explain the increase in iron content. This is based on the assumption that the chromia scale is a p-type conductor. This model of explanation is supported by the work of Hultquist et al. [85] who have oxidized pure chromium, containing different contents of dissolved hydrogen, in air at 900 °C and found that the rate of oxidation and cationic transport increased when the hydrogen content was higher in the chromium samples. The literature on the dual atmosphere effect sometimes suggests that the hydrogen doping of the protective chromia scale causes increased Fe ion-diffusivity in the oxide, which would account for the increased Fe content. It should be noted, however, that selective enhancement of Fe diffusivity is not needed for increased Fe content in the oxide. If the overall oxidation rate is increased to such a degree that a critical activity of chromium at the metal/oxide interface cannot be maintained due to insufficient diffusion of chromium from the bulk, Fe will be oxidized. Another way that the rate of oxidation can be increased is that the formation of hydroxides on oxygen sites in the oxide lattice could allow for faster oxygen diffusion [86].
Another cause for the formation of more Fe-rich oxide scales could be a diminished supply of chromium towards the metal/oxide interface, caused by the presence of hydrogen in the bulk. A decrease in chromium diffusivity in the alloy, caused by dissolved hydrogen, is, however, not supported in the literature. Chromium depletion experiments conducted by Park et al. at 800 °C have shown an increase in the chromium diffusion rate when the steel was annealed in hydrogen [87]. Ani et al. have performed Fe-FeCr-coupled diffusion experiments in atmospheres with and without hydrogen, which showed no difference in chromium diffusion in the two environments [88]. However, both Park et al. and Ani et al. have claimed that oxygen permeability increases in atmospheres of higher hydrogen pressure. Essuman et al. have also suggested that hydrogen in Fe-Cr alloys increases the diffusion rate of oxygen in the bulk, due to a higher chemical driving force and a larger lattice size [7]. This, in turn, could lead to the internal oxidation of chromium, which would tie up chromium within the bulk, resulting in lower chromium activity at the metal/oxide interface. Furthermore, Holcomb et al. have suggested that steam formation within

26
the oxide could result in pore formation, which offers fast transport of oxygen and leads to accelerated corrosion [73].
27
5 Experimental
5.1 Materials The following materials were studied: ATI 441 HP (ATI Metals), AISI 441 (Sandvik Materials Technology), Sanergy HT (Sandvik Materials Technology), Crofer 22 H and Crofer 22 APU (ThyssenKrupp VDM) and E-brite (ATI Metals). The composition and thickness of the steels are given in Table 1. The received steel sheets were cut into 15x15 mm2 coupons for normal exposures and into 20 mm diameter circular coupons for dual atmosphere exposure. Cleaning of the samples was performed by ultrasonic agitation in acetone and ethanol, and pressurized air was used for drying. The samples were exposed in an as-received state without polishing or grinding. The respective surface finish of the steels, as stated by the manufacturers, were: Sanergy HT and AISI 441 - cold rolled and bright annealed (2R), Crofer 22 H - cold rolled, annealed, quenched and pickled and for E-brite and ATI 441 HP - cold rolled, heat treated, pickled with bright finish (2B).
5.2 Exposures
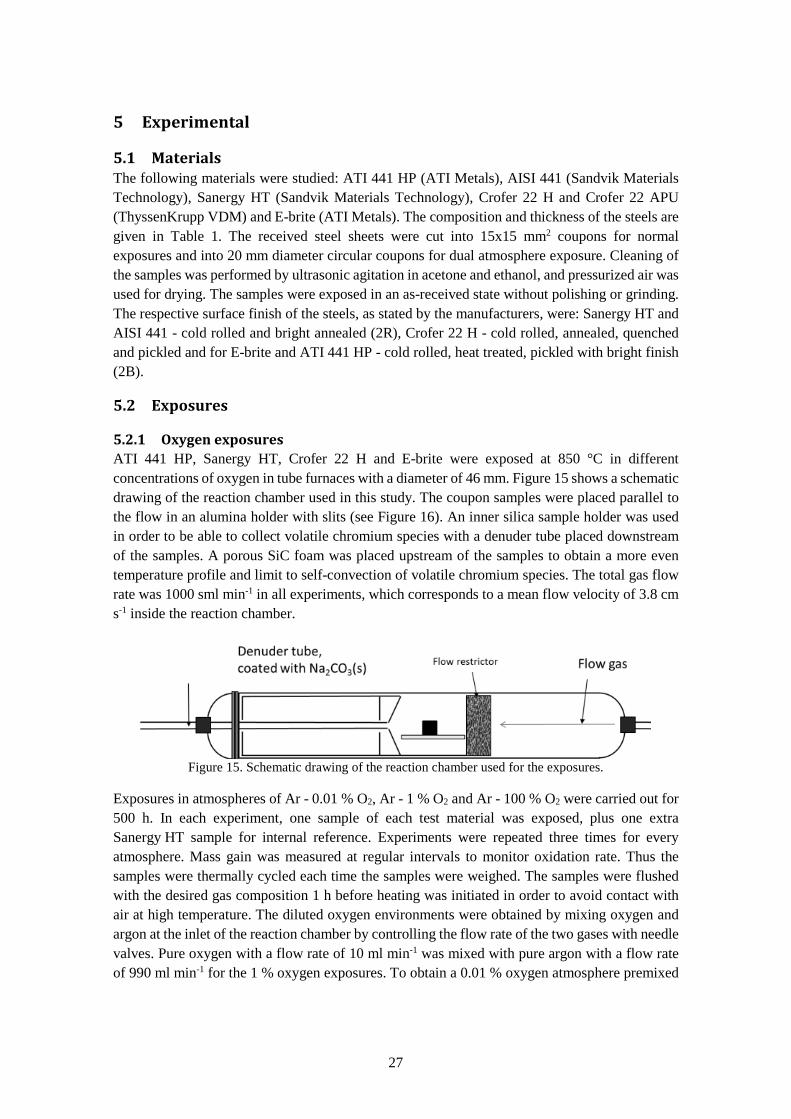
5.2.1 Oxygen exposures ATI 441 HP, Sanergy HT, Crofer 22 H and E-brite were exposed at 850 °C in different concentrations of oxygen in tube furnaces with a diameter of 46 mm. Figure 15 shows a schematic drawing of the reaction chamber used in this study. The coupon samples were placed parallel to the flow in an alumina holder with slits (see Figure 16). An inner silica sample holder was used in order to be able to collect volatile chromium species with a denuder tube placed downstream of the samples. A porous SiC foam was placed upstream of the samples to obtain a more even temperature profile and limit to self-convection of volatile chromium species. The total gas flow rate was 1000 sml min-1 in all experiments, which corresponds to a mean flow velocity of 3.8 cm s-1 inside the reaction chamber.
Figure 15. Schematic drawing of the reaction chamber used for the exposures.
Exposures in atmospheres of Ar - 0.01 % O2, Ar - 1 % O2 and Ar - 100 % O2 were carried out for 500 h. In each experiment, one sample of each test material was exposed, plus one extra Sanergy HT sample for internal reference. Experiments were repeated three times for every atmosphere. Mass gain was measured at regular intervals to monitor oxidation rate. Thus the samples were thermally cycled each time the samples were weighed. The samples were flushed with the desired gas composition 1 h before heating was initiated in order to avoid contact with air at high temperature. The diluted oxygen environments were obtained by mixing oxygen and argon at the inlet of the reaction chamber by controlling the flow rate of the two gases with needle valves. Pure oxygen with a flow rate of 10 ml min-1 was mixed with pure argon with a flow rate of 990 ml min-1 for the 1 % oxygen exposures. To obtain a 0.01 % oxygen atmosphere premixed
28
commercial Ar – 1 % O2 was mixed with argon in order to be able to regulate the oxygen concentration more accurately.
Tabl
e 1.
Com
posi
tion
of th
e in
vest
igat
ed st
eels
in w
eigh
t%. T
he c
ompo
sitio
ns w
ere
give
n by
the
resp
ectiv
e m
anuf
actu
res f
or th
e re
ceiv
ed b
atch
es.
Mat
eria
l B
atch
T
hick
-nes
s (m
m)
Fe
Cr
Mn
Si
Al
Ti
Mo
W
Nb
Zr
La
C
P S
Sane
rgy
HT
5180
53
0.2
bal.
21.2
0.
30
0.12
0.
02
0.09
0.
96
- 0.
71
0.21
-
0.04
4 0.
013
0.00
1
Cro
fer
22 H
10
346
2710
0.
2 ba
l. 22
.9
0.40
0.
20
0.02
n/
a -
1.9
0.50
0.
024
0.04
9 0.
013
0.02
0.
002
Cro
fer
22 A
PU
1732
88
0.3
bal.
22.2
0.
46
0.03
0.
02
0.06
-
-
- 0.
06
0.00
5 0.
016
0.02
E-B
rite
C*0
2219
C59 8
0.5
bal.
26.2
0.
07
0.17
0.
02
n/a
1.02
0.12
-
0.
0015
0.
011
0.01
08
ATI
441
H
P
C08
448C
714
BX
L 0.
5 ba
l. 17
.8
0.29
0.
38
0.03
0.
22
-
0.50
-
0.
013
0.02
4 0.
0007
AIS
I 441
63
960
0.2
bal.
17.8
0.
26
0.55
n/
a 0.
14
-
0.48
-
- 0.
012
0.02
4 n/
a A
ISI 4
41
6453
4 0.
3 ba
l. 17
.6
0.35
0.
59
n/a
0.17
-
0.
39
- -
0.01
4 0.
03
0.00
1 A
ISI 4
41
6431
3 0.
2 ba
l. 17
.7
0.30
0.
55
n/a
0.15
-
0.
37
- -
0.01
5 0.
027
0.00
2
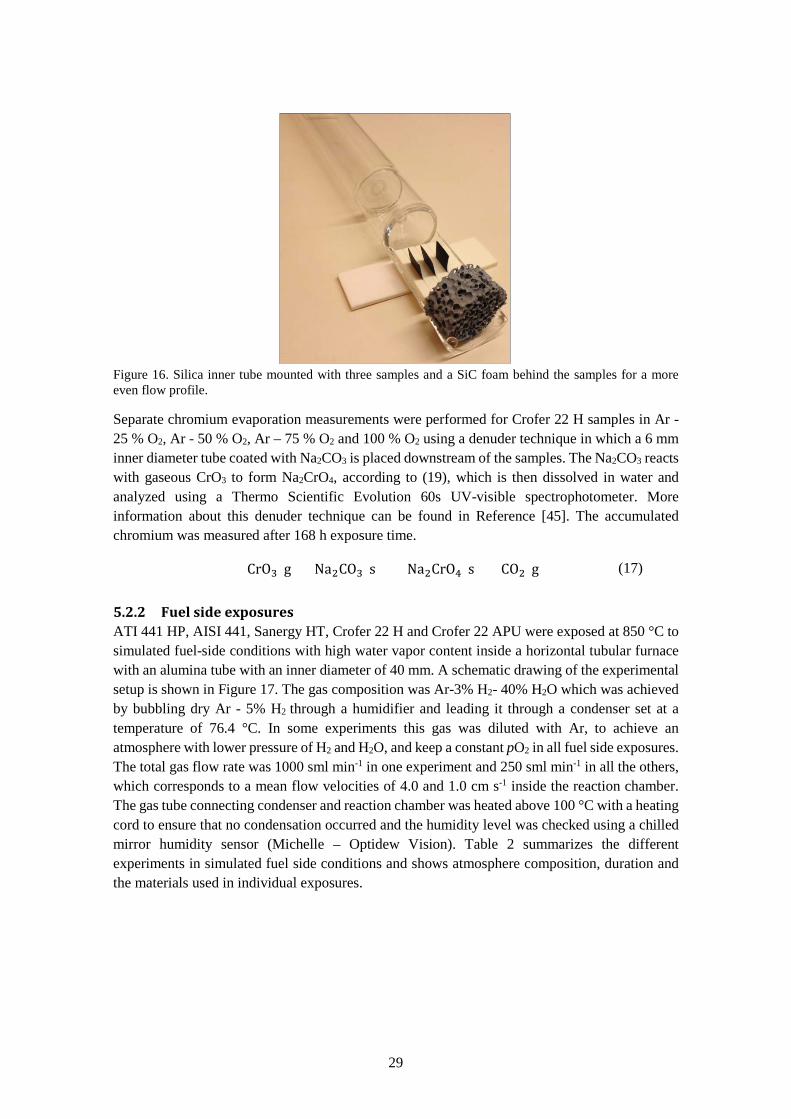
29
Figure 16. Silica inner tube mounted with three samples and a SiC foam behind the samples for a more even flow profile.
Separate chromium evaporation measurements were performed for Crofer 22 H samples in Ar - 25 % O2, Ar - 50 % O2, Ar – 75 % O2 and 100 % O2 using a denuder technique in which a 6 mm inner diameter tube coated with Na2CO3 is placed downstream of the samples. The Na2CO3 reacts with gaseous CrO3 to form Na2CrO4, according to (19), which is then dissolved in water and analyzed using a Thermo Scientific Evolution 60s UV-visible spectrophotometer. More information about this denuder technique can be found in Reference [45]. The accumulated chromium was measured after 168 h exposure time.
CrO3(g) + Na2CO3(s) = Na2CrO4(s) + CO2(g) (17)
5.2.2 Fuel side exposures ATI 441 HP, AISI 441, Sanergy HT, Crofer 22 H and Crofer 22 APU were exposed at 850 °C to simulated fuel-side conditions with high water vapor content inside a horizontal tubular furnace with an alumina tube with an inner diameter of 40 mm. A schematic drawing of the experimental setup is shown in Figure 17. The gas composition was Ar-3% H2- 40% H2O which was achieved by bubbling dry Ar - 5% H2 through a humidifier and leading it through a condenser set at a temperature of 76.4 °C. In some experiments this gas was diluted with Ar, to achieve an atmosphere with lower pressure of H2 and H2O, and keep a constant pO2 in all fuel side exposures. The total gas flow rate was 1000 sml min-1 in one experiment and 250 sml min-1 in all the others, which corresponds to a mean flow velocities of 4.0 and 1.0 cm s-1 inside the reaction chamber. The gas tube connecting condenser and reaction chamber was heated above 100 °C with a heating cord to ensure that no condensation occurred and the humidity level was checked using a chilled mirror humidity sensor (Michelle – Optidew Vision). Table 2 summarizes the different experiments in simulated fuel side conditions and shows atmosphere composition, duration and the materials used in individual exposures.
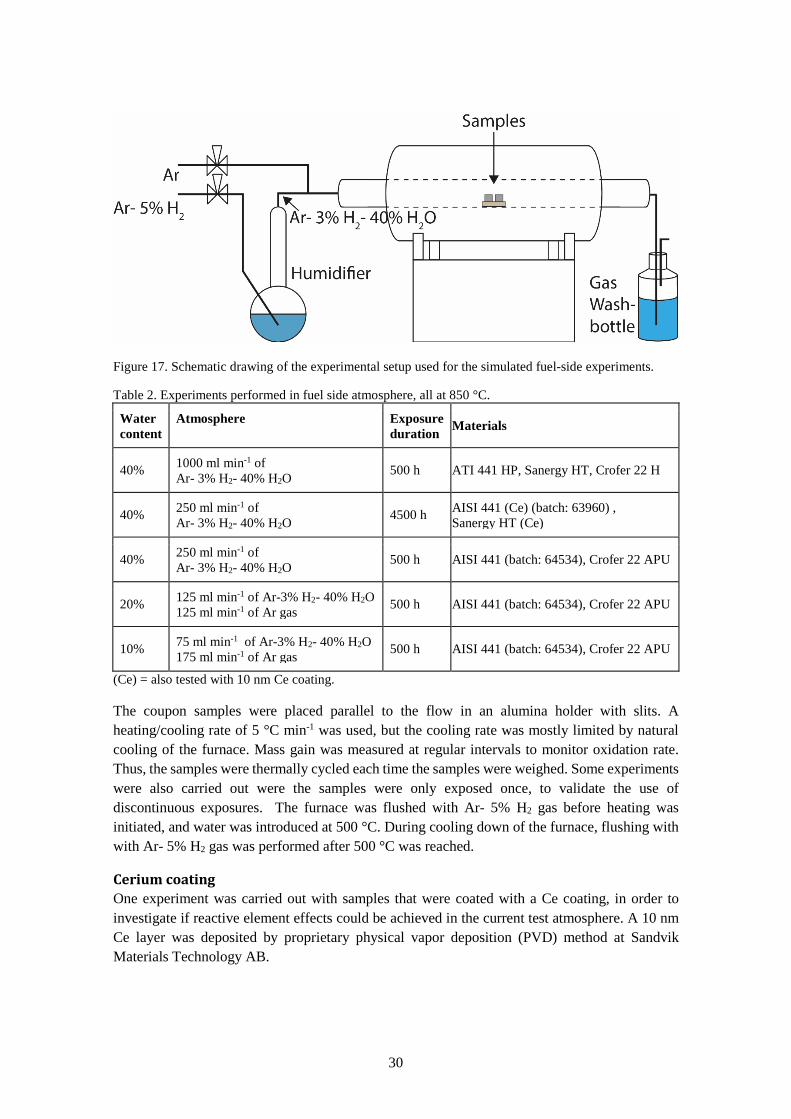
30
Figure 17. Schematic drawing of the experimental setup used for the simulated fuel-side experiments.
Table 2. Experiments performed in fuel side atmosphere, all at 850 °C.
Water content
Atmosphere
Exposure duration Materials
40% 1000 ml min-1 of Ar- 3% H2- 40% H2O 500 h ATI 441 HP, Sanergy HT, Crofer 22 H
40% 250 ml min-1 of Ar- 3% H2- 40% H2O 4500 h AISI 441 (Ce) (batch: 63960) ,
Sanergy HT (Ce)
40% 250 ml min-1 of Ar- 3% H2- 40% H2O 500 h AISI 441 (batch: 64534), Crofer 22 APU
20% 125 ml min-1 of Ar-3% H2- 40% H2O 125 ml min-1 of Ar gas 500 h AISI 441 (batch: 64534), Crofer 22 APU
10% 75 ml min-1 of Ar-3% H2- 40% H2O 175 ml min-1 of Ar gas 500 h AISI 441 (batch: 64534), Crofer 22 APU
(Ce) = also tested with 10 nm Ce coating. The coupon samples were placed parallel to the flow in an alumina holder with slits. A heating/cooling rate of 5 °C min-1 was used, but the cooling rate was mostly limited by natural cooling of the furnace. Mass gain was measured at regular intervals to monitor oxidation rate. Thus, the samples were thermally cycled each time the samples were weighed. Some experiments were also carried out were the samples were only exposed once, to validate the use of discontinuous exposures. The furnace was flushed with Ar- 5% H2 gas before heating was initiated, and water was introduced at 500 °C. During cooling down of the furnace, flushing with with Ar- 5% H2 gas was performed after 500 °C was reached.
Cerium coating One experiment was carried out with samples that were coated with a Ce coating, in order to investigate if reactive element effects could be achieved in the current test atmosphere. A 10 nm Ce layer was deposited by proprietary physical vapor deposition (PVD) method at Sandvik Materials Technology AB.
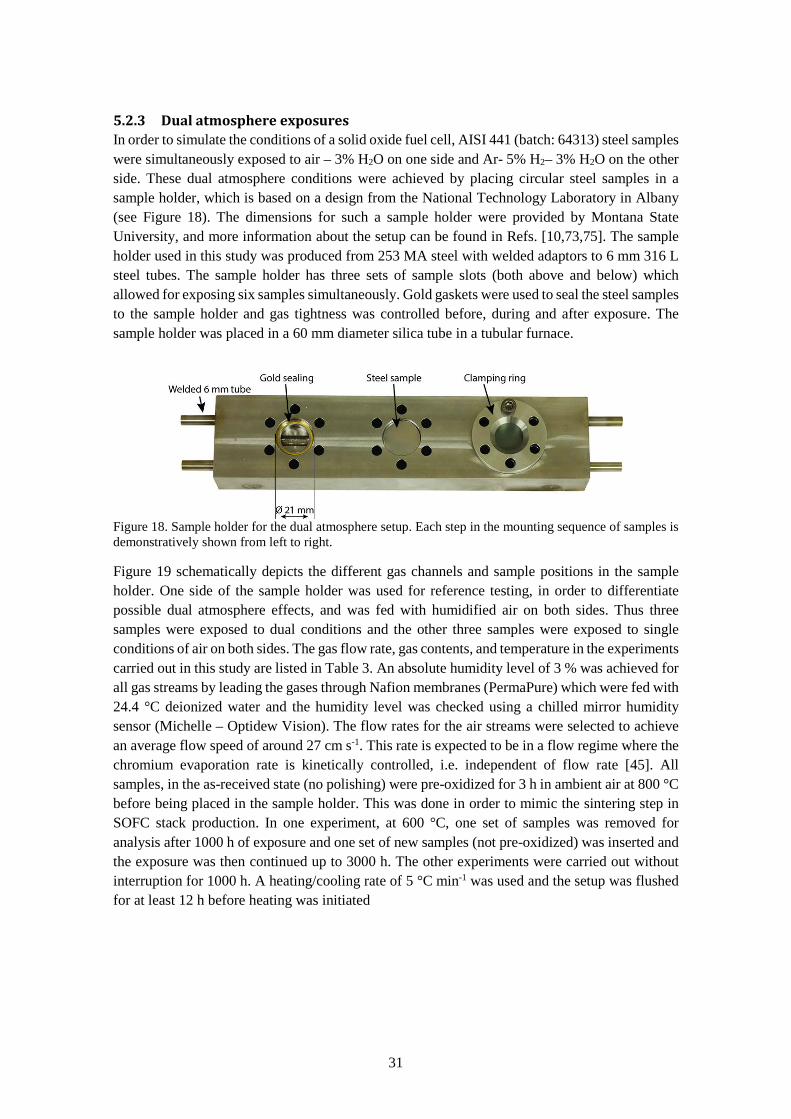
31
5.2.3 Dual atmosphere exposures In order to simulate the conditions of a solid oxide fuel cell, AISI 441 (batch: 64313) steel samples were simultaneously exposed to air – 3% H2O on one side and Ar- 5% H2– 3% H2O on the other side. These dual atmosphere conditions were achieved by placing circular steel samples in a sample holder, which is based on a design from the National Technology Laboratory in Albany (see Figure 18). The dimensions for such a sample holder were provided by Montana State University, and more information about the setup can be found in Refs. [10,73,75]. The sample holder used in this study was produced from 253 MA steel with welded adaptors to 6 mm 316 L steel tubes. The sample holder has three sets of sample slots (both above and below) which allowed for exposing six samples simultaneously. Gold gaskets were used to seal the steel samples to the sample holder and gas tightness was controlled before, during and after exposure. The sample holder was placed in a 60 mm diameter silica tube in a tubular furnace.
Figure 18. Sample holder for the dual atmosphere setup. Each step in the mounting sequence of samples is demonstratively shown from left to right.
Figure 19 schematically depicts the different gas channels and sample positions in the sample holder. One side of the sample holder was used for reference testing, in order to differentiate possible dual atmosphere effects, and was fed with humidified air on both sides. Thus three samples were exposed to dual conditions and the other three samples were exposed to single conditions of air on both sides. The gas flow rate, gas contents, and temperature in the experiments carried out in this study are listed in Table 3. An absolute humidity level of 3 % was achieved for all gas streams by leading the gases through Nafion membranes (PermaPure) which were fed with 24.4 °C deionized water and the humidity level was checked using a chilled mirror humidity sensor (Michelle – Optidew Vision). The flow rates for the air streams were selected to achieve an average flow speed of around 27 cm s-1. This rate is expected to be in a flow regime where the chromium evaporation rate is kinetically controlled, i.e. independent of flow rate [45]. All samples, in the as-received state (no polishing) were pre-oxidized for 3 h in ambient air at 800 °C before being placed in the sample holder. This was done in order to mimic the sintering step in SOFC stack production. In one experiment, at 600 °C, one set of samples was removed for analysis after 1000 h of exposure and one set of new samples (not pre-oxidized) was inserted and the exposure was then continued up to 3000 h. The other experiments were carried out without interruption for 1000 h. A heating/cooling rate of 5 °C min-1 was used and the setup was flushed for at least 12 h before heating was initiated
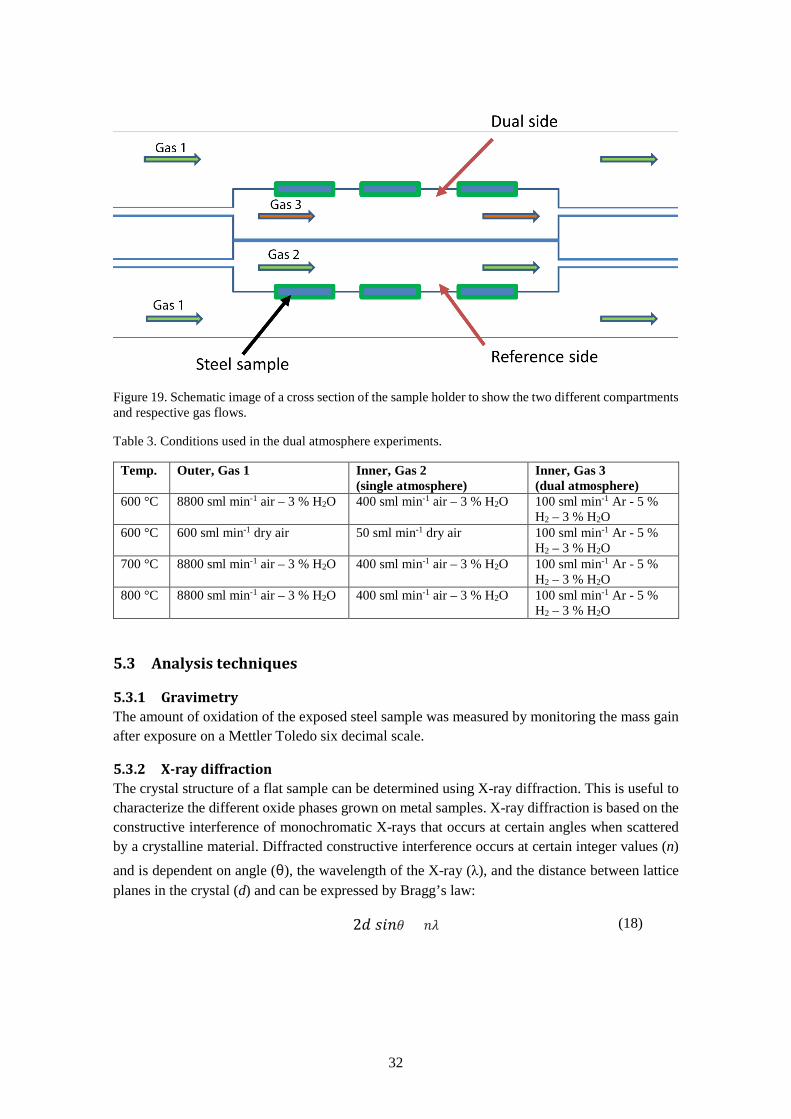
32
Figure 19. Schematic image of a cross section of the sample holder to show the two different compartments and respective gas flows.
Table 3. Conditions used in the dual atmosphere experiments.
Temp. Outer, Gas 1 Inner, Gas 2 (single atmosphere)
Inner, Gas 3 (dual atmosphere)
600 °C 8800 sml min-1 air – 3 % H2O 400 sml min-1 air – 3 % H2O 100 sml min-1 Ar - 5 % H2 – 3 % H2O
600 °C 600 sml min-1 dry air 50 sml min-1 dry air 100 sml min-1 Ar - 5 % H2 – 3 % H2O
700 °C 8800 sml min-1 air – 3 % H2O 400 sml min-1 air – 3 % H2O 100 sml min-1 Ar - 5 % H2 – 3 % H2O
800 °C 8800 sml min-1 air – 3 % H2O 400 sml min-1 air – 3 % H2O 100 sml min-1 Ar - 5 % H2 – 3 % H2O
5.3 Analysis techniques
5.3.1 Gravimetry The amount of oxidation of the exposed steel sample was measured by monitoring the mass gain after exposure on a Mettler Toledo six decimal scale.
5.3.2 X-ray diffraction The crystal structure of a flat sample can be determined using X-ray diffraction. This is useful to characterize the different oxide phases grown on metal samples. X-ray diffraction is based on the constructive interference of monochromatic X-rays that occurs at certain angles when scattered by a crystalline material. Diffracted constructive interference occurs at certain integer values (n) and is dependent on angle (θ), the wavelength of the X-ray (λ), and the distance between lattice planes in the crystal (d) and can be expressed by Bragg’s law:
2𝑑𝑑 𝑠𝑠𝑠𝑠𝑅𝑅𝜃𝜃 = 𝑅𝑅𝑛𝑛 (18)
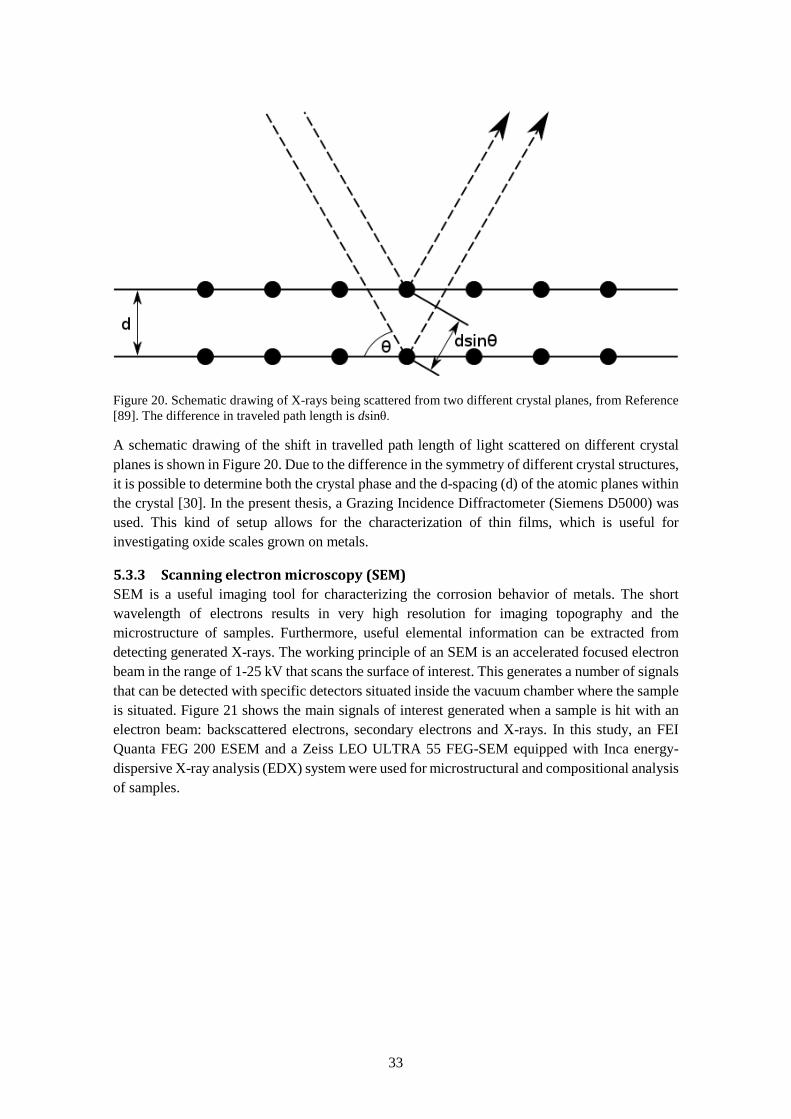
33
Figure 20. Schematic drawing of X-rays being scattered from two different crystal planes, from Reference [89]. The difference in traveled path length is dsinθ.
A schematic drawing of the shift in travelled path length of light scattered on different crystal planes is shown in Figure 20. Due to the difference in the symmetry of different crystal structures, it is possible to determine both the crystal phase and the d-spacing (d) of the atomic planes within the crystal [30]. In the present thesis, a Grazing Incidence Diffractometer (Siemens D5000) was used. This kind of setup allows for the characterization of thin films, which is useful for investigating oxide scales grown on metals.
5.3.3 Scanning electron microscopy (SEM) SEM is a useful imaging tool for characterizing the corrosion behavior of metals. The short wavelength of electrons results in very high resolution for imaging topography and the microstructure of samples. Furthermore, useful elemental information can be extracted from detecting generated X-rays. The working principle of an SEM is an accelerated focused electron beam in the range of 1-25 kV that scans the surface of interest. This generates a number of signals that can be detected with specific detectors situated inside the vacuum chamber where the sample is situated. Figure 21 shows the main signals of interest generated when a sample is hit with an electron beam: backscattered electrons, secondary electrons and X-rays. In this study, an FEI Quanta FEG 200 ESEM and a Zeiss LEO ULTRA 55 FEG-SEM equipped with Inca energy-dispersive X-ray analysis (EDX) system were used for microstructural and compositional analysis of samples.
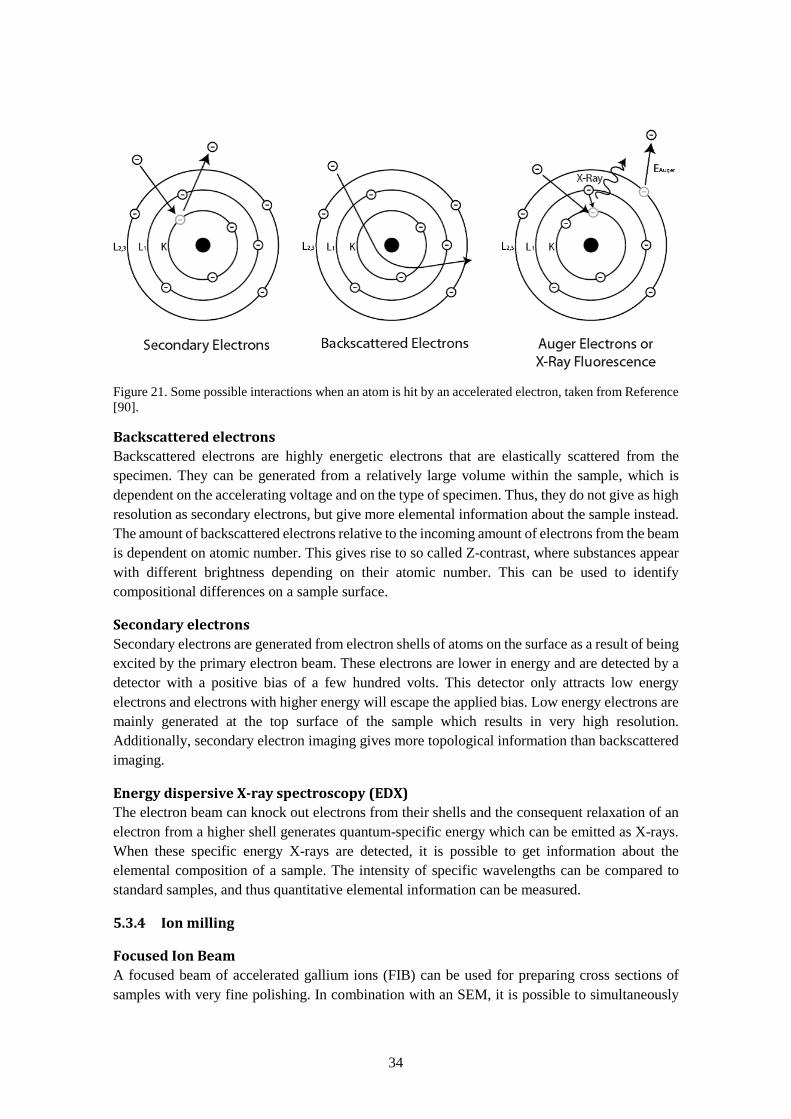
34
Figure 21. Some possible interactions when an atom is hit by an accelerated electron, taken from Reference [90].
Backscattered electrons Backscattered electrons are highly energetic electrons that are elastically scattered from the specimen. They can be generated from a relatively large volume within the sample, which is dependent on the accelerating voltage and on the type of specimen. Thus, they do not give as high resolution as secondary electrons, but give more elemental information about the sample instead. The amount of backscattered electrons relative to the incoming amount of electrons from the beam is dependent on atomic number. This gives rise to so called Z-contrast, where substances appear with different brightness depending on their atomic number. This can be used to identify compositional differences on a sample surface.
Secondary electrons Secondary electrons are generated from electron shells of atoms on the surface as a result of being excited by the primary electron beam. These electrons are lower in energy and are detected by a detector with a positive bias of a few hundred volts. This detector only attracts low energy electrons and electrons with higher energy will escape the applied bias. Low energy electrons are mainly generated at the top surface of the sample which results in very high resolution. Additionally, secondary electron imaging gives more topological information than backscattered imaging.
Energy dispersive X-ray spectroscopy (EDX) The electron beam can knock out electrons from their shells and the consequent relaxation of an electron from a higher shell generates quantum-specific energy which can be emitted as X-rays. When these specific energy X-rays are detected, it is possible to get information about the elemental composition of a sample. The intensity of specific wavelengths can be compared to standard samples, and thus quantitative elemental information can be measured.
5.3.4 Ion milling
Focused Ion Beam A focused beam of accelerated gallium ions (FIB) can be used for preparing cross sections of samples with very fine polishing. In combination with an SEM, it is possible to simultaneously
35
image and choose specific spots on a sample to mill a cross section. This makes it possible to get cross sectional information about micrometer scale features. A FEI Versa 3D DualBeam (FIB/SEM) was used on selected samples in this study when mechanical polishing was not possible or special micrometer scale features were of interest.
Broad Ion Beam A broad ion beam (BIB) can also be used to polish the edge of a sample in order to create fine polished cross sections on the millimeter scale. This can be used as an alternative to mechanical polishing of cross sections and has the benefits of being a dry process with finer polishing. An Ion Beam Milling System Leica EM TIC 3X was used in order to polish cross sections of selected samples when mechanical polishing was insufficient.
5.3.5 Chromium quantification with UV/Vis spectrophotometer The maximum light absorbance for chromate in solution is at a wavelength of 370 nm, which was the setting used for all analyses in this thesis. Equation 19 shows the equilibrium reaction between chromate and dichromate. It is important that the equilibrium of this reaction shifts towards the predominance of chromate ions, since a dichromate ion does not have the same maximum absorbance wavelength as chromate ions. Fournier-Salaün et al. have performed studies regarding chromate quantification using spectrophotometry and found that pH 9 and above is sufficient for almost 100% chromate predominance [91]. It was confirmed in the work of this thesis that the sample solutions from the leached denuders were sufficiently alkaline for the equilibrium to shift towards chromate ion predominance due to the high alkalinity of sodium carbonate from the denuder tubes.
2CrO42− + 2H+ ↔ Cr2O7
2− + H2O (19)
Calibration of the instrument with standard chromate solution showed linear dependence on concentration, which is in good agreement with the Lambert Beer relation
𝐴𝐴 = 𝜀𝜀 ∗ 𝑅𝑅 ∗ 𝑐𝑐 (20) where A is the absorbance, ε is the molar absorptivity, l is the path length of the light through the solution, and c is the concentration. In this case, l is a constant since only one type of cuvette fits into the spectrometer, thus the absorbance dependence on concentration can be derived from the standard curve and expressed as
𝐴𝐴 = 0.0902 ∗ 𝑐𝑐 (21) if the concentration is expressed in weight ppm of chromium.

36
37
6 Results and discussion
6.1 Oxygen dependence The interconnects in SOCs must have high corrosion resistance on both the fuel and the oxygen sides These environments are inherently different since the oxygen partial pressure difference is in the range of 15-20 orders of magnitude higher on the oxygen side. Due to the reactions along the electrode on the fuel side (see Equation 3), there is also a difference in the fuel-to-water ratio between the inlet and the outlet, which results in an oxygen partial pressure gradient. Consequently, when comparing results of studies carried out in different simulated SOC atmospheres the influence of oxygen pressure is often discussed in the literature. Furthermore, studies have shown that SOCs can benefit from operating at elevated pressure, which could potentially accelerate corrosion due to increased oxygen pressure [92,93].
This study was conducted in order to bring more clarity to the issue of the isolated oxygen pressure dependence on corrosion. Four ferritic stainless steels, Sanergy HT, Crofer 22 H, E-brite and ATI 441 HP were exposed to different concentrations of oxygen and the oxidation rate, oxide scale microstructure and chromium evaporation were evaluated.
6.1.1 Oxidation rate In Figure 22, squared mass gains for all tested alloys are shown. Most alloys exhibited good agreement with the parabolic rate law in Equation 13 and can thus be assumed to oxidize with ionic diffusion through the oxide scale as the rate limiting step. E-brite did not oxidize parabolic in 1 % and 0.01 % O2 due to spallation of the oxide scale. Scale adhesion will be discussed in Subsection 6.1.2. Furthermore, the parabolic oxidation of the steels behavior did not change with varying oxygen pressure (except for E-brite) and thus the oxidation mechanism seems to be constant over the studied oxygen pressure range. Figure 23 summarizes the mass gains after 500 h exposure and apparent differences in performance can be noted between the alloys. Crofer 22 H was found to oxidize the fastest, closely followed by ATI 441 HP, which was unexpected since Crofer 22 H is higher alloyed with more chromium and contains the reactive element La. Crofer 22 H is similar to Sanergy HT in elemental composition, yet it had considerable higher mass gain after 500 h with 0.83 mg cm-2 compared to 0.53 mg cm-2 in 100 % O2. E-brite had the highest chromium content of the tested steels and had the lowest mass gain, with 0.37 mg cm-2 in 100 % O2. The severe spallation of E-brite in the lower oxygen pressures resulted in misrepresentative mass gain data and, for this reason, could not be compared.
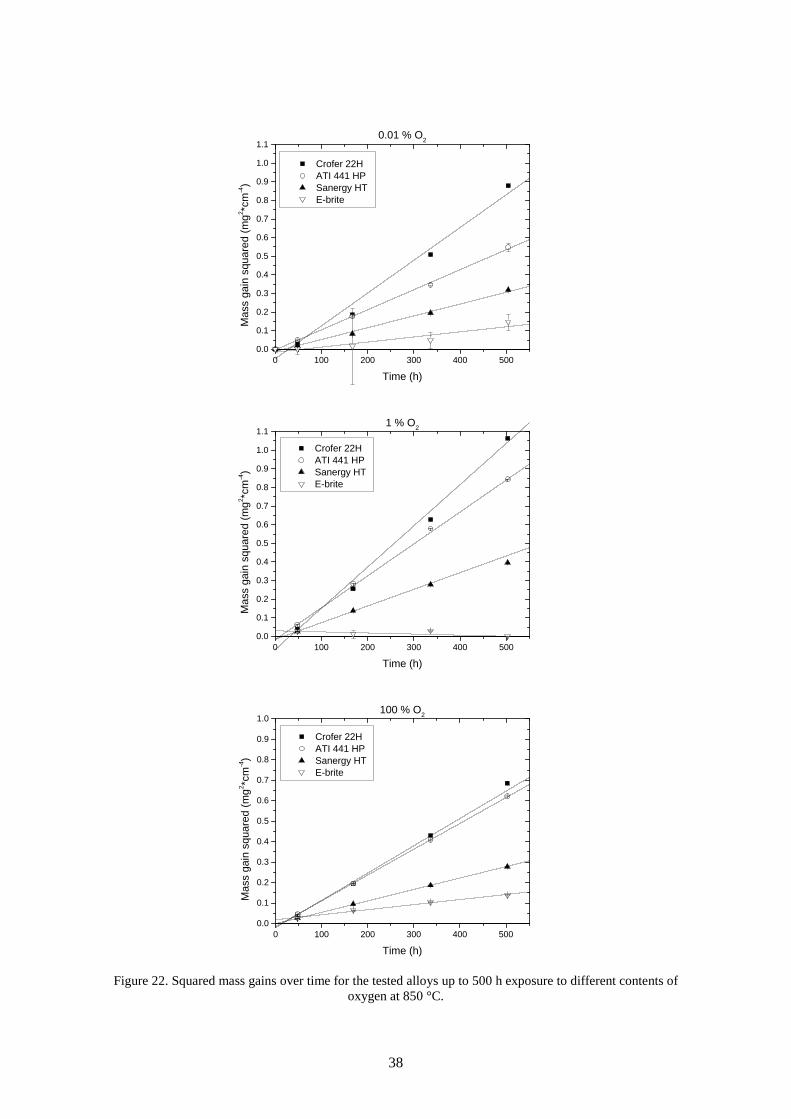
38
0 100 200 300 400 5000.0
0.1
0.2
0.3
0.4
0.5
0.6
0.7
0.8
0.9
1.0
1.1
Crofer 22H ATI 441 HP Sanergy HT E-brite
Mas
s ga
in s
quar
ed (m
g2 *cm
-4)
Time (h)
0.01 % O2
0 100 200 300 400 5000.0
0.1
0.2
0.3
0.4
0.5
0.6
0.7
0.8
0.9
1.0
1.1
Crofer 22H ATI 441 HP Sanergy HT E-brite
Mas
s ga
in s
quar
ed (m
g2 *cm
-4)
Time (h)
1 % O2
0 100 200 300 400 5000.0
0.1
0.2
0.3
0.4
0.5
0.6
0.7
0.8
0.9
1.0
Crofer 22H ATI 441 HP Sanergy HT E-brite
Mas
s ga
in s
quar
ed (m
g2 *cm
-4)
Time (h)
100 % O2
Figure 22. Squared mass gains over time for the tested alloys up to 500 h exposure to different contents of
oxygen at 850 °C.
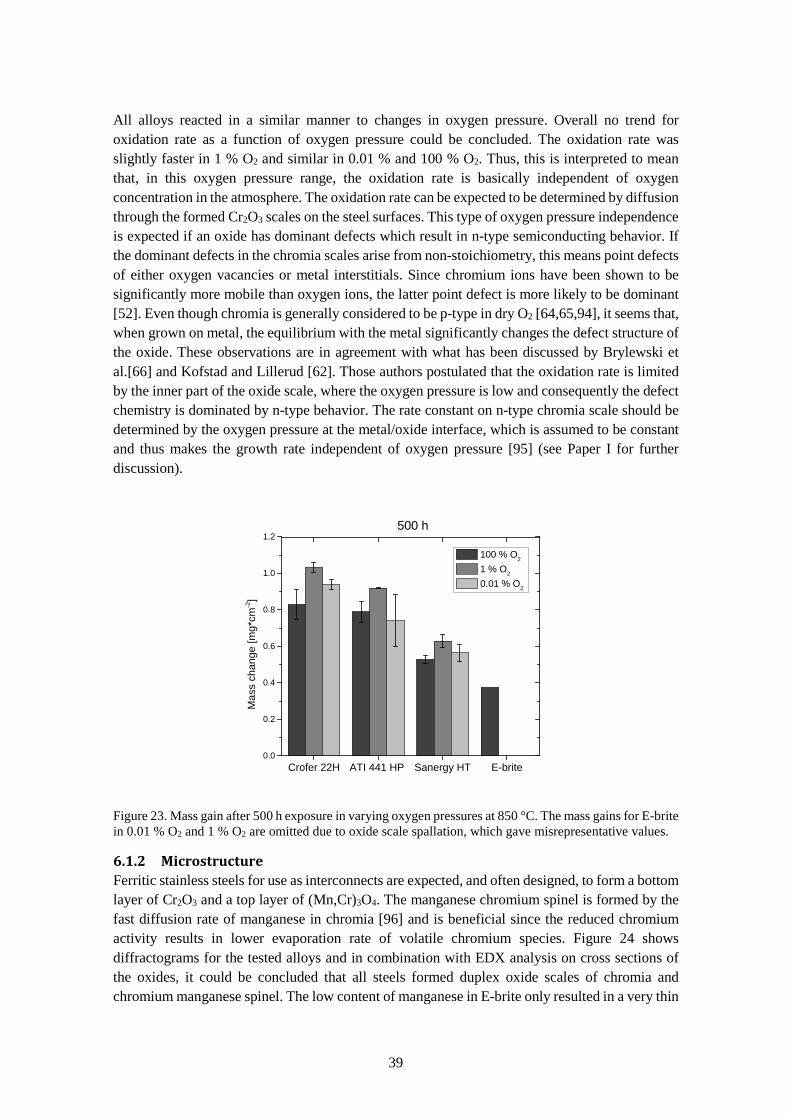
39
All alloys reacted in a similar manner to changes in oxygen pressure. Overall no trend for oxidation rate as a function of oxygen pressure could be concluded. The oxidation rate was slightly faster in 1 % O2 and similar in 0.01 % and 100 % O2. Thus, this is interpreted to mean that, in this oxygen pressure range, the oxidation rate is basically independent of oxygen concentration in the atmosphere. The oxidation rate can be expected to be determined by diffusion through the formed Cr2O3 scales on the steel surfaces. This type of oxygen pressure independence is expected if an oxide has dominant defects which result in n-type semiconducting behavior. If the dominant defects in the chromia scales arise from non-stoichiometry, this means point defects of either oxygen vacancies or metal interstitials. Since chromium ions have been shown to be significantly more mobile than oxygen ions, the latter point defect is more likely to be dominant [52]. Even though chromia is generally considered to be p-type in dry O2 [64,65,94], it seems that, when grown on metal, the equilibrium with the metal significantly changes the defect structure of the oxide. These observations are in agreement with what has been discussed by Brylewski et al.[66] and Kofstad and Lillerud [62]. Those authors postulated that the oxidation rate is limited by the inner part of the oxide scale, where the oxygen pressure is low and consequently the defect chemistry is dominated by n-type behavior. The rate constant on n-type chromia scale should be determined by the oxygen pressure at the metal/oxide interface, which is assumed to be constant and thus makes the growth rate independent of oxygen pressure [95] (see Paper I for further discussion).
Crofer 22H ATI 441 HP Sanergy HT E-brite0.0
0.2
0.4
0.6
0.8
1.0
1.2500 h
Mas
s ch
ange
[mg*
cm-2]
100 % O2
1 % O2
0.01 % O2
Figure 23. Mass gain after 500 h exposure in varying oxygen pressures at 850 °C. The mass gains for E-brite in 0.01 % O2 and 1 % O2 are omitted due to oxide scale spallation, which gave misrepresentative values.
6.1.2 Microstructure Ferritic stainless steels for use as interconnects are expected, and often designed, to form a bottom layer of Cr2O3 and a top layer of (Mn,Cr)3O4. The manganese chromium spinel is formed by the fast diffusion rate of manganese in chromia [96] and is beneficial since the reduced chromium activity results in lower evaporation rate of volatile chromium species. Figure 24 shows diffractograms for the tested alloys and in combination with EDX analysis on cross sections of the oxides, it could be concluded that all steels formed duplex oxide scales of chromia and chromium manganese spinel. The low content of manganese in E-brite only resulted in a very thin
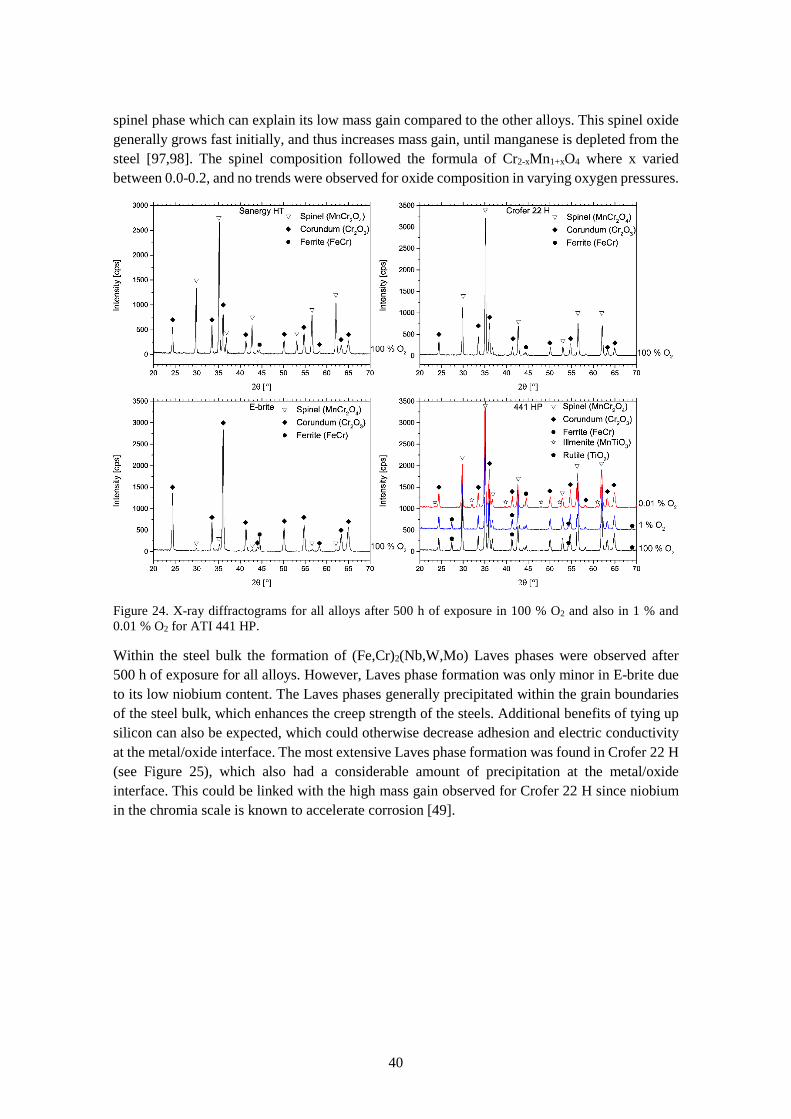
40
spinel phase which can explain its low mass gain compared to the other alloys. This spinel oxide generally grows fast initially, and thus increases mass gain, until manganese is depleted from the steel [97,98]. The spinel composition followed the formula of Cr2-xMn1+xO4 where x varied between 0.0-0.2, and no trends were observed for oxide composition in varying oxygen pressures.
Figure 24. X-ray diffractograms for all alloys after 500 h of exposure in 100 % O2 and also in 1 % and 0.01 % O2 for ATI 441 HP.
Within the steel bulk the formation of (Fe,Cr)2(Nb,W,Mo) Laves phases were observed after 500 h of exposure for all alloys. However, Laves phase formation was only minor in E-brite due to its low niobium content. The Laves phases generally precipitated within the grain boundaries of the steel bulk, which enhances the creep strength of the steels. Additional benefits of tying up silicon can also be expected, which could otherwise decrease adhesion and electric conductivity at the metal/oxide interface. The most extensive Laves phase formation was found in Crofer 22 H (see Figure 25), which also had a considerable amount of precipitation at the metal/oxide interface. This could be linked with the high mass gain observed for Crofer 22 H since niobium in the chromia scale is known to accelerate corrosion [49].
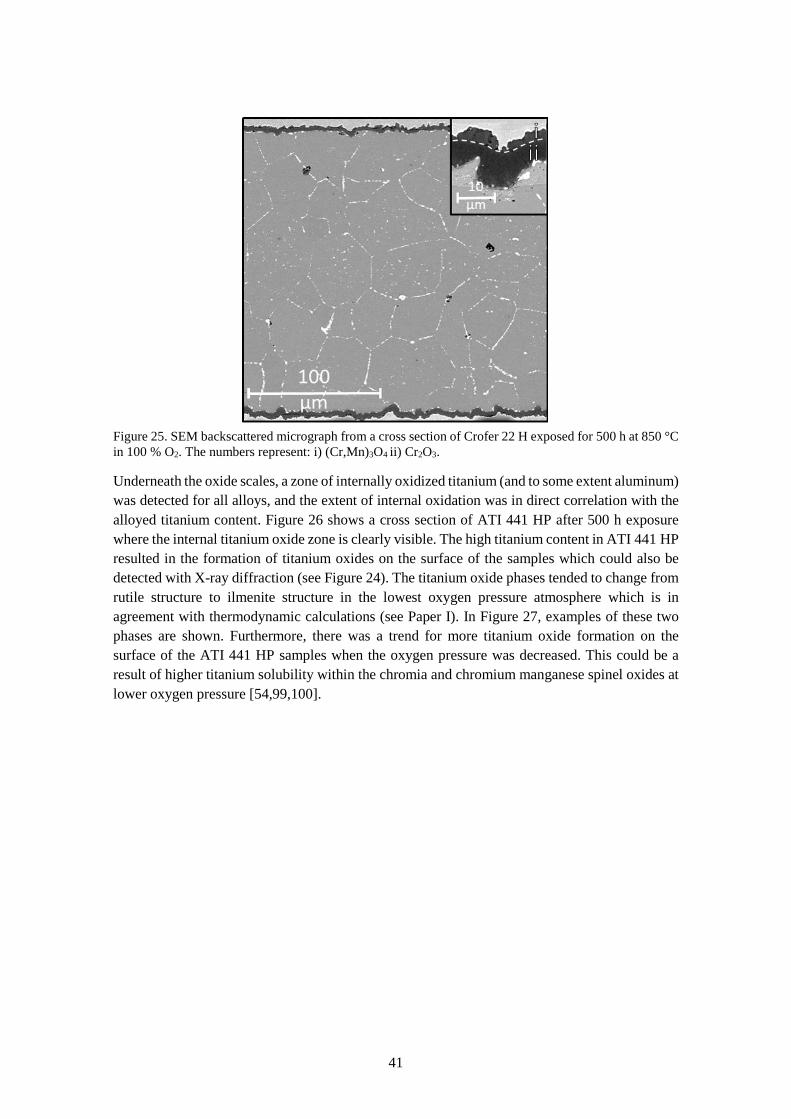
41
Figure 25. SEM backscattered micrograph from a cross section of Crofer 22 H exposed for 500 h at 850 °C in 100 % O2. The numbers represent: i) (Cr,Mn)3O4 ii) Cr2O3.
Underneath the oxide scales, a zone of internally oxidized titanium (and to some extent aluminum) was detected for all alloys, and the extent of internal oxidation was in direct correlation with the alloyed titanium content. Figure 26 shows a cross section of ATI 441 HP after 500 h exposure where the internal titanium oxide zone is clearly visible. The high titanium content in ATI 441 HP resulted in the formation of titanium oxides on the surface of the samples which could also be detected with X-ray diffraction (see Figure 24). The titanium oxide phases tended to change from rutile structure to ilmenite structure in the lowest oxygen pressure atmosphere which is in agreement with thermodynamic calculations (see Paper I). In Figure 27, examples of these two phases are shown. Furthermore, there was a trend for more titanium oxide formation on the surface of the ATI 441 HP samples when the oxygen pressure was decreased. This could be a result of higher titanium solubility within the chromia and chromium manganese spinel oxides at lower oxygen pressure [54,99,100].
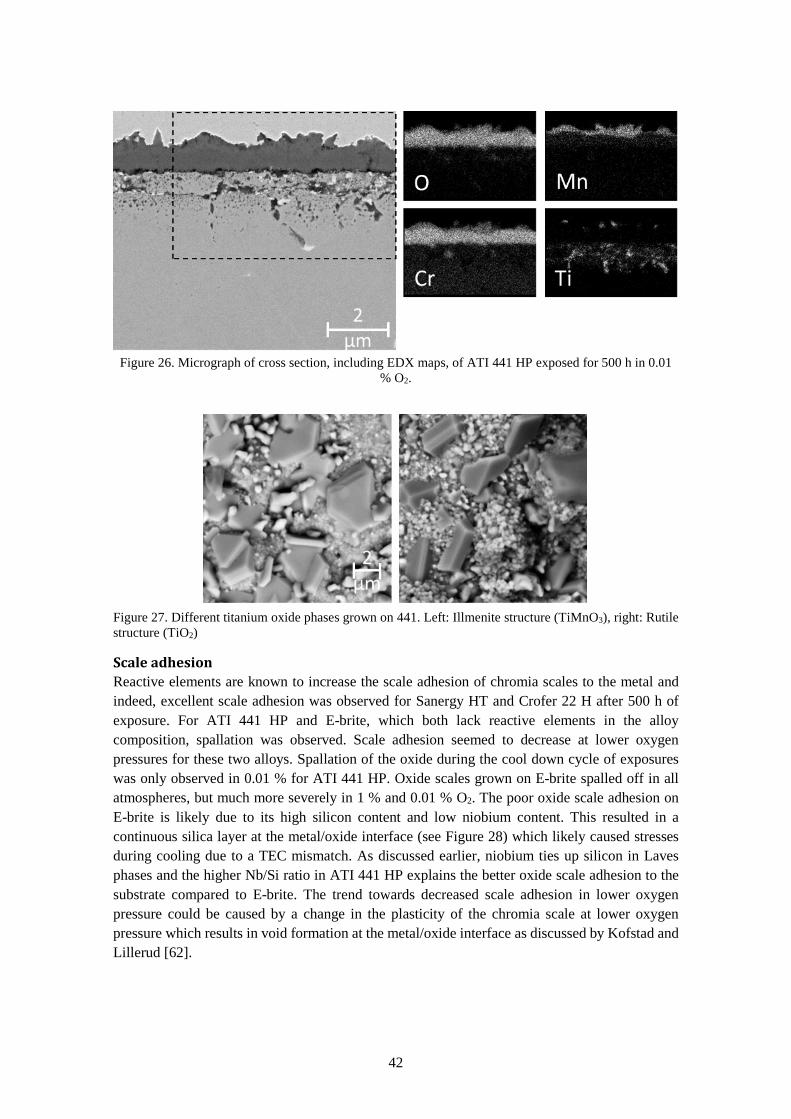
42
Figure 26. Micrograph of cross section, including EDX maps, of ATI 441 HP exposed for 500 h in 0.01
% O2.
Figure 27. Different titanium oxide phases grown on 441. Left: Illmenite structure (TiMnO3), right: Rutile structure (TiO2)
Scale adhesion Reactive elements are known to increase the scale adhesion of chromia scales to the metal and indeed, excellent scale adhesion was observed for Sanergy HT and Crofer 22 H after 500 h of exposure. For ATI 441 HP and E-brite, which both lack reactive elements in the alloy composition, spallation was observed. Scale adhesion seemed to decrease at lower oxygen pressures for these two alloys. Spallation of the oxide during the cool down cycle of exposures was only observed in 0.01 % for ATI 441 HP. Oxide scales grown on E-brite spalled off in all atmospheres, but much more severely in 1 % and 0.01 % O2. The poor oxide scale adhesion on E-brite is likely due to its high silicon content and low niobium content. This resulted in a continuous silica layer at the metal/oxide interface (see Figure 28) which likely caused stresses during cooling due to a TEC mismatch. As discussed earlier, niobium ties up silicon in Laves phases and the higher Nb/Si ratio in ATI 441 HP explains the better oxide scale adhesion to the substrate compared to E-brite. The trend towards decreased scale adhesion in lower oxygen pressure could be caused by a change in the plasticity of the chromia scale at lower oxygen pressure which results in void formation at the metal/oxide interface as discussed by Kofstad and Lillerud [62].
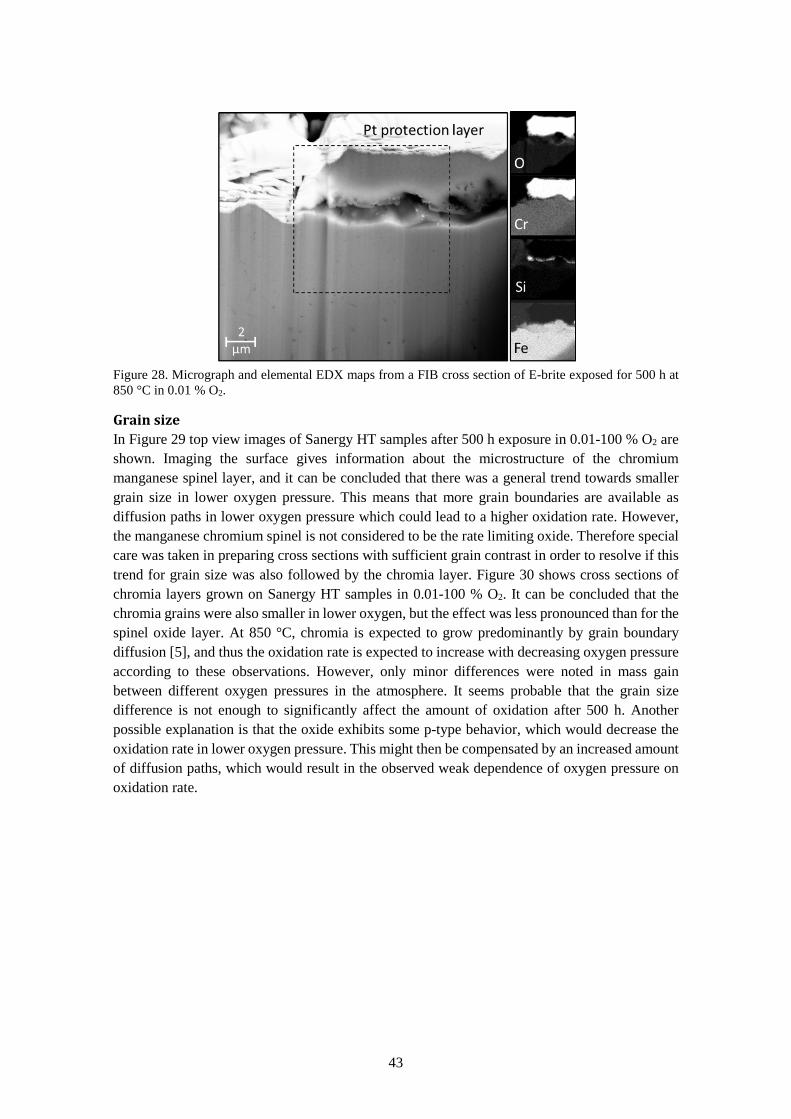
43
Figure 28. Micrograph and elemental EDX maps from a FIB cross section of E-brite exposed for 500 h at 850 °C in 0.01 % O2.
Grain size In Figure 29 top view images of Sanergy HT samples after 500 h exposure in 0.01-100 % O2 are shown. Imaging the surface gives information about the microstructure of the chromium manganese spinel layer, and it can be concluded that there was a general trend towards smaller grain size in lower oxygen pressure. This means that more grain boundaries are available as diffusion paths in lower oxygen pressure which could lead to a higher oxidation rate. However, the manganese chromium spinel is not considered to be the rate limiting oxide. Therefore special care was taken in preparing cross sections with sufficient grain contrast in order to resolve if this trend for grain size was also followed by the chromia layer. Figure 30 shows cross sections of chromia layers grown on Sanergy HT samples in 0.01-100 % O2. It can be concluded that the chromia grains were also smaller in lower oxygen, but the effect was less pronounced than for the spinel oxide layer. At 850 °C, chromia is expected to grow predominantly by grain boundary diffusion [5], and thus the oxidation rate is expected to increase with decreasing oxygen pressure according to these observations. However, only minor differences were noted in mass gain between different oxygen pressures in the atmosphere. It seems probable that the grain size difference is not enough to significantly affect the amount of oxidation after 500 h. Another possible explanation is that the oxide exhibits some p-type behavior, which would decrease the oxidation rate in lower oxygen pressure. This might then be compensated by an increased amount of diffusion paths, which would result in the observed weak dependence of oxygen pressure on oxidation rate.
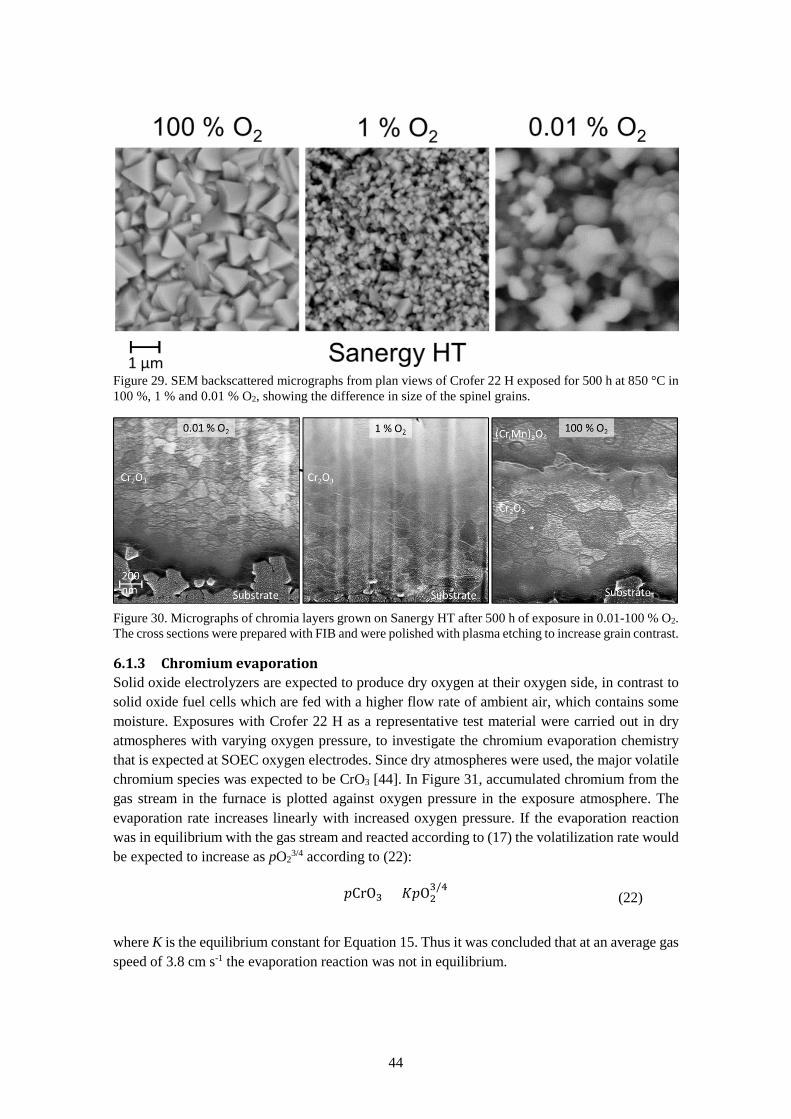
44
Figure 29. SEM backscattered micrographs from plan views of Crofer 22 H exposed for 500 h at 850 °C in 100 %, 1 % and 0.01 % O2, showing the difference in size of the spinel grains.
Figure 30. Micrographs of chromia layers grown on Sanergy HT after 500 h of exposure in 0.01-100 % O2. The cross sections were prepared with FIB and were polished with plasma etching to increase grain contrast.
6.1.3 Chromium evaporation Solid oxide electrolyzers are expected to produce dry oxygen at their oxygen side, in contrast to solid oxide fuel cells which are fed with a higher flow rate of ambient air, which contains some moisture. Exposures with Crofer 22 H as a representative test material were carried out in dry atmospheres with varying oxygen pressure, to investigate the chromium evaporation chemistry that is expected at SOEC oxygen electrodes. Since dry atmospheres were used, the major volatile chromium species was expected to be CrO3 [44]. In Figure 31, accumulated chromium from the gas stream in the furnace is plotted against oxygen pressure in the exposure atmosphere. The evaporation rate increases linearly with increased oxygen pressure. If the evaporation reaction was in equilibrium with the gas stream and reacted according to (17) the volatilization rate would be expected to increase as pO2
3/4 according to (22):
𝑝𝑝CrO3 = 𝐾𝐾𝑝𝑝O23/4 (22)
where K is the equilibrium constant for Equation 15. Thus it was concluded that at an average gas speed of 3.8 cm s-1 the evaporation reaction was not in equilibrium.
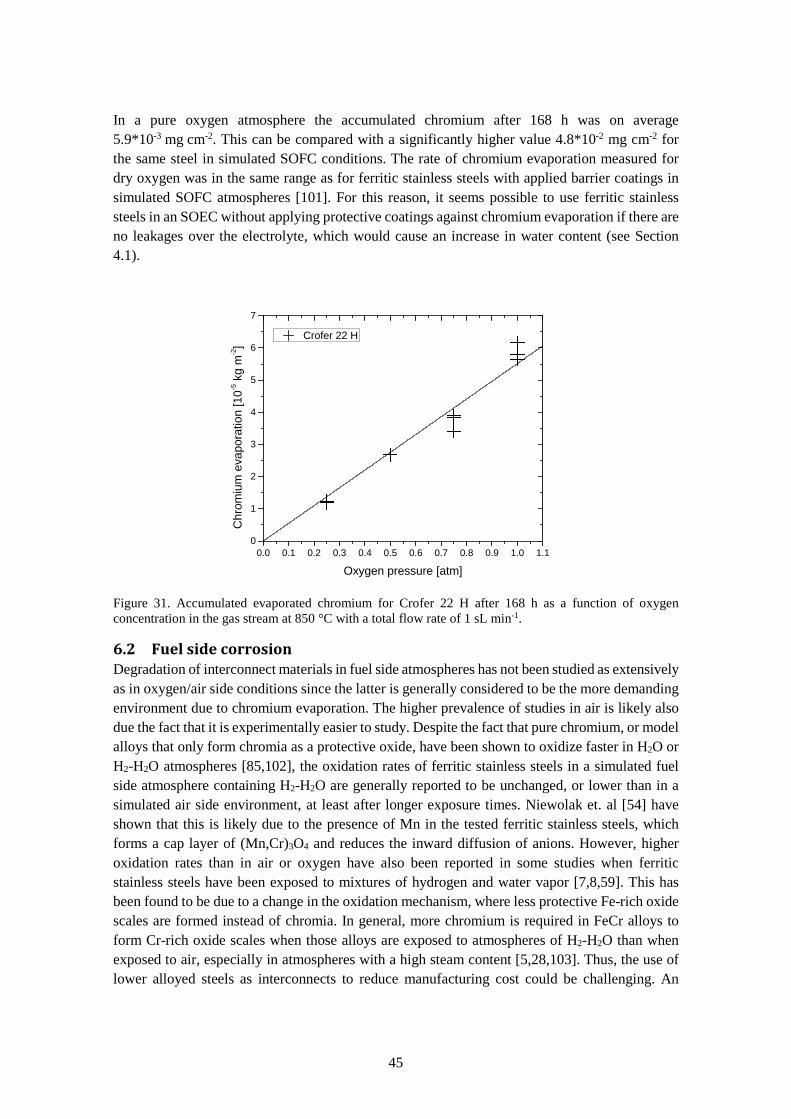
45
In a pure oxygen atmosphere the accumulated chromium after 168 h was on average 5.9*10-3 mg cm-2. This can be compared with a significantly higher value 4.8*10-2 mg cm-2 for the same steel in simulated SOFC conditions. The rate of chromium evaporation measured for dry oxygen was in the same range as for ferritic stainless steels with applied barrier coatings in simulated SOFC atmospheres [101]. For this reason, it seems possible to use ferritic stainless steels in an SOEC without applying protective coatings against chromium evaporation if there are no leakages over the electrolyte, which would cause an increase in water content (see Section 4.1).
0.0 0.1 0.2 0.3 0.4 0.5 0.6 0.7 0.8 0.9 1.0 1.10
1
2
3
4
5
6
7
Crofer 22 H
Chr
omiu
m e
vapo
ratio
n [1
0-5 k
g m
-2]
Oxygen pressure [atm]
Figure 31. Accumulated evaporated chromium for Crofer 22 H after 168 h as a function of oxygen concentration in the gas stream at 850 °C with a total flow rate of 1 sL min-1.
6.2 Fuel side corrosion Degradation of interconnect materials in fuel side atmospheres has not been studied as extensively as in oxygen/air side conditions since the latter is generally considered to be the more demanding environment due to chromium evaporation. The higher prevalence of studies in air is likely also due the fact that it is experimentally easier to study. Despite the fact that pure chromium, or model alloys that only form chromia as a protective oxide, have been shown to oxidize faster in H2O or H2-H2O atmospheres [85,102], the oxidation rates of ferritic stainless steels in a simulated fuel side atmosphere containing H2-H2O are generally reported to be unchanged, or lower than in a simulated air side environment, at least after longer exposure times. Niewolak et. al [54] have shown that this is likely due to the presence of Mn in the tested ferritic stainless steels, which forms a cap layer of (Mn,Cr)3O4 and reduces the inward diffusion of anions. However, higher oxidation rates than in air or oxygen have also been reported in some studies when ferritic stainless steels have been exposed to mixtures of hydrogen and water vapor [7,8,59]. This has been found to be due to a change in the oxidation mechanism, where less protective Fe-rich oxide scales are formed instead of chromia. In general, more chromium is required in FeCr alloys to form Cr-rich oxide scales when those alloys are exposed to atmospheres of H2-H2O than when exposed to air, especially in atmospheres with a high steam content [5,28,103]. Thus, the use of lower alloyed steels as interconnects to reduce manufacturing cost could be challenging. An
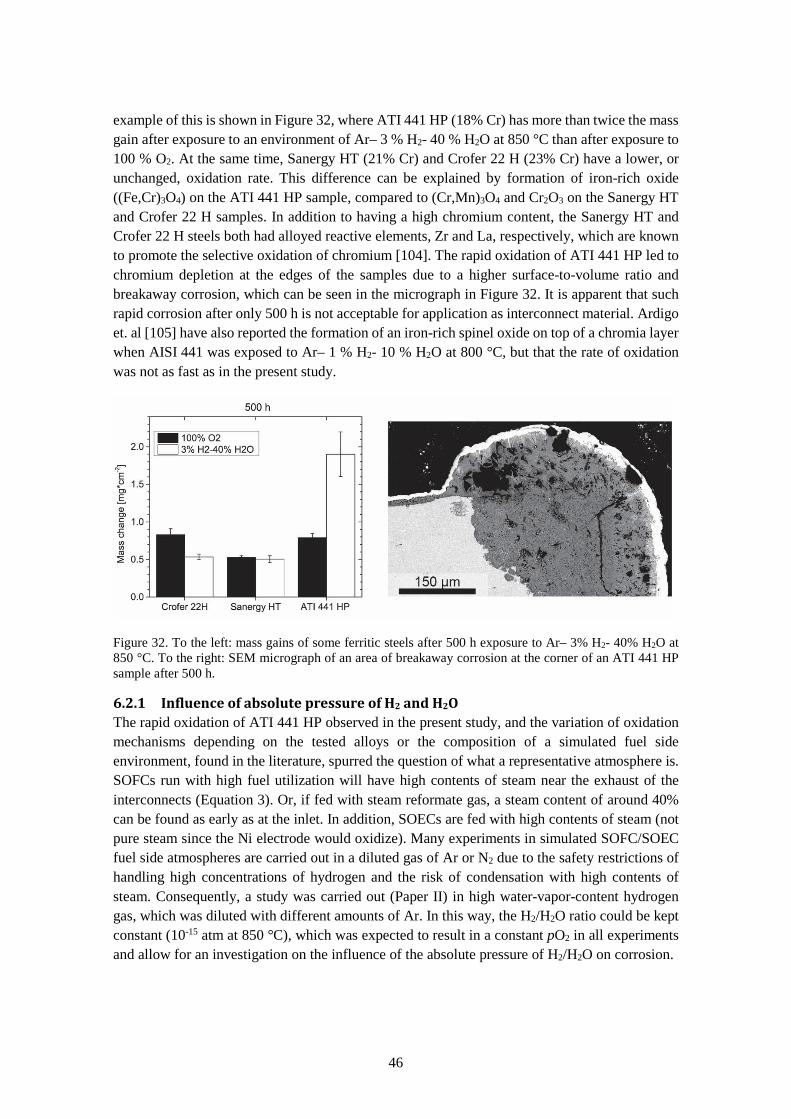
46
example of this is shown in Figure 32, where ATI 441 HP (18% Cr) has more than twice the mass gain after exposure to an environment of Ar– 3 % H2- 40 % H2O at 850 °C than after exposure to 100 % O2. At the same time, Sanergy HT (21% Cr) and Crofer 22 H (23% Cr) have a lower, or unchanged, oxidation rate. This difference can be explained by formation of iron-rich oxide ((Fe,Cr)3O4) on the ATI 441 HP sample, compared to (Cr,Mn)3O4 and Cr2O3 on the Sanergy HT and Crofer 22 H samples. In addition to having a high chromium content, the Sanergy HT and Crofer 22 H steels both had alloyed reactive elements, Zr and La, respectively, which are known to promote the selective oxidation of chromium [104]. The rapid oxidation of ATI 441 HP led to chromium depletion at the edges of the samples due to a higher surface-to-volume ratio and breakaway corrosion, which can be seen in the micrograph in Figure 32. It is apparent that such rapid corrosion after only 500 h is not acceptable for application as interconnect material. Ardigo et. al [105] have also reported the formation of an iron-rich spinel oxide on top of a chromia layer when AISI 441 was exposed to Ar– 1 % H2- 10 % H2O at 800 °C, but that the rate of oxidation was not as fast as in the present study.
Figure 32. To the left: mass gains of some ferritic steels after 500 h exposure to Ar– 3% H2- 40% H2O at 850 °C. To the right: SEM micrograph of an area of breakaway corrosion at the corner of an ATI 441 HP sample after 500 h.
6.2.1 Influence of absolute pressure of H2 and H2O The rapid oxidation of ATI 441 HP observed in the present study, and the variation of oxidation mechanisms depending on the tested alloys or the composition of a simulated fuel side environment, found in the literature, spurred the question of what a representative atmosphere is. SOFCs run with high fuel utilization will have high contents of steam near the exhaust of the interconnects (Equation 3). Or, if fed with steam reformate gas, a steam content of around 40% can be found as early as at the inlet. In addition, SOECs are fed with high contents of steam (not pure steam since the Ni electrode would oxidize). Many experiments in simulated SOFC/SOEC fuel side atmospheres are carried out in a diluted gas of Ar or N2 due to the safety restrictions of handling high concentrations of hydrogen and the risk of condensation with high contents of steam. Consequently, a study was carried out (Paper II) in high water-vapor-content hydrogen gas, which was diluted with different amounts of Ar. In this way, the H2/H2O ratio could be kept constant (10-15 atm at 850 °C), which was expected to result in a constant pO2 in all experiments and allow for an investigation on the influence of the absolute pressure of H2/H2O on corrosion.
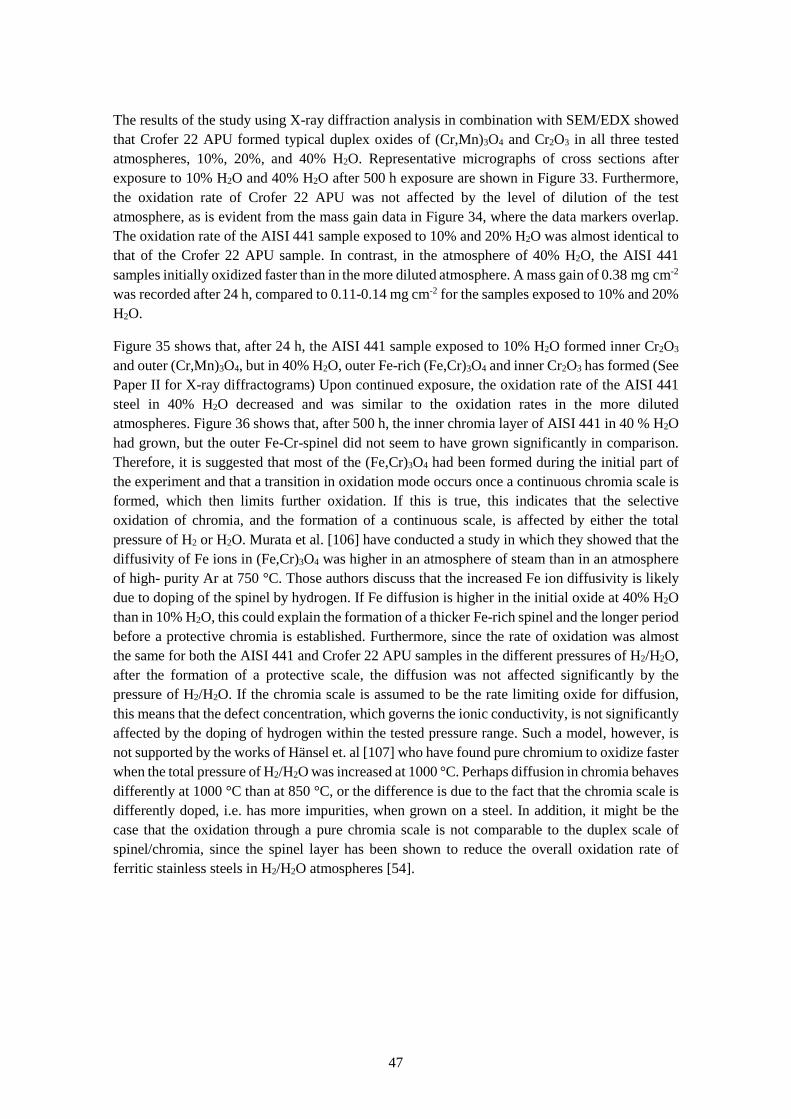
47
The results of the study using X-ray diffraction analysis in combination with SEM/EDX showed that Crofer 22 APU formed typical duplex oxides of (Cr,Mn)3O4 and Cr2O3 in all three tested atmospheres, 10%, 20%, and 40% H2O. Representative micrographs of cross sections after exposure to 10% H2O and 40% H2O after 500 h exposure are shown in Figure 33. Furthermore, the oxidation rate of Crofer 22 APU was not affected by the level of dilution of the test atmosphere, as is evident from the mass gain data in Figure 34, where the data markers overlap. The oxidation rate of the AISI 441 sample exposed to 10% and 20% H2O was almost identical to that of the Crofer 22 APU sample. In contrast, in the atmosphere of 40% H2O, the AISI 441 samples initially oxidized faster than in the more diluted atmosphere. A mass gain of 0.38 mg cm-2 was recorded after 24 h, compared to 0.11-0.14 mg cm-2 for the samples exposed to 10% and 20% H2O.
Figure 35 shows that, after 24 h, the AISI 441 sample exposed to 10% H2O formed inner Cr2O3 and outer (Cr,Mn)3O4, but in 40% H2O, outer Fe-rich (Fe,Cr)3O4 and inner Cr2O3 has formed (See Paper II for X-ray diffractograms) Upon continued exposure, the oxidation rate of the AISI 441 steel in 40% H2O decreased and was similar to the oxidation rates in the more diluted atmospheres. Figure 36 shows that, after 500 h, the inner chromia layer of AISI 441 in 40 % H2O had grown, but the outer Fe-Cr-spinel did not seem to have grown significantly in comparison. Therefore, it is suggested that most of the (Fe,Cr)3O4 had been formed during the initial part of the experiment and that a transition in oxidation mode occurs once a continuous chromia scale is formed, which then limits further oxidation. If this is true, this indicates that the selective oxidation of chromia, and the formation of a continuous scale, is affected by either the total pressure of H2 or H2O. Murata et al. [106] have conducted a study in which they showed that the diffusivity of Fe ions in (Fe,Cr)3O4 was higher in an atmosphere of steam than in an atmosphere of high- purity Ar at 750 °C. Those authors discuss that the increased Fe ion diffusivity is likely due to doping of the spinel by hydrogen. If Fe diffusion is higher in the initial oxide at 40% H2O than in 10% H2O, this could explain the formation of a thicker Fe-rich spinel and the longer period before a protective chromia is established. Furthermore, since the rate of oxidation was almost the same for both the AISI 441 and Crofer 22 APU samples in the different pressures of H2/H2O, after the formation of a protective scale, the diffusion was not affected significantly by the pressure of H2/H2O. If the chromia scale is assumed to be the rate limiting oxide for diffusion, this means that the defect concentration, which governs the ionic conductivity, is not significantly affected by the doping of hydrogen within the tested pressure range. Such a model, however, is not supported by the works of Hänsel et. al [107] who have found pure chromium to oxidize faster when the total pressure of H2/H2O was increased at 1000 °C. Perhaps diffusion in chromia behaves differently at 1000 °C than at 850 °C, or the difference is due to the fact that the chromia scale is differently doped, i.e. has more impurities, when grown on a steel. In addition, it might be the case that the oxidation through a pure chromia scale is not comparable to the duplex scale of spinel/chromia, since the spinel layer has been shown to reduce the overall oxidation rate of ferritic stainless steels in H2/H2O atmospheres [54].
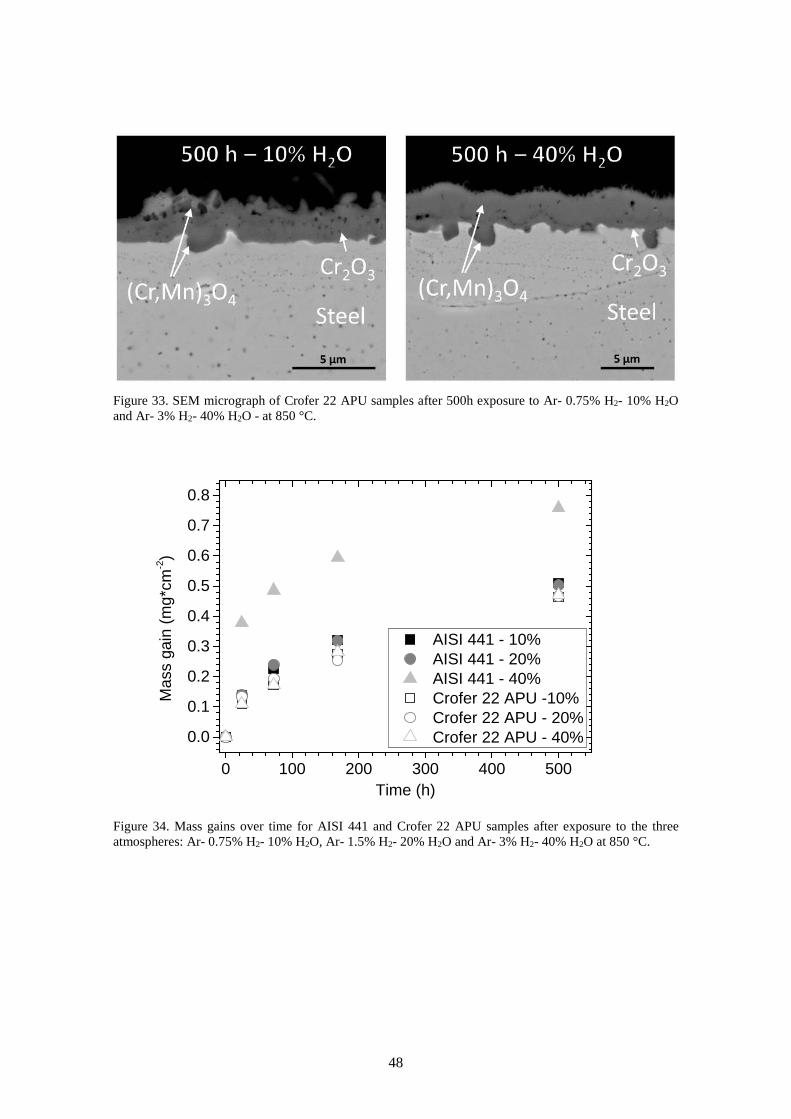
48
Figure 33. SEM micrograph of Crofer 22 APU samples after 500h exposure to Ar- 0.75% H2- 10% H2O and Ar- 3% H2- 40% H2O - at 850 °C.
0 100 200 300 400 500
0.0
0.1
0.2
0.3
0.4
0.5
0.6
0.7
0.8
AISI 441 - 10% AISI 441 - 20% AISI 441 - 40% Crofer 22 APU -10% Crofer 22 APU - 20% Crofer 22 APU - 40%
Mas
s ga
in (m
g*cm
-2)
Time (h)
Figure 34. Mass gains over time for AISI 441 and Crofer 22 APU samples after exposure to the three atmospheres: Ar- 0.75% H2- 10% H2O, Ar- 1.5% H2- 20% H2O and Ar- 3% H2- 40% H2O at 850 °C.
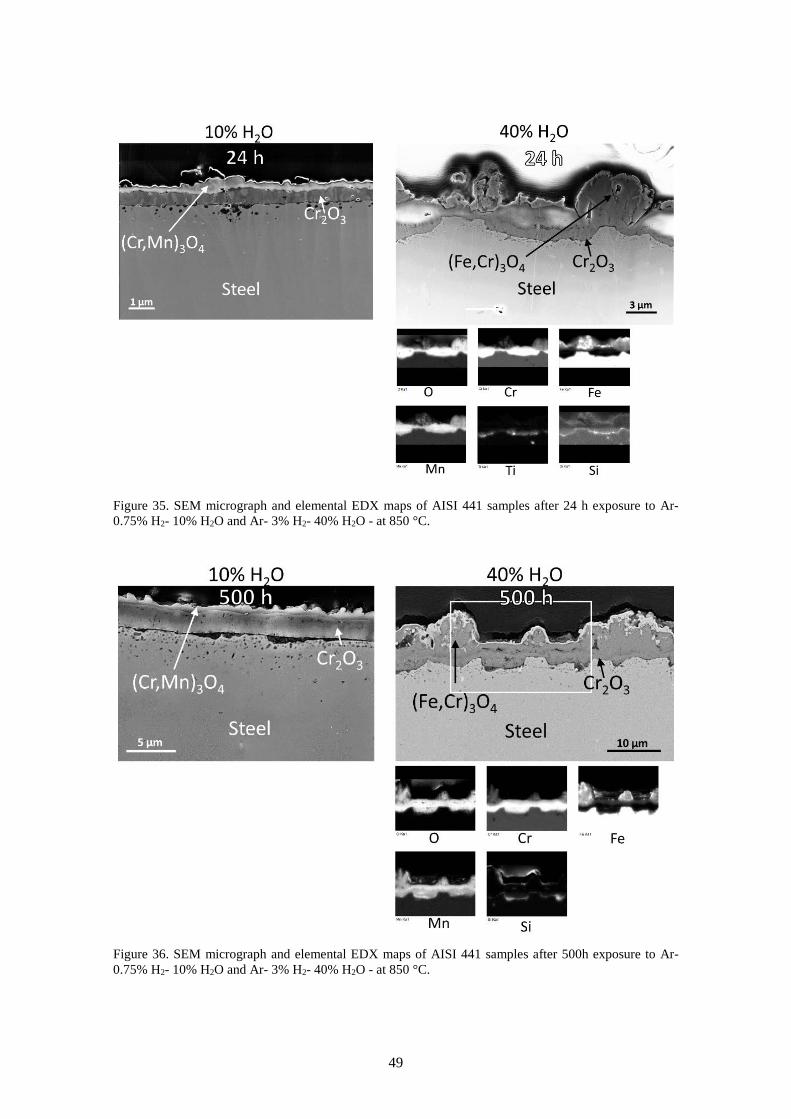
49
Figure 35. SEM micrograph and elemental EDX maps of AISI 441 samples after 24 h exposure to Ar- 0.75% H2- 10% H2O and Ar- 3% H2- 40% H2O - at 850 °C.
Figure 36. SEM micrograph and elemental EDX maps of AISI 441 samples after 500h exposure to Ar- 0.75% H2- 10% H2O and Ar- 3% H2- 40% H2O - at 850 °C.
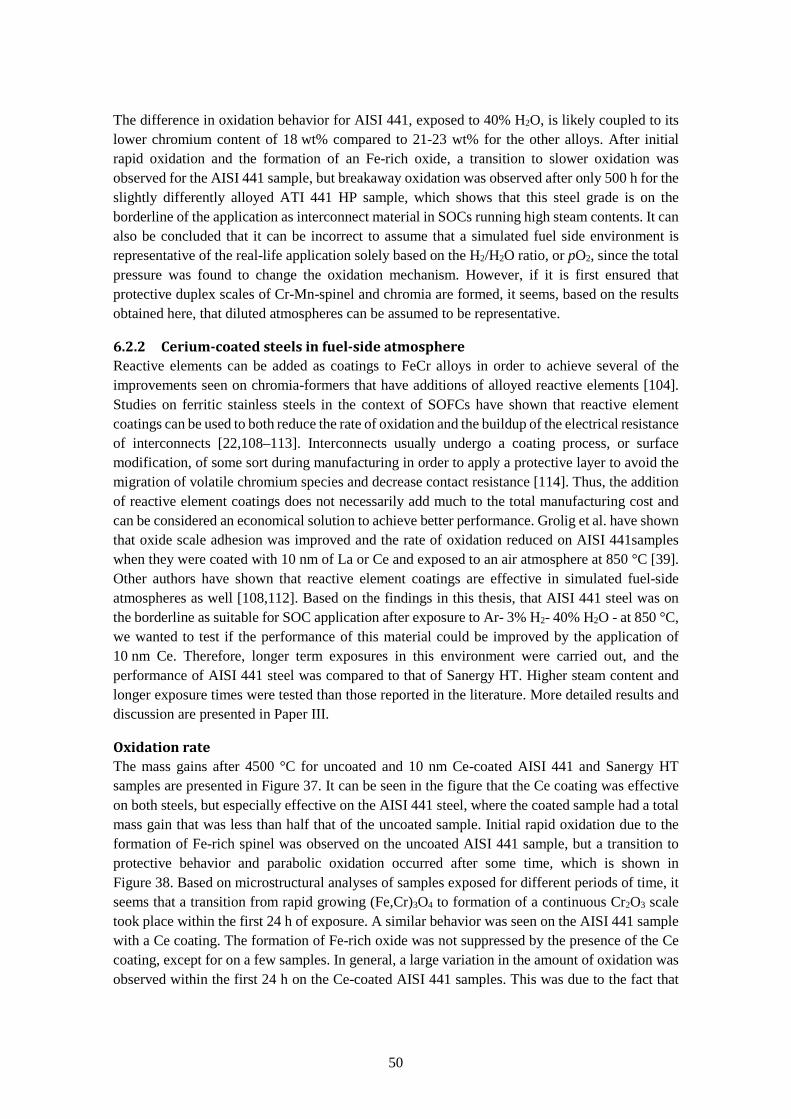
50
The difference in oxidation behavior for AISI 441, exposed to 40% H2O, is likely coupled to its lower chromium content of 18 wt% compared to 21-23 wt% for the other alloys. After initial rapid oxidation and the formation of an Fe-rich oxide, a transition to slower oxidation was observed for the AISI 441 sample, but breakaway oxidation was observed after only 500 h for the slightly differently alloyed ATI 441 HP sample, which shows that this steel grade is on the borderline of the application as interconnect material in SOCs running high steam contents. It can also be concluded that it can be incorrect to assume that a simulated fuel side environment is representative of the real-life application solely based on the H2/H2O ratio, or pO2, since the total pressure was found to change the oxidation mechanism. However, if it is first ensured that protective duplex scales of Cr-Mn-spinel and chromia are formed, it seems, based on the results obtained here, that diluted atmospheres can be assumed to be representative.
6.2.2 Cerium-coated steels in fuel-side atmosphere Reactive elements can be added as coatings to FeCr alloys in order to achieve several of the improvements seen on chromia-formers that have additions of alloyed reactive elements [104]. Studies on ferritic stainless steels in the context of SOFCs have shown that reactive element coatings can be used to both reduce the rate of oxidation and the buildup of the electrical resistance of interconnects [22,108–113]. Interconnects usually undergo a coating process, or surface modification, of some sort during manufacturing in order to apply a protective layer to avoid the migration of volatile chromium species and decrease contact resistance [114]. Thus, the addition of reactive element coatings does not necessarily add much to the total manufacturing cost and can be considered an economical solution to achieve better performance. Grolig et al. have shown that oxide scale adhesion was improved and the rate of oxidation reduced on AISI 441samples when they were coated with 10 nm of La or Ce and exposed to an air atmosphere at 850 °C [39]. Other authors have shown that reactive element coatings are effective in simulated fuel-side atmospheres as well [108,112]. Based on the findings in this thesis, that AISI 441 steel was on the borderline as suitable for SOC application after exposure to Ar- 3% H2- 40% H2O - at 850 °C, we wanted to test if the performance of this material could be improved by the application of 10 nm Ce. Therefore, longer term exposures in this environment were carried out, and the performance of AISI 441 steel was compared to that of Sanergy HT. Higher steam content and longer exposure times were tested than those reported in the literature. More detailed results and discussion are presented in Paper III.
Oxidation rate The mass gains after 4500 °C for uncoated and 10 nm Ce-coated AISI 441 and Sanergy HT samples are presented in Figure 37. It can be seen in the figure that the Ce coating was effective on both steels, but especially effective on the AISI 441 steel, where the coated sample had a total mass gain that was less than half that of the uncoated sample. Initial rapid oxidation due to the formation of Fe-rich spinel was observed on the uncoated AISI 441 sample, but a transition to protective behavior and parabolic oxidation occurred after some time, which is shown in Figure 38. Based on microstructural analyses of samples exposed for different periods of time, it seems that a transition from rapid growing (Fe,Cr)3O4 to formation of a continuous Cr2O3 scale took place within the first 24 h of exposure. A similar behavior was seen on the AISI 441 sample with a Ce coating. The formation of Fe-rich oxide was not suppressed by the presence of the Ce coating, except for on a few samples. In general, a large variation in the amount of oxidation was observed within the first 24 h on the Ce-coated AISI 441 samples. This was due to the fact that
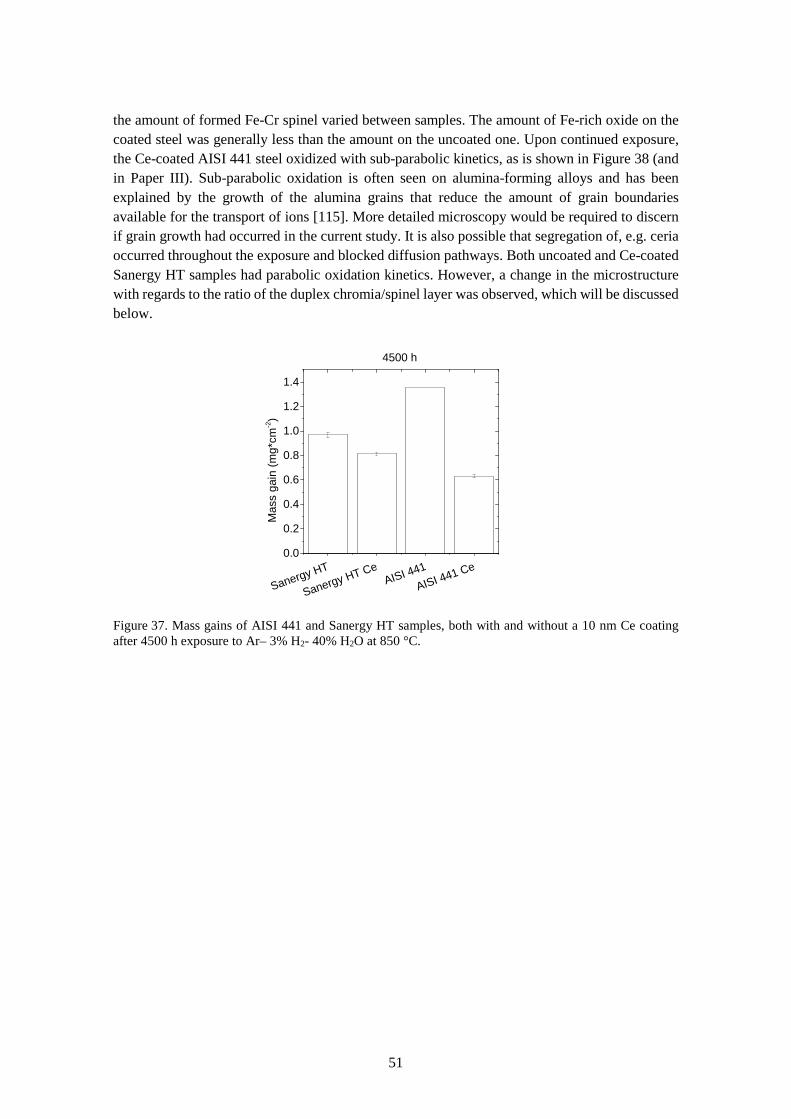
51
the amount of formed Fe-Cr spinel varied between samples. The amount of Fe-rich oxide on the coated steel was generally less than the amount on the uncoated one. Upon continued exposure, the Ce-coated AISI 441 steel oxidized with sub-parabolic kinetics, as is shown in Figure 38 (and in Paper III). Sub-parabolic oxidation is often seen on alumina-forming alloys and has been explained by the growth of the alumina grains that reduce the amount of grain boundaries available for the transport of ions [115]. More detailed microscopy would be required to discern if grain growth had occurred in the current study. It is also possible that segregation of, e.g. ceria occurred throughout the exposure and blocked diffusion pathways. Both uncoated and Ce-coated Sanergy HT samples had parabolic oxidation kinetics. However, a change in the microstructure with regards to the ratio of the duplex chromia/spinel layer was observed, which will be discussed below.
Sanergy HT
Sanergy HT CeAISI 441
AISI 441 Ce0.0
0.2
0.4
0.6
0.8
1.0
1.2
1.4
Mas
s ga
in (m
g*cm
-2)
4500 h
Figure 37. Mass gains of AISI 441 and Sanergy HT samples, both with and without a 10 nm Ce coating after 4500 h exposure to Ar– 3% H2- 40% H2O at 850 °C.
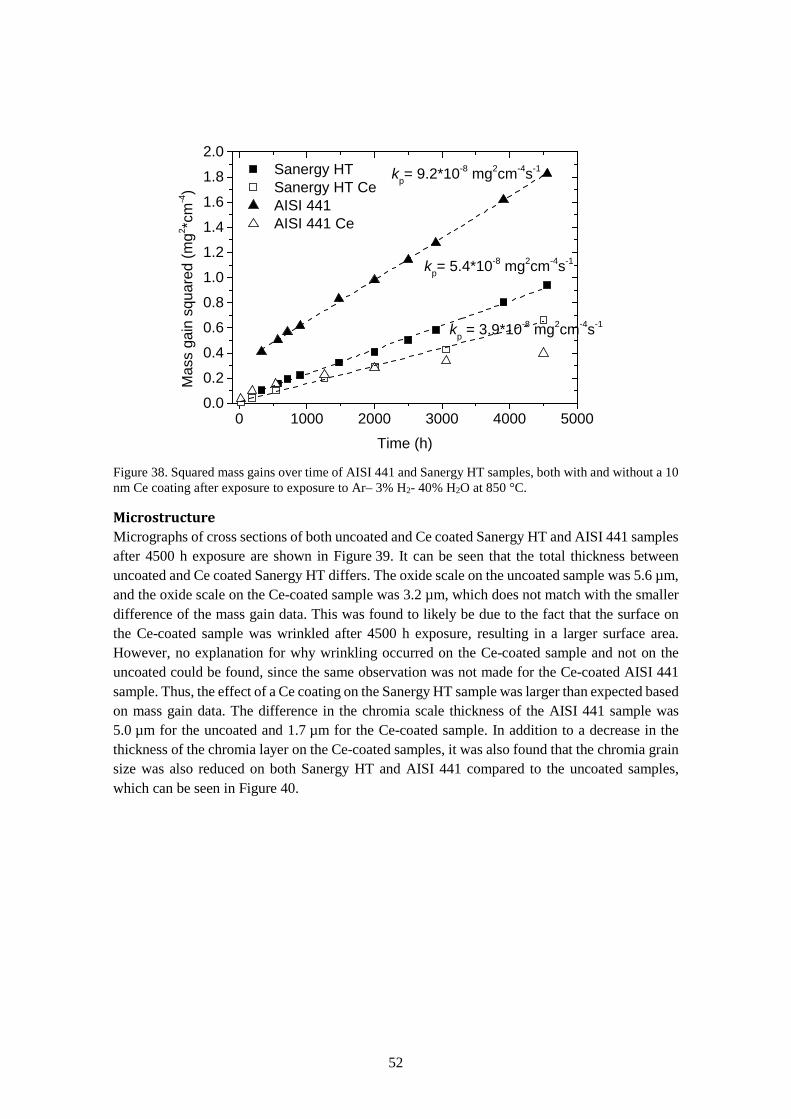
52
0 1000 2000 3000 4000 50000.0
0.2
0.4
0.6
0.8
1.0
1.2
1.4
1.6
1.8
2.0
kp = 3.9*10-8 mg2cm-4s-1
Sanergy HT Sanergy HT Ce AISI 441 AISI 441 Ce
Mas
s ga
in s
quar
ed (m
g2 *cm
-4)
Time (h)
kp= 9.2*10-8 mg2cm-4s-1
kp= 5.4*10-8 mg2cm-4s-1
Figure 38. Squared mass gains over time of AISI 441 and Sanergy HT samples, both with and without a 10 nm Ce coating after exposure to exposure to Ar– 3% H2- 40% H2O at 850 °C.
Microstructure Micrographs of cross sections of both uncoated and Ce coated Sanergy HT and AISI 441 samples after 4500 h exposure are shown in Figure 39. It can be seen that the total thickness between uncoated and Ce coated Sanergy HT differs. The oxide scale on the uncoated sample was 5.6 µm, and the oxide scale on the Ce-coated sample was 3.2 µm, which does not match with the smaller difference of the mass gain data. This was found to likely be due to the fact that the surface on the Ce-coated sample was wrinkled after 4500 h exposure, resulting in a larger surface area. However, no explanation for why wrinkling occurred on the Ce-coated sample and not on the uncoated could be found, since the same observation was not made for the Ce-coated AISI 441 sample. Thus, the effect of a Ce coating on the Sanergy HT sample was larger than expected based on mass gain data. The difference in the chromia scale thickness of the AISI 441 sample was 5.0 µm for the uncoated and 1.7 µm for the Ce-coated sample. In addition to a decrease in the thickness of the chromia layer on the Ce-coated samples, it was also found that the chromia grain size was also reduced on both Sanergy HT and AISI 441 compared to the uncoated samples, which can be seen in Figure 40.
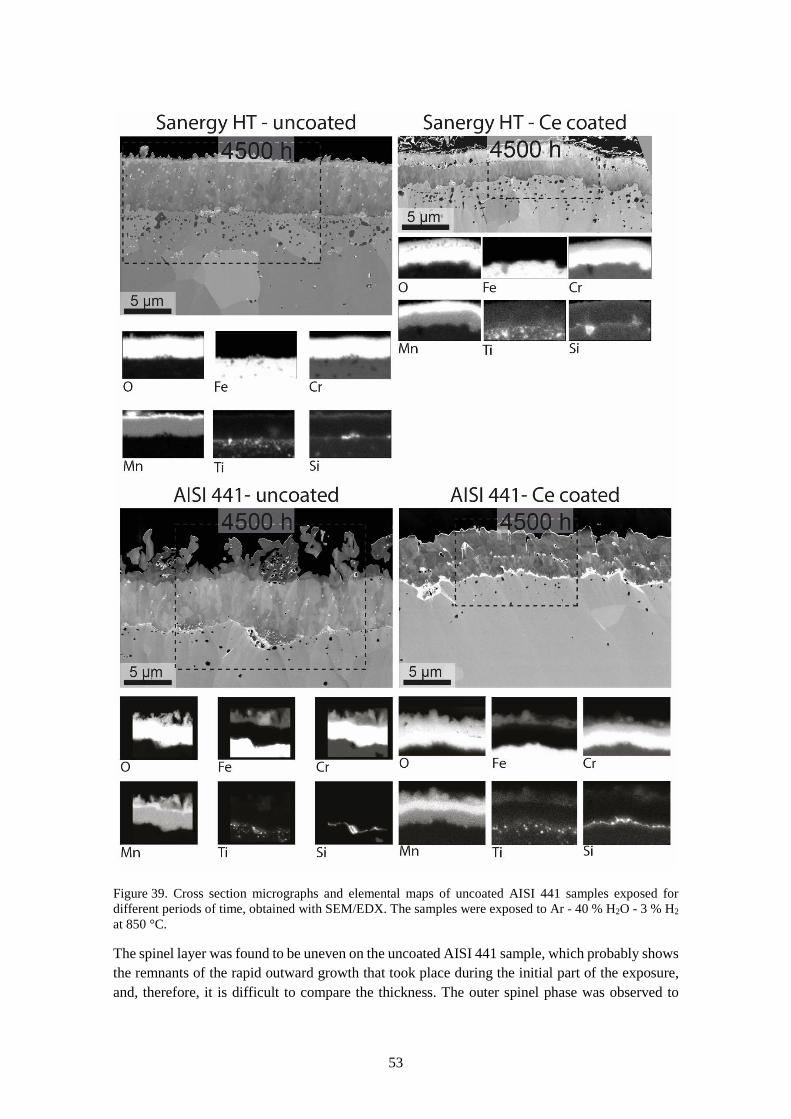
53
Figure 39. Cross section micrographs and elemental maps of uncoated AISI 441 samples exposed for different periods of time, obtained with SEM/EDX. The samples were exposed to Ar - 40 % H2O - 3 % H2 at 850 °C.
The spinel layer was found to be uneven on the uncoated AISI 441 sample, which probably shows the remnants of the rapid outward growth that took place during the initial part of the exposure, and, therefore, it is difficult to compare the thickness. The outer spinel phase was observed to
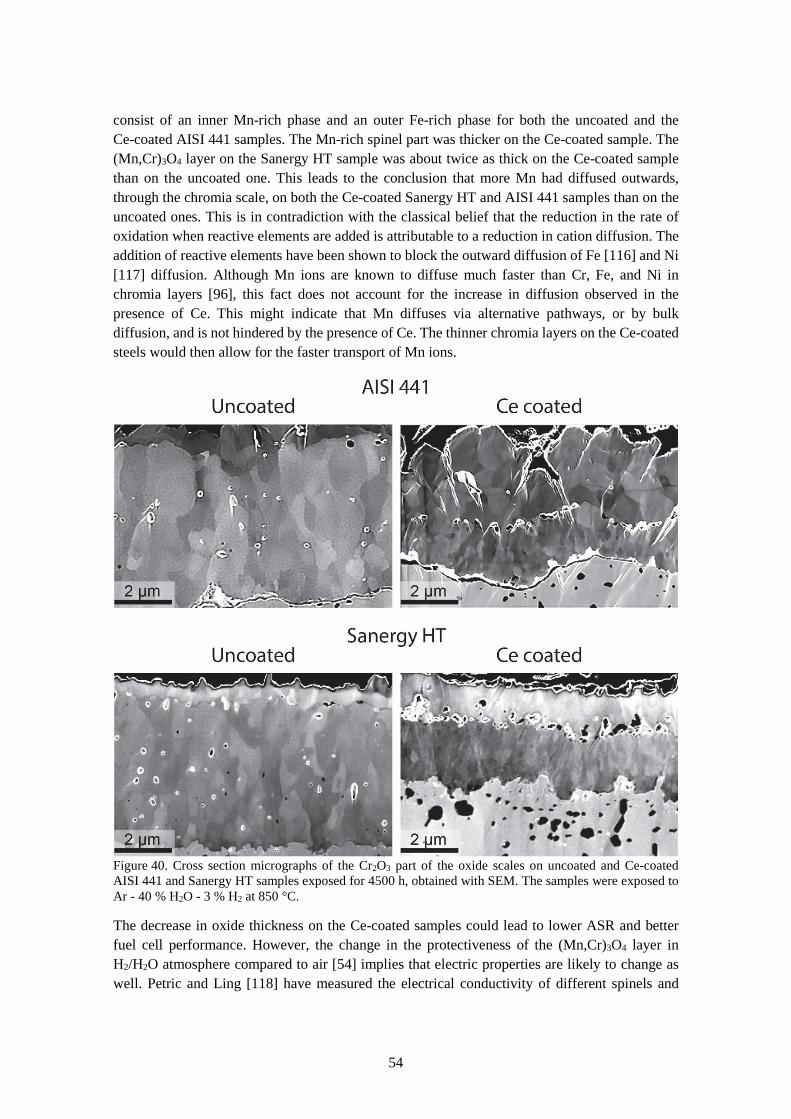
54
consist of an inner Mn-rich phase and an outer Fe-rich phase for both the uncoated and the Ce-coated AISI 441 samples. The Mn-rich spinel part was thicker on the Ce-coated sample. The (Mn,Cr)3O4 layer on the Sanergy HT sample was about twice as thick on the Ce-coated sample than on the uncoated one. This leads to the conclusion that more Mn had diffused outwards, through the chromia scale, on both the Ce-coated Sanergy HT and AISI 441 samples than on the uncoated ones. This is in contradiction with the classical belief that the reduction in the rate of oxidation when reactive elements are added is attributable to a reduction in cation diffusion. The addition of reactive elements have been shown to block the outward diffusion of Fe [116] and Ni [117] diffusion. Although Mn ions are known to diffuse much faster than Cr, Fe, and Ni in chromia layers [96], this fact does not account for the increase in diffusion observed in the presence of Ce. This might indicate that Mn diffuses via alternative pathways, or by bulk diffusion, and is not hindered by the presence of Ce. The thinner chromia layers on the Ce-coated steels would then allow for the faster transport of Mn ions.
Figure 40. Cross section micrographs of the Cr2O3 part of the oxide scales on uncoated and Ce-coated AISI 441 and Sanergy HT samples exposed for 4500 h, obtained with SEM. The samples were exposed to Ar - 40 % H2O - 3 % H2 at 850 °C.
The decrease in oxide thickness on the Ce-coated samples could lead to lower ASR and better fuel cell performance. However, the change in the protectiveness of the (Mn,Cr)3O4 layer in H2/H2O atmosphere compared to air [54] implies that electric properties are likely to change as well. Petric and Ling [118] have measured the electrical conductivity of different spinels and
55
reported a five-fold decrease in the conductivity of Mn1.2Cr1.8O4 compared to Mn3O4 at 800 °C in air atmosphere, which is lower than what has been reported for chromia at the same temperature [119]. The low pO2 in fuel-side atmospheres likely causes the spinel to be richer in chromium [120]. The benefits of a Ce coating for the electrical conductivity of an interconnect in the fuel side environment are, therefore, not obvious and must be measured before an overall evaluation of the performance of the Ce-coated samples can be done. Furthermore, since the formation of Fe-rich oxide was observed on the Ce-coated AISI 441 steel, it can be suggested that a change towards protective chromia formation does not occur if the environment is different from the one discussed herein and, consequently, would not be suitable for an SOC that operates in an environment with high steam content. Hou and Stringer [104] have discussed the difference between surface- applied and alloyed reactive elements and concluded that the promotion of chromia formation was only achieved in the presence of alloyed reactive elements.
6.3 Dual atmosphere corrosion The interconnects in SOCs are exposed to air on one side and to humid hydrogen on the other side. This will hereinafter be referred to as “dual atmosphere.” Previous studies on dual atmosphere have mostly been carried out at a temperature of 800 °C, or above, for relatively short times of up to 300 h. The development of SOCs has led to lower operating temperatures. So called intermediate temperature solid oxide fuel cells (IT-SOFC) are usually based on CGO electrolytes and can maintain good ionic conductivity down to 500 °C [121]. Therefore, experiments in a dual atmosphere setup were carried out at 600, 700, and 800 °C for up to 3000 h in order to study the influence of temperature. This was referenced against samples that had been exposed to humid air on both sides in the same sample holder (which will be referred to as “single atmosphere”) to rule out any effects of the setup itself. A high flow rate was used on the air side, which is also expected over an SOFC interconnect. This was expected to cause significant chromium volatilization [122]. Furthermore, the samples were pre-oxidized at 800 °C in order to mimic the conditioning step in stack manufacturing. This led to the formation of protective oxide scales with thicknesses of 100-200 nm calculated from mass gains.
6.3.1 Temperature effect The effect of the exposure temperature was investigated in Paper V, which contains more detailed results and discussion. Figure 41 shows the air sides after 1000 h exposure to single and dual atmosphere at 600, 700 and 800 °C. At 700 and 800 °C there was no apparent difference between the oxides formed on the air sides on single or dual atmosphere-exposed samples. On the other hand, at 600 °C the oxides formed in single atmosphere were thin and protective whereas in dual atmosphere, regions of thick iron-rich oxide had formed on the air side of all samples. Next to the thicker oxide regions, the oxide was still thin and after detailed investigation of cross sections no microstructural differences were found between these thin oxides and the thin oxides on the single atmosphere samples. The protective oxides were found to comprise of duplex scales of inner Cr2O3 and outer (Mn,Cr)3O4 at all temperatures.
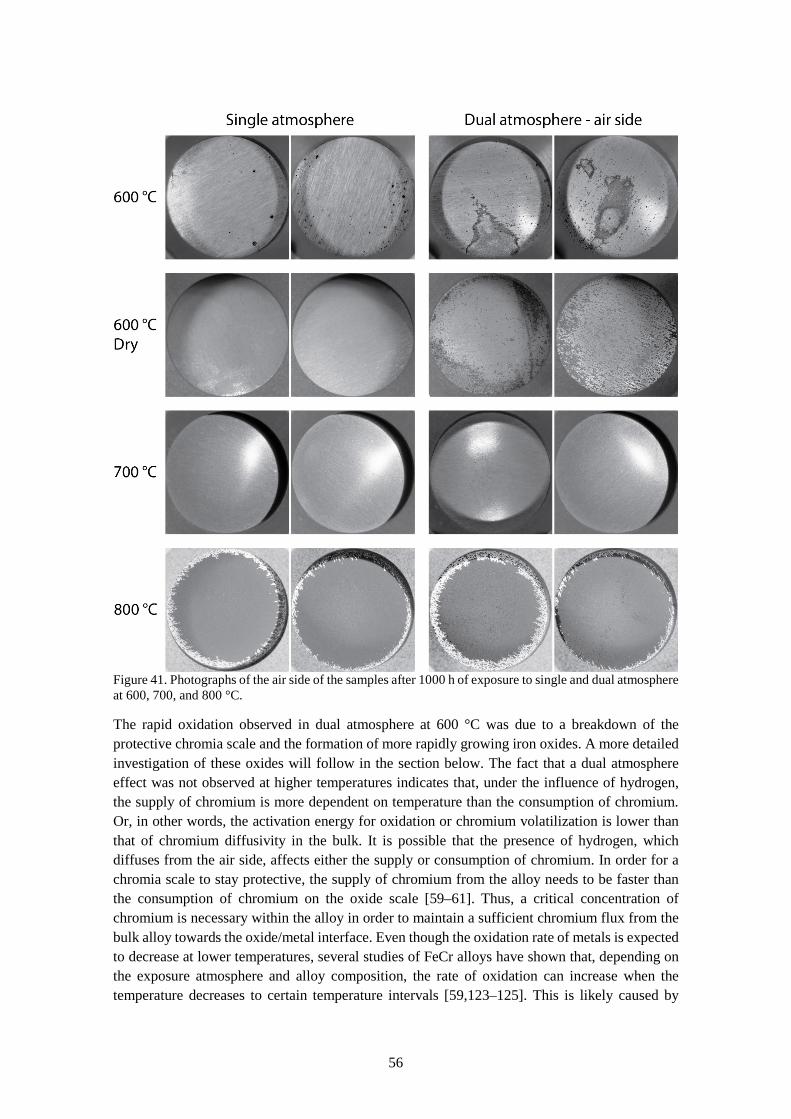
56
Figure 41. Photographs of the air side of the samples after 1000 h of exposure to single and dual atmosphere at 600, 700, and 800 °C.
The rapid oxidation observed in dual atmosphere at 600 °C was due to a breakdown of the protective chromia scale and the formation of more rapidly growing iron oxides. A more detailed investigation of these oxides will follow in the section below. The fact that a dual atmosphere effect was not observed at higher temperatures indicates that, under the influence of hydrogen, the supply of chromium is more dependent on temperature than the consumption of chromium. Or, in other words, the activation energy for oxidation or chromium volatilization is lower than that of chromium diffusivity in the bulk. It is possible that the presence of hydrogen, which diffuses from the air side, affects either the supply or consumption of chromium. In order for a chromia scale to stay protective, the supply of chromium from the alloy needs to be faster than the consumption of chromium on the oxide scale [59–61]. Thus, a critical concentration of chromium is necessary within the alloy in order to maintain a sufficient chromium flux from the bulk alloy towards the oxide/metal interface. Even though the oxidation rate of metals is expected to decrease at lower temperatures, several studies of FeCr alloys have shown that, depending on the exposure atmosphere and alloy composition, the rate of oxidation can increase when the temperature decreases to certain temperature intervals [59,123–125]. This is likely caused by
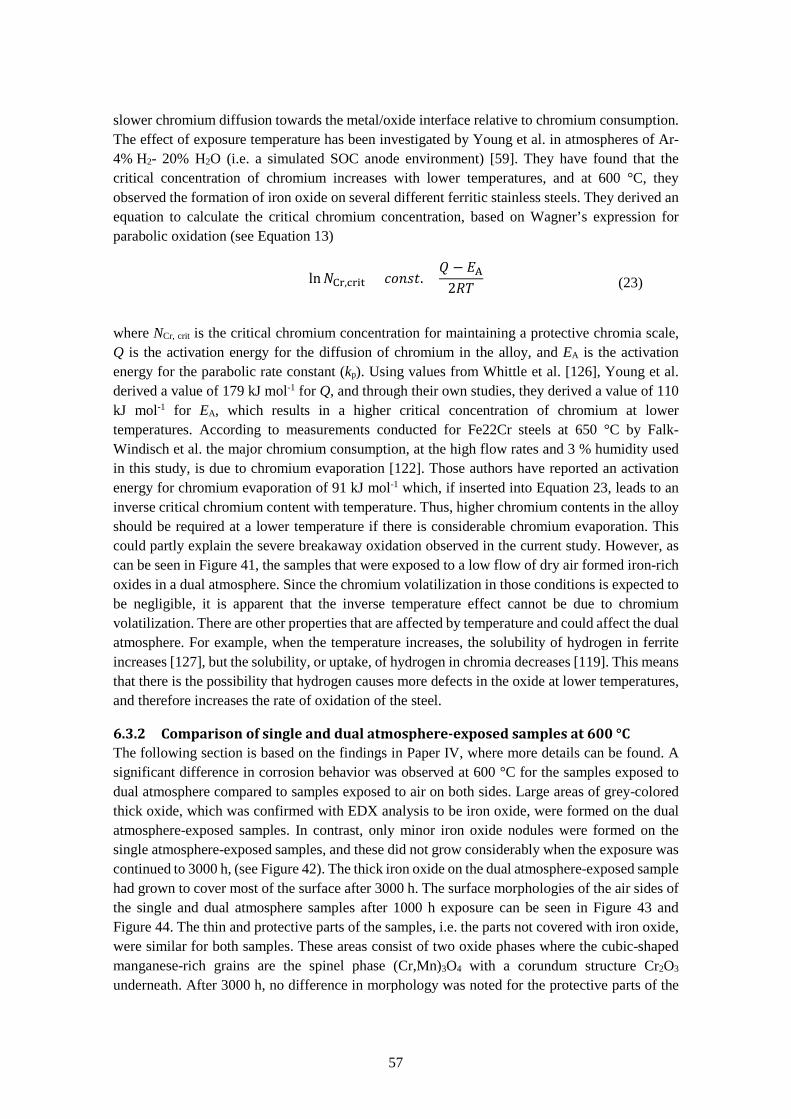
57
slower chromium diffusion towards the metal/oxide interface relative to chromium consumption. The effect of exposure temperature has been investigated by Young et al. in atmospheres of Ar- 4% H2- 20% H2O (i.e. a simulated SOC anode environment) [59]. They have found that the critical concentration of chromium increases with lower temperatures, and at 600 °C, they observed the formation of iron oxide on several different ferritic stainless steels. They derived an equation to calculate the critical chromium concentration, based on Wagner’s expression for parabolic oxidation (see Equation 13)
ln𝑁𝑁Cr,crit = 𝑐𝑐𝑐𝑐𝑅𝑅𝑠𝑠𝑡𝑡. +𝑄𝑄 − 𝐸𝐸A
2𝑅𝑅𝑇𝑇 (23)
where NCr, crit is the critical chromium concentration for maintaining a protective chromia scale, Q is the activation energy for the diffusion of chromium in the alloy, and EA is the activation energy for the parabolic rate constant (kp). Using values from Whittle et al. [126], Young et al. derived a value of 179 kJ mol-1 for Q, and through their own studies, they derived a value of 110 kJ mol-1 for EA, which results in a higher critical concentration of chromium at lower temperatures. According to measurements conducted for Fe22Cr steels at 650 °C by Falk-Windisch et al. the major chromium consumption, at the high flow rates and 3 % humidity used in this study, is due to chromium evaporation [122]. Those authors have reported an activation energy for chromium evaporation of 91 kJ mol-1 which, if inserted into Equation 23, leads to an inverse critical chromium content with temperature. Thus, higher chromium contents in the alloy should be required at a lower temperature if there is considerable chromium evaporation. This could partly explain the severe breakaway oxidation observed in the current study. However, as can be seen in Figure 41, the samples that were exposed to a low flow of dry air formed iron-rich oxides in a dual atmosphere. Since the chromium volatilization in those conditions is expected to be negligible, it is apparent that the inverse temperature effect cannot be due to chromium volatilization. There are other properties that are affected by temperature and could affect the dual atmosphere. For example, when the temperature increases, the solubility of hydrogen in ferrite increases [127], but the solubility, or uptake, of hydrogen in chromia decreases [119]. This means that there is the possibility that hydrogen causes more defects in the oxide at lower temperatures, and therefore increases the rate of oxidation of the steel.
6.3.2 Comparison of single and dual atmosphere-exposed samples at 600 °C The following section is based on the findings in Paper IV, where more details can be found. A significant difference in corrosion behavior was observed at 600 °C for the samples exposed to dual atmosphere compared to samples exposed to air on both sides. Large areas of grey-colored thick oxide, which was confirmed with EDX analysis to be iron oxide, were formed on the dual atmosphere-exposed samples. In contrast, only minor iron oxide nodules were formed on the single atmosphere-exposed samples, and these did not grow considerably when the exposure was continued to 3000 h, (see Figure 42). The thick iron oxide on the dual atmosphere-exposed sample had grown to cover most of the surface after 3000 h. The surface morphologies of the air sides of the single and dual atmosphere samples after 1000 h exposure can be seen in Figure 43 and Figure 44. The thin and protective parts of the samples, i.e. the parts not covered with iron oxide, were similar for both samples. These areas consist of two oxide phases where the cubic-shaped manganese-rich grains are the spinel phase (Cr,Mn)3O4 with a corundum structure Cr2O3 underneath. After 3000 h, no difference in morphology was noted for the protective parts of the
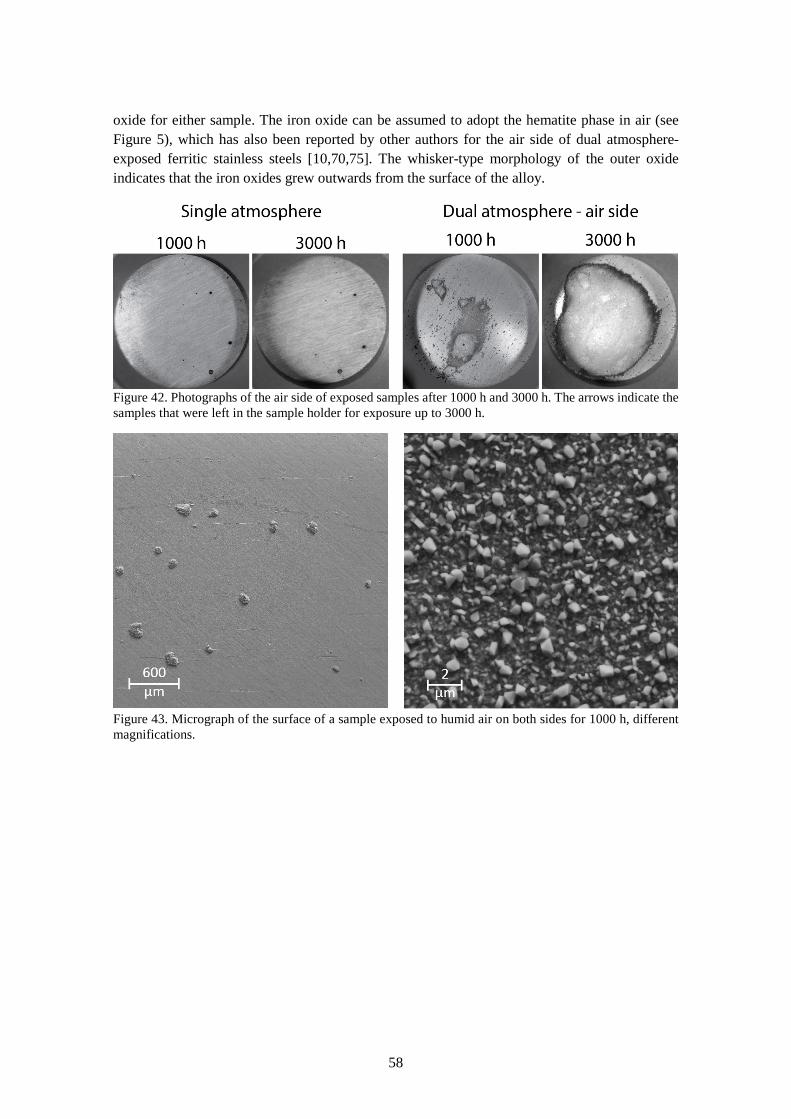
58
oxide for either sample. The iron oxide can be assumed to adopt the hematite phase in air (see Figure 5), which has also been reported by other authors for the air side of dual atmosphere-exposed ferritic stainless steels [10,70,75]. The whisker-type morphology of the outer oxide indicates that the iron oxides grew outwards from the surface of the alloy.
Figure 42. Photographs of the air side of exposed samples after 1000 h and 3000 h. The arrows indicate the samples that were left in the sample holder for exposure up to 3000 h.
Figure 43. Micrograph of the surface of a sample exposed to humid air on both sides for 1000 h, different magnifications.
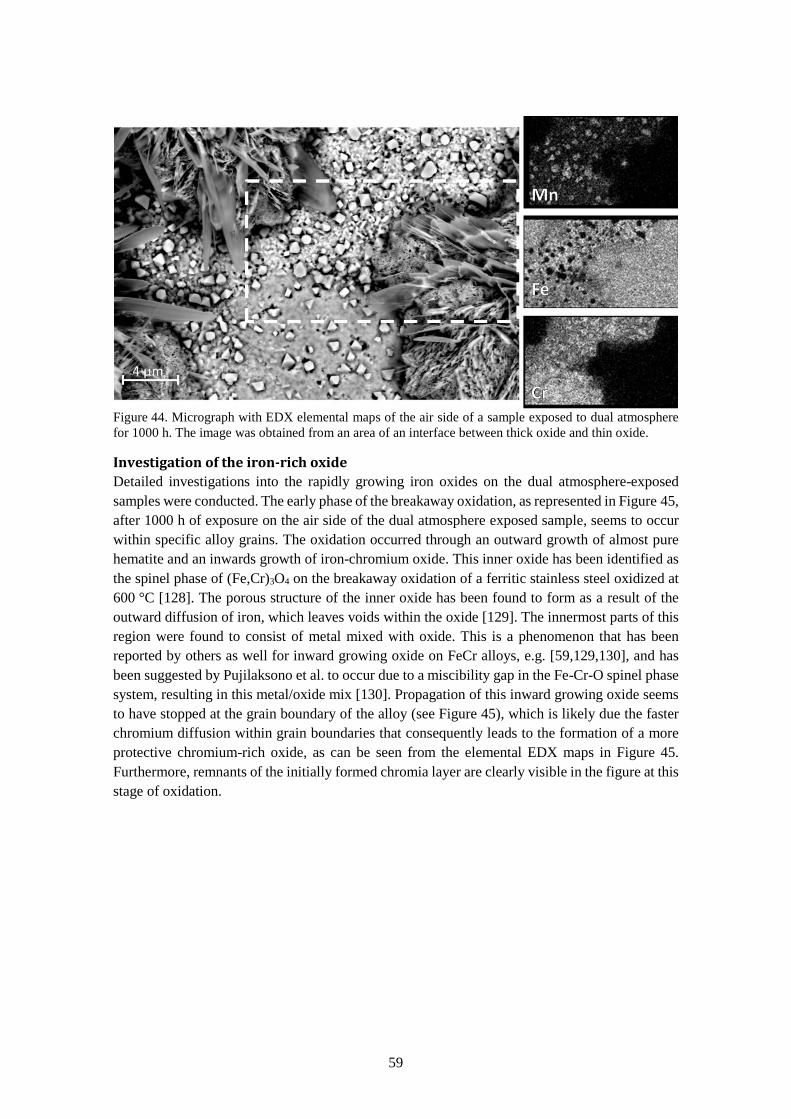
59
Figure 44. Micrograph with EDX elemental maps of the air side of a sample exposed to dual atmosphere for 1000 h. The image was obtained from an area of an interface between thick oxide and thin oxide.
Investigation of the iron-rich oxide Detailed investigations into the rapidly growing iron oxides on the dual atmosphere-exposed samples were conducted. The early phase of the breakaway oxidation, as represented in Figure 45, after 1000 h of exposure on the air side of the dual atmosphere exposed sample, seems to occur within specific alloy grains. The oxidation occurred through an outward growth of almost pure hematite and an inwards growth of iron-chromium oxide. This inner oxide has been identified as the spinel phase of (Fe,Cr)3O4 on the breakaway oxidation of a ferritic stainless steel oxidized at 600 °C [128]. The porous structure of the inner oxide has been found to form as a result of the outward diffusion of iron, which leaves voids within the oxide [129]. The innermost parts of this region were found to consist of metal mixed with oxide. This is a phenomenon that has been reported by others as well for inward growing oxide on FeCr alloys, e.g. [59,129,130], and has been suggested by Pujilaksono et al. to occur due to a miscibility gap in the Fe-Cr-O spinel phase system, resulting in this metal/oxide mix [130]. Propagation of this inward growing oxide seems to have stopped at the grain boundary of the alloy (see Figure 45), which is likely due the faster chromium diffusion within grain boundaries that consequently leads to the formation of a more protective chromium-rich oxide, as can be seen from the elemental EDX maps in Figure 45. Furthermore, remnants of the initially formed chromia layer are clearly visible in the figure at this stage of oxidation.
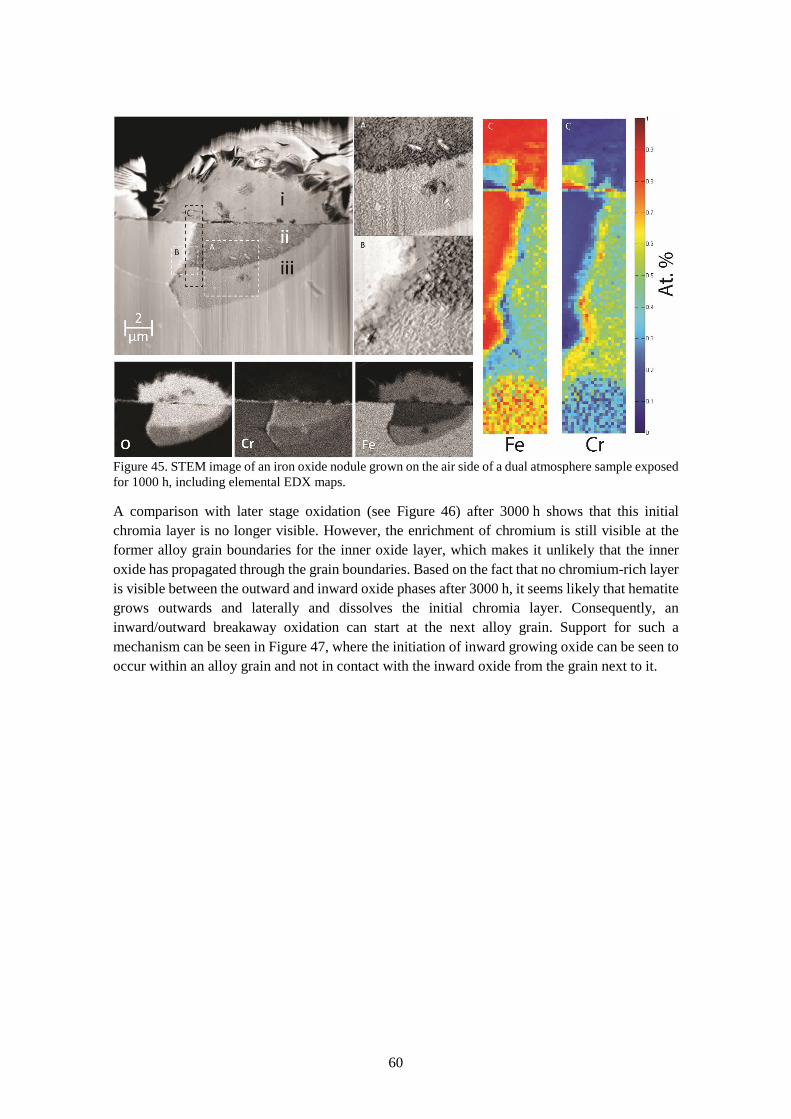
60
Figure 45. STEM image of an iron oxide nodule grown on the air side of a dual atmosphere sample exposed for 1000 h, including elemental EDX maps.
A comparison with later stage oxidation (see Figure 46) after 3000 h shows that this initial chromia layer is no longer visible. However, the enrichment of chromium is still visible at the former alloy grain boundaries for the inner oxide layer, which makes it unlikely that the inner oxide has propagated through the grain boundaries. Based on the fact that no chromium-rich layer is visible between the outward and inward oxide phases after 3000 h, it seems likely that hematite grows outwards and laterally and dissolves the initial chromia layer. Consequently, an inward/outward breakaway oxidation can start at the next alloy grain. Support for such a mechanism can be seen in Figure 47, where the initiation of inward growing oxide can be seen to occur within an alloy grain and not in contact with the inward oxide from the grain next to it.
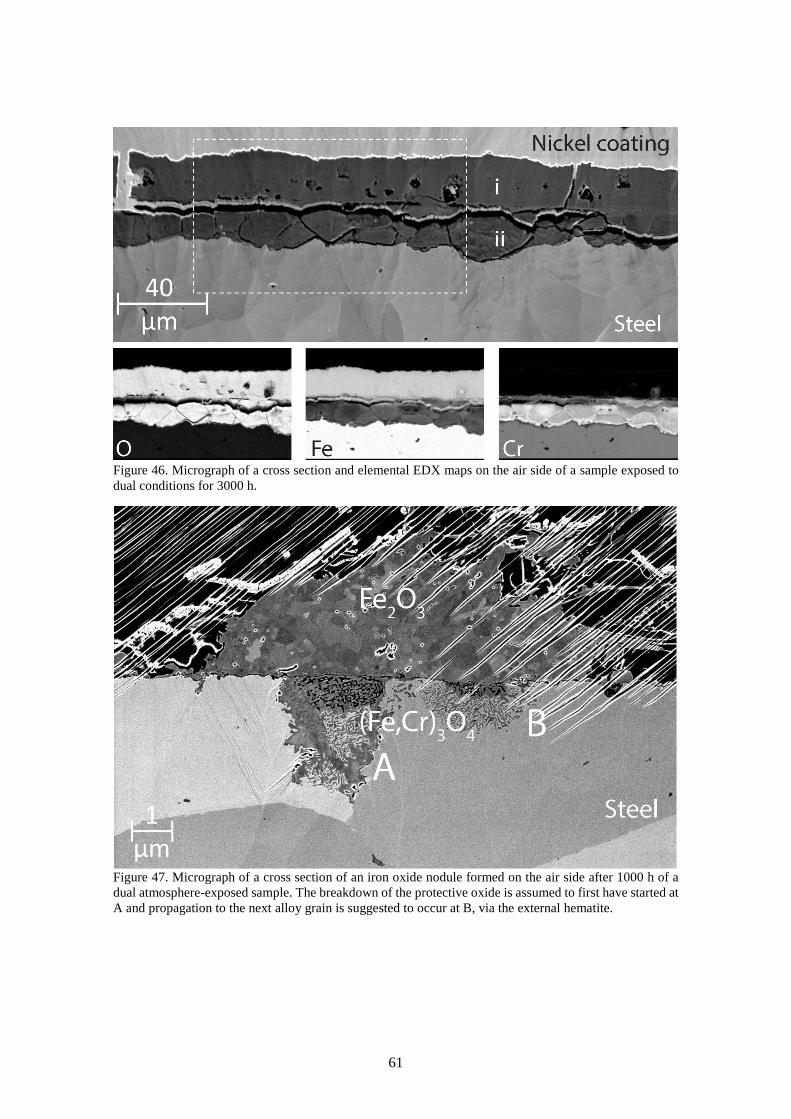
61
Figure 46. Micrograph of a cross section and elemental EDX maps on the air side of a sample exposed to dual conditions for 3000 h.
Figure 47. Micrograph of a cross section of an iron oxide nodule formed on the air side after 1000 h of a dual atmosphere-exposed sample. The breakdown of the protective oxide is assumed to first have started at A and propagation to the next alloy grain is suggested to occur at B, via the external hematite.
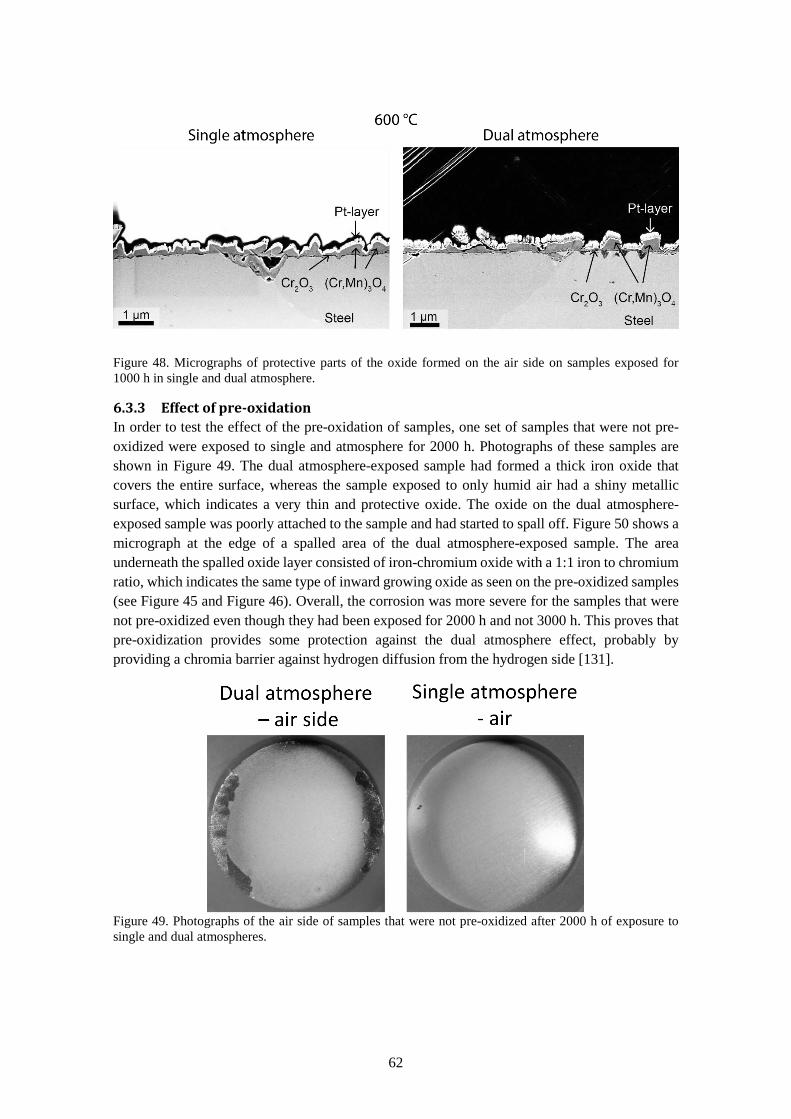
62
Figure 48. Micrographs of protective parts of the oxide formed on the air side on samples exposed for 1000 h in single and dual atmosphere.
6.3.3 Effect of pre-oxidation In order to test the effect of the pre-oxidation of samples, one set of samples that were not pre-oxidized were exposed to single and atmosphere for 2000 h. Photographs of these samples are shown in Figure 49. The dual atmosphere-exposed sample had formed a thick iron oxide that covers the entire surface, whereas the sample exposed to only humid air had a shiny metallic surface, which indicates a very thin and protective oxide. The oxide on the dual atmosphere-exposed sample was poorly attached to the sample and had started to spall off. Figure 50 shows a micrograph at the edge of a spalled area of the dual atmosphere-exposed sample. The area underneath the spalled oxide layer consisted of iron-chromium oxide with a 1:1 iron to chromium ratio, which indicates the same type of inward growing oxide as seen on the pre-oxidized samples (see Figure 45 and Figure 46). Overall, the corrosion was more severe for the samples that were not pre-oxidized even though they had been exposed for 2000 h and not 3000 h. This proves that pre-oxidization provides some protection against the dual atmosphere effect, probably by providing a chromia barrier against hydrogen diffusion from the hydrogen side [131].
Figure 49. Photographs of the air side of samples that were not pre-oxidized after 2000 h of exposure to single and dual atmospheres.
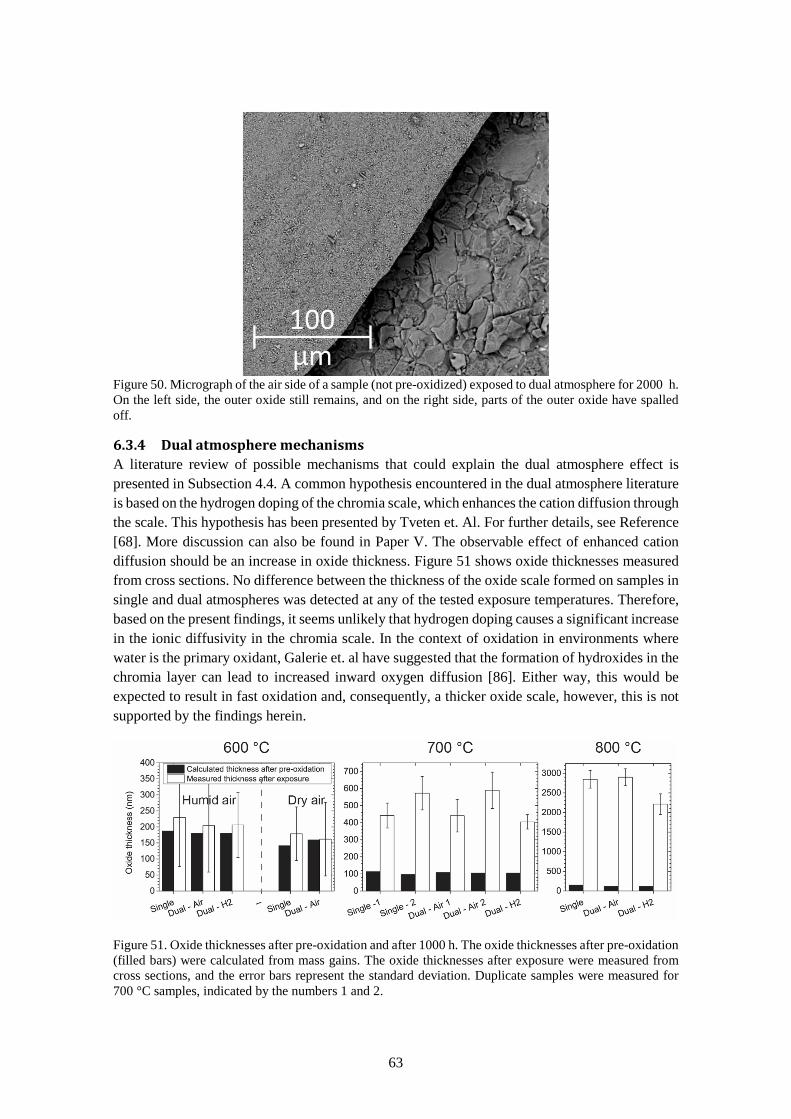
63
Figure 50. Micrograph of the air side of a sample (not pre-oxidized) exposed to dual atmosphere for 2000 h. On the left side, the outer oxide still remains, and on the right side, parts of the outer oxide have spalled off.
6.3.4 Dual atmosphere mechanisms A literature review of possible mechanisms that could explain the dual atmosphere effect is presented in Subsection 4.4. A common hypothesis encountered in the dual atmosphere literature is based on the hydrogen doping of the chromia scale, which enhances the cation diffusion through the scale. This hypothesis has been presented by Tveten et. Al. For further details, see Reference [68]. More discussion can also be found in Paper V. The observable effect of enhanced cation diffusion should be an increase in oxide thickness. Figure 51 shows oxide thicknesses measured from cross sections. No difference between the thickness of the oxide scale formed on samples in single and dual atmospheres was detected at any of the tested exposure temperatures. Therefore, based on the present findings, it seems unlikely that hydrogen doping causes a significant increase in the ionic diffusivity in the chromia scale. In the context of oxidation in environments where water is the primary oxidant, Galerie et. al have suggested that the formation of hydroxides in the chromia layer can lead to increased inward oxygen diffusion [86]. Either way, this would be expected to result in fast oxidation and, consequently, a thicker oxide scale, however, this is not supported by the findings herein.
Figure 51. Oxide thicknesses after pre-oxidation and after 1000 h. The oxide thicknesses after pre-oxidation (filled bars) were calculated from mass gains. The oxide thicknesses after exposure were measured from cross sections, and the error bars represent the standard deviation. Duplicate samples were measured for 700 °C samples, indicated by the numbers 1 and 2.
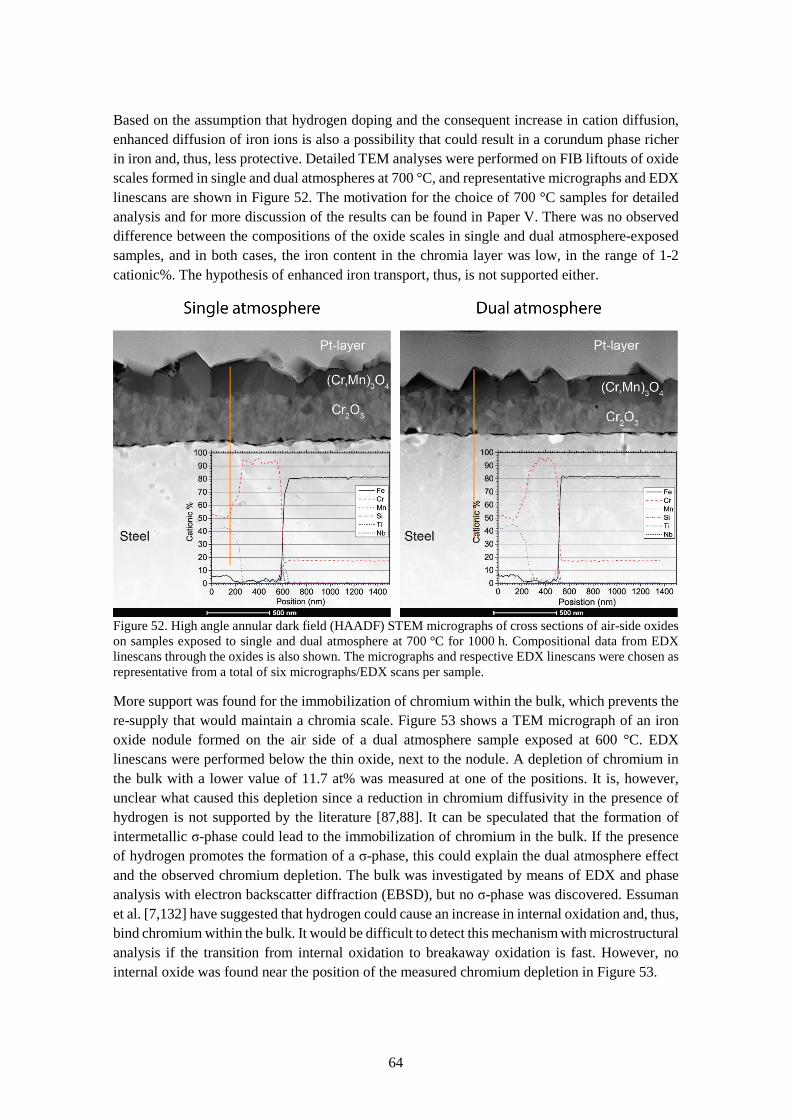
64
Based on the assumption that hydrogen doping and the consequent increase in cation diffusion, enhanced diffusion of iron ions is also a possibility that could result in a corundum phase richer in iron and, thus, less protective. Detailed TEM analyses were performed on FIB liftouts of oxide scales formed in single and dual atmospheres at 700 °C, and representative micrographs and EDX linescans are shown in Figure 52. The motivation for the choice of 700 °C samples for detailed analysis and for more discussion of the results can be found in Paper V. There was no observed difference between the compositions of the oxide scales in single and dual atmosphere-exposed samples, and in both cases, the iron content in the chromia layer was low, in the range of 1-2 cationic%. The hypothesis of enhanced iron transport, thus, is not supported either.
Figure 52. High angle annular dark field (HAADF) STEM micrographs of cross sections of air-side oxides on samples exposed to single and dual atmosphere at 700 °C for 1000 h. Compositional data from EDX linescans through the oxides is also shown. The micrographs and respective EDX linescans were chosen as representative from a total of six micrographs/EDX scans per sample.
More support was found for the immobilization of chromium within the bulk, which prevents the re-supply that would maintain a chromia scale. Figure 53 shows a TEM micrograph of an iron oxide nodule formed on the air side of a dual atmosphere sample exposed at 600 °C. EDX linescans were performed below the thin oxide, next to the nodule. A depletion of chromium in the bulk with a lower value of 11.7 at% was measured at one of the positions. It is, however, unclear what caused this depletion since a reduction in chromium diffusivity in the presence of hydrogen is not supported by the literature [87,88]. It can be speculated that the formation of intermetallic σ-phase could lead to the immobilization of chromium in the bulk. If the presence of hydrogen promotes the formation of a σ-phase, this could explain the dual atmosphere effect and the observed chromium depletion. The bulk was investigated by means of EDX and phase analysis with electron backscatter diffraction (EBSD), but no σ-phase was discovered. Essuman et al. [7,132] have suggested that hydrogen could cause an increase in internal oxidation and, thus, bind chromium within the bulk. It would be difficult to detect this mechanism with microstructural analysis if the transition from internal oxidation to breakaway oxidation is fast. However, no internal oxide was found near the position of the measured chromium depletion in Figure 53.
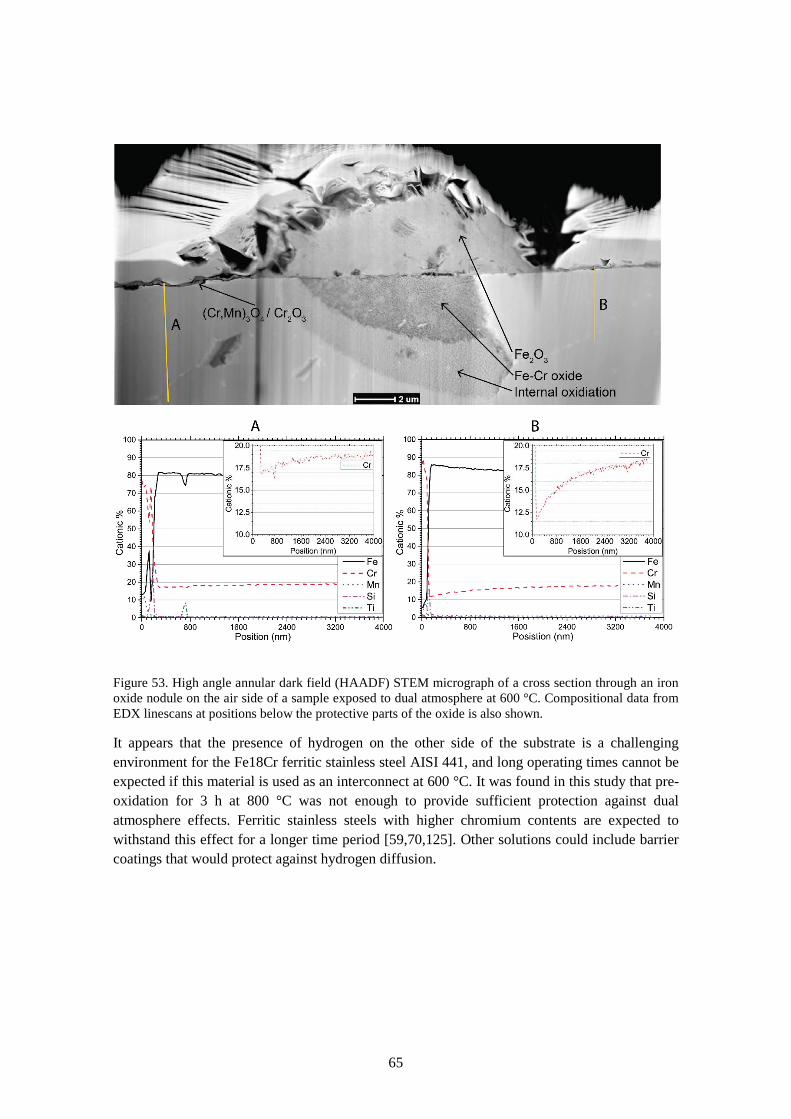
65
Figure 53. High angle annular dark field (HAADF) STEM micrograph of a cross section through an iron oxide nodule on the air side of a sample exposed to dual atmosphere at 600 °C. Compositional data from EDX linescans at positions below the protective parts of the oxide is also shown.
It appears that the presence of hydrogen on the other side of the substrate is a challenging environment for the Fe18Cr ferritic stainless steel AISI 441, and long operating times cannot be expected if this material is used as an interconnect at 600 °C. It was found in this study that pre-oxidation for 3 h at 800 °C was not enough to provide sufficient protection against dual atmosphere effects. Ferritic stainless steels with higher chromium contents are expected to withstand this effect for a longer time period [59,70,125]. Other solutions could include barrier coatings that would protect against hydrogen diffusion.

66
67
7 Conclusions The effect of several environmental parameters on the degradation of ferritic stainless steels was investigated. This was done in order to obtain greater understanding of potential material challenges, depending on how solid oxide fuel cells and electrolyzers are operated, and to obtain more input on where future material development should focus. The interconnects in an SOC stack experience extremely varying environments, ranging from pure oxygen or air to pure hydrogen or almost pure steam, and this leads to substantially different oxygen partial pressures. However, it was found that the isolated effect of changing oxygen partial pressure did not significantly influence the oxidation rate of any of the tested ferritic stainless steels. The greatest influence of varied oxygen pressure was observed on the oxide microstructure and oxide scale adhesion, where smaller grain size and more oxide spallation were observed at lower oxygen partial pressures. Chromium evaporation was found to be significantly lower in simulated SOEC atmospheres than in simulated SOFC atmospheres, but small amounts of water, e.g. from the leakage of hydrogen from the fuel side to the oxygen side, can accelerate the chromium evaporation rate significantly.
Exposure to hydrogen and water vapor was found to significantly change the mode of oxidation depending on the chromium content in the steel. Furthermore, the partial pressure of hydrogen and steam are important parameters and dilution with inert gases can lead to changes in the oxidation mechanism and to the wrong evaluation of the performance of a steel in simulated fuel side environment. Batch-to-batch variation of the AISI 441steel indicated that this steel grade is at the borderline for use in SOCs with high steam contents. Steels with higher chromium content instead showed better performance, with lower oxidation rate and better scale adhesion when they were exposed to simulated fuel side environment compared to when those steels were exposed to oxygen. A 10 nm cerium coating significantly reduced the oxidation rate and changed kinetics from parabolic to sub-parabolic. Furthermore, thinner chromia scales and thicker spinel scales formed on the cerium coated steels. This change in oxidation behavior is expected to give the steel significantly longer lifetime, since chromium depletion is reduced. However, the effects on electrical resistance need to be measured and evaluated.
AISI 441 steel was exposed to air on one side and hydrogen on the other at 600 °C, and a pronounced dual atmosphere effect was noted compared to when the steel was only exposed to air. Under dual atmosphere conditions, a thick, iron-rich, non-protective oxide was formed while the oxide scale under single conditions remained thin and protective. Thus, it is suggested that hydrogen diffusion through the steel substrate caused severe breakaway corrosion on the air side of the sample. At 700 and 800 °C protective chromia scales were observed regardless of exposure conditions. It is likely that the increased chromium diffusion in the steel at higher temperatures compensates for the negative effect of hydrogen on the protective scale on the air side. The findings do not support an increase in the growth rate of the chromia scale due to doping with hydrogen. Thus, a mechanism in which the supply of chromium towards the metal/oxide interface, such as internal oxidation, seems more likely. However, evidence for such a mechanism is difficult to find, since rapid break-away oxidation follows after the breakdown of the protective scale and “contaminates” the evidence. It is suggested that future research should focus on finding solutions to mitigate this dual atmosphere effect by increasing chromium diffusion by means of different alloy compositions or annealing, and/or decreasing hydrogen diffusion by applying barrier coatings.

68
The findings of this thesis illustrate that investigating the oxidation of stainless steels exposed to air is not sufficient to validate if a steel is suitable as interconnect material. The more complicated experiments conducted revealed changes in corrosion mechanisms with potential detrimental effects. Furthermore, it was found that steels can go from having good corrosion properties to rapid breakaway oxidation, caused by minor changes in environment. For example, operation at reduced temperatures such as for IT-SOFC, or at high water contents, can lead to accelerated corrosion if the interconnect steels are too poorly alloyed with chromium. To ensure long-term operation, it is important to choose materials for interconnects based on the intended mode of operation of the SOC stack.
69
8 References [1] J.A. Turner, Sustainable Hydrogen Production, Sci. New Ser. 305 (2004) 972–974. [2] T.D. Hall, H. McCrabb, J. Wu, H. Zhang, X. Liu, J. Taylor, Electrodeposition Of
CoMn Onto Stainless Steels Interconnects For Increased Lifetimes In SOFCs, in: SOLID OXIDE FUEL CELLS 12 (SOFC XII), ELECTROCHEMICAL SOCIETY INC, 65 S MAIN ST, PENNINGTON, NJ 08534-2839 USA, 2011: pp. 2489–2502. doi:10.1149/1.3570247.
[3] W.J. Quadakkers, J. Piron-Abellan, V. Shemet, L. Singheiser, Metallic interconnectors for solid oxide fuel cells – a review, Mater. High Temp. 20 (2003) 115–127. doi:10.3184/096034003782749071.
[4] J.W. Fergus, Metallic interconnects for solid oxide fuel cells, Mater. Sci. Eng. A. 397 (2005) 271–283. doi:10.1016/j.msea.2005.02.047.
[5] P. Kofstad, High Temperature Corrosion, Elsevier Applied Science Publishers Ltd., New York, 1988.
[6] M. Halvarsson, J.E. Tang, H. Asteman, J.-E. Svensson, L.-G. Johansson, Microstructural investigation of the breakdown of the protective oxide scale on a 304 steel in the presence of oxygen and water vapour at 600°C, Corros. Sci. 48 (2006) 2014–2035. doi:10.1016/j.corsci.2005.08.012.
[7] E. Essuman, G.H. Meier, J. Zurek, M. Hänsel, W.J. Quadakkers, The effect of water vapor on selective oxidation of Fe-Cr alloys, Oxid. Met. 69 (2008) 143–162. doi:10.1007/s11085-007-9090-x.
[8] M.R. Ardigo, V. Parry, I. Popa, S. Chevalier, W. Chandra-Ambhorn, P. Phakpeetinan, et al., Optimisation of Metallic Interconnects for Hydrogen Production by High Temperature Water Vapour Electrolysis, Defect Diffus. Forum. 323–325 (2012) 239–244. doi:10.4028/www.scientific.net/DDF.323-325.239.
[9] Z. Yang, M.S. Walker, P. Singh, J.W. Stevenson, Anomalous Corrosion Behavior of Stainless Steels under SOFC Interconnect Exposure Conditions, Electrochem. Solid-State Lett. 6 (2003) B35. doi:10.1149/1.1603012.
[10] J. Rufner, Oxidation behavior of stainless steel 430 and 441 at 800°C in single (air/air) and dual atmosphere (air/hydrogen) exposures, Int. J. Hydrogen Energy. 33 (2008) 1392–1398. doi:10.1016/j.ijhydene.2007.12.067.
[11] J. Larminie, A. Dicks, Fuel Cell Systems Explained, John Wiley & Sons, Ltd,., West Sussex, England, 2003.
[12] P. Atkins, L. Jones, Electrochemistry, in: Chem. Princ. Quest Insight, W. H. Freeman and Company, New York, 2008: pp. 483–528.
[13] J.D. Holladay, J. Hu, D.L. King, Y. Wang, An overview of hydrogen production technologies, Catal. Today. 139 (2009) 244–260. doi:10.1016/j.cattod.2008.08.039.
[14] M. Ni, M. Leung, D. Leung, Technological development of hydrogen production by solid oxide electrolyzer cell (SOEC), Int. J. Hydrogen Energy. 33 (2008) 2337–2354. doi:10.1016/j.ijhydene.2008.02.048.
70
[15] M. a. Laguna-Bercero, Recent advances in high temperature electrolysis using solid oxide fuel cells: A review, J. Power Sources. 203 (2012) 4–16. doi:10.1016/j.jpowsour.2011.12.019.
[16] I. Staffell, A. Ingram, K. Kendall, Energy and carbon payback times for solid oxide fuel cell based domestic CHP, Int. J. Hydrogen Energy. 37 (2012) 2509–2523. doi:10.1016/j.ijhydene.2011.10.060.
[17] F. Baratto, U.M. Diwekar, Life cycle assessment of fuel cell-based APUs, J. Power Sources. 139 (2005) 188–196. doi:10.1016/j.jpowsour.2004.07.025.
[18] F. Calise, A. Palombo, L. Vanoli, Design and partial load exergy analysis of hybrid SOFC–GT power plant, J. Power Sources. 158 (2006) 225–244. doi:10.1016/j.jpowsour.2005.07.088.
[19] N. Minh, Solid oxide fuel cell technology -features and applications, Solid State Ionics. 174 (2004) 271–277. doi:10.1016/j.ssi.2004.07.042.
[20] X. Sun, M. Chen, S.H. Jensen, S.D. Ebbesen, C. Graves, M. Mogensen, Thermodynamic analysis of synthetic hydrocarbon fuel production in pressurized solid oxide electrolysis cells, Int. J. Hydrogen Energy. 37 (2012) 17101–17110. doi:10.1016/j.ijhydene.2012.08.125.
[21] S.C. Singhal, K. Kendall, High Temperature Solid Oxide Fuel Cells: Fundamentals, Design and Applications, Elsevier, Amsterdam, 2003.
[22] J.G. Grolig, Coated Ferritic Stainless Steels as Interconnects in Solid Oxide Fuel Cells, (2013). http://publications.lib.chalmers.se/publication/184010-coated-ferritic-stainless-steels-as-interconnects-in-solid-oxide-fuel-cells (accessed May 29, 2015).
[23] J.T.S. Irvine, P. Connor, Solid oxide fuels cells: Facts and figures: Past, present and future perspectives for SOFC Technologies, Green Energy Technol. 55 (2013). doi:10.1007/978-1-4471-4456-4.
[24] M.S. Sohal, C.M. Stoots, J.S. Herring, J.J. Hartvigsen, D. Larsen, S. Elangovan, et al., Critical Causes of Degradation in Integrated Laboratory Scale Cells During High-Temperature Electrolysis, (2009).
[25] G. Schiller, a. Ansar, M. Lang, O. Patz, High temperature water electrolysis using metal supported solid oxide electrolyser cells (SOEC), J. Appl. Electrochem. 39 (2008) 293–301. doi:10.1007/s10800-008-9672-6.
[26] B.C. Church, T.H. Sanders, R.F. Speyer, J.K. Cochran, Thermal expansion matching and oxidation resistance of Fe–Ni–Cr interconnect alloys, Mater. Sci. Eng. A. 452–453 (2007) 334–340. doi:10.1016/j.msea.2006.10.149.
[27] S.P. Jiang, X. Chen, Chromium deposition and poisoning of cathodes of solid oxide fuel cells – A review, Int. J. Hydrogen Energy. 39 (2014) 505–531. doi:10.1016/j.ijhydene.2013.10.042.
[28] N. Birks, G.H. Meier, F.S. Pettit, Introduction to the High Temperature Oxidation of Metals, Second Edi, Cambridge University Press, New York, 2006.
[29] D.J. Young, Enabling Theory, in: High Temp. Oxid. Corros. Met., Elsevier, 2016: pp. 31–84. doi:10.1016/B978-0-08-100101-1.00002-9.
[30] L.E. Smart, E.A. Moore, Solid State Chemistry: An Introduction, Third Edit, CRC
71
Press, Boca Raton, 2005. [31] H. Asteman, Water Vapour Induced Active Oxidation of Stainless Steel,
University of Gothenburg, 2002. [32] N. Pilling, R. Bedworth, The Oxidation of Metals at High Temperatures, J. Inst.
Met. 29 (1923) 529–591. [33] C. Wagner, Beitrag zur Theorie des Anlaufvorgangs, Zeitschrift Für Phys. Chemie.
(1933) 25. [34] J. Froitzheim, Ferritic steel interconnectors and their interactions with Ni base
anodes in solid oxide fuel cells (SOFC), RWTH Aachen, 2008. [35] E.A. Polman, T. Fransen, P.J. Gellings, Oxidation kinetics of chromium and
morphological phenomena, Oxid. Met. 32 (1989) 433–447. doi:10.1007/BF00665448.
[36] L. Niewolak, L. Garcia-Fresnillo, G.H. Meier, W.J. Quadakkers, Sigma-phase formation in high chromium ferritic steels at 650°C, J. Alloys Compd. 638 (2015) 405–418. doi:10.1016/j.jallcom.2015.03.076.
[37] Alloy Phase Diagrams, Vol 3, in: ASM Handb., 1992: p. 2.152–2.162. [38] K. Huang, Characterization of iron-based alloy interconnects for reduced
temperature solid oxide fuel cells, Solid State Ionics. 129 (2000) 237–250. doi:10.1016/S0167-2738(99)00329-X.
[39] J.G. Grolig, J. Froitzheim, J.-E. Svensson, Coated stainless steel 441 as interconnect material for solid oxide fuel cells: Oxidation performance and chromium evaporation, J. Power Sources. 248 (2014) 1007–1013. doi:10.1016/j.jpowsour.2013.08.089.
[40] A. Magrasó, H. Falk-Windisch, J. Froitzheim, J.-E. Svensson, R. Haugsrud, Reduced long term electrical resistance in Ce/Co-coated ferritic stainless steel for solid oxide fuel cell metallic interconnects, Int. J. Hydrogen Energy. (2015). doi:10.1016/j.ijhydene.2015.04.147.
[41] W.N. Liu, X. Sun, E. Stephens, M.A. Khaleel, Life prediction of coated and uncoated metallic interconnect for solid oxide fuel cell applications, J. Power Sources. 189 (2009) 1044–1050. doi:10.1016/j.jpowsour.2008.12.143.
[42] E.J. Opila, D.L. Myers, N.S. Jacobson, I.M.B. Nielsen, D.F. Johnson, J.K. Olminsky, et al., Theoretical and experimental investigation of the thermochemistry of CrO2(OH)2(g), J. Phys. Chem. A. 111 (2007) 1971–1980. doi:10.1021/jp0647380.
[43] S.P. Jiang, X. Chen, Chromium deposition and poisoning of cathodes of solid oxide fuel cells – A review, Int. J. Hydrogen Energy. 39 (2014) 505–531. doi:10.1016/j.ijhydene.2013.10.042.
[44] B.B. Ebbinghaus, Thermodynamics of gas phase chromium species: The chromium oxides, the chromium oxyhydroxides, and volatility calculations in waste incineration processes, Combust. Flame. 93 (1993) 119–137. doi:10.1016/0010-2180(93)90087-J.
[45] J. Froitzheim, H. Ravash, E. Larsson, L.G. Johansson, J.E. Svensson, Investigation of Chromium Volatilization from FeCr Interconnects by a Denuder Technique, J.
72
Electrochem. Soc. 157 (2010) B1295. doi:10.1149/1.3462987. [46] P. Huczkowski, L. Singheiser, Effect of geometry and composition of Cr steels on
oxide scale properties relevant for interconnector applications in Solid Oxide Fuel Cells (SOFCs), (2005). http://publications.rwth-aachen.de/record/52348?ln=de (accessed June 1, 2015).
[47] K. Yamamoto, Y. Kimura, F.-G. Wei, Y. Mishima, Design of Laves phase strengthened ferritic heat resisting steels in the Fe–Cr–Nb(–Ni) system, Mater. Sci. Eng. A. 329–331 (2002) 249–254. doi:10.1016/S0921-5093(01)01586-6.
[48] B. Kuhn, C.A. Jimenez, L. Niewolak, T. Hüttel, T. Beck, H. Hattendorf, et al., Effect of Laves phase strengthening on the mechanical properties of high Cr ferritic steels for solid oxide fuel cell interconnect application, Mater. Sci. Eng. A. 528 (2011) 5888–5899. doi:10.1016/j.msea.2011.03.112.
[49] J. Froitzheim, G.H. Meier, L. Niewolak, P.J. Ennis, H. Hattendorf, L. Singheiser, et al., Development of high strength ferritic steel for interconnect application in SOFCs, J. Power Sources. 178 (2008) 163–173. doi:10.1016/j.jpowsour.2007.12.028.
[50] Z. Yang, G.-G. Xia, C.-M. Wang, Z. Nie, J. Templeton, J.W. Stevenson, et al., Investigation of iron–chromium–niobium–titanium ferritic stainless steel for solid oxide fuel cell interconnect applications, J. Power Sources. 183 (2008) 660–667. doi:10.1016/j.jpowsour.2008.05.037.
[51] A. Holt, Electrical conductivity of Cr2O3 doped with TiO2, Solid State Ionics. 117 (1999) 21–25. doi:10.1016/S0167-2738(98)00244-6.
[52] W.C. Hagel, A.U. Seybolt, Cation Diffusion in Cr2O3, J. Electrochem. Soc. 108 (1961) 1146–1152. doi:10.1149/1.2427973.
[53] M. Stanislowski, J. Froitzheim, L. Niewolak, W.J. Quadakkers, K. Hilpert, T. Markus, et al., Reduction of chromium vaporization from SOFC interconnectors by highly effective coatings, J. Power Sources. 164 (2007) 578–589. doi:10.1016/j.jpowsour.2006.08.013.
[54] L. Niewolak, D.J. Young, H. Hattendorf, L. Singheiser, W.J. Quadakkers, Mechanisms of Oxide Scale Formation on Ferritic Interconnect Steel in Simulated Low and High pO2 Service Environments of Solid Oxide Fuel Cells, Oxid. Met. 82 (2014) 123–143. doi:10.1007/s11085-014-9481-8.
[55] P.Y. Hou, J. Stringer, The effect of reactive element additions on the selective oxidation, growth and adhesion of chromia scales, Mater. Sci. Eng. A. 202 (1995) 1–10. doi:10.1016/0921-5093(95)09798-8.
[56] P.Y. Hou, I.G. Brown, J. Stringer, Study of the effect of reactive-element ions in a preformed oxide layer, (1991).
[57] I. Belogolovsky, P.Y. Hou, C.P. Jacobson, S.J. Visco, Chromia scale adhesion on 430 stainless steel: Effect of different surface treatments, J. Power Sources. 182 (2008) 259–264. doi:10.1016/j.jpowsour.2008.03.080.
[58] W.Z. Zhu, S.C. Deevi, Opportunity of metallic interconnects for solid oxide fuel cells: a status on contact resistance, Mater. Res. Bull. 38 (2003) 957–972. doi:10.1016/S0025-5408(03)00076-X.
73
[59] D.J. Young, J. Zurek, L. Singheiser, W.J. Quadakkers, Temperature dependence of oxide scale formation on high-Cr ferritic steels in Ar–H2–H2O, Corros. Sci. 53 (2011) 2131–2141. doi:10.1016/j.corsci.2011.02.031.
[60] H.E. Evans, A.T. Donaldson, T.C. Gilmour, Mechanisms of Breakaway Oxidation and Application to a Chromia-Forming Steel, Oxid. Met. 52 (n.d.) 379–402. doi:10.1023/A:1018855914737.
[61] N. Birks, G.H. Meier, F.S. Pettit, Mechanisms of Oxidation, in: Introd. to High Temp. Oxid. Met., Second edi, Cambridge University Press, New York, 2006: pp. 39–74.
[62] P. Kofstad, K.P. Lillerud, On High Temperature Oxidation of Chromium: II. Properties of Cr2O3 and Oxidation Mechanism of Chromium, J. Electrochem. Soc. 127 (1980) 2410. doi:10.1149/1.2129481.
[63] D. Caplan, G.I. Sproule, Effect of oxide grain structure on the high-temperature oxidation of Cr, Oxid. Met. 9 (1975) 459–472. doi:10.1007/BF00611694.
[64] A. Holt, P. Kofstad, Electrical conductivity and defect structure of Cr2O3. I. High temperatures (>∼1000°C), Solid State Ionics. 69 (1994) 127–136. doi:10.1016/0167-2738(94)90401-4.
[65] D.B. Meadowcroft, F.G. Hicks, Electrical Conduction Processes and Defect Structure of Chromic Oxide, Proc. Br. Ceram. Soc. 23 (1972) 33–41.
[66] T. Brylewski, Application of Fe–16Cr ferritic alloy to interconnector for a solid oxide fuel cell, Solid State Ionics. 143 (2001) 131–150. doi:10.1016/S0167-2738(01)00863-3.
[67] H. Hindam, D.P. Whittle, Microstructure, adhesion and growth kinetics of protective scales on metals and alloys, Oxid. Met. 18 (1982) 245–284. doi:10.1007/BF00656571.
[68] B. Tveten, G. Hultquist, T. Norby, Hydrogen in Chromium: Influence on the High-Temperature Oxidation Kinetics in O2, Oxide-Growth Mechanisms, and Scale Adherence, Oxid. Met. 51 (1999) 221–233. doi:10.1023/A:1018866505708.
[69] S.R.J. Saunders, M. Monteiro, F. Rizzo, The oxidation behaviour of metals and alloys at high temperatures in atmospheres containing water vapour: A review, Prog. Mater. Sci. 53 (2008) 775–837. doi:10.1016/j.pmatsci.2007.11.001.
[70] Z. Yang, M.S. Walker, P. Singh, J.W. Stevenson, T. Norby, Oxidation Behavior of Ferritic Stainless Steels under SOFC Interconnect Exposure Conditions, J. Electrochem. Soc. 151 (2004) B669. doi:10.1149/1.1810393.
[71] H. Kurokawa, Oxidation behavior of Fe–16Cr alloy interconnect for SOFC under hydrogen potential gradient, Solid State Ionics. 168 (2004) 13–21. doi:10.1016/j.ssi.2004.02.008.
[72] Z. Yang, G. Xia, P. Singh, J.W. Stevenson, Effects of water vapor on oxidation behavior of ferritic stainless steels under solid oxide fuel cell interconnect exposure conditions, Solid State Ionics. 176 (2005) 1495–1503. doi:10.1016/j.ssi.2005.03.019.
[73] G.R. Holcomb, M. Ziomek-Moroz, S.D. Cramer, B.S. Covino, S.J. Bullard, Dual-Environment Effects on the Oxidation of Metallic Interconnects, J. Mater. Eng.
74
Perform. 15 (2006) 404–409. doi:10.1361/105994906X117198. [74] R. Amendola, P. Gannon, B. Ellingwood, K. Hoyt, P. Piccardo, P. Genocchio,
Oxidation behavior of coated and preoxidized ferritic steel in single and dual atmosphere exposures at 800°C, Surf. Coatings Technol. 206 (2012) 2173–2180. doi:10.1016/j.surfcoat.2011.09.054.
[75] P. Gannon, R. Amendola, High-Temperature, Dual-Atmosphere Corrosion of Solid-Oxide Fuel Cell Interconnects, JOM. 64 (2012) 1470–1476. doi:10.1007/s11837-012-0473-3.
[76] A. Werner, B. Skilbred, N. Sciences, Metallic Interconnects for Proton Ceramic Fuel Cells Oxidation behavior and transport properties under simulated fuel cell conditions, (2012).
[77] M.E. Leonard, R. Amendola, P.E. Gannon, W.-J. Shong, C.-K. Liu, High-temperature (800 °C) dual atmosphere corrosion of electroless nickel-plated ferritic stainless steel, Int. J. Hydrogen Energy. 39 (2014) 15746–15753. doi:10.1016/j.ijhydene.2014.07.144.
[78] M. Stygar, T. Brylewski, A. Kruk, K. Przybylski, Oxidation properties of ferritic stainless steel in dual Ar–H2–H2O/air atmosphere exposure with regard to SOFC interconnect application, Solid State Ionics. 262 (2014) 449–453. doi:10.1016/j.ssi.2014.03.029.
[79] M.R. Ardigo, I. Popa, L. Combemale, S. Chevalier, F. Herbst, P. Girardon, Dual atmosphere study of the K41X stainless steel for interconnect application in high temperature water vapour electrolysis, Int. J. Hydrogen Energy. (2015). doi:10.1016/j.ijhydene.2015.01.116.
[80] J. Li, D. Yan, Y. Gong, Y. Jiang, J. Li, J. Pu, et al., Investigation of Anomalous Oxidation Behavior of SUS430 Alloy in Solid Oxide Fuel Cell Dual Atmosphere, J. Electrochem. Soc. 164 (2017) C945–C951. doi:10.1149/2.0251714jes.
[81] J. Ryter, R. Amendola, M. McCleary, W.-J. Shong, C.-K. Liu, R. Spotorno, et al., Effect of electrical current on the oxidation behavior of electroless nickel-plated ferritic stainless steel in solid oxide fuel cell operating conditions, Int. J. Hydrogen Energy. 43 (2018) 426–434. doi:10.1016/j.ijhydene.2017.11.055.
[82] S.K. Yen, Critical Hydrogen Concentration for the Brittle Fracture of AISI 430 Stainless Steel, J. Electrochem. Soc. 143 (1996) 2736. doi:10.1149/1.1837100.
[83] A.W. Bredvei Skilbred, R. Haugsrud, The effect of dual atmosphere conditions on the corrosion of Sandvik Sanergy HT, Int. J. Hydrogen Energy. 37 (2012) 8095–8101. doi:10.1016/j.ijhydene.2011.10.096.
[84] H. Kurokawa, Y. Oyama, K. Kawamura, T. Maruyama, Hydrogen Permeation Through Fe-16Cr Alloy Interconnect in Atmosphere Simulating SOFC at 1073 K, J. Electrochem. Soc. 151 (2004) A1264. doi:10.1149/1.1767349.
[85] G. Hultquist, B. Tveten, E. Hörnlund, Hydrogen in Chromium: Influence on the High-Temperature Oxidation Kinetics in H2O, Oxide-Growth Mechanisms, and Scale Adherence, Oxid. Met. 54 (2000) 1–10. doi:10.1023/A:1004610626903.
[86] A. Galerie, J.P. Petit, Y. Wouters, J. Mougin, A. Srisrual, P.Y. Hou, Water Vapour Effects on the Oxidation of Chromia-Forming Alloys, Mater. Sci. Forum. 696
75
(2011) 200–205. doi:10.4028/www.scientific.net/MSF.696.200. [87] E. Park, B. Hüning, M. Spiegel, Evolution of near-surface concentration profiles
of Cr during annealing of Fe–15Cr polycrystalline alloy, Appl. Surf. Sci. 249 (2005) 127–138. doi:10.1016/j.apsusc.2004.11.078.
[88] M.H. Bin Ani, T. Kodama, M. Ueda, K. Kawamura, T. Maruyama, The Effect of Water Vapor on High Temperature Oxidation of Fe-Cr Alloys at 1073 K, Mater. Trans. 50 (2009) 2656–2663. doi:10.2320/matertrans.M2009212.
[89] Furiouslettuce, Bragg diffraction, (n.d.). https://commons.wikimedia.org/w/index.php?curid=6487785 (accessed May 5, 2018).
[90] M.P. Dewar, Characterization and Evaluation of Aged 20Cr32Ni1Nb Stainless Steels, University of Alberta, 2013.
[91] M.-C. Fournier-Salaün, P. Salaün, Quantitative determination of hexavalent chromium in aqueous solutions by UV-Vis spectrophotometer, Cent. Eur. J. Chem. 5 (2007) 1084–1093. doi:10.2478/s11532-007-0038-4.
[92] S.H. Chan, H.K. Ho, Y. Tian, Modelling of simple hybrid solid oxide fuel cell and gas turbine power plant, J. Power Sources. 109 (2002) 111–120. doi:10.1016/S0378-7753(02)00051-4.
[93] S.H. Jensen, X. Sun, S.D. Ebbesen, R. Knibbe, M. Mogensen, Hydrogen and synthetic fuel production using pressurized solid oxide electrolysis cells, Int. J. Hydrogen Energy. 35 (2010) 9544–9549. doi:10.1016/j.ijhydene.2010.06.065.
[94] E.W.A. Young, J.H. Gerretsen, The Oxygen Patrial Pressure Dependence of the Defect Structure of Chromium(III) Oxide, J. Electrochem. Soc. 134 (1987) 2257–2260. doi:10.1149/1.2100862.
[95] E.A. Polman, T. Fransen, P.J. Gellings, The reactive element effect; ionic processes of grain-boundary segregation and diffusion in chromium oxide scales, J. Phys. Condens. Matter. 1 (1989) 4497–4510. doi:10.1088/0953-8984/1/28/001.
[96] R.E. Lobnig, H.P. Schmidt, K. Hennesen, H.J. Grabke, Diffusion of cations in chromia layers grown on iron-base alloys, Oxid. Met. 37 (1992) 81–93. doi:10.1007/BF00665632.
[97] S. Canovic, J. Froitzheim, R. Sachitanand, M. Nikumaa, M. Halvarsson, L.-G. Johansson, et al., Oxidation of Co- and Ce-nanocoated FeCr steels: A microstructural investigation, Surf. Coatings Technol. 215 (2013) 62–74. doi:10.1016/j.surfcoat.2012.08.096.
[98] R. Sachitanand, M. Sattari, J.-E. Svensson, J. Froitzheim, Evaluation of the oxidation and Cr evaporation properties of selected FeCr alloys used as SOFC interconnects, Int. J. Hydrogen Energy. 38 (2013) 15328–15334. doi:10.1016/j.ijhydene.2013.09.044.
[99] A. Naoumidis, H.A. Schulze, W. Jungen, P. Lersch, Phase studies in the chromium-manganese-titanium oxide system at different oxygen partial pressures, J. Eur. Ceram. Soc. 7 (1991) 55–63. doi:10.1016/0955-2219(91)90054-4.
[100] E. Essuman, G.H. Meier, J. Zurek, M. Hänsel, L. Singheiser, T. Norby, et al., Effect of oxygen partial pressure on the oxidation behaviour of an yttria dispersion
76
strengthened NiCr-base alloy, J. Mater. Sci. 43 (2008) 5591–5598. doi:10.1007/s10853-008-2795-7.
[101] C. Key, J. Eziashi, J. Froitzheim, R. Amendola, R. Smith, P. Gannon, Methods to Quantify Reactive Chromium Vaporization from Solid Oxide Fuel Cell Interconnects, J. Electrochem. Soc. 161 (2014) C373–C381. doi:10.1149/2.0041409jes.
[102] J. Zurek, D.J. Young, E. Essuman, M. Hänsel, H.J. Penkalla, L. Niewolak, et al., Growth and adherence of chromia based surface scales on Ni-base alloys in high- and low-pO2 gases, Mater. Sci. Eng. A. 477 (2008) 259–270. doi:10.1016/j.msea.2007.05.035.
[103] W.J. Quadakkers, J. Żurek, Oxidation in Steam and Steam/Hydrogen Environments, in: Shreir’s Corros., 4th ed., Elsevier, 2010: pp. 407–456. doi:10.1016/B978-044452787-5.00022-6.
[104] P.Y. Hou, J. Stringer, The effect of reactive element additions on the selective oxidation, growth and adhesion of chromia scales, Mater. Sci. Eng. A. 202 (1995) 1–10. doi:10.1016/0921-5093(95)09798-8.
[105] M.R. Ardigo, I. Popa, S. Chevalier, S. Weber, O. Heintz, M. Vilasi, Effect of Water Vapor on the Oxidation Mechanisms of a Commercial Stainless Steel for Interconnect Application in High Temperature Water Vapor Electrolysis, Oxid. Met. 79 (2012) 495–505. doi:10.1007/s11085-012-9338-y.
[106] Y. Murata, H. Minai, K. Nagai, A. Shiraki, M. Morinaga, (Fe, Cr)3O4 Spinel Layer as the Key to Solving the Accelerated Oxidation of High Cr Iron Alloy in High-temperature Steam, ISIJ Int. 48 (2008) 1434–1437. doi:10.2355/isijinternational.48.1434.
[107] M. Hänsel, W.J. Quadakkers, D.J. Young, Role of Water Vapor in Chromia-Scale Growth at Low Oxygen Partial Pressure, Oxid. Met. 59 (2003) 285–301. doi:10.1023/A:1023040010859.
[108] T. Brylewski, A. Gil, A. Rakowska, S. Chevalier, A. Adamczyk, J. Dabek, et al., Improving the Physicochemical Properties of Fe–25Cr Ferritic Steel for SOFC Interconnects via Y-Implantation and Y2O3-Deposition, Oxid. Met. 80 (2013) 83–111. doi:10.1007/s11085-012-9345-z.
[109] S. Fontana, R. Amendola, S. Chevalier, P. Piccardo, G. Caboche, M. Viviani, et al., Metallic interconnects for SOFC: Characterisation of corrosion resistance and conductivity evaluation at operating temperature of differently coated alloys, J. Power Sources. 171 (2007) 652–662. doi:10.1016/j.jpowsour.2007.06.255.
[110] K. Huang, P.Y. Hou, J.B. Goodenough, Reduced area specific resistance for iron-based metallic interconnects by surface oxide coatings, Mater. Res. Bull. 36 (2001) 81–95. doi:10.1016/S0025-5408(01)00506-2.
[111] G. Cabouro, G. Caboche, S. Chevalier, P. Piccardo, Opportunity of metallic interconnects for ITSOFC: Reactivity and electrical property, J. Power Sources. 156 (2006) 39–44. doi:10.1016/j.jpowsour.2005.08.039.
[112] S. Fontana, S. Chevalier, G. Caboche, Metallic interconnects for solid oxide fuel cell: Effect of water vapour on oxidation resistance of differently coated alloys, J. Power Sources. 193 (2009) 136–145. doi:10.1016/j.jpowsour.2008.11.041.
77
[113] Rakshith Sachitanand, Thin-film coated steel foils as interconnects for solid oxide fuel cells (SOFC), Chalmers University of Technology, 2015. http://publications.lib.chalmers.se/records/fulltext/220846/220846.pdf.
[114] N. Shaigan, W. Qu, D.G. Ivey, W. Chen, A review of recent progress in coatings, surface modifications and alloy developments for solid oxide fuel cell ferritic stainless steel interconnects, J. Power Sources. 195 (2010) 1529–1542. doi:10.1016/j.jpowsour.2009.09.069.
[115] W.J. Quadakkers, D. Naumenko, E. Wessel, V. Kochubey, L. Singheiser, Growth Rates of Alumina Scales on Fe–Cr–Al Alloys, Oxid. Met. 61 (2004) 17–37. doi:10.1023/B:OXID.0000016274.78642.ae.
[116] H. Falk-Windisch, J. Claquesin, M. Sattari, J.-E. Svensson, J. Froitzheim, Co- and Ce/Co-coated ferritic stainless steel as interconnect material for Intermediate Temperature Solid Oxide Fuel Cells, J. Power Sources. 343 (2017) 1–10. doi:10.1016/j.jpowsour.2017.01.045.
[117] P.Y. Hou, J. Stringer, The effect of aluminum as an alloying addition or as an implant on the high-temperature oxidation of Ni-25Cr, Oxid. Met. 34 (1990) 299–321. doi:10.1007/BF00665020.
[118] A. Petric, H. Ling, Electrical Conductivity and Thermal Expansion of Spinels at Elevated Temperatures, J. Am. Ceram. Soc. 90 (2007) 1515–1520. doi:10.1111/j.1551-2916.2007.01522.x.
[119] A. Holt, P. Kofstad, Electrical conductivity and defect structure of Cr2O3. II. Reduced temperatures (<∼1000°C), Solid State Ionics. 69 (1994) 137–143. doi:10.1016/0167-2738(94)90402-2.
[120] A. Naoumidis, H.A. Schulze, W. Jungen, P. Lersch, Phase studies in the chromium-manganese-titanium oxide system at different oxygen partial pressures, J. Eur. Ceram. Soc. 7 (1991) 55–63. doi:10.1016/0955-2219(91)90054-4.
[121] D.J.L. Brett, A. Atkinson, N.P. Brandon, S.J. Skinner, Intermediate temperature solid oxide fuel cells., Chem. Soc. Rev. 37 (2008) 1568–78. doi:10.1039/b612060c.
[122] H. Falk-Windisch, J.E. Svensson, J. Froitzheim, The effect of temperature on chromium vaporization and oxide scale growth on interconnect steels for Solid Oxide Fuel Cells, J. Power Sources. 287 (2015) 25–35. doi:10.1016/j.jpowsour.2015.04.040.
[123] T. Jonsson, S. Canovic, F. Liu, H. Asteman, J.-E. Svensson, L.-G. Johansson, et al., Microstructural investigation of the effect of water vapour on the oxidation of alloy 353 MA in oxygen at 700 and 900°C, Mater. High Temp. 22 (2005) 231–243. doi:10.3184/096034005782744461.
[124] J. Żurek, E. Wessel, L. Niewolak, F. Schmitz, T.-U. Kern, L. Singheiser, et al., Anomalous temperature dependence of oxidation kinetics during steam oxidation of ferritic steels in the temperature range 550–650 °C, Corros. Sci. 46 (2004) 2301–2317. doi:10.1016/j.corsci.2004.01.010.
[125] L. Sánchez, M.P. Hierro, F.J. Pérez, Effect of Chromium Content on the Oxidation Behaviour of Ferritic Steels for Applications in Steam Atmospheres at High Temperatures, Oxid. Met. 71 (2009) 173–186. doi:10.1007/s11085-008-9134-x.
78
[126] D.. Whittle, G.. Wood, D.. Evans, D.. Scully, Concentration profiles in the underlying alloy during the oxidation of iron-chromium alloys, Acta Metall. 15 (1967) 1747–1755. doi:10.1016/0001-6160(67)90066-1.
[127] D.M. Coldwell, R.B. McLellan, Thermodynamic properties of Fe-Cr-H ternary solid solutions, Acta Metall. 23 (1975) 57–61. doi:10.1016/0001-6160(75)90069-3.
[128] F. Liu, J.E. Tang, T. Jonsson, S. Canovic, K. Segerdahl, J.-E. Svensson, et al., Microstructural Investigation of Protective and Non-Protective Oxides on 11% Chromium Steel, Oxid. Met. 66 (2006) 295–319. doi:10.1007/s11085-006-9035-9.
[129] T. Jonsson, B. Pujilaksono, H. Heidari, F. Liu, J.-E. Svensson, M. Halvarsson, et al., Oxidation of Fe–10Cr in O2 and in O2+H2O environment at 600°C: A microstructural investigation, Corros. Sci. 75 (2013) 326–336. doi:10.1016/j.corsci.2013.06.016.
[130] B. Pujilaksono, T. Jonsson, H. Heidari, M. Halvarsson, J.-E. Svensson, L.-G. Johansson, Oxidation of Binary FeCr Alloys (Fe–2.25Cr, Fe–10Cr, Fe–18Cr and Fe–25Cr) in O2 and in O2 + H2O Environment at 600 °C, Oxid. Met. 75 (2011) 183–207. doi:10.1007/s11085-010-9229-z.
[131] R. Faust, Dual Atmosphere Corrosion of Ferritic Stainless Steel used for Solid Oxide Fuel Cell Applications The Importance of the Location of Pre-Oxidation Scales, (2017).
[132] E. Essuman, G.H. Meier, J. Żurek, M. Hänsel, L. Singheiser, W.J. Quadakkers, Enhanced internal oxidation as trigger for breakaway oxidation of Fe–Cr alloys in gases containing water vapor, Scr. Mater. 57 (2007) 845–848. doi:10.1016/j.scriptamat.2007.06.058.