Embed Size (px)
Citation preview

The Efficiency of Sampling Techniques for NTD Reporting
1
The Efficiency of Sampling Techniques for NTD Reporting
Xuehao Chu University of South Florida
Abstract
This paper examines the minimum sample size required by each of six sampling tech-niques for estimating annual passenger miles traveled to meet the Federal Transit Administration’s 95% confidence and 10% precision levels for the National Transit Database. It first describes these sampling techniques in non-technical terms and hypothesizes how they are expected to compare in their minimum sample sizes. It then determines the minimum sample size for 83 actual sample datasets that cover 6 modes and 65 transit agencies. Finally, it summarizes the results in minimum sample size to compare the relative efficiency of these sampling techniques. The potential for improved efficiency from using these sampling techniques is great, but the exact degree of improvement depends highly on individual agencies, modes, and services.
IntroductionTo be eligible for the Urbanized Area Formula Grant Program of the Federal Tran-sit Administration (FTA), transit agencies must report annual passenger miles traveled (PMT) to the Nation Transit Database (NTD) for each combination of mode and type of service (purchased or directly-operated) (FTA 2007, FTA 2008). The NTD requires that a 100% count of annual PMT be reported if it is available and reliable. Getting a 100% account of annual PMT, however, requires keeping track of the distance that every passenger travels. Except in a few cases (e.g., fer-ryboat with only two stops), annual PMT is almost always estimated through
Journal of Public Transportation, Vol. 12, No. 4, 2009
2
statistical sampling, and such an estimate must meet FTA’s 95% confidence and 10% precision levels.
To estimate annual PMT through random sampling, agencies have the burden of developing a sampling plan that meets FTA’s requirements, as well as the sig-nificantly higher burden of collecting the sample data. It is highly desirable to be able to reduce these agency costs while meeting FTA’s confidence and precision requirements.
One strategy to reduce agencies’ burden of developing sampling plans would be to have a user-friendly Excel template for individual agencies to explore and develop sampling plans that are most efficient for their conditions. One example can be found in Chu and Ubaka (2004), but the study was limited to the sampling technique used in FTA’s Circular 2710.1A for motorbus. Chu (2009) develops a more comprehensive template that incorporates a range of sampling techniques that agencies can explore. While the paper uses this new template for analysis, this strategy is not a focus and is not discussed further.
The most effective strategy to reduce agencies’ burden of data collection would be through improving sampling efficiency by taking advantage of modern sampling techniques. Furth (2005), for example, shows the capability of modern sampling techniques to improve sampling efficiency for one agency. This is the focus of this paper.
Many agencies, however, do not consider the relative efficiency of modern sam-pling techniques. The existence of the circular sampling plans for motorbus and demand-response may have discouraged agencies from seeking more efficient sampling plans (UMTA 1988a, UMTA 1988b). More important, agencies may not fully understand the potential cost savings. The literature does not have adequate information on these cost savings. The technical work in the literature typically includes actual examples of cost savings, but these examples are limited to a few cases (Furth 2005) or a few sampling techniques (Furth and McCollom 1987) and are almost always for motorbus only.
The goal of the paper is to encourage agencies to explore the potential of cost savings from using various modern sampling techniques. Toward that goal, the objective is to examine several modern sampling techniques and the potential of reducing agency costs from using them. Specifically, this paper provides the most comprehensive picture of how six modern sampling techniques may perform across a wide range of modes and operating conditions under a uniform process
The Efficiency of Sampling Techniques for NTD Reporting
3
for data analysis. This comprehensive picture helps transit agencies better under-stand the potential cost savings from using these sampling techniques. It also helps transit agencies better understand that the actual efficiency of individual sampling techniques and their relative efficiency depend highly on the mode and the actual operating conditions.
The remainder of the paper first describes six sampling techniques in non-techni-cal terms and hypothesizes how they are expected to compare for their respective minimum sample sizes. It then determines the minimum sample size for 83 actual sample datasets that cover 6 modes and 65 transit agencies. Finally, it summarizes the results in minimum sample size to compare the relative efficiency of these sampling techniques. It also shows the potential and variations in the relative effi-ciency across the sample datasets used.
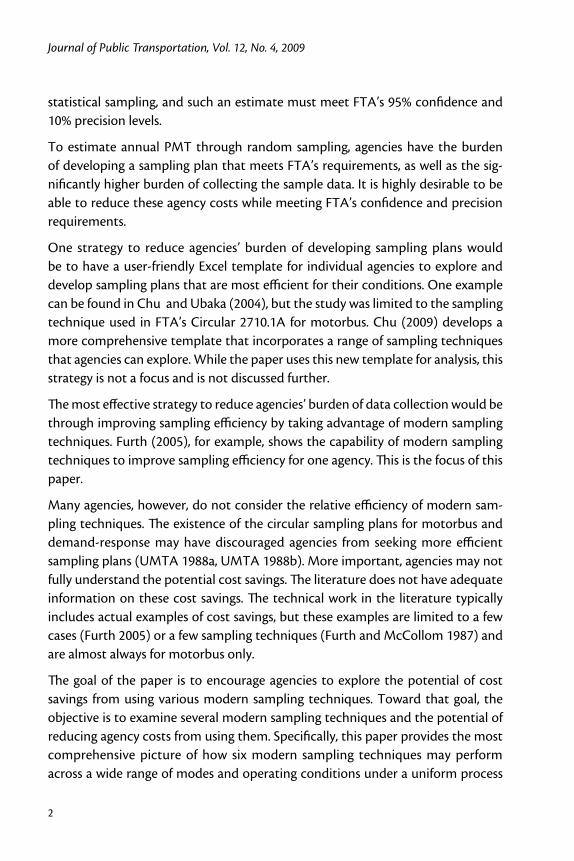
Sampling TechniquesTable 1 summarizes the six sampling techniques considered in this paper. One way to understand them is to look at them as defined by the two basic sampling meth-ods listed in the columns and the three estimation methods listed in the rows. The description here avoids technical details, which are available in standard textbooks on sampling techniques (Cochran 1977).
Table 1. Six Sampling Techniques
Basic Sampling MethodsSimple random sampling involves every unit operated having the same chance of being selected at random. Stratified sampling, on the other hand, involves divid-ing an agency’s service into two or more groups and sampling separately within each group. The objective of stratification is to reduce within-group differences.

Journal of Public Transportation, Vol. 12, No. 4, 2009
4
For an agency that operates both local and express bus services, with the latter having much longer routes, for example, the average passenger trip length (APTL) is likely to vary less across local bus trips or across express bus trips than across all bus trips.
Estimation MethodsThere are two basic methods to estimate PMT—direct expansion and ratio expan-sion. In the case of sampling one-way bus trips, direct expansion involves multiply-ing the average PMT per one-way bus trip in a sample with an expansion factor, or the total number of one-way bus trips actually operated in this case. FTA’s Circular 2710.1A is based on this expansion method for motorbus services (UMTA 1988a). Ratio expansion, on the other hand, involves multiplying the estimate of a ratio from a sample with a known quantity. Estimating PMT as the product of a 100% count of unlinked passenger trips (UPT) and an estimated APTL is one example of ratio expansion. In this case, the APTL is the ratio and the 100% count of UPT is the known quantity. FTA’s Circulars 2710.2A and 2710.4A are based on ratio expansion (UMTA 1988b, UMTA 1988c).
The paper considers two of the three approaches to ratio expansion that have appeared in the literature—one based on absolute APTL, one based on cash rev-enues, and one based on relative APTL. The approach based on absolute APTL is already mentioned above. The approach based on cash revenues uses PMT per dollar of cash-fare revenue as the ratio and total cash-fare revenues as the known quantity. FTA’s Circular 2710.4A is based on the revenue approach (UMTA 1988c) and, because of changing patterns in cash-fare payment over time, FTA no longer approves the sampling plan in this circular without certification by a qualified stat-istician. For the same reason, this paper does not consider the revenue approach any further.
Furth (2005) recently proposed the ratio-expansion approach based on relative APTL. This new approach uses a new known quantity called potential PMT. For any unit of operation along a route (i.e., one one-way vehicle trip, all operations in a year, etc.), its potential PMT is the product of the UPT count on that unit and the route length. In other words, the potential PMT for a given route is its PMT if every passenger traveled the full route length. This new approach uses a relative APTL from a sample as the ratio. For a given route, the relative APTL is the abso-lute APTL over the route length. The relative APTL for a route gives the average fraction of a route’s length that passengers travel on all units of service. A ratio of

The Efficiency of Sampling Techniques for NTD Reporting
5
0.5 for a route, for example, would indicate that, on average, passengers travel one half of the length of the route.
PrerequisitesTable 2 summarizes the prerequisites of these sampling techniques in terms of modes and required data. Direct simple random sampling is applicable to all situ-ations. Each of the other techniques has some prerequisites. These prerequisites are needed for one of three elements of these sampling techniques – stratification, ratio expansion based on absolute APTL, and ratio expansion based on relative APTL. Because the length of a one-way vehicle run can vary for a given route, the average length of each route for the relative-APTL ratio expansion should be cal-culated as the ratio of annual total vehicle revenue miles and annual total vehicle revenue one-way trips along that route.
Table 2. Applicable Modes and Required Data by Sampling Technique
Notes: DR = demand response APTL = average passenger trip length UPT = unlinked passenger trips
Expected Relative EfficiencyTable 1 also summarizes the expected relative efficiency between some of these sampling techniques. Stratification is expected to improve efficiency over simple random sampling for any given estimation method. Otherwise, one would not use stratification because it complicates both data collection and estimation of annual PMT.
Ratio expansion with the absolute-APTL approach is expected to improve effi-ciency over direction expansion with or without stratification. PMT at any unit of operation (e.g., one-way trips) tends to be proportional to the number of UPT

Journal of Public Transportation, Vol. 12, No. 4, 2009
6
for that unit. As a result, it is often more efficient to estimate annual PMT as the product of a 100% count of UPT and the absolute APTL from a sample.
Furth (2005) hypothesizes that the relative-APTL approach is more efficient than the absolute-APTL approach. He argues that PMT at any unit of operation tends to be proportional to not only UPT on the unit but also the route length. Since the product of UPT on a unit of operation and the route length is potential PMT for the unit, PMT on a unit of operation tends to be proportional to potential PMT on that unit. As a result, it is expected to be more efficient to estimate annual PMT by multiplying a 100% count of potential PMT and the relative APTL from a sample by each route in a system.
MethodologyTo analyze the relative efficiency of these six sampling techniques, 83 sample datasets were used that cover 65 agencies and six modes – motorbus, trolleybus, demand-response, vanpool, light rail, and commuter rail with motorbus and trol-leybus combined as a single bus mode for analysis.
AssumptionsAn initial sample size for a given sample dataset to reach the minimum sample size is adjusted for two considerations. One accounts for errors in the sample data. Errors can result from both sampling and non-sampling sources, and these errors may lead to the initial sample size too large or too small for FTA’s requirements. To guard against the latter, a margin of 25% is built into the minimum sample size used in this paper. This margin, however, does not influence the relative efficiency of sampling techniques. The other relates to the minimum size of 10 for each stra-tum when ratio estimation is used. Bias exists in ratio expansion, and it can become significant when the sample size is below 10 (Furth and McCollom 1987).
The results are presented in relative terms. When comparing the efficiency of Absolute-APTL simple random sampling (40) and direct simple random sampling (200), for example, the result is shown as the percent reduction in minimum sam-ple size by Absolute-APTL simple random sampling from direct simple random sampling ((40-200)/200 = -80%).
For ease of references, direct simple random sampling sometimes is referred to as the base technique, while the other five techniques as a whole are referred to as non-base sampling techniques. For motorbus services, using the commonly-used

The Efficiency of Sampling Techniques for NTD Reporting
7
sampling plan in Circular 2710.1A as the base would help transit agencies to deter-mine how much their data collection effort would decline relative to their current effort. Since circular sampling plans are not available for most modes, however, direct simple random sampling is used as the base instead for all modes.
Data Sources and CharacteristicsAmong the 83 sample datasets, 14 are for demand-response, 7 for vanpool, 8 for light rail, 3 for commuter rail, and 51 for bus. According to the Florida Transit Information System, these six modes represent more than 96% of all mode-service type reports submitted to the NTD for 2006. The sample datasets come from two sources. Some are from transit agencies as a result of requests for previous research efforts on sampling for the NTD (Chu and Ubaka 2004, Chu 2006, Chu 2007). Most, however, come from transit agencies in response to a request as part of an effort to develop the National Transit Database Sampling Manual (Chu 2009). This later request was sent to each agency that reported to the NTD for 2006 and was for each mode and type of service that each agency reported. For many agencies that sent their sample datasets for multiple years for a given mode and service type, only the latest is used.
The sampling units vary among the sample datasets both across modes and within a mode. For demand-response and vanpool, the sampling unit is always in vehicle days. For bus, it is in round trips for one sample dataset but in one-way trips for all others. For light rail and commuter rail, the sampling unit is in one-way passenger car trips in most cases but is in one-way train trips for a few of the sample datasets. Not separating the results for different sampling units does not affect the relative efficiency between two sampling techniques.
When applicable, stratification is done differently for different modes and sample datasets with information contained in each sample dataset. There are at least issues with post-stratification:
Information is not always available in a sample dataset for choosing the most •useful way. Stratification depends on the type of quantity on which stratifica-tion is executed and how stratification is done with a chosen quantity.
Stratification is not always based on information available before sampling. •For vanpool, for example, it is done uniformly across all datasets with two strata defined by the sample median of APTL. For bus, stratification is based on route length if available but is based on APTL otherwise. In real applica-

Journal of Public Transportation, Vol. 12, No. 4, 2009
8
tions, one should use something that is known before sampling occurs, such as route length, as the basis for stratification.
As a result, the efficiency of stratification-based sampling techniques may not be exact for each applicable sample dataset. This shortcoming may influence the relative efficiency between stratification and simple random sampling. It does not negatively impact the paper’s main purpose—to motivate transit agencies to explore these sampling techniques.
Actual Relative EfficiencyThis section empirically examines the relative efficiency of the sampling tech-niques from four perspectives. After describing the analysis method, the results for these perspectives are presented in separate sub-sections:
Potentials and Variations shows the potentials in efficiency improvements •from using the various sampling techniques as well as the variations in how each sampling technique may do for a particular case.
Effects of Estimation Methods compares empirically the efficiency of the •different estimation methods for a given basic sampling method. Compari-sons are made separately between Relative-APTL simple random sampling and direct simple random sampling and between the two approaches to ratio expansion.
Effects of Sampling Methods compares empirically the efficiency of the two •basic sampling methods for any given estimation method.
Ratio Expansion versus Stratification examines their relative efficiency •empirically.
Potentials and VariationsThe potential for each sampling technique to improve efficiency is great and can be shown both for individual sample datasets and for all sample datasets com-bined. For individual sample datasets, the potential is evidenced by the highest percent reduction for each applicable sampling technique and mode. The poten-tial is shown between direct simple random sampling and each of the other five sampling techniques.
Table 3 shows both minimum and maximum percent reductions in minimum sam-ple size for each non-base sampling technique from the base technique (i.e., direct simple random sampling) by mode. Also shown is the number of sample datasets

The Efficiency of Sampling Techniques for NTD Reporting
9
used. For Absolute-APTL simple random sampling, for example, the highest reduc-tion ranges from 65% for vanpool and 98% for commuter rail. For the sample data-sets as a whole, the potential is equally significant. While not shown separately, the total minimum sample sizes for all sample datasets is 14,341 under Absolute-APTL simple random sampling but 30,687 under the base technique, a reduction of 53%.
Table 3. Potentials and Variations in Efficiency Improvements
Notes: To show transit agencies the potential of sampling techniques for efficiency improvements and how these improvements vary, this study chose to use the percent reduction from the base technique for each applicable non-base sampling technique. It may be argued that reduction in the number of units is more relevant for saving costs than percent reduction. Percent reduction is found to be easier for presentation.
Understanding the potential for improvement is important, but equally impor-tant is to understand the variations. First, Table 3 shows some variation in whether a non-base sampling technique may actually improve efficiency. The lowest reduc-tion being zero by direct stratified sampling for bus shows that stratification alone does not necessarily improve efficiency. In this particular case, routes in the sample dataset are separated into three groups, with 10 and 20 miles as the separation cri-teria. In addition, the lowest reduction being positive 2% by Absolute-APTL simple random sampling for bus shows that ratio expansion does not always improve

Journal of Public Transportation, Vol. 12, No. 4, 2009
10
efficiency over direct expansion. Other than these exceptions, however, these non-base sampling techniques improve efficiency from the base technique. More important, Table 3 shows that the degree of improvements depends highly on the mode and the actual operating conditions through comparing the minimum and maximum reductions for each sampling technique and each mode.
What might be the causes of these large variations in efficiency improvements across the different sample datasets for a given sampling technique? The direct cause of these large variations in efficiency improvements is differences in the degree of varia-tion in the relevant parameter across the different sample datasets. The parameter is PMT per unit of sampling for direct expansion, APTL for Absolute-APTL ratio expansion, and relative passenger trip length for Relative-APTL ratio expansion. For example, the Absolute-APTL approach works well when APTL does not vary much from one vehicle trip to another. This often is the case in transit systems in which the routes have roughly the same length, but not when a transit agency has a mix of long-distance express routes and shorter local routes. If an agency’s routes are of varying length without a clear breakpoint, there is some benefit to stratifying; but if the routes can be neatly divided into very long, express routes and similar-length local routes, stratification can be extremely effective in improving sampling efficiency. In terms of any indirect causes that lead to the differences in the degree of variation in the relevant parameter for a given sampling technique, all we know is that they likely reflect a combination of all service characteristics, including the service geography, the route networks and service polices of all modes in the same service geography, the spatial origin and destination patterns for travelers, etc.
Effects of Estimation MethodsThe effects of estimation methods can be determined in two steps. The first step determines the effects of Absolute-APTL ratio expansion over the base, and the other determines the effects of the Relative-APTL approach over the Absolute-APTL approach. For each step, the analysis is done both without stratification and with stratification.
Figure 1 shows the effects of Absolute-APTL ratio expansion for each applicable mode and sample dataset, with Figure 1a for the case of without stratification and Figure 1b with stratification:
Without stratification, Absolute-APTL ratio expansion does not always •improve efficiency. The exception is the bus sample dataset where the correlation between UPT and PMT is extremely low at 0.42. Otherwise,

The Efficiency of Sampling Techniques for NTD Reporting
11
Absolute-APTL ratio expansion improves efficiency over the base technique for all sample datasets. The improvement is uniformly high for light rail and commuter rail, but is more varied for the other modes. Part of the modal difference in the variation of efficiency improvements within a mode is the result of differences in the number of sample datasets used.
With stratification, Absolute-APTL ratio expansion improves efficiency •for all applicable sample datasets, including the bus sample dataset where Absolute-APTL ratio expansion is less efficient without stratification. In addition, the efficiency improvements appear to be far more uniform both within modes and between modes.
Figure 1a. Absolute-APTL Simple Random versus Base
Figure 1b. Absolute-APTL Stratified versus Direct Stratified

Journal of Public Transportation, Vol. 12, No. 4, 2009
12
Relative-APTL ratio expansion is applicable to 12 bus sample datasets, 2 light rail datasets, and 1 commuter rail dataset. For the small number of applications to the rail modes, Relative-APTL ratio expansion does not improve efficiency over Abso-lute-APTL ratio expansion either with or without stratification. For bus, as shown in Table 4, however, their relative efficiency depends on the operating conditions of transit agencies. The 12 sample datasets have been separated into four groups, and the following patterns of relative efficiency are observed:
The Relative-APTL approach is far more efficient for the first five datasets •under both basic sampling methods. Among these cases, the advantage of the relative-APTL approach is far greater under simple random sampling than under stratified sampling.
The Relative-APTL approach is slightly more efficient for datasets 6-8 under •both basic sampling methods.
The Relative-APTL approach is slightly more efficient for datasets 9-10 under •stratified sampling but not under simple random sampling.
The Absolute-APTL approach is more efficient for datasets 11-12 under •both basic sampling methods.
Table 4. Relative Efficiency of Relative- and Absolute-APTL Approaches for Bus Service

The Efficiency of Sampling Techniques for NTD Reporting
13
Effects of Sampling MethodsThe effects of stratification versus without stratification can be determined for each estimation method—direct expansion, Absolute-APTL ratio expansion, and Relative-APTL ratio expansion:
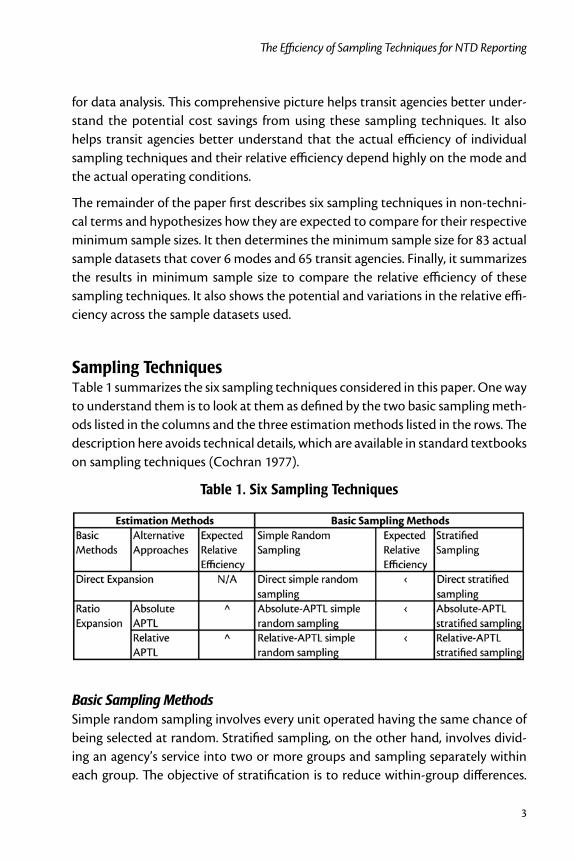
With direct expansion, stratification improves efficiency for all four appli-•cable modes (Figure 2a). The improvement is similar in percentage terms for commuter rail and vanpool, but varies quite significantly across sample datasets for light rail and bus.
With Absolute-APTL ratio expansion, whether stratification improves effi-•ciency differs significantly across modes (Figure 2b). Stratification improves efficiency at least 50% for all vanpool sample datasets. With two exceptions, it also improves efficiency for bus though the effect varies more across the sample datasets. For light rail and commuter rail, however, stratification makes sampling less efficient. This reversed relative efficiency for stratifica-tion does not necessarily reflect the characteristics of stratification, but rather is likely the result of three factors in applying stratification with ratio expansion to these two rail modes. The minimum sample size is small for the two rail modes under Absolute-APTL simple random sampling, at least for the sample datasets available for this paper. For the 8 light rail sample datasets, the minimum sample size under Absolute-APTL simple random sampling is 52 for one sample dataset and under 33 for all other sample datasets. For the 3 commuter rail sample datasets, the minimum sample size under Absolute-APTL simple random sampling is under 40. The second factor is the minimum stratum size of 10 used. The third factor is the number of strata used for stratification.
With Relative-APTL ratio expansion, stratification improves efficiency for all •20 applicable bus sample datasets (Figure 2c), although with a wide range in the degree of improvements. For the single applicable sample dataset for commuter rail, stratification is less efficient. For the two applicable sample datasets for light rail, stratification is more efficient for one sample dataset but is less efficient for the other.
Journal of Public Transportation, Vol. 12, No. 4, 2009
14
Figure 2a. Direct Stratified versus Base
Figure 2b. Absolute-APTL Stratified versus Absolute-APTL Simple Random

The Efficiency of Sampling Techniques for NTD Reporting
15
Figure 2c. Relative-APTL Stratified versus Relative-APTL Simple Random
Ratio Expansion versus StratificationWith one exception for vanpool, Absolute-APTL simple random sampling is far more efficient than direct stratified sampling for all sample datasets from van-pool, light rail, and commuter rail (Figure 3a). The relative efficiency between ratio expansion and stratification, however, is mixed for bus. For the cases where the minimum sample size is toward the lower end of the full range, Absolute-APTL simple random sampling is still more efficient than direct stratified sampling. For the cases where the minimum sample size is toward the higher end of the full range, however, the opposite appears to be the case. This pattern can be observed in Figure 3b, which shows the minimum sample size for these two sampling tech-niques in an x-y plot, with the two axes on the same scale along with a 45-degree diagonal line for easy comparison.

Journal of Public Transportation, Vol. 12, No. 4, 2009
16
Figure 3a. Percent Reductions for Four Mode
Figure 3b. Minimum Sample Size for Bus
ConclusionsThis paper has examined the minimum sample size required by each of six sam-pling techniques for estimating annual passenger miles traveled to meet Federal Transit Administration’s 95% confidence and 10% precision levels for the National Transit Database. The six sampling techniques and the findings about them are relevant to any method of data collection for estimating annual passenger miles traveled through random sampling. The findings have important implications for both transit agencies and consultants as practitioners and for researchers.

The Efficiency of Sampling Techniques for NTD Reporting
17
For practitioners, the potential cost savings from using these sampling techniques is great, both for individual cases and for the transit industry as a whole. Practi-tioners should be motivated by these great potentials to consider these sampling techniques. But the actual cost savings for any specific case depends highly on the mode, the operating conditions, and the sampling technique. Practitioners should explore the actual cost savings possible for each sampling technique for their particular mode and operating conditions before deciding whether any of these sampling techniques should be used and which of them should be used.
For researchers, the paper provides the most comprehensive picture of how six modern sampling techniques may perform across a wide range of modes and operating conditions. This comprehensive picture shows that the expected improvement in sampling efficiency for certain sampling techniques can be sig-nificantly greater or significantly less than what researchers have expected from both theoretical considerations and prior limited empirical evidence. For example, estimating passenger miles traveled through ratio expansion on the basis of Relative-APTL has been hypothesized and shown with data from one agency to be more efficient than ratio expansion based on Absolute-APTL (Furth 2005). The results from 12 bus samples, 2 light rail samples, and one commuter rail sample in this paper, however, show that the relative efficiency of these two approaches also vary by mode and the operating conditions of individual cases.
Acknowledgments
The Florida Department of Transportation (FDOT) funded the research through the National Center for Transit Research at the Center for Urban Transportation Research at the University of South Florida. The author would like to thank the many agencies that contributed their sample datasets. The author wants to thank Tara Bartee of FDOT and John Giorgis of FTA for their encouragement and sup-port in developing the National Transit Database Sampling Manual. The author also thanks Peter Furth for his stimulating discussions about the sampling tech-niques and their application to NTD reporting. Comments and suggestions from anonymous reviewers on earlier versions have helped improve the paper.

Journal of Public Transportation, Vol. 12, No. 4, 2009
18
References
Cochran, W. G. 1977. Sampling Techniques, 3rd ed., John Wiley and Sons, Inc., New York.
Chu, X., and I. Ubaka. 2004. A guide to customized sampling plans for National Transit Database reporting. Journal of Public Transportation 7: 21-47.
Chu, X. 2006. Ridership accuracy and transit formula grants. Transportation Research Record 1986: 3-10.
Chu, X. 2007. Another look at FTA approved sampling plans for fixed-route bus services. Transportation Research Record 1992: 113-120.
Chu, X. 2009. Development of Comprehensive Guidance on Obtaining Service Consumed Data for NTD. Center for Urban Transportation Research, Tampa, Florida.
Federal Transit Administration. 2007. Fiscal year 2007 apportionments and alloca-tions and program information. Federal Register 72: 13872-13966.
Federal Transit Administration. 2008. 2008 Annual National Transit Database Reporting Manual. At http://www.ntdprogram.gov/ntdprogram/annual.htm, accessed on July 23, 2008. FDOT (2008), Florida Transit Information System, at http://www.ftis.org/, accessed on July 23, 2008.
Furth, P. G., and B. McCollom. 1987. Using conversion factors to lower transit data collection costs. Transportation Research Record 1144: 1-6.
Furth, P. G. 2005. Sampling and estimation techniques for estimating bus system passenger miles. Journal of Transportation and Statistics 8: 87-100.
Urban Mass Transportation Administration (UMTA). 1988a. Sampling Procedures for Obtaining Fixed Route Bus Operating Data Under the Section 15 Reporting System, Circular UMTA-C-2710.1A, U.S. Department of Transportation.
Urban Mass Transportation Administration (UMTA). 1988b. Sampling Procedures for Obtaining Demand-Responsive Bus System Operating Data Required Under the Section 15 Reporting System, Circular UMTA-C-2710.2A, U.S. Department of Transportation.
Urban Mass Transportation Administration (UMTA). 1988c. Revenue Based Sam-pling Procedures for Obtaining Fixed Route Bus Operating Data Required Under

The Efficiency of Sampling Techniques for NTD Reporting
19
the Section 15 Reporting System, Circular UMTA-C-2810.4A, U.S. Department of Transportation.
About the Author
Dr. Chu ([email protected]) is a Senior Research Associate at the Center for Urban Transportation Research at the University of South Florida in Tampa. He has a Ph.D. in economics from the University of California at Irvine. He has published widely in economics and transportation journals, including the Journal of Transport Eco-nomics and Policy, Transportation, and Transportation Research and is a referee of articles for many international journals, including the Journal of Political Economy and Transportation Science. He served on the Editorial Board of Transportation Research-Part A during 2001–2003 and currently is on the Editorial Board of the Journal of Transportation Safety and Security. He has conducted extensive research on the accuracy of service-consumed data reported to the NTD and on sampling techniques, including both FTA Circular 2710.1A sampling plans and alternative sampling techniques. He has served as a qualified statistician to certify or to develop and certify alternative sampling techniques for many transit agencies for both fixed-route and vanpool services and recently proposed to the FTA the National Transit Database Sampling Manual that includes comprehensive guidance for individual transit agencies to obtain data on passenger miles traveled and unlinked passenger trips for all modes and services.