Embed Size (px)
Citation preview

Office of Budget and Policy October 2013
Transit Profiles:
NTDNational Transit Database
2012 Reporting Year
Top 50 Agencies Summary


Transit Profiles: Top 50 Agencies Summary
Table of Contents
Introduction ................................................................................................................................................... 1 Profile Details ............................................................................................................................................ 1 Sections .................................................................................................................................................... 1 Additional National Transit Database Publications ................................................................................. 2
Top 50 Reporting Agencies for Report Year 2012 ....................................................................................... 3
2012 National Transit Profile Summary - Top 50 Reporting Agencies ......................................................... 5
Profile Data Elements Cross-Reference to the 2012 NTD Report Location/Calculation ............................ 8
Table of Contents Page ii

Transit Profiles: Top 50 Agencies Summary
Introduction
The Transit Profiles: Top 50 Agencies Summary is one of five profiles provided in the National Transit Database (NTD) Annual Report. This volume provides an aggregate profile of the Top 50 reporting agencies filing an NTD Annual Report for 2012. The Top 50 agencies were determined from unlinked passenger trips. Profiles contain general, financial, and modal data, as well as performance and trend indicators.
For the 2012 report year, 820 transit agencies submitted reports:
• 542 agencies submitted full reports,• 243 agencies submitted Small Systems Waivers (SSW’s), and• 35 agencies received other waivers for detailed reporting (Reporting, Planning and Capital
Waivers).
786 agencies, the total full and SSW reporters, are included in the 2012 NTD database. Agencies that qualified for the SSW operate thirty or fewer vehicles across all modes and types of service (TOS).
Profile Details
There are no reporting changes for the 2012 Report Year.
General information includes urbanized area (UZA) statistics, service area statistics, service consumption (system wide), service supplied (system wide) and vehicles operated in maximum service (VOMS).
Financial information includes fare revenues earned, fare revenues applied to operations, sources of operating funds expended, summary of operating expenses (OE), sources of capital funds expended and uses of capital funds. Two pie charts graphically depict sources of operating funds expended and capital funds expended. The remainder of the profile presents information separated by mode.
Please note:
• Bus (MB) and heavy rail (HR) always appear first and second if operated by an agency.• Operating expenses (OE), fare revenues, and services supplied and consumed by mode do not
include purchased transportation (PT) data reported by the sellers of service.• Fixed Guideway directional route miles (FG DRM) include the total DRM at the agency’s fiscal
year end (FYE). FG segments used by more than one agency are included for each agencyreporting the segments.
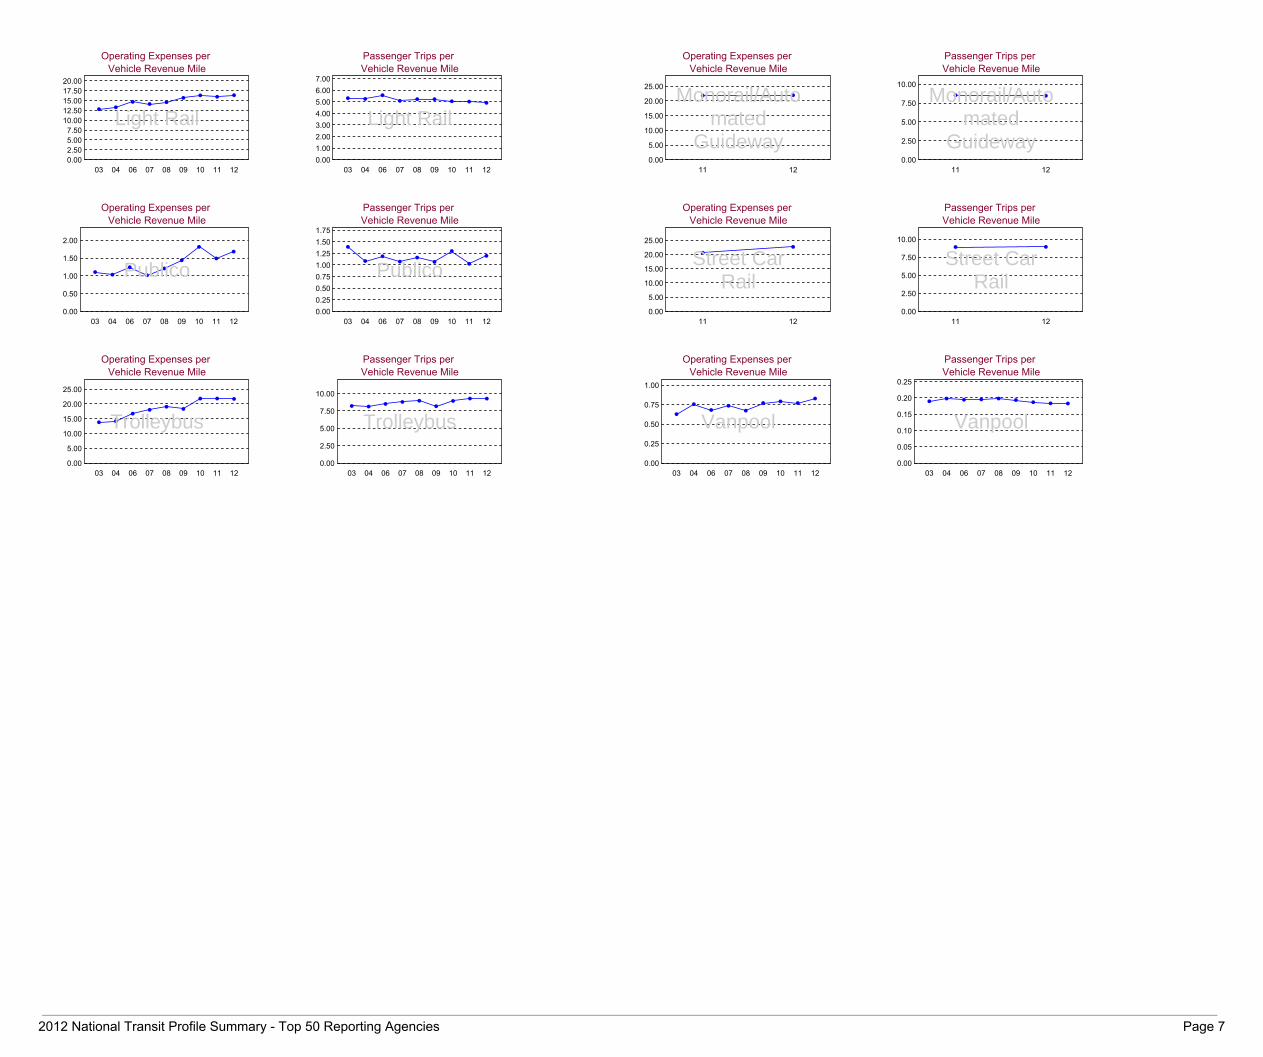
• Performance measures are derived from individual mode characteristics and represent costefficiency, cost effectiveness, and service effectiveness. Graphs highlight selected performancemeasures over the prior ten years for the modes shown in lines one and two.
Anomalies may exist in these graphs as the result of a report not received, a waiver granted, data deleted after validation, or data deemed questionable in a particular year.
Sections
• Full Reporting Agencies for Report Year 2012 – This section lists all transit agencies completing afull NTD report in the 2012 database.
• Top 50 Agencies for Report Year 2012 – This section lists the top 50 transit agencies based onunlinked passenger trips filing an NTD report in the 2012 database.
• 2012 National Transit Profile Summary – Top 50 Reporting Agencies – This section provides anaggregate summaries of top 50 reporter data collected during the 2012 Report Year.
• Profile Data Elements Cross-Reference – This section provides a cross-reference identifying
Introduction Page 1

Transit Profiles: Top 50 Agencies Summary
where each data item in the profiles can be located in an agency’s National Transit Database report, as well as the algorithms used in determining these items.
Additional National Transit Database Publications
• Historical Data Files
• Annual Data Tables
• Annual Databases
• Annual National Transit Summaries and Trends (NTST)
Introduction Page 2

Transit Profiles: Top 50 Agencies Summary
Top 50 Reporting Agencies for Report Year 2012
0001 King County Department of Transportation - Metro Transit Division
0008 Tri-County Metropolitan Transportation District of Oregon
0040 Central Puget Sound Regional Transit Authority
1003 Massachusetts Bay Transportation Authority
2004 Niagara Frontier Transportation Authority
2008 MTA New York City Transit
2076 Westchester County Bee-Line System
2078 Metro-North Commuter Railroad Company, dba: MTA Metro-North Railroad
2080 New Jersey Transit Corporation
2098 Port Authority Trans-Hudson Corporation
2100 MTA Long Island Rail Road
2188 MTA Bus Company
2206 Nassau Inter County Express
3019 Southeastern Pennsylvania Transportation Authority
3022 Port Authority of Allegheny County
3030 Washington Metropolitan Area Transit Authority
3034 Maryland Transit Administration
3051 Ride-On Montgomery County Transit
4008 Charlotte Area Transit System
4022 Metropolitan Atlanta Rapid Transit Authority
4029 Broward County Transit Division
4034 Miami-Dade Transit
4035 Central Florida Regional Transportation Authority
4105 Puerto Rico Highway and Transportation Authority PRHTA
5008 Milwaukee County Transit System
5015 The Greater Cleveland Regional Transit Authority
5027 Metro Transit
5066 Chicago Transit Authority
5113 Pace - Suburban Bus Division
5118 Northeast Illinois Regional Commuter Railroad Corporation dba: Metra Rail
5119 City of Detroit Department of Transportation
6008 Metropolitan Transit Authority of Harris County, Texas
6011 VIA Metropolitan Transit
6048 Capital Metropolitan Transportation Authority
6056 Dallas Area Rapid Transit
Top 50 Reporting Agencies for Report Year 2012 Page 3

Transit Profiles: Top 50 Agencies Summary
7006 Bi-State Development Agency of the Missouri-Illinois Metropolitan District, d.b.a.(St. Louis) Metro
8001 Utah Transit Authority
8006 Denver Regional Transportation District
9002 City and County of Honolulu Department of Transportation Services
9003 San Francisco Bay Area Rapid Transit District
9013 Santa Clara Valley Transportation Authority
9014 Alameda-Contra Costa Transit District
9015 San Francisco Municipal Railway
9019 Sacramento Regional Transit District
9023 Long Beach Transit
9026 San Diego Metropolitan Transit System
9032 City of Phoenix Public Transit Department dba Valley Metro
9036 Orange County Transportation Authority
9045 Regional Transportation Commission of Southern Nevada
9154 Los Angeles County Metropolitan Transportation Authority dba: Metro
Top 50 Reporting Agencies for Report Year 2012 Page 4

2012 National Transit Profile Summary - Top 50 Reporting Agencies
General Information (Millions)
Service Consumption Annual Unlinked Trips
Service Supplied Annual Vehicle Revenue Miles Annual Vehicle Revenue Hours Vehicles Operated in Maximum Service
8,704.8
2,521.3170.1
66,566
Financial Information (Millions)
Fare Revenues EarnedSources of Operating Funds Expended Fare Revenues (36%) Local Funds (26%) State Funds (27%) Federal Assistance (6%) (***) Other Funds (5%)Total Operating Funds ExpendedSources of Capital Funds Expended Local Funds (34%) State Funds (11%) Federal Assistance (41%) (***) Other Funds (13%)Total Capital Funds Expended
$11,598.3
$11,501.3$8,360.8$8,796.6$1,904.5$1,657.7
$32,221.0
$4,647.9$1,535.5$5,577.5$1,744.3
$13,505.3
Summary Operating Expenses (Millions)
Total Operating Expenses 0.0
Sources ofOperating Funds Expended
Sources ofCapital Funds Expended
Vehicles Operated in Maximum Service and Uses of Capital Funds Performance Measures
ModeDirectly
OperatedPurchased
Transportation Total
OperatingExpense per
VehicleRevenue
Mile
OperatingExpense per
VehicleRevenue
Hour
OperatingExpense per
UnlinkedPassenger Trip
UnlinkedPassenger Trips
per VehicleRevenue
Mile
UnlinkedPassenger Trips
per VehicleRevenue
Hour
Bus 25,400 3,339 $2,661.9 $12.8 $144.0 $3.5 3.7 41.6Heavy Rail 9,047 0 $5,242.0 $10.9 $217.4 $1.8 5.9 118.1Commuter Rail 4,852 649 $2,352.4 $15.5 $501.3 $10.3 1.5 48.6Demand Response 817 8,862 $52.1 $5.4 $74.0 $42.1 0.1 1.8Demand Response - Taxi 0 2,618 $0.6 $4.0 $38.6 $23.5 0.2 1.6Light Rail 1,301 42 $3,035.0 $16.4 $257.0 $3.3 4.9 77.1Ferryboat 0 17 $1.0 $45.7 $542.1 $7.4 6.2 73.5Trolleybus 394 0 $17.5 $21.7 $148.9 $2.3 9.3 63.6Cable Car 27 0 $4.2 $188.2 $419.8 $7.8 24.0 53.6Vanpool 2,750 2,769 $14.1 $0.8 $32.5 $4.5 0.2 7.2Monorail/Automated Gui 21 0 $9.9 $22.0 $224.0 $2.6 8.5 86.3Publico 0 2,605 $0.0 $1.7 $19.2 $1.4 1.2 13.6Inclined Plane 2 2 $0.0 $21.2 $62.6 $0.7 29.6 87.3Bus Rapid Transit 55 0 $27.2 $12.8 $156.7 $2.3 5.5 67.9Commuter Bus 464 355 $68.9 $7.4 $178.5 $6.9 1.1 25.8Street Car Rail 155 0 $16.8 $22.7 $189.2 $2.5 8.9 74.6Hybrid Rail 0 23 $1.7 $31.7 $733.2 $13.2 2.4 55.7Total 45,285 21,281 $13,505.3
Modal Characteristics
Mode
OperatingExpenses(Millions)
FareRevenues(Millions)
Uses ofCapitalFunds
(Millions)
Annual VehicleRevenue Miles
(Millions)
Annual UnlinkedTrips (Millions) Annual Vehicle
Revenue Hours
AverageFleet Age
in Years
VehiclesOperated in
MaximumService
Bus $13,300.0 $3,926.8 $2,661.9 1,036.5 3,841.1 92.4 7.8 28,739Heavy Rail $6,839.9 $4,469.9 $5,242.0 629.2 3,714.9 31.5 19.6 9,047Commuter Rail $4,374.8 $2,308.9 $2,352.4 281.4 424.5 8.7 19.6 5,501Demand Response $1,647.3 $96.1 $52.1 307.0 39.1 22.3 3.9 9,679Demand Response - Taxi $47.6 $4.2 $0.6 11.8 2.0 1.2 N/A 2,618Light Rail $1,444.6 $425.4 $3,035.0 88.3 433.6 5.6 13.9 1,343Ferryboat $22.4 $15.5 $1.0 0.5 3.0 0.0 17.8 17Trolleybus $226.5 $87.9 $17.5 10.4 96.7 1.5 12.3 394Cable Car $57.0 $27.9 $4.2 0.3 7.3 0.1 104.4 27Vanpool $76.1 $52.8 $14.1 91.9 16.8 2.3 3.7 5,519Monorail/Automated Gui $23.6 $0.0 $9.9 1.1 9.1 0.1 7.4 21Publico $46.0 $44.9 $0.0 27.3 32.7 2.4 N/A 2,605Inclined Plane $0.9 $1.8 $0.0 0.0 1.2 0.0 138.5 4Bus Rapid Transit $30.9 $4.8 $27.2 2.4 13.4 0.2 5.7 55Commuter Bus $205.0 $91.5 $68.9 27.6 29.6 1.1 7.1 819Street Car Rail $91.1 $34.8 $16.8 4.0 35.9 0.5 41.8 155Hybrid Rail $49.1 $5.1 $1.7 1.5 3.7 0.1 11.3 23Total $28,482.7 $11,598.3 $13,505.3 2,521.3 8,704.8 170.1 66,566
(*) Includes some double-counting for bus mode. These are the fixed-guideway miles at the agency's fiscal year end for all levels of service (A through F).(**) Includes Federal capital funds used to pay for operating expenses. (***) Includes capital funds used to pay for capital projects.(****) Average UPT values not available for DT Demand Response Taxi.
2012 National Transit Profile Summary - Top 50 Reporting Agencies Page 5

AutomatedGuideway
AutomatedGuideway
Bus RapidTransit
Bus RapidTransit
CommuterBus
CommuterBus
DemandResponse
DemandResponse
Ferryboat Ferryboat
Hybrid Rail Hybrid Rail
Bus Bus
Cable Car Cable Car
CommuterRail
CommuterRail
DemandResponse -
Taxi
DemandResponse -
Taxi
Heavy Rail Heavy Rail
InclinedPlane
InclinedPlane
2012 National Transit Profile Summary - Top 50 Reporting Agencies Page 6
Light Rail Light Rail
Publico Publico
Trolleybus Trolleybus
Monorail/Automated
Guideway
Monorail/Automated
Guideway
Street CarRail
Street CarRail
Vanpool Vanpool
2012 National Transit Profile Summary - Top 50 Reporting Agencies Page 7

Transit Profiles: Top 50 Agencies Summary
Profile Data Elements Cross-Reference to the 2012 NTD Report Location/Calculation The information contained in the preceding exhibits is derived from the data reported by agencies to the National Transit Database. The profile summary data, including all agencies and individual agency summaries, were determined from the following locations on the Annual NTD Report:
Profile Data Point Profile Summary Section Module and Form Line Item (Calculation)
ID Number Basic Agency NTD Internet Reporting – Forms Summary
NTD ID
Website Basic Agency Basic: B-10 Line 01 Transit Agency Identification Information: URL
Address Basic Agency Basic: B-10 Line 01 Transit Agency Identification Information: Mailing address
Agency Name Basic Agency Basic: B-10 Line 01 Transit Agency Identification Information: Agency name
CEO Name and Phone Number
Basic Agency Basic: B-20 Line 01 Transit Agency Identification Information: Honorific, First name, Initial, Last name, Phone, Ext.
Square Miles General Information Basic: B-10 Primary UZA information
Population General Information Basic: B-10 Primary UZA information
Population Ranking out of UZAs
General Information Basic: B-10 Line 05 Demographic Information: Primary UZA
Other UZAs Served General Information Basic: B-10 Line 05 Demographic Information: Available Secondary UZA/Non-UZA(s)
Square Miles Service Area Statistics Basic: B-10 Line 05 Demographic Information: Square Miles
Population Service Area Statistics Basic: B-10 Line 05 Demographic Information: Population
Annual Unlinked Trips Service Consumption Service: S-10 The sum of all modal annual unlinked trips
Line 18 Column D: Unlinked Passenger Trips
Profile Data Elements Cross-Reference to the 2012 NTD Report Location/Calculation Page 8

Transit Profiles: Top 50 Agencies Summary
Profile Data Point Profile Summary Section Module and Form Line Item (Calculation)
Annual Passenger Miles Service Consumption Service: S-10 The sum of all modal annual passenger miles
Rail Modes
Line 20 Column D: Passenger Miles (PM)
Non-Rail Modes
Line 20 Column D: Passenger Miles Traveled (PMT)
Average Weekday Unlinked Trips
Service Consumption Service: S-10 The sum of all modal weekday unlinked trips
Line 18 Column A: Average Weekday Schedule Unlinked Passenger Trips
Average Saturday Unlinked Trips
Service Consumption Service: S-10 The sum of all modal Saturday unlinked trips
Line 18 Column B: Average Saturday Schedule Unlinked Passenger Trips
Average Sunday Unlinked Trips
Service Consumption Service: S-10 The sum of all modal Sunday unlinked trips
Line 18 Column C: Average Sunday Schedule Unlinked Passenger Trips
Annual Vehicle Revenue Miles
Service Supplied Service: S-10 The sum of all modal annual vehicle revenue miles
Rail Modes
Line 12 Column D: Total Actual Passenger Car Revenue Miles
Non-Rail Modes
Line 12 Column D: Total Actual Vehicle Revenue Miles (VRM)
Annual Vehicle Revenue Hours
Service Supplied Service: S-10 The sum of all modal annual vehicle revenue hours
Rail Modes
Line 15 Column D: Total Actual Passenger Car Revenue Hours
Non-Rail Modes
Line 15 Column D: Total Actual Vehicle Revenue Miles (VRH)
Vehicles Available for Maximum Service
Service Supplied cont. Service: S-10 Line 02 Vehicles available for annual maximum service
Base Period Requirement
Service Supplied cont. Service: S-10 The smallest value in Line
06: Vehicles in Operation
Profile Data Elements Cross-Reference to the 2012 NTD Report Location/Calculation Page 9

Transit Profiles: Top 50 Agencies Summary
Profile Data Point Profile Summary Section Module and Form Line Item (Calculation)
Fare Revenues Earned Financial Information Financial: F-10 The sum of all modal passenger fares
Line 2 Column C: Total All Directly Operated Modes plus Line 04 Column C: Total All Purchased Transportation Modes
Fare Revenues Sources of Operating Funds Expended
Financial: F-10 The sum of all modal passenger fares spent on operations
Line 2 Column D: Total All Directly Operated Modes plus Line 04 Column D: Total All Purchased Transportation Modes
Local Funds Sources of Operating Funds Expended
Financial: F-10 Line 43 Total Local Funds
State Funds Sources of Operating Funds Expended
Financial: F-10 Line 56 Total State Funds
Federal Assistance Sources of Operating Funds Expended
Financial: F-10 Line 76 Total Federal Funds
Other Funds Sources of Operating Funds Expended
Financial: F-10 Line 30 Column D: Total Directly Generated Funds minus Line 02 Column D: Total All Directly Operated Modes minus Line 04 Column D: Total All Purchased Transportation
Total Operating Funds Expended
Sources of Operating Funds Expended
Financial: F-10 The sum of:
Fare Revenues
Local Funds
State Funds
Federal Assistance
Other Funds
Local Funds Sources of Capital Funds Expended
Financial: F-10 Line 43 Column E: Total Local Funds
State Funds Sources of Capital Funds Expended
Financial: F-10 Line 56 Column E: Total State Funds
Federal Assistance Sources of Capital Funds Expended
Financial: F-10 Line 76 Column E: Total Federal Funds
Other Funds Sources of Capital Funds Expended
Financial: F-10 The sum of Directly Generated Funds minus the Total Passenger Fares.
Line 30 Column E: Total Directly Generated Funds minus Line 02 Column E: Total All Directly Operated Modes minus Line 04 Column D: Total All Purchased Transportation
Profile Data Elements Cross-Reference to the 2012 NTD Report Location/Calculation Page 10

Transit Profiles: Top 50 Agencies Summary
Profile Data Point Profile Summary Section Module and Form Line Item (Calculation)
Total Capital Funds Expended
Sources of Capital Funds Expended
Financial: F-10 Line 80 Column E: Total Funds Expended on Capital during the Period
Salary, Wages, Benefits Summary Operating Expenses
Financial: F-40 The sum of:
Line 01 Column E: Operator’s Salaries and Wages
Line 02 Column E: Other Salaries and Wages
Line 03 Column E: Fringe Benefits The sum of:
Materials and Supplies Summary Operating Expenses
Financial: F-40 The sum of:
Line 05 Column E: Fuel and Lubricants
Line 06 Column E: Tires and Tubes
Line 07 Column E: Other Materials and Supplies
Purchased Transportation
Summary Operating Expenses
Financial: F-40 The sum of:
Line 11 Column E: In Report
Line 12 Column E: Filing Separate Report
Other Operating Expenses
Summary Operating Expenses
Financial: F-40 The sum of:
Line 04 Column E: Services
Line 08 Column E: Utilities
Line 09 Column E: Casualty and Liability Costs
Line 10 Column E: Taxes
Line 13 Column E: Miscellaneous Expenses
Line 14 Column E: Expenses Transfers
Total Operating Expenses
Summary Operating Expenses
Financial: F-40 Line 15 Column E: Total Modal Expenses
Reconciling Cash Expenditures
Summary Operating Expenses
Financial: F-40 Line 23 Column a: Other Reconciling Items
Directly Operated Vehicles Operated in Maximum Service and Uses of Capital Funds
Basic: B-10 Line 06: Enter Number of Vehicles Operated in Annual Maximum Service by Mode and Types of Service – Directly Operated Modes
Profile Data Elements Cross-Reference to the 2012 NTD Report Location/Calculation Page 11

Transit Profiles: Top 50 Agencies Summary
Profile Data Point Profile Summary Section Module and Form Line Item (Calculation)
Purchased Transportation
Vehicles Operated in Maximum Service and Uses of Capital Funds
Basic: B-10 Line 06: Enter Number of Vehicles Operated in Annual Maximum Service by Mode and Types of Service – Purchased Transportation Modes
Revenue Vehicles Vehicles Operated in Maximum Service and Uses of Capital Funds
Financial: F-20 Column E: Revenue Vehicles
Systems and Guideways Vehicles Operated in Maximum Service and Uses of Capital Funds
Financial: F-20 The sum of:
Column A: Guideway Column G: Fare Revenue Collection Equipment Column H: Communication/Information Systems
Facilities and Stations Vehicles Operated in Maximum Service and Uses of Capital Funds
Financial: F-20 The sum of:
Column B: Passenger Stations
Column C: Administrative Buildings
Column D: Maintenance Buildings
Other Vehicles Operated in Maximum Service and Uses of Capital Funds
Financial: F-20 Column I: Other
Total Vehicles Operated in Maximum Service and Uses of Capital Funds
Financial: F-20 Column J: Total All Uses of Capital – Total
Operating Expense per Vehicle Revenue Mile
Performance Measures Financial: F-30 & Service: S-10
Total Modal Expenses divided by passenger miles
F-30 Line 15 Column E: Total Modal Expenses divided by
Rail modes
S-10 Line 12 Column D: Total actual passenger car revenue miles
Non-rail modes
S-10 Line 12 Column D: Total actual vehicle revenue miles (VRM)
Profile Data Elements Cross-Reference to the 2012 NTD Report Location/Calculation Page 12

Transit Profiles: Top 50 Agencies Summary
Profile Data Point Profile Summary Section Module and Form Line Item (Calculation)
Operating Expense per Vehicle Revenue Hour
Performance Measures Financial: F-30 & Service: S-10
Total Modal Expenses divided by passenger miles
F-30 Line 15 Column E: Total Modal Expenses divided by
Rail modes
S-10 Line 15 Column D: Total actual passenger car revenue hours
Non-rail modes
S-10 Line 15 Column D: Total actual vehicle revenue hours (VRH)
Operating Expense per Passenger Mile
Performance Measures Financial: F-30 & Service: S-10
Total Modal Expenses divided by passenger miles
F-30 Line 15 Column E: Total Modal Expenses divided by
Rail modes
S-10 Line 20 Column D: Passenger miles (PM)
Non-rail modes
S-10 Line 20 Column D: Passenger miles traveled (PMT)
Operating Expense per Unlinked Passenger Trip
Performance Measures Financial: F-30 & Service: S-10
Total Modal Expenses divided by unlinked passenger trips
F-30 Line 15 Column E: Total Modal Expenses divided by S- 10 Line 18 Column D: Unlinked passenger trips
Trips per Vehicle Revenue Mile
Performance Measures Service: S-10 Unlinked passenger trips divided by vehicle revenue miles
Line 18 Column D: Unlinked passenger trips divided by
Rail modes
Line 12 Column D: Total actual passenger car revenue miles
Non-rail modes
Line 12 Column D: Total actual vehicle revenue miles (VRM)
Profile Data Elements Cross-Reference to the 2012 NTD Report Location/Calculation Page 13

Transit Profiles: Top 50 Agencies Summary
Profile Data Point Profile Summary Section Module and Form Line Item (Calculation)
Unlinked Passenger Trips per Vehicle Revenue Hour
Performance Measures Financial: F-30 & Service: S-10
Unlinked passenger trips divided by vehicle revenue miles
Line 18 Column D: Unlinked passenger trips divided by
Rail modes
S-10 Line 15 Column D: Total actual passenger car revenue hours
Non-rail modes
S-10 Line 15 Column D: Total actual vehicle revenue hours (VRH)
Operating Expenses Modal Characteristics Financial: F-30 The modal total expenses minus purchased transportation reported separately
Line 15 Column E: Total Expenses minus Line 12 Column E
Fare Revenues Modal Characteristics Financial: F-10 The sum of all modal passenger fares
Line 01 Column C: Passenger Fares for Directly Operated Service plus Line 03 Column C: Passenger Fares for Purchased Transportation Service
Uses of Capital Funds Modal Characteristics Financial: F-20 Column J: Total All Uses of Capital
Annual Vehicle Revenue Miles
Modal Characteristics Service: S-10 Rail modes
Line 12 Column D: Total actual passenger care revenue miles
Non-rail modes
Line 12 Column D: Total actual vehicle revenue miles (VRM)
Annual Unlinked Trips Modal Characteristics Service: S-10 Line 18 Column D: Unlinked passenger trips
Annual Vehicle Revenue Hours
Modal Characteristics Service: S-10 Rail modes
Line 15 Column D: Total passenger care revenue hours
Non-rail modes
Line 15 Column D: Total actual vehicle revenue hours (VRH)
Fixed Guideway Directional Route Miles
Modal Characteristics Service: S-20 Line 05: Total controlled and exclusive right-of-way (ROW) @ FYE
Vehicle Available for Maximum Service
Modal Characteristics Service: S-10 Line 02: Vehicle available for maximum service
Profile Data Elements Cross-Reference to the 2012 NTD Report Location/Calculation Page 14

Transit Profiles: Top 50 Agencies Summary
Profile Data Point Profile Summary Section Module and Form Line Item (Calculation)
Average Fleet Age in Years
Modal Characteristics Asset: A-30
The average age of each vehicle in a mode
The current year (ex. 2012) minus Column F: Year of Manufacture divided by Column A: Number of Vehicles in Total Fleet
Vehicles Operated in Maximum Service
Modal Characteristics Basic: B-10 Line 06: Enter Number of Vehicles Operated in Annual Maximum Service by Mode and Types of Service
Peak to Base Ratio Modal Characteristics Service: S-10 Highest number of weekday peak vehicles or passenger cars in operation divided by the lowest number of weekday peak vehicles or passenger cars in operation.
Rail modes
Line 06 Columns E-H: Passenger cars in operation
Non-rail modes
Line 6 Columns E-H: Vehicles in operation
Percent Spares Modal Characteristics Service: S-10 Vehicles available for annual maximum service divided by vehicles operated in annual maximum service
Line 02: Vehicles available for annual maximum service (VAMS) divided by Line 01: Vehicles operated in annual maximum service (VOMS)
Operating Expense per Vehicle Revenue Mile
Service Efficiency Financial: F-30 & Service: S-10
Total Modal Expenses divided by passenger miles
F-30 Line 15 Column E: Total Modal Expenses divided by
Rail modes
Line 12 Column D: Total actual passenger car revenue miles
Non-rail modes
S-10 Line 12 Column D: Total actual vehicle revenue miles (VRM)
Profile Data Elements Cross-Reference to the 2012 NTD Report Location/Calculation Page 15

Transit Profiles: Top 50 Agencies Summary
Profile Data Point Profile Summary Section Module and Form Line Item (Calculation)
Operating Expense per Vehicle Revenue Hour
Service Efficiency Financial: F-30 & Service: S-10
Total Modal Expenses divided by passenger miles
F-30 Line 15 Column E: Total Modal Expenses divided by
Rail modes
Line 15 Column E: Total actual passenger car revenue hours
Non-rail modes
S-10 Line 15 Column E: Total actual vehicle revenue hours (VRH)
Operating Expense per Passenger Mile
Service Effectiveness Financial: F-30 & Service: S-10
Total Modal Expenses divided by passenger miles
F-30 Line 15 Column E: Total Modal Expenses divided by
Rail modes
S-10 Line 20 Column D: Passenger miles (PM)
Non-rail modes
S-10 Line 20 Column D: Passenger miles traveled (PMT)
Operating Expense per Unlinked Passenger Trip
Service Effectiveness Financial: F-30 & Service: S-10
Total Modal Expenses divided by unlinked passenger trips
F-30 Line 15 Column E: Total Modal divided by S-10 Line 18 Column D: Unlinked passenger trips
Unlinked Passenger Trips per Vehicle Revenue Mile
Service Effectiveness Service: S-10 Unlinked passenger trips divided by vehicle revenue miles
Line 18 Column D: Unlinked passenger trips (UPT) divided by
Rail modes
Line 12 Column D: Total actual passenger car revenue miles
Non-rail modes
Line 12 Column D: Total actual vehicle revenue miles (VRM)
Profile Data Elements Cross-Reference to the 2012 NTD Report Location/Calculation Page 16

Transit Profiles: Top 50 Agencies Summary
Profile Data Point Profile Summary Section Module and Form Line Item (Calculation)
Unlinked Passenger Trips per Vehicle Revenue Hour
Service Effectiveness Service: S-10 Unlinked passenger trips divided by vehicle revenue hours
Line 18 Column D: Unlinked passenger trips (UPT) divided by
Rail modes
Line 15 Column D: Total actual passenger car revenue hours
Non-rail modes
Line 15 Column D: Total actual vehicle revenue hours (VRH)
Profile Data Elements Cross-Reference to the 2012 NTD Report Location/Calculation Page 17