Embed Size (px)
Citation preview

1
The Effects of Silicone Contamination on Bond Performance of Various Bond Systems
G. L. Anderson, S. D. Stanley, G. L. Young, R. A. Brown, K. B. Evans, and L. A. Wurth
Huntsville Space Operations
ATK Aerospace Systems
620 Discovery Drive, Building 2, Suite 200
Huntsville, AL 35806
e-mail: [email protected]
Tel.: (256) 428-5849
FAX: (256) 544-0857
Key Words: contamination sensitivity, silicone contamination, epoxy, pressure sensitive
adhesive, vulcanizing agents, tensile adhesion, peel adhesion, fracture energy, silane
adhesion promoter
Abstract
The sensitivity to silicone contamination of a wide variety of adhesive bond systems is
discussed. Generalizations regarding factors that make some bond systems more
sensitive to contamination than others are inferred and discussed. The effect of silane
https://ntrs.nasa.gov/search.jsp?R=20120016452 2018-05-27T13:00:15+00:00Z

2
adhesion promoting primer on the contamination sensitivity of two epoxy/steel bond
systems is also discussed.
Introduction
Silicone contamination of bond surfaces has long been a concern in bonding operations.
Although silicone-based adhesives and sealants are used in many bond applications, low-
molecular-weight silicone oils on bond surfaces can inhibit or preclude adhesive-to-
substrate contact required to achieve strong adhesion. The high lubricity and chemical
and thermal stability of silicones make silicone oil or grease an outstanding lubricant in
many production processes where they can be a significant source of bond contamination.
An additional source of silicone contamination in many instances is processing and
support materials that are often fabricated using processes where silicone is used
extensively.
Considerable effort has been made to investigate detection methods for silicone
contamination [1-3] and cleaning of contamination [4, 5] from bond surfaces. The open
literature regarding sensitivity of adhesive bond systems to contamination is sparse [6, 7].
The sensitivity of bond performance can change depending on the performance test
employed to measure the sensitivity with fracture tests typically yielding greater
sensitivity than strength tests [8]. The use of a silane adhesion promoting primer has
been shown to significantly reduce the sensitivity of an epoxy adhesive bond to steel

3
substrates contaminated with low-level hydrocarbon grease [8]. There are also adhesive
systems that are formulated to be insensitive to silicone contamination [9].
This manuscript details the test methods and equipment used to perform bond system
contamination studies and the results of a program investigating the sensitivity of a wide
variety of bond systems to silicone contamination. General conclusions regarding the
sensitivity of various substrate/adhesive systems to silicone contamination are presented.
A separate study is also discussed that significantly increased the understanding of the
use of silane adhesion promoting primer in reducing the sensitivity of the most sensitive
bonds to silicone contamination.
Experimental
Bond System and Contamination Materials
A wide variety of bond systems was tested in the general study. The epoxy adhesives
used for the study include three major types. Two commercially available fiber-filled
epoxies with glass transition temperatures greater than ambient temperature were tested
(referred to as Epoxy A and Epoxy B). A cork-filled epoxy (Epoxy C) and an in-house
formulated fiber-filled epoxy with a room temperature glass transition were also tested
(Epoxy D). The adhesion of an epoxy-polyamide paint used with an epoxy-polyamide
primer (Paint A) and a polyurethane paint (Paint B) were also tested. Two vulcanized
bond systems were tested for sensitivity to silicone contamination on steel substrate bond
surfaces. Both systems contained a primer and an adhesive (VA-1 and VA-2). The

4
second of the two systems contained a solvated natural rubber topcoat. Finally, a
pressure sensitive adhesive was also tested.
The bond substrates to which the silicone contamination was applied were numerous.
The tested metals included D6AC steel, 304 stainless steel, Inconel®, and 7075
aluminum. Painted D6AC steel was also a tested substrate. Three different paints were
tested in this manner: Paint A and Paint B previously described and a urethane paint
system (Paint C). The tested elastomeric insulation materials included cured silica fiber
(SF) and carbon fiber (CF) filled ethylene propylene diene monomer (EPDM) rubber,
asbestos fiber (AF) and SF filled nitrile butadiene rubber (NBR), and natural rubber
(NR). Three non-elastomeric ablative insulation material substrates were also tested:
graphite, carbon-cloth phenolic (CCP) and glass-cloth phenolic (GPC).
Not every adhesive/substrate system was tested. All combinations used in production
bonds were considered, and testing was limited to systems where bond failure could have
catastrophic consequences to the overall structure. The 21 combinations that were tested
are shown in Table I. The cleaning process used for each system was the baseline
production surface preparation process. Thus, the post-clean bond performance is an
indication of the effect of silicone contamination occurring prior to bond surface
preparation. Also shown in Table I are the adhesive cure temperatures used in this study
The surface preparations used were quite varied. Solvent wipes were accomplished by
wiping the surface with solvent-dampened low-lint polyester knit cloth followed by a dry

5
wipe using the same cloth. A 30-minute minimum dry time was instituted following all
solvent wiping operations. Detergent washing was performed using commercially
available industrial washers. The detergent used was a 10-percent aqueous solution of a
commercially available mixture of detergents, sodium triphosphate (a corrosion
inhibitor), and anti-foaming surfactants. The detergent solution is alkaline with pH
between 9.5 to 10.5. The solution is heated to 77 ± 5°C prior to use, and the wash
operation is followed by two separate deionized water rinses to remove all trace of
surfactant from the bond surfaces. Sodium metasilicate is added to the final rinse water
to inhibit corrosion of the steel substrates. Surface preparation by abrasion was
performed by hand using 180-grit sandpaper or emery cloth. The grit blast operation was
performed at 0.4 MPa (running pressure) and a stand-off distance of 3 cm. The grit
media used was staurolite sand.
Several solvents were used in the preparation of the various bond substrate surfaces. One
is commercial solvent made up principally of 1-methyl-4-(1-methylethenyl)-cyclohexane,
propanol, and 1-T-butoxy-2-propanol (SOLV-1). Another is a commercial solvent
mixture of paraffin-based hydrocarbons and d-limonene (SOLV-2). A third consists
mainly of mineral spirits (SOLV-3). Methyl ethyl ketone (MEK), trichloroethane (TCA),
and isopropyl alcohol (IPA) were also used. The solvent used with any given material
system coincides with that used in an equivalent production operation.
The silicone used as the contaminant for these experiments was a 1000-cs viscosity
polydimethyl siloxane oil. In order to apply the contaminant at low levels for this testing

6
the silicone oil was diluted in an n-propyl bromide-based solvent. The solvent was the
best of five solvents tested in preliminary process development efforts for keeping the
silicone in solution. The solution was constantly stirred until fed into the spray system.
The second study used to more fully investigate the effect of cure temperature and the use
of silane adhesion promoting primers used the two commercially available epoxy
adhesives, Epoxy A and Epoxy B, cured at a variety of temperatures. The silane primer
used is a mixture of 40 weight percent cyclohexane, 40 weight percent absolute ethanol,
and 5 weight percent each of n-butanol, 2-butoxyethanol, distilled/deionized water, and γ-
glycidoxy-propyltrimethoxy silane. To this mixture 0.3 weight percent acetic acid is
added. The mixture is allowed a minimum of 7 days at 21 ± 2°C before use in order to
allow the acidified solution to hydrolyze the methoxy end groups of the silane.
Application of Silicone Contamination
Silicone contamination was applied to the bond surfaces of the substrates following
surface preparations representative of a given production process. The application was
accomplished using a SonoFlux 9500 ultrasonic spray system manufactured by Sono-Tek
Corporation. The diluted silicone contaminant is supplied to the spray assembly from a
closed reservoir by a positive displacement gear pump. The contaminant is atomized into
a fine mist at the tip of the non-clogging, large-orifice ultrasonic nozzle where it is then

7
dispersed horizontally to the correct width by low-pressure compressed air before being
propelled onto the prepared bond surface by a turbulent stream of air.
The target level for the silicone contamination was 108 ± 11 mg/m2. This target level
was selected to represent the high end of the amount of silicone that can transfer from
processing materials to substrates during normal manufacturing operations.
Measurement of the silicone level was performed using the average of gravimetric
measurements from witness foils that preceded and followed each contamination
application. The vast majority of the measured levels were in the 104 to 112 mg/m2
range. Contamination uniformity has been shown visually by using the spray system to
apply dye penetrant, then examining the coated surface under ultraviolet light. The
reproducibility of the panel-to-panel test results and the low variability of the bond
performance results from within a given bond system also evidence the uniformity of the
contamination application.
Processes
The overall process flow was as follows:
1) The substrate bond surfaces were cleaned and prepared prior to spray application
of the silicone contamination.

8
2) Silicone was applied at a level of 108 mg/m2 for the general studies and a level of
22 mg/m2 for the follow-on study.
3) The silicone was allowed to stage on the bond surface for three to five days at
laboratory-ambient temperature (21 ± 2°C) prior to proceeding. In cases used as
control samples in which no contamination was applied, the bond substrates were
staged for an equivalent amount of time in a clean environment held to
approximately 50 percent relative humidity (RH).
4) Following the staging, half of the contaminated samples were cleaned using the
same process as prior to contamination application.
5) The samples were bonded and tested.
Testing
The majority of the bond systems were tested for tensile adhesion strength using a tensile
button-to-plate configuration (see Figure 1). The plate (20 cm by 30 cm) in this
configuration was the test surface serving as the control or contaminated surface as
desired. The adhesive/plate bond was the desired test interface and is referred to
hereafter as the primary bond.
In many instances, the plate was a composite of cured rubber or paint over the base metal
plate. In all instances, the secondary bond of the composite plates (paint or rubber to the
plate) was created in such a way (either by ensuring best practices in the bonding
operations or geometrically increasing the bond area of the secondary bond in

9
comparison to the primary or tested bond) to preclude secondary bond failures. The
buttons bonded to the plates were all made of D6AC steel, and the button surfaces were
also treated using best practices to preclude a secondary bond failure at the
button/adhesive interface. In no case was secondary bond failure observed.
For statistical purposes, three separate plates were prepared per sample set, contaminated
as appropriate and bonded using twelve buttons for each panel. Within plate bond
performance, variation (as calculated by the standard deviation) was typically less than
10 percent of the median tensile adhesion strength of the plate for control, contaminated,
and contaminated and cleaned samples. The median tensile adhesion strength value for
each plate was used as the value most representative of the plate bond performance. Each
of the three plates was contaminated separately, although the bonding of all three plates
was performed using the same adhesive mix. Thus, the variation of tensile adhesion
strength among the three panels represents not only the test and process variation, but
also minor differences in the silicone contamination level.
Four other specimen geometries were used for this testing: quadruple lap shear (also
known as double strap lap shear), 90-degree peel, T-peel, and tapered double cantilever
beam (TDCB). These specimens were used because each has been shown in previous
testing to be more sensitive to material and process variation. This advantage is
somewhat counteracted by the small dimensions of the specimens, which makes them
significantly more difficult to clean and prepare for bonding in a way that would well
represent much larger production hardware.

10
Results
Many of the bond systems showed no effect in measured bond performance from 108
mg/m2 silicone contamination on the bond surface. This statement is the result of
performing analysis of variance using Tukey’s Honest Significant Difference (HSD) test
at a 95 percent confidence level. The results for these insensitive bond systems are
shown in Table II. Within the table, the coefficients of variation (CV) for the data set are
the average of the individual CV for each panel. The CV data are included to determine
if the variability in the bond performance results was affected by the silicone
contamination even for the bond systems where the performance was unaffected.
In three cases, the variability of the bond performance was significantly greater for the
contaminated samples versus the control samples even though the performance was
equivalent. In all three of these cases, the failure was 100 percent cohesive within the
substrate or the adhesive: Paint B, SF-NBR, and the pressure-sensitive adhesive (PSA).
A possible cause of the increased variability is that the silicone may be negatively
affecting the material in areas of inherent weakness near the surface to which silicone
was applied. This could cause the variability to increase without affecting the median
values of the performance.
It is of significant interest to identify commonalities among these bond systems, as those
commonalities infer generalizations regarding silicone contamination sensitivity. Most of
the substrates to which the silicone was applied prior to bonding for the insensitive bond

11
systems allow diffusion of the silicone away from the bond surface. Because the
substrates were given three to five days between application of the silicone and the
bonding operation, this staging time may have allowed diffusion of the silicone into the
substrate rather than remaining concentrated at the bond surface.
There are two exceptions to this in the results: Epoxy A bonded to Inconel and Epoxy C
bonded to 304 stainless steel. In both of these instances, the failure mode of the control
samples was almost entirely interfacial between the adhesive and the substrate, and the
bond strength was relatively low, less than half the cohesive strength of the adhesive.
These may be mitigating factors helping to explain these exceptions.
Eight bond systems demonstrated a statistically significant reduction in bond
performance due to silicone contamination. In six of the cases, there was also a shift in
the failure mode toward failure at the contaminated interface. In the other two cases, the
failure mode of the control samples was already at the interface. Table III shows the
results for these eight bond systems.
The two bond systems that did not experience a failure mode shift (Epoxy C/cured SF-
EPDM and Epoxy B/high-ply-angle GCP) also experienced the smallest performance
decreases on a percentage basis. The performance reductions of these two systems were
in the mid-thirty percent range. Two other commonalities of these bond systems were
that they have a substrate that allows silicone diffusion from the surface and they
experienced the lowest variability within the contaminated samples.
12
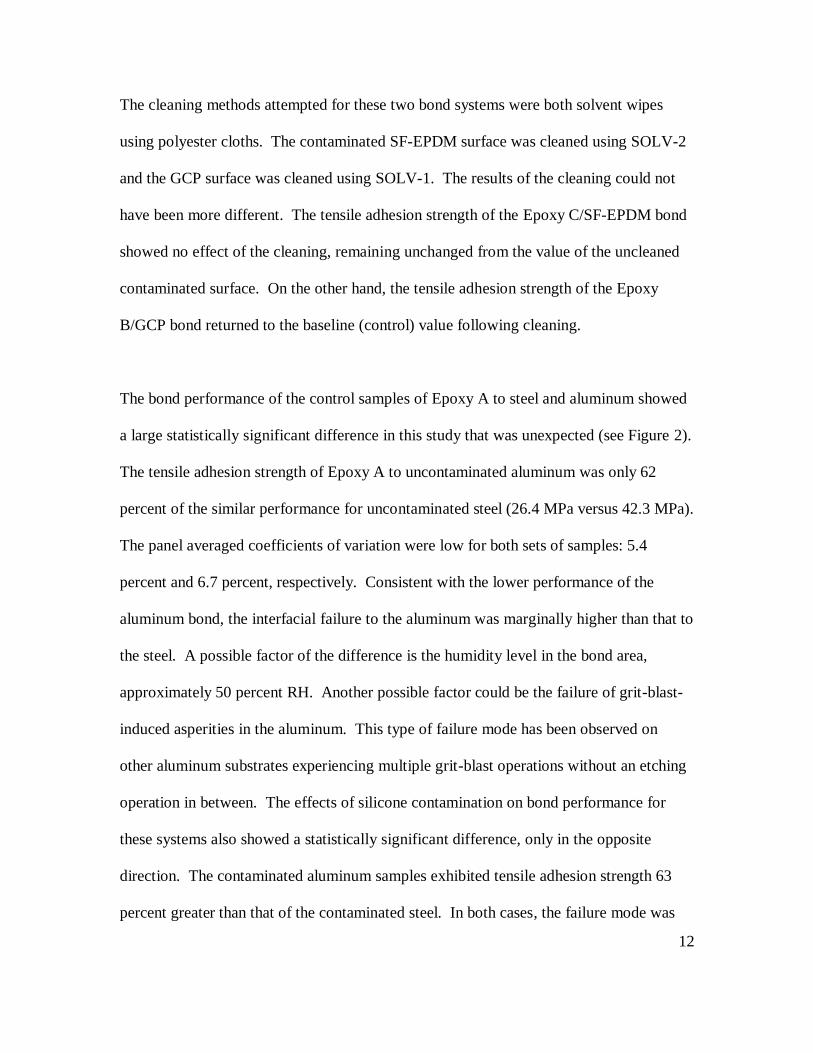
The cleaning methods attempted for these two bond systems were both solvent wipes
using polyester cloths. The contaminated SF-EPDM surface was cleaned using SOLV-2
and the GCP surface was cleaned using SOLV-1. The results of the cleaning could not
have been more different. The tensile adhesion strength of the Epoxy C/SF-EPDM bond
showed no effect of the cleaning, remaining unchanged from the value of the uncleaned
contaminated surface. On the other hand, the tensile adhesion strength of the Epoxy
B/GCP bond returned to the baseline (control) value following cleaning.
The bond performance of the control samples of Epoxy A to steel and aluminum showed
a large statistically significant difference in this study that was unexpected (see Figure 2).
The tensile adhesion strength of Epoxy A to uncontaminated aluminum was only 62
percent of the similar performance for uncontaminated steel (26.4 MPa versus 42.3 MPa).
The panel averaged coefficients of variation were low for both sets of samples: 5.4
percent and 6.7 percent, respectively. Consistent with the lower performance of the
aluminum bond, the interfacial failure to the aluminum was marginally higher than that to
the steel. A possible factor of the difference is the humidity level in the bond area,
approximately 50 percent RH. Another possible factor could be the failure of grit-blast-
induced asperities in the aluminum. This type of failure mode has been observed on
other aluminum substrates experiencing multiple grit-blast operations without an etching
operation in between. The effects of silicone contamination on bond performance for
these systems also showed a statistically significant difference, only in the opposite
direction. The contaminated aluminum samples exhibited tensile adhesion strength 63
percent greater than that of the contaminated steel. In both cases, the failure mode was

13
nearly 100 percent adhesive between the Epoxy A and the metal substrate. Because of
the significantly higher control performance and the significantly lower contaminated
performance of the Epoxy A/steel system, the percent reduction in tensile adhesion
strength for this system was nearly double that for the Epoxy A/aluminum system, 77
percent versus 40 percent.
The cleaning method used for the two Epoxy A contamination sensitive bonds was a
solvent wipe using polyester cloths dampened with SOLV-2. Given the differences in
Epoxy A/steel and Epoxy B/aluminum tensile adhesion strengths of the control and
contaminated sample sets, it is interesting to note that the contaminated and cleaned
samples exhibited virtually the same bond strengths at 18.7 to 18.8 MPa. This was an
improvement of 94 percent over the contaminated steel substrate tensile adhesion
strength and an 18 percent improvement for the aluminum bond.
The effects of silicone contamination on steel prior to priming and painting with the Paint
A system or bonding with Epoxy D adhesive were large. As shown in Figure 3, the
tensile adhesion strength reductions were 68 and 97 percent, respectively. Both systems
also experienced a complete change in failure mode, from cohesive in the paint or
adhesive to interfacial between the paint or adhesive and the contaminated steel substrate.
The Epoxy D bond strength was nearly nil after the contamination application, a 97
percent reduction for the control value. Cleaning the contaminated steel surface with a
solvent wipe using SOLV-1 dampened polyester cloth prior to bonding with Epoxy D

14
made a huge difference in the tensile adhesion strength in comparison with the
contaminated steel bond without cleaning. Where the contaminated surface yielded a
strength of only 0.8 MPa, solvent wiping the contaminated surface prior to bonding
increased the subsequent bond strength to 10.9 MPa. While this is still a 56 percent
decrease in comparison to the control tensile adhesion strength, the order of magnitude
improvement over the contaminated performance is impressive.
For the Paint A system, SOLV-2 was the solvent used to clean the silicone-contaminated
steel in a solvent wipe. The post-cleaning tensile adhesion strength showed an 83 percent
increase over the contaminated samples (14.1 MPa versus 7.7 MPa), reducing the effect
of the contamination from 68 percent to 41 percent.
The effects of contamination on Epoxy B bonds to steel and aluminum substrates were
determined using buttons bonded to panels for tensile adhesion strength and TDCBs for
bond fracture energy. The tensile adhesion strength and bond fracture energy results are
shown graphically in Figures 4 and 5, respectively. Consistent with the author’s previous
work [8], the fracture energy was affected more significantly than the bond strength.
Where the bond strengths to steel and aluminum were both reduced 65 percent, the
fracture energies were reduced 98 and 78 percent, respectively. Unlike the Epoxy A
results, the steel and aluminum control samples were statistically equivalent in the Epoxy
B study.

15
A very rigorous cleaning method was used for the Epoxy B bonds to steel and aluminum.
Contaminated samples were solvent wiped using polyester cloths dampened with SOLV-
1, then grit blasted. Even with this extensive cleaning, bond performance as measured in
terms of tensile adhesion strength and bond fracture energy was not returned to the
baseline of the control samples. The tensile adhesion strength came closest to returning
to baseline. The contaminated and cleaned samples decreased in strength only 11 and 22
percent for the steel and aluminum bonds, respectively. This compares favorably to the
65 percent reduction without the cleaning. As measured by the bond fracture energy, the
contaminated and cleaned samples still exhibited a performance decrease of 50 to 55
percent from the baseline. Although this is a huge improvement over the contaminated
samples, the decrease is still quite large considering the cleaning method used. A
possible cause of the continued bond performance reduction even after grit blasting is
that a small fraction of the grit media gets embedded into the metal surface during the
blasting operation. The embedded grit media likely entraps silicone beneath it that can
spread over time onto the nearby bond surface. Another possible cause could be
insufficiency of the grit blast duration (0.3 cm2/s) or pressure (550 kPa).
In looking at the silicone contamination sensitivities in general, it is important to note that
six of the eight sensitive bond systems have surfaces through which the silicone cannot
diffuse. The other two cases showed the smallest bond degradation of the eight systems
exhibiting any effect. In contrast, nine of the thirteen bond systems that showed no
sensitivity to bond surface contamination at this level had substrates into which the
silicone could diffuse. Two of the remaining insensitive bond systems had significantly

16
elevated cure temperatures. The thermal energy of the silicone molecules at the higher
temperature could be expected to overcome the secondary chemical forces attracting the
silicone to the steel substrate. These thermally energetic silicone molecules would be
more able to diffuse into the curing rubber during the 2 to 7 hour cure and bonding
operation.
In an attempt to further demonstrate the effect of cure temperature on the silicone
contamination sensitivity of a given bond system, a second set of experiments was carried
out. In this set of tests, two bond systems were studied: Epoxy A and Epoxy B to D6AC
steel. The contamination level for these tests was 22 mg/m2 and the test geometry was
the standard three panels with 24 buttons bonded to each. For both bond systems, the
cure temperature was set at different levels: 21, 41, 57, and 82°C (for Epoxy B) and 93°C
(for Epoxy A). Use of silane adhesion promoting primer was also a parameter examined
in this testing. There were three conditions investigated for both adhesive systems: 1) no
silane (contaminated control samples), 2) silane applied to the steel substrate prior to
silicone contamination application, and 3) application of the silane to the silicone-
contaminated steel bond surface. To accomplish this, each panel was divided into three
sections each with eight buttons bonded to each test section. The silane was applied
using a paint brush, taking care to minimize the overlap between brush strokes. The
silane was applied at ambient temperature (21 ± 2°C) at a minimum of one hour prior to
silicone contamination application for one test section and prior to adhesive application
for the other pertinent test section.

17
Another set of samples was created and tested under all three silane conditions in which
the silane-treated substrates were subjected to elevated temperature (110 ± 5°C) for one
hour. This staging at elevated temperature has been shown to drive to completion the
condensation reaction between the silane and the hydrated metal oxide surface. This
third set of samples was bonded using only the Epoxy B adhesive.
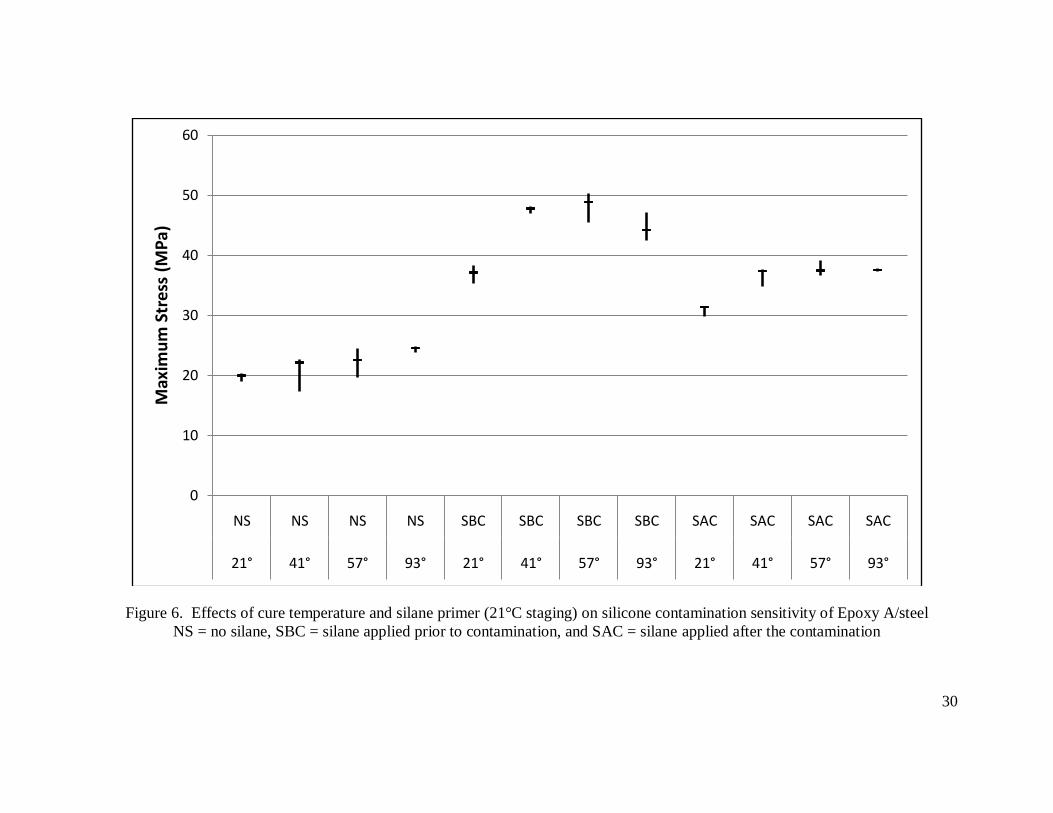
The results from the Epoxy A tests are shown in Figure 6. The effect of cure temperature
for the samples without silane was minimal with the tensile adhesion strength increasing
only 22 percent as the cure temperature was increased from 21 to 82°C. The results were
such that the only statistically significant difference (at the 95 percent confidence level)
was between the two temperature extremes. The failure mode in these samples without
silane was a mixture of adhesion failure to the panel at the contaminated interface and
cohesive in the EA 934NA adhesive, with a trend of decreasing adhesion failure with
increasing cure temperature. Because the failure mode was mixed, the cause of the
increased performance with increasing cure temperature could have been due to
additional curing of the EA 934NA at the higher cure temperatures, increased diffusion of
the silicone from the bond surface into the adhesive, or a combination of the two causes.
The failure mode of the samples in which the silane was applied prior to the
contamination exhibited nearly 100 percent cohesive failure within the Epoxy A. From
these results, we observed that some additional curing of the adhesive occurs between the
cure temperatures of 21 and 41°C. This is seen in the increase in the tensile adhesion
strength between samples cured at these two temperatures. No additional curing appears

18
to occur at temperatures greater than 41°C. The results also show that low-level silicone
contamination does not affect the steel/silane/Epoxy A bond system in cases where
contamination of the substrate bond surface does not occur until after the silane
application.
The application of the silane adhesion promoter reduced the sensitivity of the bond
system to contamination whether the silane was applied before or after the contamination.
The effect was significantly enhanced; however, in the case where the silane was applied
before the silicone contamination. This can be explained when one considers that the
silicone can create relatively strong hydrogen bonding to the metal oxide surface, resist
displacement by the silane, and preclude the molecular contract between the silane and
the metal oxide that is required for the desired condensation reaction between them.
Comparative results for the Epoxy B testing with the cure temperature and silane
application parameters are shown in Figure 7. The results lead to the same conclusions as
the Epoxy A testing. Evidence of additional adhesive cure at temperatures above 21°C is
seen in the data generated by samples treated with silane prior to contamination
applications. These samples, like the Epoxy A samples, failed cohesively in the
adhesive. Thus, as in the Epoxy A case, low-level silicone contamination does not affect
the Epoxy B bond system as long as the silicone can be applied before any contamination
can take place. In the case where the silane was applied to a contaminated steel surface,
the influence of the silane was much less with only a small increase in the tensile
adhesion strength over contaminated samples that did not receive the silane application.

19
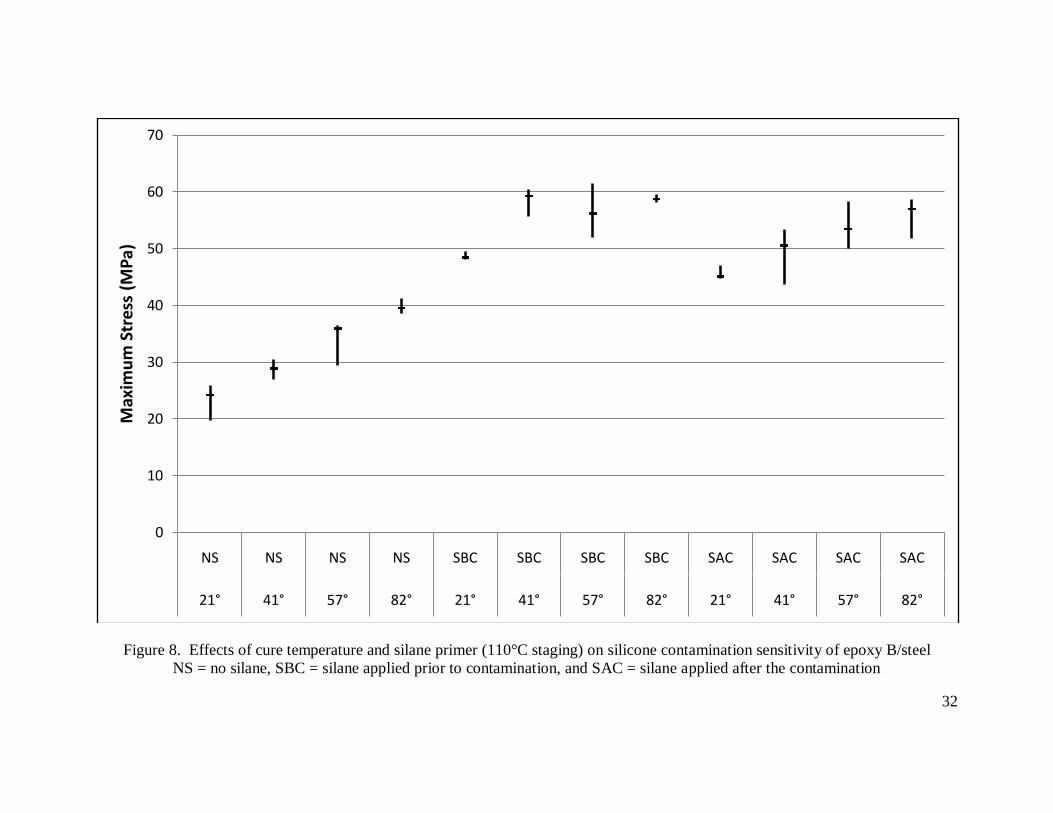
The final set of tests shows a dramatic improvement in the effect of silane application to a
contaminated steel substrate. These tests were generated from samples given a silane
“cure” at 110°C following the silane application. The results, shown in Figure 8, were
equivalent to the silane results without the 110°C “cure” for the case where the
contamination was applied to the silane-treated surface. For this case, the tensile
adhesion strength improved to match the results from the samples treated with silane
prior to contamination application. The failure mode also changed due to the silane
“cure”. The failure mode shifted from approximately 10 percent adhesive failure at the
contaminated interface to virtually complete failure within the adhesive at the baseline
strength of the adhesive. It appears that the silane is able to displace the silicone
contamination and react with the metal oxide substrate surface at the elevated
temperature.
Conclusions
Several general conclusions can be made from the results of this testing. The sensitivity
of the strength of bond systems to silicone contamination on the substrate bond surface
appears to be dependent on the substrate material and the adhesive or adhesion promoting
primer cure temperature. In cases where the silicone is able to diffuse into the substrate,
the bond system is generally insensitive to the contamination. The sensitivity to the
contaminant also appears to decrease with increasing cure temperature.

20
Cleaning silicone contaminated surfaces using a solvent wipe method generally improves
the subsequent bond performance, but rarely brings that performance back to baseline.
Even grit blasting contaminated metal substrates failed to restore subsequent bond
strengths completely.
The bond systems that exhibited the greatest sensitivity to silicone contamination are
high-strength bonds to metal surfaces where the baseline failure mode is cohesive within
the adhesive. In such cases, the sensitivity can be reduced significantly or eliminated
completely by the use of silane adhesion promoting primer. The beneficial effects of
silane primer are magnified by exposing the silane-treated substrate to elevated
temperature (110°C).

21
References
1. Burns, H. D., SPIE 2945, 101-103 (1979).
2. Pearson, L. H., NASA Conference Publication, No. 3298, 573-581 (1995).
3. Workman, G. L., Hughes, C., and Arendale, W. A., NASA Conference
Publication, No. 3349, 477-485 (1997).
4. Cull, R. A., NASA Conference Publication, No. 3349, 75-83 (1997).
5. Egitto, F. D., Matienzo, L. J., Spalik, J., and Fuerniss, S. J., Material Research
Society Symposium Proceedings 385, 245-250 (1995).
6. Stanley, S. D., Proceedings of the 31st Annual Meeting of The Adhesion Society
Inc. (The Adhesion Society, Blacksburg, VA, 2008), pp. 412-414.
7. Caldwell, G.A., Hudson, W.D., Plaia, J.R., Proceedings of the 26th Annual
Meeting of The Adhesion Society Inc. (The Adhesion Society, Blacksburg, VA,
2003), pp 516-518.
8. Anderson, G. L., J. Adhesion 41, 129-137 (1993).
9. Crook, R., and Guilfoyle, D., Adhesive Joints: Formulation, Characteristics and
Testing, Vol 2, (vsp International Science Publishers, The Netherlands, 2002),
Part I, pp 101-111.

22
Table I. Bond systems
Bondline (Adhesive or Paint/Contaminated Substrate) Cure Temperature (°C), Time Surface Preparation
Epoxy D/CF-EPDM (Cured) 21°C, 4 days min. Abrade
Epoxy A/Paint A Coated D6AC Steel 21°C, 5 days min. SOLV-2 Wipe/Abrade/SOLV-2 Wipe
Epoxy D/ASNBR (Cured) 21°C, 4 days min. SOLV-2 Wipe
Epoxy C/SF-EPDM (Cured) 21°C, 4 days min. SOLV-2 Wipe
Epoxy C/Paint C Coated 7075 Aluminum 21°C, 4 days min. SOLV-2 Wipe/Abrade/SOLV-2 Wipe
D6AC Steel/VA-1/SF-EPDM 143°C, 7 hr Abrade/TCA Wipe
Epoxy D/D6AC Steel 21°C, 5 days min. SOLV-1 Wipe
Paint A/D6AC Steel 21°C, 24 hr min each SOLV-2 Wipe/Abrade/SOLV-2 Wipe
Epoxy A/D6AC Steel 21°C, 5 days min. SOLV-2 Wipe
Epoxy A/7075 Aluminum 21°C, 5 days min. SOLV-2 Wipe
Epoxy A/Paint B Coated Aluminum 21°C, 5 days min. SOLV-3 Wipe/Abrade/SOLV-3 Wipe
Epoxy B/Graphite 41°C, 48 hr IPA Wipe
Epoxy B/SF-NBR (Cured) 41°C, 48 hr MEK Wipe/Abrade/MEK Wipe
CCP/PSA/D6AC Steel 21°C at 34 psi, 1 day Abrade/TCA Wipe
PSA/ASNBR 21°C at 34 psi, 1 day TCA Wipe
Epoxy A/Inconel Steel 21°C, 5 days min. SOLV-3 Wipe/Abrade/SOLV-3 Wipe
Epoxy C/Stainless Steel 21°C, 4 days min. SOLV-3 Wipe/Abrade/SOLV-3 Wipe
Epoxy B/7075 Aluminum 41°C, 48 hr Detergent Wash/SOLV-1 Wipe/Grit Blast
Epoxy B/D6AC Steel 41°C, 48 hr Detergent Wash/SOLV-1 Wipe/Grit Blast
Epoxy B/High-Ply-Angle GCP 41°C, 48 hr SOLV-1
NR/VA-2/D6AC Steel 152°C, 2 hr SOLV-1

23
Table II. Bond performance of systems insensitive to 108 mg/m2 of silicone
contamination applied to the bond surface prior to adhesive application
Adhesive Cure
Temp
(°F)
Contaminated Substrate
Test Geometry
Bond Performance (CV) Failure Mode Control Contaminated
Epoxy D 21 Cured CF-EPDM B/P 0.55 MPa (14.0%)
0.49 MPa (10.6%)
100% coh CF-
EPDM
Epoxy D 21 Cured AF-NBR B/P 5.61 MPa
(5.5%)
5.23 MPa
(6.5%)
100% coh
AF-NBR
Epoxy A 21 Painted Steel
(Paint A)
B/P 27.5 MPa
(5.4%)
29.2 MPa
(5.1%)
100% coh
Paint
Epoxy A 21 Painted
Aluminum (Paint B)
B/P 22.1 MPa
(7.4%)
19.5 MPa
(14.9%)
100% coh
Paint
Epoxy A 21 Inconel B/B 12.8 MPa
(21.2%)
12.1 MPa
(15.4%)
85-100%
adh
Epoxy C 21 Painted Aluminum
(Paint C)
B/P 10.3 MPa (10.4%)
9.6 MPa (9.6%)
100% coh RT-455
Epoxy C 21 304 Stainless
Steel
B/B 3.0 MPa
(20.3%)
3.2 MPa
(24.4%)
>95% adh
Epoxy A 41 Graphite B/B 24.2 MPa
(13.5%)
24.5 MPa
(13.6%)
100% coh
Graphite
Epoxy A 41 Cured SF-NBR B/B 9.5 MPa
(2.7%)
9.5 MPa
(9.9%)
100% coh
SF-NBR
PSA 21 CCP B/P 1.02 MPa
(23.2%)
0.99 MPa
(19.8%)
100% adh
PSA 21 Cured AF-NBR B/P
T-peel
0.93 MPa (17.2%)
4.96 pli
(13.1%)
0.97 MPa (17.5%)
4.07 pli
(23.4%)
100% adh
100% adh
NR / VA-2 152 D6AC Steel QLS
Peel
4.7 MPa (7.7%)
4.4 kN/m
(12.1%)
4.5 MPa (9.3%)
4.6 kN/m
(15.3%)
100% coh NBR
>80% coh
NR
SF-EPDM / VA-1
143 D6AC Steel B/P
Peel
7.4 MPa (7.7%)
16.6 kN/m
(5.5%)
6.6 MPa (21.8%)
15.9 kN/m
(9.3%)
100% coh SF-EPDM
100% coh
SF-EPDM
Test Geometries: B/P is button-to-panel; B/B is button-to-button; QSL is quadruple lap shear
Failure Mode: coh is cohesive in the adhesive of substrate specified; adh is interfacial between
the adhesive and the substrate

24
Table III. Bond performance of systems sensitive to 108 mg/m2 of silicone contamination applied to the bond surface
prior to adhesive application
Adhesive Cure Temp
(°C) Contaminated
Substrate Test
Geometry Control Contaminated Cleaned
Bond
Performance
(CV)
Failure
Mode
Bond
Performance
(CV)
Failure
Mode
Bond
Performance
(CV)
Failure
Mode
Epoxy C 21 Cured SF-
EPDM
B/P 2.6 MPa
(7.2%)
100% adh 1.7 MPa
(6.4%)
100% adh 1.7 MPa
(6.7%)
100% adh
Epoxy D 21 D6AC Steel B/P 24.6 MPa
(2.1%)
95% coh
Epoxy
0.81 MPa
(44.3%)
100% adh 10.9 MPa
(12.0%)
> 95% adh
Paint A 21 D6AC Steel B/P 23.9 MPa
(6.8%)
100% coh
Paint
7.7 MPa
(19.3%)
100% adh 14.1 MPa
(6.9%)
20% coh
Paint
80% adh
Epoxy A 21 D6AC Steel B/P 42.3 MPa (6.7%)
> 90% coh Epoxy
9.7 MPa (15.3%)
100% adh 18.8 MPa (9.3%)
100% adh
Epoxy A 21 7075
Aluminum
B/P
26.4 MPa
(5.4%)
> 80% coh
Epoxy
15.9 MPa
(12.6%)
> 95% adh 18.7 MPa
(12.6%)
> 95% adh
Epoxy B 41 D6AC Steel B/P
TDCB
67.9 MPa (2.4%)
3.54 kJ/m2
(17.2%)
100% coh Epoxy
70% coh
Epoxy
23.6 MPa (15.4%)
0.09 kJ/m2
(11.8%)
> 95% adh
100% adh
60.2 MPa (6.2%)
1.75 kJ/m2
(11.8%)
> 95% coh Epoxy
10% coh
Epoxy 90% adh
Epoxy B 41 7075
Aluminum
B/P
TDCB
63.4 MPa
(5.3%)
3.01 kJ/m2
(20.1%)
100% coh
Epoxy
50% coh Epoxy
22.5 MPa
(9.7%)
0.67 kJ/m2
(39.2%)
> 95% adh
100% adh
49.7 MPa
(4.9%)
1.52 kJ/m2
(44.5%)
100% coh
Epoxy
5% coh Epoxy
95% adh
Epoxy B 41 High-ply-angle GCP
B/B 50.3 MPa (5.0%)
100% adh 33.1 MPa (8.9%)
100% adh 52.1 MPa (5.5%)
100% adh

25
Figure 1. Schematic of tensile button-to-plate bond configuration

26
Figure 2. Effects of silicone contamination on Epoxy A tensile adhesion strength to steel and aluminum
0.0
5.0
10.0
15.0
20.0
25.0
30.0
35.0
40.0
45.0
50.0
Epoxy A/Steel control
Epoxy A/Steel contaminated
Epoxy A/Steel Cleaned
Epoxy A/Aluminum
control
Epoxy A/Aluminum contaminated
Epoxy A/Aluminum
cleaned
Ten
sile
Ad
hes
ion
Str
en
gth
(M
Pa)

27
Figure 3. Effects of silicone contamination on Epoxy D and Paint A tensile adhesion strength to steel
0.0
5.0
10.0
15.0
20.0
25.0
30.0
Epoxy D/Steel control
Epoxy D/Steel contaminated
Epoxy D/Steel cleaned
Paint A/Steel control
Paint A/Steel contaminated
Paint A/Steel cleaned
Ten
sile
Ad
hes
ion
Str
engt
h (
MP
a)

28
Figure 4. Effects of silicone contamination on Epoxy B tensile adhesion strength to steel and aluminum
0.0
10.0
20.0
30.0
40.0
50.0
60.0
70.0
80.0
Epoxy B / Steel control
Epoxy B / Steel
contaminated
Epoxy B / Steel cleaned
Epoxy B / Aluminum
control
Epoxy B / Aluminum
contaminated
Epoxy B / Aluminum
cleaned
Ten
sile
Ad
hes
ion
Str
en
gth
(M
Pa)

29
Figure 5. Effects of silicone contamination on Epoxy B bond fracture energy to steel and aluminum
0.00
0.50
1.00
1.50
2.00
2.50
3.00
3.50
4.00
4.50
Epoxy B / Steel control
Epoxy B / Steel
contaminated
Epoxy B / Steel cleaned
Epoxy B / Aluminum
control
Epoxy B / Aluminum
contaminated
Epoxy B / Aluminum
cleaned
Bo
nd
Fra
ctu
re E
ner
gy (
kJ/s
q m
)
30
Figure 6. Effects of cure temperature and silane primer (21°C staging) on silicone contamination sensitivity of Epoxy A/steel
NS = no silane, SBC = silane applied prior to contamination, and SAC = silane applied after the contamination
0
10
20
30
40
50
60
NS NS NS NS SBC SBC SBC SBC SAC SAC SAC SAC
21° 41° 57° 93° 21° 41° 57° 93° 21° 41° 57° 93°
Max
imu
m S
tres
s (M
Pa)

31
Figure 7. Effects of cure temperature and silane primer (21°C staging) on silicone contamination sensitivity of Epoxy B/steel
NS = no silane, SBC = silane applied prior to contamination, and SAC = silane applied after the contamination
0
10
20
30
40
50
60
70
NS NS NS NS SBC SBC SBC SBC SAC SAC SAC SAC
21° 41° 57° 82° 21° 41° 57° 82° 21° 41° 57° 82°
Max
imu
m S
tre
ss (
MP
a)
32
Figure 8. Effects of cure temperature and silane primer (110°C staging) on silicone contamination sensitivity of epoxy B/steel
NS = no silane, SBC = silane applied prior to contamination, and SAC = silane applied after the contamination
0
10
20
30
40
50
60
70
NS NS NS NS SBC SBC SBC SBC SAC SAC SAC SAC
21° 41° 57° 82° 21° 41° 57° 82° 21° 41° 57° 82°
Max
imu
m S
tres
s (M
Pa)