Embed Size (px)
Citation preview
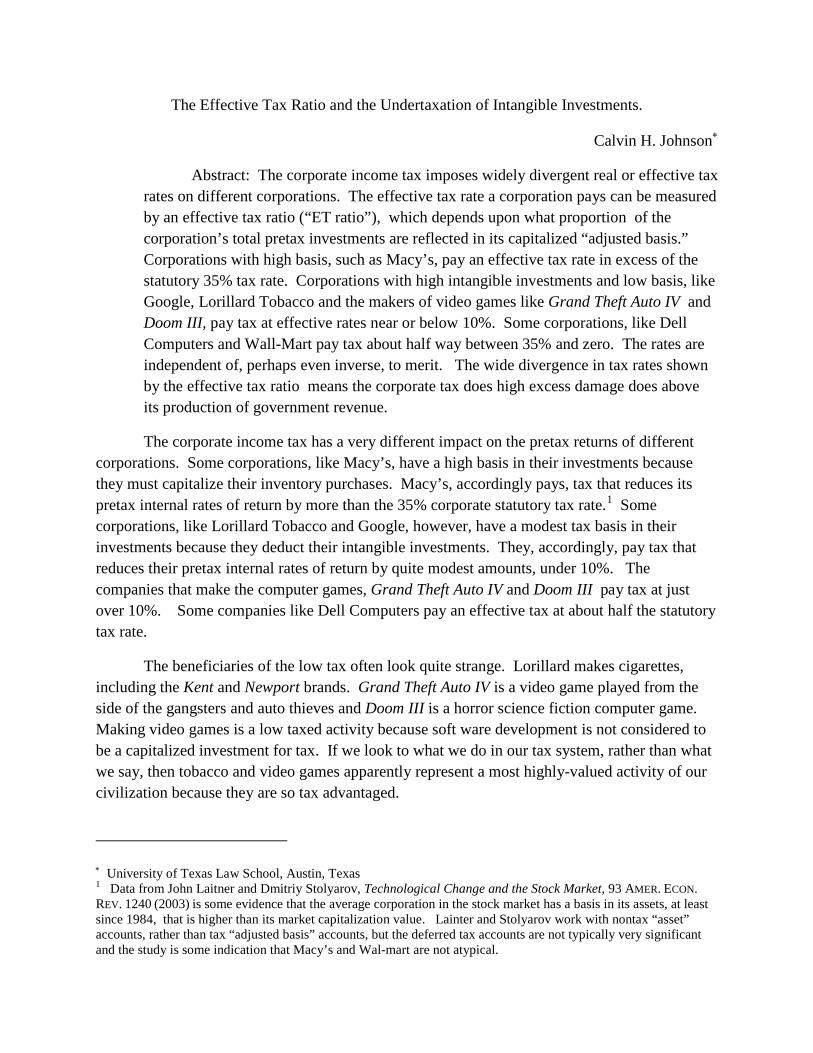
The Effective Tax Ratio and the Undertaxation of Intangible Investments.
Calvin H. Johnson∗
The corporate income tax has a very different impact on the pretax returns of different corporations. Some corporations, like Macy’s, have a high basis in their investments because they must capitalize their inventory purchases. Macy’s, accordingly pays, tax that reduces its pretax internal rates of return by more than the 35% corporate statutory tax rate.
Abstract: The corporate income tax imposes widely divergent real or effective tax rates on different corporations. The effective tax rate a corporation pays can be measured by an effective tax ratio (“ET ratio”), which depends upon what proportion of the corporation’s total pretax investments are reflected in its capitalized “adjusted basis.” Corporations with high basis, such as Macy’s, pay an effective tax rate in excess of the statutory 35% tax rate. Corporations with high intangible investments and low basis, like Google, Lorillard Tobacco and the makers of video games like Grand Theft Auto IV and Doom III, pay tax at effective rates near or below 10%. Some corporations, like Dell Computers and Wall-Mart pay tax about half way between 35% and zero. The rates are independent of, perhaps even inverse, to merit. The wide divergence in tax rates shown by the effective tax ratio means the corporate tax does high excess damage does above its production of government revenue.
1
∗ University of Texas Law School, Austin, Texas 1 Data from John Laitner and Dmitriy Stolyarov, Technological Change and the Stock Market, 93 AMER. ECON. REV. 1240 (2003) is some evidence that the average corporation in the stock market has a basis in its assets, at least since 1984, that is higher than its market capitalization value. Lainter and Stolyarov work with nontax “asset” accounts, rather than tax “adjusted basis” accounts, but the deferred tax accounts are not typically very significant and the study is some indication that Macy’s and Wal-mart are not atypical.
Some corporations, like Lorillard Tobacco and Google, however, have a modest tax basis in their investments because they deduct their intangible investments. They, accordingly, pay tax that reduces their pretax internal rates of return by quite modest amounts, under 10%. The companies that make the computer games, Grand Theft Auto IV and Doom III pay tax at just over 10%. Some companies like Dell Computers pay an effective tax at about half the statutory tax rate.
The beneficiaries of the low tax often look quite strange. Lorillard makes cigarettes, including the Kent and Newport brands. Grand Theft Auto IV is a video game played from the side of the gangsters and auto thieves and Doom III is a horror science fiction computer game. Making video games is a low taxed activity because soft ware development is not considered to be a capitalized investment for tax. If we look to what we do in our tax system, rather than what we say, then tobacco and video games apparently represent a most highly-valued activity of our civilization because they are so tax advantaged.
The advantages and handicaps are not engineered; they arise primarily because the tax law capitalizes investments in tangible things and financial instruments, but not in intangibles. In this tax law follows the lead of the accounting system, which refuses to treat intangible investments not attached to any physical thing, as if it were an investment.
The differential tax impact increases the damage that the corporate tax causes, even apart from the strangeness of who is advantaged. Pretax profit presumably capture the price consumers are willing to pay because of the utility they derive from a project. When tax imposes different burdens on different products it sends capital into inferior investments judged by their pretax merits.
The effective tax rate a corporation pays can be measured by an effective tax ratio (“ET ratio”) according to how much of a corporation’s investments are reflected in its adjusted basis. An income tax that perfectly identified the internal rate of return from the corporation’s investments and reduced it by the statutory tax rate would leave the corporation with an adjusted basis just equal to the net present value of its investments.2 An income tax that gives corporations a zero basis in its investments does not reduce the corporation’s pretax internal rate of return at all.3 So it is that a mixture of full basis and zero basis investments yields an effective tax ratio that satisfies the following equation:
Effective tax rate = Statutory tax rate * Adjusted basis of corporation’s assets
The term “effective tax rate” has a number of very different definitions, but it is used here to refer to the measure of the reduction in pretax internal rate of return.
Investment value in absence of tax
The effective tax rate, the equation states, depends upon what proportion of a taxpayer’s total pretax investments are capitalized “basis.”
4 Internal rate of return is a universal yardstick used to compare investments of diverse terms, risks, tangibility, stripes and colors. The internal rate of return is a compound annual interest rate like the interest rate that would be advertised on a bank account or a bond.5
2 The argument originates in Paul Samuelson, Tax Deductibility of Economic Depreciation to Insure Invariant Valuations, 72 J. POL. ECON. 604 (1964). 3 The seminal piece is Cary Brown, Business-Income Taxation and Investment Incentives, in INCOME, EMPLOYMENT AND PUBLIC POLICY: ESSAYS IN HONOR OF ALVIN H. HANSON 300 (1948).
4 Effective Tax Rate = ( IRRpretax - IRRpost tax)/ IRRpretax
There are other definitions of “effective tax
where “IRR” is internal rate of return. The numerator ( IRRpretax - IRRpost tax) is the reduction in IRR or compound annual interest caused by tax. Tax rates are conventionally cited as reduction caused by tax as a fraction of pretax position, so the denominator is pretax IRR. See generally, Donald Fullerton, “Marginal Effective Tax Rates, “ http://www.taxpolicycenter.org/taxtopics/encyclopedia/Marginal-tax.cfm (2007). 5 See, e.g. RICHARD BREALEY & STEWART MYERS, PRINCIPLES OF CORPORATE FINANCE 99-108 (6th ed. 2000) for a discussion, including limitations of internal rate of return.

rate” which have no relationship to the internal- rate-of-return reduction measure.6
The ET ratio derived from financial statements bears a family resemblance to “Tobin’s q,” that is, the ratio of the value of the firm to the replacement costs of its assets. Tobin’s q was used originally to indicate whether the corporation should increase its investment or not and it has been used for other, diverse purposes.
The accounting definition of “effective tax rate” is not helpful in determining the impact of tax on pretax internal rate of return, and it is not used here. The “ET ratio” defended here assumes a constant statutory tax rate across time. The ratio does not capture permanent items like tax credits and exemptions. The ratio also breaks down when net operating loss carryforwards replace instantaneously recognized losses.
The effective tax ratio is useful because can be reasonably approximated from published financial data. The available data is sometimes ambiguous on key points, but it is illuminating even with tolerable error. The adjusted basis of the firm’s assets is approximately equal to the firm’s balance sheet “assets,” but reducing the “assets” by the base amounts represented by the deferred tax account. The post- tax value of the firms is available because a smart public stock market values a public corporation’s total assets every business day, with the best information and tools at hand. A workable approximation of the fair market value of the firm’s investments in absence of tax can be derived from market capitalization in the presence of tax.
7 High Tobin’s q values are associated with small reduction in internal rate of return. A simplified Tobin’s q is the ratio of market capitalization to accounting book assets and the simplified version is highly correlated with the original Tobin’s q ratio that looks to replacement value of the assets.8
6 “Effective tax rate” often refers to total tax divided by total income, that is, to overall or average tax by contrast with the marginal tax or extra tax to be paid on a unit of extra income. Accounting also has a definition of “effective tax rate” which attributes future payments of tax as a cost properly matched to current accounting-defined income. 2 DONALD KIESO, JERRY WEYGANDT & TERRY WARFIED, INTERMEDIATE ACCOUNTING 1070 (10th ed. 2001).
The ET ratio, discussed here, differs from the simplified Tobin’s q in that it uses “adjusted basis,” which is the tax-system parallel to book “assets”, and derives what investment would be in absence of tax, rather than looking to real market capitalization in a taxed world.
7 The seminal article, James Tobin, A General Equilibrium Approach to Monetary Theory, 1 J. OF MONEY CREDIT AND BANKING 15, 23 1969) uses the q (short for “quotient”) to argue that firms will increase investments if value exceeds reproduction costs of assets. Lawrence H. Summers, Taxation and Corporate Investment: A q-Theory Approach. 1981-1 BROOKINGS PAPERS ON ECONOMIC ACTIVITY 67, 80 (1981) uses the assumption that firms will invest when value equals cost of reproduction of assets to argue for tax cuts on capital investment to counteract inflation. Summers assumes homogeneous capital and thus is not looking at the divergent impact of tax on different firms and industries. Tobin’s q is used on nontax questions, in, e.g., H. P. Lang, René M. Stulz & Ralph A. Walkling, Managerial performance, Tobin's Q, and the gains from successful tender offers, 24 J. FIN. ECON. 137 (1989) (using Tobin’s q to measure target vulnerability to and shareholder gains from tender offers); Craig Doidge, G. Andrew Karolyi and René M. Stulz, Why are foreign firms listed in the U.S. worth more? , 71 J. FIN. ECON. 205 (2004) (using Tobin’s q to measure extra value foreign firms achieve by listing on U.S. exchange). 8 Kee H. Chung and Stephen W. Pruitt, A Simple Approximation of Tobin's q, 23 FINANCIAL MANAGEMENT 70 (1994) argue that ratio of market capitalization to book assets is highly correlated with the ratio of market capitalization to replacement value in the original Tobin’s q and that the former ratio is far easier to calculate.

Unfortunately permanent tax advantages are not included in this study. The published financial statements for the corporations under examination were not transparent enough to make it feasible to incorporate permanent items into the ET ratio or analysis. The ET ratio thus does not take into account reductions in tax, for instance, from energy, oil or R&D tax credits, from exclusions for municipal bond interest or corporate-owned life insurance, from exemptions for overseas investment, and from any other tax shelters they are up to. The ET ratio, in assuming that all income bears a marginal tax of 35%, overstates the tax corporations pay, even while it is useful in measuring the advantage of deducting investments that still have value.
The wide divergence in the impact of corporate tax on internal rate return makes the corporate tax an inefficient tax that does excess damage as it collects its revenue.9
The divergence in effective tax rates, moreover, arises primarily because of decisions within the accounting profession but followed by tax, to make accounting easier. Accounting has been reluctant to allow nonfinancial intangible investments to be capitalized as an “asset,” listed on the balance sheet.
The pretax return from an investment presumably identifies the investments with the highest utility to society. Consumers’ real priorities are reflected only in the pretax price they will pay and when tax warps the image investors get, the priorities of real users are not reflected in post tax returns nor in investor decisions. At very least, tobacco (Lorillard) and violent video games (Activision and Take Two) do not seem to qualify as merit goods, more valuable than their price could reflect, so that the case for subsidy to the products or a tax advantage over competing products is not a good one.. A tax that varies widely in its impact on internal rate of return distorts investor decisions and shifts capital into inferior investments.
10
9 Don Fullerton & Andrew B. Lyon, Tax Neutrality and Intangible Capital, in 2 TAX POLICY AND THE ECONOMY 63, 72 (Laurence H. Summers, ed., 1988) calculate a welfare cost of failing to capitalize intangible investments as a percentage of corporate tax and of gross national product, but they use only advertizing and research and development investments identified by the IRS, STATISTICS OF INCOME, and concede that that may considerably understate intangible investments. There is no need, in the years of the data base they used, for a corporation to distinguish research from any other business expense. A corporation with a high Tobin’s q is getting investment values out of its expenses beyond advertising and research and development expenditures.
To be a balance sheet asset, there must be a specific property the investments attach too. Decisions to make accounting simpler have been brought into the income tax, without any apparent consideration of the wisdom of a low or zero effective tax rate. Under current accounting standards, investments in the development of computer software,
10 BARUCH LEV, INTANGIBLES: MANAGEMENT, MEASUREMENT, AND REPORTING (2001) and Leandro Cañibano, et. al., Shortcomings in the Measurement of Innovation: Implications for Accounting Standard Setting, 4 J. OF MMGMENT & GOVERANCE 319 (2000) advocate expanded capitalization of costs of intangibles. Douglas J. Skinner, “Accounting for Intangibles - A Critical Review of Policy Recommendations,” University of Chicago - Graduate School of Business Working Paper Series (Dec 2007) is skeptical that capitalization of intangibles would persuade more investment in companies with more intangibles, because the smart investors can see through the accounting.

pharmaceuticals, customer goodwill, and advertizing are treated as current expenses and not assets by accounting standards.11 All research and development costs are considered too speculative or intangible to be considered a balance sheet asset.12 Accounting treats the internal development of self-developed “goodwill,” that is, the value of the business as a whole in excess of the value of any property or thing accounting is willing to recognize as a balance sheet asset any property it owns, is never an asset to the company that built up the goodwill.13
Tax has become at least as conservative as accounting in expensing intangibles. When soft ware development was a young and experimental enterprise, the tax law allowed the immediate deduction of the costs of development.
Even for costs that could be identified with legally protected brand names, patents, copy rights, pharmaceutical research and workforce are not treated as assets or investments because of accounting reluctant to tolerate difficulties in associating costs with future benefits. High values for Tobin’s q for companies with intangible investments arises, not so much because the corporation is making something worth far more than its cost, but because the accounting data is used to measure assets in the ratio and accounting refuses to treat any new economy investments as investments. The accounting profession, indeed, has withdrawn entirely from the attempt to measure income from the new economy with an assumption that all investments for soft ware, goodwill, intellectual property and the like are worthless when made.
14 The expensing of software development is consistent with a more general refusal to capitalize intangible costs. Tax will now allow expensing of costs not associated with a specific potentially salable property as too intangible to capitalize.15
Sometimes the benefit that could be achieved by a better accounting description of intangibles is “so small as to make accounting for it unreasonable or administratively impracticable,”
16
11 Accounting for The Costs of Computer Software to be Sold, Leased or Otherwise marketed, Statement of Financial Accounting Standard No. 86 para. 3-6 (1985) (requiring immediate expensing of research and development costs of software prior to technological feasibility and general capitalization of development costs after technological feasibility is established). 12 Accounting for Research and Development Costs, Statement of Financial Accounting Standard No. 2, para. 49 (1974) (requiring the immediate expensing of research and development costs). 13 Accounting Principles Board Opinion No. 17, Intangible Assets paras. 11, 24 (1970) (costs of developing intangible assets which are not specifically identifiable, have indeterminate lives, or are inherent in a continuing business as a whole are expensed when incurred). 14 28See Rev. Proc. 69-21, 1969-2 C.B. 303 (allowing expensing of cost of developing software); 15 Treasury Reg. §1.263(a)-4(b)(3) (2004) (defining separate and distinct asset as property capable by nature of being sold). Criticism of the regulations includes Ethan Yale, When Are Capitalization Exceptions Justified?, 57 TAX LAW REVIEW 549 (2004); Calvin Johnson, Destroying Tax Base: The Proposed INDOPCO Capitalization Regulations, 99 TAX NOTES 1381 (2003). 16 IRC§132(e)
but there is no indication of a reasoned balance between accountant convenience and a level economic playing field. The expensing of intangible investments is not part of a deliberate decision to punish the disfavored tangible investments nor to subsidize
intangible investments. Given the pattern of reward and punishment, it would be difficult to imagine any principle that engineered the results. The impact to punish tangible investment and subsidize intangible seems to arise entirely out of considerations internal to the accounting that mean that accounting will not have to deal with the problems of capturing the investment value of an investment when it does not attach to specific property.
The divergent effective tax rates that arise because of differing fractions of corporate investments that are capitalized are a serious issue. Previous articles, including mine, have suggested that that the Treasury Regulations on intangibles, should have should decided in favor of capitalizing costs on a number of discrete issues.17 Investments in intangibles such as computer games, software, and pharmaceuticals are not as different from investments in tangible products as current accounting and tax make them out to be. Many intangibles now expensed are sufficiently saleable and identifiable that they should meet conventional definitions of assets. I am willing to suggest that development of Grand Theft Auto IV, Doom III or Guitar Hero XX should not be getting the zero effective tax rate advantage that they get. Development of a product and product design might well be capitalized so as to reach a full tax on the investment. None of the suggestions, however, have gone so far as to suggest capitalization of self-developed goodwill attached only to the business as a whole. I have previously suggested that we need to replace the corporate income tax with a trivial-rate tax on market capitalization, 18 and I do think problems of intangibles are serious enough to fix the problem or abandon the corporate income tax. A move over to a universal consumption tax would give all investments and industries the chance to catch up with the advantages that low basis corporations now have. This article, however, is primarily about identifying the problem by means of a ratio between capitalized investments and total investments that identifies the effective tax rate.
I. Proof and Illustrations of the Effective Tax Ratio.
The tax effect in reducing a corporation’s pretax returns depends on the ratio of costs that are capitalized (and not yet deducted) for tax purposes to the pretax value of the corporation’s investments:
Effective tax rate = Statutory tax rate * Adjusted basis of corporation’s assets
The effective tax ratio (ET ratio) above is first proved with algebra for a single period investment or a for a perpetuity. Then the ET ratio is illustrated with spreadsheets for a depreciating investment and for an appreciating investment. Some readers might find the spreadsheets
Investment in absence of tax
17 Ethan Yale, supra note 12; Calvin H. Johnson, supra note 12. 18 Calvin H. Johnson, Replace the Corporate Tax with a Market Capitalization Tax, 117 TAX NOTES 1082 (2007)

illustrations to be more concrete and clear, and should come back to the algebra only as way to generalize their understanding. Some readers will find that the algebra is a better communication.
A. Single period or perpetuity.
This section develops an algebraic description of a capitalized investment, in which there is full tax on the return, then a description of an expensed investment in which there is no tax reduction of the return. The section then shows the effective tax rate from a blended investment that is half capitalized and from an investment in which 20% of the cost is capitalized.
1. Full tax on return.
Assume R is the annual rate of return from an investment of capital “C.” The return for one year is C*R. The investment can be either a one year investment only or it can be a perpetuity in which the annual after tax profit with withdrawn every year. If we assume a statutory tax rate of “T,” the tax on C*R is T*C*R and the after tax profit is
C*R – T* C * R = CR * (1-T)
The effective tax rate measures the drop in return as a fraction of the pretax return
Effective tax rate = Pretax rate of return – post tax rate of return pretax tax rate of return or here: C * R - C * R*(1-T) C * R which equals: 1 – 1 * (1-T) = T. For example, if C of $100 is invested at R of 10%, the taxpayer would receive $10 after a year in absence of tax. Tax at assumed T of 35% would be $3.50 on the $10, and the effective tax would be equal to the statutory tax rate:
Effect tax = C*R - C*R*(1-T) = $100*10%- $100* 10%*(1-35%) = $10- $6.50 = $3.50
The model assumes that the capital C has been taxed before or simultaneous with investment, which is called “hard money” investment or “H” here. The model ignores the “double tax of income” under which both capital and the return to capital is taxed. The statutory tax rate, conventionally stated as a T ignores the double tax, and the models here are consistent with effective tax rate T being the full statutory tax. Using “T” as the base line for full taxation of
= 35% C*R $100*10% $10 $10

income also simplifies the algebra. 19 To reach an effective tax rate of T equal to the statutory tax rate, the investment of C must be hard money (“H”), that is, it must be capitalized.
By contrast if capital can be excluded or exempted, called soft money investment here or “S”, then the effective tax rate is zero.
2. No effective tax
Now assume that capital can be expensed or excluded so the full investment is soft money. Deductible amounts will give the investor a tax savings that is like a government’s reimbursing or sharing in the cost of the investment at its start at fraction of the investment equal to T. The government is sometimes described as a partner of the investor when an investment can be expensed or excluded when made.
.
20 In turn an investor can increase or “gross up” the investment counting on the reimbursement. If amount S is the budget constraint on the amount the taxpayer can invest, then there is a greater investment “X”, that will have a net costs of S after the tax savings of T * X.
X - T* X = S
X* (1-T) = S
X = S/(1-T)
If S/(1-T) is invested, consist with the S budget constraint, then the profit per year is [S/(1-T)]*R. Tax at the presumed constant statutory tax rate T reduces the return to
S
which is equal to S* R.
* R * (1-T) (1-T)
19 It is possible to include the tax on capital in the model and model income as double tax, but the algebra is messy and not consistent with the conventional understanding of stautory tax rate T. If capital C is reduced by income before investment and R is also taxed, then the effective tax rate formula becomes:
C * R - C * (1-T) * R*(1-T) which simplifies to effective tax rate of 1- (1-T)2 rather than to T. C * R The double tax model yields an effective tax of 1-65%2 or 57.75% for a statutory tas rate of 35%. With C of $100, R of $10, the tax of $5.78 reduces the after tax return to $4.225. Using 1- (1-T)2 instead of T in the calculation of the impact of soft money and the ET ratio is possible but the formulas are unwieldy to work with. The “exemption” of return or the expensing of capital becomes [C * R - C * (1-T) * R*(1-T) ] /C*R or just T. If the capital invested is partially expensed (“S” for soft money) and partially capitalized (“H” for hard money), then the effective tax rate over all is {(H+S)*R - [H*(1-T)2*R * + S*R*(1-T)]}/ (H+S)*R which “simplifies” to an unwieldy [1 - [H*(1-T)2 + S*(1-T)]}/ (H+S). The models in text uses the conventional effective tax rate of T for full tax, and the zero effective tax and ET ratio are calculated consistent with T -- rather than with 1- (1-T)2 -- being the statutory tax rate for full tax. 20

Alternatively stated, the contribution to the government at the front end a rate T, left the taxpayer’s cost at (1-T) and fully offset the government’s share of R at the back end. The government was a fair partner who contributed an amount of T at the start and also took out T at the end. The taxpayer gets the same rate of return R on the amount it has invested, that is, S, as it would get from investing S at rate R in world totally without tax. The investment went from S*R before tax to S*R after tax, which is a zero effective tax.
To replace the algebra with numbers assume, for example, an investment of $100 can be grossed up to $100/(1-T) = $100/1-35% = $154 in reliance on the ability to deduct the $154 investment. The after tax cost of the $154 is $154 (1-35%) = $100, which is the budget constraint. Investment of $154 yields a profit of $15.40 per year. Tax at 35% of $15.40 takes out $5.40, which reduces the return to $10. The $10 is the same amount as would occur from a 10% return on $100 investment in absence of tax.
The zero effective rate conclusion assumes that the T rate of tax in the year of the investment and the year(s) the S*R is received is constant. The model, with minor adjustment, allows both the benefit of the tax reimbursement and the detriment of tax on return to be delayed, so long as the delays are consistent. With a delay in tax reimbursement upon investment or a delay in tax on return, the tax rate T should be thought of a discounted T1 rate, that is T discounted by a few months interest. To be pure zero effective tax rate, the discounting has to be the same for the investing and the return. Differences in the statutory tax rate or in the delay of savings or tax will mean the effective tax rate is higher or lower than zero. But even with variation in rate or delay, the zero effective tax rate is the center of the framework – true for constant rates and delay – that is true and illuminating even with variations that cause an effective tax rate to be above or below the zero effective tax rate.
The model assumes that the amount invested is sensitive to tax, and that S will be the budget constraint and the amount invested after tax.21
Stating the return at S*R necessarily presumes that the taxpayer is getting capital of S back in addition to the profit of S*R. The taxpayer invests S/(1-T), given the upfront tax savings. Deduction of S/(1-T) leaves the taxpayer with no basis. The definition of R assumes
Other models that assume that early tax will be paid without reducing the investment by borrowing or by liquidating comes other investment will still give an advantage to soft money investing but not at a level equal to exemption of R from tax.
21 Soft money investing is like exemption of return R even if the investor does not expand the investment to S/(1-T), so long as investment is sensitive to tax. Assume, for instance, that income H will be invested in a capitalized investment producing basis not deductions and thus H must be reduced by tax to H*(1-T) before investment. The return would be H*(1-T) * R and assume, by some miracle or legislation, that the return is exempted from tax. A soft money investment S does not have to be reduced by tax at the outset, and thus earns S*R. When tax is imposed on the full S*R -- basis having been used up --, the taxpayer has S* R (1-T) after tax. When S and H are equal, the after tax returns, H*(1-T) * R = S* R (1-T). The proof assumes that H must drop by tax, which S does not pay.

that the full S/(1-T) capital invested must be returned, -- if it is not we need to restate the return R. The full S/(1-T) is subject to tax because there is no basis, so tax is T* S/(1-T) and the after tax return is S/(1-T) – T* S/(1-T) which is equal to [ S/(1-T) ] * (1-T) or just to S, the taxpayer’s original capital. The taxpayer has gotten his capital back, even while the return is subject to zero effective tax rate.
3. Mixed Soft & Hard: The ET Ratio.
Assume now that the corporation invests amount H, which is not deducted, but creates basis, and amount S which is deducted immediately and thus may be grossed to account for the tax reimbursement of the gross investment cost. Both H and S/(1-T) earn R. After tax at T, the return is [ H + S/(1-t) ] * R * (1-t). The effective tax is again pretax results less post tax results as a fraction of pretax results:
(H+S)* R - [ H + S/(1-T) ] * R * (1-T) = 1 - H * (1-T) +S = (H+S)* R H+S 1 - H - H *T + S = 1 - H + S - H *T
To turn the algebra into specific numbers, assume, for example, a corporation in which half the cost of an investment is expensed and half is basis. Assume the investment in absence of tax of $200 and that $100 of it must be capitalized and produces basis and $100 may be expensed immediately. The ability to deduct means the taxpayer may invest $100/(1-T) = $100/65% or $154 within the $100 budget constraint relying on tax savings of 35%*$154 or $54 to bring down the $154 investment to a $100 net cost. The return at 10% gives $10 on the hard money investment and $15.38 to the soft for a total pretax return of $25.38. Tax at 35%*$25.39 or $8.88 brings the return down to $16.50. The pretax return at 10% of pretax $200 was $20, so the reduction by tax was $20-$16.51 or $3.50. The effective tax rate is calculated as the $3.50 reduction by tax over $20 pretax, which is a 17-1/2% of the pretax return. The effective tax rate is half the statutory tax rate, which consistent with the ET ratio when half of pretax investment was hard money.
= 1 - 1 + Ht/ H+S = H + S H + S H/(H+S) * T Therefore, the effective tax rate is equal to the statutory tax rate times the ratio of the hard money H to the total investment in absence of tax (H+S). This is the ET ratio.
22
22 The statement of return at rate R assumes capital must be returned. Returning $10 for $100 investment is not 10% interest, but $90 theft, so that the total return must be $110. The $100 hard money is basis at the end of the investment and not taxed. The $100 soft money was grossed up to $154 at the outset of the investment, and the deduction of $154 left the taxpayer without basis, so that the full $154 is taxed at the liquidation of the investment. Tax at 35%*$154 or $54 reduces the liquidation proceeds to $100.

Assume now that only one fifth of the pretax investment is hard money. The ET ratio says the effective tax rate should be 35%/5 or 7%. Assume an investment the investment in absence of tax of $500 and that $100 of it must be capitalized and produces basis and $400 may be expensed immediately. The ability to deduct means the taxpayer may invest $400/(1-T) = $400/65% or $615 within the $400. The return at 10% gives $10 on the hard money investment and $61.54 on the soft for a total pretax return of $71.54. Tax at 35%*$71.54 or $25.04 brings the return down to $46.50. The pretax return at 10% of pretax $500 was $50, so the reduction by tax was $50-$46.50 or $3.50. The effective tax rate is calculated as the $3.50 reduction by tax over $50 pretax, which is 7% of the pretax return. The effective tax rate is one-fifth of the statutory tax rate, which consistent with the ET ratio when one-fifth of the half of pretax investment was hard money.
B. Wasting firms or investments
The ET ratio holds true for depreciating investments or for appreciating assets. The ET ratio for depreciation and appreciating assets is shown here with spreadsheets, rather than algebra.
1. Description of the investment as a bank account
.
To show the ratio assume, first, an investment of $100 that will return $26.38 at the end of each year for the next five years. The investment might be a contract for purchase of rentable machinery, or a lease or royalties, or a debt or bank account. In financial analysis, the nature of the investment is abstracted out, leaving just the cash flows, shown at follows:
Cash Flow Chart (1). Five Year 10%-Return Investment
The example was set up to generate a 10% annual return, such that the net present value of $26.38 is $100 using discount rate of 10%, under the standard formula for calculation of present
$26.38 $26.38 $26.38 $26.38 $26.38
($100)
Year 0 1 2 3 4 5
value of an annuity.23
23 PV = A [1- 1/(1+i)n] /i , where is PV is present value, i is discount rate and n is number of periods in which cash flow of A is paid. Therefore A = PV/ {[1- 1/(1+i)n] /i } and 23.10 = $100 / {[1- 1/(1+5%)5] /5%} for n is five years and i is 5%. The present value for an annuity can be derived by series analysis from the longer version, discounting cash flow separately: (1) PV = A/(1+i) + A/(1+i)2 + A/(1+i)3 … A/(1+i)n-1 + A/(1+i)n Multiplying and dividing each term of series (1) by 1-(1+i) will not change the value of (1). The multiplication by 1 will replicate series (1) and the multiplication by – (1+i) will set up a parallel series that will cancel out most of the terms: (2) PV = A/(1+i) + A/(1+i)2 + A/(1+i)3 … A/(1+i)n-1 + A/(1+i)n - A - A/(1+i) - A/(1+i)2 - A/(1+i)n-2 - A/(1+i)n-1 The two lines of series (2) largely cancel each other out and leave (3) PV = -A + A/(1+i)n
To preserve the quality in (1), (3) must also be divided by 1-(1+i), which simplifies to -i. (4) PV = {-A + A/(1+i)n} / -i If we factor out A, and divide both numerator and denominator of (4) by -1, (4) becomes (5) PV= A [1- 1/(1+i)n] /i, which is the standard for the present value of an annuity.
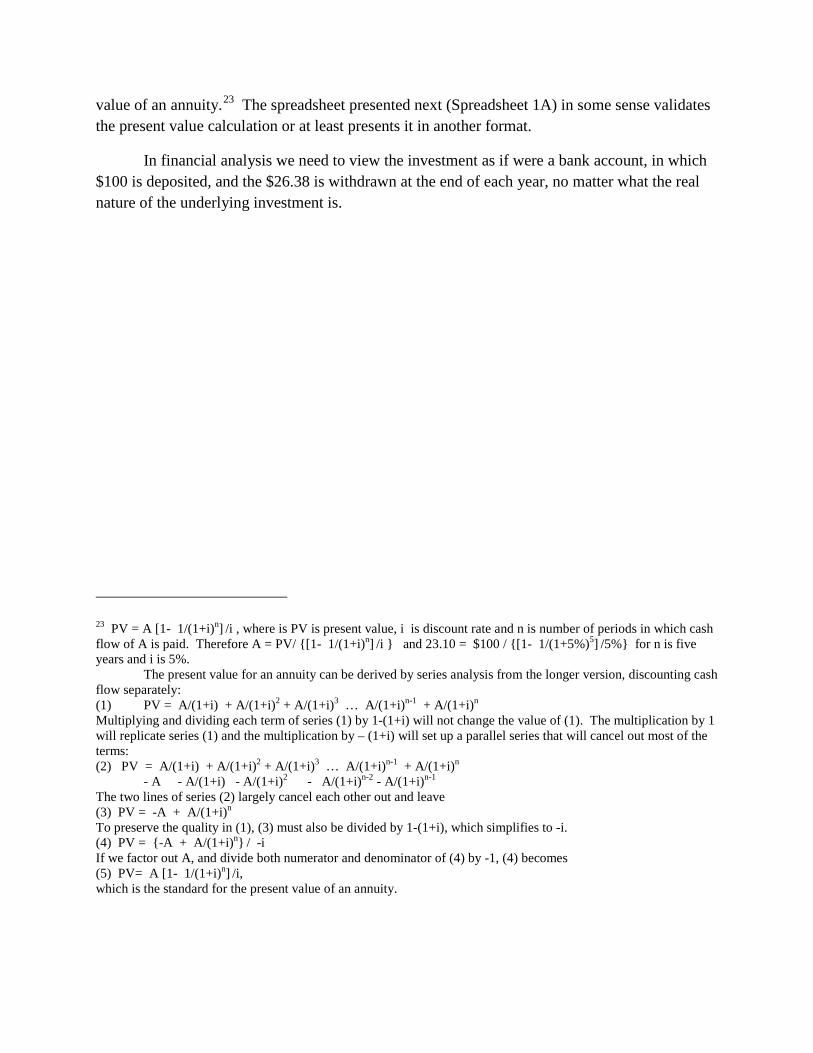
The spreadsheet presented next (Spreadsheet 1A) in some sense validates the present value calculation or at least presents it in another format.
In financial analysis we need to view the investment as if were a bank account, in which $100 is deposited, and the $26.38 is withdrawn at the end of each year, no matter what the real nature of the underlying investment is.

Spreadsheet 1A: Declining Asset: 5 year annuity
year 1 2 3 4 5 6
1. Bank account balance year start (then reduced by row 4.)
$100 $83.62 $65.60 $45.78 $23.98 0
2. Interest
at 10% of prior balance
$10.00 $8.36 $6.56 $4.58 $2.40
3. Withdrawal at year end $26.38 $26.38 $26.38 $26.38 $26.38
4. Withdrawal in excess of interest earned (row 3. less row 2.)
$16.38 $18.02 $19.82 $21.80 $23.98
Row 1 of spreadsheet 1A is the bank account balance of the bank account that is like the investment under examination. In tax terminology, it is the adjusted basis of the investment, when the tax system identifies the interest from the bank account as the taxable income. Row 2 is the interest on the bank account in row 1. The rate remains at 10%, but the amount shrinks as the bank account shrinks. Row 3 is the amount withdrawn every year, that is, the $26.38 positive cash flow. The $26.38 exceeds the amount earned by the depositor as interest at 10%, shown by row 2, so that that the bank account balance shrinks by the amount of the excess withdrawals each year. Row 4 is the withdrawal ($26.38) that in excess of interest of row 1, and it reduces the bank account balance in row 1. Row 4 is a recovery of the $100 investment and not interest and it is not taxed by an income tax. Row 4 can be called depreciation or amortization or recovery of basis in tax terminology. Reducing the basis or bank account balance by the depreciation under the row 4 amounts yields a new bank account balance in the following year of row 1. Each year interest is earned on a reduced bank account, the interest amount is then lower at the constant 10%, and withdrawals in excess of interest reduce the bank account again. At the end of the term, the bank account has been reduced from $100 to zero.
The figures of Spreadsheet 1A are tied together. One can identify the 10% interest in row 2, only by subtracting the depreciation of row 4 from the cash flow withdrawals in line 2. Indeed one can identify the interest in row 2 if and only if the bank account balance is set as indicated by row 1. In tax terminology, the bank account balance in row 1 is the adjusted basis of the investment.
The adjusted basis of row 1 is equal to the present values of the cash flows yet to come. Thus after a year, there are only four $26.38 withdrawals or cash flows yet to come and they have a present value at 10% of $83.62. After two years, there are only three $26.38 cash flows yet to come and they have a present value of $65.90. So after three years, the remaining cash flows have a net present value of $45.78, after four years $23.98 and after five years there is nothing left in the account, nor future cash flows to come. The relationships of adjusted basis to net present value and to the interest on the hypothetical bank account are all inherent in the

mathematics that the present value of a $26.38 five-year annuity is $100. One can identify the 10% interest from the bank account only if the adjusted basis of row 1 is kept equal to the net present value of the future investments.
The amounts in Row 4 of Spreadsheet 1A constitute “economic depreciation” with respect to the 5-year, 10%-return declining value investment. The depreciation deductions in row 4 and the resulting schedule of adjusted basis in Row 1 of the spreadsheet are the necessary tax results to identify and tax the 10% internal rate of return from the investments and make the effective rate of tax equal to the statutory tax rate, as explained next.
2. Full taxation of 10% interest
When the interest (on line 2 of spreadsheet 1A) is subjected to tax, then tax will reduce the internal rate of return from the investment by 35%. A 35% tax on interest can be expected to reduce the 10% interest return down to (1-t) or 65% of the interest and 65% of 10% is 6.5%. Spreadsheet 1B, following, continues the example in spreadsheet 1A, and shows that the internal rate of return goes down, as expected by 35%. Spreadsheet 1B shows the after tax IRR by showing that discounted present value of the after tax cash flows from the investment is equal to the $100 investment when 6.5% is used as the discount rate.
Spreadsheet 1B: After tax value of Spreadsheet 1 Investment. (Continues 1A) year 1 2 3 4 5 5. Tax on interest (35% * row 2.) $3.50 $2.93 $2.30 $1.60 $0.84 6. Withdrawal less tax (row 3. less row 5.) $22.88 $23.45 $24.08 $24.78 $25.54 7. Discounting row 6 @ found 6.5%.
/ (1+6.5%) / (1+6.5%)2 / (1+6.5%)3 / (1+6.5%)4 / (1+6.5%)5
8. Present value $21.48 $20.68 $19.94 $19.26 $18.64 9. Sum of row 8 $100
The definition of internal rate of return is that it is the discount rate “i” that will reduce the net present value to zero:
(1) 0 = -100 + 21.48/(1+i) + 20.68/(1+i)2 + 19.94/(1+i)3 + 19.26/(1+i)4 + 18.64/(1+i)5
In other words, the present value of the future cash flows are equal to the present value of investment:
(2) 100 = 21.48/(1+i) + 20.68/(1+i)2 + 19.94/(1+i)3 + 19.26/(1+i)4 + 18.64/(1+i)5
There is a unique answer that will satisfy the “i” in equations (1) and (2), but the “i” can not be isolated from all the differing exponents simultaneously so the equations can not be solved by
algebra. The solution must be found by trial and error, or by computers with algorithms that hone in on a solution by trial and error. The 6.5% discount rate in Spreadsheet (1B) was found by Excel program “Goalseek” function. Once the rate is found it can be validated by testing it in equations (1) or (2).
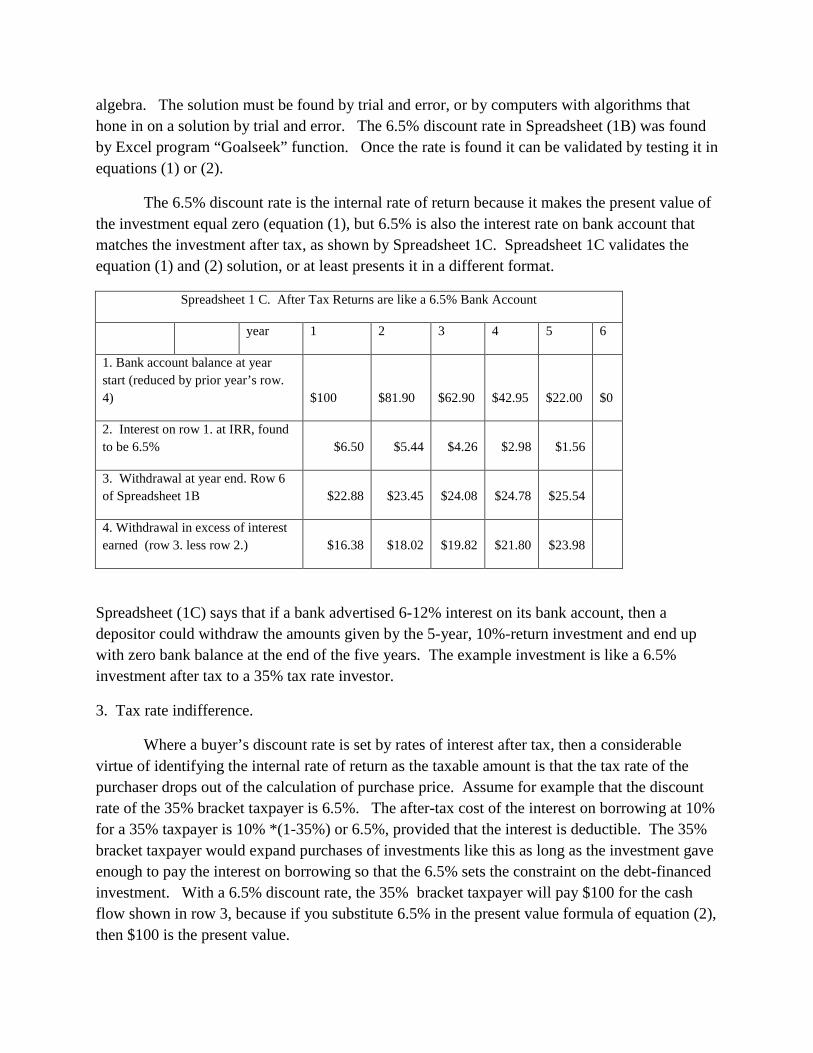
The 6.5% discount rate is the internal rate of return because it makes the present value of the investment equal zero (equation (1), but 6.5% is also the interest rate on bank account that matches the investment after tax, as shown by Spreadsheet 1C. Spreadsheet 1C validates the equation (1) and (2) solution, or at least presents it in a different format.
Spreadsheet 1 C. After Tax Returns are like a 6.5% Bank Account
year 1 2 3 4 5 6
1. Bank account balance at year start (reduced by prior year’s row. 4) $100 $81.90 $62.90 $42.95 $22.00 $0
2. Interest on row 1. at IRR, found to be 6.5% $6.50 $5.44 $4.26 $2.98 $1.56
3. Withdrawal at year end. Row 6 of Spreadsheet 1B $22.88 $23.45 $24.08 $24.78 $25.54
4. Withdrawal in excess of interest earned (row 3. less row 2.) $16.38 $18.02 $19.82 $21.80 $23.98
Spreadsheet (1C) says that if a bank advertised 6-12% interest on its bank account, then a depositor could withdraw the amounts given by the 5-year, 10%-return investment and end up with zero bank balance at the end of the five years. The example investment is like a 6.5% investment after tax to a 35% tax rate investor.
3. Tax rate indifference.
Where a buyer’s discount rate is set by rates of interest after tax, then a considerable virtue of identifying the internal rate of return as the taxable amount is that the tax rate of the purchaser drops out of the calculation of purchase price. Assume for example that the discount rate of the 35% bracket taxpayer is 6.5%. The after-tax cost of the interest on borrowing at 10% for a 35% taxpayer is 10% *(1-35%) or 6.5%, provided that the interest is deductible. The 35% bracket taxpayer would expand purchases of investments like this as long as the investment gave enough to pay the interest on borrowing so that the 6.5% sets the constraint on the debt-financed investment. With a 6.5% discount rate, the 35% bracket taxpayer will pay $100 for the cash flow shown in row 3, because if you substitute 6.5% in the present value formula of equation (2), then $100 is the present value.
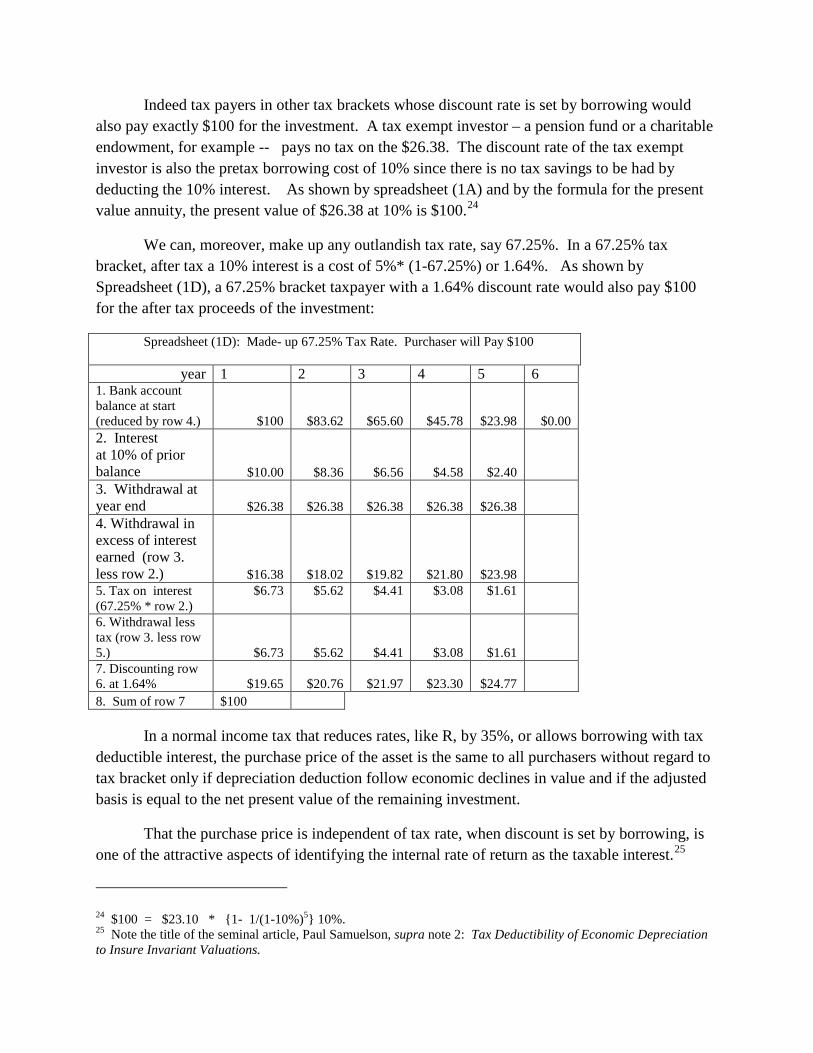
Indeed tax payers in other tax brackets whose discount rate is set by borrowing would also pay exactly $100 for the investment. A tax exempt investor – a pension fund or a charitable endowment, for example -- pays no tax on the $26.38. The discount rate of the tax exempt investor is also the pretax borrowing cost of 10% since there is no tax savings to be had by deducting the 10% interest. As shown by spreadsheet (1A) and by the formula for the present value annuity, the present value of $26.38 at 10% is $100.24
Spreadsheet (1D): Made- up 67.25% Tax Rate. Purchaser will Pay $100
We can, moreover, make up any outlandish tax rate, say 67.25%. In a 67.25% tax bracket, after tax a 10% interest is a cost of 5%* (1-67.25%) or 1.64%. As shown by Spreadsheet (1D), a 67.25% bracket taxpayer with a 1.64% discount rate would also pay $100 for the after tax proceeds of the investment:
year 1 2 3 4 5 6 1. Bank account balance at start (reduced by row 4.) $100 $83.62 $65.60 $45.78 $23.98 $0.00 2. Interest at 10% of prior balance $10.00 $8.36 $6.56 $4.58 $2.40
3. Withdrawal at year end $26.38 $26.38 $26.38 $26.38 $26.38
4. Withdrawal in excess of interest earned (row 3. less row 2.) $16.38 $18.02 $19.82 $21.80 $23.98
5. Tax on interest (67.25% * row 2.)
$6.73 $5.62 $4.41 $3.08 $1.61
6. Withdrawal less tax (row 3. less row 5.) $6.73 $5.62 $4.41 $3.08 $1.61
7. Discounting row 6. at 1.64% $19.65 $20.76 $21.97 $23.30 $24.77
8. Sum of row 7 $100 In a normal income tax that reduces rates, like R, by 35%, or allows borrowing with tax deductible interest, the purchase price of the asset is the same to all purchasers without regard to tax bracket only if depreciation deduction follow economic declines in value and if the adjusted basis is equal to the net present value of the remaining investment.
That the purchase price is independent of tax rate, when discount is set by borrowing, is one of the attractive aspects of identifying the internal rate of return as the taxable interest.25
24 $100 = $23.10 * {1- 1/(1-10%)5} 10%. 25 Note the title of the seminal article, Paul Samuelson, supra note 2: Tax Deductibility of Economic Depreciation to Insure Invariant Valuations.

Identifying internal rate of return as taxable income will make the purchase price be equal for all investors, without regard to their tax bracket, however, only if we can assume that both the interest and the discount rate are reduced by tax at the same rate t, and result in i*(1-t) after tax. The discount rate does not have to be fixed by a taxpayers tax-deductible borrowing, but if the discount rate is set by some alternative investment, the return from the investment has to come into equilibrium with fully taxed interest or tax-deductible interest. If the taxpayer gets a return better than i*(1-t) after tax and after competition among investments than the tax rate will determine purchase price. For example, if all three taxpayers have access to a 10% untaxed discount rate, then the tax exempt taxpayer will pay $100 for the property, the 35% tax bracket taxpayer will pay $91.06, and the 67.25% tax bracket taxpayer will pay $82.82 for the investment.26
Assume again a 5-year, 10%-return, constant cash flow return investment. In absence to tax, the investment would be $100 in year zero and cash flows of $26.38 for pretax return of 10%, just as in spreadsheet 1A. Assume now, however, that that the taxpayer’s investment can be expensed immediately, as, for example, investments in computer games or internal goodwill are expensed. The upfront deduction allows the taxpayer to expand the investment, relying on the reimbursement or tax savings from the immediate deduction. As noted, a $100 investment can be grossed to S/(1-T), or here $100/(1-35%) or $154. The savings at 35%* $154 or $54 reduce the cost of the $154 back down to the $100 budget constraint. Spreadsheet 1E assumes that the same 10% return will be available on a $154 as on the $100 investment. It shows that $30.77 for five years will be sufficient to give the 10% interest, recover the $154 investment by leaving the bank account at zero by reason of withdrawals at the end of the five years. The
Indentifying interest (row 2 of Spreadsheets (1A) and (1D)) is possible only if the adjusted basis of the investment is kept at the amounts of Row 1 or net present value of future cash flows. When basis drops below the “bank account” balance, then taxable income does not describe the interest return and the internal rate of return does not drop by the statutory tax rate. Indeed, when the full $100 investment is deducted at once, tax does not reduce the internal rate of return. When half the investment is deducted at once, so adjusted basis drops to $50, then the internal rate of return is only one half the statutory tax rates.
4. Expensing of investments.
The internal rate of return from the investment is unaffected by tax when the investment is deducted in full immediately. A zero basis in the asset, implies a zero internal rate of return reducing effective tax rate.
26 Row 6 of Spreadsheet (1B) has a net present value of $91.06 at a 10% discount rate and row 6 of Spreadsheet (1D) has a net present value of $82.82 at a 10% discount rate.

$30.77 can be calculated under the standard formula for present value of an annuity,27
Spreadsheet 1E Expensing of 5-year 10%-return asset
or it can be found by trial and error with the Excel goalseek program.
1 2 3 4 5 6
1. Bank account balance at start of year (reduced by prior row 4) $154 $123.08 $92.31 $61.54 $30.77 $0.00
2. Interest rate on row 1 at 10% $15.38 $12.31 $9.23 $6.15 $3.08
3. Withdrawal (positive cash flow) $30.77 $30.77 $30.77 $30.77 $30.77
4. Withdrawal in excess of interest (row 3 less row 2 $15.38 $18.46 $21.54 $24.62 $27.69
Once the $154 is expensed, there is no further basis to deduct. Row 1 no longer presents adjusted basis and row 4 no longer represents the allowable depreciation. All the positive cash flow or withdrawal in row 3 is subject to tax, here at 35%, and the tax reduces the cash flows so that they have a 10% internal rate of return after tax. Spreadsheet 1F continues the spreadsheet 1B investment showing the after tax 10% return:
27 Amount A will satisfy the present value formula that net present value , is equal to A * [1-1/(1+i)n] /i Wwith $154 equal to net present value, i to 10% and n to 5 years, amount A the constant cash flow for five years is equal to $30.77. Spreadsheet 2A shows the results in another format.

Spreadsheet 1F. Tax on the Expensed 5-year Return
1 2 3 4 5
5 Tax on withdrawal (35% of row 3) $14.20 $14.20 $14.20 $14.20 $14.20
6. After tax cash flows. (Row 5. less row 5) $26.38 $26.38 $26.38 $26.38 $26.38
7. After tax cash flows discounted by (1+10%)n. $23.98 $21.80 $19.82 $18.02 $16.38
8. Sum of the discounted cash flows. $100
Spreadsheet 1F shows the investment has a 10% internal rate of return after tax because the discounted present value of the after tax cash flows at 10% is equal to the $100 cost. The investment went from a 10% return pretax to a 10% return post tax which means that tax did not reduce the internal rate of return and that the effective tax rate was zero.
Expensing prevents tax from reducing the internal rate of return from the investment because the value of the tax savings up front is equal to the tax taken out of cash flows. The government becomes a fair partner contributing 35% in reimbursement of the investment’s cost as well as taking out 35% of the returns. Cash flow chart (2) superimposes the effect of tax on the original $100, five-year 10% investment. With tax, the investment could be $154, grossed up from $100, to yield cash flows of $30.77, rather than $26.33. But at the center of the cash flow chart, marked in bold, is the taxpayer’s (1-T) share of the investment which is identical to the pretax investment shown in Cash Flow Chart (1):

Cash Flow Cart (2): The Government as a Fair Partner: Pretax Investment at 10% Shown Inside Grossed up Expensed Investment.
5. Mixed Soft & Hard: The ET Ratio.
a. Half hard, half soft money
The after-tax cash flow for each half of the in-absence-of-tax $200 investment has already been calculated. Spreadsheet (1G) below collects the information into one overall investment, half hard money and half soft money.
. Assume now an investment of $200 in the same five year, 10%-return, constant cash flow investment. Assume, however, that $100 has to be capitalized and becomes basis, that is, hard money investing in amount H. Assume that the other half of the investment is soft money of $100, or S, which can be can be expensed immediately. The ability to deduct the $100 allows the taxpayer to gross up the investment to S/(1-T), which with S of $100 and T of 35% becomes an $154 in reliance on the tax savings or reimburse of 35%*$154 or $54. Half the investment is hard money and half the investment is soft money.
$26.38 $26.3 8 $26.38 $26.38 $26.38
$30.77 $30.77 $30.77 $30.77 $30.77
($100)
$154
Cash flows in absence of tax (in Bold)

Spreadsheet 1G Half Soft, Half Hard Money
1 2 3 4 5 6
1. Basis from Hard Money (from row 1 of spreadsheet (1A) $100 $83.62 $65.60 $45.78 $23.98 $0.00
1A. Basis from soft money 0 0 0 0 0
1B Total basis. $100 $83.62 $65.60 $45.78 $23.98 $0.00
2A. After tax cash flows from Hard Money (from row 6. of spreadsheet 1B.
$22.88 $23.45 $24.08 $24.78 $25.54
2B. After tax cash flows from Soft money (from row 6 of spreadsheet 1F) $26.38 $26.38 $26.38 $26.38 $26.38
2C. Sum of the after tax cash flows from both Hard and Soft (row 2A + 2B) $49.26 $49.83 $50.46 $51.16 $51.92
3. Discounted value of after tax cash flows at 8.25%
$45.51 $42.52 $39.78 $37.26 $34.93
4. Sum of the discounted values
$200
Spreadsheet 1G shows that the internal rate of return from the $200 investment is 8.25%. Since the investment started as a 10% return in absence of tax, tax reduced by the return from to 10% to $8.25% or by 17.5%. The effective tax rate is accordingly 17.5%:
Effective tax rate = (IRRpretax – IRRposttax) / IRRpretax = (10%- 8.25%)/ 10% = 1.75%/10% =17.5%

The investment for spreadsheet 1G was half hard money, capitalized costs or basis. According to the effective tax ratio, the effective tax rate should be one half of the statutory tax rate:
Effective tax rate = H/(H+S)* T = 100/200 * 35% = 17.5%
The adjusted basis for this investment, shown in row 2B of spreadsheet 1G is also one half of what the adjusted basis would be if tax were to identify and tax the 10% rate of return.
b. One-fifth hard money. One can also do the same exercise under the assumption that the hard money investment remains at $100, but the soft money investment is $400 (grossed up however by the tax reimbursement). Under the ET ratio, the effective tax rate should be one fifth of 35% for a 7% rate. The internal rate of return from the investment after tax should drop by 7% from 10% internal rate of return to an after tax 9.3%. Spreadsheet 1H has a logic exactly like 1G, except that the soft money investment is four times larger, so the after tax return (row 2B) is four times larger. Spreadsheet 1H shows that the ET ratio holds true for the constant five-year cash flow investment when hard-money basis H, is one fifth of the total investment in absence of tax:

Spreadsheet 1H One-fifth Hard Money Basis
year 1 2 3 4 5 6
1. Basis from Hard Money (from row 1 of spreadsheet (1A) $100 $83.62 $65.60 $45.78 $23.98 $0.00
1A. Basis from soft money 0 0 0 0 0
1B Total basis. $100 $83.62 $65.60 $45.78 $23.98 $0.00
2A. After tax cash flows from Hard Money (from row 6. of spreadsheet 1B.
$22.88 $23.45 $24.08 $24.78 $25.54
2B. After tax cash flows from Soft money (four times row 6 of spreadsheet 1F) $105.52 $105.52 $105.52 $105.52 $105.52
2C. Sum of the after tax cash flows from both Hard and Soft (row 2A + 2B) $128.40 $128.97 $129.60 $130.30 $131.06 $128.40
3. Discounted value of after tax cash flows at 9.3%
$45.51 $42.52 $39.78 $37.26 $34.93
4. Sum of the discounted values
$500
Spreadsheet 1H shows that the after tax internal rate of return from the absence of tax $500 investment is 9.3%. Since the investment started as a 10% return in absence of tax, tax reduced by the return from to 10% to 9.3% or by 0.7%. The effective tax rate is accordingly 7%:

Effective tax rate = (IRRpretax – IRRposttax) / IRRpretax = (10%- 9.3%)/ 10% = 0.7%/10% =7%
The investment for spreadsheet 1G was one-fifth hard money, capitalized costs or basis, by comparison to the $500 investment in absence of tax. According to the effective tax ratio, the effective tax rate should be one fifth of the statutory tax rate:
Effective tax ratio = H/(H+S)* T = 100/500 * 35% = 7%
The basis in row 1 of spreadsheet 1H is always exactly one-fifth of what it would be if the tax were to identify internal rate of return as the taxable income and reduce it by the statutory tax rate.
C. Appreciating Investment.
The ET ratio works not just for a perpetuity, shown by algebra, and for a depreciating asset but also for an appreciating asset. Assume now that $100 invested in absence of tax will grow at 10% compounded annually to 100* (1+10%)5 which equals $161.05 after five years. In absence of tax, the cash flow looks as follows:
Cash Flow Chart 3: Compound growth at 10%
a. Identification of interest. The following spreadsheet 2A identifies the interest-like return on the investment in chart 3 and reduces the internal rate of return by the statutory tax rate:
($100)
Year 0 1 2 3 4 5
$161.05

Spreadsheet 2A Investment Appreciating at 10% per year. Tax Reduces 10% by Statutory Tax Rate
year 0 1 2 3 4 5
1. Basis when compound growth is taxed. $100.00 $110.00 $121.00 $133.10 $146.41 $161.05
2. Taxable income (10% of prior basis in row 1)
$10.00 $11.00 $12.10 $13.31 $14.64
3. Tax on row 2. at 35%.
$3.50 $3.85 $4.24 $4.66 $5.12
4. After tax cash flows. ($100) -$3.50 -$3.85 -$4.24 -$4.66 $155.93
5. Present value of row 4 at 6.5%
($100) -$3.29 -$3.39 -$3.51 -$3.62 $113.81
6. Sum of the present values of row 5.
0
Spreadsheet 2A shows that tax on the 10% interest will reduce the internal rate of return from the investment from 10% to 6.5%, which is consistent with the 35% statutory tax rate.
The basis that will identify the internal rate of return is the net present value of the future $146.41 and the basis rises by 10% at the final $146.41 payment gets closer. The pattern is the compound growth under which original issue discount taxed as the discount expires as the final payment draws closer. The taxation of the interest requires taxation of unrealized appreciation, but the tax code commonly taxes expiration of the discount rate as interest, even though the interest is not received but compounds.28
If the $100 investment may be expensed, and becomes soft money, the $100 may be grossed up by $100/(1-35%) = $154. The return at 10% compounded is then $154* (1+10%)5
Spreadsheet 2A does not show it, but the appreciating 5 year, 10% investment will be worth $100 to all taxpayers, no matter what their tax bracket so long as their discount rate is determined by deductible interest or by alternative investments giving R*(1-T) return after tax.
28 See, e.g. IRC §1272(current inclusion of original issue discount); §7872(b) (original issue discount found in low interest loans between related parties).

or $247.77. When the basis is used at once, the entire $247.77 is subject to the 35% tax, but the 35% tax does not reduce the internal rate of return below 10%:
Spreadsheet 2B Expensed Investment, growing at 10% per year. Tax does not reduce internal rate of return.
Year 0 1 2 3 4 5
1. Pretax cash flow. ($153.85) 0 0 0 0 $247.77
2. Tax on cash flow at 35% (parenthesis is tax savings) ($53.85) 0 0 0 0 $86.72
3. After tax cash flows (row 1 minus row 2) -$100.00 $161.05
Internal rate of return of row 3 10%
Row 3, the after tax cash flows, with expensing is identical to the cash flows from the $100 investment in absence of tax. The cash flows have a 10% return because $100*(1+10%)5
will equal $161.05 and therefore 10% will make the net present value of the investment equal to zero. With expensing the government has become a fair partner contributing the same 35% at the beginning of the investment by tax savings as it takes out at the end by tax. The effective rate of tax is zero because tax did not reduce the 10% pretax return.
Expensing for an appreciating investment can be viewed, as for a depreciating asset, as if the government had been a fair partner to the investment. The 35% tax reimbursement at the beginning of the investment allows the taxpayer to gross up the $100 investment and the 35% tax at the end of the investment just took out the interest of a 35% fair partner:
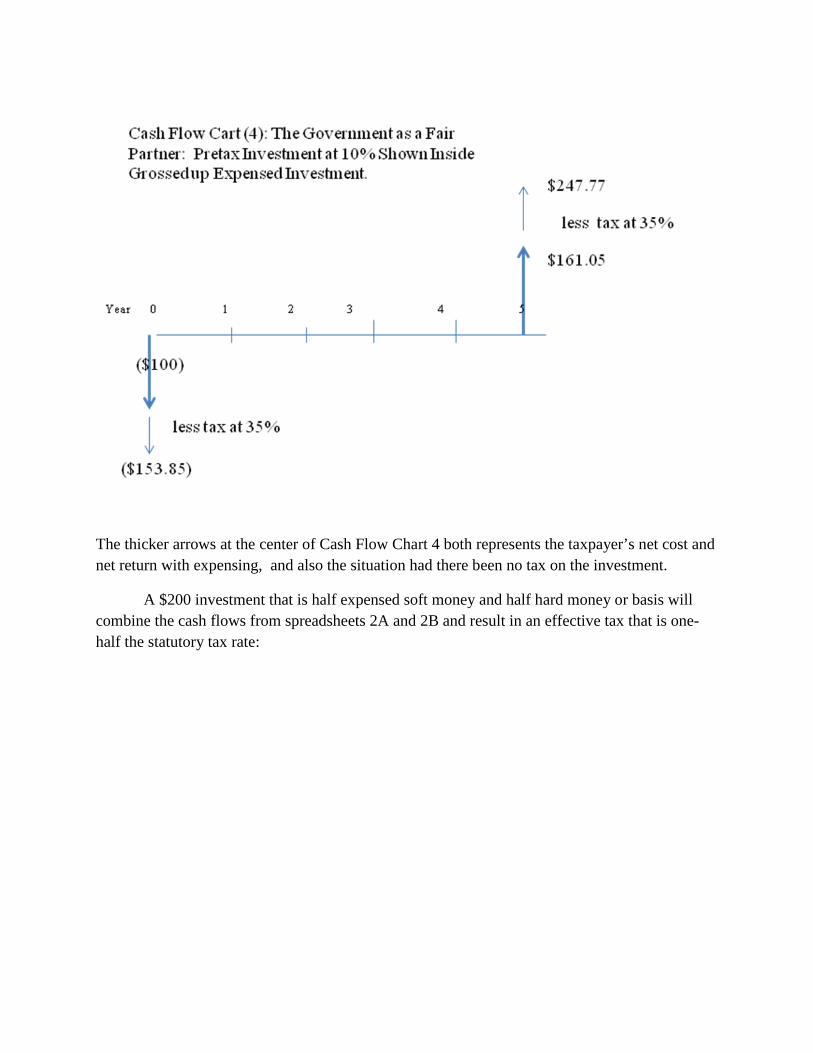
The thicker arrows at the center of Cash Flow Chart 4 both represents the taxpayer’s net cost and net return with expensing, and also the situation had there been no tax on the investment.
A $200 investment that is half expensed soft money and half hard money or basis will combine the cash flows from spreadsheets 2A and 2B and result in an effective tax that is one-half the statutory tax rate:
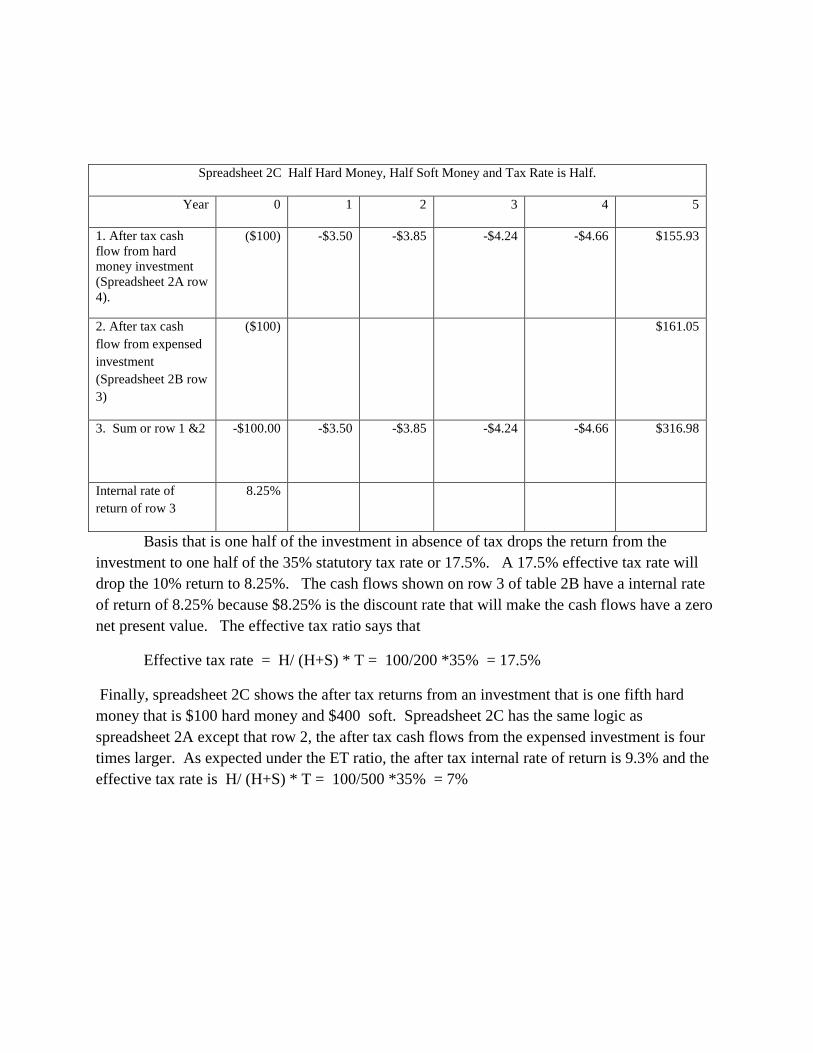
Spreadsheet 2C Half Hard Money, Half Soft Money and Tax Rate is Half.
Year 0 1 2 3 4 5
1. After tax cash flow from hard money investment (Spreadsheet 2A row 4).
($100) -$3.50 -$3.85 -$4.24 -$4.66 $155.93
2. After tax cash flow from expensed investment (Spreadsheet 2B row 3)
($100) $161.05
3. Sum or row 1 &2 -$100.00 -$3.50 -$3.85 -$4.24 -$4.66 $316.98
Internal rate of return of row 3
8.25%
Basis that is one half of the investment in absence of tax drops the return from the investment to one half of the 35% statutory tax rate or 17.5%. A 17.5% effective tax rate will drop the 10% return to 8.25%. The cash flows shown on row 3 of table 2B have a internal rate of return of 8.25% because $8.25% is the discount rate that will make the cash flows have a zero net present value. The effective tax ratio says that
Effective tax rate = H/ (H+S) * T = 100/200 *35% = 17.5%
Finally, spreadsheet 2C shows the after tax returns from an investment that is one fifth hard money that is $100 hard money and $400 soft. Spreadsheet 2C has the same logic as spreadsheet 2A except that row 2, the after tax cash flows from the expensed investment is four times larger. As expected under the ET ratio, the after tax internal rate of return is 9.3% and the effective tax rate is H/ (H+S) * T = 100/500 *35% = 7%

Spreadsheet 2D. One-fifth Hard Money and Tax is One-Fifth
Year 0 1 2 3 4 5
1. After tax cash flow from hard money investment (Spreadsheet 2A row 4).
($100) -$3.50 -$3.85 -$4.24 -$4.66 $155.93
2. After tax cash flow from expensed investment (Spreadsheet 2B row 3)
($400) $644.20
3. Sum or row 1 &2 ($500) ($3.50) ($3.85) ($4.24) ($4.66) $800.13
Internal rate of return of row 3
9.3%
II. Estimating the Effective Tax Ratio for Public Companies.
The financial statements that publically traded corporations must make public provide enough information to estimate the ET ratio for the corporation as a whole. Annual reports including the financial statements publically traded corporations are now easily accessible online at the SEC website.29
29
Spreadsheet (3), following, shows the ET ratio and effective tax rate for eight public companies: Google, Lorillard Tobacco, Activision, Take Two, Dell Computers, Wal-Mart, JetBlue and Macy’s. . The sample is not big and it was selected to give a range of results with a decided bias toward well know corporations. Companies with hard to assess preferred stock and other complexities were dropped out. The analysis assumed that all taxable income was taxed at 35%, because the data was not clear or reliable enough to use any other assumption; the analysis thus misses lower tax due to permanent items including, e.g., earnings in foreign subsidiaries, tax credits for subsidized activity, tax exempt municipal bonds, or corporate owned life insurance or any of myriad of corporate tax shelters.
http://www.sec.gov/edgar/searchedgar/webusers.htm provides a portal to Annual Reports, including financial statements filed with the SEC.

The sample does show a very large variation in the effective tax rate that corporations pay. The expensing of investments in intangibles explains most of the divergence in effective tax rate.
The overall logic of spreadsheet 3 is that the effective rate of tax depends on the ratio of capitalized investment to total investment of the Corporation. The ET ratio is H/(H+S) and the effective tax rate is [H/(H+S)]* T where T is the 35% statutory tax rate, H is the capitalized or hard-money investment and S is the non-basis or soft money investment, both H and S in absence of tax.
The market capitalization of the corporation is the estimate of the total value of the corporation’s investments. The estimate is made by the smart market investors who set price. Market capitalization can be expected to be a better estimate of real investment value than any accounting based figures.30
H or hard money investments is the adjusted basis of the corporation’s total assets. Total assets (row 6 ) are found on each corporation’s financial statements balance sheet. “Adjusted basis” is the tax term parallel to the accounting term, “assets” Tax and accounting have different rules for capitalizing costs and for the time or pattern for depreciation, (moving capitalized asset costs over to current expenses) that lead to different figures for “assets” and “adjusted basis.” Accounting standards, however, require the corporation identify when the tax depreciation or expensing of assets has exceeded the accounting-standards depreciation or expensing. The deferred tax liability (row 7) is the accounting record of current tax saved that would not have been saved had the accounting-standards rules for expensing and depreciation been used. The “deferred tax liability” account, however, records tax rather than tax base, so that to get to the tax-base adjustment to book assets, one must divide the tax amounts of the “deferred tax liability” accounts by the tax rate (row 8, the deferred tax liability adjustment), assumed here at 35%. Subtracting the deferred tax adjustment (row 7) from corporate “assets” (row 6) yields an approximation of the corporation’s total adjusted basis in its investments. (row8). Both tax and book accounting generally provide for expensing of the costs of intangible investments, so the adjustments for deferred tax liability have no effect in moving from book “assets” to tax “adjusted basis.” Permanent tax advantages are also not part of the deferred tax liability so the figures do not pick up the tax advantages to the corporation from such things as tax-exempt municipal bonds, corporate owned life insurance, and tax credits for oil and research. Permanent differences can be expected to be significant but they are beyond the scope of this study.
Market capitalization is share price (row 1 of spreadsheet 3) times number of shares outstanding (row 2) to yield equity value (row 3). Equity value (row 3) is added to total liabilities (row 4) to reach market capitalization (row 5).
30 See, .e.g., Burton Malkiel, Is the Stock Market Efficient?, Science 1313, 1317 (March 10, 1989)(answering largely yes); Foot & Perold, New Trading Practices and Short-Run Market Efficiency, NBER Working Paper No. 3498 (Oct. 1990)(arguing that stock prices react fully to news within 15 minutes of the time the news becomes available).
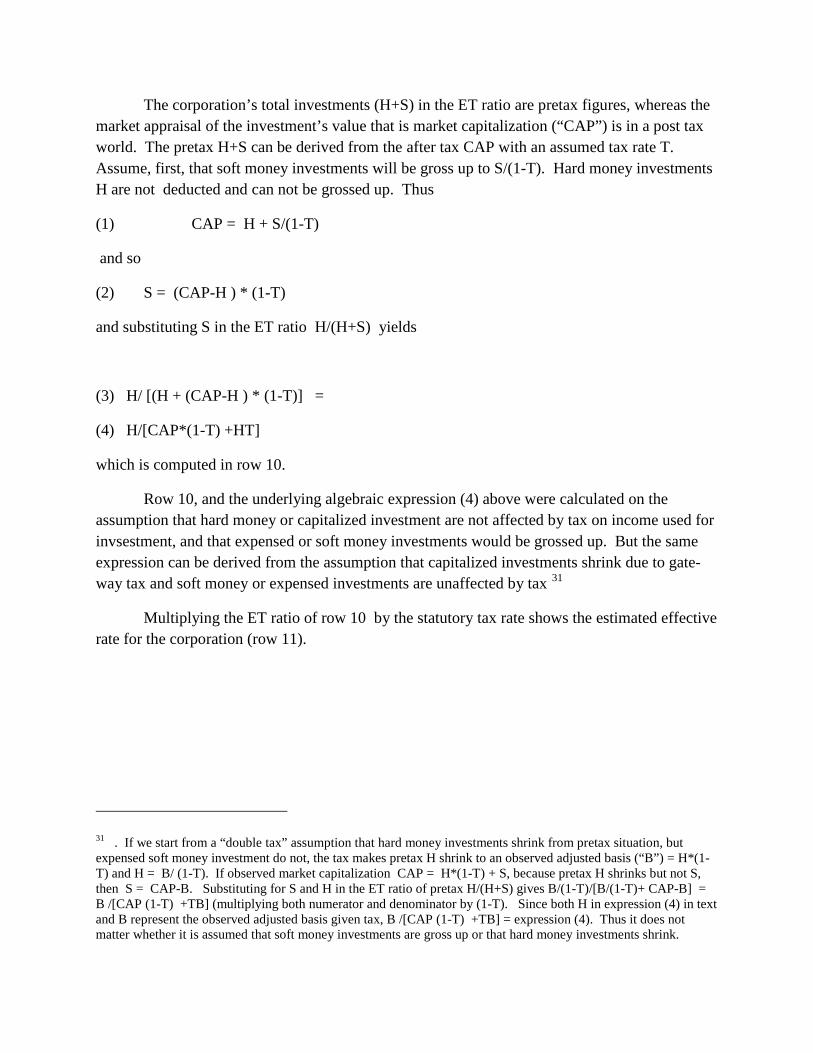
The corporation’s total investments (H+S) in the ET ratio are pretax figures, whereas the market appraisal of the investment’s value that is market capitalization (“CAP”) is in a post tax world. The pretax H+S can be derived from the after tax CAP with an assumed tax rate T. Assume, first, that soft money investments will be gross up to S/(1-T). Hard money investments H are not deducted and can not be grossed up. Thus
(1) CAP = H + S/(1-T)
and so
(2) S = (CAP-H ) * (1-T)
and substituting S in the ET ratio H/(H+S) yields
(3) H/ [(H + (CAP-H ) * (1-T)] =
(4) H/[CAP*(1-T) +HT]
which is computed in row 10.
Row 10, and the underlying algebraic expression (4) above were calculated on the assumption that hard money or capitalized investment are not affected by tax on income used for invsestment, and that expensed or soft money investments would be grossed up. But the same expression can be derived from the assumption that capitalized investments shrink due to gate-way tax and soft money or expensed investments are unaffected by tax 31
Multiplying the ET ratio of row 10 by the statutory tax rate shows the estimated effective rate for the corporation (row 11).
31 . If we start from a “double tax” assumption that hard money investments shrink from pretax situation, but expensed soft money investment do not, the tax makes pretax H shrink to an observed adjusted basis (“B”) = H*(1-T) and H = B/ (1-T). If observed market capitalization CAP = H*(1-T) + S, because pretax H shrinks but not S, then S = CAP-B. Substituting for S and H in the ET ratio of pretax H/(H+S) gives B/(1-T)/[B/(1-T)+ CAP-B] = B /[CAP (1-T) +TB] (multiplying both numerator and denominator by (1-T). Since both H in expression (4) in text and B represent the observed adjusted basis given tax, B /[CAP (1-T) +TB] = expression (4). Thus it does not matter whether it is assumed that soft money investments are gross up or that hard money investments shrink.

Effective Tax Rate [H/(S+H)]*T
(in millions, except for share price and percentages}
Google Lorillard Activision Take Two Dell Wal-Mart Jetblue Macy's
1. share price32 $533.44 $68.55 $25.00 $24.95 $24.37 $59.06 $4.07 $18.55
2. shares outstanding 313 174 283 74 2060 3973 182 420
3. equity value (row 1* rw2) 166,922 $11,928 $7,075 $1,853 $50,202 $234,645 $739 $7,785
4. total liabilities $2,136 1,433 $382 $360 $23,732 $88,253 $3,844 $14,447
5. Market Capitalization (rw3+rw4) 169,058 $13,361 $7,457 $2,213 $73,934 $322,898 $5,598 $22,232
6. Balance-sheet Assets $25,336 $2,350 $1,794 $831
$27,561 $163,514 $6,050 $27,789
7. deferred tax $478 $5,111 $192 $1,446
8. deferred tax adjust (rw7÷.35) $1,367 $14,603 $549 $4,131
9. Adjusted basis (rw6 –rw8) $23,969 $2,350 $1,720 $831 $27,561 $148,911 $5,501 $23,658
10. Effective tax Ratio H/[Cap*(1-T) +H*T] 20.3% 24.7% 31.6% 33.2% 47.76% 56.8% 98.9% 104.1%
32 The stock prices for Google, HP, Wal-Mart and Macy’s are as of July 17, 2008. Dates for other stock quotes are Aug. 6 (Lorillard Tobacco), @@ (copy to come).
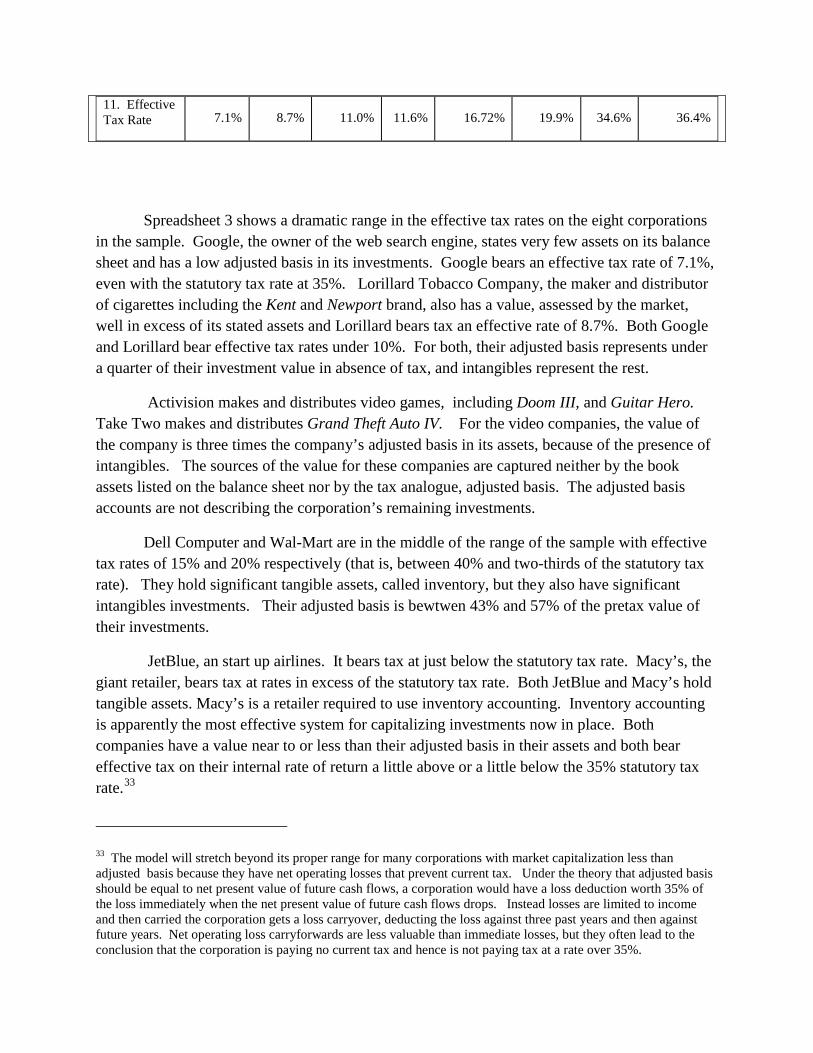
11. Effective Tax Rate 7.1% 8.7% 11.0% 11.6% 16.72% 19.9% 34.6% 36.4%
Spreadsheet 3 shows a dramatic range in the effective tax rates on the eight corporations in the sample. Google, the owner of the web search engine, states very few assets on its balance sheet and has a low adjusted basis in its investments. Google bears an effective tax rate of 7.1%, even with the statutory tax rate at 35%. Lorillard Tobacco Company, the maker and distributor of cigarettes including the Kent and Newport brand, also has a value, assessed by the market, well in excess of its stated assets and Lorillard bears tax an effective rate of 8.7%. Both Google and Lorillard bear effective tax rates under 10%. For both, their adjusted basis represents under a quarter of their investment value in absence of tax, and intangibles represent the rest.
Activision makes and distributes video games, including Doom III, and Guitar Hero. Take Two makes and distributes Grand Theft Auto IV. For the video companies, the value of the company is three times the company’s adjusted basis in its assets, because of the presence of intangibles. The sources of the value for these companies are captured neither by the book assets listed on the balance sheet nor by the tax analogue, adjusted basis. The adjusted basis accounts are not describing the corporation’s remaining investments.
Dell Computer and Wal-Mart are in the middle of the range of the sample with effective tax rates of 15% and 20% respectively (that is, between 40% and two-thirds of the statutory tax rate). They hold significant tangible assets, called inventory, but they also have significant intangibles investments. Their adjusted basis is bewtwen 43% and 57% of the pretax value of their investments.
JetBlue, an start up airlines. It bears tax at just below the statutory tax rate. Macy’s, the giant retailer, bears tax at rates in excess of the statutory tax rate. Both JetBlue and Macy’s hold tangible assets. Macy’s is a retailer required to use inventory accounting. Inventory accounting is apparently the most effective system for capitalizing investments now in place. Both companies have a value near to or less than their adjusted basis in their assets and both bear effective tax on their internal rate of return a little above or a little below the 35% statutory tax rate.33
33 The model will stretch beyond its proper range for many corporations with market capitalization less than adjusted basis because they have net operating losses that prevent current tax. Under the theory that adjusted basis should be equal to net present value of future cash flows, a corporation would have a loss deduction worth 35% of the loss immediately when the net present value of future cash flows drops. Instead losses are limited to income and then carried the corporation gets a loss carryover, deducting the loss against three past years and then against future years. Net operating loss carryforwards are less valuable than immediate losses, but they often lead to the conclusion that the corporation is paying no current tax and hence is not paying tax at a rate over 35%.

The statutory tax rates for all of the companies in the sample is 35%, but the companies bear very different taxes in terms of affect on their internal rates of return. The primary explanation of the differences is how well the adjusted basis accounts describe the value of the corporation’s investments. Corporations with large intangibles have relatively low basis because neither tax nor book accounting capitalize intangibles.

Conclusion.
Corporations have widely divergent effective tax rates because they have widely different fractions of their investments which are capitalized. The effective tax measures the reduction in the internal rate of return a corporation makes. The effective tax ratio is the ratio of the corporation’s adjusted basis in its assets to the fair market value of its investments, both measured on a pretax basis. The effective tax ratio times the statutory tax rate measures the effective tax rate on the corporation.
The wide divergent in effective tax mean that the corporate tax is doing damage to the allocation of capital that is in excess of the tax revenue passed over from the corporations to government. By presumption the pretax revenue represents real consumer demand and the pretax revenue after costs represent the profit and in turn the value of the company derived from real demand. Investors look to the situation after tax and the differential tax rates are distorting investors decisions by channeling their capital into the low taxed corporations and away from the high tax rate corporations. There is no engineering behind the results. No one would favor Lorillard Tobacco Company above all others if the choice were thoughtful. Avon Products are not poisons but it is difficult to see why they are so tax advantaged. The adverse tax on Wall-Mart and Macy’s is not because they unpopular or disliked by comparison with DuPont, Lorillard or Avon, but because their assets are capitalized by inventory accounting.
The divergence in effective tax rates is serious enough that we should either capitalize intangible costs to bring the adjusted basis up to fair market value of the corporation’s basis. Alternatively, we should abandon accounting based taxes on income and impose tax on market capitalization instead.