Embed Size (px)
Citation preview
Wahyu Winardi
Seventh High Level Tax Conference For Asian Countries
Tokyo, 5-7 April 2016
Directorate General of Tax (DGT) – Ministry of Finance of Republic of IndonesiaDeputy Director of VAT Regulation -Directorate of Tax Regulation I
Challenge and Solution
2
Subject
3
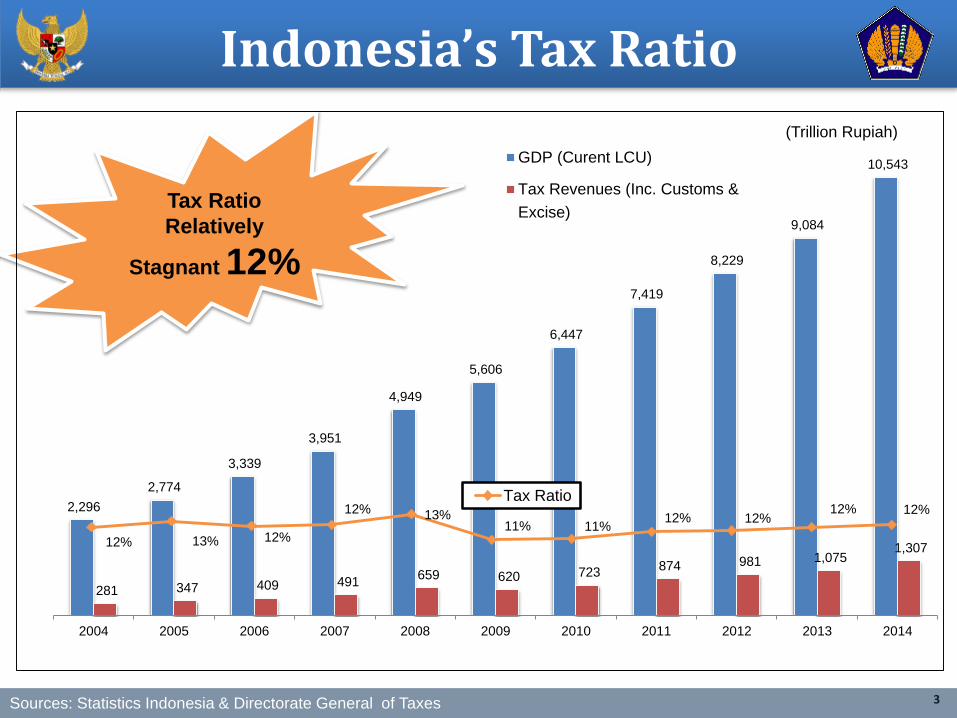
Indonesia’s Tax Ratio
Tax Ratio
Relatively
Stagnant 12%
2,296
2,774
3,339
3,951
4,949
5,606
6,447
7,419
8,229
9,084
10,543
281 347 409 491 659 620 723
874 981 1,075 1,307
2004 2005 2006 2007 2008 2009 2010 2011 2012 2013 2014
(Trillion Rupiah)
GDP (Curent LCU)
Tax Revenues (Inc. Customs &
Excise)
12% 13% 12%
12% 13%11% 11%
12% 12%12% 12%
Tax Ratio
Sources: Statistics Indonesia & Directorate General of Taxes
4
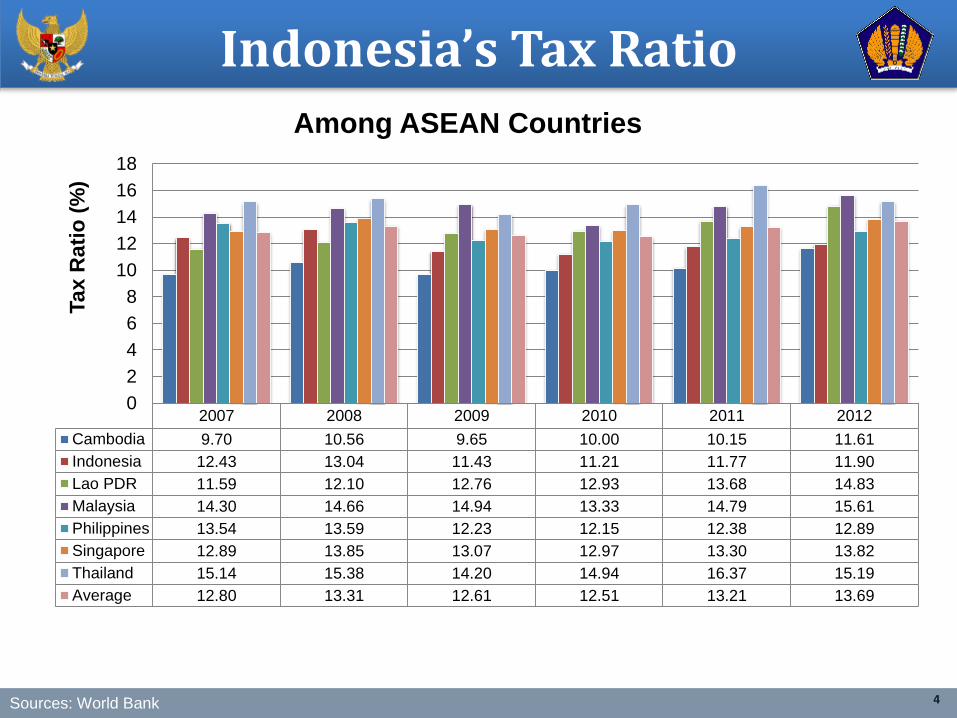
Indonesia’s Tax Ratio
Source: World Bank
2007 2008 2009 2010 2011 2012
Cambodia 9.70 10.56 9.65 10.00 10.15 11.61
Indonesia 12.43 13.04 11.43 11.21 11.77 11.90
Lao PDR 11.59 12.10 12.76 12.93 13.68 14.83
Malaysia 14.30 14.66 14.94 13.33 14.79 15.61
Philippines 13.54 13.59 12.23 12.15 12.38 12.89
Singapore 12.89 13.85 13.07 12.97 13.30 13.82
Thailand 15.14 15.38 14.20 14.94 16.37 15.19
Average 12.80 13.31 12.61 12.51 13.21 13.69
0
2
4
6
8
10
12
14
16
18
Tax R
ati
o (
%)
Among ASEAN Countries
Sources: World Bank
5
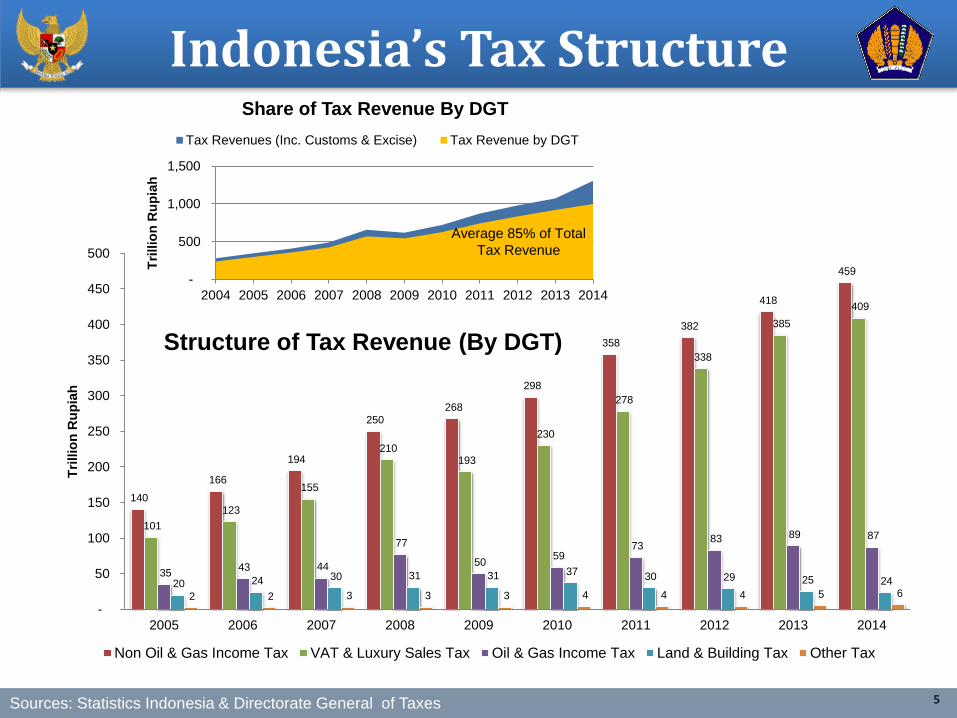
Indonesia’s Tax Structure
Sources: Statistics Indonesia & Directorate General of Taxes
-
500
1,000
1,500
2004 2005 2006 2007 2008 2009 2010 2011 2012 2013 2014
Tri
llio
n R
up
iah
Share of Tax Revenue By DGT
Tax Revenues (Inc. Customs & Excise) Tax Revenue by DGT
Average 85% of Total
Tax Revenue
140
166
194
250
268
298
358
382
418
459
101
123
155
210 193
230
278
338
385
409
35 43 44
77
50 59
73 83 89 87
20 24 30 31 31 37 30 29 25 24
2 2 3 3 3 4 4 4 5 6
-
50
100
150
200
250
300
350
400
450
500
2005 2006 2007 2008 2009 2010 2011 2012 2013 2014
Tri
llio
n R
up
iah
Structure of Tax Revenue (By DGT)
Non Oil & Gas Income Tax VAT & Luxury Sales Tax Oil & Gas Income Tax Land & Building Tax Other Tax
6
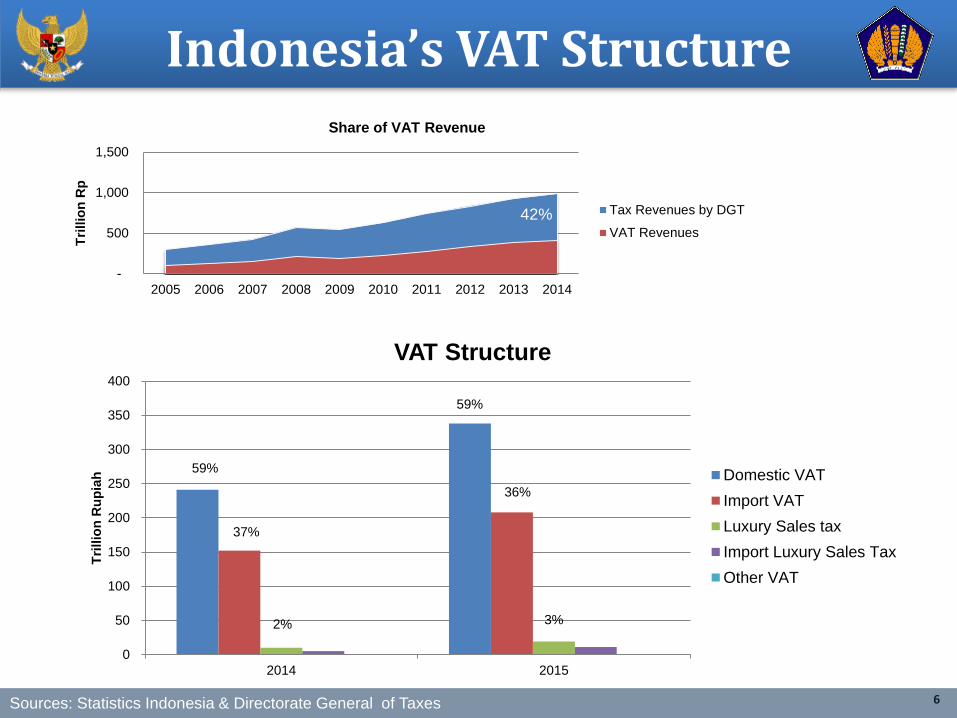
Indonesia’s VAT Structure
Sources: Statistics Indonesia & Directorate General of Taxes
42%
0
50
100
150
200
250
300
350
400
2014 2015
Tri
llio
n R
up
iah
VAT Structure
Domestic VAT
Import VAT
Luxury Sales tax
Import Luxury Sales Tax
Other VAT
59%
59%
37%
36%
2% 3%
-
500
1,000
1,500
2005 2006 2007 2008 2009 2010 2011 2012 2013 2014
Tri
llio
n R
p
Share of VAT Revenue
Tax Revenues by DGT
VAT Revenues
42%
7
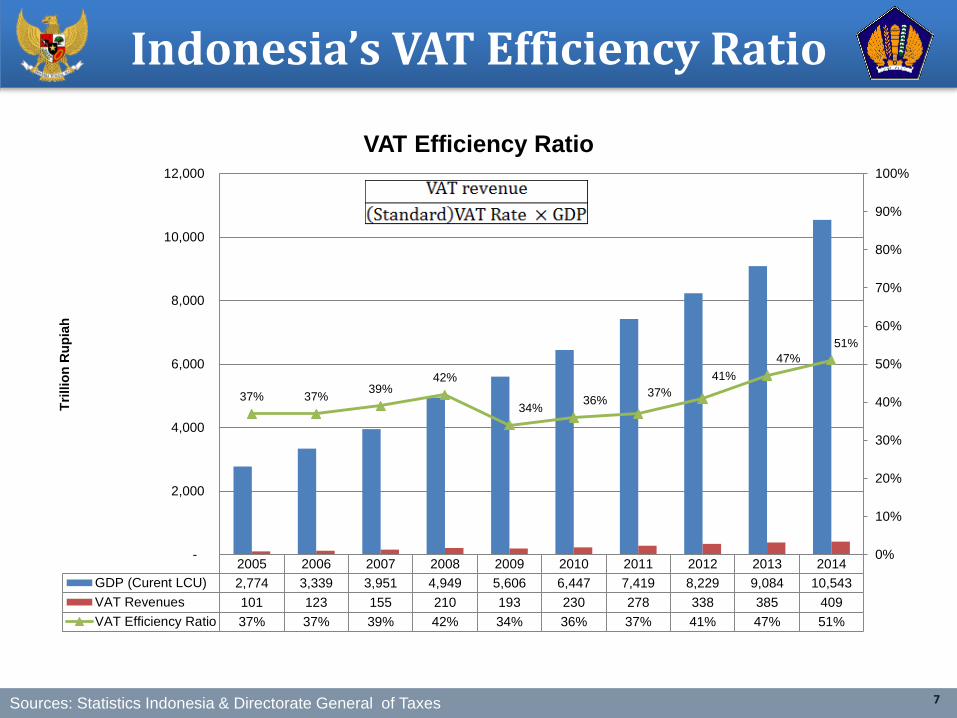
Indonesia’s VAT Efficiency Ratio
33%
Sources: Statistics Indonesia & Directorate General of Taxes
2005 2006 2007 2008 2009 2010 2011 2012 2013 2014
GDP (Curent LCU) 2,774 3,339 3,951 4,949 5,606 6,447 7,419 8,229 9,084 10,543
VAT Revenues 101 123 155 210 193 230 278 338 385 409
VAT Efficiency Ratio 37% 37% 39% 42% 34% 36% 37% 41% 47% 51%
37% 37%39%
42%
34%36%
37%
41%
47%
51%
0%
10%
20%
30%
40%
50%
60%
70%
80%
90%
100%
-
2,000
4,000
6,000
8,000
10,000
12,000
Tri
llio
n R
up
iah
VAT Efficiency Ratio
8
33%
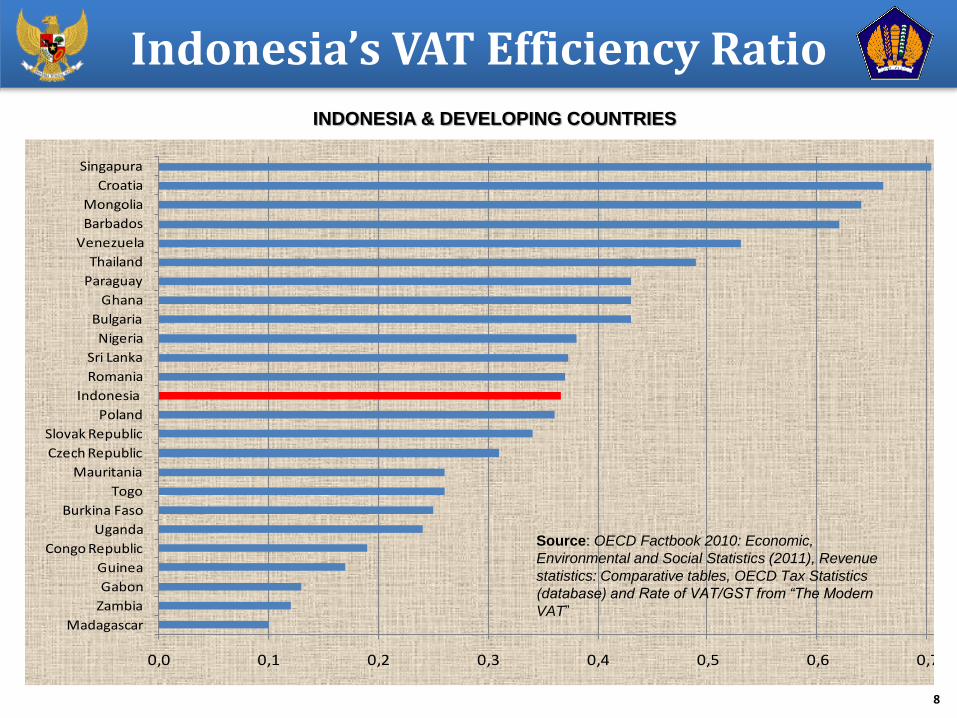
INDONESIA & DEVELOPING COUNTRIES
0,0 0,1 0,2 0,3 0,4 0,5 0,6 0,7 0,8
Madagascar
Zambia
Gabon
Guinea
Congo Republic
Uganda
Burkina Faso
Togo
Mauritania
Czech Republic
Slovak Republic
Poland
Indonesia
Romania
Sri Lanka
Nigeria
Bulgaria
Ghana
Paraguay
Thailand
Venezuela
Barbados
Mongolia
Croatia
Singapura
Source: OECD Factbook 2010: Economic,
Environmental and Social Statistics (2011), Revenue
statistics: Comparative tables, OECD Tax Statistics
(database) and Rate of VAT/GST from “The Modern
VAT”
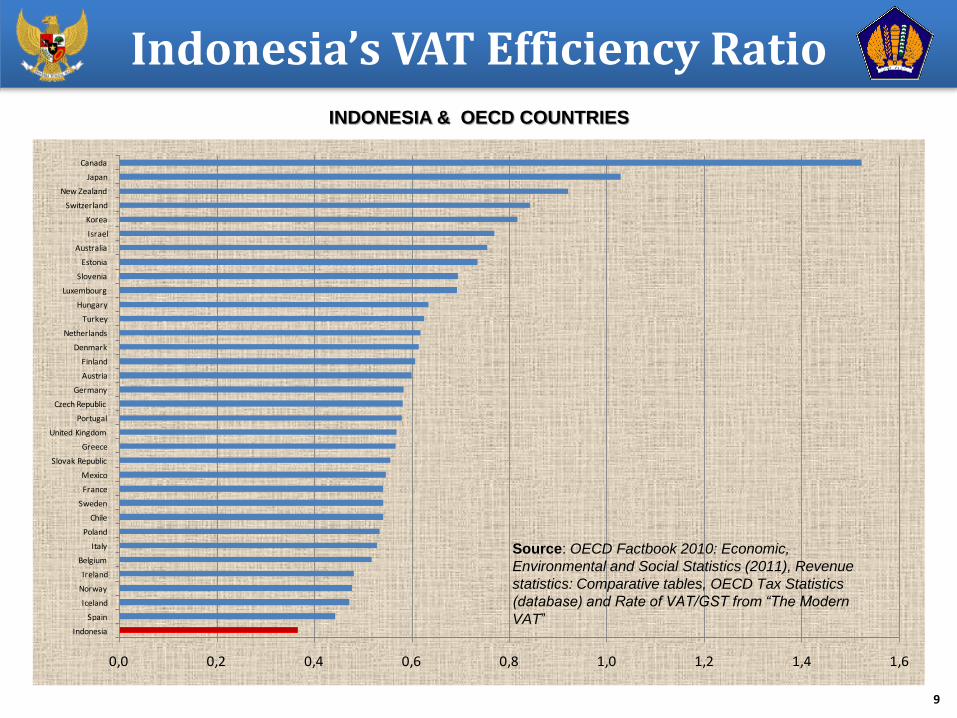
Indonesia’s VAT Efficiency Ratio
9
33%
INDONESIA & OECD COUNTRIES
0,0 0,2 0,4 0,6 0,8 1,0 1,2 1,4 1,6
Indonesia
Spain
Iceland
Norway
Ireland
Belgium
Italy
Poland
Chile
Sweden
France
Mexico
Slovak Republic
Greece
United Kingdom
Portugal
Czech Republic
Germany
Austria
Finland
Denmark
Netherlands
Turkey
Hungary
Luxembourg
Slovenia
Estonia
Australia
Israel
Korea
Switzerland
New Zealand
Japan
Canada
Source: OECD Factbook 2010: Economic,
Environmental and Social Statistics (2011), Revenue
statistics: Comparative tables, OECD Tax Statistics
(database) and Rate of VAT/GST from “The Modern
VAT”
Indonesia’s VAT Efficiency Ratio
10
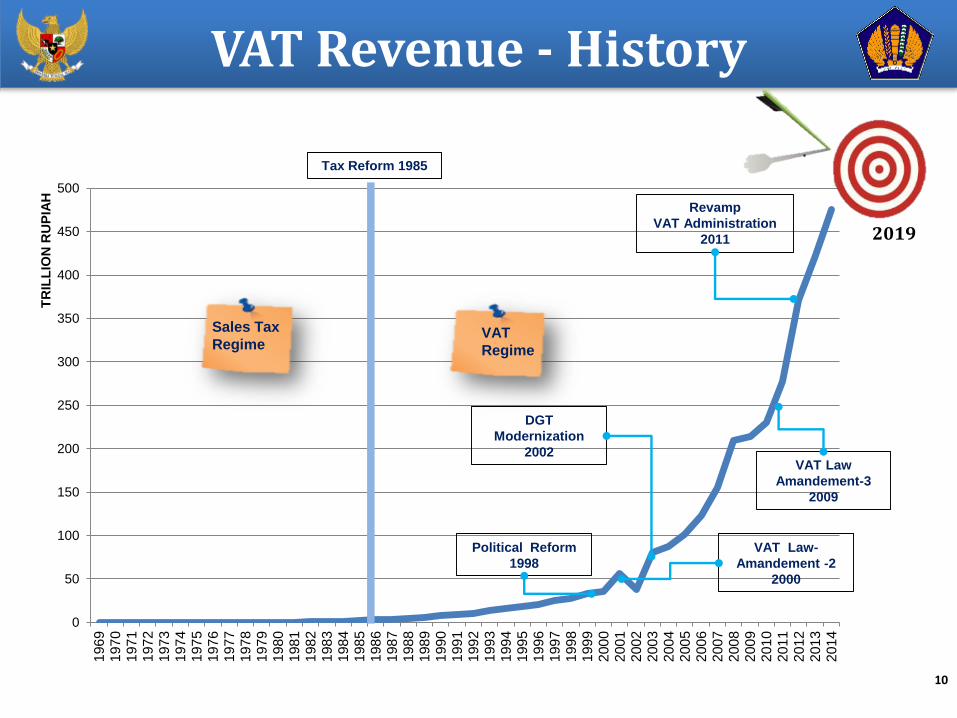
VAT Revenue - History
0
50
100
150
200
250
300
350
400
450
500
196
91
97
01
97
11972
197
31
97
41
97
51
97
61
97
71
97
81
97
91
98
01
98
11
98
21
98
31
98
41
98
51
98
61
98
71
98
81989
199
01
99
11
99
21
99
31
99
41
99
51
99
61
99
71
99
81
99
92
00
02
00
12
00
22
00
32
00
42005
200
62
00
72
00
82
00
92
01
02
01
12
01
22
01
32
01
4
TR
ILL
ION
RU
PIA
H
VAT
Regime
Sales Tax
Regime
Political Reform
1998
DGT
Modernization
2002VAT Law
Amandement-3
2009
Revamp
VAT Administration
2011 2019
Tax Reform 1985
VAT Law-
Amandement -2
2000
11
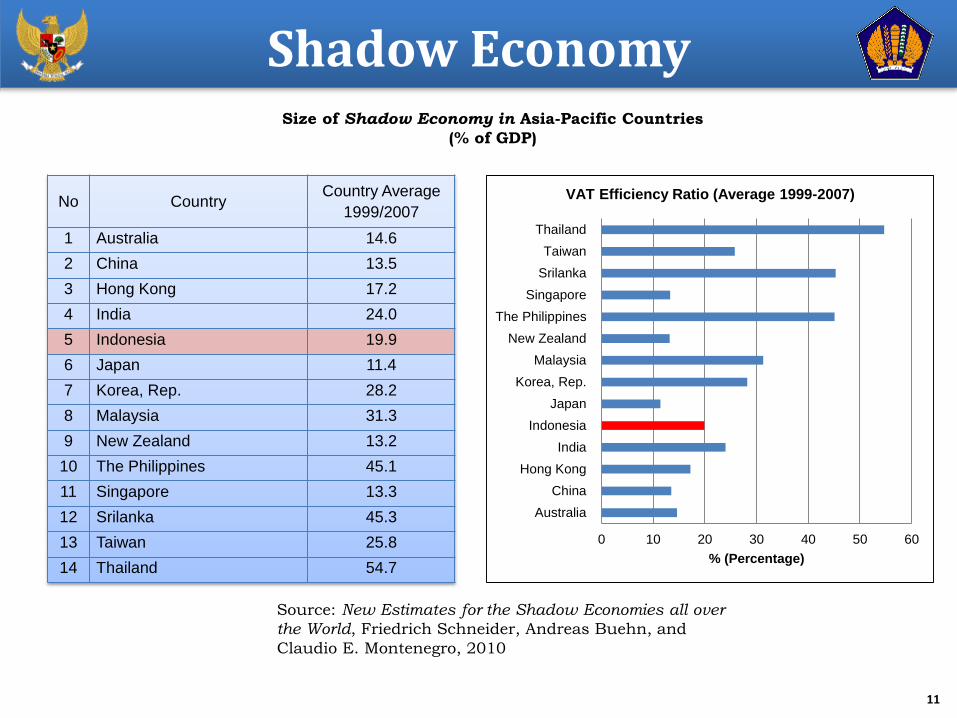
Shadow Economy
No CountryCountry Average
1999/2007
1 Australia 14.6
2 China 13.5
3 Hong Kong 17.2
4 India 24.0
5 Indonesia 19.9
6 Japan 11.4
7 Korea, Rep. 28.2
8 Malaysia 31.3
9 New Zealand 13.2
10 The Philippines 45.1
11 Singapore 13.3
12 Srilanka 45.3
13 Taiwan 25.8
14 Thailand 54.7
Size of Shadow Economy in Asia-Pacific Countries
(% of GDP)
Source: New Estimates for the Shadow Economies all over
the World, Friedrich Schneider, Andreas Buehn, and
Claudio E. Montenegro, 2010
0 10 20 30 40 50 60
Australia
China
Hong Kong
India
Indonesia
Japan
Korea, Rep.
Malaysia
New Zealand
The Philippines
Singapore
Srilanka
Taiwan
Thailand
% (Percentage)
VAT Efficiency Ratio (Average 1999-2007)
12
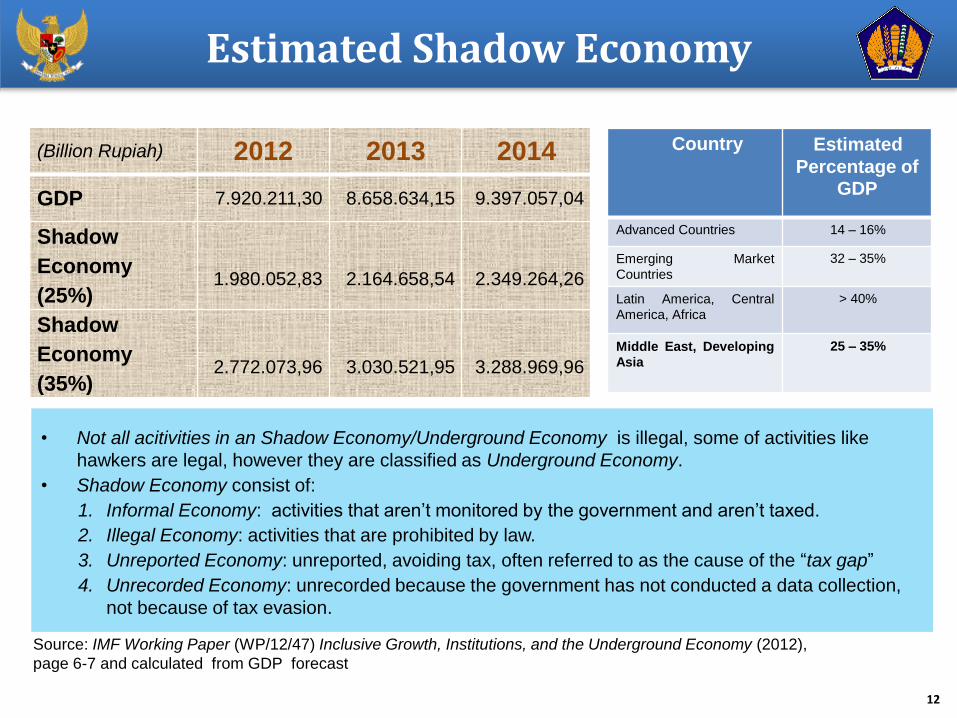
Estimated Shadow Economy
Source: IMF Working Paper (WP/12/47) Inclusive Growth, Institutions, and the Underground Economy (2012),
page 6-7 and calculated from GDP forecast
(Billion Rupiah) 2012 2013 2014
GDP 7.920.211,30 8.658.634,15 9.397.057,04
Shadow
Economy
(25%) 1.980.052,83 2.164.658,54 2.349.264,26
Shadow
Economy
(35%) 2.772.073,96 3.030.521,95 3.288.969,96
• Not all acitivities in an Shadow Economy/Underground Economy is illegal, some of activities like
hawkers are legal, however they are classified as Underground Economy.
• Shadow Economy consist of:
1. Informal Economy: activities that aren’t monitored by the government and aren’t taxed.
2. Illegal Economy: activities that are prohibited by law.
3. Unreported Economy: unreported, avoiding tax, often referred to as the cause of the “tax gap”
4. Unrecorded Economy: unrecorded because the government has not conducted a data collection,
not because of tax evasion.
Country Estimated
Percentage of GDP
Advanced Countries 14 – 16%
Emerging Market
Countries
32 – 35%
Latin America, Central
America, Africa
> 40%
Middle East, Developing
Asia
25 – 35%
13
0 10 20 30 40
VA
T R
ate
Co
rpora
te
Inco
me T
ax
Ra
te
Pers
onal
Inco
me T
ax
Ra
te
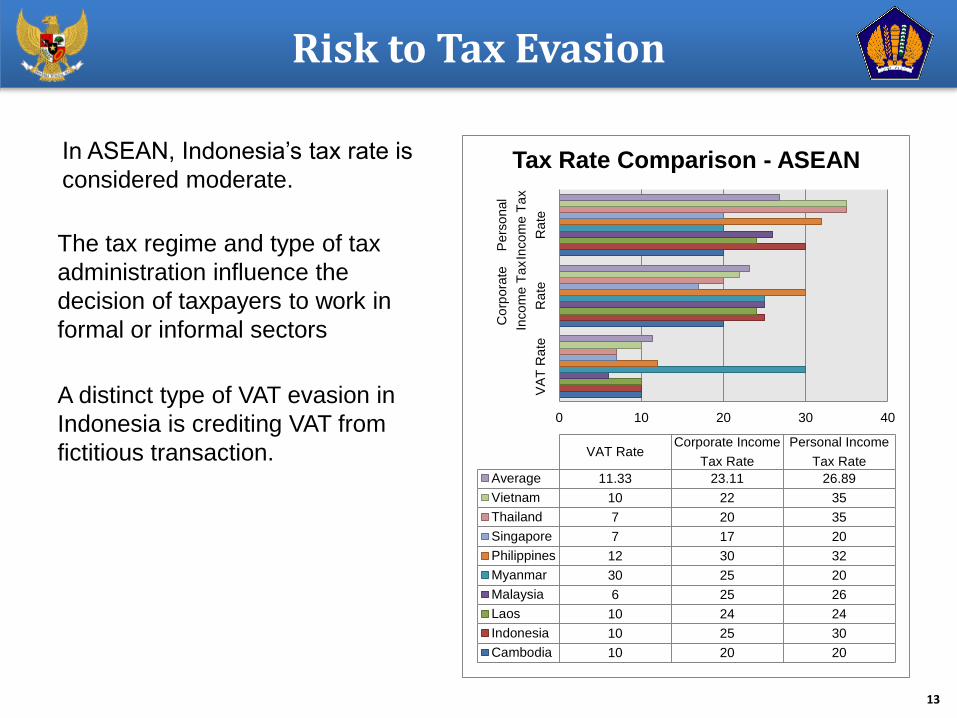
VAT RateCorporate Income
Tax Rate
Personal Income
Tax Rate
Average 11.33 23.11 26.89
Vietnam 10 22 35
Thailand 7 20 35
Singapore 7 17 20
Philippines 12 30 32
Myanmar 30 25 20
Malaysia 6 25 26
Laos 10 24 24
Indonesia 10 25 30
Cambodia 10 20 20
Tax Rate Comparison - ASEAN
Risk to Tax Evasion
A distinct type of VAT evasion in
Indonesia is crediting VAT from
fictitious transaction.
In ASEAN, Indonesia’s tax rate is
considered moderate.
The tax regime and type of tax
administration influence the
decision of taxpayers to work in
formal or informal sectors
14
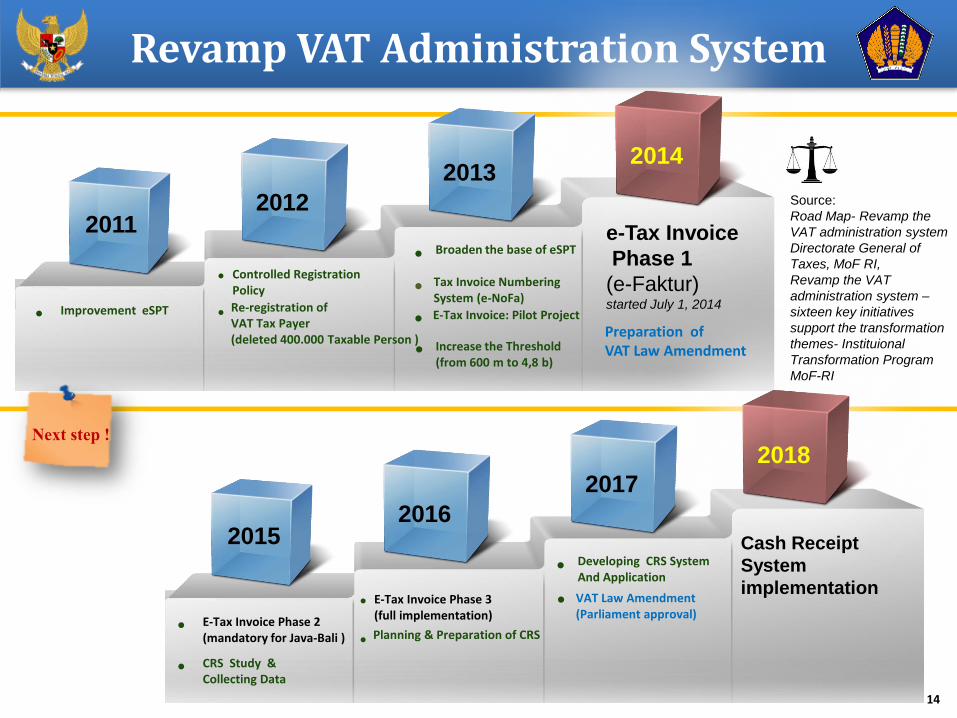
20122011
20142013
e-Tax Invoice
Phase 1
(e-Faktur)started July 1, 2014
• Improvement eSPT
• Controlled Registration Policy
• Re-registration of VAT Tax Payer(deleted 400.000 Taxable Person )
• Broaden the base of eSPT
• Tax Invoice Numbering System (e-NoFa)
• E-Tax Invoice: Pilot Project
• Increase the Threshold (from 600 m to 4,8 b)
20162015
2018
2017
Cash Receipt
System
implementation
• E-Tax Invoice Phase 2(mandatory for Java-Bali )
• CRS Study & Collecting Data
•
• Planning & Preparation of CRS
• Developing CRS System And Application
Source:
Road Map- Revamp the
VAT administration system
Directorate General of
Taxes, MoF RI,
Revamp the VAT
administration system –
sixteen key initiatives
support the transformation
themes- Instituional
Transformation Program
MoF-RI
• VAT Law Amendment(Parliament approval)
Next step !
E-Tax Invoice Phase 3(full implementation)
Preparation of VAT Law Amendment
Revamp VAT Administration System
15
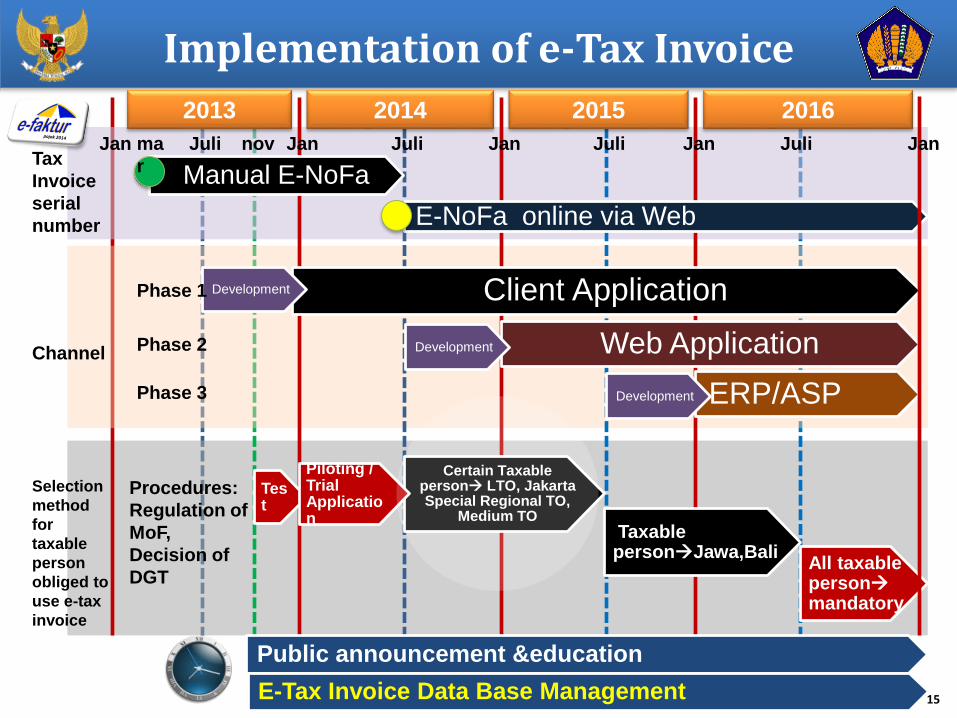
Implementation of e-Tax Invoice
Manual E-NoFa
Client Application
Web Application
ERP/ASP
2014 2015 2016
E-NoFa online via Web
2013
Development
Public announcement &education
Certain Taxable person LTO, Jakarta Special Regional TO,
Medium TOTaxable personJawa,Bali
All taxable personmandatory
Development
Development
Tax
Invoice
serial
number
Phase 1
Phase 2
Phase 3
Selection
method
for
taxable
person
obliged to
use e-tax
invoice
E-Tax Invoice Data Base Management
Channel
novJulima
r
Juli Juli JuliJan Jan JanJanJan
Procedures:
Regulation of
MoF,
Decision of
DGT
Test
Piloting / Trial Application
16
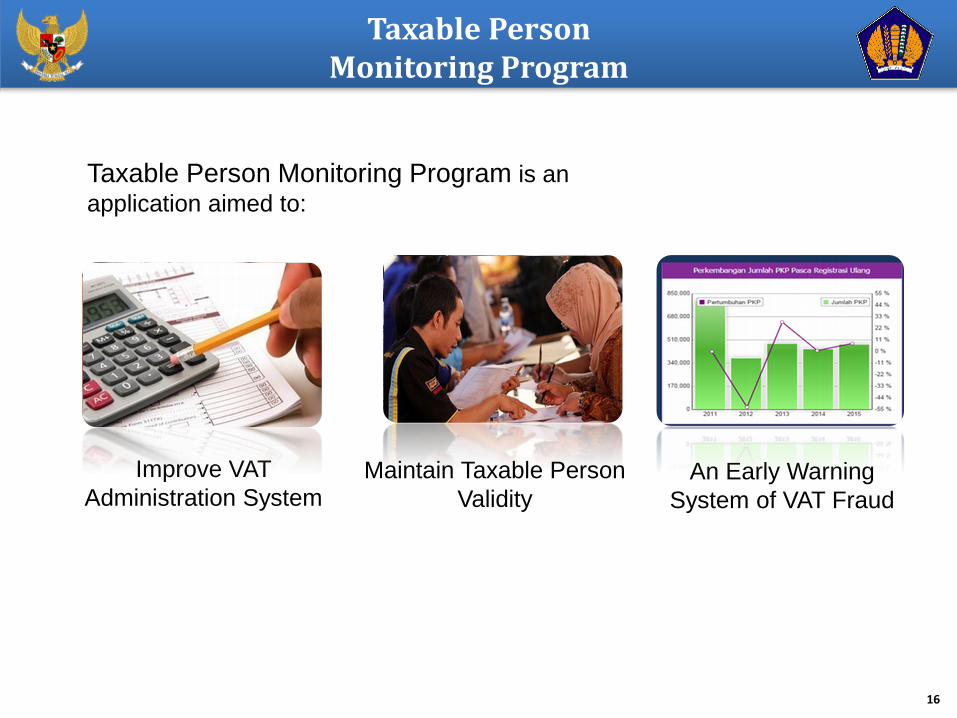
Taxable Person Monitoring Program
Improve VAT
Administration SystemAn Early Warning
System of VAT Fraud
Maintain Taxable Person
Validity
Taxable Person Monitoring Program is an
application aimed to:
17
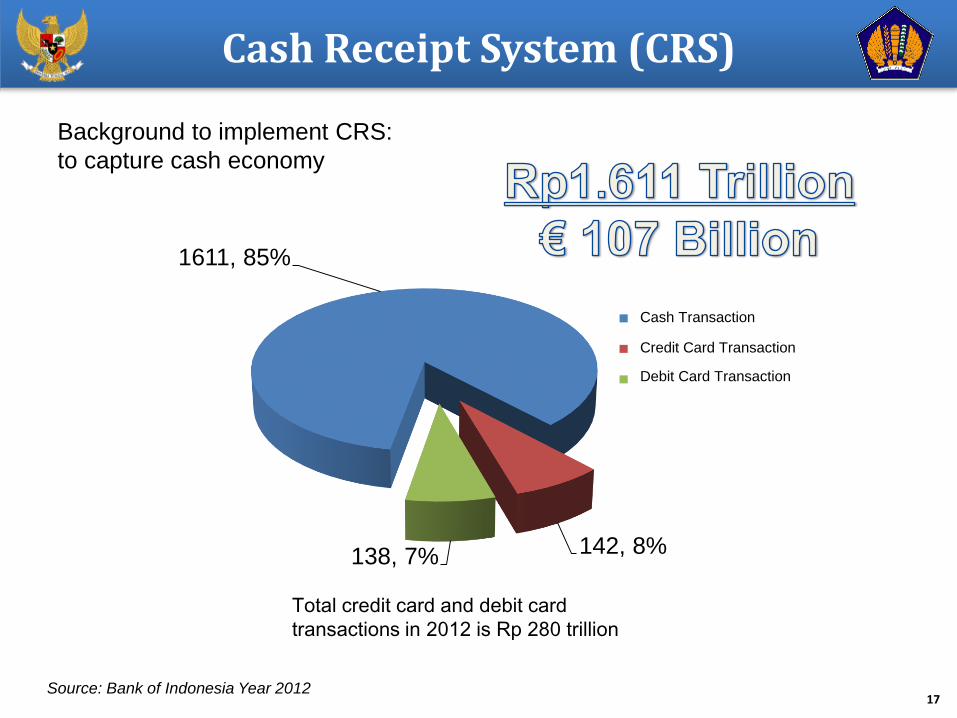
Cash Receipt System (CRS)
1611, 85%
142, 8%138, 7%
Transaksi Tunai
Transaksi Kartu Kredit
Transaksi Kartu Debit
Cash Transaction
Credit Card Transaction
Debit Card Transaction
Source: Bank of Indonesia Year 2012
Total credit card and debit card
transactions in 2012 is Rp 280 trillion
Background to implement CRS:
to capture cash economy
18
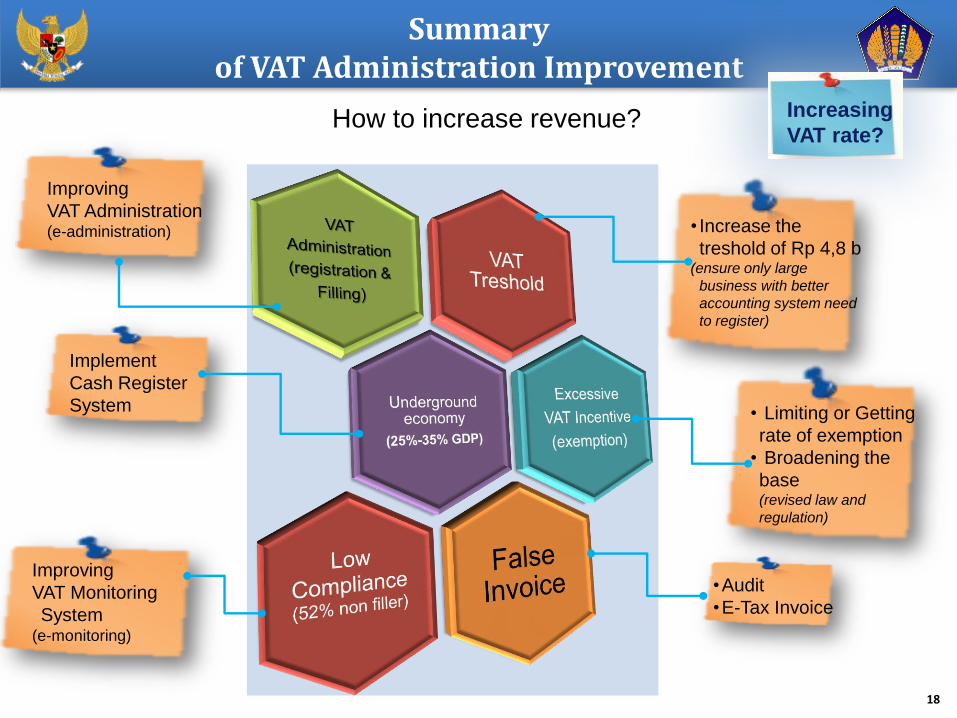
Summary of VAT Administration Improvement
RUU PPN
• Limiting or Getting
rate of exemption
• Broadening the
base(revised law and
regulation)
Improving
VAT Administration(e-administration)
•Audit
•E-Tax Invoice
Improving
VAT Monitoring
System(e-monitoring)
• Increase the
treshold of Rp 4,8 b(ensure only large
business with better
accounting system need
to register)
Implement
Cash Register
System
Increasing
VAT rate?How to increase revenue?
19
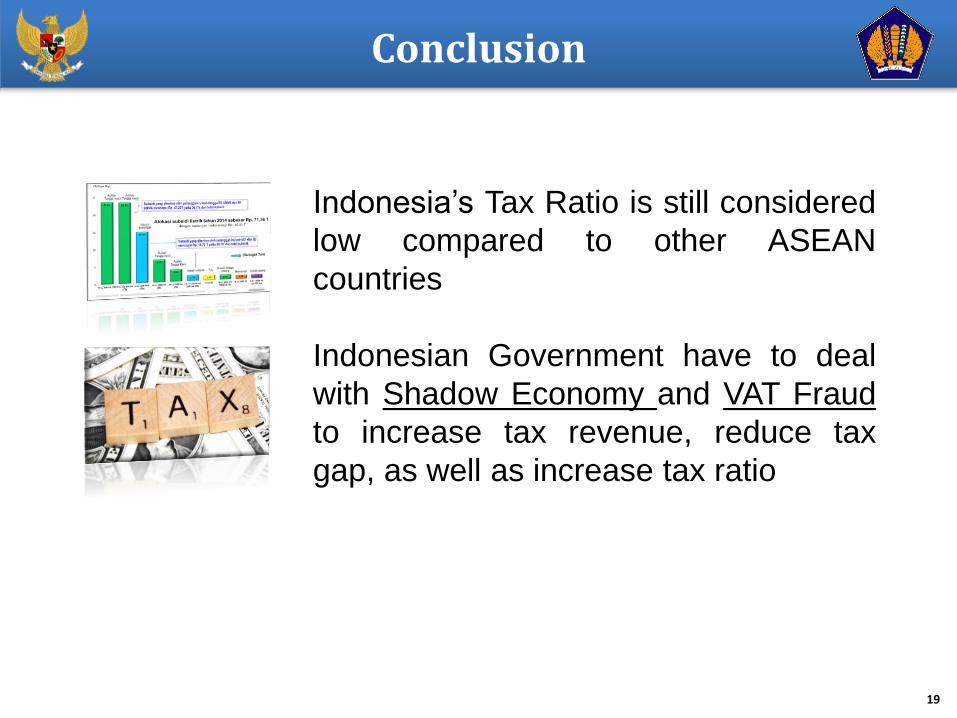
Conclusion
Indonesia’s Tax Ratio is still considered
low compared to other ASEAN
countries
Indonesian Government have to deal
with Shadow Economy and VAT Fraud
to increase tax revenue, reduce tax
gap, as well as increase tax ratio

Thanks For Your Attention