Embed Size (px)
Citation preview
The economic feasibility of on-farmfeed milling for Arizona poultry ranches
Item Type text; Thesis-Reproduction (electronic)
Authors Schwabe, Barry Edward, 1952-
Publisher The University of Arizona.
Rights Copyright © is held by the author. Digital access to this materialis made possible by the University Libraries, University of Arizona.Further transmission, reproduction or presentation (such aspublic display or performance) of protected items is prohibitedexcept with permission of the author.
Download date 04/07/2018 13:33:46
Link to Item http://hdl.handle.net/10150/566562
THE ECONOMIC FEASIBILITY OF ON-FARM
FEED MILLING FOR ARIZONA POULTRY RANCHES
by
Barry Edward Schwabe
A Thesis Submitted to the Faculty of the
DEPARTMENT OF AGRICULTURAL ECONOMICS
In Partial Fulfillment of the Requirements For the Degree of
MASTER OF SCIENCE
In the Graduate College
THE UNIVERSITY OF ARIZONA
1 9 7 7
STATEMENT BY AUTHOR
This thesis has been submitted in partial fulfillment of requirements for an advanced degree at The University of Arizona and is deposited in the University Library to be made available to borrowers under rules of the Library.
Brief quotations from this thesis are allowable without special permission, provided that accurate acknowledgment of source is made. Requests for permission for extended quotation from or reproduction of this manuscript in whole or in part may be granted by the head of the major department or the Dean of the Graduate College when in his judgment the proposed use of the material is in the interests of scholarship. In all other, instances, however, permission must be obtained from the author.
SIGNED:
APPROVAL BY THESIS DIRECTOR
This thesis has been approved on the date shown below:
/s' 7 y' ROBERT C. ANgBS ' Date
Professor of Agricultural Economics
ACKNOWLEDGMENTS
I wish to express my gratitude to Dr. Robert C. Angus for his
assistance in the development of this study. The support of Dr. Bobby
L. Reid, Dr. Franklin Rollins, and Dr. Roger Selley is also appreciated.
Further appreciation is extended to the numerous people who con
tributed information and provided guidance during the course of this
research. In particular, I acknowledge the faculty and graduate students
of the Department of Agricultural Economics as well as the feed milling
professionals that I consulted.
Special recognition is given to Adele Goodberry for typing the
rough draft and Paula Tripp for typing the final draft.
Above all, I thank Mom, Dad, Ken, and Nan for instilling in me
the personal qualities to make graduate studies a beneficial experience.
ill
TABLE OF CONTENTS
Page
LIST OF TABLES...................................................... vi
LIST OF ILLUSTRATIONS................................................ ix
ABSTRACT ............................................................ x
CHAPTER*
I INTRODUCTION . . . .......................................... 1
Review of Literature ................................... 2Growth and Status of On-Farm Feed Milling . . . . . 3Debating On-Farm Feed Milling's Economic
Feasibility ...................................... 4Economic Feasibility ............................... 4Planning Guides ................................... 9
II EXPERIMENTAL D E S I G N ...........................................11
Production Requirements............................... 11Storage Requirements ................................... 12Mill Design and C o s t s .......... 16Feed Ingredient Prices . ............. 17Process F l o w .............................................. 17Commercial F e e d .......................................... 19Procedure for the Analysis......................... 21
III RESULTS OF THE A N A L Y S I S .......................................25
Average Annual Costs Associated with On-FarmFeed Milling............................................ 25
Average Annual Cost Relationships for On-FarmFeed Milling............................................ 26
Economies of S i z e .................................... 26Cost Component Relationships .......................... 34Capacity Utilization ............................... 34Capital Versus Labor Intensive Mills ............... 36Elimination of Arizona Competitive
Disadvantage ...................................... 36Year 1 Costs Associated with On-Farm Feed Milling . . . 41Year 1 Cost Relationships for On-Farm Feed Milling . . . 46
Economies of S i z e .................................... 46Cost Component Relationships ....................... 46
iv
V
Page
Capacity Utilization and Capital VersusLabor Intensive M i l l s .................. 49
Elimination of Arizona CompetitiveDisadvantage............. ....................... 49
IV SUMMARY AND CONCLUSIONS......................................54
APPENDIX A. PHYSICAL PLANT AND ESTIMATED COSTS FOR ON-FARMFEED MILLING ON ARIZONA POULTRY R A N C H E S ................57
APPENDIX B. FORMULA FOR INTEREST RATES USING THE TRADITIONAL DEPRECIATION METHOD WHERE INTEREST CHARGES ARE EQUIVALENT TO NET PRESENT VALUE METHOD.................. 67
TABLE OF CONTENTS— Continued
SELECTED BIBLIOGRAPHY 69
LIST OF TABLES
1. On-Farm Feed Requirements (tons) by Flock Sizefor Arizona Poultry Ranchers................................13
2. Layer Diet for Arizona Poultry Ranches.......... .. 14
3. Storage Requirements for On-Farm Feed Milling onArizona Poultry Ranches by Daily Tonnage Produced . . . . 15
4. Total Costs per Ton of Commercial Feed Formulaby Flock Size . ............................................20
5. Initial Investment for On-Farm Feed Milling onArizona Poultry Ranches by Daily Tonnage Produced . . . . 27
6. Average Annual Production Costs for On-Farm FeedMilling on Arizona Poultry Ranches by DailyTonnage Produced ............................................28
7. Average Annual Maximum Ingredient Costs for On-FarmFeed Milling Feasibility on Arizona PoultryRanches by Daily Tonnage Produced ........................ 30
8. Feed Ingredient Prices for On-Farm Feed Milling onArizona Poultry Ranches — February 23, 1977 ............. 31
9. Average Annual Cost per Ton for On-Farm Feed Milling on Arizona Poultry Ranches by Daily TonnageProduced....................................................32
10. Average Annual Cost-Savings per Ton for On-FarmFeed Milling on Arizona Poultry Ranches by DailyTonnage Produced .......................................... 32
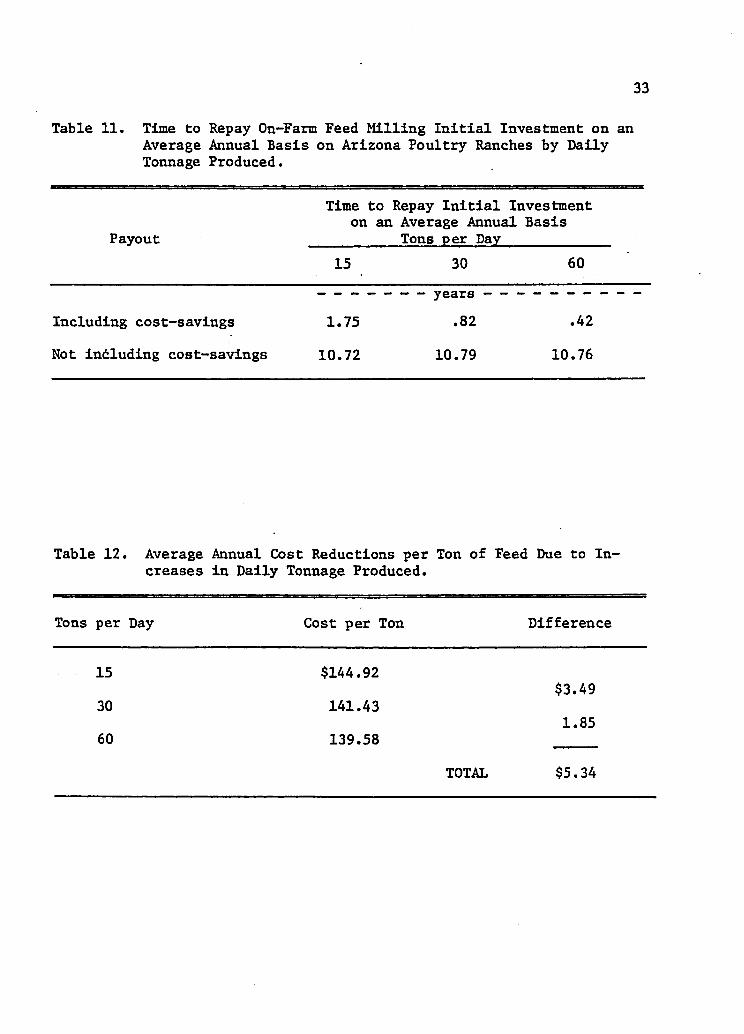
11. Time to Repay On-Farm Feed Milling Initial Investment on an Average Annual Basis on Arizona PoultryRanches by Daily Tonnage Produced ................... . . 33
12. Average Annual Cost Reductions per Ton of Feed Dueto Increases in Daily Tonnage Produced ................... 33
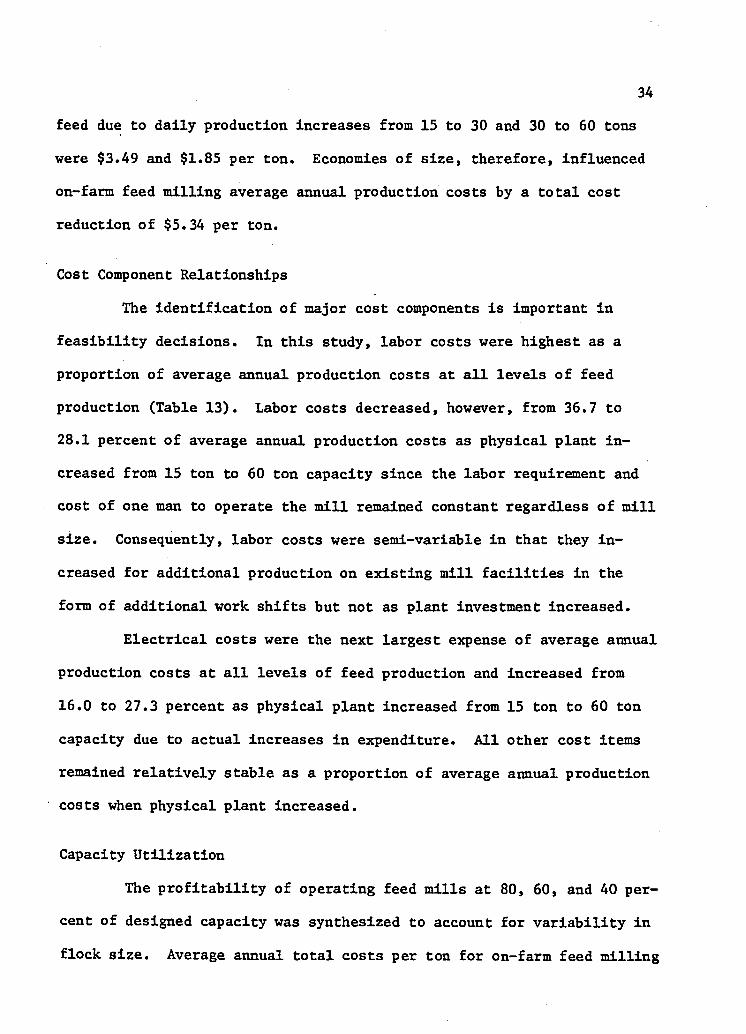
13. Percentage Distribution of Average Annual Production Costs Among Cost Items for On-Farm Feed Milling on Arizona Poultry Ranches by Daily Tonnage Produced....................................................35
Table Page
vi
vii
14. Average Annual Cost per Ton for On-Farm Feed Millingon Arizona Poultry Ranches at Various CapacityLevels by Daily Tonnage Produced ......................... 37
15. Average Annual Production Costs at 100% Capacity, Oneand Two 8 "Hour Shifts, for On-Farm Feed Millingon Arizona Poultry Ranches by Daily TonnageProduced (8 Hour S h i f t ) .................................. 38
16. Average Percent Reduction in Feed Costs for On-FarmFeed Milling on Arizona Poultry Ranches Versus Required Percent Reductions to Eliminate California Production from the Arizona Egg Market by Daily Tonnage Produced ............................... 40
17. Year 1 Production Costs for On-Farm Feed Millingon Arizona Poultry Ranches by Daily TonnageProduced................................................... 42
18. Year 1 Maximum Ingredient Costs for On-Farm FeedMilling Feasibility on Arizona Poultry Ranchesby Daily Tonnage Produced ............................... 44
19. Year 1 Cost per Ton for On-Farm Feed Milling onArizona Poultry Ranches by Daily Tonnage Produced . . . . 44
20. Year 1 Cost-Savings per Ton for On-Farm Feed Milling on Arizona Poultry Ranches by Daily TonnageProduced.................. 45
21. Time to Repay On-Farm Feed Milling Initial Investment on a Year 1 Basis on Arizona Poultry Ranchesby Daily Tonnage Produced .................. 45
22. Year 1 Cost Reductions per Ton of Feed Due to Increases in Daily Tonnage Produced........................... 47
23. Percentage Distribution of Year 1 ProductionCosts Among Cost Items for On-Farm Feed Millingon Arizona Poultry Ranches by Daily TonnageProduced....................................................48
24. Year 1 Cost per Ton for On-Farm Feed Milling onArizona Poultry Ranches at Various Capacity Levels by Daily Tonnage Produced .
LIST OF TABLES— Continued
Table Page
50
via
Table Page
25. Year 1 Production Costs at 100% Capacity, One andTwo 8 Hour Shifts, for On-Farm Feed Milling on Arizona Poultry Ranches by Daily Tonnage Produced (8 Hour Shift)....................................51
26. Year 1 Percent Reduction in Feed Costs for On-Farm Feed Milling on Arizona Poultry Ranches Versus Required Percent Reductions to Eliminate California Production from the Arizona EggMarket by Daily Tonnage Produced ......................... 53
LIST OF TABLES— Continued
LIST OF ILLUSTRATIONS
1. Process Flow for 30 Ton per 8 Hour Day On-FarmFeed M i l l ................................................ 18
Figure Page
ix
ABSTRACT
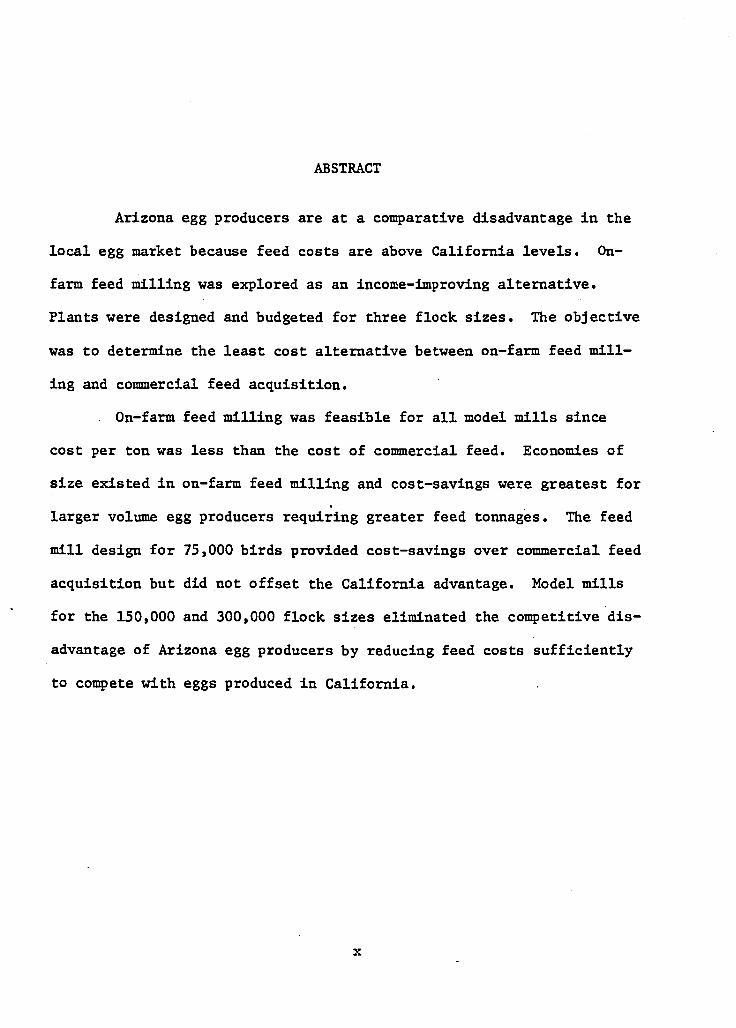
Arizona egg producers are at a comparative disadvantage in the
local egg market because feed costs are above California levels. On-
farm feed milling was explored as an income-improving alternative.
Plants were designed and budgeted for three flock sizes. The objective
was to determine the least cost alternative between on-farm feed mill
ing and commercial feed acquisition.
On-farm feed milling was feasible for all model mills since
cost per ton was less than the cost of commercial feed. Economies of
size existed in on-farm feed milling and cost-savings were greatest for
larger volume egg producers requiring greater feed tonnages. The feed
mill design for 75,000 birds provided cost-savings over commercial feed
acquisition but did not offset the California advantage. Model mills
for the 150,000 and 300,000 flock sizes eliminated the competitive dis
advantage of Arizona egg producers by reducing feed costs sufficiently
to compete with eggs produced in California.
x
CHAPTER I
INTRODUCTION
Arizona poultry ranches compete with California producers for
Arizona markets. California producers have a comparative advantage be
cause of lower production costs (Wilson 1975). As a result, many Ari
zona egg producers ceased unprofitable operations resulting in a 60 per
cent decrease in number of layers and egg production from 1970-76. This
decrease took place during a period of population growth in Arizona and
an increase in egg consumption of 14 percent (1,366,071 to 1,561,875
cases of eggs). Arizona production accounted for 25 percent of the mar
ket in 1976 as opposed to 45 percent in 1970. From an economic point of
view, poultry ranchers are seeking income-improving alternatives.
The sensitivity of Arizona egg producers' competitive position
with respect to changes in feed costs, transportation costs, and popula
tion increases through 1990 was assessed through a linear programming
transportation model by Wilson (1975). The primary factor affecting the
competitive disadvantage of Arizona egg producers was feed costs. Wil
son concluded that the competitive disadvantage for Arizona egg pro
ducers could be eliminated by producing eggs at feed costs equivalent to California.
This study provides information for poultry ranchers who are
currently considering various feed procurement methods for reducing feed
costs. Specifically, the economic feasibility of on-farm feed milling
1
2
relative to commercial feed acquisition is examined. Designs and costs
for on-farm feed mills are synthesized from which cost alternatives are
ascertained. If feed cost reductions from on-farm feed milling are
found, they will be compared to the reductions estimated by Wilson for
making Arizona egg producers competitive in the local egg market with
California producers.
Review of Literature
The economic feasibility of on-farm feed milling has been dis
cussed in trade journals and U.S.D.A. reports since the 1950's. Trade
journals such as Feedstuffs, The Feed Bag, and Wallaces Farmer, e.g.,
Hagen (1961) and Smith (1960) , recorded the growth of on-farm feed mill
ing and published debates regarding its economic feasibility. U.S.D.A.
experiment stations researched the system's design and economic
feasibility as well as provided planning guides for farmers.
Two limitations inherent in these sources concerned differences
between on-farm feed mills. First, valid comparisons of results re
ported in the literature were problematic because on-farm feed mills
varied by design, size, and ration produced. In addition, little of the
research dealt specifically with poultry applications. Thus, studies
regarding other livestock feed processing systems were used as refer
ences. Finally, the similarity of numerous studies in this field made
a representative literature review more practical than one that was
inclusive
3
Growth and Status of On-Farm Feed Milling
On-farm feed milling flourished with the development and Im
provement of grinding/mixing equipment and feed storage/handling
facilities that made it possible to handle large volumes of feed and
reduce labor requirements. Moreover, many farms had the opportunity
to use high-quality fresh grains from their own supplies.
' Illinois economist Ralph Mutti (Hagen 1961) related the adoption
rate of on-farm feed milling to larger livestock enterprises and trends
to complete rations. Ken McFate, a Missouri agricultural engineer,
recognized automated operations as well as cost-savings in feed pro
cessing and labor as influential factors ("Costs for Farm Mixing of
Feed Outlined" 1965). He also observed that existing mills increased
in size because of the greater farm productivity resulting from on-farm
feed milling (Hagen 1961).
The status of on-farm feed milling in the Midwest was investi
gated by A1 P. Nelson (1965a). Nelson discovered that the average farm
miller did not know his cost for producing a ton of feed since he failed
to account for labor, taxes, interest on investment, depreciation, in
surance, and power acknowledging only the cost of ingredients. In
addition, on-farm millers were large feeders who bought their concen
trate from bag dealers or custom mill operators. Some of them would
grind and mix for neighbors either by contracting to do the job or by
renting out their equipment. He predicted on-farm milling would in
crease considerably in the future due to the inclination of more edu
cated modern day farmers to experiment.
Debating On-Farm Feed Milling's Economic Feasibility
In 1960, U.S.D.A. economist Carl Vosloh (Smith 1960) stated that
large-scale livestock feeders should.consider farm processed feeds
based upon survey work conducted in North Carolina and Florida. On the
other hand, Oakley M. Ray (Smith 1960), Market Research Director for
American Feed Manufacturers Association pointed out that surveys favor
able to on-farm feed milling have omitted certain costs involved in feed
manufacture including credit, production and marketing advice, and the
time required for making purchasing and production scheduling decisions.
Erwin Wascher (Smith 1960) of Heneggers' and Co. illustrated this view
point by citing instances where expensive farm feed mills lied idle be
cause their owners had found that commercial rations actually cost less
after analyzing all factors involved. Mutti (Hagen 1961) suggested that
values assigned by producers to various cost items such as labor, de
preciation, and interest on investment influenced them in determining
what method had the lowest cost.
Economic Feasibility
Studies conducted by state agricultural experiment stations
determined the cost relationships and break-even points for various
sized on-farm feed milling operations and searched for economies of size.
Cost relationships varied by type of milling system (Bloome
et al. 1976). Labor was high for portable grinder mixers, mills with
portable mixers, and stationary mills with portable mixers. High
operating costs were also found for portable grinder mixers and mills
with portable mixers.
4
5
On the other hand, well-planned automatic electric mills required
the least labor and had the lowest operating cost. They also had a long
service life but were not always adaptable to existing facilities.
Package feed centers, which were also automatic electric mills, had
high costs due to overhead storage bins but narrowed significantly the
gap of cost per ton of feed produced against other systems as the pro
cessed annual volume increased (Bloome and Tubbs 1972). Although there
were few options in unit size, they were pre-engineered for reliability
and were quickly installed.
Trotter and Hoch’s research (1967) was concerned specifically
with Pennsylvania poultry farms and compared on-farm feed milling with
the purchase of commercial feed. They developed repre
sentative systems for six flock sizes based upon data which was obtained
from personal interviews with farmers employing the different methods.
Incorporated in this was a time and motion study to determine allocation
of labor among job elements and the equipment involved in preparing,
processing, and storing a ton of feed. Median values were used since
they were not influenced by extreme variations. They applied budgeting
techniques to attain total system costs and performed protein tests to
determine the accuracy of on-farm feed formulation.
Their conclusions were:
1. The economic advantage of on-farm feed milling increased with
flock size.
The feasibility of on-farm feed milling depended largely on the
availability and alternative use for labor. Consequently, when
the alternative use for labor was low, on-farm feed milling was
2.
6
attractive because it provided a higher labor income. Ac
cordingly, when the alternative use for labor was high,
commercial feed should be bought.
3. The feasibility of on-farm feed milling was influenced by the
availability of capital or credit for fixed and operating
costs. Consequently, when the alternative use for capital
was low, on-farm feed milling was attractive because it pro
vided higher returns on investment. Accordingly, when the
alternative use for capital was high, commercial feed should
be bought.
4. If high alternative uses for labor and low alternative uses
for capital existed, the purchase of commercial feed resulted
in the highest rate of return to the limiting input, labor.
Implementation efficiency was cited as important in determining
the feasibility of on-farm feed milling by Degn, Phillips, and Barston
(1965). Their work encompassed an analysis of on-farm feed milling for
existing plants and an analysis for more ideally designed plants based
upon efficient observed cases and adjusted by recommendations from feed
plant equipment manufacturers. They found that efficient small plants
in Montana were processing feed at a cost almost as low as larger
facilities and the most efficient easily competed with commercial
sources. Furthermore, small scale on-farm feed mills could be designed
that would be more economical than the average of the existing small
size mills
Nelson and Austin (1966) studied how costs could be reduced by
changing fixed and variable cost relationships for North Dakota commer
cial feed plants. They reported the following:
1. Rates of capacity utilization had significant effects on costs
per ton of output. For example, average total cost per ton for
a 30 ton per eight hour shift mill ranged from $7.71 at 100
percent capacity to $14.27 at 40 percent capacity.
2. Adding second and third shifts to existing plant reduced average
total costs in both average fixed and average variable cost
components. Thus, lower costs per ton were found when operating
a 30 ton mill 16 hours per day than operating a 100 ton mill 8
hours per day.
3. Wide variation in equipment and building costs caused small
variation in costs per ton possibly due to improvement in the
feed product and lower long run depreciation, maintenance, and
other costs.
Further economic implications were presented by Dauzat and Roy
(1975) for Louisiana package feed centers versus alternative procurement
methods. They mentioned the following:
1. On-farm feed millers may suffer a disadvantage relative to
commercial feed processors due to economies in transportation,
in favorable hedging opportunities, and quality control of
ingredients.
7
8
2. Widespread use of on-farm feed mills may represent competition
to commercial feed millers and retail feed dealers causing
them to reduce markups.
3. On-farm feed millers may lose savings resulting from feed
dealers not fully marking up feed prices in proportion to
rises in ingredient prices. On the other hand, they may gain
savings resulting from feed dealers not fully marking down feed
prices in proportion to decreases in ingredient prices.
4. Labor required for ingredient purchases and ration formulation
can be substantial although actual labor for milling may appear
minimal.
5. The lowest cost per unit of product produced should be the
vital factor determining a feed's worth as opposed to the
lowest cost per ton of feed obtained. (However, the reason
for using this criterion was not clearly explained.)
6. Rations which are technically difficult to mix such as broiler
mixes should remain with commercial processors since they are
usually complex and costly to mix.
7. On-farm feed mills recover initial investment through deprecia
tion and interest on investment in about seven years.
8. Additional investment in grain storage facilities and higher
costs of inventory offset the advantage of purchasing grain
at lower prices during harvest time.
Courtney and Siebert (1970) pointed out that factors such as
labor and management availability, quality of feed, and the profitability
9
Other factors noted by Degn et al. (1965) were:
1. the amount of unused resources on the farm that could be
utilized by feed processing,
2. the distance from farm to commercial plant (as the distance
increased so did the feasibility as long as most feed
ingredients were found on the farm),
3. the service at the commercial processing plant in the form of
waiting time, storage, credit, and nutritional advice,
4. the management ability of the farmer,
5. the continuity of feeding, and
6. the individual farmer's view on future trends regarding economic
advantages.
Trotter and Hoch (1967) also considered:
1. availability of ingredients,
2. availability of capital or credit,
3. risks of (a) discontinuing operations before equipment fully
amortizes, (b) equipment breakdown, and (c) less available time for managing flock; and
4. access to markets.
Planning Guides
of on-farm feed milling as compared with other forms of investment should
be considered before purchasing an on-farm feed mill.
Planning guides by Allen, Sorenson and McCune (1970), Puckett
(1964), and the Feed Production School, Inc. (1961) and Feed Production
Council (1970) detailed procedures and examples for designing on-farm
10feed mills. Specifically, they dealt with defining basic processing
operations and equipment as well as analyzing process flow, material
handling, facility capacity, layout, and standards of operation. Fur
thermore, Roy and Wiggins (1970) and Vosloh (1976) furnished resource
and capital requirements for feed manufacturing at various levels of
production. These references guided the design of model on-farm feed
mills in this study.
CHAPTER II
EXPERIMENTAL DESIGN
An economic-engineering approach was used to develop mill de
signs and budgets for Arizona poultry ranchers. Costs of feed produced
by the synthesized mills were compared to the cost of commercial feed
acquisitiop. As in any synthesis or budget approach, specific assump
tions wremade for design specifications, costs, and related prices.
This chapter outlines the assumptions and philosophy of the
analysis. It begins with the derivation of production and storage re
quirements and continues with the provision of sources for developing
mill design and on-farm feed milling cost components. An explanation
of on-farm feed milling's process flow is then given followed by a list
ing of costs inherent in using commercial feed. Next, the procedure for
making cost comparisons is detailed which includes consideration of
total investment, costs associated with ownership, operating costs,
ingredient costs, and cost-savings on an average year and Year 1 basis
at various levels of capacity utilization. The effects of size and an
additional 8 hour work shift are also explored. Finally, the basis for
determining the influence of on-farm feed milling on the Arizona egg
producer's competitive position in the local egg market is given.
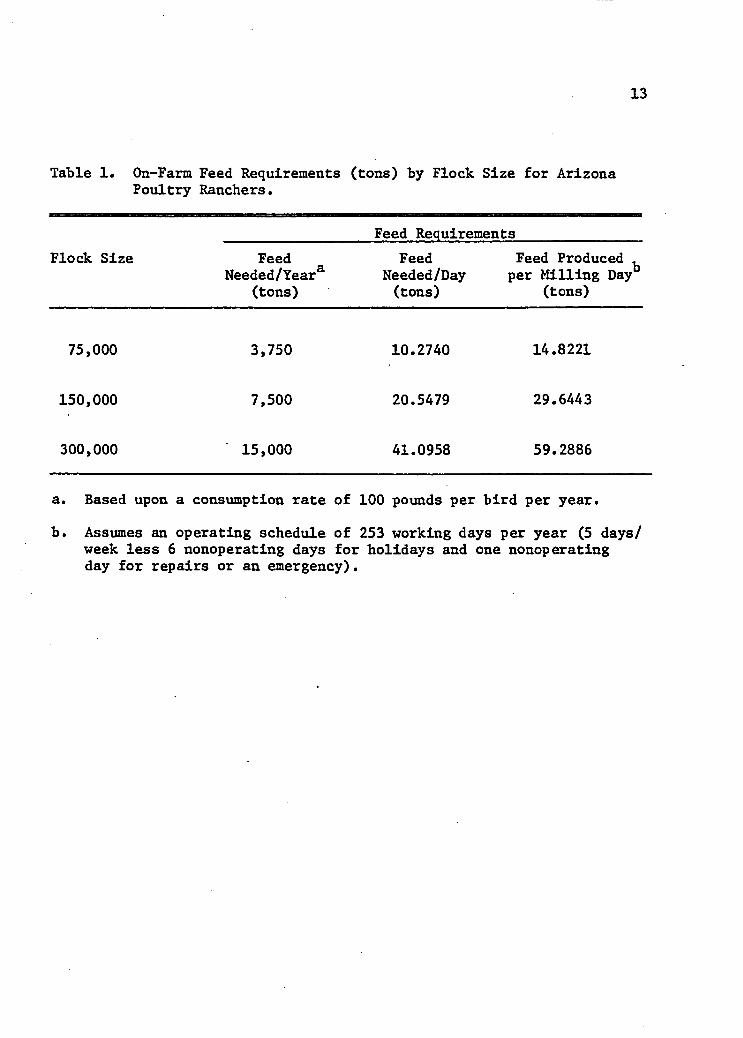
Production Requirements
A layer consumption rate of 100 pounds of feed per bird per year
was assumed to determine production requirements of on-farm feed mills
11
12
for flock sizes representing current and anticipated levels of Arizona
egg production (Table 1). Specifically, flock sizes of 75,100, 150,000,
and 300,000 birds were investigated at 100 percent capacity utilization.
Annual feed requirements (tons) for each flock size were estimated by
multiplying the consumption rate by the number of birds in each flock.
Daily feed requirements were found by dividing annual requirements by
365 days. Finally, tons of feed produced per milling day were ascer
tained by assuming an 8 hour operating schedule of 253 days per year
(5 days per week less 6 nonoperating days for holidays and one non
operating day for repairs or an emergency). As a result, on-farm feed
mills with approximately 15, 30, and 60 ton production capacity of
finished feed per 8 hour day were studied.
Storage Requirements
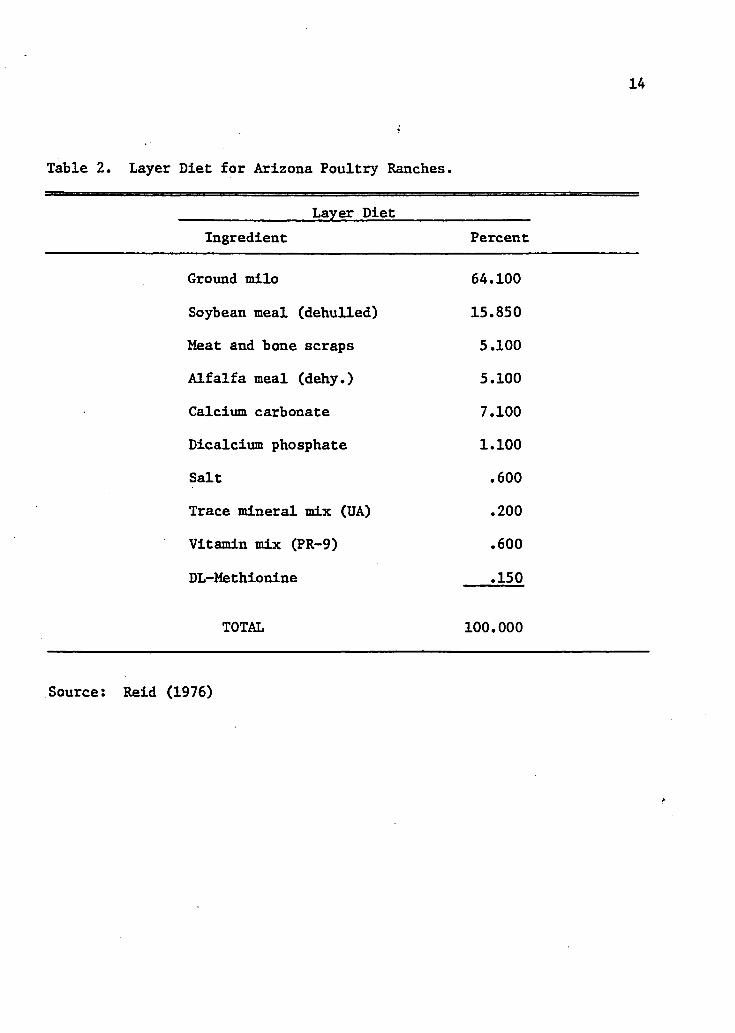
Storage requirements for ingredients were established for a
layer diet prepared by The University of Arizona College of Agriculture
based upon production requirements per milling day (Tables 2 and 3).
Allowing for 3 percent shrinkage in the milling process, the amount of
each ingredient needed per year was calculated depending upon its com
position in the layer diet. Daily ingredient requirements were then
estimated from which a 14 day storage capacity for ingredients was deter
mined. In addition, finished feed storage was assumed at two milling
days production except for the 60 ton' mill which had one.
The problem of reserve storage capacity for ingredients and
finished feed was considered in the feed mill design. The capacity of
this storage depended upon cost/benefit trade-offs. The specifications
13
Table 1. On-Farm Feed Requirements (tons) by Flock Size for Arizona Poultry Ranchers.
Feed RequirementsFlock Size Feed
Needed/Year*(tons)
FeedNeeded/Day (tons)
Feed Produced . per Milling Day"
(tons)
75,000 3,750 10.2740 14.8221
150,000 7,500 20.5479 29.6443
300,000 15,000 41.0958 59.2886
a. Based upon a consumption rate of 100 pounds per bird per year.
b. Assumes an operating schedule of 253 working days per year (5 days/ week less 6 nonoperating days for holidays and one nonoperating day for repairs or an emergency).
14
Table 2. Layer Diet for Arizona Poultry Ranches.
Layer DietIngredient Percent
Ground milo 64.100
Soybean meal (dehulled) 15.850
Meat and bone scraps 5.100
Alfalfa meal (dehy.) 5.100
Calcium carbonate 7.100
Dicalcium phosphate 1.100
Salt .600
Trace mineral mix (UA) .200
Vitamin mix (PR-9) .600
DL-Methionine .150
TOTAL 100.000
Source: Reid (1976)
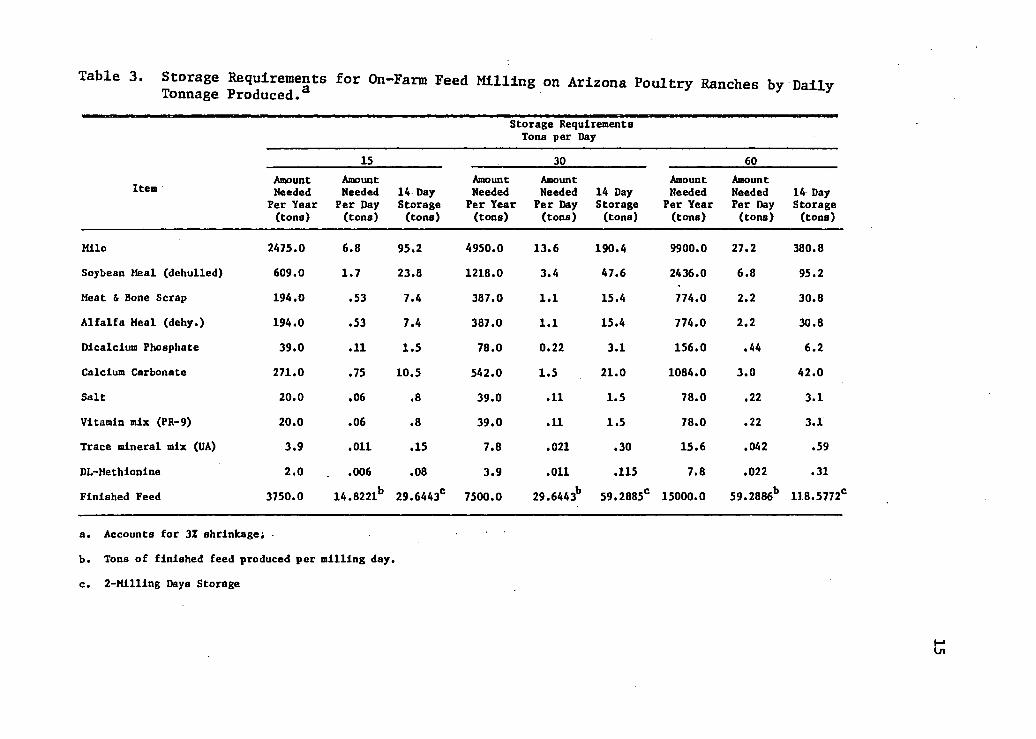
Table 3. Storage Requirements for On-Farm Feed Milling on Arizona Poultry Ranches by Daily Tonnage Produced. 1 3
Storage Requirements Tons per Day
Item
15 30 60Amount Needed
Per Year (tons)
Amount Needed Per Day (tons)
14 Day Storage (tons)
Amount Needed Per Year (tons)
Amount Needed Per Day (tons)
14 Day Storage (tons)
Amount Needed Per Year (tons)
Amount Needed Per Day (tons)
14 Day Storage (tons)
Hilo 2475.0 6.8 95.2 4950.0 13.6 190.4 9900.0 27.2 380.8Soybean Heal (dehulled) 609.0 1.7 23.8 1218.0 3.4 47.6 2436.0 6.8 95.2Meat & Bone Scrap 194.0 .53 7.4 387.0 1.1 15.4 774.0 2.2 30.8Alfalfa Heal (dehy.) 194.0 .53 7.4 387.0 1.1 15.4 774.0 2.2 30.8Dicalcium Phosphate 39.0 .11 1.5 78.0 0.22 3.1 156.0 • 44 6.2Calcium Carbonate 271.0 .75 10.5 542.0 1.5 21.0 1084.0 3.0 42.0Salt 20.0 .06 .8 39.0 .11 1.5 78.0 .22 3.1Vitamin mix (PR-9) 20.0 .06 .8 39.0 .11 1.5 78.0 .22 3.1Trace mineral mix (UA) 3.9 .011 .15 7.8 .021 .30 15.6 .042 .59DL-Methionine 2.0 .006 .08 3.9 .011 .115 7.8 .022 .31Finished Feed 3750.0 14.8221b 29.6443C 7500.0 29.6443b 59.2885C 15000.0 59.2886b 118.5772'
a. Accounts for 3% shrinkage; •b. Tons of finished feed produced per milling day.c. 2-Hilling Days Storage
16
provided for "working" storage at approximately 11 days for ingredient
delivery and allowed for delays in receiving ingredients or mill break
down without immediate cessation of feeding operations. Plants were de
signed without large storage capacities in order to avoid higher fixed
costs. Additional storage facilities for ranchers to take advantage of
seasonal ingredient price fluctuations and quantity discounts were
recognized as an investment decision outside of on-farm feed milling
and, thus, not considered in this study. Ingredient storage was
specified in "days" because it permitted poultry ranchers to know how
many days a flock could suffice with on-farm feed storage while finished
feed storage was measured in "milling-days" in order to maintain adequate
supply on milling days lost due to repairs or emergencies.
Mill Design and Costs
Physical plants for model on-farm feed mills were then designed
using the economic-engineering approach. Planning guides from the
U.S.D.A. and American Feed Manufacturers Association explained basic
mill operations from which additional plant designs from other feasi
bility studies were used as input for synthesizing Arizona on-farm feed
mills. The Arizona designs were examples of representative plants for
their type and size which may not be ideal in every respect; however,
efforts were made to ensure relative efficiency in their implementation.
Mr. Mel Gunning (1977), a Phoenix millwright, reviewed the plant
designs to make certain that they were workable, efficient, and expand
able. Subsequently, costs for building and implementing mills were ob
tained from equipment dealers and related suppliers. Modifications in
17
design were made at this time to account for adaptation of standard
equipment and facilities in the mill instead of adhering to specifica
tions that demanded custom-made items at higher prices (Appendix A).
Yet, actual mill situations would probably require slight modification
from these specifications due to the unique physical, feed, and financial
requirements of each ranch.
Feed Ingredient Prices
The problem of forecasting feed ingredient prices to determine
on-farm feed milling’s total cost were not considered in this study be
cause prices vary seasonally'as well as from year to year. Rather,
February 23, 1977 ingredient prices as paid by Arizona Feeds, a Tucson-
based commercial feed processor, were used because they were relatively
current Arizona quotations. As a result, these prices may differ from
those paid by Arizona poultry ranchers due to volume purchases, hedging,
and ranch location. Nevertheless, they provided a useful estimate which
ranchers could easily substitute for once their individual ingredient
prices are known.
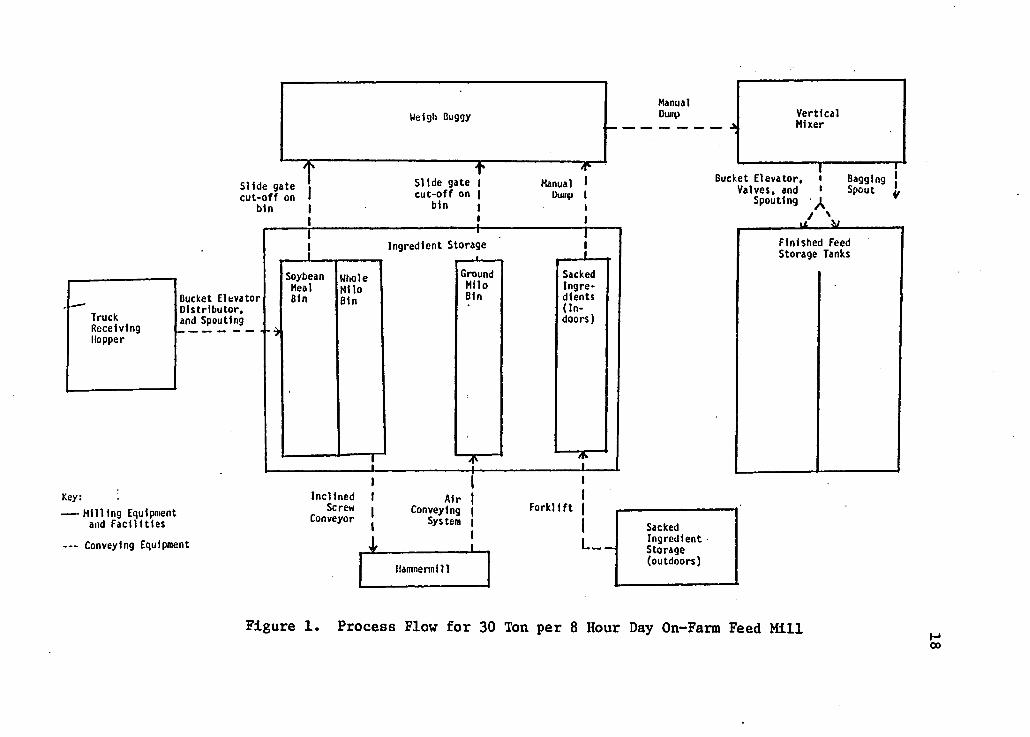
Process Flow
The mills designed in this study were automatic electric and
comprised three centers of operation: (1) receiving, (2) processing,
and (3) mixing (Figure 1). Receiving entailed dumping bulk ingredients
into a truck receiving hopper that conveyed the ingredients by gravity
to a bucket elevator for storage in ingredient tanks. In this case,
milo and soybean meal were the only bulk ingredients stored. All other ingredients were sacked and kept outside the mill building. Forklifts
ManualDump
Bucket E le v a to r , * V a lve s , and 1
Spouting ^
BaggingSpout
Manual I Dump 1
S lid e gate I c u t -o f f on |
b in 1
S lid e gate c u t -o f f on
b ln
Fin ish ed Feed Storage Tanks
In g re d ie n t Storage
SoybeanMealBlnBucket E leva to r
D is tr ib u to r , and Spouting
In c lin e d I Screw •
Conveyor J
Key:
------M il l in g Equipmentand F a c i l i t ie s
— Conveying Equipment
F o r k l i f tConveying j System |
HammertnU 1
SackedIn g re d ie n tStorage(outd oo rs )
GroundM iloBln
SackedIn g re d ien ts( In doors)Truck
ReceivingHopper
V e r t ic a lM ixer
Weigh Buggy
Figure 1. Process Flow for 30 Ton per 8 Hour Day On-Farm Feed Mill H00
19were used to transfer sacked feed Ingredients into the mill building
when needed.
Processing involved grinding of grain into a digestable form,.
In this case, milo moved through discharge screw conveyors to the
hammermill for grinding. At completion, milo was brought to a ground
grain storage bin by either a screw or pneumatic conveyor, depending
upon which was more efficient for the particular sized mill.
Mixing included combining all ingredients into a single feed
ration and conveying it to a mill storage facility. Ingredients were
unloaded in their proper proportions into a weigh buggy and then de
posited into a vertical mixer. Next, mixed feed was discharged into a
second bucket elevator and taken to finished feed storage.
No consideration was given to pelletizing feed. However, a
bagging spout was included on the mixer because it provided an oppor
tunity for storing feed at a relatively low cost in case of an emergency
as well as providing the means to sell sacked feed.
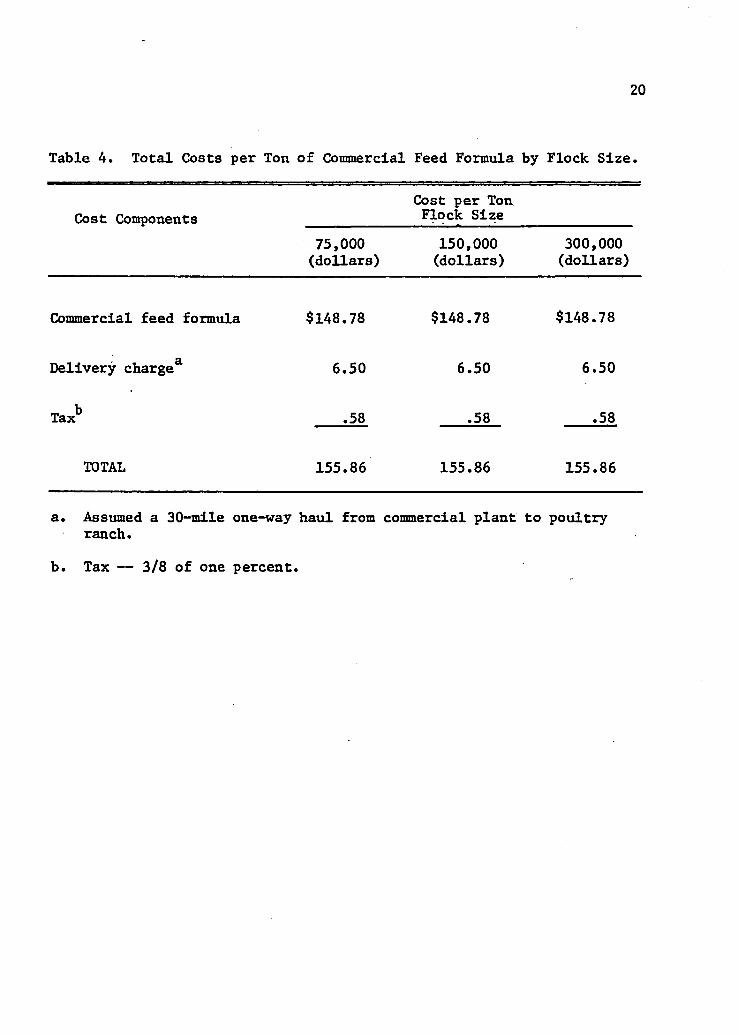
Commercial Feed
Total costs for purchasing commercial feed equivalent to
that produced on-farm were obtained from Arizona Feeds, Tucson (Table 4).
Their prices were assumed representative of feed costs currently encurred
by Arizona poultry ranchers although Arizona Feeds was not the only
source of poultry feed for the state. Included in them were charges for
feed, delivery, and state tax. Volume discounts were not considered be
cause they were believed to vary among feed producers and ranchers.
20
Table 4. Total Costs per Ton of Commercial Feed Formula by Flock Size.
Cost ComponentsCost per Ton Flock Size
75,000(dollars)
150,000(dollars)
300,000(dollars)
Commercial feed formula $148.78 $148.78 $148.78
Delivery charge* 6.50 6.50 6.50
Taxb .58 .58 .58
TOTAL 155.86 155.86 155.86
a. Assumed a 30-mile one-way haul from commercial plant to poultry ranch.
b. Tax — 3/8 of one percent.
21
Procedure for the Analysis
Average annual costs were used to determine the economic feasi
bility of on-farm feed milling on Arizona poultry ranches based upon
cost comparisons analysis with commercial feed acquisition. Production
costs were also computed for Year 1 to permit poultry ranchers to assess
the initial financial requirements of operating an on-farm feed mill.
The criterion used for evaluating on-farm feed milling was cost
per ton of feed because of its traditional application in the literature.
Accordingly, the qualitative equivalency between on-farm processed feed
and commercial feed was assumed. No basis was found for using cost per
unit of product over cost per ton of feed as suggested by Dauzat and Roy
(1975).
Total investment was calculated for each model mill and used for
estimating annual production costs. Subsequently, annual depreciation,
interest on investment, insurance, taxes, and costs for electricity and
repairs were determined based upon assumptions and sources given in
Tables 6 and 17. However, further explanation of annual depreciation
follows to cite effects of different derivation techniques on total cost.
Annual investment in equipment and facilities were computed
using the traditional method of averaging initial investment and sal
vage value. However, Selley (1977) pointed out that this method under
states the interest on investment and, therefore, annual cost of Tn-m
operation. The basic reason for the underestimate is that the time
value of funds is overlooked in the traditional method. For example,
higher interest costs would result from more frequent replacement of
22
equipment or facilities whereas interest costs would remain constant
when estimated using the traditional method.
Costs to determine the magnitude of the underestimate of interest
in using the traditional method and changes in interest costs that evolve
from use of the net present value method were determined. Specifically,
interest costs for the mill were calculated using the present value
method with an 8.5 percent interest rate. Then, the interest rate re
quired to provide the same interest cost using the depreciation method
was computed (Appendix B). Although interest costs were underestimated
by 26 and 33 percent for assets having useful lifetimes of 17 and 25
years, respectively, in no case were the conclusions of this study al
tered by use of the depreciation method versus the net present value
method.
Subtracting on-farm feed milling’s annual production cost per
ton from commercial feed's cost per ton yielded the maximum ingredient
cost per ton for on-farm feed milling economic feasibility. Conse
quently, ingredients costing more than this dollar amount per ton en
sured a loss from on-farm feed milling while ingredients costing less
indicated cost-savings.
Cost of ingredients per ton of finished feed was confuted by
adding the products of the total cost per hundredweight for each in
gredient and its proportion in the layer diet and multiplying that sum
by twenty (since 20 cwt ■ 1 ton). Summing finished feed’s ingredient
cost per ton and the production cost per ton yielded on-farm feed mill
ing total cost per ton.
23
Cost-savings or losses per ton were derived by subtracting the
cost per ton of on-farm feed milling from commercial feed. Time to re
pay the on-farm feed milling initial investment was estimated by divid
ing the initial mill investment by depreciation and interest on invest
ment (Dauzat and Roy 1975). Furthermore, a payout period was predicted
that included cost-savings for repayment of the initial investment.
Cost reductions per ton of on-farm milled feed due to increases
in daily tonnage produced were investigated to determine the existence
and degree of economies of size. Furthermore, relationships among cost
items for on-farm feed milling were traced through a percentage distribu
tion of production costs.
Effects of less than 100 percent capacity utilization of on-farm
feed milling total cost per ton were examined to find at what utiliza
tion rates, if any, on-farm feed milling cost more than using commercial
feed. This is extremely important to Arizona poultry ranchers since
flock sizes, and hence, feed requirements can vary considerably over
time. Fixed cost per ton was adjusted proportionally for decreases in
feed production and equipment depreciation. Equipment depreciation de
creased proportionally to capacity utilization since less usage extended
equipment lifetimes. Variable cost per ton was reduced 10 percent less
than output due to inherent fixed characteristics: for example, elec
trical power usage where mill facilities must be lighted during mill
operations regardless of the amount of finished feed produced (Austin
and Nelson 1966)• Labor costs were also reduced in this process making
the mill operator's job part-time although the mill operator would be
probably assigned other farm duties so that he would not seek employment
24
elsewhere. Total costs per ton were then determined for 80, 60, and 40
percent capacity utilizations.
Relationships between fixed and variable costs were also changed
to study the effects of adding a second 8 hour work shift to Arizona
on-farm feed mills. Operating mills at 100 percent capacity with two
8 hour work shifts was explored as a lower cost alternative to investing
in larger plants that produced the same amount of feed.
Finally, Wilson’s claim (1975) that feed costs were the primary
factor affecting the competitive disadvantage of Arizona egg producers
with respect to California producers prompted investigating on-farm
feed milling as a means of offsetting this disadvantage. Thus, percent
reductions in feed costs associated with on-farm feed milling were com
pared to the percent reductions estimated by Wilson (1975) to produce
eggs at feed costs equivalent to California.
CHAPTER III
RESULTS OF THE* ANALYSIS
Costs of on-farm feed milling and commercial feed acquisition
are compared in this chapter. In addition, costs associated with on-
farm feed milling are detailed. Calculations of initial investment for
the 15, 30, and 60 ton per 8 hour day mills are made which become the
foundation for determining costs on an average annual and Year 1 basis.
The following variables are estimated: production costs, production
cost per ton, maximum ingredient cost per ton for on-farm feed milling
economic feasibility, ingredient cost per ton, cost-savings, total cost,
total cost per ton, and time required to repay the initial investment.
Economies of size, cost component relationships, capacity utilization at
levels less than 100 percent, and capital versus labor intensive mills
are discussed. Finally, the cost of on-farm processed feed is compared
to cost reductions necessary to become competitive with California egg
producers as determined by Wilson (1975).
Average Annual Costs Associated with On-Farm Feed Milling
On-farm feed milling provided feed at less cost than commercial
acquisition on an average annual basis. It resulted in cost-savings and
repayed the initial investment during the useful lifetime of the invest
ment. A useful life of 25 years for facilities and 17 years for equipment was assumed.
25
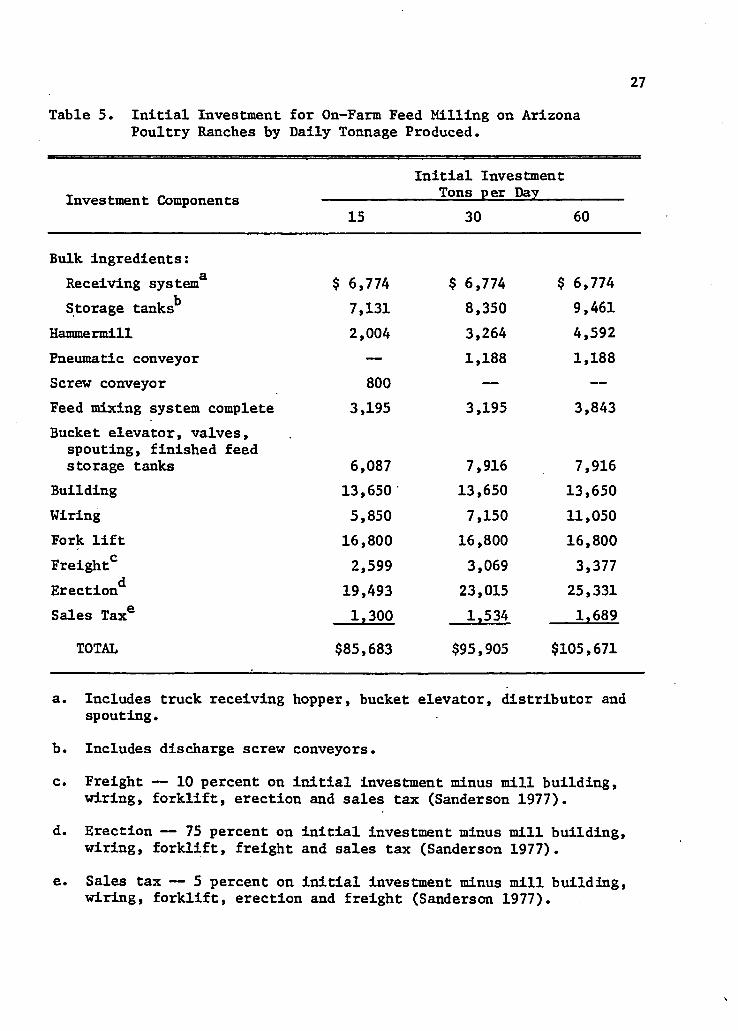
Initial investments for 15, 30, and 60 ton per 8 hour day on-
farm feed mills on Arizona poultry ranches were $85,683, $95,905, and
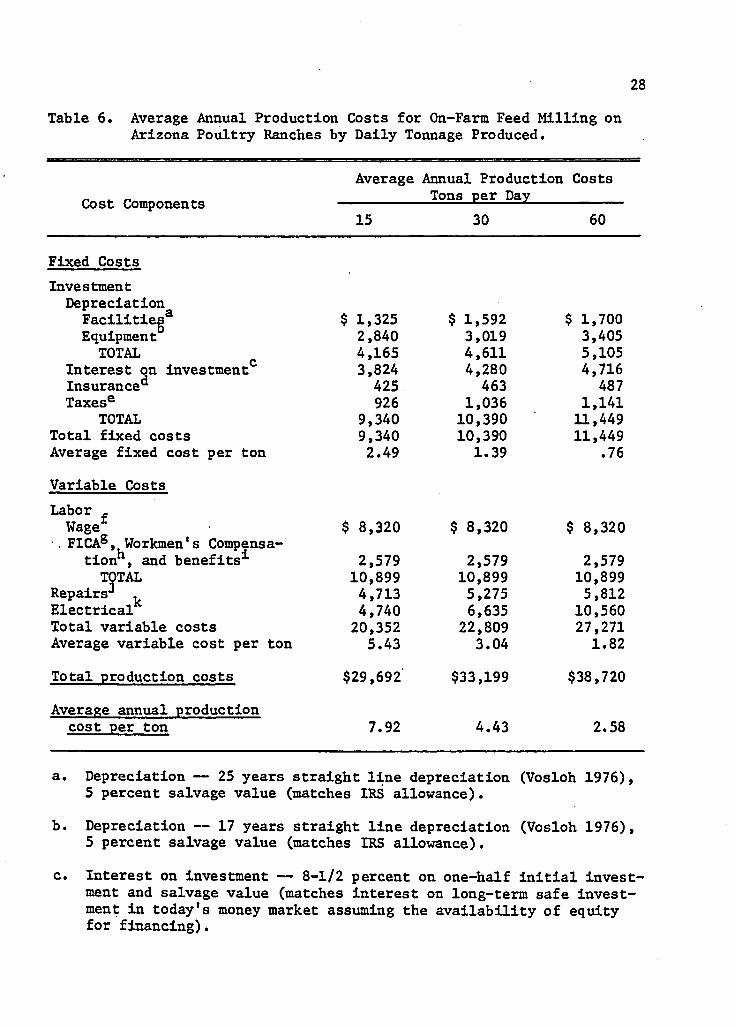
$105,671, respectively (Table 5). Total production costs for the aver
age year amounted to $29,692, $33,199, and $38,720 (Table 6). Conse
quently, average annual production costs per ton were $7.92, $4.43, and
$2.58 (Table 6).
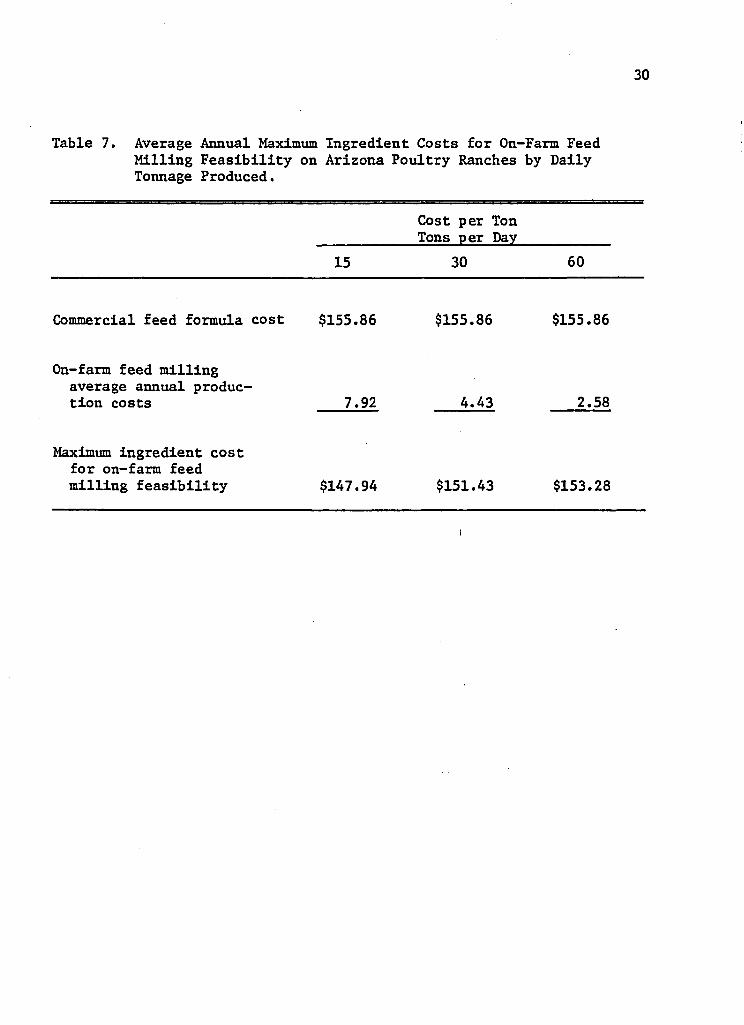
The total cost of commercial feed was estimated at $155.86 per
ton which made the average annual maximum ingredient costs for on-farm
feed milling feasibility $147.94, $151.43, and $153.28 per ton, respec
tively, for the 15, 30, and 60 ton mills (Table 7). Since ingredient
cost per ton of finished feed was $137 (Table 8), cost-savings were
apparent for the on-farm feed milling alternative.
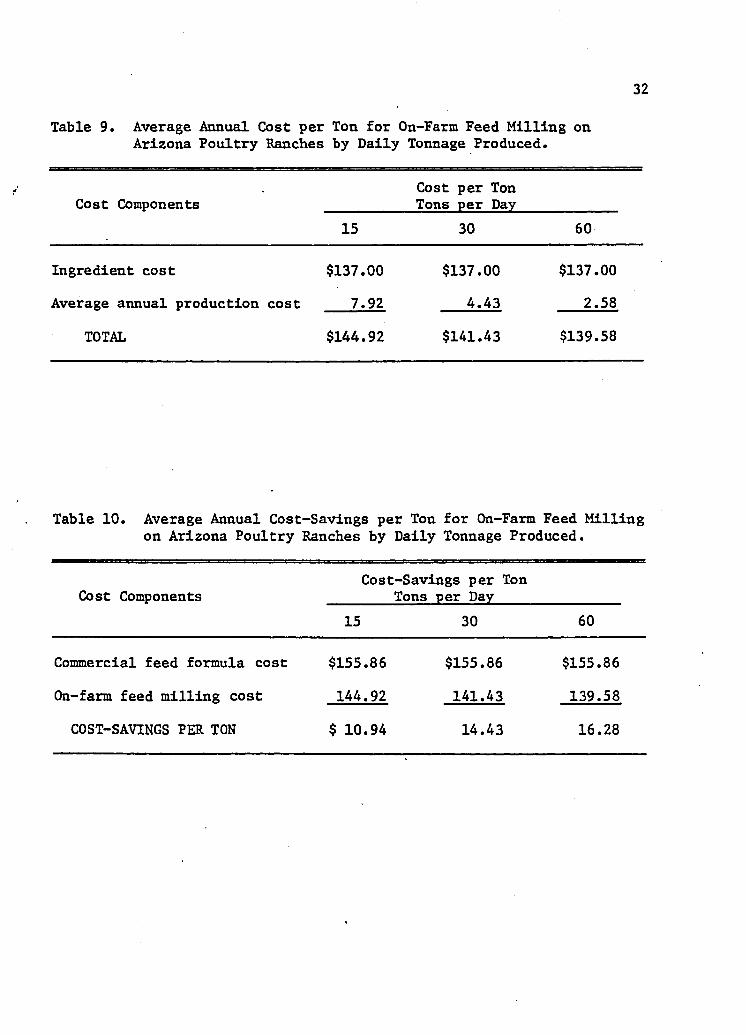
Total average annual costs per ton for on-farm feed milling were
$144.92, $141.43, and $139.58 (Table 9) which provided average annual
cost-savings per ton of $10.94, $14.43, and $16.28 (Table 10). The re
quired time to repay the initial investment for each mill was 10.72,
10.79, and 10.76 years (Table 11). However, inclusion of cost-savings
to repay initial investment reduced the time required to 1.75, .82, and
.42 years.
26
Average Annual Cost Relationships for On-Farm Feed Milling
Economies of Size
Economies of size existed for on-farm feed milling because cost-
savings were greatest for larger volume egg producers requiring greater
feed tonnages (Table 12). Average annual cost reductions per ton of

27Table 5. Initial Investment for On-Farm Feed Milling on
Poultry Ranches by Daily Tonnage Produced.Arizona
Investment ComponentsInitial Investment
Tons per Day15 30 60
Bulk ingredients:Receiving system3 $ 6,774 $ 6,774 $ 6,774Storage tanks** 7,131 8,350 9,461
Hammermill 2,004 3,264 4,592Pneumatic conveyor — 1,188 1,188Screw conveyor 800 — ”Feed mixing system complete Bucket elevator, valves,
3,195 3,195 3,843
spouting, finished feedstorage tanks 6,087 7,916 7,916
Building 13,650 13,650 13,650Wiring 5,850 7,150 11,050Fork lift 16,800 16,800 16,800Freight0 2,599 3,069 3,377Erection** 19,493 23,015 25,331Sales Tax6 1,300 1,534 1,689
TOTAL $85,683 $95,905 $105,671
a. Includes truck receiving hopper, bucket elevator, distributor and spouting.
b. Includes discharge screw conveyors.
c. Freight — 10 percent on initial investment minus mill building, wiring, forklift, erection and sales tax (Sanderson 1977).
d. Erection — 75 percent on initial investment minus mill building, wiring, forklift, freight and sales tax (Sanderson 1977).
e. Sales tax — 5 percent on initial investment minus mill building, wiring, forklift, erection and freight (Sanderson 1977).
27
Table 5. Initial Investment for On-Farm Feed Milling on ArizonaPoultry Ranches by Daily Tonnage Produced.
Initial InvestmentInvestment Components Tons per Day
15 30 60
Bulk ingredients:Receiving system3 $ 6,774 $ 6,774 $ 6,774Storage tanks*1 7,131 8,350 9,461
Hammermill 2,004 3,264 4,592Pneumatic conveyor — 1,188 1,188Screw conveyor 800 — ——Feed mixing system complete 3,195 3,195 3,843Bucket elevator, valves,
spouting, finished feedstorage tanks 6,087 7,916 7,916
Building 13,650 13,650 13,650Wiring 5,850 7,150 11,050Fork lift 16,800 16,800 16,800Freight0 2,599 3,069 3,377Erection** 19,493 23,015 25,331Sales Tax6 1,300 1,534 1,689
TOTAL $85,683 $95,905 $105,671
a. Includes truck receiving hopper, bucket elevator, distributor and spouting.
b. Includes discharge screw conveyors.
c. Freight — 10 percent on initial investment minus mill building, wiring, forklift, erection and sales tax (Sanderson 1977).
d. Erection — 75 percent on initial investment minus mill building, wiring, forklift, freight and sales tax (Sanderson 1977).
e. Sales tax — 5 percent on initial investment minus mill building, wiring, forklift, erection and freight (Sanderson 1977).
28
Table 6. Average Annual Production Costs for On-Farm Feed Milling onArizona Poultry Ranches by Daily Tonnage Produced.
Cost ComponentsAverage Annual Production
Tons per DayCosts
15 30 60
Fixed CostsInvestmentDepreciation
Facilities $ 1,325 $ 1,592 $ 1,700Equipment0 2,840 3,019 3,405
TOTAL 4,165 4,611 5,105Interest on investment0 3,824 4,280 4,716Insurance^ 425 463 487Taxes6 926 1,036 1,141
TOTAL 9,340 10,390 11,449Total fixed costs 9,340 10,390 11,449Average fixed cost per ton 2.49 1.39 .76
Variable Costs Labor ,Wage $ 8,320 $ 8,320 $ 8,320
•. FICA8 , Workmen's Compensa-tion , and benefits3- 2,579 2,579 2,579TOTAL
Repairs** .10,899 10,899 10,8994,713 5,275 5,812
Electrical* 4,740 6,635 10,560Total variable costs 20,352 22,809 27,271Average variable cost per ton 5.43 3.04 1.82
Total production costs $29,692 $33,199 $38,720
Average annual productioncost per ton 7.92 4.43 2.58
a. Depreciation — 25 years straight line depreciation (Vosloh 1976), 5 percent salvage value (matches IRS allowance).
b. Depreciation — 17 years straight line depreciation (Vosloh 1976), 5 percent salvage value (matches IRS allowance).
c. Interest on investment — 8-1/2 percent on one-half initial investment and salvage value (matches interest on long-term safe investment in today's money market assuming the availability of equity for financing).
29Table 6. (continued)
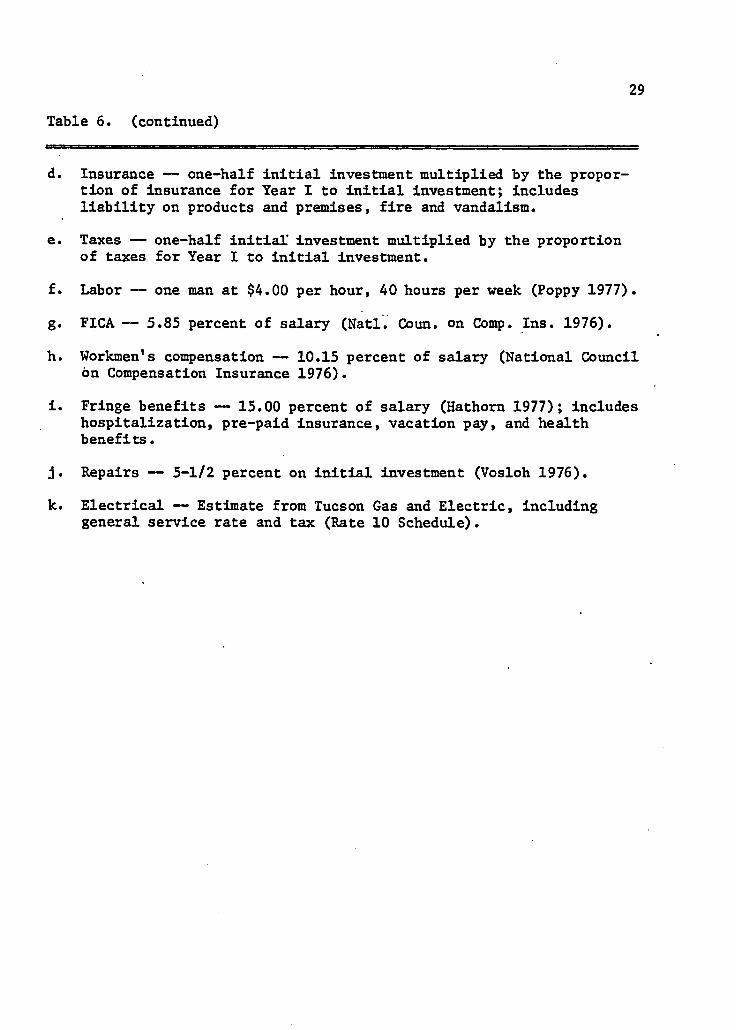
d. Insurance — one-half Initial Investment multiplied by the proportion of insurance for Year I to initial investment; includes liability on products and premises, fire and vandalism.
e. Taxes — one-half initial investment multiplied by the proportion of taxes for Year I to initial investment.
f. Labor — one man at $4.00 per hour, 40 hours per week (Poppy 1977).
g. PICA — 5.85 percent of salary (Natl. Coun. on Comp. Ins. 1976).
h. Workmen’s compensation — 10.15 percent of salary (National Council on Compensation Insurance 1976).
i. Fringe benefits — 15.00 percent of salary (Hathom 1977); includes hospitalization, pre-paid insurance, vacation pay, and health benefits.
j. Repairs — 5-1/2 percent on initial investment (Vosloh 1976).
k. Electrical — Estimate from Tucson Gas and Electric, including general service rate and tax (Rate 10 Schedule).
30
Table 7. Average Annual Maximum Ingredient Costs for On-Farm Feed Milling Feasibility on Arizona Poultry Ranches by Daily Tonnage Produced.
Cost per Ton__________ Tons per Day________15 30 60
Commercial feed formula cost $155.86 $155.86 $155.86
On-farm feed milling average annual production costs 7.92 4.43 2.58
Maximum ingredient cost for on-farm feed milling feasibility $147.94 $151.43 $153.28
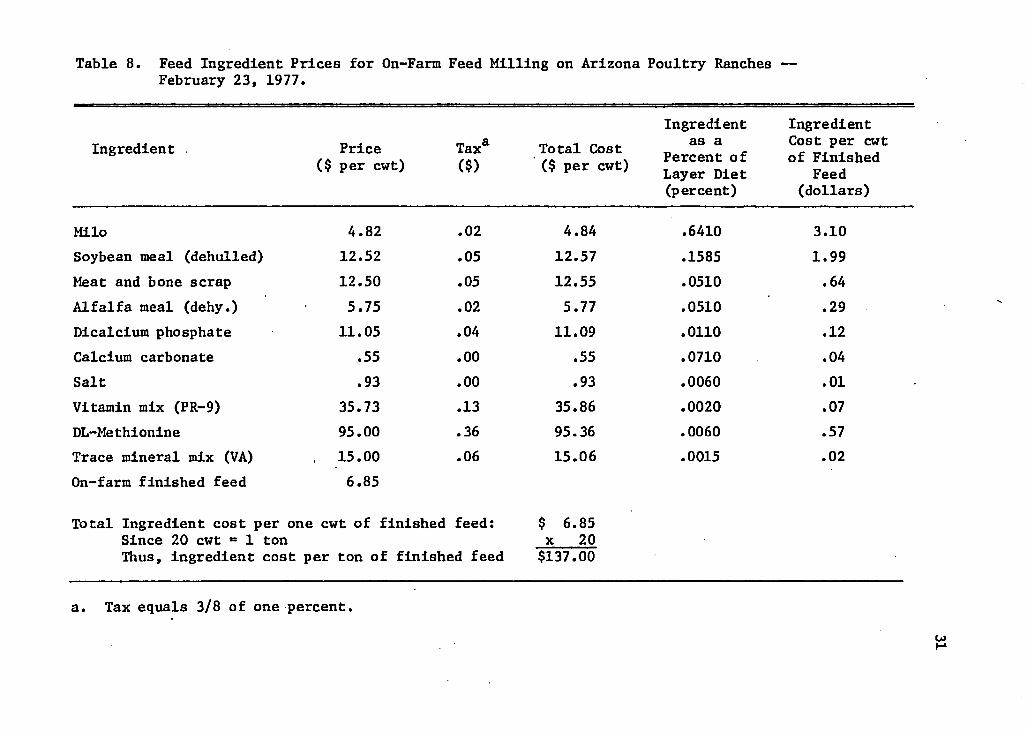
Table 8. Feed Ingredient Prices for On-Farm Feed Milling on Arizona Poultry Ranches February 23, 1977.
Ingredient IngredientIngredient Price
($ per cwt)Tax*($)
Total Cost ($ per cwt)
as aPercent of Layer Diet (percent)
Cost per cwt of Finished
Feed(dollars)
Milo 4.82 .02 4.84 .6410 3.10Soybean meal (dehulled) 12.52 .05 12.57 .1585 1.99Meat and bone scrap 12.50 .05 12.55 .0510 . 64Alfalfa meal (dehy.) 5.75 .02 5.77 .0510 .29Dicalcium phosphate 11.05 .04 11.09 .0110 .12Calcium carbonate .55 .00 .55 .0710 .04Salt .93 .00 .93 .0060 .01Vitamin mix (PR-9) 35.73 .13 35.86 .0020 .07DL-Methionine 95.00 .36 95.36 .0060 .57Trace mineral mix (VA) 15.00 .06 15.06 .0015 .02On-farm finished feed 6.85
Total Ingredient cost per one cwt of finished feed: $ 6.85Since 20 cwt = 1 ton x 20Thus, ingredient cost per ton of finished feed $137.00
a. Tax equals 3/8 of one percent
32
Table 9. Average Annual Cost per Ton for On-Farm Feed Milling onArizona Poultry Ranches by Daily Tonnage Produced.
Cost Components15
Cost per Ton Tons per Day
30 60
Ingredient cost $137.00 $137.00 $137.00
Average annual production cost 7.92 4.43 2.58
TOTAL $144.92 $141.43 $139.58
Table 10. Average Annual Cost-Savings per Ton for On-Farm Feed Milling on Arizona Poultry Ranches by Daily Tonnage Produced.
Cost-Savings per TonCost Components ________ Tons per Day________________
15 30 60
Commercial feed formula cost $155.86 $155.86 $155.86
On-farm feed milling cost 144.92 141.43 139.58
COST-SAVINGS PER TON $ 10.94 14.43 16.28
33
Table 11. Time to Repay On-Farm Feed Milling Initial Investment on anAverage Annual Basis on Arizona Poultry Ranches by DailyTonnage Produced.
Payout
Time to Repay Initial Investment on an Average Annual Basis
_________ Tons per Day___________15 30 60
Including cost-savings 1.75--- years ---
.82 .42
Not including cost-savings 10.72 10.79 10.76
Table 12. Average Annual Cost Reductions per Ton of Feed Due to Increases in Daily Tonnage Produced.
Tons per Day Cost per Ton Difference
15 $144.92
30 141.43
60 139.58
$3.49
1.85
TOTAL $5.34
34
feed due to daily production increases from 15 to 30 and 30 to 60 tons
were $3.49 and $1.85 per ton. Economies of size, therefore, influenced
on-farm feed milling average annual production costs by a total cost
reduction of $5.34 per ton.
Cost Component Relationships
The identification of major cost components is important in
feasibility decisions. In this study, labor costs were highest as a
proportion of average annual production costs at all levels of feed
production (Table 13). Labor costs decreased, however, from 36.7 to
28.1 percent of average annual production costs as physical plant in
creased from 15 ton to 60 ton capacity since the labor requirement and
cost of one man to operate the mill remained constant regardless of mill
size. Consequently, labor costs were semi-variable in that they in
creased for additional production on existing mill facilities in the
form of additional work shifts but not as plant investment increased.
Electrical costs were the next largest expense of average annual
production costs at all levels of feed production and increased from
16.0 to 27.3 percent as physical plant increased from 15 ton to 60 ton
capacity due to actual increases in expenditure. All other cost items
remained relatively stable as a proportion of average annual production
costs when physical plant increased.
Capacity Utilization
The profitability of operating feed mills at 80, 60, and 40 per
cent of designed capacity was synthesized to account for variability in
flock size. Average annual total costs per ton for on—farm feed milling
35
Table 13. Percentage Distribution of Average Annual Production Costs Among Cost Items for On-Farm Feed Milling on Arizona Poultry Ranches by Daily Tonnage Produced.
Percentage Distribution of Average Annual Production Costs
Cost Components _____________ Tons per Day___________15 30 60
--------------- percent------------ -
Fixed Costs Investment
DepreciationFacilities 4.5 4.8 4.4Equipment 9.6 9.1 8.8
TOTAL 14.1 13.9 13.2Interest on Investment 12.9 12.9 12.2Insurance 1.4 1.4 1.3Taxes 3.1 3.1 2.9
TOTAL 31.5 31.3 29.6Total fixed costs 31.5 31.3 29.6
Variable CostsLaborWage 28.0 25.0 21.4FICA, Workmen's Compensa
tion, and Benefits 8.7 7.8 6.7TOTAL 36.7 32.8 28.1
Repairs 15.8 15.9 15.0Electrical 16.0 20.0 27.3Total variable costs 68.5 68.7 70.4
Total Production Costs 100.0 100.0 100.0
36
remained below the cost for commercial feed at each level of capacity
utilization for the model mills (Table 14). The highest average total
cost per ton was $149.30 at 40 percent capacity of the 15 ton mill
which still provided a cost-saving of $6.56 per ton.
Capital Versus Labor Intensive Mills
Costs were compared to determine the least cost alternative
between building a larger capacity mill or adding an 8 hour work shift
on 15 and 30 ton per 8 hour day mills for producing twice as much feed
per day (Table 15). Investment in larger plant capacity resulted in
ranchers encurring lower costs than using two 8 hour shifts on 15 and
30 ton mills. Specifically, one 8 hour shift on the 30 ton mill cost
$141.43 per ton, $2.62 less than two 8 hour shifts on the 15 ton mill;
one 8 hour shift on the 60 ton mill cost $139.58 per ton, $1.36 less
than two 8 hour shifts on the 30 ton mill. The cost per ton difference
was attributed to the labor intensive mills1 increased fixed cost from
accelerated depreciation and a twofold increase of variable cost which
resulted from the doubling of each variable cost component. Further
more, there were no increases in variable cost for larger capacity mills.
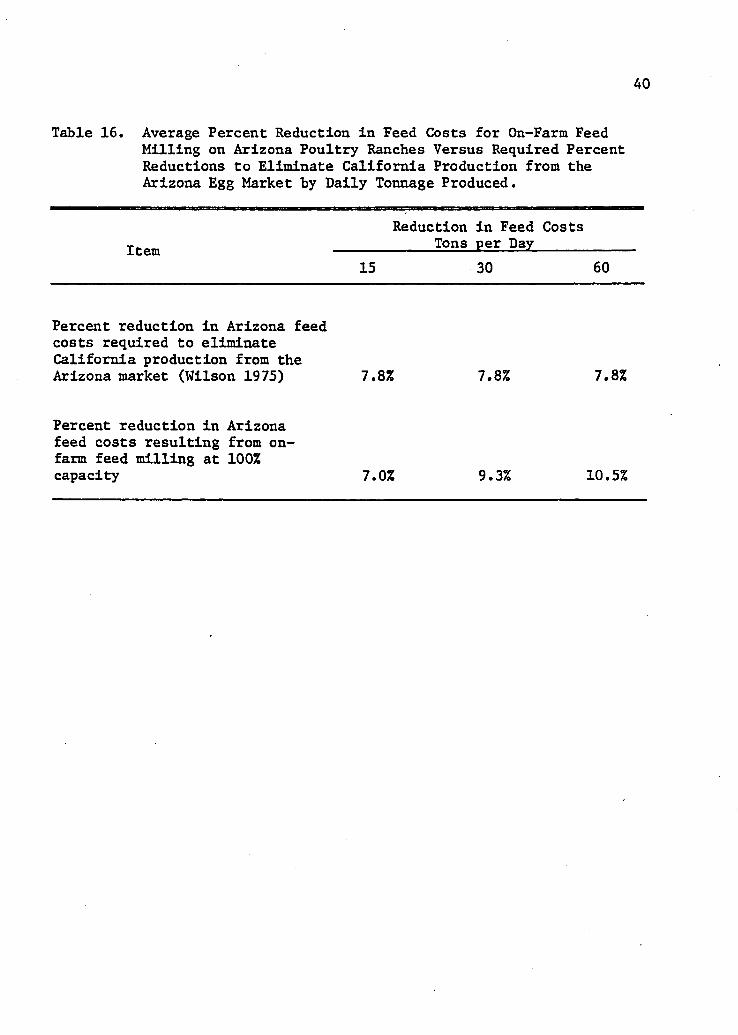
Elimination of Arizona Competitive Disadvantage
Percent reductions in feed costs resulting from the use of 15,
30, and 60 tons per 8 hour day on-farm feed mills were 7.0, 9.3, and
10.5 percent during the average year (Table 16). These cost reductions,
except for production at the 15 ton level, exceeded the 7.8 percent cost
reduction necessary to become competitive with California egg producers
as determined by Wilson (1975).
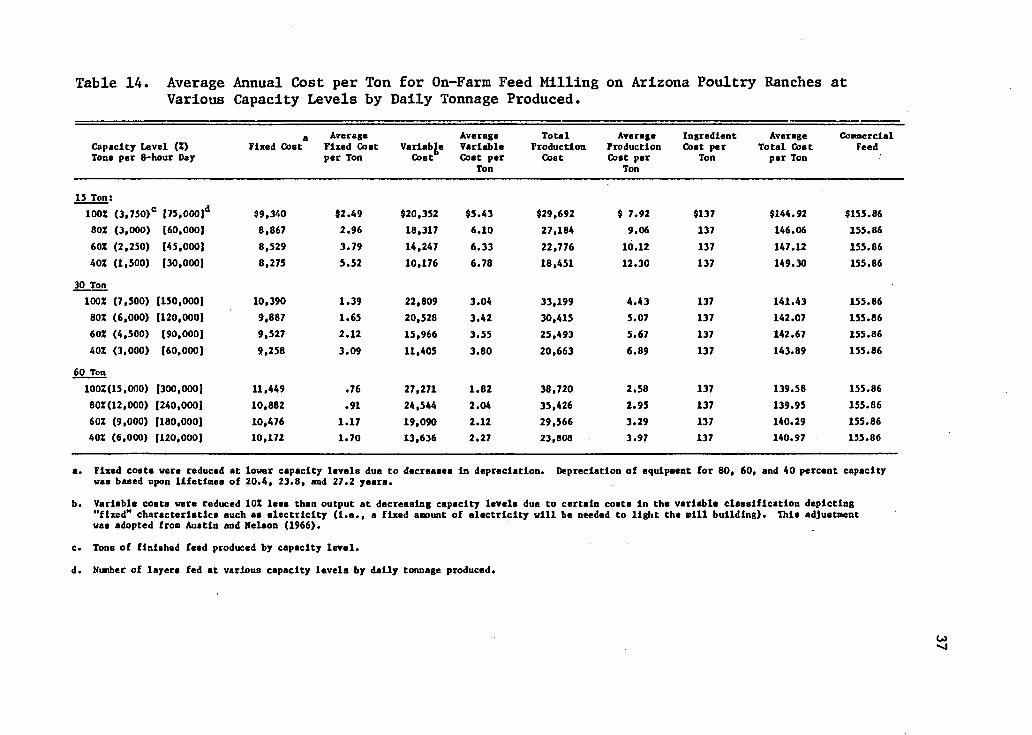
Table 14. Average Annual Cost per Ton for On-Farm Feed Milling on Arizona Poultry Ranches at Various Capacity Levels by Daily Tonnage Produced.
Capacity Level (!) Tons per 8-hour Day
aFixed Cost
Average Fixed Cost per Ton
VariableCost6
Average Variable Cost per
Ton
TotalProductionCost
Average Production Cost per
Ton
Ingredient Cost per
TonAverage
Total Cost per Ton
CommercialFeed
15 Tons100% (3,750)c I75,000]d $9,340 $2.49 $20,352 $5.43 $29,692 $ 7.92 $137 $144.92 $155.8680% (3,000) 160,000) 8,867 2.96 18,317 6.10 27,184 9.06 137 146.06 155.8660% (2,250) [45,000) 8,529 3.79 14,247 6.33 22,776 10.12 137 147.12 155.8640% (1,500) (30,000) 8,275 5.52 10,176 6.78 18,451 12.30 137 149.30 155.86
30 Ton100% (7,500) [150,000) 10,390 1.39 22,809 3.04 33,199 4.43 137 141.43 155.8680% (6,000) (120,000) 9,887 1.65 20,528 3.42 30,415 5.07 137 142.07 155.8660% (4,500) (90,000) 9,527 2.12 15,966 3.55 25,493 5.67 137 142.67 155.8640% (3,000) (60,000) 9,258 3.09 11,405 3.80 20,663 6.89 137 143.89 155.86
60 Ton1002(15,000) (300,000) 11,449 .76 27,271 1.82 38,720 2.58 137 139.58 155.86802(12,000) [240,000] 10,882 .91 24,544 2.04 35,426 2.95 137 139.95 155.8660% (9,000) (180,000) 10,476 1.17 19,090 2.12 29,566 3.29 137 140.29 155.8640% (6,000) (120,000) 10,172 1.70 13,636 2.27 23,808 3.97 137 140.97 155.86
a. Fixed coata were reduced at lower capacity levels due to decreases in depreciation. Depreciation of equipment for 80, 60, and 40 percent capacity was based upon lifetimes of 20.4, 23.8, and 27.2 years.
b. Variable costs were reduced 10% less than output at decreasing capacity levels due to certain costs in the variable classification depicting "fixed" characteristics such as electricity (i.e., a fixed amount of electricity will be needed to light the mill building). This adjustment was adopted from Austin and Nelson (1966)•
c. Tons of finished feed produced by capacity level.d. Number of layers fed at various capacity levels by daily tonnage produced.

Table 15. Average Annual Production Costs at 100% Capacity, One and Two 8 Hour Shifts, for On-Farm Feed Milling on Arizona Poultry Ranches by Daily Tonnage Produced (8 Hour Shift).
Cost ComponentsAverage Annual Production Costs
_________________________Tons per Day_________________________________ 15________ ________ 30________ ________ 60________1 Shift 2 Shifts 1 Shift 2 Shifts 1 Shift 2 Shifts
Fixed CostsInvestment:
DepreciationFacilitiesEquipment3
Interest on investment Insurance ' Taxes
Total fixed cost.Average fixed cost per ton
Variable CostsLabor*1WageFICA, Workmen's Compensation,
and Benefits Total
Repairs3 ,Electrical3Total variable cost;Average variable cost per tonTotal production cost
$1,325 $1,3252,840 5,6803,824 3,824
425 425926 926
9,340 12,1802.49 1.62
$8,320 $16,640
2,579 5,15810,899 21,7984,713 9,4264,740 9,480
20,352 40,7045.43 5.43
29,692 52,884
$1,592 $1,5923,019 6,0384,280 4,280
463 4631,036 1,036
10,390 13,4091.39 .89
$8,320 $16,640
2,579 5,15810,899 21,7985,275 10,5506,635 13,270
22,809 45,6183.04 3.04
33,199 59,027
$1,700 $1,7003,405 6,8104,716 4,716
487 4871,141 1,141
11,449 14,854.76 .50
$8,320 $16,640
2,579 5,15810,899 21,7985,812 11,624
10,560 21,12027,271 54,5421.82 1.82
38,720 69,396 u>00
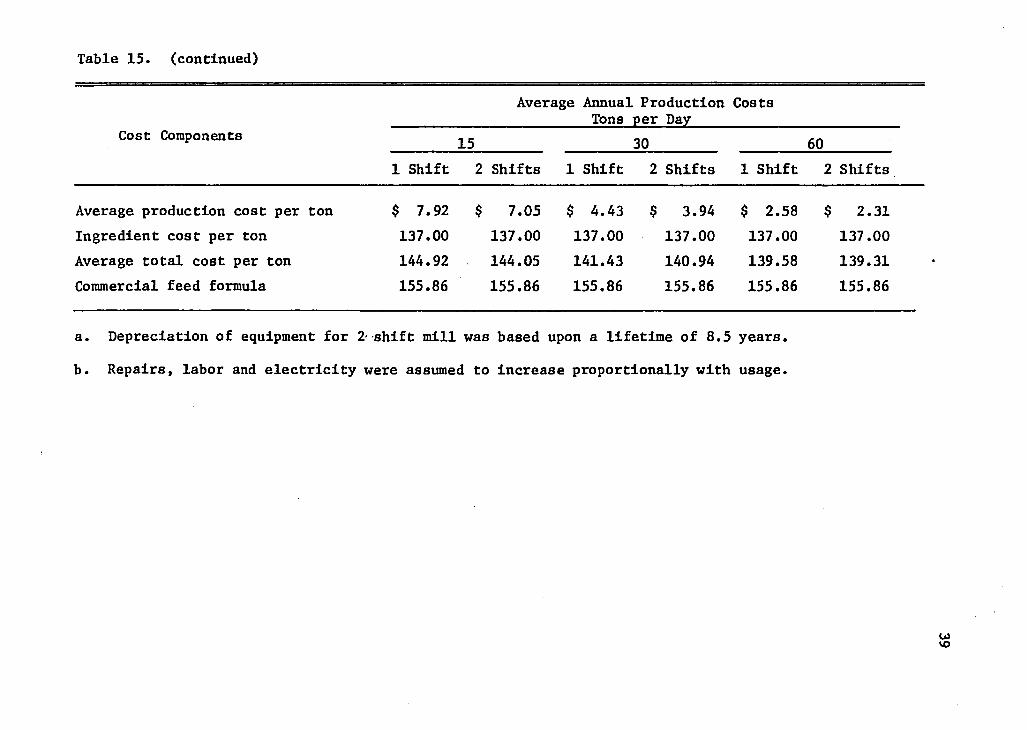
Table 15. (continued)
Cost Components
Average Annual Production Costs Tons per Day
]L5 30 (501 Shift 2 Shifts 1 Shift 2 Shifts 1 Shift 2 Shifts
Average production cost per ton $ 7.92 $ 7.05 $ 4.43 $ 3.94 $ 2.58 $ 2.31Ingredient cost per ton 137.00 137.00 137.00 137.00 137.00 137.00Average total cost per ton 144.92 144.05 141.43 140.94 139.58 139.31Commercial feed formula 155.86 155.86 155.86 155.86 155.86 155.86
a. Depreciation of equipment for 2 shift mill was based upon a lifetime of 8.5 years.
b. Repairs, labor and electricity were assumed to increase proportionally with usage.
wvo
40
Table 16. Average Percent Reduction in Feed Costs for On-Farm FeedMilling on Arizona Poultry Ranches Versus Required Percent Reductions to Eliminate California Production from the Arizona Egg Market by Daily Tonnage Produced.
ItemReduction
Tonsin Feed per Day
Costs
15 30 60
Percent reduction in Arizona feed costs required to eliminate California production from the Arizona market (Wilson 1975) 7.8% 7.8% 7.8%
Percent reduction in Arizona feed costs resulting from on- farm feed milling at 100% capacity 7.0% 9.3% 10.5%
41
Year 1 Costs Associated with On-Farm Feed Milling
Production costs for Year 1 were computed to ascertain the
poultry rancher’s initial cash flow so that an assessment of the capital
available versus the initial financial .requirements■of operating an on-
farm feed mill could be made by individual ranchers. However, it ap
peared that capital availability would not be a problem since the cost
per ton of on-farm processed feed remained below the cost per ton of
commercial feed.
Year 1 annual production costs were higher than the average year
due to higher than average annual fixed costs (Table 17). This was at
tributed to the investment being worth more in its first year of opera
tion than in the average year which resulted in higher costs for interest
on investment, insurance and taxes. Thus, total Year 1 production costs
were $34,866, $38,977, and $45,065 having production costs per ton of
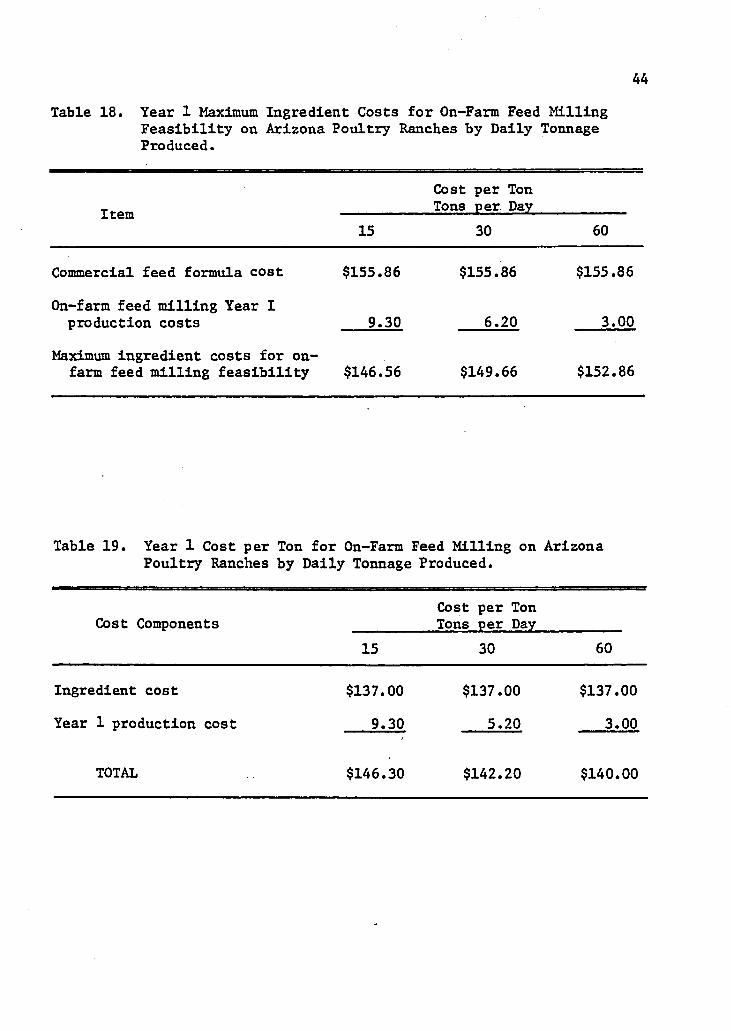
$9.30, $5.20, and $3.00. Maximum ingredient costs for on-farm feed mill
ing feasibility were lower at $146.56, $149.66 and $152.86 per ton
(Table 18), but still provided cost-savings since ingredient cost per
ton of finished feed was $137.00. Total Year 1 production costs per
ton were higher at $146.30, $142.20, and $140.00 (Table 19) which pro
vided lower cost-savings per ton of $9.56, $13.66, and $15.86 (Table 20).
The payout periods if Year 1 depreciation and interest on invest
ment were constant throughout the mill’s useful lifetime were 7.25, 7.28,
and 7.27 years and 1.88, .86, and .43 years when cost-savings was in
cluded (Table 21). Consequently, the actual payout periods for the
mills lie between the Year 1 and average year estimates because: (1)
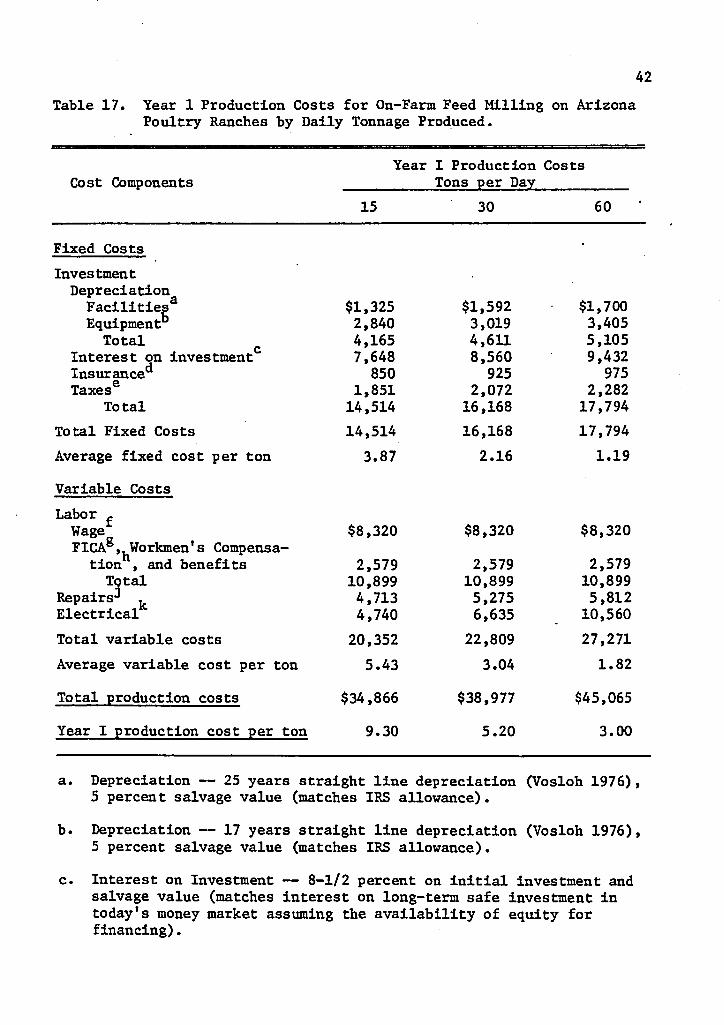
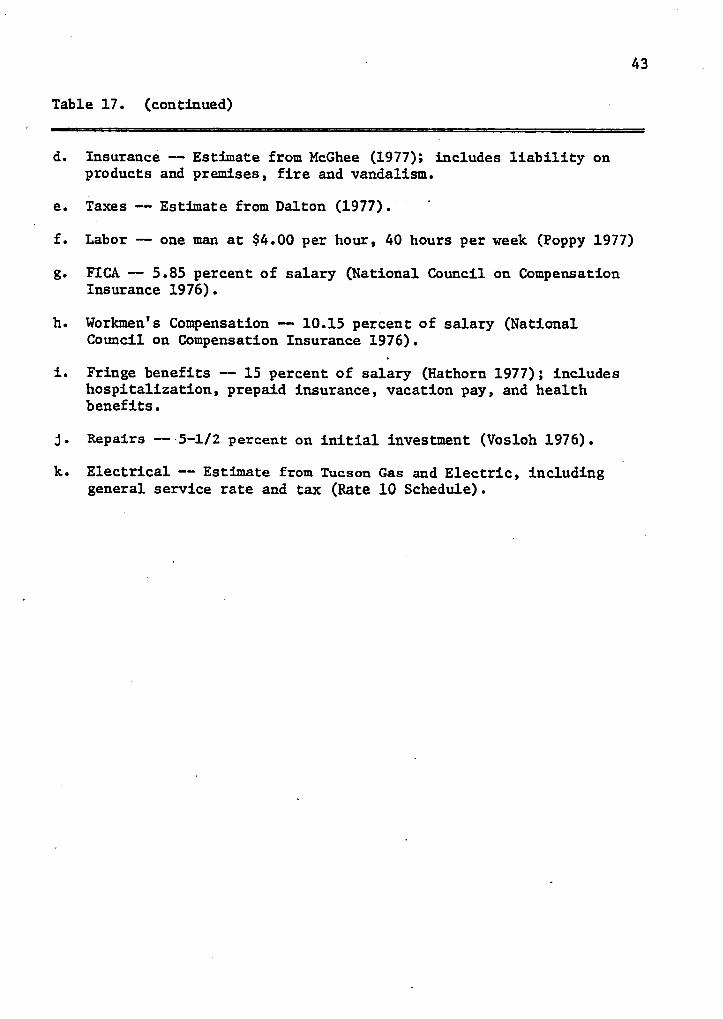
42Table 17. Year 1 Production Costs for On-Farm Feed Milling on Arizona
Poultry Ranches by Daily Tonnage Produced.
Cost ComponentsYear
15
I Production Tons per Day
30
Costs
60
Fixed CostsInvestmentDepreciation
FacilitiesEquipment"
$1,325 $1,592 $1,7002,840 3,019 3,405
Total 4,165 4,611 5,105Interest on investment 7,648 8,560 9,432Insurance" 850 925 975Taxes6 1,851 2,072 2,282
To tal 14,514 16,168 17,794Total Fixed Costs 14,514 16,168 17,794Average fixed cost per ton 3.87 2.16 1.19
Variable Costs Labor ,Wage $8,320 $8,320 $8,320FICA,.Workmen*s Compensa-
tion , and benefits 2,579 2,579 2,579Total 10,899 10,899 10,899
Repairs-* . 4,713 5,275 5,812Electrical* 4,740 6,635 10,560Total variable costs 20,352 22,809 27,271Average variable cost per ton 5.43 3.04 1.82
Total production costs $34,866 $38,977 $45,065
Year I production cost per ton 9.30 5.20 3.00
a. Depreciation — 25 years straight line depreciation (Vosloh 1976), 5 percent salvage value (matches IRS allowance).
b. Depreciation — 17 years straight line depreciation (Vosloh 1976), 5 percent salvage value (matches IRS allowance).
c. Interest on Investment — 8-1/2 percent on initial investment and salvage value (matches interest on long-term safe investment in today’s money market assuming the availability of equity for financing).
43
Table 17. (continued)
d. Insurance — Estimate from McGhee (1977); includes liability on products and premises, fire and vandalism.
e. Taxes — Estimate from Dalton (1977).
f. Labor — one man at $4.00 per hour, 40 hours per week (Poppy 1977)
g. FICA — 5.85 percent of salary (National Council on Compensation Insurance 1976).
h. Workmen’s Compensation — 10.15 percent of salary (National Council on Compensation Insurance 1976).
i. Fringe benefits — 15 percent of salary (Hathorn 1977); includes hospitalization, prepaid insurance, vacation pay, and health benefits.
j . Repairs -- 5-1/2 percent on initial investment (Vosloh 1976).
k. Electrical — Estimate from Tucson Gas and Electric, including general service rate and tax (Rate 10 Schedule).
44
Table 18. Year 1 Maximum Ingredient Costs for On-Farm Feed Milling Feasibility on Arizona Poultry Ranches by Daily Tonnage Produced.
ItemCost per Ton Tons per Day
15 30 60
Commercial feed formula cost $155.86 $155.86 $155.86
On-farm feed milling Year I production costs 9.30 6.20 3.00
Maximum ingredient costs for on- farm feed milling feasibility $146.56 $149.66 $152.86
Table 19. Year 1 Cost per Ton for On-Farm Feed Milling on Poultry Ranches by Daily Tonnage Produced.
Arizona
Cost ComponentsCost per Ton Tons per Day
15 30 60
Ingredient cost $137.00 $137.00 $137.00
Year 1 production cost 9.30 5.20 3.00
TOTAL $146.30 $142.20 $140.00
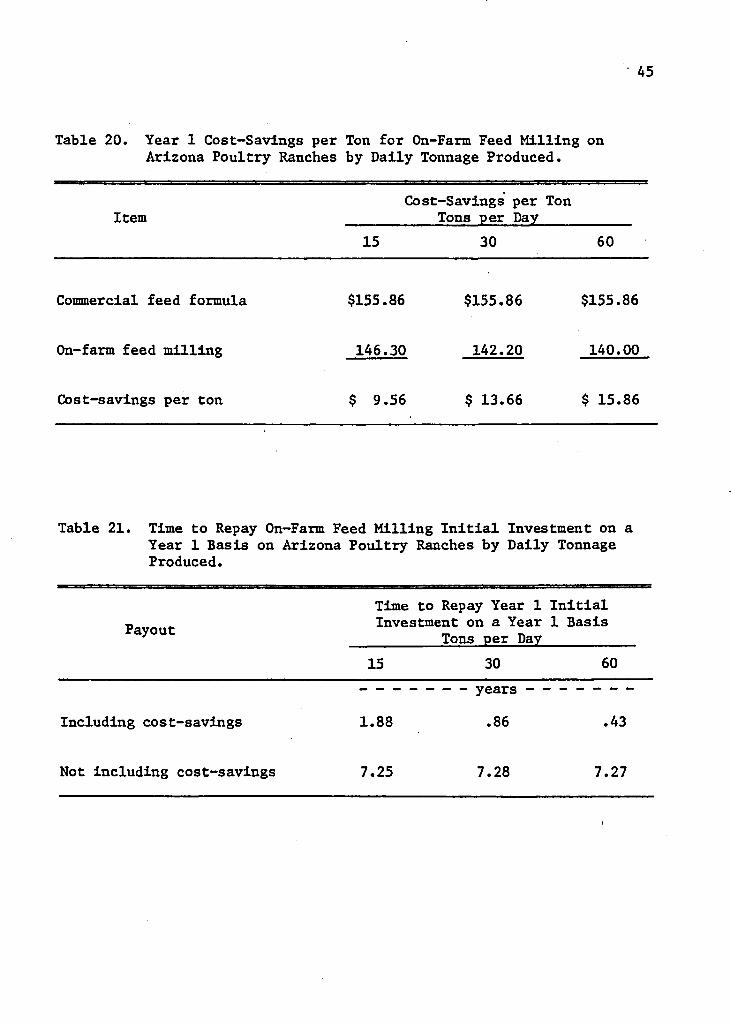
Table 20. Year 1 Cost-Savings per Ton for On-Farm Feed Milling on Arizona Poultry Ranches by Daily Tonnage Produced.
Cost-Savings per TonItem Tons per Day
15 30 60
Commercial feed formula $155.86 $155.86 $155.86
On-farm feed milling 146.30 142.20 140.00
Cost-savings per ton $ 9.56 $ 13.66 $ 15.86
Table 21. Time to Repay On-Farm Feed Milling Initial Investment on a Year 1 Basis on Arizona Poultry Ranches by Daily Tonnage Produced.
PayoutTime to Repay Year 1 Investment on a Year
Tons per Day15 30
Initial 1 Basis
60
Including cost-savings 1.88 .86 .43
Not including cost-savings 7.25 7.28 7.27
46
the payout period based on the average year overstates the actual since
more depreciation and interest are payed out before the average year,
and (2) the payout period based on Year 1 understates the actual since
less depreciation and interest on investment are payed out after the
first year.
Year 1 Cost Relationships for On-Farm Feed Milling
Economies of Size
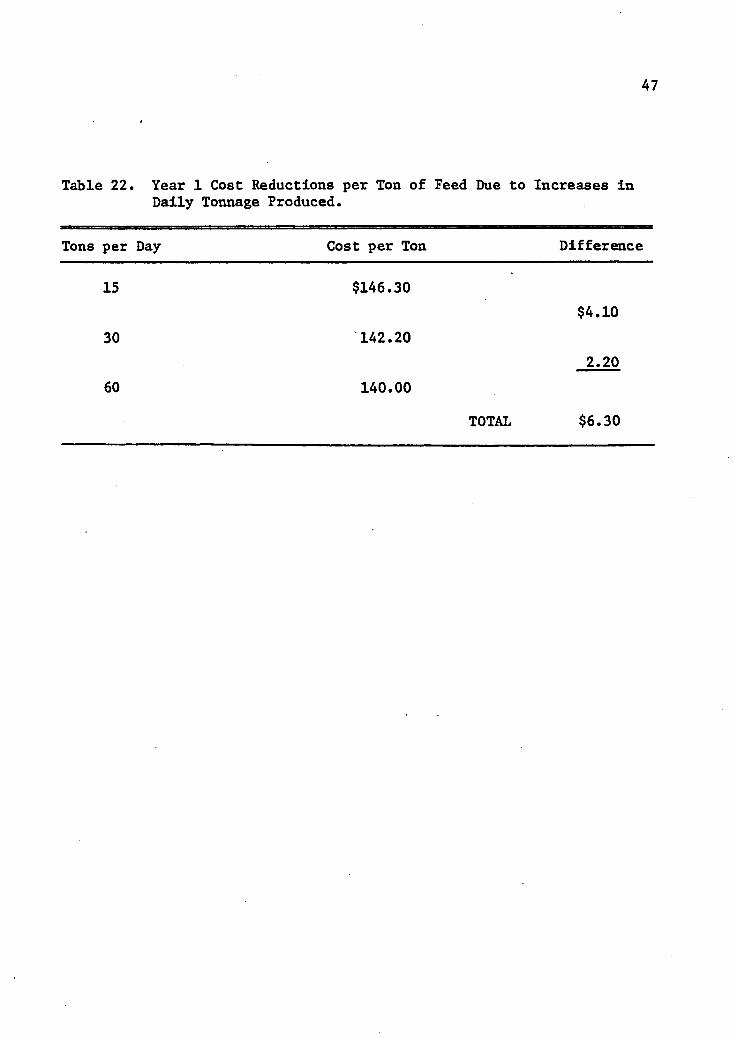
As expected, economies of size were larger for on-farm feed mill
ing during Year 1 than on an average annual basis due to Year l*s higher
production costs (Table 22). Year 1 cost reductions per ton of feed due
to daily production increases from 15 to 30 and 30 to 60 tons were $4.10
and $2.20 per ton; therefore, total cost reductions from economies of
size were $6.30 per ton.
Cost Component Relationships
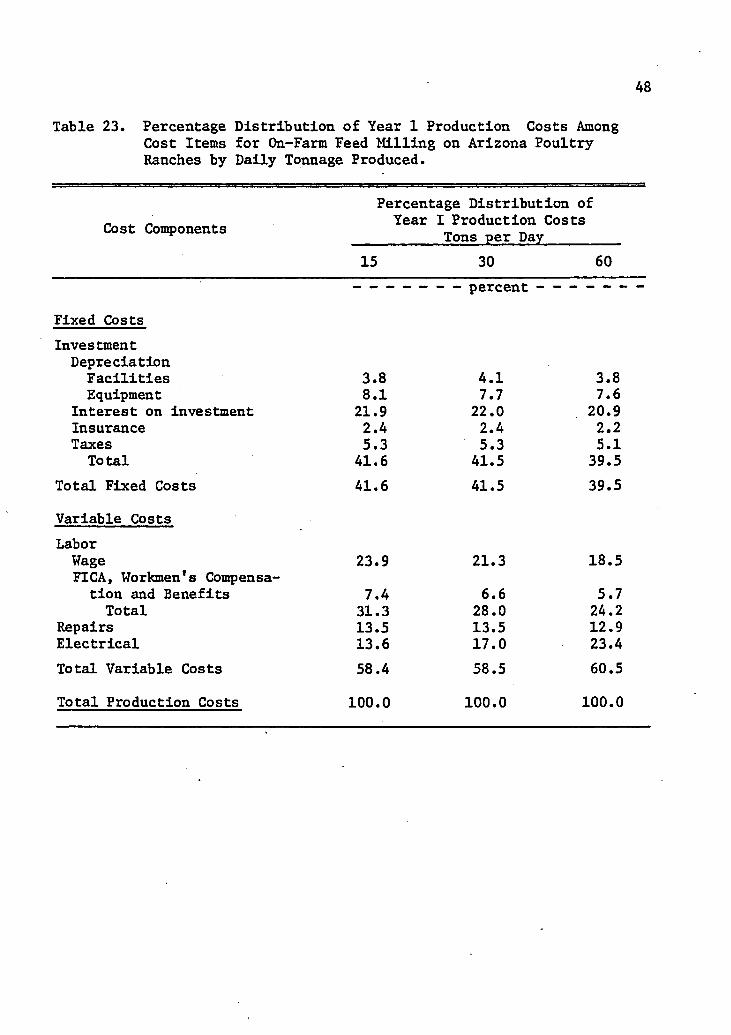
Increases in interest on investment, the second largest expense,
reduced variable costs as a proportion of total production costs for
the model mills (Table 23). Labor costs remained highest as a propor
tion of total production costs but at a lower level of 31.3 to 24.2
percent as physical plant increased from 15 to 60 ton capacity. Elec
trical costs followed interest on investment as the next major expense
ranging from 13.6 to 23.4 percent of total production costs.
47
Table 22. Year 1 Cost Reductions per Ton of Feed Due to Increases in Daily Tonnage Produced.
Tons per Day Cost per Ton Difference
15
30
60
$146.30
142.20
140.00
$4.10
2.20
TOTAL $6.30
48
Table 23. Percentage Distribution of Year 1 Production Costs Among Cost Items for On-Farm Feed Milling on Arizona Poultry Ranches by Daily Tonnage Produced.
Cost Components
Fixed CostsInvestmentDepreciation
FacilitiesEquipment
Interest on investment Insurance Taxes
TotalTotal Fixed Costs
Variable CostsLabor
WageFICA, Workmen's Compensa
tion and Benefits Total
Repairs ElectricalTotal Variable Costs
Percentage Distribution of Year I Production Costs
__________ Tons per Day________15 30 60• ----------- percent----------
3.88.121.92.45.341.641.6
23.9
7.431.313.513.658.4
100.0
4.17.722.02.45.3
41.541.5
21.3
6.628.013.5 17.058.5
100.0
3.87.6
20.92.25.139.539.5
18.5
5.724.212.923.460.5
100.0Total Production Costs
Capacity Utilization and Capital Versus Labor Intensive Mills
Year 1 total costs per ton for on-farm feed milling remained
below the cost for commercial feed at each level of capacity utiliza
tion for the designed mills (Table 24). Furthermore, larger mill
capacity provided lower costs per ton when producing 30 and 60 tons of
feed per day than adding an 8 hour work shift on 15 and 30 ton per 8
hour day mills (Table 25).
Elimination of Arizona Competitive Disadvantage
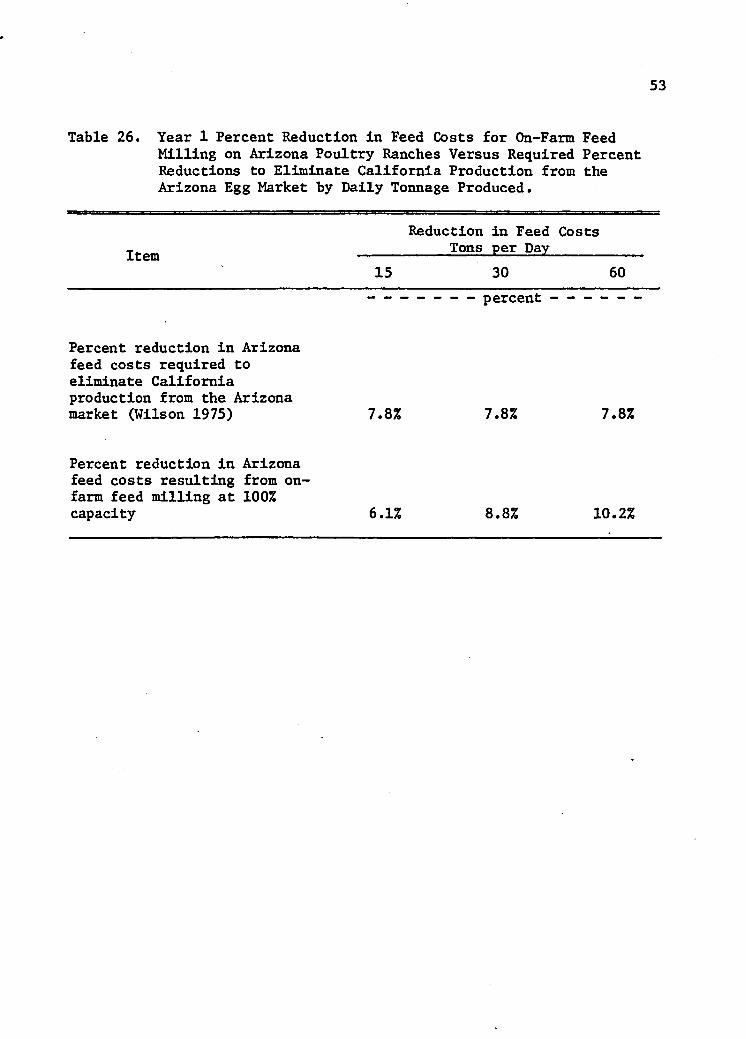
Finally, the relative reductions in feed cost for Year 1 were
6.1, 8.8, and 10.2 percent for the 15, 30, and 60 ton mills (Table 26).
These cost reductions, with the exception of the 15 ton level, exceeded
the 7.8 percent cost reduction necessary to become competitive with
California egg producers as determined by Wilson (1975).
49
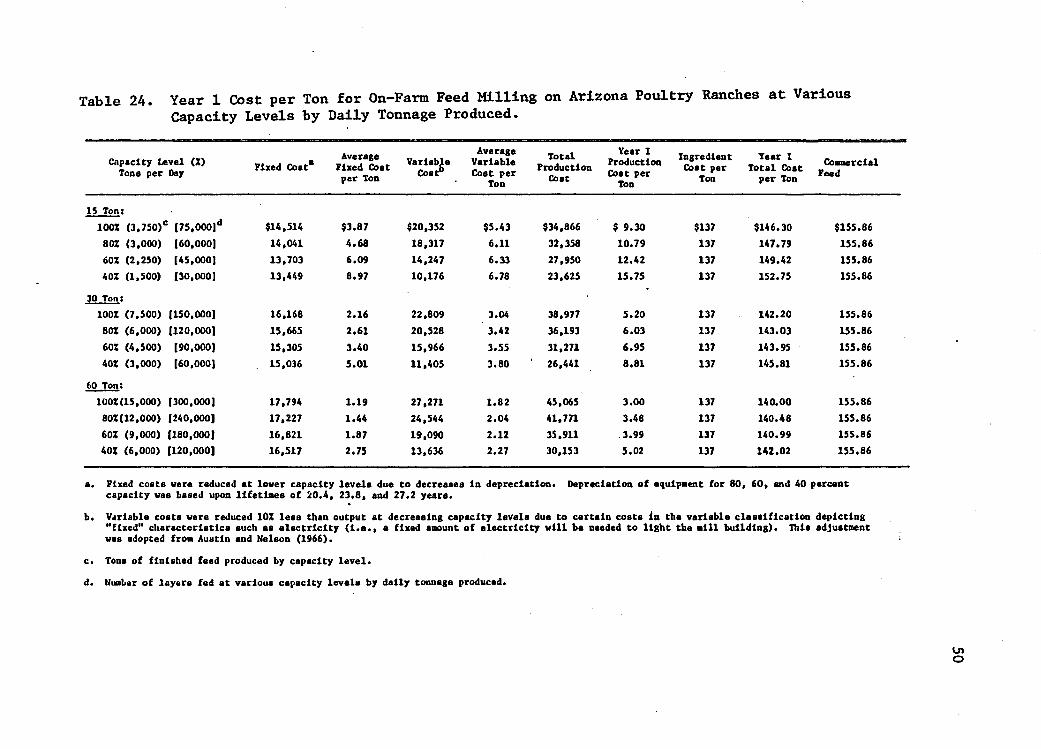
Table 24. Year 1 Cost per Ton for On-Farm Feed Milling on Arizona Poultry Ranches at Various Capacity Levels by Daily Tonnage Produced.
Capacity Level (X) Tons per Day Fixed Cost8
Average Fixed Cost per Ton
VariableCost”
Average Variable Cost per
Ton
TotalProduction
Cost
Year I Production Cost per Ton
Ingredient Cost per
TonYear I
Total Cost per Ton
CommercialFeed
15 Ton:100% (3,750)* I75,0001d $14,514 $3.87 $20,352 $5.43 $34,866 $ 9.30 $137 $146.30 $155.8680% (3,000) (60,000] 14,041 4.68 18,317 6.11 32,358 10.79 137 147.79 155.8660% (2,250) [45,0001 13,703 6.09 14,247 6.33 27,950 12.42 137 149.42 155.8640% (1,500) 130,000] 13,449 8.97 10,176 6.78 23,625 15.75 137 152.75 155.86
30 Ton:100% (7,500) [150,000] 16,168 2.16 22,809 3.04 38,977 5.20 137 142.20 155.8680% (6,000) [120,000] 15,665 2.61 20,528 3.42 36,193 6.03 137 143.03 155.8660% (4,500) [90,000] 15,305 3.40 15,966 3.55 31,271 6.95 137 143.95 155.8640% (3,000) [60,000] 15,036 5.01 11,405 3.80 ' 26,441 8.81 137 145.81 155.86
60 Toni100%(15,000) (300,000] 17,794 1.19 27,271 1.82 45,065 3.00 137 140.00 155.8680%(12,000) (240,000] 17,227 1.44 24,544 2.04 41,771 3.48 137 140.48 155.8660% (9,000) [180,000] 16,821 1.87 19.090 2.12 35.911 3.99 137 140.99 155.8640% (6,000) [120,000] 16,517 2.75 13,636 2.27 30,153 5.02 137 142.02 155.86
a. Fixed costs were reduced at lower capacity levels due to decreases in depreciation# Depreciation of equipment for 80, 60, and 40 percent capacity was based upon lifetimes of 20.4, 23.8, and 27.2 years.
b. Variable costs were reduced 10% less than output at decreasing capacity levels due to certain costs in the variable classification depicting "fixed" characteristics such as electricity (l.e., a fixed amount of electricity will be needed to light the mill building). This adjustment was adopted from Austin and Nelson (1966).
c. Tons of finished feed produced by capacity level.d. Number of layers fed at various capacity levels by daily tonnage produced.
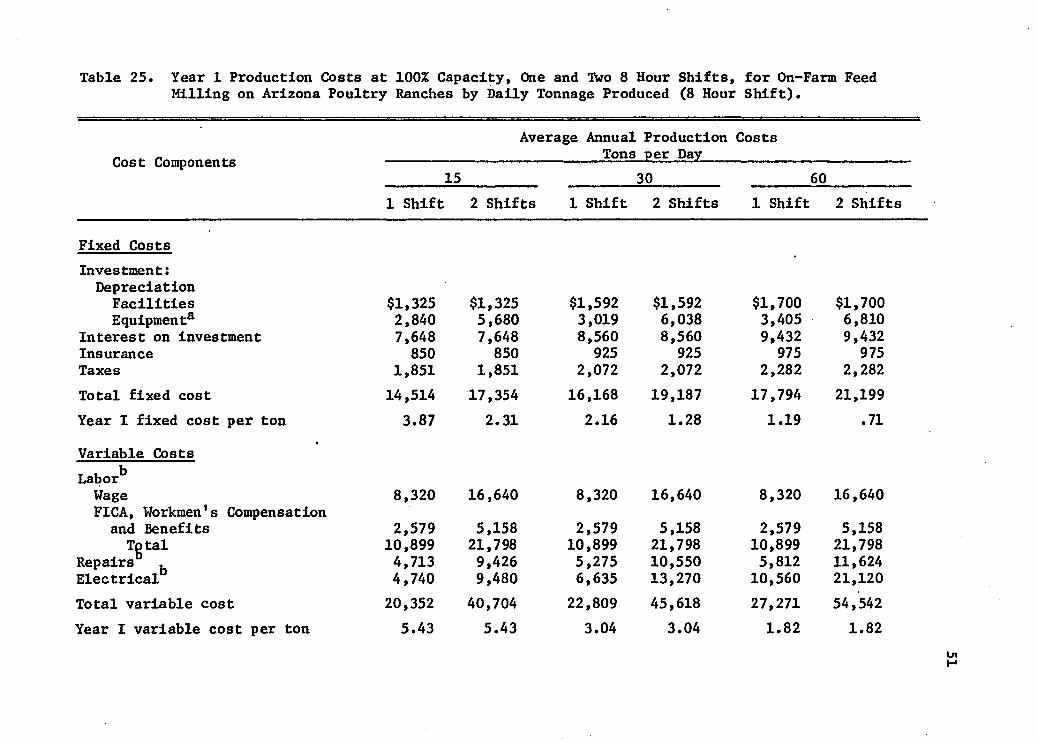
Table 25. Year 1 Production Costs at 100% Capacity, One and Two 8 Hour Shifts, for On-Farm Feed Milling on Arizona Poultry Ranches by Daily Tonnage Produced (8 Hour Shift).
Cost Components
Fixed CostsInvestment:Depreciation
FacilitiesEquipment3
Interest on investmentInsuranceTaxesTotal fixed costYear I fixed cost per ton
Variable CostsLabor*'WageFICA, Workmen's Compensation
and Benefits Total
Repairs" .ElectricalTotal variable costYear I variable cost per ton
Average Annual Production Costs___________________________Tons per Day________________________________ 15_________ ____________ 30________ _______ 60_________1 Shift 2 Shifts 1 Shift 2 Shifts 1 Shift 2 Shifts
$1,325 $1,325 $1,5922,840 5,680 3,0197,648 7,648 8,560850 850 925
1,851 1,851 2,07214,514 17,354 16,168
3.87 2.31 2.16
8,320 16,640 8,320
2,579 5,158 2,57910,899 21,798 10,8994,713 9,426 5,2754,740 9,480 6,63520,352 40,704 22,8095.43 5.43 3.04
$1,592 $1,700 $1,7006,038 3,405 6,8108,560 9,432 9,432
925 975 9752,072 2,282 2,282
19,187 17,794 21,1991.28 1.19 .71
16,640 8,320 16,640
5,158 2,579 5,15821,798 10,899 21,79810,550 5,812 11,62413,270 10,560 21,12045,618 27,271 54,542
3.04 1.82 1.82
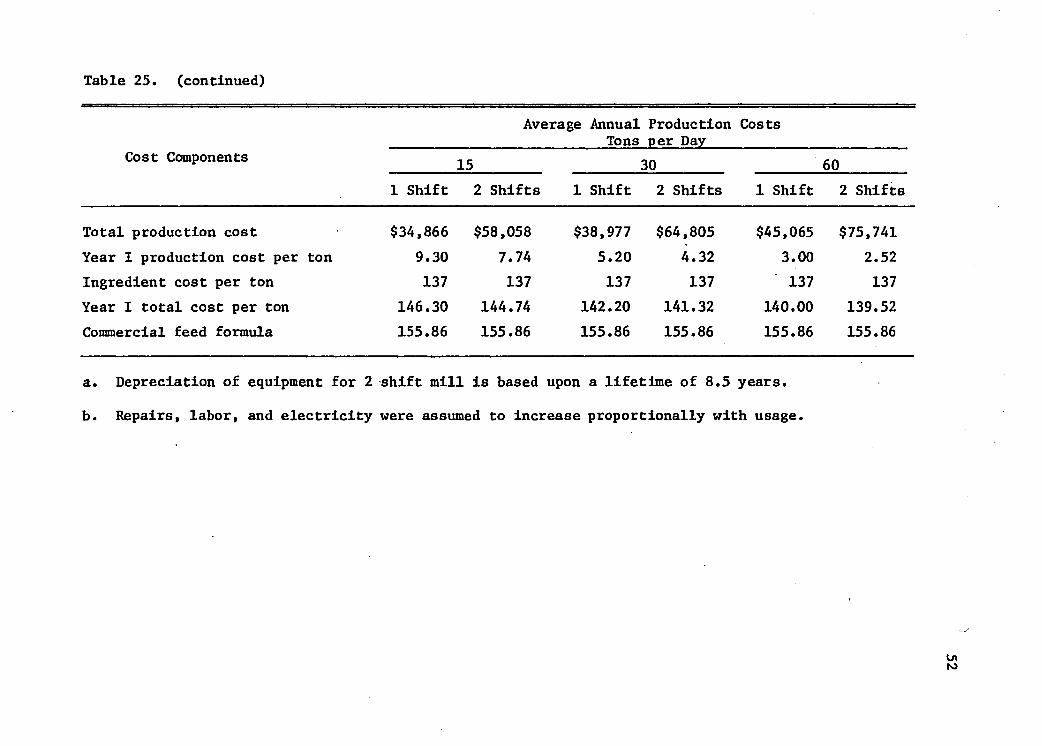
Table 25. (continued)
Cost Components
Average Annual Production Tons per Day
Costs
15 30 601 Shift 2 Shifts 1 Shift 2 Shifts 1 Shift 2 Shifts
Total production cost $34,866 $58,058 $38,977 $64,805 $45,065 $75,741Year I production cost per ton 9.30 7.74 5.20 4.32 3.00 2.52Ingredient cost per ton 137 137 137 137 137 137Year I total cost per ton 146.30 144.74 142.20 141.32 140.00 139.52Commercial feed formula 155.86 155.86 155.86 155.86 155.86 155.86
a. Depreciation of equipment for 2 shift mill Is based upon a lifetime of 8.5 years.
b. Repairs, labor, and electricity were assumed to increase proportionally with usage.
53
Table 26. Year 1 Percent Reduction in Feed Costs for On-Farm FeedMilling on Arizona Poultry Ranches Versus Required Percent Reductions to Eliminate California Production from the Arizona Egg Market by Daily Tonnage Produced.
ItemReduction in Feed Costs
_________ Tons per Day_________15 30 60• --------- -- percent---------
Percent reduction in Arizona feed costs required to eliminate California production from the Arizonamarket (Wilson 1975) 7.8% 7.8% 7.8%
Percent reduction in Arizona feed costs resulting from on- farm feed milling at 100% capacity 6.1% 8.8% 10.2%
CHAPTER IV
SUMMARY AND CONCLUSIONS
The purpose of this study was to determine the economic feasi
bility of on-farm feed milling for Arizona poultry ranchers. Specific
ally, costs were estimated for on-farm feed milling versus commercial
feed acquisition.
An economic-engineering approach was used to develop model de
signs and costs for on-farm feed mills at flock sizes of 75,000, 150,000
and 300,000 birds. As in any synthesis or budgeting approach, assump
tions were inherent in their representation. The results provided input
for poultry ranchers deciding among alternatives to reduce feed costs
which according to Wilson (1975) would improve their competitive posi
tion in the Arizona egg market. Furthermore, this study supplied a
method for ranchers to assess individual situations by substituting
their own mill requirements and related prices into the feasibility
framework.
Feasibility of on-farm feed milling existed in all model mills
since cost per ton was less than cost per ton of commercial feed. The
largest mill at 60 tons per 8 hour day yielded the lowest cost per ton,
and thereby the highest cost-savings when compared against commercial
feed.
Changes in relationships between fixed and variable costs per
ton through capacity utilization or substituting additional labor for
54
55plant investment did not affect on-farm feed milling feasibility. Cost-
savings were present for all mills as capacity utilization decreased to
40 percent. Additional labor requirements in the form of a second 8
hour work shift also provided cost-savings; yet these cost-savings were
less than cost-savings from larger capacity mills. Thus, it was apparent
that additional plant investment was the lower cost alternative as long
as the additional capacity can be utilized.
The magnitude of reductions in feed costs against commercial feed
provided Arizona egg producers with a better competitive position in the
Arizona egg market. On-farm feed milling, except for production at the
15 ton per day level, allowed Arizona egg producers to produce eggs at
feed costs less than California which would eliminate their competitive
disadvantage.
Finally, farmers should now consider other factors that are
necessary to the implementation of on-farm feed milling in Arizona.
Most important are (1) labor and management availability, (2) ingredient
availability, (3) capital or credit availability, (4) importance of
services provided by commercial processing plant such as storage, credit,
and nutritional advice, (5) feed quality, (6) profitability of an on-
farm feed milling versus other forms of investment, (7) risks of dis
continuing operations before equipment fully amortizes, equipment break
down, and less available time for managing flock, and (8) access to
markets.
Thus, the conclusions of this study are as follows:
1. On-farm feed milling is a feasible feed procurement alter
native based upon cost comparisons to commercial feed
56acquisition for Arizona poultry flock sizes of 75,000, 150,000,
and 300,000 birds.
2. Flock sizes may decrease to 40 percent of capacity without in
fluencing the feasibility of on-farm feed milling.
3. The choice of additional labor or plant investment to produce
twice the amount of feed of an 8 hour per day mill does not
influence the feasibility of on-farm feed milling at these
flock sizes. However, larger capacity mills have greater cost-
savings which makes them the lower cost alternative.
4. Economies of size were present for on-farm feed milling. No
diseconomies of size were found for the production levels
examined in this study.
5. On-farm feed milling, except at a flock size of 75,000 birds,
eliminated the competitive disadvantage of Arizona egg pro
ducers according to Wilson (1975) by reducing feed costs to
less than his estimate of feed costs in California.
APPENDIX A
PHYSICAL PLANT AND ESTIMATED COSTS FOR ON-FARM FEED MILLING ON ARIZONA POULTRY RANCHES
57
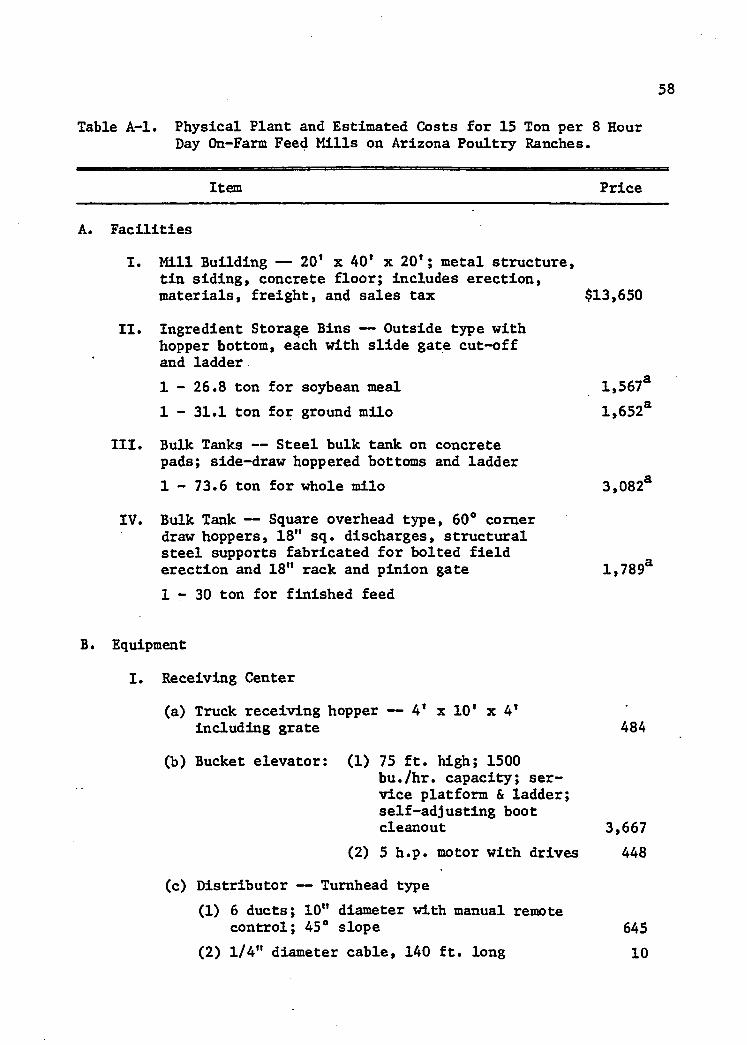
58
Table A-l. Physical Plant and Estimated Costs for 15 Ton per 8 HourDay On-Farm Feed Mills on Arizona Poultry Ranches.
Item Price
A. Facilities
I. Mill Building — 20* x 40* x 20'; metal structure, tin siding, concrete floor; includes erection, materials, freight, and sales tax $13,650
II. Ingredient Storage Bins — Outside type with hopper bottom, each with slide gate cut-off and ladder1 - 26.8 ton for soybean meal 1 - 31.1 ton for ground milo
III. Bulk Tanks — Steel bulk tank on concretepads; side-draw hoppered bottoms and ladder1 - 73.6 ton for whole milo 3,082*
IV. Bulk Tank — Square overhead type, 60° comer draw hoppers, 18" sq. discharges, structural steel supports fabricated for bolted field erection and 18" rack and pinion gate 1,789*1 - 3 0 ton for finished feed
B. Equipment
I. Receiving Center
(a) Truck receiving hopper — 4* x 10' x 4' including grate
(b) Bucket elevator: (1) 75 ft. high; 1500bu./hr. capacity; service platform & ladder; self-adjusting boot cleanout
(2) 5 h.p. motor with drives
(c) Distributor — Tumhead type(1) 6 ducts; 10" diameter with manual remote
control; 45° slope(2) 1/4" diameter cable, 140 ft. long
484
3,667448
64510
1,567*1,652*
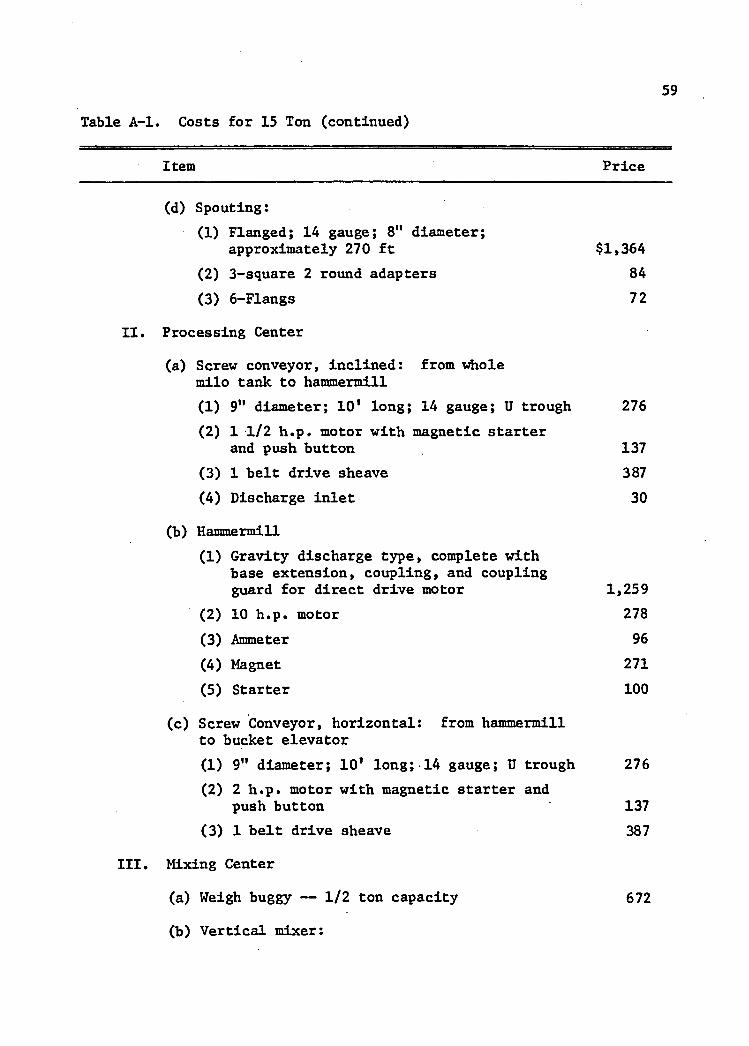
59Table A-l. Costs for 15 Ton (continued)
Item Price
(d) Spouting:(1) Flanged; 14 gauge; 8" diameter;
approximately 270 ft $1,364(2) 3-square 2 round adapters 84(3) 6-Flangs 72
II. Processing Center
(a) Screw conveyor, inclined: from wholemilo tank to hammermill(1) 9" diameter; 10* long; 14 gauge; U trough 276(2) 1 1/2 h.p. motor with magnetic starter
and push button 137(3) 1 belt drive sheave 387(4) Discharge inlet 30
(b) Hammermill(1) Gravity discharge type, complete with
base extension, coupling, and couplingguard for direct drive motor 1,259
(2) 10 h.p. motor 278(3) Ammeter 96(4) Magnet 271(5) Starter 100
(c) Screw Conveyor, horizontal: from hammermillto bucket elevator(1) 9" diameter; 10* long; 14 gauge; U trough 276(2) 2 h.p. motor with magnetic starter and
push button 137(3) 1 belt drive sheave 387
III. Mixing Center
(a) Weigh buggy — 1/2 ton capacity 672
(b) Vertical mixer:
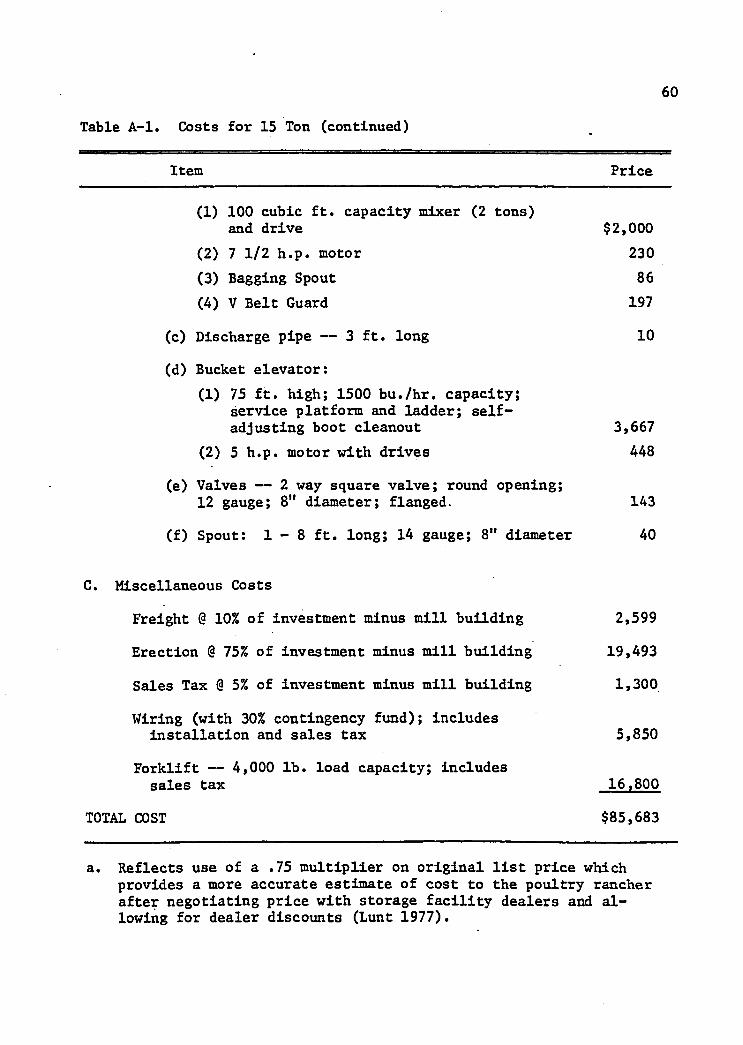
60
Item Price
(1) 100 cubic ft. capacity mixer (2 tons)and drive $2,000
(2) 71/2 h.p. motor 230(3) Bagging Spout 86(4) V Belt Guard 197
(c) Discharge pipe — 3 ft. long 10
(d) Bucket elevator:(1) 75 ft. high; 1500 bu./hr. capacity;
service platform and ladder; self-adjusting boot cleanout 3,667
(2) 5 h.p. motor with drives 448
(e) Valves — 2 way square valve; round opening;12 gauge; 8" diameter; flanged. 143
(f) Spout: 1 - 8 ft. long; 14 gauge; 8" diameter 40
C. Miscellaneous Costs
Freight @ 10% of investment minus mill building 2,599
Erection @ 75% of investment minus mill building 19,493
Sales Tax @ 5% of investment minus mill building 1,300
Wiring (with 30% contingency fund); includesinstallation and sales tax 5,850
Forklift — 4,000 lb. load capacity; includessales tax 16,800
TOTAL COST $85,683
Table A-l. Costs for 15 Ton (continued)
a. Reflects use of a .75 multiplier on original list price whichprovides a more accurate estimate of cost to the poultry rancherafter negotiating price with storage facility dealers and allowing for dealer discounts (hunt 1977).
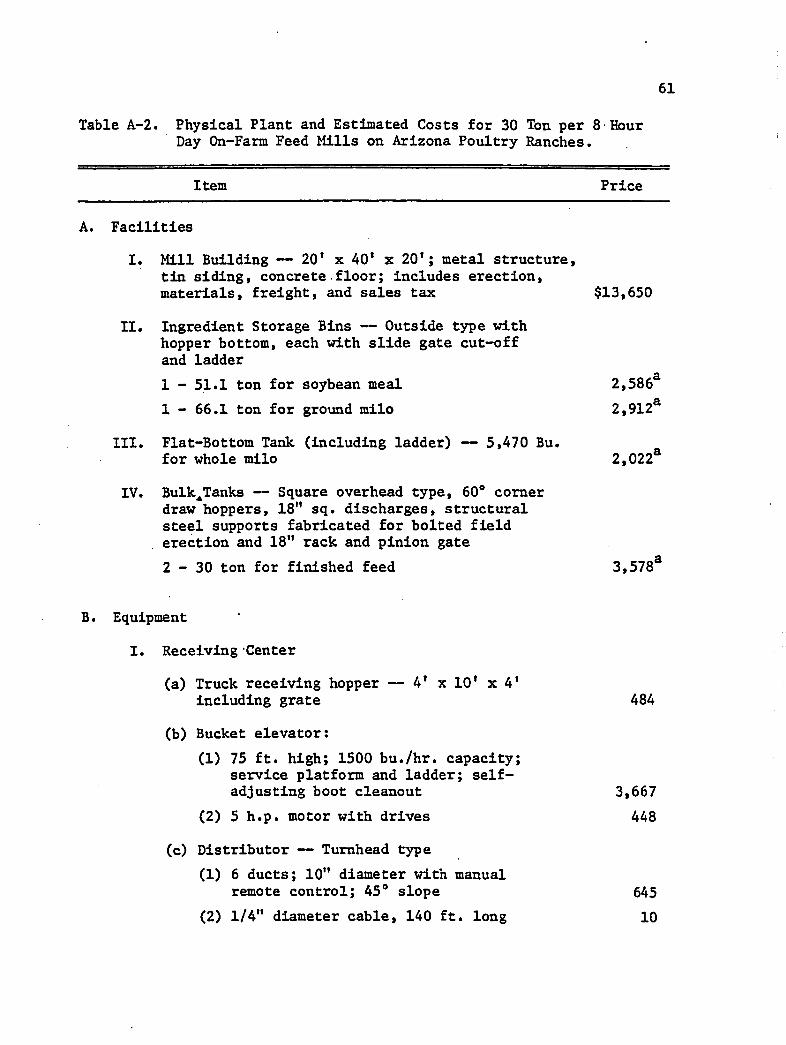
61
Table A-2. Physical Plant and Estimated Costs for 30 Ton per 8 HourDay On-Farm Feed Mills on Arizona Poultry Ranches.
Item Price
A. Facilities
I. Mill Building — 20* x 40* x 20'; metal structure, tin siding, concrete floor; includes erection, materials, freight, and sales tax $13,650
II. Ingredient Storage Bins — Outside type with hopper bottom, each with slide gate cut-off and ladder1 - 51.1 ton for soybean meal 2,586*1 - 66.1 ton for ground milo 2,912*
III. Flat-Bottom Tank (including ladder) — 5,470 Bu.for whole milo 2,022*
IV. Bulk^Tanks — Square overhead type, 60e corner draw hoppers, 18" sq. discharges, structural steel supports fabricated for bolted field erection and 18" rack and pinion gate2 - 3 0 ton for finished feed 3,578*
B. Equipment
I. Receiving Center
(a) Truck receiving hopper — 4* x 10* x 4*including grate 484
(b) Bucket elevator:(1) 75 ft. high; 1500 bu./hr. capacity;
service platform and ladder; self-adjusting boot cleanout 3,667
(2) 5 h.p. motor with drives 448
(c) Distributor — Tumhead type(1) 6 ducts; 10" diameter with manual
remote control; 45° slope 645(2) 1/4" diameter cable, 140 ft. long 10
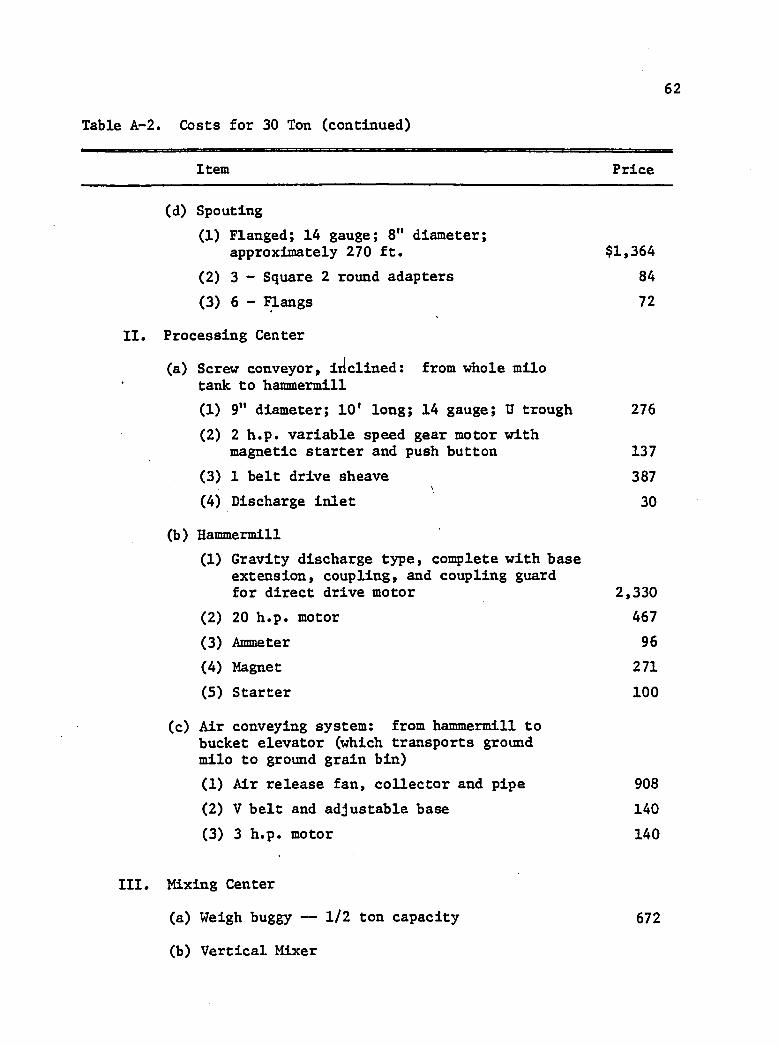
62
Table A-2. Costs for 30 Ton (continued)
Item Price
(d) Spouting(1) Flanged; 14 gauge; 8" diameter;
approximately 270 ft. $1,364(2) 3 - Square 2 round adapters 84(3) 6 - Flangs 72
II. Processing Center
(a) Screw conveyor, inclined: from whole milotank to hammeraill(1) 9" diameter; 10' long; 14 gauge; U trough 276(2) 2 h.p. variable speed gear motor with
magnetic starter and push button 137(3) 1 belt drive sheave 387(4) Discharge inlet 30
(b) Hammermill(1) Gravity discharge type, complete with base
extension, coupling, and coupling guardfor direct drive motor 2,330
(2) 20 h.p. motor 467(3) Ammeter 96(4) Magnet 271(5) Starter 100
(c) Air conveying system: from hammermill tobucket elevator (which transports ground milo to ground grain bin)(1) Air release fan, collector and pipe 908(2) V belt and adjustable base 140(3) 3 h.p. motor 140
III. Mixing Center
(a) Weigh buggy — 1/2 ton capacity 672
(b) Vertical Mixer
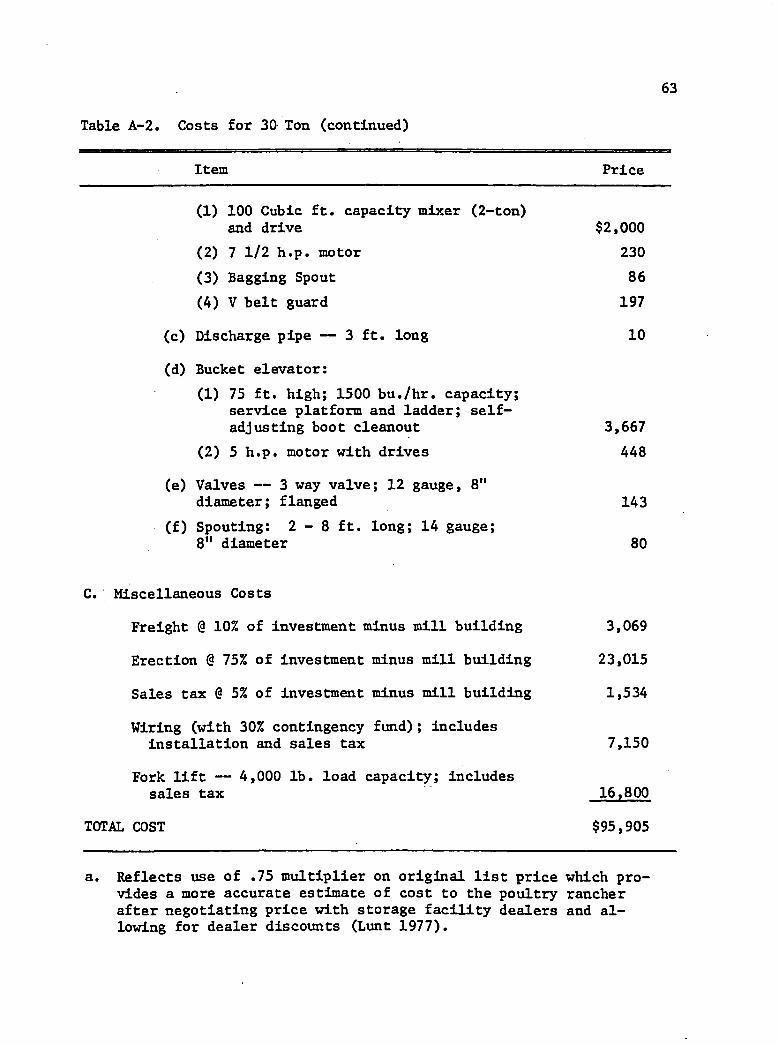
63
Table A-2. Costs for 30 Ton (continued)
Item Price
(1) 100 Cubic ft. capacity mixer (2-ton) and drive $2,000
(2) 7 1/2 h.p. motor 230(3) Bagging Spout 86(4) V belt guard 197
(c) Discharge pipe — 3 ft. long 10
(d) Bucket elevator:(1) 75 ft. high; 1500 bu./hr. capacity;
service platform and ladder; self- adjusting boot cleanout 3,667
(2) 5 h.p. motor with drives 448
(e) Valves — 3 way valve; 12 gauge, 8" diameter; flanged 143
(f) Spouting: 2 - 8 ft. long; 14 gauge;8" diameter 80
C. Miscellaneous Costs
Freight @ 10% of investment minus mill building 3,069
Erection @ 75% of investment minus mill building 23,015
Sales tax @ 5% of investment minus mill building 1,534
Wiring (with 30% contingency fund); includes installation and sales tax 7,150
Fork lift — 4,000 lb. load capacity; includes sales tax 16,800
TOTAL COST $95,905
a. Reflects use of .75 multiplier on original list price which provides a more accurate estimate of cost to the poultry rancherafter negotiating price with storage facility dealers and allowing for dealer discounts (hunt 1977).
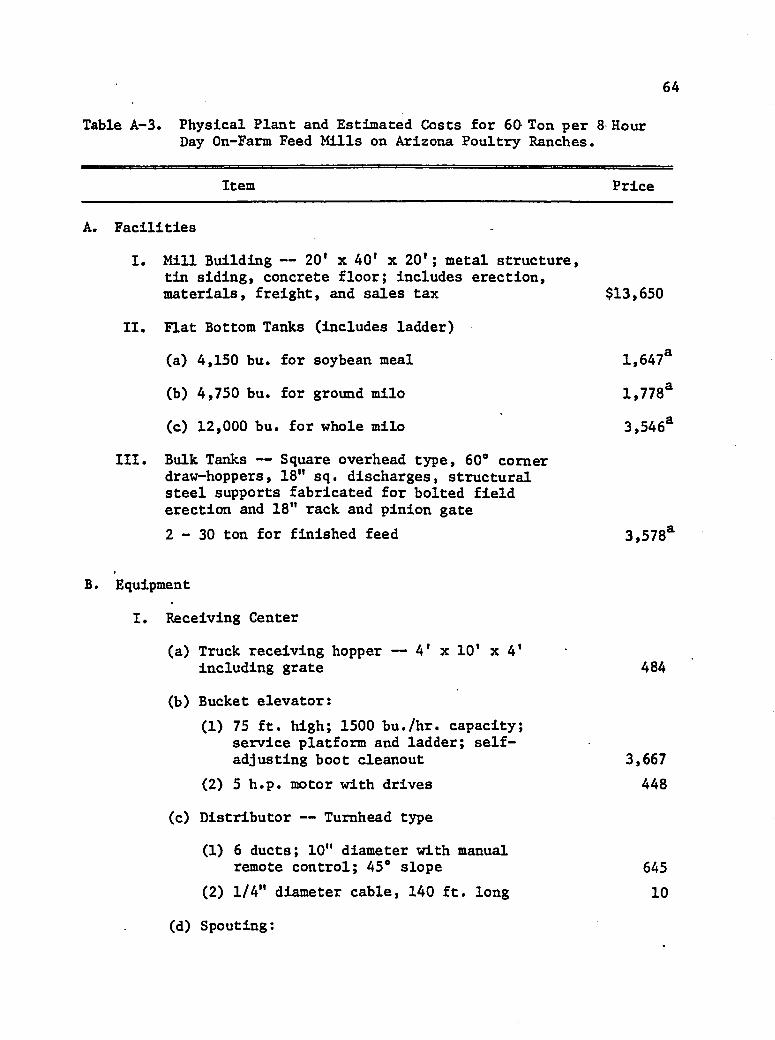
64
Table A-3. Physical Plant and Estimated Costs for 60 Ton per 8 HourDay On-Farm Feed Kills on Arizona Poultry Ranches.
Item Price
A. Facilities
I. Mill Building — 20* x 40' x 20'; metal structure, tin siding, concrete floor; includes erection, materials, freight, and sales tax $13,650
II. Flat Bottom Tanks (includes ladder)
(a) 4,150 bu. for soybean meal 1,647*
(b) 4,750 bu. for ground milo 1,778*
(c) 12,000 bu. for whole milo 3,546*
III. Bulk Tanks — Square overhead type, 60° comer draw-hoppers, 18" sq. discharges, structural steel supports fabricated for bolted field erection and 18" rack and pinion gate2 - 3 0 ton for finished feed 3,578*
Equipment
I. Receiving Center
(a) Truck receiving hopper — 4* x 10* x 4' including grate 484
(b) Bucket elevator:(1) 75 ft. high; 1500 bu./hr. capacity;
service platform and ladder; self- adjusting boot cleanout 3,667
(2) 5 h.p. motor with drives 448
(c) Distributor — Turnhead type
(1) 6 ducts; 10" diameter with manual remote control; 45° slope 645
(2) 1/4" diameter cable, 140 ft. long 10
(d) Spouting:
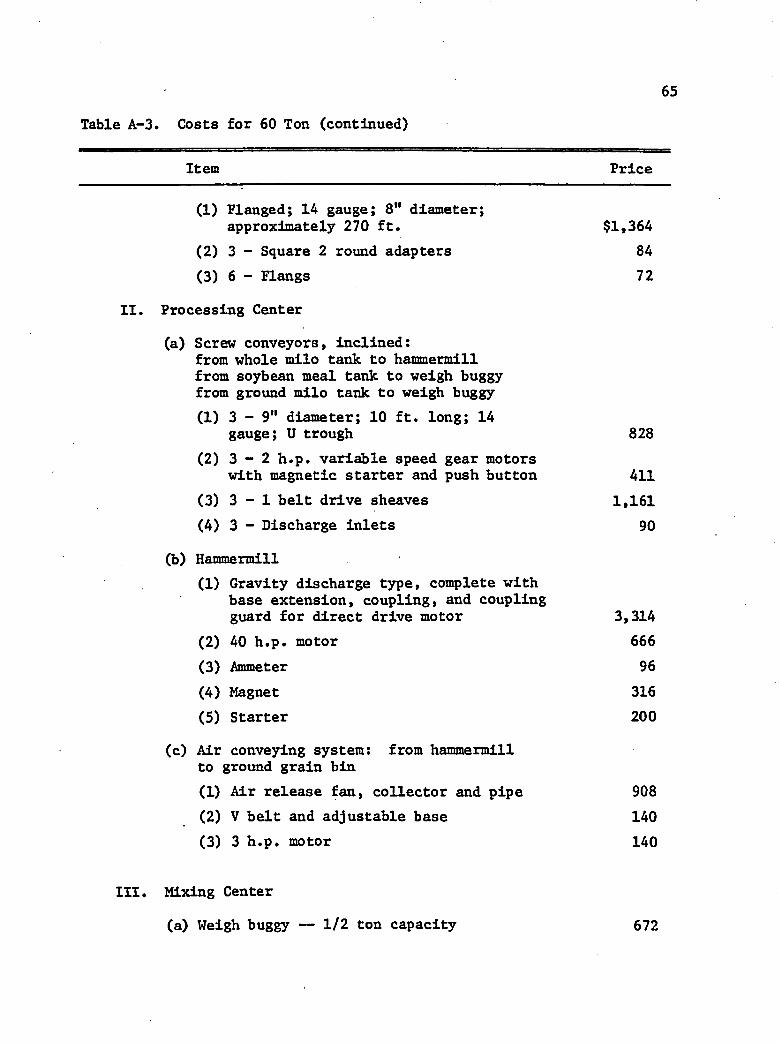
65
Table A-3. Costs for 60 Ton (continued)
Item Price
(1) Flanged; 14 gauge; 8" diameter; approximately 270 ft. $1,364
(2) 3 - Square 2 round adapters 84(3) 6 - Flangs 72
Processing Center
(a) Screw conveyors, inclined: from whole milo tank to hammermill from soybean meal tank to weigh buggy from ground milo tank to weigh buggy(1) 3 - 9" diameter; 10 ft. long; 14
gauge; U trough 828(2) 3 - 2 h.p. variable speed gear motors
with magnetic starter and push button 411(3) 3 - 1 belt drive sheaves 1,161(4) 3 - Discharge inlets 90
(b) Hammermill(1) Gravity discharge type, complete with
base extension, coupling, and coupling guard for direct drive motor 3,314
(2) 40 h.p. motor 666(3) Ammeter 96(4) Magnet 316(5) Starter 200
(c) Air conveying system: from hammermillto ground grain bin(1) Air release fan, collector and pipe 908(2) V belt and adjustable base 140(3) 3 h.p. motor 140
III. Mixing Center
(a) Weigh buggy — 1/2 ton capacity 672
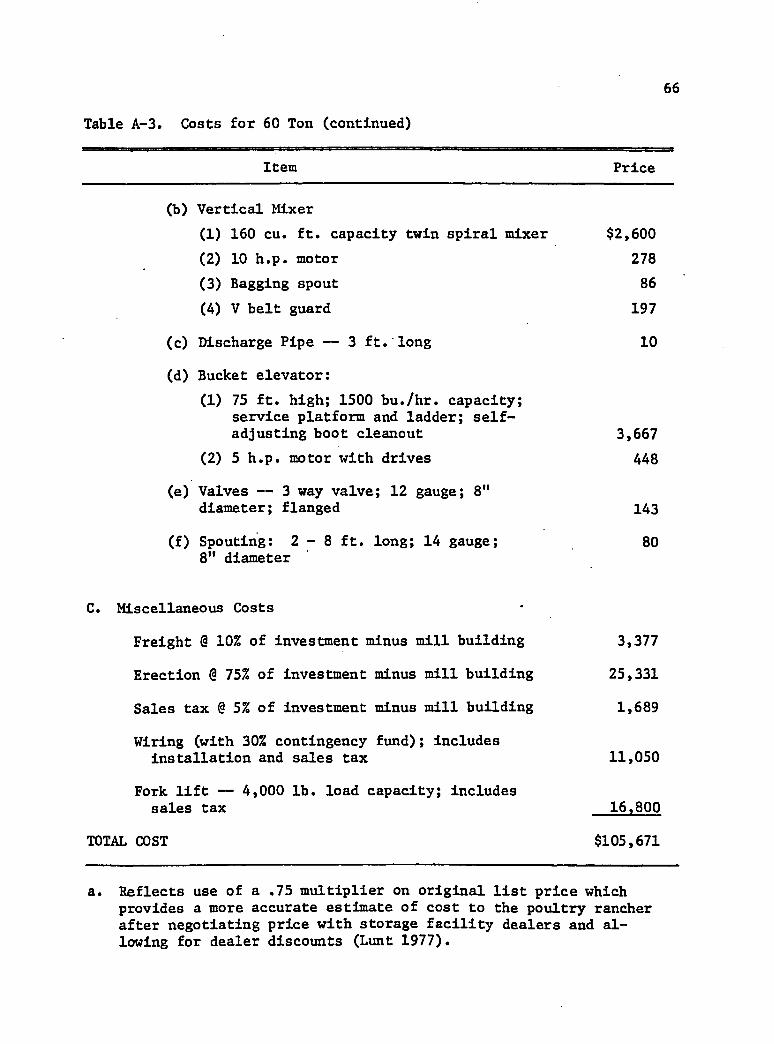
66
Table A-3. Costs for 60 Ton (continued)
Item Price
(b) Vertical Mixer(1) 160 cu. ft. capacity twin spiral mixer $2,600(2) 10 h.p. motor 278(3) Bagging spout 86(4) V belt guard 197
(c) Discharge Pipe — 3 ft. long 10
(d) Bucket elevator:(1) 75 ft. high; 1500 bu./hr. capacity;
service platform and ladder; self-adjusting boot cleanout 3,667
(2) 5 h.p. motor with drives 448
(e) Valves — 3 way valve; 12 gauge; 8"diameter; flanged 143
(f) Spouting: 2 - 8 ft. long; 14 gauge; 808" diameter
C. Miscellaneous Costs
Freight @ 10% of investment minus mill building 3,377
Erection @ 75% of investment minus mill building 25,331
Sales tax @ 5% of investment minus mill building 1,689
Wiring (with 30% contingency fund); includesinstallation and sales tax 11,050
Fork lift — 4,000 lb. load capacity; includessales tax 16,800
TOTAL COST $105,671
a. Reflects use of a .75 multiplier on original list price whichprovides a more accurate estimate of cost to the poultry rancherafter negotiating price with storage facility dealers and allowing for dealer discounts (Lunt 1977).
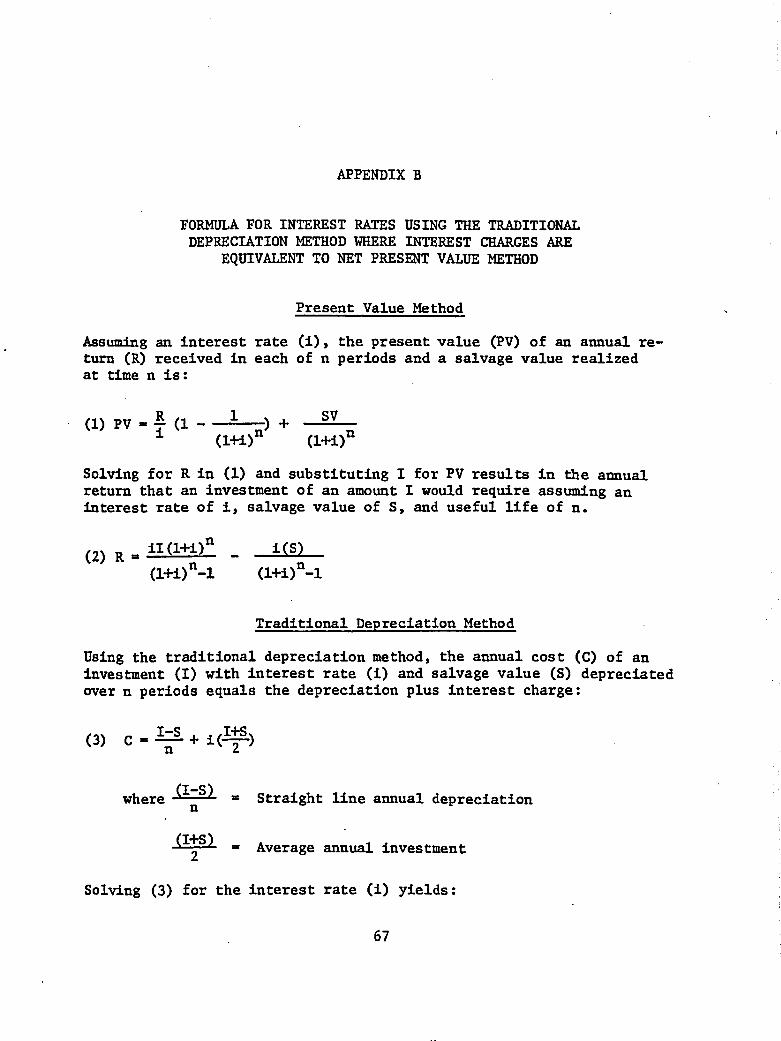
APPENDIX B
FORMULA FOR INTEREST RATES USING THE TRADITIONAL DEPRECIATION METHOD WHERE INTEREST CHARGES ARE
EQUIVALENT TO NET PRESENT VALUE METHOD
Present Value Method
Assuming an Interest rate (1), the present value (PV) of an annual return (R) received In each of n periods and a salvage value realized at time n Is:
(1) PV SV(l+i)n
Solving for R in (1) and substituting I for PV results in the annual return that an investment of an amount I would require assuming an interest rate of i, salvage value of S, and useful life of n.
(2) r - — tm—(l+i)n-l (l+i)“-l
Traditional Depreciation Method
Using the traditional depreciation method, the annual cost (C) of an investment (I) with interest rate (i) and salvage value (S) depreciated over n periods equals the depreciation plus interest charge:
(3) C i ( %n z
where (I-S) Straight line annual depreciation
Average annual investment
Solving (3) for the interest rate (i) yields:
(I+S)2
67
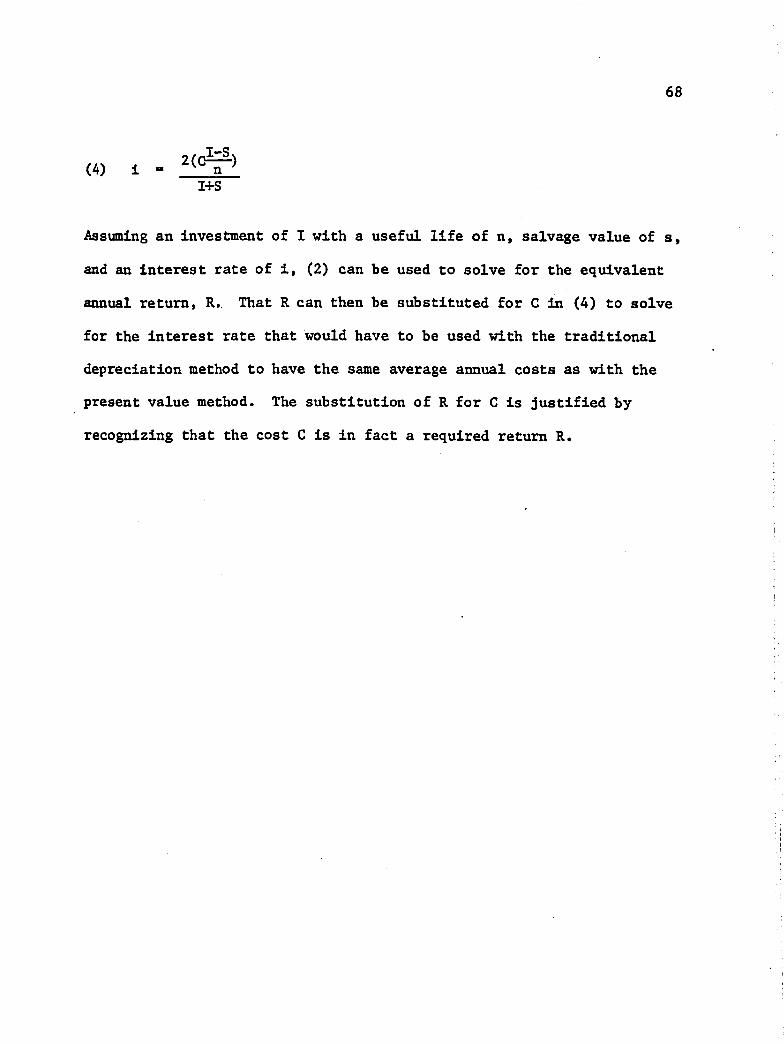
68
(4) iI+S
Assuming an Investment of I with a useful life of n, salvage value of s,
and an interest rate of 1, (2) can be used to solve for the equivalent
annual return, R. That R can then be substituted for C In (4) to solve
for the interest rate that would have to be used with the traditional
depreciation method to have the same average annual costs as with the
present value method. The substitution of R for C is justified by
recognizing that the cost C is in fact a required return R.
SELECTED BIBLIOGRAPHY
Allen, W. S., J. W. Sorenson and W. E. McCune, Farm Feed Processing — Equipment, Planning, Design, B-972, Texas A & M University, College Station: Agricultural Extension Service, July 1970.
Austin, Philip E. and David C. Nelson, An Economic Analysis of the Costs of Manufacturing Commercial Feed in North Dakota, Agricultural Economic Report No. 47, North Dakota State University, Fargo: Agricultural Experiment Station, June 1966.
Bloome, Peter, A1 Jensen, LeRoy Rottman, and Erland Rothenberger, "Swine Feeds: Storage and Handling of Ingredients and Systems forPreparation and Distribution," to be part of Pork Industry Handbook, Purdue University, Lafayette, fact sheet draft, 1976.
Bloome, Peter D. and Alan R. Tubbs, On-Farm Feed Processing: Systems,Economics, Financing, Circular E-816, Oklahoma State University, Stillwater: Agricultural Extension Service, September 1972.
Brown, Robert H., "North Carolina Poultry Processor Completes Circle of Integrated Operations with Feed Mill," Feedstuffs, Vol. 38, No. 10, March 12, 1966, pp. 54-56.
Burbee, Clark R., Edwin T. Bardwell and Alfred A. Brown, Economics of Broiler Feed Mixing and Distribution, Station Bulletin 484, University of New Hampshire, Durham: Agricultural ExperimentStation, September 1965.
Collier, Anthony, "Picking a System," Dairy Farmer, Vol. 19, No. 9, September 1972, p. 47 ff.
"Costs for Farm Mixing of Feed Outlined," Feedstuffs, Vol. 37, No. 48, December 11, 1965, p. 48.
Courtney, Richard H. and Jerome B. Siebert, An Economic Analysis of Oh- Ranch Dairy Feed Manufacturing in California, No. 70-1, University of California, Berkeley: Agricultural Extension Service,Agricultural Experiment Station, February 1970.
Dalton, Dave, Head of Farm and Ranch Division, Pima County Assessors Office, Tucson, Arizona, personal interview, April 1977.
Dalton, G. E. and J. B. Dent, "Economics of Home Milling and Mixing,"NAAS (National Agricultural Advisory Service) Quarterly Review, Vol. 85, Autumn 1969, pp. 26-30.
69
70
Dauzat, Ruben J. and Ewell P. Roy, The Economic Feasibility of On-Farm Feed Processing for Selected Livestock Enterprises in Louisiana, D. A. E. Research Paper #495, Louisiana State University, Baton Rouge: Agricultural Experiment Station, November 1975.
Degn, Arne, Glynn Phillips and Clive R. Harston, On-Farm Feed Processing in Montana, Bulletin 594, Montana State College, Bozman: Agricultural Experiment Station, April 1965.
Donald, James, On-the-Farm Feed Processing Systems, Circular 558, Clem- son University, Clemson, S. C.: Cooperative Extension Service,November 1975.
"Farm Feed Mixing Saves Money, But Takes Good Plan," Successful Farmer, Vol. 75, No. 2, February 1977, p. 52.
Feed Production Council, American Feed Manufacturers Association, Inc., Feed Manufacturing Technology, Chicago: American Feed Manufacturers Association, Inc., 1970.
Feed Production School, Inc., Feed Production Handbook, Kansas City:Feed Production School, Inc., 1961.
Gunning, Mel, Millwright, Mel Gunning Co., Phoenix, Arizona, personal interview, May 1977.
Hagen, Richard, "Growing Interest in . . . On-Farm Grinding and Mixing," Wallaces Farmer, Vol. 86, December 2, 1961, p. 12.
Hathorri, Scott, Agricultural Economist, Department of AgriculturalEconomics, The University of Arizona, Tucson, personal interview, May 1977.
"How Are the Small Grinder-Mixers Working in Iowa?," Wallaces Farmer, Vol. 87, August 4, 1962, pp. 52-53.
Hull, Dale 0., Planning On-the-Farm Feed Processing Systems, AE-989,Iowa State University, Ames: Cooperative Extension Service,December 1964.
Hull, Dale 0., "On-the-Farm Processing has Many Advantages," Hoard's Dairyman, Vol. 112, October 1967, p. 170.
Jordan, Herb, "Poultry Farms May Home-Mix Feeds," for Poultry Sales and Service, mimeograph, April 1, 1975.
Lunt, Walter, Feed Equipment Dealer, Walter R. Lunt Sales Company, Phoenix, Arizona, telephone interview, May 1977.
McFate, Kenneth L., Electric Feed Processing Guaranteed to Ease the Squeeze, New York: The Reuben H. Donnelley Corp., 1969.
71McGhee, Harold, Agent, Fireman Fund Insurance, Tucson, Arizona, telephone
Interview, April 1977.
National Council on Compensation Insurance, The Rating Manual of theNational Council on Compensation Insurance, New York, New York, August 1, 1976.
Nelson, A1 P., "On-Farm Mixing in the Midwest," Feedstuffs, Vol. 37,No. 42, January 23, 1965a, p. 42 ff.
Nelson, A1 P., "Some On-Farm Mixing Attitudes Change," Feedstuffs,Vol. 37, No. 34, November 27, 1965b, p. 34 ff..
Nelson, David C. and Phillip E. Austin, "Analysis of Feed Manufacturing Costs," Feedstuffs, Vol. 38, No. 35, September 3, 1966, pp. 56- 58.
Payne, J. I., "Would It Pay You to Mill and Mix," Dairy Farmer, Vol. 16, No. 12, December 1969, p. 3 8 . ff.
Poppy* Wendell, On-Farm Feed Mill Manager, Suncrest..Poultry Farm,Phoenix, Arizona, plant interview, March 1977.
"Pros and Cons of On-Farm Feed Mixing," Poultry Digest, Vol. 27,November 1968, p. 610.
Puckett, H. B., Automatic Feeding Equipment for Livestock and Poultry. Farmers’ Bulletin No. 2198, U. S. D. A., Washington, D. C.:March 1964.
Reid, Bobby, Professor of Poultry Sciences, The University of Arizona, Tucson, personal interview, September 1976.
Roy, Ewell P., Jim D. Goodwin and Charles Pope, Economic Feasibility of Establishing an Integrated Broiler Chicken Production Marketing Complex in Louisiana, D.A.E. Research Report No. 501, Louisiana State University, Baton Rouge: Agricultural Experiment Station, May 1976.
Roy, Ewell and Paul L. Wiggins, Resource Requirements for Feed Milling Facilities in Louisiana, D.A.E. Research Report No. 415,Louisiana State University, Baton Rouge: Agricultural Experiment Station, October 1970.
Sanderson, Bill, Feed Equipment Dealer, W. E. Sanderson and Assoc., Phoenix, Arizona, telephone interview, May 1977.
Schlechty, David L., Cost-Size Relationships for South Central ArizonaPoultry Ranches, M. S. Thesis, Agricultural Economics Department, The University of Arizona, Tucson, 1965.
72Selley, Roger, Agricultural Economist, The University of Arizona, Tucson,
personal interview, July 1977.
Smith, Bruce W., "On-Farm Processing of Feeds Debated," The Feed Bag,Vol. 36, October 1960, p. 12 ff..
"Study Examines Use of Small Grinder-Mixer for Poultry Feed," Feed- stuffs, Vol. 38, No. 2, Jan. 15, 1966, p. 70 ff.
Trotter, Clarence E. and Ronald C. Hoch, The Economic Feasibility of On-the-Farm Milling, Bulletin 745, The Pennsylvania State University, University Park: Agricultural Experiment Station,December 1967.
Vosloh, Carl S., Jr., Feed Manufacturing Costs and Capital Requirements. Agricultural Economic Report No. 335, U. S. D. A., Washington,D. C.: Economic Research Service, May 1976.
Wendling, Leo T., John A. True, Harold E. Stover and Floyd N. Reece,Planning Feed Handling Systems, C-322, Kansas State University, Manhattan: Agricultural Experiment Station, April 1966.
"Which Is Cheapest? Custom Feed Processing vs. Your Own Mill," Wallaces Farmer, Vol. 88, August 3, 1963, p. 40.
Wilson, Paul N.,"The Competitive Position of the Arizona Egg Industry," M. S. Thesis, Agricultural Economics Department, The University of Arizona, Tucson, 1975.
\ f '
'• Ti
*• am
m- rn *
2 0 10 8