Embed Size (px)
Citation preview

The Domestic Airline Industry
Eric HuangChase Funderburk
Vincent RussomagnoTerry Wu

Why the domestic airline industry?
• Personal enthusiasm
• Purchasing experience and familiarity
• Geographic and temporal pricing differences
• Variety of pricing possibilities

Industry Overview
• Life Cycle Stage: Decline• Revenue Volatility: High– Rising fuel prices

Background

Background
• Demand determinants: leisure travel, business travel, cargo transportation, sudden impacts

Background
• Capital intensity: high– Wages: 10.0% of
revenues (2013)

Background

Major Companies
• Delta Airlines
• United Continental Holdings
• AMR

Major Companies: Delta Airlines
• Market Share: 15.1%• Headquartered in Atlanta, Georgia
– 80,000 employees– 5,000 daily flights– Fleet size: 722 (mainline)– Destinations: 247 (mainline)
• Member of SkyTeam alliance
• Regional servicing: Delta Connection
• Volatile yearly revenue changes
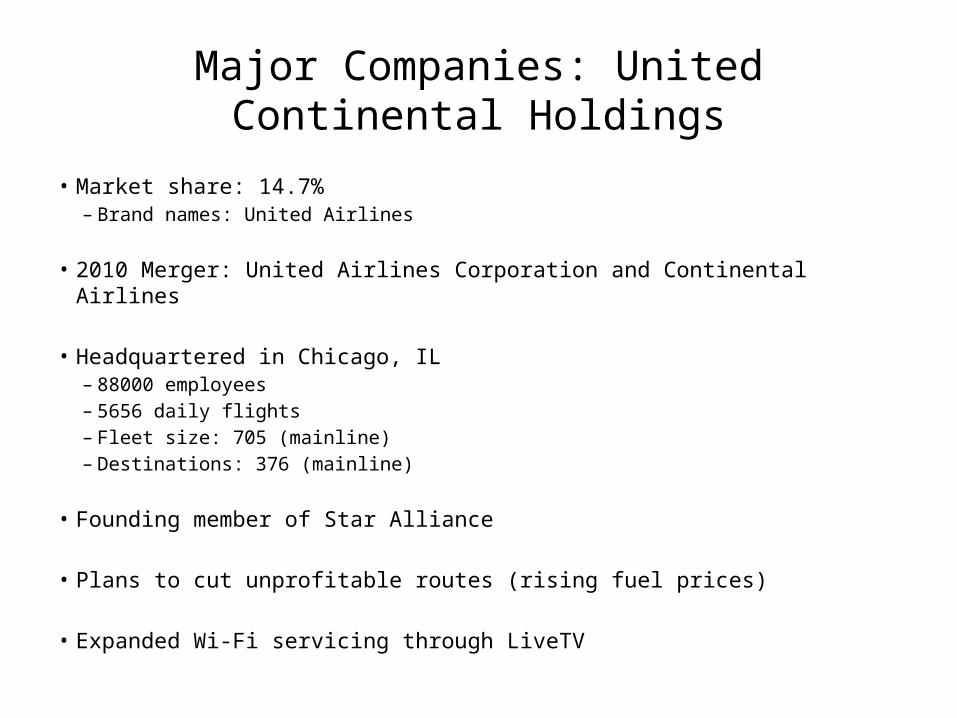
Major Companies: United Continental Holdings
• Market share: 14.7%– Brand names: United Airlines
• 2010 Merger: United Airlines Corporation and Continental Airlines
• Headquartered in Chicago, IL– 88000 employees– 5656 daily flights– Fleet size: 705 (mainline)– Destinations: 376 (mainline)
• Founding member of Star Alliance
• Plans to cut unprofitable routes (rising fuel prices)
• Expanded Wi-Fi servicing through LiveTV

Major Companies: AMR• Market Share: 9.0%
– American Airlines, American Airlines Cargo, American Eagle
• 2011: AMR filed for bankruptcy– 13,000 jobs elminated
• Headquartered in Fort Worth, TX– 80,100 employees– 3,400 daily flights– Fleet: 605 (451 on order)– Destinations: 250
• February 2013: AMR and US Airways Group merger– Largest airline– Close in Q3-2013 (72% AMR, 28% US Airways)– New name: American Airlines Group Inc
Competition
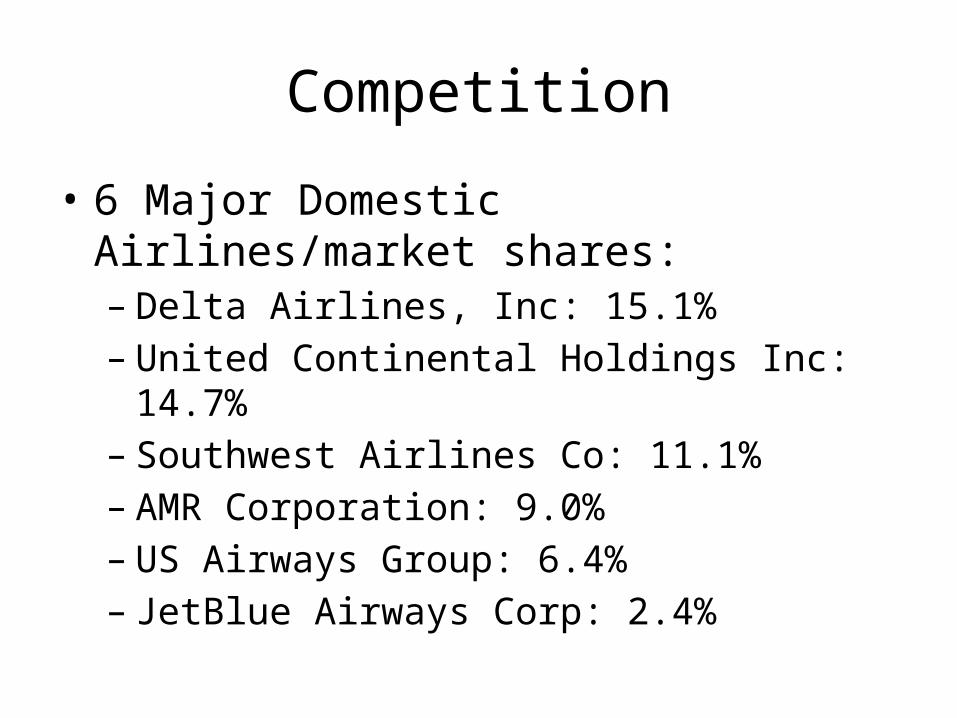
• 6 Major Domestic Airlines/market shares: – Delta Airlines, Inc: 15.1%– United Continental Holdings Inc: 14.7%– Southwest Airlines Co: 11.1%– AMR Corporation: 9.0%– US Airways Group: 6.4%– JetBlue Airways Corp: 2.4%
Market Concentration
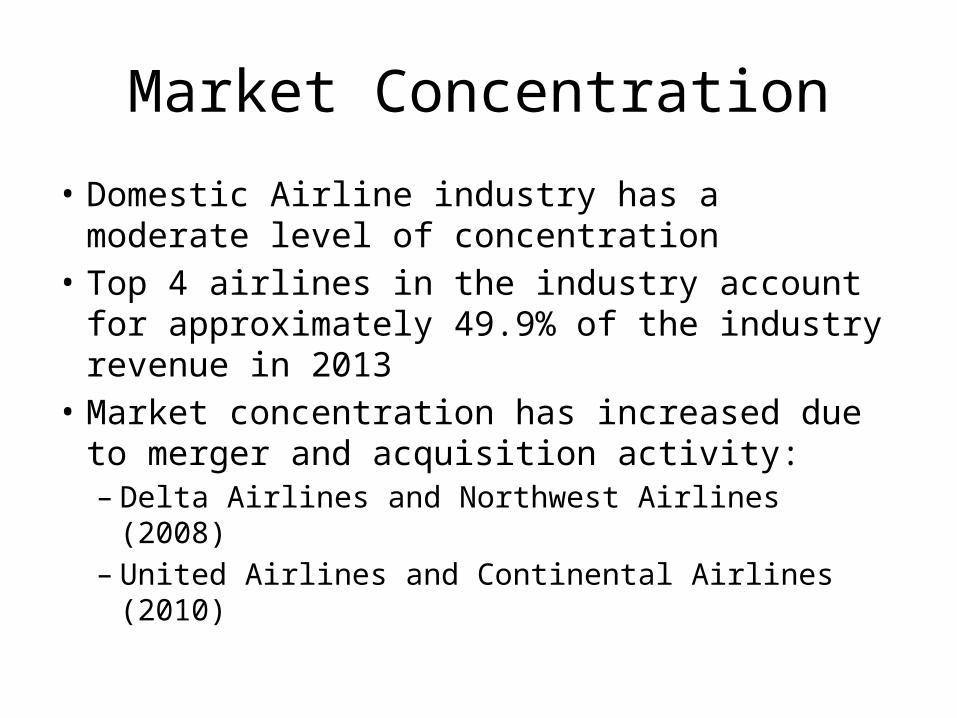
• Domestic Airline industry has a moderate level of concentration
• Top 4 airlines in the industry account for approximately 49.9% of the industry revenue in 2013
• Market concentration has increased due to merger and acquisition activity: – Delta Airlines and Northwest Airlines (2008)– United Airlines and Continental Airlines (2010)

Government Regulation
• October 24, 1978 – Airline Deregulation Act • Prior to 1978 government agency, the Civil Aeronautics Board (CAB)
determined the airline routes and the prices charged
• Post 1978 – Market-driven industry, customer demand determining price– Hub and Spoke system (legacy carriers): funnel passengers from
different locations into central hubs at major airports where passengers are sorted onto connecting flights to their final destination• E.g. American Airlines, United Airlines, Delta, United Continental
– Low-Cost Carriers (LCCs) – airlines formed post 1978 deregulation • Eliminate many traditional passenger services offered on legacy carriers • E.g. SouthWest

Government Regulation (cont.)
• Low entry barriers; high exit barriers– Post deregulation: many new start-ups• Good for consumers; bad for legacy carriers• Start-ups offer lower fares than legacy carriers to
compete resulting in decreased legacy carrier revenue• Results in many airline bankruptcies but credit card
companies and aircraft manufacturers would rather keep bankrupt airlines alive rather than have them liquidate– Survival of bankrupt airlines makes it difficult for other airline
to raise fares to profitable levels

Government Regulation (cont)
• Maintenance Programs– Federal Aviation Regulations (FAR) Part 121
• Industrial Regulations– Standard industrial regulations– Occupational Health and Safety Administration
(OSHA)• Environmental Regulations– 1990 Clean Air Act: National Emission Standards
for Hazardous Air Pollutants (NESHAP)

Industry Organization
• Aviation Suppliers Association (ASA)– Represents more than 490 global member
companies that lead logistics programs, purchasing efforts and distribution of aircraft parts worldwide
– Focus on safety, international compliance and ethical business practices that impact the aviation parts supply industry

Industry Organization (cont)
• Horizontal Integration:– Civil aircraft manufacturing: Boeing (60% of
market), Airbus (30% of market)– Aircraft assembly and aircraft engine components:
Rolls Royce plc, General Electric (GE) – Equipment and parts: Thales, Teledyne, Gables
Engineering, Timken– Aircraft interior refurbishment and completion
companies

Industry Organization (cont)
• Numerous factors affect the aircraft manufacturing industry: – Industry must develop more efficient and
environmentally friendly aircraft parts to comply with environmental standards aimed at reducing negative aircraft externalities such as aircraft noise and engine combustion emissions

Introduction
• Overview of stats on IBIS
• Trends and future

Pricing Strategies – Pre Booking
• Pre Booking:– Short: 1 week– Medium: 1 month– Long: 3 months

Pricing Strategies – Trips
• Business Trips:– Departure: Monday– Arrival: Thursday
• Leisure Trips:– Departure: Friday– Arrival: Sunday
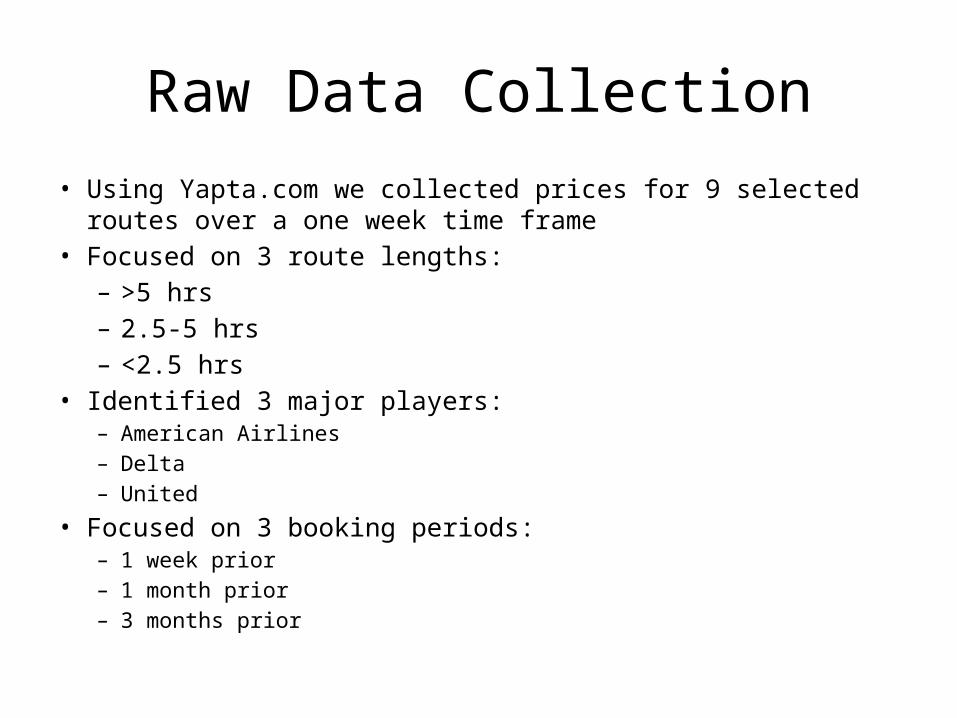
Raw Data Collection• Using Yapta.com we collected prices for 9 selected routes over a one week
time frame• Focused on 3 route lengths:
– >5 hrs– 2.5-5 hrs– <2.5 hrs
• Identified 3 major players:– American Airlines– Delta– United
• Focused on 3 booking periods:– 1 week prior– 1 month prior– 3 months prior

Raw Data Sample

Business Trips – 1 Week Booking

Mon. Tues. Wed. Thurs. Fri. Sat. Sun.0
200
400
600
800
1000
1200
JFK-LAX (>5)
DeltaUnitedAmerican
Mon. Tues. Wed. Thurs. Fri. Sat. Sun.0
100
200
300
400
500
600
700
800
LAX - SEA (2.5-5)
DeltaUnitedAmerican
Mon. Tues. Wed. Thurs. Fri. Sat. Sun.0
200
400
600
800
1000
1200
ATL - IAH (<2.5)
DeltaUnitedAmerican
• The mid length flight was the cheapest
• Closer to departure, the >5 hr flight was clearly the most expensive
• Prices were stable for the <2.5 hr flight and increasing steadily for the other two

Business Trips – 1 Month Booking

Mon. Tues. Wed. Thurs. Fri. Sat. Sun.0
50100150200250300350400450500
LAX - SEA (2.5-5)
DeltaUnitedAmerican
Mon. Tues. Wed. Thurs. Fri. Sat. Sun.0
50
100
150
200
250
300
350
400
450
ATL - IAH (<2.5)
DeltaUnitedAmerican
Mon. Tues. Wed. Thurs. Fri. Sat. Sun.0
100
200
300
400
500
600
700
JFK - LAX (>5)
DeltaUnitedAmerican
• The longest flight (>5 hrs) was the most expensive throughout
• The shortest flight was slightly cheaper than the mid length flight
• Prices were most volatile in the <2.5 hr flight

Business Trips – 3 Month Booking
Mon. Tues. Wed. Thurs. Fri. Sat. Sun.380
400
420
440
460
480
500
520
JFK - LAX (>5)
DeltaUnitedAmerican
Mon. Tues. Wed. Thurs. Fri. Sat. Sun.0
50
100
150
200
250
300
350
400
LAX - SEA (2.5-5)
DeltaUnitedAmerican
Mon. Tues. Wed. Thurs. Fri. Sat. Sun.340
345
350
355
360
365
370
375
ATL - IAH (<2.5)
DeltaUnitedAmerican
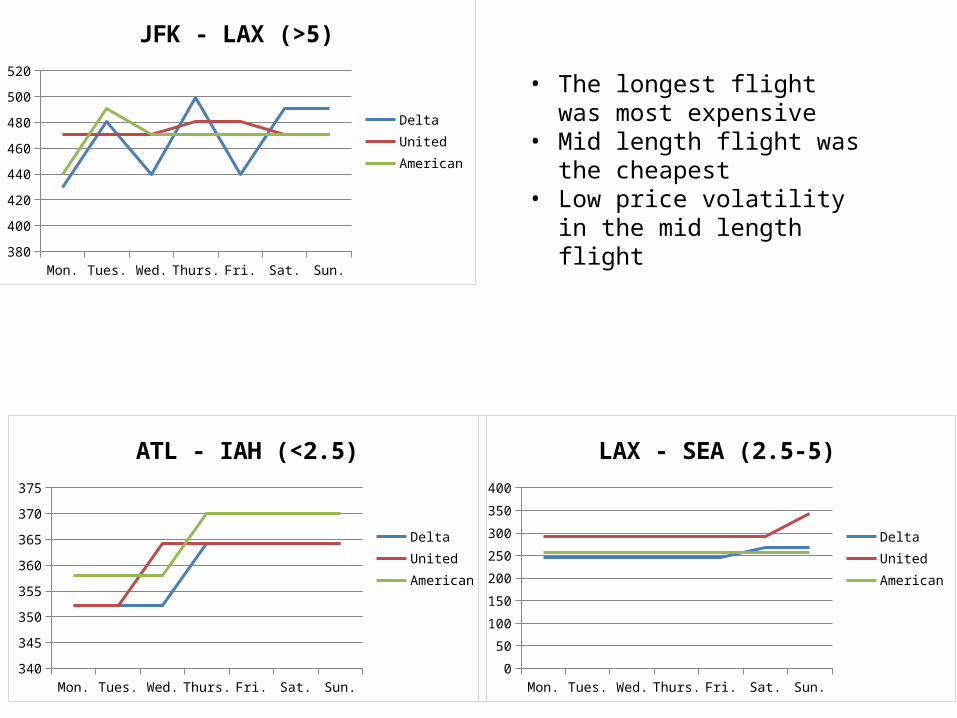
• The longest flight was most expensive
• Mid length flight was the cheapest
• Low price volatility in the mid length flight

Business Trip Analysis
• When waiting till the last minute to book a flight the distance has little impact
• On the 1 month and 3 month pre-booking times, the distance has a more significant impact on pricing
• Extemporaneous supply and demand factors in regional markets cause additional price fluctuation
Leisure Trips – 1 Week BookingLeisure vs Business Analysis looking at 1 Week Booking

Mon. Tues. Wed. Thurs. Fri. Sat. Sun.0
200
400
600
800
1000
1200
JFK - LAX (Leisure)
DeltaUnitedAmerican
Mon. Tues. Wed. Thurs. Fri. Sat. Sun.0
200
400
600
800
1000
1200
JFK-LAX (Business)
DeltaUnitedAmerican
Leisure vs BusinessJFK - LAX
• These flights are similarly priced over time
• There is a greater relative spike in business than leisure in the few days before departure

Mon. Tues. Wed. Thurs. Fri. Sat. Sun.0
200
400
600
800
1000
1200
1400
LAX - SEA (Leisure)
DeltaUnitedAmerican
Mon. Tues. Wed. Thurs. Fri. Sat. Sun.0
100
200
300
400
500
600
700
800
LAX - SEA (Business)
DeltaUnitedAmerican
Leisure vs BusinessLAX - SEA
• There is a premium charged to business passengers
• The extreme leisure rate hike seen by American is an outlier
• Could be a result of too much pre-booking

Mon. Tues. Wed. Thurs. Fri. Sat. Sun.0
100
200
300
400
500
600
700
800
ATL - IAH (Leisure)
DeltaUnitedAmerican
Mon. Tues. Wed. Thurs. Fri. Sat. Sun.0
200
400
600
800
1000
1200
ATL - IAH (Business)
DeltaUnitedAmerican
Leisure vs BusinessATL - IAH
• There is a premium charged to business passengers
• Delta attempts to take advantage of extreme last minute bookings with steep rate hikes

Leisure vs Business Analysis
• Airline appear to be effectively price discriminating against business customers– Charge them a premium for late booking
tendencies• Example of 3rd degree price discrimination

Leisure Trips – 1 Week Booking
Mon. Tues. Wed. Thurs. Fri. Sat. Sun.0
200
400
600
800
1000
1200
1400
LAX - SEA (2.5-5)
DeltaUnitedAmerican
Mon. Tues. Wed. Thurs. Fri. Sat. Sun.0
100
200
300
400
500
600
700
800
ATL - IAH (<2.5)
DeltaUnitedAmerican
Mon. Tues. Wed. Thurs. Fri. Sat. Sun.0
200
400
600
800
1000
1200
JFK - LAX (>5)
DeltaUnitedAmerican
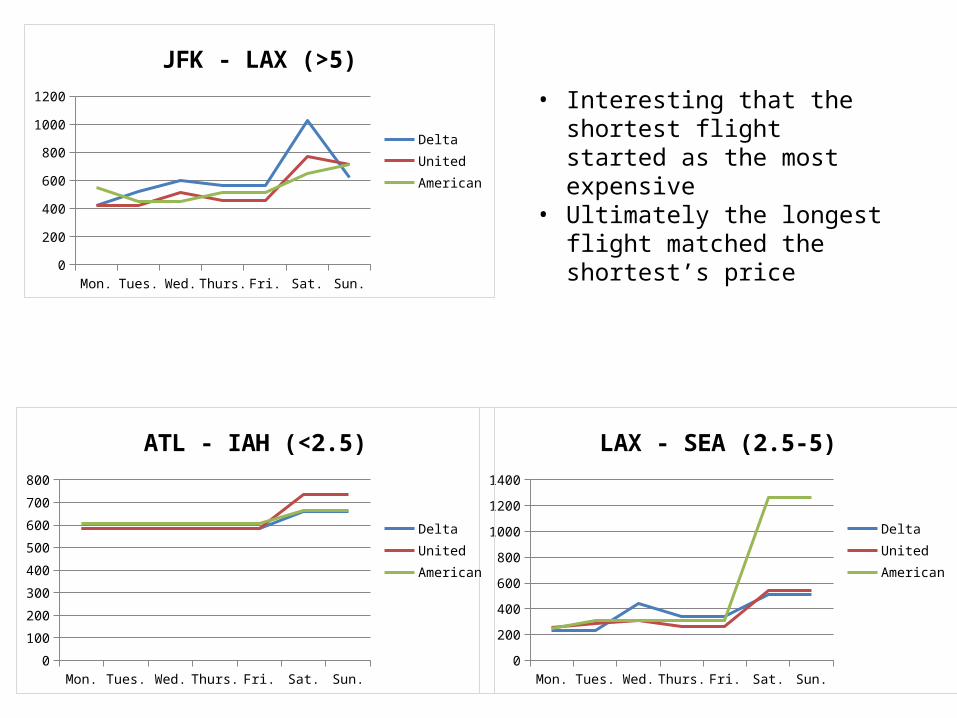
• Interesting that the shortest flight started as the most expensive
• Ultimately the longest flight matched the shortest’s price

Leisure Trips – 1 Month Booking
Mon. Tues. Wed. Thurs. Fri. Sat. Sun.0
100
200
300
400
500
600
JFK - LAX (>5)
DeltaUnitedAmerican
Mon. Tues. Wed. Thurs. Fri. Sat. Sun.0
50
100
150
200
250
300
350
400
LAX - SEA (2.5-5)
DeltaUnitedAmerican
Mon. Tues. Wed. Thurs. Fri. Sat. Sun.0
50
100
150
200
250
300
350
400
ATL - IAH (<2.5)
DeltaUnitedAmerican
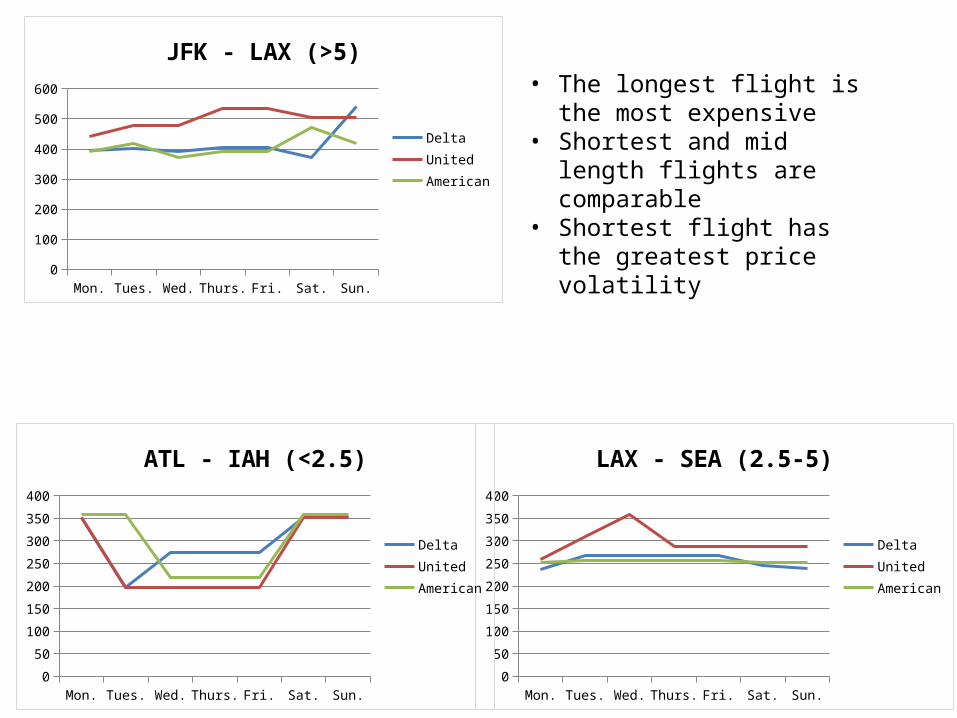
• The longest flight is the most expensive
• Shortest and mid length flights are comparable
• Shortest flight has the greatest price volatility

Leisure Trips – 3 Month Booking

Mon. Tues. Wed. Thurs. Fri. Sat. Sun.0
100
200
300
400
500
600
700
800
JFK - LAX (>5)
Delta
United
American
Mon. Tues. Wed. Thurs. Fri. Sat. Sun.0
50100150200250300350400450500
LAX - SEA (2.5-5)
DeltaUnitedAmerican
Mon. Tues. Wed. Thurs. Fri. Sat. Sun.340
345
350
355
360
365
370
375
ATL - IAH (<2.5)
Delta
United
American
• The longest is the most expensive
• Delta is pricing higher than the competition for the mid length flight• They may have less
regional capabilities

Leisure Trip Analysis
• Similar findings to Business Trips• Again we saw when waiting till the last minute
to book a flight the distance has little impact• On the 1 month and 3 month pre-booking
times, the distance has a more significant impact on pricing
• Outside factors like regional supply and demand are difficult to nail down
Leisure Trips – 3 Month BookingPre-Booking Analysis

Average Observed Prices by Weekdays
Monday Tuesday Wednesday Thursday Friday Saturday Sunday330
340
350
360
370
380
390
400
BusinessLeisureCombined
• Book on Monday or Wednesday to save the most money on flights
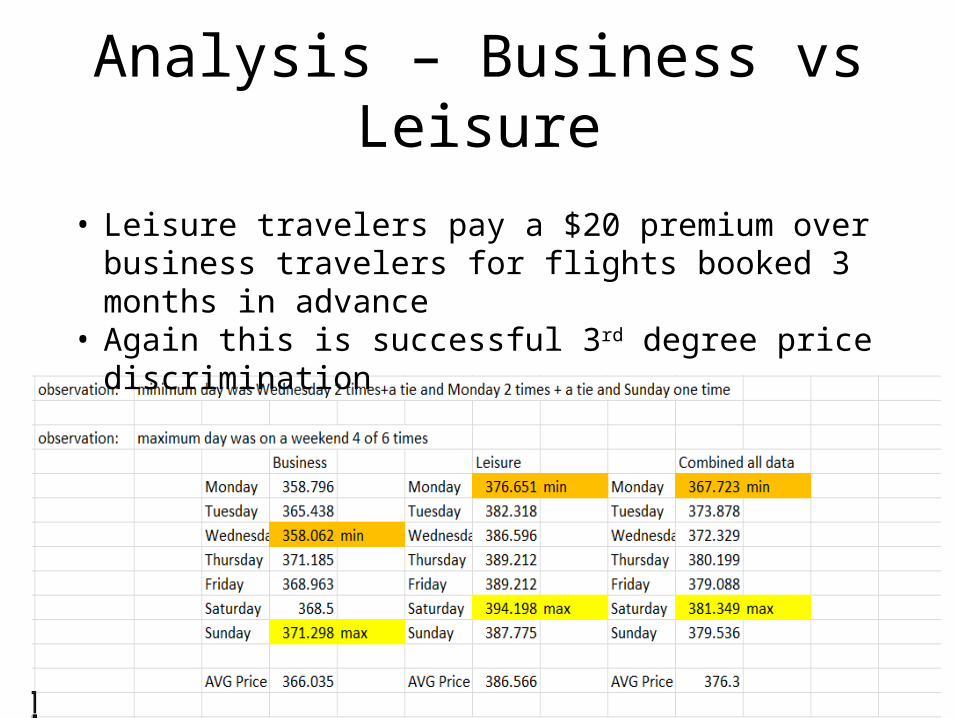
Analysis – Business vs Leisure
• Leisure travelers pay a $20 premium over business travelers for flights booked 3 months in advance
• Again this is successful 3rd degree price discrimination

Analysis and Recommendation
• Industry is heavily reliant on:– Fuel Prices– Seasonality of Travel– Government Regulation• Security• Funding

Financial Analysis• Industry P/E ratio is 10.4X on average
– This is extremely low compared to an S&P 500 average of 14.3X• LTG forecasts are surprisingly high at an average of 28.8%
– This is likely explained by the airline industry weathering a few very tough years of high fuel costs and consumer uncertainty
– When the economy improves people travel more• American Airlines has undergone significant restructuring through a Chapter 11
bankruptcy filing• Other major players have cut costs and are now lean and ready to grow so long as
government regulation does not interfere

Crude Oil Futures
• Fuel prices are volatile and directly effect the costs of flying• Airlines hedge their exposure to fuel prices but this is more of an art
than a science– Low fuel prices will typically result in better industry performance
• With the emergence of alternative energy sources the airline industry may face less competition for fuel

Final Recommendation
• The airline industry trades at a relative value to the market
• There are many risks involved but if you believe in management then “stock-picking” may be a successful strategy within the industry
• Suggest avoiding this sector as a long term play