Embed Size (px)
Citation preview

THE CONNECTICUT ECONOMIC DIGEST 1April 2017
APRIL 2017
Economic Indicators on the Overall Economy ......................... 5 Individual Data Items ......................... 6-8Comparative Regional Data .............. 9Economic Indicator Trends ........ 10-11Help Wanted OnLine ........................ 15Business and Employment ChangesAnnounced in the News Media ...... 19Labor Market Areas: Nonfarm Employment .................... 12-17 Sea. Adj. Nonfarm Employment ..........14 Labor Force ............................................ 18 Hours and Earnings .............................. 19Cities and Towns: Labor Force ..................................... 20-21 Housing Permits .................................... 22Technical Notes ............................... 23At a Glance ....................................... 24
Connecticut Exports:2016 in Review............. 1-3
A New Look at EarningsInequality ..................... 4-5
IN THIS ISSUE...
In February...Nonfarm Employment Connecticut..................... 1,682,400 Change over month ............ -0.10% Change over year ................ +0.1%
United States .............. 145,798,000 Change over month ........... +0.16% Change over year ................. +1.6%
Unemployment Rate Connecticut............................. 4.7% United States .......................... 4.7%
Consumer Price Index United States ...................... 243.603 Change over year .................. +2.7%
G
Connecticut Exports: 2016in ReviewBy Laura Jaworski, Office of International and Domestic Business
Development, DECD
ECONOMIC DIGESTTHE CONNECTICUT
Vol.22 No.4 A joint publication of the Connecticut Department of Labor & the Connecticut Department of Economic and Community Development
Chart 1: Connecticut’s Exports, 1997-2016 ($ in billions)
eopolitical issues seemedto dominate 2016, whether
it was the U.S. elections, Brexit,the Eurozone, free tradeagreements, economicintegration or nationalsovereignty. How these globalissues impact trade, currency,and political relationshipsremains to be seen. In themeantime, to assessConnecticut’s export status, areview of several key categoriesfollows.
Annual Export Figures
In 2016, Connecticut’scommodity exports totaled $14.4
billion, a 5.49% decrease from the$15.24 billion registered in 2015.1
It is important to note, assignificant as commodity exportsare, they omit service exports, forwhich the collection of data isinexact and unavailable at thestate level. All U.S. states facethis data gap. This means thatexport figures for a state likeConnecticut- with a largeconcentration of insurance,financial and other services-understate the true magnitude ofits overall export value.
Data indicates that 5,717companies exported fromConnecticut in 2014. Eighty-nine
0
2
4
6
8
10
12
14
16
18
1997
1998
1999
2000
2001
2002
2003
2004
2005
2006
2007
2008
2009
2010
2011
2012
2013
2014
2015
2016

THE CONNECTICUT ECONOMIC DIGEST2 April 2017
ConnecticutDepartment of Labor
Connecticut Departmentof Economic andCommunity Development
THE CONNECTICUT
The Connecticut Economic Digest ispublished monthly by the ConnecticutDepartment of Labor, Office of Research, andthe Connecticut Department of Economic andCommunity Development. Its purpose is toregularly provide users with a comprehensivesource for the most current, up-to-date dataavailable on the workforce and economy of thestate, within perspectives of the region andnation.
The annual subscription is $50. Sendsubscription requests to: The ConnecticutEconomic Digest, Connecticut Department ofLabor, Office of Research, 200 Folly BrookBoulevard, Wethersfield, CT 06109-1114.Make checks payable to the ConnecticutDepartment of Labor. Back issues are $4 percopy. The Digest can be accessed free ofcharge from the DOL Web site. Articles fromThe Connecticut Economic Digest may bereprinted if the source is credited. Please sendcopies of the reprinted material to the ManagingEditor. The views expressed by the authors aretheirs alone and may not reflect those of theDOL or DECD.
Managing Editor: Jungmin Charles Joo
Associate Editor: Erin C. Wilkins
We would like to acknowledge the contributionsof many DOL Research and DECD staff andRob Damroth to the publication of the Digest.
Catherine Smith, CommissionerTim Sullivan, Deputy CommissionerBart Kollen, Deputy Commissioner
505 Hudson StreetHartford, CT 06106-2502Phone: (860) 270-8000Fax: (860) 270-8200E-Mail: [email protected]: http://www.decd.org
Scott D. Jackson, CommissionerKurt Westby, Deputy Commissioner
Andrew Condon, Ph.D., DirectorOffice of Research200 Folly Brook BoulevardWethersfield, CT 06109-1114Phone: (860) 263-6275Fax: (860) 263-6263E-Mail: [email protected]: http://www.ctdol.state.ct.us/lmi
ECONOMIC DIGESTpercent of these companies weresmall and medium-sizedenterprises with fewer than 500employees, and account for 23%of Connecticut commodityexports.2
Connecticut’s ranking among thestates held steady at 27th in2016.3 Texas, California,Washington, New York andIllinois were the top five exportstates in 2016, ranked in terms ofexport commodity dollars. All fiveof those states experienceddecreases in 2016.
U.S. commodity exports totaledmore than $1.45 trillion in 2016,representing a 3.25% decreaseover the $1.5 trillion recorded in2015.
In New England in 2016, onlyMassachusetts’ exports valueranked higher thanConnecticut’s, as has been thecase since 2005. As a regionaltrading block, New England’scommodity exports totaled morethan $52.47 billion in 2016, aslight 0.16% decrease from 2015.
Connecticut ExportComposition
Connecticut’s top exportcommodities mirror the state’shistoric strengths and there is ademonstrated consistency amongthe state’s top exports. Last yearwas no exception. In 2016 at thetwo-digit Harmonized System (HS)commodity code level,Connecticut’s top five exportcommodities were (1) aircraft,spacecraft and parts thereof; (2)industrial machinery, includingcomputers; (3) electric machinery,sound equipment, TV equipment,parts; (4) optic, photo, medical orsurgical instruments and (5)special classification provisions,Nesoi. The bulk of specialclassification provisions werecomposed of exports of repaired
imports. Please refer to Table Afor commodity export details.
Drilling down an additional layerinto the HS commodity codesreveals the transportationsector’s dominance ofConnecticut exports. At thefour-digit HS level, the state’stop exports included civilianaircraft, engines, parts; exportsof repaired imports andturbojets, turbopropellers.
To put these figures intonational and regional context,the U.S. and New Englandstates’ top export commoditieswere similar to Connecticut’s. In2016, the top five U.S. exportcommodities were (1) industrialmachinery, includingcomputers; (2) electricmachinery, sound equipment,TV equipment, parts; (3) aircraft,spacecraft and parts thereof; (4)vehicles, except railway ortramway, and parts and (5)mineral fuel, oil, bituminsubstances, mineral wax. In2016, the New England region’stop five export commodities were(1) electric machinery, soundequipment, TV equipment, parts;(2) industrial machinery,including computers; (3) optic,photo, medical or surgicalinstruments; (4) aircraft,spacecraft, and parts thereofand (5) natural or culturedpearls, precious stones, preciousmetal clad materials, imitationjewelry and coins.
State Export Partners
The state’s top five commodityexport destinations were France,Germany, Canada, the UnitedArab Emirates (UAE) andMexico. Please refer to Table B.Following a 12.60% decrease in2015, France experienced aslight 0.66% uptick in 2016 toremain the #1 destination forConnecticut commodity exports

THE CONNECTICUT ECONOMIC DIGEST 3April 2017
at $1.95 billion. Connecticutexported over $1 billion to eachof its remaining top five tradepartners in 2016. Among thestate’s top 10 partners, theNetherlands experienced thegreatest growth in Connecticutcommodity exports, a 3.58%increase. Significant increasesoccurred in commodities ofmineral fuel, oil, bituminsubstances, mineral wax;pharmaceutical products;vehicles, except railway ortramway; and essential oils. TheU.A.E. continues to trend as asignificant market destination forstate exports, dominated byaircraft, spacecraft and partsthereof; electric machinery,sound equipment, TV equipmentand industrial machinery,including computers. Rounding
out the state’s top 10 tradepartners in 2016 were theUnited Kingdom, China, Japan,the Netherlands and SouthKorea, ranking 6-10,respectively.
In 2016, the top five destinationsfor U.S. commodity exports wereCanada, Mexico, China, Japanand the United Kingdom, whilethe top five destinations for theNew England states wereCanada, Mexico, Germany,China and France.
State Trade ExpansionPromotion (STEP) Grant
The state and federalgovernment continue to work todevelop export opportunities. Tothat end, DECD administers a
State Trade ExpansionPromotion (STEP) grantaward from the U.S.Small BusinessAdministration (SBA).The STEP program goalis to increase the valueof exports for smallbusinesses currentlyexporting and grow thenumber of exporters.Working in conjunctionwith partners such asthe Connecticut Centerfor AdvancedTechnology (CCAT),U.S. Department ofCommerce (USDOC),Small BusinessDevelopment Center(SBDC), and others,DECD directs STEPfunds towards companyparticipation in variousexport activities, eventsand trainingopportunities.For more informationabout DECD’sinternational programsand services, includingSTEP grant activities,eligibility standards,program guidelines and
application procedures, pleasecontact Laura Jaworski at 860-270-8068 [email protected].
_________________________1 Data Source: World Institute forStrategic Economic Research (WISER),http://www.wisertrade.org.
2 “Connecticut Exports, Jobs, & ForeignInvestment,” U.S. Department ofCommerce International TradeAdministration, February 2017.
3 Omitting Puerto Rico and variousexport sales attributed to “unknown state,”Connecticut actually ranked 25th. In thestate export data series, low-value exportestimates are credited to “unknown state,”as export statistics are collected only forexport commodity shipments over$2,500.
Table A: 2016 Connecticut Commodity Exports
Rank DescriptionANNUAL
2015
ANNUAL
2016%2015‐ 2016
TOTAL ALL COMMODITIES 15,240,632,658 14,403,241,314 -5.49
1 Aircraf t, Spacecraf t, And Parts Thereof 6,721,258,114 5,925,954,997 -11.83
2 Industrial Machinery, Including Computers 2,014,954,443 2,279,397,443 13.12
3 Electric Machinery Etc; Sound Equip; Tv Equip; Pts 1,328,874,554 1,157,370,041 -12.91
4 Optic, Photo Etc, Medic Or Surgical Instrments Etc 1,189,287,336 1,141,205,069 -4.04
5 Special Classif ication Provisions, Nesoi 356,737,885 604,710,284 69.51
6 Plastics And Articles Thereof 383,241,481 336,490,591 -12.2
7 Copper And Articles Thereof 383,497,087 230,321,282 -39.94
8 Inorg Chem; Prec & Rare-Earth Met & Radioact Compd 221,597,694 211,937,562 -4.36
9 Miscellaneous Chemical Products 137,385,136 158,884,532 15.65
10 Mineral Fuel, Oil Etc.; Bitumin Subst; Mineral Wax 155,120,792 146,902,275 -5.3
Table B: 2016 Connecticut Commodity Exports by Partner Country
Rank DescriptionANNUAL
2015
ANNUAL
2016%2015‐ 2016
TOTAL ALL PARTNER COUNTRIES 15,240,632,658 14,403,241,314 -5.49
1 France 1,941,850,836 1,954,711,707 0.66
2 Germany 1,653,266,793 1,640,965,329 -0.74
3 Canada 1,623,192,123 1,632,517,685 0.57
4 United Arab Emirates 1,592,080,475 1,241,851,486 -22
5 Mexico 1,319,126,998 1,060,675,322 -19.59
6 United Kingdom 884,507,463 894,510,909 1.13
7 China 1,028,368,940 814,474,780 -20.8
8 Japan 525,184,912 526,118,396 0.18
9 Netherlands 476,587,430 493,647,957 3.58
10 Korea, Republic Of 456,045,969 363,751,577 -20.24

THE CONNECTICUT ECONOMIC DIGEST4 April 2017
T
A New Look at Earnings InequalityBy Patrick J. Flaherty, Assistant Director of Research, DOL, [email protected]
here is a great deal ofliterature documenting the
increase in income inequality inthe United States from the mid-1970s to the present. Data fromthe Current Population Survey(CPS) and the Internal RevenueService (IRS) show similar trends.In a recent presentation,1 Dr.James R. Spletzer of the U.S.Census Bureau reviewed thisdata and presented new findingsusing data from the LongitudinalEmployer-Household Dynamics(LEHD).2
The IRS data presented bySpletzer shows that the share ofincome earned by the top 10% ofearners has risen from around35% in the 1970s to over 50% by2012. The CPS data shows thatthe 90/10 ratio has increasedsignificantly since the mid-1970s.(This is the ratio of the earningsof those at the 90th percentile—top 10% of all earners—to thoseat 10th percentile—the bottom10% of all earners.) Virtually allof the increase in the 90/10 ratiosince the mid-1990s has beendue to an increase in the 90/50
ratio (the gap between earners atthe 90th percentile and themedian earner). The 50/10 ratio(the gap between the medianearner and those at the 10thpercentile) has remained flat. After briefly mentioning someexplanations for the wideninggap (skills, institutions,technology/automation), Spletzerfocuses on the role of the firm.One idea is that there are goodpaying firms and bad payingfirms. As stated in one of thearticles Spletzer cites “increasedvariance of establishmentearnings is a major pathway forthe increased variance inindividual earnings.”3
Using data from the LEHD,Spletzer decomposes thevariance in wages (how muchindividual wages differ from eachother) into within firm andacross firm components, that ishow much the wages of workersin the same company differ fromeach other compared to howmuch the wages paid at differentcompanies differ from eachother. He found that roughly
half the earnings variance weobserve is across firms and halfwithin firms. However, since themid 1990s, “93.5% of the growthin earnings variance is acrossfirms.”4
Spletzer noted that there areat least three possibleexplanations for the increasedinequality in earnings amongfirms. One is worker-firmsorting, that is good workers endup working with other really goodworkers at good firms. Anotheris “rent sharing,” that firms thatearn profits share those withtheir workers. Some firms aremore profitable than others, sosome firms have more “rents” toshare than others. Anotherpossible explanation of firmdifferences in wages can beexplained by industry differences. The publicly availableaggregate LEHD data forConnecticut does not allow us tolook at earnings within individualfirms. However, we can see thatearnings differences amongindustries may indeed begrowing. Ranking each industry5
by the earnings of workers whohad held a job for a least a fullquarter and comparing theindustries at the 10th, 50th, and90th percentiles in terms of totalemployment shows that the gapbetween the earnings of those at10th and the 90th percentile hasbeen widening and that much ofthe increase is due to theincrease in the 90/50 ratio. Ofcourse, there are many factorscontributing to this change,including the experience andeducation of workers. Onefeature of the LEHD data is itincludes demographic and firmcharacteristics (such as age ofworker and size of firm). A fullanalysis of the wage gap using allof these factors is a promisingarea for future research. For
3.0
3.5
4.0
4.5
5.0
5.5
Ratio
1996 1998 2000 2002 2004 2006 2008 2010 2012 2014Source: Quarterly Workforce Indicators (QWI)
Earnings of 90th Percentile Industry / 10th Percentile Industry
Connecticut Wage Ratio

THE CONNECTICUT ECONOMIC DIGEST 5April 2017
GENERAL ECONOMIC INDICATORS
Sources: *Dr. Steven P. Lanza, University of Connecticut **Farmington Bank ***Federal Reserve Bank of Philadelphia
General Drift Indicators are composite measures of the four-quarter change in three coincident (Connecticut Manufacturing Production Index, nonfarm employment, andreal personal income) and three leading (housing permits, manufacturing average weekly hours, and initial unemployment claims) economic variables, and are indexed so1996 = 100.
The Farmington Bank Business Barometer is a measure of overall economic growth in the state of Connecticut that is derived from non-manufacturing employment,real disposable personal income, and manufacturing production.
The Philadelphia Fed’s Coincident Index summarizes current economic condition by using four coincident variables: nonfarm payroll employment, average hoursworked in manufacturing, the unemployment rate, and wage and salary disbursements deflated by the consumer price index (U.S. city average).
4Q 4Q CHANGE 3Q(Seasonally adjusted) 2016 2015 NO. % 2016General Drift Indicator (1996=100)* Leading 117.9 116.6 1.3 1.1 118.4 Coincident 117.2 117.2 0.0 0.0 117.5Farmington Bank Business Barometer (1992=100)** 137.3 135.8 1.5 1.1 137.3
Philadelphia Fed's Coincident Index (July 1992=100)*** Jan Jan Dec(Seasonally adjusted) 2017 2016 2016 Connecticut 184.97 175.81 9.16 5.2 184.99 United States 181.47 176.31 5.16 2.9 181.10
example, just looking at menaged 45 to 54 shows that the90/10 wage gap rose from themid-1990s to the early 2000sand then held steady for almosta decade before rising again.Decomposing this further showsthat the 50/10 ratio hasremained fairly steady while, just
as with the national datapresented by Spletzer, the 90/50wage gap has increasedsignificantly. When ranking industries byaverage wage, those at the topwill, by definition, pay more thanthose at the bottom. Thequestion for further research is
1.5
2.0
2.5
3.0
Ratio
1996 1998 2000 2002 2004 2006 2008 2010 2012 2014
90 / 50 Ratio
50 / 10 Ratio
Source: Quarterly Workforce Indicators (QWI)
Earnings of 90th, 50th & 10th Percentile Industries
Wage Ratio -- CT Men Age 45 to 54why the gap between those at thetop and those at the bottom hasbeen widening – and in particularwhy those at the top have gainedso much on those in themiddle.
________________________1 “Earnings Inequality Statistics from
the LEHD,” February 15, 2017.Available at https://www.c2er.org/ledwebinars/.
2 Information about the LEHD and theLocal Employment Dynamics (LED)Partnership is available at https://lehd.did.census.gov/.
3 Barth, Bryson, Davis & Freeman, “It’sWhere Your Work: Increases inDispersion of Earnings acrossEstablishments and Individuals in theUnited States,” Journal of LaborEconomics, 2016, vol. 34, No. 2, pt. 2p. S71.
4 Spletzer, James R. “EarningsInequality Statistics from the LEHD”presentation to accompany February15, 2017 webinar.
5 This analysis was done looking atindustries at the 4-digit NAICS level.
THE CONNECTICUT ECONOMIC DIGEST6 April 2017
EMPLOYMENT BY INDUSTRY SECTOR
INCOME
Average weekly initial
claims fell from a year
ago.
UNEMPLOYMENT
The production worker
weekly earnings fell over
the year.
MANUFACTURING ACTIVITY
ECONOMIC INDICATORSTotal nonfarm
employment increased
over the year.
Personal income for third
quarter 2017 is
forecasted to increase 3.5
percent from a year
earlier.
Source: Connecticut Department of Labor * Includes Native American tribal government employment
Sources: Connecticut Department of Labor; U.S. Bureau of Labor Statistics
Sources: Connecticut Department of Labor; U.S. Department of Energy*Latest two months are forecasted.
Source: Bureau of Economic Analysis*Forecasted by Connecticut Department of Labor
(Seasonally adjusted) 3Q* 3Q CHANGE 2Q*(Annualized; $ Millions) 2017 2016 NO. % 2017Personal Income $265,609 $256,649 8,960 3.5 $263,340UI Covered Wages $114,825 $112,156 2,669 2.4 $113,636
Feb Feb CHANGE Jan(Seasonally adjusted; 000s) 2017 2016 NO. % 2017TOTAL NONFARM 1,682.4 1,680.3 2.1 0.1 1,684.0 Natural Res & Mining 0.6 0.6 0.0 0.0 0.6 Construction 59.2 59.6 -0.4 -0.7 58.0 Manufacturing 155.7 156.4 -0.7 -0.4 156.1 Trade, Transportation & Utilities 300.5 299.0 1.5 0.5 302.4 Information 31.3 32.6 -1.3 -4.0 31.5 Financial Activities 130.7 129.9 0.8 0.6 131.6 Professional and Business Services 218.3 218.3 0.0 0.0 217.4 Education and Health Services 331.0 328.3 2.7 0.8 327.9 Leisure and Hospitality 155.2 153.1 2.1 1.4 158.4 Other Services 66.3 64.4 1.9 3.0 66.4 Government* 233.6 238.1 -4.5 -1.9 233.7
STATE
Feb Feb CHANGE Jan Dec(Not seasonally adjusted) 2017 2016 NO. % 2017 2016Production Worker Avg Wkly Hours 41.4 41.5 -0.1 -0.2 42.1 --Prod. Worker Avg Hourly Earnings 24.77 27.17 -2.40 -8.8 24.92 --Prod. Worker Avg Weekly Earnings 1,025.48 1,127.56 -102.08 -9.1 1,049.13 --CT Mfg. Prod. Index, NSA (2009=100) 102.7 103.2 -0.5 -0.5 103.1 106.2 Production Worker Hours (000s) 3,801 3,986 -186 -4.7 3,873 -- Industrial Electricity Sales (mil kWh)* 245 248 -2.9 -1.2 245 252CT Mfg. Prod. Index, SA (2009=100) 108.9 110.4 -1.5 -1.4 106.3 110.1
Feb Feb CHANGE Jan(Seasonally adjusted) 2017 2016 NO. % 2017Labor Force, resident (000s) 1,901.4 1,891.2 10.2 0.5 1,892.2 Employed (000s) 1,811.9 1,787.6 24.3 1.4 1,807.2 Unemployed (000s) 89.5 103.5 -14.0 -13.5 85.0Unemployment Rate (%) 4.7 5.5 -0.8 --- 4.5Labor Force Participation Rate (%) 66.2 65.9 0.3 --- 65.8Employment-Population Ratio (%) 63.0 62.3 0.7 --- 62.9Average Weekly Initial Claims 3,341 3,702 -361 -9.8 3,496Avg. Insured Unemp. Rate (%) 2.50 2.47 0.03 --- 2.45
2016 2015 3Q 2016U-6 Rate (%) 10.8 10.9 -0.1 --- 11.1

THE CONNECTICUT ECONOMIC DIGEST 7April 2017
TOURISM AND TRAVEL
ECONOMIC INDICATORSBUSINESS ACTIVITY S&P 500 Index increased
over the year.
Gaming slots fell over the
year.
BUSINESS STARTS AND TERMINATIONS Net business formation, as
measured by starts minus
stops registered with the
Department of Labor, was up
over the year.
STATE REVENUES
Sources: Connecticut Department of Economic and Community Development; U.S. Department of Energy,Energy Information Administration; Connecticut Department of Revenue Services; F.W. Dodge;Connecticut Department of Motor Vehicles; Wisertrade.org
* Estimated by the Bureau of the Census
Sources: Connecticut Secretary of the State; Connecticut Department of Labor
Feb Feb % % (Millions of dollars) 2017 2016 CHG CURRENT PRIOR CHGTOTAL ALL REVENUES* 1,003.8 1,159.5 -13.4 2,941.9 2,863.8 2.7 Corporate Tax 16.0 13.8 15.9 43.2 29.8 45.0 Personal Income Tax 527.7 532.5 -0.9 1,531.9 1,559.8 -1.8 Real Estate Conv. Tax 12.1 12.6 -4.0 29.5 26.6 10.9 Sales & Use Tax 318.0 357.3 -11.0 810.6 730.0 11.0 Gaming Payments** 20.9 21.3 -2.2 41.8 42.6 -1.9
YEAR TO DATE
Sources: Connecticut Department of Revenue Services; Division of Special Revenue*Includes all sources of revenue; Only selected sources are displayed; Most July receipts arecredited to the prior fiscal year and are not shown. **See page 23 for explanation.
Sources: Connecticut Department of Transportation, Bureau of Aviation and Ports; ConnecticutCommission on Culture and Tourism; Division of Special Revenue
*STR, Inc. Due to layoffs, Info Center Visitors data are no longer published.**Attraction participants expanded from 6 to 23 beginning with July 2014 data***See page 23 for explanation
Y/Y % YEAR TO DATE % MONTH LEVEL CHG CURRENT PRIOR CHG
Occupancy Rate (%)* Feb 2017 52.2 -1.3 49.6 48.9 1.4Major Attraction Visitors** Feb 2017 288,489 -2.7 548,389 602,451 -9.0Air Passenger Count Feb 2017 437,459 2.8 898,541 859,998 4.5Gaming Slots (Mil.$)*** Feb 2017 1,018.8 -1.0 2,048.0 2,079.5 -1.5
Y/Y % %MO/QTR LEVEL CHG CURRENT PRIOR CHG
STARTS Secretary of the State Feb 2017 2,186 -4.8 4,915 4,547 8.1 Department of Labor 3Q 2016 2,021 -9.9 7,253 7,289 -0.5
TERMINATIONS Secretary of the State Feb 2017 757 -24.0 1,872 1,879 -0.4 Department of Labor 3Q 2016 1,459 -27.2 4,886 5,501 -11.2
YEAR TO DATE
STATE
Total all revenues were down
from a year ago.
Y/Y % YEAR TO DATE % MONTH LEVEL CHG CURRENT PRIOR CHG
New Housing Permits* Feb 2017 175 -58.4 487 571 -14.7Electricity Sales (mil kWh) Jan 2017 2,533 -0.4 2,533 2,544 -0.4Construction Contracts Index (1980=100) Feb 2017 217.7 -70.8 --- --- ---New Auto Registrations Feb 2017 13,577 -59.0 31,945 53,996 -40.8Exports (Bil. $) 4Q 2016 3.70 -4.6 14.40 15.24 -5.5S&P 500: Monthly Close Feb 2017 2,363.64 22.3 --- --- ---
THE CONNECTICUT ECONOMIC DIGEST8 April 2017
CONSUMER NEWS
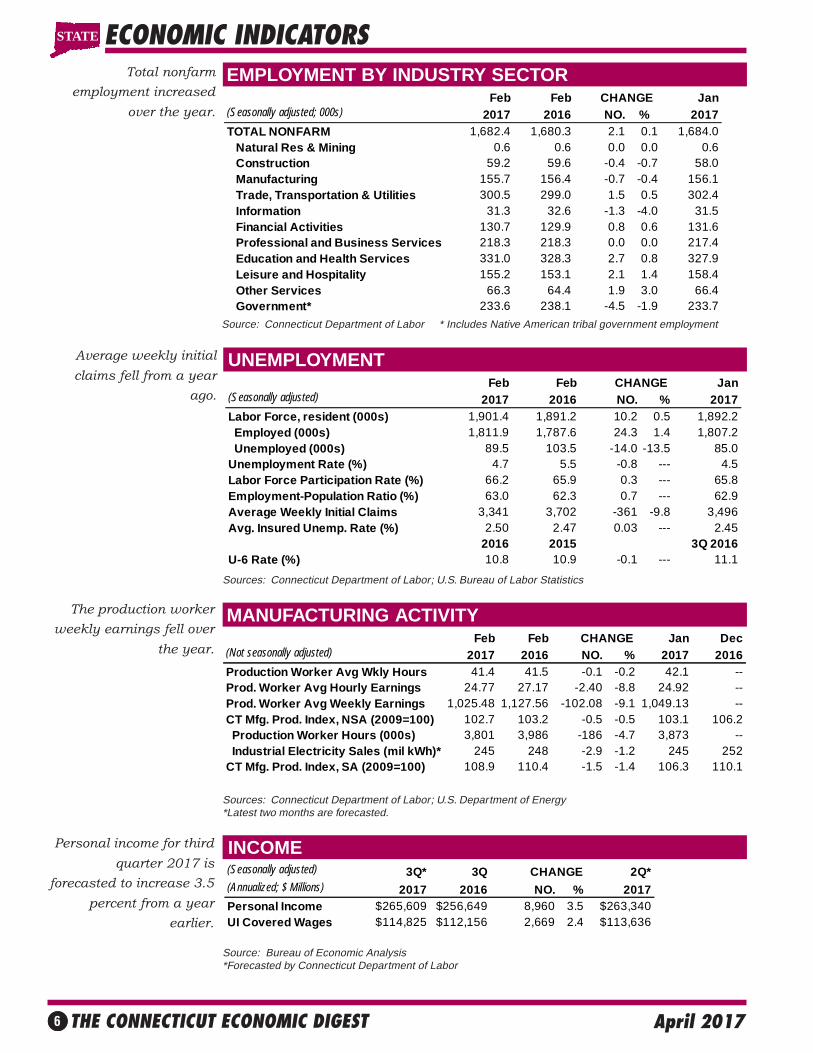
EMPLOYMENT COST INDEXCompensation cost for the
nation rose 2.2 percent
over the year.
Conventional mortgage
rate rose to 4.17 percent
over the month.
INTEREST RATES
ECONOMIC INDICATORS
U.S. inflation rate
was up by 2.7 percent
over the year.
Source: U.S. Department of Labor, Bureau of Labor Statistics
Sources: U.S. Department of Labor, Bureau of Labor Statistics; The Conference Board*Change over prior monthly or quarterly period**The Boston CPI can be used as a proxy for New England and is measured every other month.
Sources: Federal Reserve; Federal Home Loan Mortgage Corp.
Feb Jan Feb(Percent) 2017 2017 2016Prime 3.75 3.75 3.50
Federal Funds 0.66 0.65 0.38
3 Month Treasury Bill 0.53 0.52 0.31
6 Month Treasury Bill 0.65 0.62 0.45
1 Year Treasury Note 0.82 0.83 0.53
3 Year Treasury Note 1.47 1.48 0.90
5 Year Treasury Note 1.90 1.92 1.22
7 Year Treasury Note 2.22 2.23 1.5310 Year Treasury Note 2.42 2.43 1.78
20 Year Treasury Note 2.76 2.75 2.20
Conventional Mortgage 4.17 4.15 3.66
Seasonally Adjusted Not Seasonally AdjustedPrivate Industry Workers Dec Sep 3-Mo Dec Dec 12-Mo(Dec. 2005 = 100) 2016 2016 % Chg 2016 2015 % ChgUNITED STATES TOTAL 127.3 126.7 0.5 127.2 124.5 2.2
Wages and Salaries 127.2 126.6 0.5 127.1 124.2 2.3
Benefit Costs 127.5 127.0 0.4 127.3 125.1 1.8
NORTHEAST TOTAL --- --- --- 128.7 125.6 2.5 Wages and Salaries --- --- --- 128.3 124.7 2.9
STATE
(Not seasonally adjusted) MO/QTR LEVEL Y/Y P/P*CONSUMER PRICES CPI-U (1982-84=100)
U.S. City Average Feb 2017 243.603 2.7 0.3 Purchasing Power of $ (1982-84=$1.00) Feb 2017 0.411 -2.7 -0.3
Northeast Region Feb 2017 258.768 2.6 0.3
NY-Northern NJ-Long Island Feb 2017 267.662 2.6 0.3
Boston-Brockton-Nashua** Jan 2017 264.865 3.0 1.2 CPI-W (1982-84=100)
U.S. City Average Feb 2017 237.477 2.8 0.3
% CHANGE

THE CONNECTICUT ECONOMIC DIGEST 9April 2017
UNEMPLOYMENT RATES
LABOR FORCE
NONFARM EMPLOYMENT
All states showed a
decrease in its
unemployment rate over
the year.
All nine states in the
region gained jobs over
the year.
Six states posted
increases in the labor
force from last year.
COMPARATIVE REGIONAL DATA
Source: U.S. Department of Labor, Bureau of Labor Statistics
Source: U.S. Department of Labor, Bureau of Labor Statistics
Source: U.S. Department of Labor, Bureau of Labor Statistics
Feb Feb CHANGE Jan(Seasonally adjusted; 000s) 2017 2016 NO. % 2017Connecticut 1,682.4 1,680.3 2.1 0.1 1,684.0Maine 620.2 617.3 2.9 0.5 621.9Massachusetts 3,603.6 3,545.9 57.7 1.6 3,593.5New Hampshire 677.5 666.4 11.1 1.7 680.4New Jersey 4,130.2 4,056.5 73.7 1.8 4,117.6New York 9,496.9 9,361.7 135.2 1.4 9,484.5Pennsylvania 5,941.6 5,867.6 74.0 1.3 5,929.1Rhode Island 495.2 489.3 5.9 1.2 493.0Vermont 315.9 312.5 3.4 1.1 315.9United States 145,798.0 143,448.0 2,350.0 1.6 145,563.0
Feb Feb CHANGE Jan(Seasonally adjusted) 2017 2016 NO. % 2017Connecticut 1,901,358 1,891,160 10,198 0.5 1,892,209
Maine 698,146 683,670 14,476 2.1 696,193
Massachusetts 3,626,947 3,586,316 40,631 1.1 3,599,258
New Hampshire 751,837 745,338 6,499 0.9 751,876
New Jersey 4,522,985 4,517,396 5,589 0.1 4,514,340
New York 9,554,111 9,560,734 -6,623 -0.1 9,523,041
Pennsylvania 6,434,441 6,437,640 -3,199 0.0 6,440,304
Rhode Island 552,212 552,212 0 0.0 551,042
Vermont 346,841 344,197 2,644 0.8 346,072
United States 160,056,000 158,888,000 1,168,000 0.7 159,716,000
Feb Feb Jan(Seasonally adjusted) 2017 2016 CHANGE 2017Connecticut 4.7 5.5 -0.8 4.5Maine 3.2 3.7 -0.5 3.5Massachusetts 3.4 4.2 -0.8 3.2New Hampshire 2.7 2.8 -0.1 2.7New Jersey 4.4 5.0 -0.6 4.6New York 4.4 4.9 -0.5 4.6Pennsylvania 5.0 5.4 -0.4 5.2Rhode Island 4.5 5.4 -0.9 4.8Vermont 3.0 3.3 -0.3 3.1United States 4.7 4.9 -0.2 4.8
STATE

THE CONNECTICUT ECONOMIC DIGEST10 April 2017
ECONOMIC INDICATOR TRENDSSTATE
TOTAL NONFARM EMPLOYMENT, SA, 000s Month 2015 2016 2017Jan 1,671.5 1,677.8 1,684.0
Feb 1,668.8 1,680.3 1,682.4
Mar 1,669.1 1,683.8
Apr 1,671.2 1,677.7
May 1,675.5 1,677.3
Jun 1,678.1 1,678.8
Jul 1,673.6 1,680.6
Aug 1,674.2 1,681.2
Sep 1,673.5 1,681.4
Oct 1,677.6 1,679.2
Nov 1,678.7 1,678.2
Dec 1,677.7 1,677.5
UNEMPLOYMENT RATE, SA, % Month 2015 2016 2017Jan 6.1 5.5 4.5
Feb 6.0 5.5 4.7
Mar 5.9 5.7
Apr 5.8 5.7
May 5.6 5.7
Jun 5.5 5.8
Jul 5.4 5.7
Aug 5.3 5.6
Sep 5.3 5.4
Oct 5.4 5.1
Nov 5.4 4.7
Dec 5.4 4.4
LABOR FORCE, SA, 000s Month 2015 2016 2017
Jan 1,900.2 1890.3 1,892.2
Feb 1,900.1 1891.2 1,901.4
Mar 1,898.6 1891.7
Apr 1,895.9 1892.2
May 1,892.4 1892.5
Jun 1,888.7 1892.5
Jul 1,885.8 1892.1
Aug 1,884.2 1891.3
Sep 1,883.6 1890.1Oct 1,883.8 1888.8
Nov 1,884.3 1887.5
Dec 1,885.2 1886.2
AVERAGE WEEKLY INITIAL CLAIMS, SA Month 2015 2016 2017
Jan 4,100 3,488 3,496
Feb 4,072 3,702 3,341
Mar 4,021 3,774
Apr 4,086 3,838
May 3,772 3,911
Jun 4,055 4,894
Jul 3,940 3,750Aug 3,945 3,906
Sep 3,787 4,057
Oct 3,719 3,852
Nov 3,648 3,844
Dec 3,713 3,812
0123456789
10
03 04 05 06 07 08 09 10 11 12 13 14 15 16 17
1,500
1,540
1,580
1,620
1,660
1,700
1,740
03 04 05 06 07 08 09 10 11 12 13 14 15 16 17
2,000
3,000
4,000
5,000
6,000
7,000
8,000
9,000
03 04 05 06 07 08 09 10 11 12 13 14 15 16 17
1650
1700
1750
1800
1850
1900
1950
03 04 05 06 07 08 09 10 11 12 13 14 15 16 17

THE CONNECTICUT ECONOMIC DIGEST 11April 2017
ECONOMIC INDICATOR TRENDS STATE
REAL AVG MFG HOURLY EARNINGS, NSA, 1982-84$ Month 2015 2016 2017Jan $10.79 $11.74 $10.52
Feb $10.79 $11.76 $10.43
Mar $10.89 $11.83
Apr $11.00 $11.82
May $10.71 $12.01
Jun $10.81 $11.68
Jul $10.80 $11.62
Aug $11.12 $11.34
Sep $11.29 $11.03
Oct $11.34 $10.84
Nov $11.54 $10.71
Dec $11.78 $10.60
AVG MANUFACTURING WEEKLY HOURS, NSA Month 2015 2016 2017Jan 40.5 41.6 42.1
Feb 40.2 41.5 41.4
Mar 40.7 42.0
Apr 40.2 41.9
May 39.7 42.9
Jun 39.6 42.8
Jul 39.4 43.1
Aug 40.5 42.2
Sep 40.1 42.9
Oct 40.7 43.4
Nov 42.2 43.0Dec 42.4 43.5
CT MFG PRODUCTION INDEX (NSA, 12 MMA, 2009=100) Month 2015 2016 2017Jan 108.3 109.0 109.9
Feb 108.2 109.0 109.8
Mar 108.5 109.1
Apr 108.5 109.3
May 107.8 110.2
Jun 108.3 110.0
Jul 108.8 110.1
Aug 108.7 110.4Sep 108.8 110.5
Oct 109.3 109.9
Nov 109.0 110.2
Dec 108.8 110.1
SECRETARY OF STATE'S NET BUSINESS STARTS, 12MMA Month 2015 2016 2017Jan 1,238 1,153 1,370
Feb 1,256 1,163 1,375
Mar 1,165 1,242
Apr 1,097 1,315
May 1,054 1,324
Jun 1,065 1,285
Jul 1,067 1,294Aug 1,073 1,329
Sep 1,061 1,339
Oct 1,063 1,322
Nov 1,080 1,347
Dec 1,133 1,344
38
39
40
41
42
43
44
03 04 05 06 07 08 09 10 11 12 13 14 15 16 17
8
9
10
11
12
13
03 04 05 06 07 08 09 10 11 12 13 14 15 16 17
80
90
100
110
120
130
140
150
03 04 05 06 07 08 09 10 11 12 13 14 15 16 17
500
700
900
1,100
1,300
1,500
1,700
1,900
03 04 05 06 07 08 09 10 11 12 13 14 15 16 17

THE CONNECTICUT ECONOMIC DIGEST12 April 2017
Not Seasonally Adjusted
Feb Feb CHANGE Jan2017 2016 NO. % 2017
TOTAL NONFARM EMPLOYMENT…………… 1,654,300 1,652,900 1,400 0.1 1,654,600TOTAL PRIVATE………………………………… 1,417,900 1,412,200 5,700 0.4 1,420,500 GOODS PRODUCING INDUSTRIES………… 207,200 209,500 -2,300 -1.1 207,800 CONSTRUCTION, NAT. RES. & MINING.…… 52,500 53,800 -1,300 -2.4 52,600 MANUFACTURING…………………………… 154,700 155,700 -1,000 -0.6 155,200 Durable Goods………………………………… 121,300 122,600 -1,300 -1.1 121,700 Fabricated Metal……………………………… 29,300 29,100 200 0.7 29,300 Machinery…………………………………… 13,300 13,700 -400 -2.9 13,400 Computer and Electronic Product………… 11,200 11,800 -600 -5.1 11,300 Transportation Equipment . . . . . . . . . . . . . . 42,700 41,200 1,500 3.6 42,600 Aerospace Product and Parts…………… 28,200 27,600 600 2.2 28,000 Non-Durable Goods………………………… 33,400 33,100 300 0.9 33,500 Chemical……………………………………… 7,000 7,600 -600 -7.9 7,000 SERVICE PROVIDING INDUSTRIES………… 1,447,100 1,443,400 3,700 0.3 1,446,800 TRADE, TRANSPORTATION, UTILITIES….. 294,300 293,500 800 0.3 301,300 Wholesale Trade……………………………… 63,900 61,900 2,000 3.2 63,400 Retail Trade…………………………………… 177,900 180,600 -2,700 -1.5 184,500 Motor Vehicle and Parts Dealers…………… 21,000 21,200 -200 -0.9 21,000 Building Material……………………………… 14,200 14,200 0 0.0 14,200 Food and Beverage Stores………………… 43,800 43,900 -100 -0.2 44,800 General Merchandise Stores……………… 28,800 27,900 900 3.2 30,500 Transportation, Warehousing, & Utilities…… 52,500 51,000 1,500 2.9 53,400 Utilities………………………………………… 5,200 5,700 -500 -8.8 5,300 Transportation and Warehousing………… 47,300 45,300 2,000 4.4 48,100 INFORMATION………………………………… 31,400 32,400 -1,000 -3.1 31,300 Telecommunications………………………… 8,600 8,900 -300 -3.4 8,600 FINANCIAL ACTIVITIES……………………… 130,000 128,900 1,100 0.9 131,000 Finance and Insurance……………………… 110,200 109,500 700 0.6 111,000 Credit Intermediation and Related………… 24,800 25,100 -300 -1.2 25,100 Financial Investments and Related………… 26,100 25,700 400 1.6 26,300 Insurance Carriers & Related Activities…… 59,300 58,700 600 1.0 59,600 Real Estate and Rental and Leasing……… 19,800 19,400 400 2.1 20,000 PROFESSIONAL & BUSINESS SERVICES 211,800 213,300 -1,500 -0.7 210,000 Professional, Scientific……………………… 98,000 97,500 500 0.5 96,000 Legal Services……………………………… 12,800 12,700 100 0.8 12,700 Computer Systems Design………………… 25,700 26,000 -300 -1.2 25,600 Management of Companies………………… 31,900 32,900 -1,000 -3.0 31,900 Administrative and Support………………… 81,900 82,900 -1,000 -1.2 82,100 Employment Services……………………… 25,800 27,800 -2,000 -7.2 26,400 EDUCATION AND HEALTH SERVICES…… 332,600 328,700 3,900 1.2 324,800 Educational Services………………………… 67,200 66,100 1,100 1.7 58,900 Health Care and Social Assistance………… 265,400 262,600 2,800 1.1 265,900 Hospitals……………………………………… 58,600 57,800 800 1.4 58,800 Nursing & Residential Care Facilities……… 61,800 62,300 -500 -0.8 61,800 Social Assistance…………………………… 56,900 55,100 1,800 3.3 56,800 LEISURE AND HOSPITALITY………………… 145,300 142,600 2,700 1.9 148,800 Arts, Entertainment, and Recreation………… 21,900 22,200 -300 -1.4 22,800 Accommodation and Food Services………… 123,400 120,400 3,000 2.5 126,000 Food Serv., Restaurants, Drinking Places… 112,700 109,900 2,800 2.5 115,300 OTHER SERVICES…………………………… 65,300 63,300 2,000 3.2 65,500 GOVERNMENT ………………………………… 236,400 240,700 -4,300 -1.8 234,100 Federal Government………………………… 18,000 17,700 300 1.7 18,000 State Government……………………………. 66,800 69,400 -2,600 -3.7 65,200 Local Government**…………………………… 151,600 153,600 -2,000 -1.3 150,900
CONNECTICUT
NONFARM EMPLOYMENT ESTIMATES
Current month’s data are preliminary. Prior months’ data have been revised. All data are benchmarked to March 2016. *Total excludes workers idled due to labor-management disputes. **Includes Indian tribal government employment
STATE

THE CONNECTICUT ECONOMIC DIGEST 13April 2017
DANBURY LMA
BRIDGEPORT -STAMFORD LMA
NONFARM EMPLOYMENT ESTIMATES
Current month’s data are preliminary. Prior months’ data have been revised. All data are benchmarked to March 2016. *Total excludes workers idled due to labor-management disputes.
LMA
Not Seasonally Adjusted
Feb Feb CHANGE Jan2017 2016 NO. % 2017
TOTAL NONFARM EMPLOYMENT…………… 397,800 401,900 -4,100 -1.0 400,500TOTAL PRIVATE………………………………… 353,800 357,700 -3,900 -1.1 356,800 GOODS PRODUCING INDUSTRIES………… 39,600 40,500 -900 -2.2 39,300 CONSTRUCTION, NAT. RES. & MINING.…… 10,700 11,100 -400 -3.6 10,400 MANUFACTURING…………………………… 28,900 29,400 -500 -1.7 28,900 Durable Goods………………………………… 22,500 23,300 -800 -3.4 22,700 SERVICE PROVIDING INDUSTRIES………… 358,200 361,400 -3,200 -0.9 361,200 TRADE, TRANSPORTATION, UTILITIES….. 69,200 70,000 -800 -1.1 71,000 Wholesale Trade……………………………… 13,400 13,100 300 2.3 13,400 Retail Trade…………………………………… 45,600 47,000 -1,400 -3.0 47,300 Transportation, Warehousing, & Utilities…… 10,200 9,900 300 3.0 10,300 INFORMATION………………………………… 12,500 12,300 200 1.6 12,500 FINANCIAL ACTIVITIES……………………… 41,100 40,800 300 0.7 41,700 Finance and Insurance……………………… 34,600 34,300 300 0.9 34,800 Credit Intermediation and Related………… 8,900 9,300 -400 -4.3 9,000 Financial Investments and Related………… 17,200 17,200 0 0.0 17,300 PROFESSIONAL & BUSINESS SERVICES 61,200 66,300 -5,100 -7.7 61,400 Professional, Scientific……………………… 30,600 30,600 0 0.0 29,600 Administrative and Support………………… 21,200 23,100 -1,900 -8.2 21,900 EDUCATION AND HEALTH SERVICES…… 73,400 71,800 1,600 2.2 72,300 Health Care and Social Assistance………… 61,100 59,900 1,200 2.0 61,000 LEISURE AND HOSPITALITY………………… 39,100 38,800 300 0.8 40,800 Accommodation and Food Services………… 31,300 30,500 800 2.6 32,700 OTHER SERVICES…………………………… 17,700 17,200 500 2.9 17,800 GOVERNMENT ………………………………… 44,000 44,200 -200 -0.5 43,700 Federal………………………………………… 2,500 2,400 100 4.2 2,500 State & Local…………………………………… 41,500 41,800 -300 -0.7 41,200
Not Seasonally Adjusted
Feb Feb CHANGE Jan2017 2016 NO. % 2017
TOTAL NONFARM EMPLOYMENT…………… 77,800 77,600 200 0.3 78,100TOTAL PRIVATE………………………………… 67,200 66,900 300 0.4 67,800 GOODS PRODUCING INDUSTRIES………… 11,800 11,900 -100 -0.8 11,900 SERVICE PROVIDING INDUSTRIES………… 66,000 65,700 300 0.5 66,200 TRADE, TRANSPORTATION, UTILITIES….. 17,100 17,100 0 0.0 17,600 Retail Trade…………………………………… 12,300 12,500 -200 -1.6 12,900 PROFESSIONAL & BUSINESS SERVICES 9,100 9,200 -100 -1.1 9,100 LEISURE AND HOSPITALITY………………… 7,100 7,000 100 1.4 7,100 GOVERNMENT ………………………………… 10,600 10,700 -100 -0.9 10,300 Federal………………………………………… 700 700 0 0.0 700 State & Local…………………………………… 9,900 10,000 -100 -1.0 9,600

THE CONNECTICUT ECONOMIC DIGEST14 April 2017
HARTFORD LMA
NONFARM EMPLOYMENT ESTIMATESLMA
SEASONALLY ADJUSTED TOTAL NONFARM EMPLOYMENT
Current month’s data are preliminary. Prior months’ data have been revised. All data are benchmarked to March 2016.*Total excludes workers idled due to labor-management disputes
** Unofficial seasonally adjusted estimates produced by the Connecticut Department of Labor
Not Seasonally Adjusted
Feb Feb CHANGE Jan2017 2016 NO. % 2017
TOTAL NONFARM EMPLOYMENT…………… 565,500 563,800 1,700 0.3 563,800TOTAL PRIVATE………………………………… 478,800 474,400 4,400 0.9 478,900 GOODS PRODUCING INDUSTRIES………… 72,400 73,500 -1,100 -1.5 72,300 CONSTRUCTION, NAT. RES. & MINING.…… 17,300 18,300 -1,000 -5.5 17,400 MANUFACTURING…………………………… 55,100 55,200 -100 -0.2 54,900 Durable Goods………………………………… 45,700 45,800 -100 -0.2 45,500 Non-Durable Goods………………………… 9,400 9,400 0 0.0 9,400 SERVICE PROVIDING INDUSTRIES………… 493,100 490,300 2,800 0.6 491,500 TRADE, TRANSPORTATION, UTILITIES….. 90,100 89,500 600 0.7 91,300 Wholesale Trade……………………………… 19,300 18,000 1,300 7.2 18,700 Retail Trade…………………………………… 53,700 54,600 -900 -1.6 55,300 Transportation, Warehousing, & Utilities…… 17,100 16,900 200 1.2 17,300 Transportation and Warehousing………… 16,200 15,900 300 1.9 16,400 INFORMATION………………………………… 11,200 11,600 -400 -3.4 11,200 FINANCIAL ACTIVITIES……………………… 57,300 57,000 300 0.5 57,100 Depository Credit Institutions……………… 6,100 6,100 0 0.0 6,200 Insurance Carriers & Related Activities…… 36,900 37,100 -200 -0.5 37,000 PROFESSIONAL & BUSINESS SERVICES 72,800 71,100 1,700 2.4 73,500 Professional, Scientific……………………… 35,100 34,300 800 2.3 35,300 Management of Companies………………… 10,500 10,100 400 4.0 10,600 Administrative and Support………………… 27,200 26,700 500 1.9 27,600 EDUCATION AND HEALTH SERVICES…… 107,400 105,000 2,400 2.3 105,200 Educational Services………………………… 14,300 13,900 400 2.9 11,800 Health Care and Social Assistance………… 93,100 91,100 2,000 2.2 93,400 Ambulatory Health Care…………………… 30,900 30,700 200 0.7 31,400 LEISURE AND HOSPITALITY………………… 45,500 45,100 400 0.9 45,800 Accommodation and Food Services………… 39,000 38,700 300 0.8 39,200 OTHER SERVICES…………………………… 22,100 21,600 500 2.3 22,500 GOVERNMENT ………………………………… 86,700 89,400 -2,700 -3.0 84,900 Federal………………………………………… 5,400 5,300 100 1.9 5,300 State & Local…………………………………… 81,300 84,100 -2,800 -3.3 79,600
Seasonally AdjustedFeb Feb CHANGE Jan
Labor Market Areas 2017 2016 NO. % 2017 BRIDGEPORT-STAMFORD LMA……………… 408,900 411,000 -2,100 -0.5 409,800 DANBURY LMA………………………………… 79,100 79,000 100 0.1 79,200 HARTFORD LMA………………………………… 570,900 569,700 1,200 0.2 571,800 NEW HAVEN LMA……………………………… 280,800 281,300 -500 -0.2 279,100 NORWICH-NEW LONDON LMA……………… 129,700 128,500 1,200 0.9 129,600 WATERBURY LMA……………………………… 67,000 67,200 -200 -0.3 66,800 ENFIELD LMA**………………………………… 45,300 45,600 -300 -0.7 45,100 TORRINGTON-NORTHWEST LMA**………… 32,900 33,300 -400 -1.2 32,800 DANIELSON-NORTHEAST LMA**…………… 27,200 27,300 -100 -0.4 27,300

THE CONNECTICUT ECONOMIC DIGEST 15April 2017
NEW HAVEN LMA
NONFARM EMPLOYMENT ESTIMATES
Current month’s data are preliminary. Prior months’ data have been revised. All data are benchmarked to March 2016. *Total excludes workers idled due to labor-management disputes. **Value less than 50
LMA
HELP WANTED ONLINE
* A percent of advertised vacancies per 100 persons in labor forceSource: The Conference Board
CT Online Labor Demand Fell5,700 in February 2017
The Conference Board’s HelpWanted OnLine (HWOL) datareported that there were 70,800advertisements for Connecticut-based jobs in February 2017, a 7.5percent decrease over the monthbut a 2.3 percent increase over theyear. There were 3.73 advertisedvacancies for every 100 persons inConnecticut’s labor force, whilenationally it was 2.84 percent.Among the New England states,Massachusetts had the highestlabor demand rate (3.85), whileMaine had the lowest rate (2.52).
The Conference Board Help Wanted OnLine® Data Series (HWOL) measures the number ofnew, first-time online jobs and jobs reposted from the previous month for over 16,000 Internet jobboards, corporate boards and smaller job sites that serve niche markets and smaller geographicareas. Background information and technical notes and discussion of revisions to the series areavailable at: www.conference-board.org/data/helpwantedonline.cfm.
Not Seasonally Adjusted
Feb Feb CHANGE Jan2017 2016 NO. % 2017
TOTAL NONFARM EMPLOYMENT…………… 277,100 278,200 -1,100 -0.4 273,300 TOTAL PRIVATE………………………………… 240,900 241,800 -900 -0.4 237,600 GOODS PRODUCING INDUSTRIES………… 32,900 33,300 -400 -1.2 33,100 CONSTRUCTION, NAT. RES. & MINING.…… 9,700 9,700 0 0.0 9,800 MANUFACTURING…………………………… 23,200 23,600 -400 -1.7 23,300 Durable Goods………………………………… 16,800 17,500 -700 -4.0 16,900 SERVICE PROVIDING INDUSTRIES………… 244,200 244,900 -700 -0.3 240,200 TRADE, TRANSPORTATION, UTILITIES….. 50,300 49,700 600 1.2 51,200 Wholesale Trade……………………………… 11,600 11,400 200 1.8 11,600 Retail Trade…………………………………… 29,200 29,300 -100 -0.3 30,000 Transportation, Warehousing, & Utilities…… 9,500 9,000 500 5.6 9,600 INFORMATION………………………………… 3,100 3,200 -100 -3.1 3,100 FINANCIAL ACTIVITIES……………………… 12,500 12,400 100 0.8 12,500 Finance and Insurance……………………… 8,800 8,900 -100 -1.1 8,800 PROFESSIONAL & BUSINESS SERVICES 29,100 29,700 -600 -2.0 28,800 Administrative and Support………………… 13,500 13,700 -200 -1.5 13,400 EDUCATION AND HEALTH SERVICES…… 79,800 80,100 -300 -0.4 75,500 Educational Services………………………… 30,300 30,900 -600 -1.9 26,000 Health Care and Social Assistance………… 49,500 49,200 300 0.6 49,500 LEISURE AND HOSPITALITY………………… 22,300 22,800 -500 -2.2 22,500 Accommodation and Food Services………… 19,800 19,500 300 1.5 20,000 OTHER SERVICES…………………………… 10,900 10,600 300 2.8 10,900 GOVERNMENT ………………………………… 36,200 36,400 -200 -0.5 35,700 Federal………………………………………… 4,900 4,800 100 2.1 4,900 State & Local…………………………………… 31,300 31,600 -300 -0.9 30,800
Feb Feb Jan(Seasonally adjusted) 2017 2016 2017CT Vacancies (000s) 70.8 69.2 76.5
Hartford Vac. (000s) 27.6 28.0 29.1
Connecticut 3.73 3.65 4.03
United States 2.84 3.45 3.07
Maine 2.52 4.59 2.57
Massachusetts 3.85 4.75 4.08
New Hampshire 3.17 4.24 3.47Rhode Island 2.64 3.26 2.99
Vermont 3.22 3.76 3.58
Labor Demand Rate *

THE CONNECTICUT ECONOMIC DIGEST16 April 2017
NORWICH-NEW LONDON-WESTERLY, CT-RI LMA
Current month’s data are preliminary. Prior months’ data have been revised. All data are benchmarked to March 2016. *Total excludes workers idled due to labor-management disputes. **Includes Indian tribal government employment.
NONFARM EMPLOYMENT ESTIMATES
WATERBURY LMA
LMA
Not Seasonally Adjusted
Feb Feb CHANGE Jan2017 2016 NO. % 2017
TOTAL NONFARM EMPLOYMENT…………… 126,800 125,000 1,800 1.4 127,200TOTAL PRIVATE………………………………… 95,900 93,500 2,400 2.6 96,500 GOODS PRODUCING INDUSTRIES………… 20,600 20,000 600 3.0 20,600 CONSTRUCTION, NAT. RES. & MINING.…… 4,000 3,900 100 2.6 4,000 MANUFACTURING…………………………… 16,600 16,100 500 3.1 16,600 Durable Goods………………………………… 13,400 12,700 700 5.5 13,400 Non-Durable Goods………………………… 3,200 3,400 -200 -5.9 3,200 SERVICE PROVIDING INDUSTRIES………… 106,200 105,000 1,200 1.1 106,600 TRADE, TRANSPORTATION, UTILITIES….. 23,700 22,500 1,200 5.3 24,300 Wholesale Trade……………………………… 2,600 2,500 100 4.0 2,600 Retail Trade…………………………………… 16,700 15,700 1,000 6.4 17,200 Transportation, Warehousing, & Utilities…… 4,400 4,300 100 2.3 4,500 INFORMATION………………………………… 1,100 1,100 0 0.0 1,100 FINANCIAL ACTIVITIES……………………… 2,800 2,800 0 0.0 2,800 PROFESSIONAL & BUSINESS SERVICES 8,600 8,700 -100 -1.1 8,600 EDUCATION AND HEALTH SERVICES…… 20,800 20,700 100 0.5 20,400 Health Care and Social Assistance………… 17,500 18,000 -500 -2.8 17,800 LEISURE AND HOSPITALITY………………… 14,800 14,300 500 3.5 15,200 Accommodation and Food Services………… 13,600 12,500 1,100 8.8 13,800 Food Serv., Restaurants, Drinking Places… 11,500 10,700 800 7.5 11,600 OTHER SERVICES…………………………… 3,500 3,400 100 2.9 3,500 GOVERNMENT ………………………………… 30,900 31,500 -600 -1.9 30,700 Federal………………………………………… 2,900 2,800 100 3.6 2,800 State & Local**………………………………… 28,000 28,700 -700 -2.4 27,900
Not Seasonally Adjusted
Feb Feb CHANGE Jan 2017 2016 NO. % 2017
TOTAL NONFARM EMPLOYMENT…………… 66,000 65,900 100 0.2 65,700TOTAL PRIVATE………………………………… 55,800 55,900 -100 -0.2 55,700 GOODS PRODUCING INDUSTRIES………… 9,900 10,000 -100 -1.0 9,800 CONSTRUCTION, NAT. RES. & MINING.…… 2,300 2,400 -100 -4.2 2,200 MANUFACTURING…………………………… 7,600 7,600 0 0.0 7,600 SERVICE PROVIDING INDUSTRIES………… 56,100 55,900 200 0.4 55,900 TRADE, TRANSPORTATION, UTILITIES….. 12,800 13,000 -200 -1.5 13,200 Wholesale Trade……………………………… 2,100 2,100 0 0.0 2,100 Retail Trade…………………………………… 8,900 9,000 -100 -1.1 9,200 Transportation, Warehousing, & Utilities…… 1,800 1,900 -100 -5.3 1,900 INFORMATION………………………………… 600 600 0 0.0 600 FINANCIAL ACTIVITIES……………………… 1,900 1,900 0 0.0 1,900 PROFESSIONAL & BUSINESS SERVICES 5,300 5,400 -100 -1.9 5,100 EDUCATION AND HEALTH SERVICES…… 17,300 17,100 200 1.2 17,100 Health Care and Social Assistance………… 15,800 15,400 400 2.6 15,800 LEISURE AND HOSPITALITY………………… 5,400 5,300 100 1.9 5,400 OTHER SERVICES…………………………… 2,600 2,600 0 0.0 2,600 GOVERNMENT ………………………………… 10,200 10,000 200 2.0 10,000 Federal………………………………………… 500 500 0 0.0 500 State & Local…………………………………… 9,700 9,500 200 2.1 9,500

THE CONNECTICUT ECONOMIC DIGEST 17April 2017
NONFARM EMPLOYMENT ESTIMATES
NOTE: More industry detail data is available for the State and its nine labor market areas at: http://www.ctdol.state.ct.us/lmi/202/covered.htm. The data published there differ from the data in the preced-ing tables in that they are developed from a near-universe count of Connecticut employment covered bythe unemployment insurance (UI) program, while the data here is sample-based. The data drawn fromthe UI program does not contain estimates of employment not covered by unemployment insurance, andis lagged several months behind the current employment estimates presented here.
SMALLER LMAS*
Current month’s data are preliminary. Prior months’ data have been revised. All data are benchmarked to March 2016. *Total excludes workers idled due to labor-management disputes.
SPRINGFIELD, MA-CTNECTA**
** New England City and Town Area
LMA
For further information on these nonfarm employment estimates contact Lincoln Dyer at (860) 263-6292.
Not Seasonally Adjusted
Feb Feb CHANGE Jan 2017 2016 NO. % 2017
TOTAL NONFARM EMPLOYMENT ENFIELD LMA…………………………………… 44,700 44,900 -200 -0.4 44,700 TORRINGTON-NORTHWEST LMA…………… 31,700 32,000 -300 -0.9 32,000 DANIELSON-NORTHEAST LMA……………… 26,700 26,700 0 0.0 26,800
Not Seasonally Adjusted
Feb Feb CHANGE Jan2017 2016 NO. % 2017
TOTAL NONFARM EMPLOYMENT…………… 332,400 327,700 4,700 1.4 326,700TOTAL PRIVATE………………………………… 266,500 263,000 3,500 1.3 264,200 GOODS PRODUCING INDUSTRIES………… 38,200 37,900 300 0.8 38,100 CONSTRUCTION, NAT. RES. & MINING.…… 9,800 9,300 500 5.4 9,700 MANUFACTURING…………………………… 28,400 28,600 -200 -0.7 28,400 Durable Goods………………………………… 19,300 19,300 0 0.0 19,300 Non-Durable Goods………………………… 9,100 9,300 -200 -2.2 9,100 SERVICE PROVIDING INDUSTRIES………… 294,200 289,800 4,400 1.5 288,600 TRADE, TRANSPORTATION, UTILITIES….. 59,400 58,600 800 1.4 60,300 Wholesale Trade……………………………… 11,200 10,800 400 3.7 11,200 Retail Trade…………………………………… 35,000 34,400 600 1.7 35,800 Transportation, Warehousing, & Utilities…… 13,200 13,400 -200 -1.5 13,300 INFORMATION………………………………… 3,400 3,500 -100 -2.9 3,400 FINANCIAL ACTIVITIES……………………… 16,900 17,200 -300 -1.7 16,900 Finance and Insurance……………………… 13,500 13,900 -400 -2.9 13,500 Insurance Carriers & Related Activities…… 9,100 9,400 -300 -3.2 9,000 PROFESSIONAL & BUSINESS SERVICES 25,900 25,500 400 1.6 25,900 EDUCATION AND HEALTH SERVICES…… 82,200 79,100 3,100 3.9 78,900 Educational Services………………………… 16,000 15,100 900 6.0 12,900 Health Care and Social Assistance………… 66,200 64,000 2,200 3.4 66,000 LEISURE AND HOSPITALITY………………… 27,800 28,600 -800 -2.8 28,000 OTHER SERVICES…………………………… 12,700 12,600 100 0.8 12,700 GOVERNMENT ………………………………… 65,900 64,700 1,200 1.9 62,500 Federal………………………………………… 6,000 6,000 0 0.0 5,900 State & Local…………………………………… 59,900 58,700 1,200 2.0 56,600
* State-designated Non-CES areas

THE CONNECTICUT ECONOMIC DIGEST18 April 2017
LABOR FORCE ESTIMATES
Current month’s data are preliminary. Prior months’ data have been revised. All data are benchmarked to March 2016.
EMPLOYMENT Feb Feb CHANGE Jan(Not seasonally adjusted) STATUS 2017 2016 NO. % 2017
CONNECTICUT Civilian Labor Force 1,896,100 1,880,800 15,300 0.8 1,887,100Employed 1,791,100 1,767,400 23,700 1.3 1,784,900
Unemployed 105,000 113,300 -8,300 -7.3 102,200Unemployment Rate 5.5 6.0 -0.5 --- 5.4
BRIDGEPORT-STAMFORD LMA Civilian Labor Force 465,100 464,500 600 0.1 464,500Employed 439,600 437,400 2,200 0.5 439,700
Unemployed 25,500 27,100 -1,600 -5.9 24,800Unemployment Rate 5.5 5.8 -0.3 --- 5.3
DANBURY LMA Civilian Labor Force 107,800 106,700 1,100 1.0 107,700Employed 102,600 101,200 1,400 1.4 102,600
Unemployed 5,300 5,500 -200 -3.6 5,100Unemployment Rate 4.9 5.2 -0.3 --- 4.7
DANIELSON-NORTHEAST LMA Civilian Labor Force 43,400 42,600 800 1.9 43,100Employed 40,700 39,700 1,000 2.5 40,600
Unemployed 2,600 2,900 -300 -10.3 2,400Unemployment Rate 6.1 6.8 -0.7 --- 5.7
ENFIELD LMA Civilian Labor Force 50,500 49,400 1,100 2.2 49,800Employed 47,700 46,400 1,300 2.8 47,000
Unemployed 2,800 3,000 -200 -6.7 2,700Unemployment Rate 5.6 6.0 -0.4 --- 5.5
HARTFORD LMA Civilian Labor Force 621,200 614,200 7,000 1.1 618,100Employed 587,400 577,300 10,100 1.7 585,000
Unemployed 33,800 36,900 -3,100 -8.4 33,100Unemployment Rate 5.4 6.0 -0.6 --- 5.4
NEW HAVEN LMA Civilian Labor Force 323,400 321,700 1,700 0.5 319,900Employed 305,900 302,700 3,200 1.1 302,800
Unemployed 17,500 19,000 -1,500 -7.9 17,100Unemployment Rate 5.4 5.9 -0.5 --- 5.4
NORWICH-NEW LONDON LMA Civilian Labor Force 142,500 139,900 2,600 1.9 142,300Employed 134,600 131,000 3,600 2.7 134,500
Unemployed 7,900 8,900 -1,000 -11.2 7,900Unemployment Rate 5.5 6.4 -0.9 --- 5.5
TORRINGTON-NORTHWEST LMA Civilian Labor Force 47,000 47,000 0 0.0 47,100Employed 44,200 44,000 200 0.5 44,400
Unemployed 2,800 3,000 -200 -6.7 2,700Unemployment Rate 5.9 6.4 -0.5 --- 5.7
WATERBURY LMA Civilian Labor Force 111,300 110,700 600 0.5 110,700Employed 103,500 102,400 1,100 1.1 103,200
Unemployed 7,700 8,300 -600 -7.2 7,400Unemployment Rate 6.9 7.5 -0.6 --- 6.7
UNITED STATES Civilian Labor Force 159,482,000 158,279,000 1,203,000 0.8 158,676,000Employed 151,594,000 150,060,000 1,534,000 1.0 150,527,000
Unemployed 7,887,000 8,219,000 -332,000 -4.0 8,149,000Unemployment Rate 4.9 5.2 -0.3 --- 5.1
LMA
THE CONNECTICUT ECONOMIC DIGEST 19April 2017
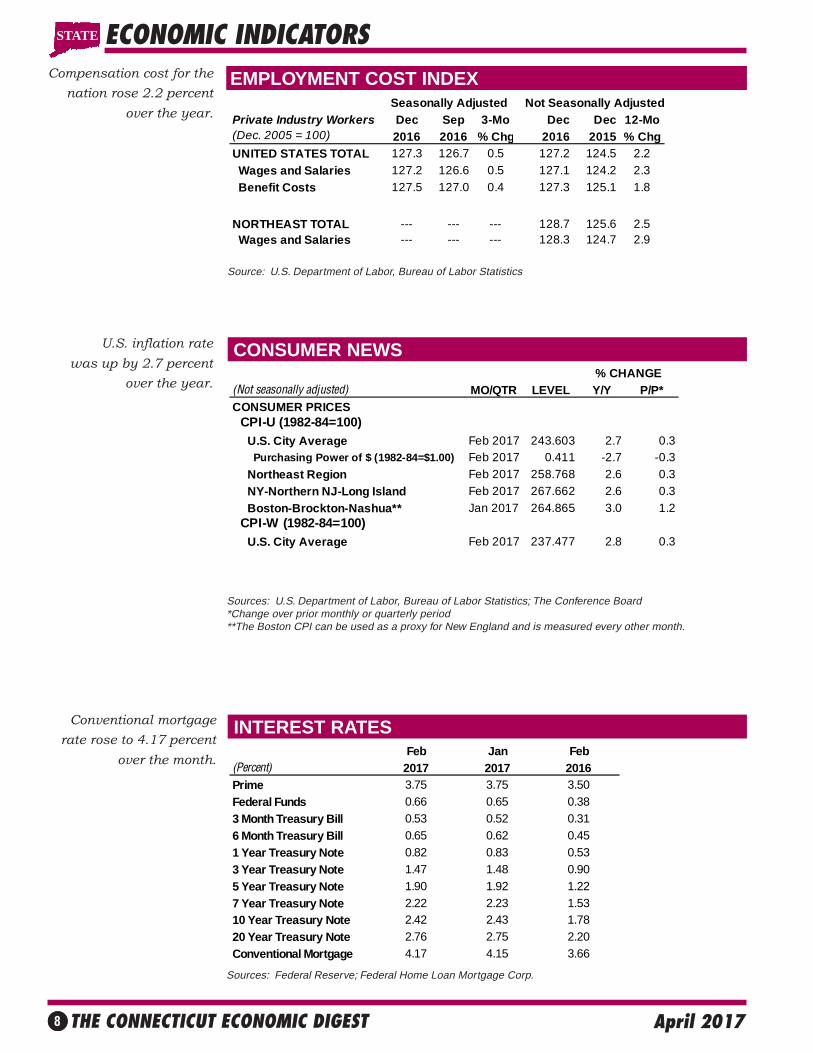
HOURS AND EARNINGS
Current month’s data are preliminary. Prior months’ data have been revised. All data are benchmarked to March 2016.
BUSINESS AND EMPLOYMENT CHANGES ANNOUNCED IN THE NEWS MEDIA Norwegian company to buy Proton OnSite for $70M
A Norwegian company has agreed to purchase Wallingford’s Proton OnSite for approximately $70 million in cashand stock. Nel ASA, which like Proton makes equipment called electrolyzers, has signed a non-binding termsheet with Proton, a manufacturer of hydrogen-generation technology used in submarines, hydrogen vehiclesand industrial settings. Proton CFO Sheldon Paul said Monday by phone that the company intends to keep itslocal operations and workforce. Nel and Proton hope to close the sale in the second quarter.
Xerox cuts 800 jobs in Q4Xerox continued to pare costs in the fourth quarter even as it completed the separation of its business processoutsourcing operations, cutting 800 jobs and ending a lease on a jet and the maintenance of a corporate aviationdepartment.
United Bank moving 200 workers to downtown HartfordUnited Bank, a community lender based in Glastonbury, is relocating its administrative base and some 200workers to downtown Hartford’s Goodwin Square office tower. The move will begin in late spring or earlysummer.
Business & Employment Changes Announced in the News Media lists start-ups, expansions, staff reductions, and layoffs reported bythe media, both current and future. The report provides company name, the number of workers involved, date of the action, theprincipal product or service of the company, a brief synopsis of the action, and the source and date of the media article. This publica-tion is available in both HTML and PDF formats at the Connecticut Department of Labor Web site, http://www.ctdol.state.ct.us/lmi/busemp.htm.
LMA
AVG WEEKLY EARNINGS AVG WEEKLY HOURS AVG HOURLY EARNINGSFeb CHG Jan Feb CHG Jan Feb CHG Jan
(Not seasonally adjusted) 2017 2016 Y/Y 2017 2017 2016 Y/Y 2017 2017 2016 Y/Y 2017
PRODUCTION WORKERMANUFACTURING $1,025.48 $1,127.56 -$102.08 $1,049.13 41.4 41.5 -0.1 42.1 $24.77 $27.17 -$2.40 $24.92 DURABLE GOODS 1,071.43 1,190.80 -119.37 1,099.53 42.5 41.9 0.6 42.8 25.21 28.42 -3.21 25.69 NON-DUR. GOODS 849.32 901.91 -52.59 859.52 37.3 40.3 -3.0 39.5 22.77 22.38 0.39 21.76CONSTRUCTION 1,067.25 1,077.51 -10.26 1,079.69 36.4 36.7 -0.3 36.9 29.32 29.36 -0.04 29.26
ALL EMPLOYEESSTATEWIDETOTAL PRIVATE 1,032.90 1,003.59 29.31 1,056.83 33.0 33.1 -0.1 33.7 31.30 30.32 0.98 31.36GOODS PRODUCING 1,200.24 1,263.02 -62.78 1,207.46 38.2 39.2 -1.0 38.9 31.42 32.22 -0.80 31.04 Construction 1,139.47 1,159.90 -20.43 1,149.63 35.9 37.2 -1.3 36.8 31.74 31.18 0.56 31.24 Manufacturing 1,227.31 1,312.61 -85.29 1,235.48 39.4 40.5 -1.1 40.1 31.15 32.41 -1.26 30.81SERVICE PROVIDING 1,004.09 957.12 46.97 1,030.90 32.1 32.0 0.1 32.8 31.28 29.91 1.37 31.43 Trade, Transp., Utilities 856.52 860.64 -4.13 867.67 31.9 32.6 -0.7 32.4 26.85 26.40 0.45 26.78 Financial Activities 1,690.32 1,627.13 63.19 1,806.52 36.5 37.5 -1.0 38.0 46.31 43.39 2.92 47.54 Prof. & Business Serv. 1,241.79 1,220.34 21.45 1,287.14 34.6 34.6 0.0 35.4 35.89 35.27 0.62 36.36 Education & Health Ser. 919.04 849.34 69.70 926.07 31.9 31.1 0.8 32.2 28.81 27.31 1.50 28.76 Leisure & Hospitality 417.93 430.28 -12.35 423.12 23.8 25.4 -1.6 24.6 17.56 16.94 0.62 17.20 Other Services 777.85 681.57 96.28 786.79 30.6 30.4 0.2 31.7 25.42 22.42 3.00 24.82
LABOR MARKET AREAS: TOTAL PRIVATE Bridgeport-Stamford 1,149.08 1,177.04 -27.96 1,183.39 32.7 33.1 -0.4 33.6 35.14 35.56 -0.42 35.22 Danbury 990.89 980.72 10.17 993.00 31.8 34.1 -2.3 33.1 31.16 28.76 2.40 30.00 Hartford 1,054.44 1,024.46 29.98 1,083.92 33.4 33.9 -0.5 34.0 31.57 30.22 1.35 31.88 New Haven 978.09 946.61 31.48 992.77 32.1 32.8 -0.7 32.7 30.47 28.86 1.61 30.36 Norwich-New London 816.54 756.38 60.17 814.93 31.6 32.2 -0.6 32.3 25.84 23.49 2.35 25.23 Waterbury 824.11 773.91 50.20 850.16 33.9 32.3 1.6 34.9 24.31 23.96 0.35 24.36
THE CONNECTICUT ECONOMIC DIGEST20 April 2017
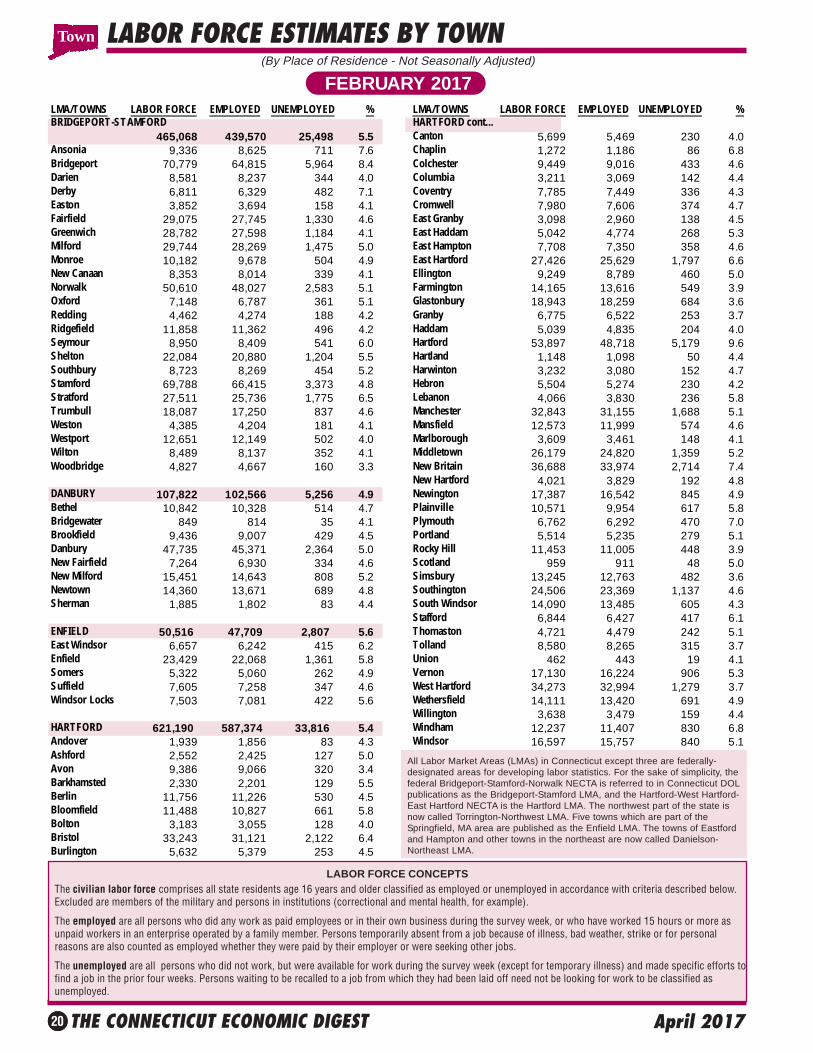
LABOR FORCE ESTIMATES BY TOWN
FEBRUARY 2017(By Place of Residence - Not Seasonally Adjusted)
The civilian labor force comprises all state residents age 16 years and older classified as employed or unemployed in accordance with criteria described below.Excluded are members of the military and persons in institutions (correctional and mental health, for example).
The employed are all persons who did any work as paid employees or in their own business during the survey week, or who have worked 15 hours or more asunpaid workers in an enterprise operated by a family member. Persons temporarily absent from a job because of illness, bad weather, strike or for personalreasons are also counted as employed whether they were paid by their employer or were seeking other jobs.
The unemployed are all persons who did not work, but were available for work during the survey week (except for temporary illness) and made specific efforts tofind a job in the prior four weeks. Persons waiting to be recalled to a job from which they had been laid off need not be looking for work to be classified asunemployed.
LABOR FORCE CONCEPTS
Town
All Labor Market Areas (LMAs) in Connecticut except three are federally-designated areas for developing labor statistics. For the sake of simplicity, thefederal Bridgeport-Stamford-Norwalk NECTA is referred to in Connecticut DOLpublications as the Bridgeport-Stamford LMA, and the Hartford-West Hartford-East Hartford NECTA is the Hartford LMA. The northwest part of the state isnow called Torrington-Northwest LMA. Five towns which are part of theSpringfield, MA area are published as the Enfield LMA. The towns of Eastfordand Hampton and other towns in the northeast are now called Danielson-Northeast LMA.
LMA/TOWNS LABOR FORCE EMPLOYED UNEMPLOYED % LMA/TOWNS LABOR FORCE EMPLOYED UNEMPLOYED %BRIDGEPORT-STAMFORD HARTFORD cont...
465,068 439,570 25,498 5.5 Canton 5,699 5,469 230 4.0Ansonia 9,336 8,625 711 7.6 Chaplin 1,272 1,186 86 6.8Bridgeport 70,779 64,815 5,964 8.4 Colchester 9,449 9,016 433 4.6Darien 8,581 8,237 344 4.0 Columbia 3,211 3,069 142 4.4Derby 6,811 6,329 482 7.1 Coventry 7,785 7,449 336 4.3Easton 3,852 3,694 158 4.1 Cromwell 7,980 7,606 374 4.7Fairfield 29,075 27,745 1,330 4.6 East Granby 3,098 2,960 138 4.5Greenwich 28,782 27,598 1,184 4.1 East Haddam 5,042 4,774 268 5.3Milford 29,744 28,269 1,475 5.0 East Hampton 7,708 7,350 358 4.6Monroe 10,182 9,678 504 4.9 East Hartford 27,426 25,629 1,797 6.6New Canaan 8,353 8,014 339 4.1 Ellington 9,249 8,789 460 5.0Norwalk 50,610 48,027 2,583 5.1 Farmington 14,165 13,616 549 3.9Oxford 7,148 6,787 361 5.1 Glastonbury 18,943 18,259 684 3.6Redding 4,462 4,274 188 4.2 Granby 6,775 6,522 253 3.7Ridgefield 11,858 11,362 496 4.2 Haddam 5,039 4,835 204 4.0Seymour 8,950 8,409 541 6.0 Hartford 53,897 48,718 5,179 9.6Shelton 22,084 20,880 1,204 5.5 Hartland 1,148 1,098 50 4.4Southbury 8,723 8,269 454 5.2 Harwinton 3,232 3,080 152 4.7Stamford 69,788 66,415 3,373 4.8 Hebron 5,504 5,274 230 4.2Stratford 27,511 25,736 1,775 6.5 Lebanon 4,066 3,830 236 5.8Trumbull 18,087 17,250 837 4.6 Manchester 32,843 31,155 1,688 5.1Weston 4,385 4,204 181 4.1 Mansfield 12,573 11,999 574 4.6Westport 12,651 12,149 502 4.0 Marlborough 3,609 3,461 148 4.1Wilton 8,489 8,137 352 4.1 Middletown 26,179 24,820 1,359 5.2Woodbridge 4,827 4,667 160 3.3 New Britain 36,688 33,974 2,714 7.4
New Hartford 4,021 3,829 192 4.8DANBURY 107,822 102,566 5,256 4.9 Newington 17,387 16,542 845 4.9Bethel 10,842 10,328 514 4.7 Plainville 10,571 9,954 617 5.8Bridgewater 849 814 35 4.1 Plymouth 6,762 6,292 470 7.0Brookfield 9,436 9,007 429 4.5 Portland 5,514 5,235 279 5.1Danbury 47,735 45,371 2,364 5.0 Rocky Hill 11,453 11,005 448 3.9New Fairfield 7,264 6,930 334 4.6 Scotland 959 911 48 5.0New Milford 15,451 14,643 808 5.2 Simsbury 13,245 12,763 482 3.6Newtown 14,360 13,671 689 4.8 Southington 24,506 23,369 1,137 4.6Sherman 1,885 1,802 83 4.4 South Windsor 14,090 13,485 605 4.3
Stafford 6,844 6,427 417 6.1ENFIELD 50,516 47,709 2,807 5.6 Thomaston 4,721 4,479 242 5.1East Windsor 6,657 6,242 415 6.2 Tolland 8,580 8,265 315 3.7Enfield 23,429 22,068 1,361 5.8 Union 462 443 19 4.1Somers 5,322 5,060 262 4.9 Vernon 17,130 16,224 906 5.3Suffield 7,605 7,258 347 4.6 West Hartford 34,273 32,994 1,279 3.7Windsor Locks 7,503 7,081 422 5.6 Wethersfield 14,111 13,420 691 4.9
Willington 3,638 3,479 159 4.4HARTFORD 621,190 587,374 33,816 5.4 Windham 12,237 11,407 830 6.8Andover 1,939 1,856 83 4.3 Windsor 16,597 15,757 840 5.1Ashford 2,552 2,425 127 5.0Avon 9,386 9,066 320 3.4Barkhamsted 2,330 2,201 129 5.5Berlin 11,756 11,226 530 4.5Bloomfield 11,488 10,827 661 5.8Bolton 3,183 3,055 128 4.0Bristol 33,243 31,121 2,122 6.4Burlington 5,632 5,379 253 4.5

THE CONNECTICUT ECONOMIC DIGEST 21April 2017
LABOR FORCE ESTIMATES BY TOWN
The unemployment rate represents the number unemployed as a percent of the civilian labor force.
With the exception of those persons temporarily absent from a job or waiting to be recalled to one, persons with no job and who are not actively looking for oneare counted as "not in the labor force".
Over the course of a year, the size of the labor force and the levels of employment undergo fluctuations due to such seasonal events as changes in weather,reduced or expanded production, harvests, major holidays and the opening and closing of schools. Because these seasonal events follow a regular pattern eachyear, their influence on statistical trends can be eliminated by adjusting the monthly statistics. Seasonal Adjustment makes it easier to observe cyclical and othernonseasonal developments.
(By Place of Residence - Not Seasonally Adjusted)
FEBRUARY 2017
LABOR FORCE CONCEPTS (Continued)
Town
LMA/TOWNS LABOR FORCE EMPLOYED UNEMPLOYED % LMA/TOWNS LABOR FORCE EMPLOYED UNEMPLOYED %NEW HAVEN 323,353 305,870 17,483 5.4 TORRINGTON-NORTHWESTBethany 3,103 2,960 143 4.6 47,032 44,242 2,790 5.9Branford 15,984 15,228 756 4.7 Canaan 687 661 26 3.8Cheshire 15,444 14,884 560 3.6 Colebrook 839 785 54 6.4Chester 2,354 2,254 100 4.2 Cornwall 754 728 26 3.4Clinton 7,274 6,901 373 5.1 Goshen 1,595 1,513 82 5.1Deep River 2,877 2,747 130 4.5 Kent 1,516 1,443 73 4.8Durham 4,291 4,107 184 4.3 Litchfield 4,749 4,513 236 5.0East Haven 15,786 14,815 971 6.2 Morris 1,395 1,323 72 5.2Essex 3,361 3,211 150 4.5 Norfolk 903 846 57 6.3Guilford 12,840 12,376 464 3.6 North Canaan 1,705 1,607 98 5.7Hamden 35,005 33,330 1,675 4.8 Roxbury 1,319 1,263 56 4.2Killingworth 3,811 3,667 144 3.8 Salisbury 1,806 1,713 93 5.1Madison 9,035 8,685 350 3.9 Sharon 1,462 1,397 65 4.4Meriden 32,049 29,914 2,135 6.7 Torrington 19,321 17,975 1,346 7.0Middlefield 2,510 2,392 118 4.7 Warren 790 749 41 5.2New Haven 64,004 59,615 4,389 6.9 Washington 2,036 1,953 83 4.1North Branford 8,202 7,804 398 4.9 Winchester 6,155 5,773 382 6.2North Haven 13,335 12,728 607 4.6Old Saybrook 5,115 4,851 264 5.2 WATERBURY 111,254 103,534 7,720 6.9Orange 7,213 6,935 278 3.9 Beacon Falls 3,446 3,260 186 5.4Wallingford 26,108 24,883 1,225 4.7 Bethlehem 1,959 1,838 121 6.2West Haven 29,992 28,125 1,867 6.2 Middlebury 3,863 3,693 170 4.4Westbrook 3,660 3,458 202 5.5 Naugatuck 17,338 16,194 1,144 6.6
Prospect 5,555 5,303 252 4.5*NORWICH-NEW LONDON-WESTERLY, CT PART Waterbury 50,752 46,305 4,447 8.8
126,488 119,523 6,965 5.5 Watertown 12,919 12,276 643 5.0Bozrah 1,439 1,374 65 4.5 Wolcott 9,878 9,368 510 5.2Canterbury 2,904 2,731 173 6.0 Woodbury 5,544 5,297 247 4.5East Lyme 8,811 8,382 429 4.9Franklin 1,064 1,018 46 4.3 DANIELSON-NORTHEASTGriswold 6,326 5,921 405 6.4 43,356 40,709 2,647 6.1Groton 18,439 17,570 869 4.7 Brooklyn 4,170 3,934 236 5.7Ledyard 7,963 7,627 336 4.2 Eastford 946 891 55 5.8Lisbon 2,362 2,217 145 6.1 Hampton 1,028 966 62 6.0Lyme 1,217 1,170 47 3.9 Killingly 9,626 9,014 612 6.4Montville 9,344 8,819 525 5.6 Plainfield 8,763 8,144 619 7.1New London 12,052 11,154 898 7.5 Pomfret 2,472 2,385 87 3.5No. Stonington 2,920 2,778 142 4.9 Putnam 4,868 4,555 313 6.4Norwich 20,356 19,037 1,319 6.5 Sterling 2,057 1,911 146 7.1Old Lyme 3,773 3,621 152 4.0 Thompson 5,255 4,960 295 5.6Preston 2,431 2,281 150 6.2 Woodstock 4,171 3,949 222 5.3Salem 2,163 2,041 122 5.6Sprague 1,641 1,528 113 6.9Stonington 9,676 9,222 454 4.7Voluntown 1,462 1,385 77 5.3Waterford 10,145 9,647 498 4.9
Not Seasonally Adjusted:CONNECTICUT 1,896,100 1,791,100 105,000 5.5
*Connecticut portion only. For whole NECTA,including RI part, see below. UNITED STATES 159,482,000 151,594,000 7,887,000 4.9NORWICH-NEW LONDON-WESTERLY, CT-RI
142,459 134,566 7,893 5.5 Seasonally Adjusted:RI part 15,971 15,043 928 5.8 CONNECTICUT 1,901,400 1,811,900 89,500 4.7(Hopkinton and Westerly) UNITED STATES 160,056,000 152,528,000 7,528,000 4.7

THE CONNECTICUT ECONOMIC DIGEST22 April 2017
HOUSING PERMIT ACTIVITY BY TOWN
For further information on the housing permit data, contact Kolie Sun of DECD at (860) 270-8167.
TOWN FEB YR TO DATE TOWN FEB YR TO DATE TOWN FEB YR TO DATE2017 2017 2016 2017 2017 2016 2017 2017 2016
Andover 0 1 1 Griswold 0 0 0 Preston 1 1 0Ansonia na na na Groton na na na Prospect 2 2 0Ashford na na na Guilford na na na Putnam na na naAvon 1 3 3 Haddam 0 0 0 Redding 0 0 1Barkhamsted na na na Hamden na na na Ridgefield 0 0 2Beacon Falls na na na Hampton na na na Rocky Hill 0 1 1Berlin 0 0 0 Hartford 0 0 0 Roxbury na na naBethany na na na Hartland 0 0 0 Salem na na naBethel 6 12 10 Harwinton na na na Salisbury na na naBethlehem na na na Hebron 1 2 0 Scotland na na na
Bloomfield 0 0 5 Kent 0 0 0 Seymour na na naBolton 1 1 1 Killingly na na na Sharon na na naBozrah na na na Killingworth 1 1 1 Shelton 8 11 6Branford 0 1 2 Lebanon 2 2 0 Sherman 0 1 0Bridgeport 5 13 14 Ledyard na na na Simsbury 1 2 187Bridgewater 0 0 0 Lisbon na na na Somers 1 1 0Bristol 0 1 5 Litchfield na na na South Windsor 0 1 1Brookfield 1 1 3 Lyme 0 0 1 Southbury na na naBrooklyn 1 1 1 Madison na na na Southington 4 8 9Burlington 1 3 2 Manchester 0 1 6 Sprague 0 0 0
Canaan na na na Mansfield 0 2 0 Stafford 0 0 0Canterbury na na na Marlborough 0 0 0 Stamford 0 0 2Canton 0 1 2 Meriden na na na Sterling na na naChaplin na na na Middlebury na na na Stonington na na naCheshire 0 2 4 Middlefield 0 0 0 Stratford 1 3 2Chester 0 1 0 Middletown 6 14 6 Suffield 2 5 3Clinton 1 2 1 Milford 10 30 22 Thomaston na na naColchester 1 2 5 Monroe 2 2 1 Thompson na na naColebrook na na na Montville na na na Tolland 0 2 0Columbia 0 1 0 Morris na na na Torrington na na na
Cornwall na na na Naugatuck na na na Trumbull 0 1 0Coventry 1 2 3 New Britain 0 0 1 Union 1 1 0Cromwell 2 4 2 New Canaan 2 7 2 Vernon 20 20 28Danbury 16 26 12 New Fairfield 0 1 2 Voluntown 0 0 0Darien 3 8 6 New Hartford na na na Wallingford 1 2 3Deep River 0 0 0 New Haven 3 4 0 Warren na na naDerby na na na New London 3 6 4 Washington na na naDurham 0 1 2 New Milford na na na Waterbury 0 24 1East Granby 0 0 0 Newington 0 2 0 Waterford na na naEast Haddam 0 0 2 Newtown 0 1 2 Watertown na na na
East Hampton 2 3 0 Norfolk na na na West Hartford 6 12 1East Hartford 0 0 1 North Branford na na na West Haven na na naEast Haven na na na North Canaan na na na Westbrook 0 2 1East Lyme 1 2 1 North Haven na na na Weston 0 0 1East Windsor 2 3 2 North Stonington na na na Westport 1 7 10Eastford na na na Norwalk 3 79 6 Wethersfield 1 1 1Easton 0 0 0 Norwich 12 12 1 Willington 0 0 0Ellington 3 11 4 Old Lyme na na na Wilton 1 2 4Enfield 0 1 1 Old Saybrook 0 1 2 Winchester na na naEssex 0 1 2 Orange na na na Windham 0 1 1
Fairfield 0 8 107 Oxford 0 1 5 Windsor 1 2 1Farmington 0 1 2 Plainfield na na na Windsor Locks 2 4 0Franklin na na na Plainville 1 1 0 Wolcott 0 1 1Glastonbury 0 6 4 Plymouth na na na Woodbridge na na naGoshen na na na Pomfret na na na Woodbury 0 2 0Granby 1 17 1 Portland 0 0 1 Woodstock na na naGreenwich 8 18 16
Town
THE CONNECTICUT ECONOMIC DIGEST 23April 2017
TECHNICAL NOTESBUSINESS STARTS AND TERMINATIONSRegistrations and terminations of business entities as recorded with the Secretary of the State and the ConnecticutDepartment of Labor (DOL) are an indication of new business formation and activity. DOL business starts include newemployers which have become liable for unemployment insurance taxes during the quarter, as well as new establish-ments opened by existing employers. DOL business terminations are those accounts discontinued due to inactivity (noemployees) or business closure, and accounts for individual business establishments that are closed by still activeemployers. The Secretary of the State registrations include limited liability companies, limited liability partnerships, andforeign-owned (out-of-state) and domestic-owned (in-state) corporations.
CONSUMER PRICE INDEXThe Consumer Price Index (CPI), computed and published by the U.S. Bureau of Labor Statistics, is a measure of theaverage change in prices over time in a fixed market basket of goods and services. It is based on prices of food, clothing,shelter, fuels, transportation fares, charges for doctors’ and dentists’ services, drugs and other goods and services thatpeople buy for their day-to-day living. The Northeast region is comprised of the New England states, New York, NewJersey and Pennsylvania.
EMPLOYMENT COST INDEXThe Employment Cost Index (ECI) covers both wages and salaries and employer costs for employee benefits for alloccupations and establishments in both the private nonfarm sector and state and local government. The ECI measuresemployers’ labor costs free from the influences of employment shifts among industries and occupations. The base periodfor all data is December 2005 when the ECI is 100.
GAMING DATAIndian Gaming Payments are amounts received by the State as a result of the slot compact with the two Federallyrecognized tribes in Connecticut, which calls for 25 percent of net slot receipts to be remitted to the State. IndianGaming Slots are the total net revenues from slot machines only received by the two Federally recognized Indian tribes.
HOURS AND EARNINGS ESTIMATESProduction worker earnings and hours estimates include full- and part-time employees working within manufacturingindustries. Hours worked and earnings data are computed based on payroll figures for the week including the 12th of themonth. Average hourly earnings are affected by such factors as premium pay for overtime and shift differential as well aschanges in basic hourly and incentive rates of pay. Average weekly earnings are the product of weekly hours worked andhourly earnings. These data are developed in cooperation with the U.S. Department of Labor, Bureau of Labor Statistics.
INITIAL CLAIMSAverage weekly initial claims are calculated by dividing the total number of new claims for unemployment insurancereceived in the month by the number of weeks in the month. A minor change in methodology took effect with datapublished in the March 1997 issue of the DIGEST. Data have been revised back to January 1980.
INSURED UNEMPLOYMENT RATEPrimarily a measure of unemployment insurance program activity, the insured unemployment rate is the 13-weekaverage of the number of people claiming unemployment benefits divided by the number of workers covered by theunemployment insurance system.
LABOR FORCE ESTIMATESLabor force estimates are a measure of the work status of people who live in Connecticut. Prepared under the direction ofthe U.S. Bureau of Labor Statistics, the statewide estimates are the product of a signal-plus noise model, which usesresults from the Current Population Survey (CPS), a monthly survey of Connecticut households, counts of claimants forunemployment benefits, and establishment employment estimates. The 2015 LAUS Redesign includes improved time-series models for the census divisions, states, select substate areas, and the balances of those states; an improved real-time benchmarking procedure to the national Current Population Survey (CPS) estimates; an improved smoothedseasonal adjustment procedure; and improved treatment of outliers. Non-modeled area estimation improvements in-clude: updated Dynamic Residency Ratios (DRR); more accurate estimates for all-other employment; more accurateestimation of agricultural employment; and improved estimation of non-covered agricultural unemployment. Handbookestimation is now done at the city/town level instead of at the Labor Market Area (LMA) level in Connecticut, whichbetter reflects local conditions. The Redesign also introduces estimation inputs from the American Community Survey(ACS) to replace inputs that were previously obtained from the decennial census long-form survey. Labor force data,reflecting persons employed by place of residence, are not directly comparable to the place-of-work industry employmentseries. In the labor force estimates, workers involved in labor disputes are counted as employed. The labor force data alsoincludes agricultural workers, unpaid family workers, domestics and the self-employed. Because of these conceptualdifferences, total labor force employment is almost always different from nonfarm wage and salary employment.
LABOR MARKET AREASAll Labor Market Areas (LMAs) in Connecticut except three are federally-designated areas for developing labor statistics.For the sake of simplicity, the federal Bridgeport-Stamford-Norwalk NECTA is referred to in Connecticut DOL publica-tions as the Bridgeport-Stamford LMA, and the Hartford-West Hartford-East Hartford NECTA is the Hartford LMA. Thenorthwest part of the state is now called Torrington-Northwest LMA. Five towns which are part of the Springfield, MAarea are published as the Enfield LMA. The towns of Eastford and Hampton and other towns in the northeast are nowcalled Danielson-Northeast LMA. Industry employment and labor force data estimates contained in Connecticut Depart-ment of Labor publications are prepared following the same statistical procedures developed by the U.S. Department ofLabor, Bureau of Labor Statistics, whether for federally designated or state-determined areas.
NONFARM EMPLOYMENT ESTIMATESNonfarm employment estimates are derived from a survey of businesses to measure jobs by industry. The estimatesinclude all full- and part-time wage and salary employees who worked during or received pay for the pay period whichincludes the 12th of the month. Excluded from these estimates are proprietors, self-employed workers, private householdemployees and unpaid family workers. In some cases, due to space constraints, all industry estimates are not shown.These data are developed in cooperation with the U.S. Department of Labor, Bureau of Labor Statistics.
UI COVERED WAGESUI covered wages is the total amount paid to those employees who are covered under the Connecticut’s UnemploymentInsurance (UI) law for services performed during the quarter. The fluctuations in the 1992-93 period reflect the effect ofthe changes in the tax law and the massive restructuring in the state’s economy.

ECONOMIC INDICATORS AT A GLANCE
Leading General Drift Indicator ..... +1.1Coincident General Drift Indicator .. 0.0Farmington Bank Bus. Barometer +1.1Phil. Fed’s CT Coincident Index .... +5.2
Total Nonfarm Employment........... +0.1
Labor Force ..................................... +0.5Employed ......................................... +1.4Unemployed ................................... -13.5Unemployment Rate ..................... -0.8*Labor Force Participation Rate ......... +0.3Employment-Population Ratio .......... +0.7
Average Weekly Initial Claims ........ -9.8Avg Insured Unempl. Rate .......... +0.03*U-6 Rate ......................................... -0.1*
Prod. Worker Avg Wkly Hrs, Mfg ..... -0.2PW Avg Hourly Earnings, Mfg ........ -8.8PW Avg Weekly Earnings, Mfg ....... -9.1CT Mfg. Production Index ............... -0.5 Production Worker Hours ................ -4.7 Industrial Electricity Sales ............... -1.2
Personal Income ............................ +3.5UI Covered Wages .......................... +2.4
Business Activity New Housing Permits .................... -58.4 Electricity Sales .............................. -0.4 Construction Contracts Index ........ -70.8 New Auto Registrations ................. -59.0 Exports ........................................... -4.6 S&P 500: Monthly Close .............. +22.3
Business Starts Secretary of the State ..................... -4.8 Dept. of Labor ................................. -9.9
Business Terminations Secretary of the State ................... -24.0 Dept. of Labor ............................... -27.2
State Revenues ............................. -13.4 Corporate Tax ............................... +15.9 Personal Income Tax ........................ -0.9 Real Estate Conveyance Tax ............ -4.0 Sales & Use Tax ............................. -11.0 Gaming Payments ........................... -2.2
Tourism and Travel Occupancy Rate ............................. -1.3 Major Attraction Visitors................... -2.7 Air Passenger Count ...................... +2.8 Gaming Slots .................................. -1.0
Employment Cost Index (U.S.) Total ............................................... +2.2 Wages & Salaries........................... +2.3 Benefit Costs ................................. +1.8
Consumer Prices U.S. City Average ........................... +2.7 Northeast Region ........................... +2.6 NY-NJ-Long Island ......................... +2.6 Boston-Brockton-Nashua ............... +3.0
Interest Rates Prime .......................................... +0.25* Conventional Mortgage ............... +0.51*
Mailing address:
Connecticut Economic DigestConnecticut Department of Labor
Office of Research200 Folly Brook Boulevard
Wethersfield, CT 06109-1114
THE CONNECTICUT ECONOMIC DIGEST
*Percentage point change; **Less than 0.05 percent; NA = Not Available
The Connecticut Economic Digest is available on the internet at:
http://www.ctdol.state.ct.us/lmi
April 2017
(Percent change from prior year; see pages 4-8 for reference months or quarters)
THE CONNECTICUT
A joint publication of The Connecticut Departments of Labor and Economic and Community Development
ECONOMIC DIGEST
If you wish to have your name removed from our mailing list, please
check here and return this page (or a photocopy) to the address at left.
If your address has changed, please check here, make the necessary
changes to your address label and return this page to the address at left.
If you receive more than one copy of this publication, please check
here and return this page from the duplicate copy to the address at left.
DO YOU WANT TO BE NOTIFIED BY EMAIL WHEN THEDIGEST IS PUBLISHED EACH MONTH?
Simply email to [email protected] with only the following in thebody of the message, leave subject blank:SUBSCRIBE DOL-CTEconomicDigest your_name(type in your name where it says your_name)