Embed Size (px)
Citation preview

THE CONNECTICUT
ECONOMIC DIGESTOCTOBER 2014
October 2014
Economic Indicators on the Overall Economy ......................... 5 Individual Data Items ......................... 6-8Comparative Regional Data .............. 9Economic Indicator Trends ........ 10-11Help Wanted OnLine ........................ 15Business and Employment ChangesAnnounced in the News Media ...... 19Labor Market Areas: Nonfarm Employment .................... 12-17 Sea. Adj. Nonfarm Employment ..........14 Labor Force ............................................ 18 Hours and Earnings .............................. 19Cities and Towns: Labor Force ..................................... 20-21 Housing Permits .................................... 22Technical Notes ............................... 23At a Glance ....................................... 24
A Closer Look at Home CareOccupations.................... 1-5
IN THIS ISSUE...
In August...Nonfarm Employment Connecticut..................... 1,665,300 Change over month ............ -0.22% Change over year ................ +0.3%
United States .............. 139,118,000 Change over month ........... +0.10% Change over year ................. +1.8%
Unemployment Rate Connecticut............................. 6.6% United States .......................... 6.1%
Consumer Price Index United States ...................... 237.852 Change over year .................. +1.7%
Vol.19 No.10 A joint publication of the Connecticut Department of Labor & the Connecticut Department of Economic and Community Development
By Sarah Pilipaitis, CT DOL Economist
A Closer Look at HomeA Closer Look at HomeA Closer Look at HomeA Closer Look at HomeA Closer Look at HomeCare OccupationsCare OccupationsCare OccupationsCare OccupationsCare Occupations
E very two years, theConnecticut Department of
Labor produces long-termoccupational projections. The 2012-2022 projections show that two ofthe fastest growing occupations interms of percent and net changecome from the Home Health Careindustry. The fastest growingoccupation in Connecticut in theten-year timeframe by net change isprojected to be Personal Care Aideswith a growth of 38.1 percent and8,846 jobs. Nearby on the list offastest growing occupations inConnecticut is Home Health Aideswith a projected growth rate of38.1% and 3,195 jobs from 2012 to2022.1 The rise in these twooccupations warrants a closer lookat what each of them entails. The care of the elderly,convalescents, or persons withdisabilities has been trending tomore services being performed atthe patient’s home. The reasons for
this are often financial as well aspatient-preference. The past decadehas seen a decrease in both theemployment and number ofestablishments of nursing carefacilities in Connecticut. As of 2012,there were 234 privately-ownednursing care facilities in the statewith 37,301 employees.2
The need for receiving homehealth care varies on an individualbasis. Not every elderly or disabledperson will require personalizedattention. Likewise, consumers ofhome care can come from any agegroup and from those inconvalescence. However, the demandfor home care comes primarily fromthe older and disabled population. Alook at the 2010 Census data revealsthe make-up of these groups inConnecticut. Of Connecticut’s3,574,097 residents, there are506,559 (14%) that are above the ageof 64. Similarly, of the 2,843,949people who are 5 years and older,
Employment 2012
Projections 2022
Net Change
Percent Change
Average Annual Wage
Personal Care Aides 23,244 32,090 8,846 38.1% $24,476Registered Nurses 35,985 41,234 5,249 14.6% $75,929Secretaries and Administrative Assistants, Except Legal, Medical, and Executive
34,526 38,644 4,118 11.9% $39,450
Combined Food Preparation and Serving Workers, Including Fast Food
26,728 30,736 4,008 15.0% $19,629
Retail Salespersons 53,799 57,267 3,468 6.4% $22,425General and Operations Managers 31,160 34,422 3,262 10.5% $121,137Home Health Aides 8,251 11,446 3,195 38.7% $28,023Childcare Workers 18,300 21,167 2,867 15.7% $21,947Maids and Housekeeping Cleaners 17,804 20,555 2,751 15.4% $22,652First‐Line Supervisors of Office and Administrative Support Workers
26,358 28,895 2,537 9.6% $57,221
Top 10 Fastest Growing Occupations in Connecticut, by net change

THE CONNECTICUT ECONOMIC DIGEST2 October 2014
ConnecticutDepartment of Labor
Connecticut Departmentof Economic andCommunity Development
THE CONNECTICUT
The Connecticut Economic Digest ispublished monthly by the ConnecticutDepartment of Labor, Office of Research, andthe Connecticut Department of Economic andCommunity Development. Its purpose is toregularly provide users with a comprehensivesource for the most current, up-to-date dataavailable on the workforce and economy of thestate, within perspectives of the region andnation.
The annual subscription is $50. Sendsubscription requests to: The ConnecticutEconomic Digest, Connecticut Department ofLabor, Office of Research, 200 Folly BrookBoulevard, Wethersfield, CT 06109-1114.Make checks payable to the ConnecticutDepartment of Labor. Back issues are $4 percopy. The Digest can be accessed free ofcharge from the DOL Web site. Articles fromThe Connecticut Economic Digest may bereprinted if the source is credited. Please sendcopies of the reprinted material to the ManagingEditor. The views expressed by the authorsare theirs alone and may not reflect those ofthe DOL or DECD.
Managing Editor: Jungmin Charles Joo
Associate Editor: Sarah C. Pilipaitis
We would like to acknowledge the contributionsof many DOL Research and DECD staff andRob Damroth to the publication of the Digest.
Catherine Smith, CommissionerRonald Angelo, Deputy CommissionerChristopher Bergstrom, Deputy Commissioner
505 Hudson StreetHartford, CT 06106-2502Phone: (860) 270-8000Fax: (860) 270-8200E-Mail: [email protected]: http://www.decd.org
Sharon Palmer, CommissionerDennis Murphy, Deputy Commissioner
Andrew Condon, Ph.D., DirectorOffice of Research200 Folly Brook BoulevardWethersfield, CT 06109-1114Phone: (860) 263-6275Fax: (860) 263-6263E-Mail: [email protected]: http://www.ctdol.state.ct.us/lmi
ECONOMIC DIGEST
383,882 (13%) have a disability.3
As the demand for home carerises, it becomes increasinglyimportant to better understand theindustry. There are numerous jobtitles that home care is reportedunder. In terms of occupationalclassifications, the key way todistinguish among them is whetheror not the in-home care provided ishealth-related versus assisting withdaily living activities. The two mainoccupational titles given are PersonalCare Aide and Home Health Aide.4
Personal Care Aide
The Occupational InformationNetwork (O*NET) gives the followingdescription of a Personal Care Aide:Assist the elderly, convalescents, orpersons with disabilities with dailyliving activities at the person’s homeor in a care facility. Duties performedat a place of residence may includekeeping house (making beds, doinglaundry, washing dishes) andpreparing meals. May provideassistance at non-residential carefacilities. May advise families, theelderly, convalescents, and personswith disabilities regarding such thingsas nutrition, cleanliness, andhousehold activities.
Employment
The primary sector that employsthis occupation in Connecticut isEducation and Health Services,comprising 96.8% of personal careaides.5 Within this sector is an
industry titled Services for theElderly and Persons with Disabilities(NAICS code 624120). This industrycomprises establishments primarilyengaged in providing nonresidentialsocial assistance services to improvethe quality of life for the elderly,persons diagnosed with mentalretardation, or persons withdisabilities. These establishmentsprovide for the welfare of these ofindividuals in such areas as daycare, nonmedical home care orhomemaker services, socialactivities, group support, andcompanionship.6
Over the past decade,Connecticut employment for thisindustry has more than tripled. Inthe first quarter of 2003, the averagemonthly employment was 4,432.Ten years later it grew to 13,665workers. The number ofestablishments in this industry hasalso experienced a sharp rise. Therewere 165 businesses reported in thisindustry in the first quarter of 2003.By 2013, the figure jumped to 359businesses in Connecticut.7
What You Need to Know If YouWant to Be a Personal Care Aide
The faster than average projectedgrowth rate of this occupation isgreat news for jobseekers interestedin this line of work. Important skillsto hold for this job are: activelistening, service orientation, criticalthinking, social perceptiveness,monitoring, speaking, coordination,writing, active learning, andinstructing. The educational
210
220
230
240
250
260
270
280
36,000
36,500
37,000
37,500
38,000
38,500
39,000
39,500
Establishm
ents
Employmen
t
Nursing Care Facilities in Connecticut
All Employees Number of Establishments

THE CONNECTICUT ECONOMIC DIGEST 3October 2014
requirements are typically a highschool diploma. Depending on theemployer, some previous experiencemay be necessary. Reliabletransportation is also highlyimportant in this field.8
Wages
As of the first quarter of 2013,the average wage of a personal careaide in Connecticut falls well belowthe statewide mean wage for alloccupations of $26.16 per hour. Thestatewide average hourly rate forpersonal care workers is $12.05,making the average annual salary$25,069. The labor market areawith the highest average wage isTorrington at $13.91 and theDanbury labor market area has thelowest earnings at $10.92 per hour.9
Regulation
In Connecticut, the Departmentof Consumer Protection overseeshomemaker-companion agencies.There are currently 449 activelyregistered homemaker-companionagencies registered with theDepartment-- a requirement to dobusiness in the state. All agenciesare mandated to conduct acomprehensive background check ofall of its employees before they arehired and have them sign a criminalhistory form. Homemaker-companion agenciesmust have a written contract orservice plan signed by both theagency and client. The contract orplan shall:
1. provide a list of the anticipatedservices to be provided by the agencyto the client, the term and cost of saidservices, a clear definition of theemployee, provider and clientemployment relationship, safeguardsfor securing personal clientinformation, a list of provider jobcategories such as “live-in” or “dailycall,” and job duties;2. contain the homemaker-companion agency policy for theacceptance of gratuities and gifts bythe homemaker-companion agency’semployees and independentcontractors on behalf of the client;and3. contain a process for the client tofile a complaint with the homemaker-companion agency. A process shall bemade available for individuals otherthan a client to file a complaint.10
Clients must be given a contactphone number and address for the
agency and an authorizedrepresentative to discuss their care.Also, each client must have a filewhere the caretaker keeps extensivedetails on the care provided. Nationally, the United StatesDepartment of Labor’s Wage andHour Division has adoptedregulations for domestic service inprivate homes under the Fair LaborStandards Act of 1935. Home healthaides and personal care assistants,also known as direct care workers,must be paid the minimum wage andovertime (over 40 hours per week)with certain exceptions. When thework is performed in Connecticut,the Connecticut minimum wagewould apply. In 2014, the minimumwage in Connecticut is $8.70,increasing to $9.15 in January 2015,$9.60 in January 2016 and $10.10in January 2017. Exceptions arethose direct care workers defined asproviding companionship servicesunder the FLSA (which Connecticuthas used since 1977 for domesticservice) or live-in domestics whowould be exempt from overtime butnot minimum wage. On January 1, 2015, third partyemployers of companions must paythe minimum wage and overtime.11
Home Health Aide
The Occupational InformationNetwork (O*NET) gives the followingdescription of a Home Health Aide:Provide routine individualizedhealthcare such as changingbandages and dressing wounds, andapplying topical medications to theelderly, convalescents, or persons withdisabilities at the patient’s home or in
Under 18 years23%
18 to 24 years9%
25 to 34 years12%35 to 44 years
14%
45 to 54 years16%
55 to 64 years12%
65 to 74 years7%
75 to 84 years5%
85 years and over2%
Age of Connecticut's Population
050100150200250300350400
02,0004,0006,0008,00010,00012,00014,00016,000
1Q20
03
4Q20
03
3Q20
04
2Q20
05
1Q20
06
4Q20
06
3Q20
07
2Q20
08
1Q20
09
4Q20
09
3Q20
10
2Q20
11
1Q20
12
4Q20
12
Establishm
ents
Employ
men
t
Connecticut's Non‐Medical Home Care Industry
Average Monthly Employment Units

THE CONNECTICUT ECONOMIC DIGEST4 October 2014
a care facility. Monitor or reportchanges in health status. May alsoprovide personal care such asbathing, dressing, and grooming ofpatient.
Employment
The primary sector that employsthis occupation in Connecticut isEducation and Health Services,comprising 98.8% of home healthaides.12 Within this sector is anindustry titled Home Health CareServices (NAICS code 621610). Thisindustry comprises establishmentsprimarily engaged in providingskilled nursing services in the home,along with a range of the following:personal care services; homemakerand companion services; physicaltherapy; medical social services;medications; medical equipment andsupplies; counseling; 24-hour homecare; occupation and vocationaltherapy; dietary and nutritionalservices; speech therapy; audiology;and high-tech care, such asintravenous therapy.13
Over the past decade,Connecticut employment for thisindustry has also been on the rise,although at a slower pace thanServices for the Elderly and Personswith Disabilities. In 2003 quarter 1,the average monthly employmentwas 12,378. By 2013 quarter 1, thefigure has increased to 13,985workers, a 13% rise. The number ofbusiness units in this industry hasexperienced a gradual rise. Therewere 177 businesses reported in thisindustry in 2003 quarter 1. As of2013 quarter 1, there are now 218business units in Connecticutreported under this industry.14
What You Need to Know If YouWant to Be a Home Health Aide
The projected growth rate of38.7% for this occupation isencouraging for jobseekers interested
in this line of work. Important skillsto hold for this job are: serviceorientation, active listening, socialperceptiveness, critical thinking,speaking, monitoring, complexproblem solving, coordination, andjudgment and decision making. Theeducational requirements aretypically a high school diploma.15
The State of Connecticut requires allhome health aides to complete anurse aide training program of noless than seventy-five hours and acompetency evaluation program.There are currently 118 approvedprograms offered throughout thestate. The following is what thetraining program covers in bothlecture and clinical settings: 1. Communication skills; 2. Observation, reporting anddocumentation of patients statusand the care or services furnished; 3. Reading and recordingtemperature, pulse and respiration; 4. Basic infection controlprocedures; 5. Basic elements of bodyfunction and changes in bodyfunction that must be reported to anaide’s supervisor; 6. Maintenance of a clean, safeand healthy environment;
7. Recognizing emergencies andknowledge of emergency procedures; 8. The physical, emotional, anddevelopmental needs of and ways towork with the populations served bythe home health care agency,including the need for respect for thepatient, his or her privacy and his orher property; 9. Appropriate and safetechniques in personal hygiene andgrooming that include: bath (bed,sponge, tub or shower), shampoo(sink, tub or bed), nail and skin care,oral hygiene, toileting andelimination; 10. Safe transfer techniques andambulation; 11. Normal range of motion andpositioning; 12. Adequate nutrition and fluidintake; and 13. Any other task that the homehealth care agency may choose tohave the homemaker-home healthaide perform. Once the training program iscomplete, the trainee must completethe competency evaluation. Underthe supervision of a registered nurse(whom must possess a minimum oftwo years nursing experience, with atleast one in home health care), theabove skills are tested throughperformance of the tasks and bywritten or oral examination.16
Depending on the employer, someprevious experience may benecessary. Reliable transportation isalso highly important in this field.
Wages
Though slightly higher than apersonal care aide, the average wage
Labor Market Area Average Annual Average Hourly Entry Level (hourly) Mid‐Range (hourly)Statewide $25,069 $12.05 $9.64 $9.94 ‐ $13.63Bridgeport‐Stamford $26,355 $12.67 $10.12 $10.43 ‐ $13.85Danbury $22,711 $10.92 $9.08 $9.37 ‐ $12.21Hartford $23,794 $11.44 $8.93 $9.32 ‐ $12.86New Haven $24,685 $11.87 $10.00 $10.21 ‐ $13.42New London‐Norwich $27,721 $13.33 $10.32 $11.14 ‐ $15.45Waterbury $24,240 $11.65 $8.85 $9.20 ‐ $13.45Torrington $28,926 $13.91 $12.76 $12.64 ‐ $14.86Danielson $23,440 $11.26 $9.70 $9.88 ‐ $11.78
Personal Care Aide
0
50
100
150
200
250
11,00011,50012,00012,50013,00013,50014,00014,50015,000
1Q20
03
4Q20
03
3Q20
04
2Q20
05
1Q20
06
4Q20
06
3Q20
07
2Q20
08
1Q20
09
4Q20
09
3Q20
10
2Q20
11
1Q20
12
4Q20
12
Establishm
ents
Employ
men
t
Connecticut's Medical Home Care Industry
Average Monthly Employment Units

THE CONNECTICUT ECONOMIC DIGEST 5October 2014
OCCUPATIONAL PROFILE: Physician Assistants
GENERAL ECONOMIC INDICATORS
Sources: *The Connecticut Economy, University of Connecticut **Farmington Bank ***Federal Reserve Bank of Philadelphia
The Connecticut Economy's General Drift Indicators are composite measures of the four-quarter change in three coincident (Connecticut Manufacturing ProductionIndex, nonfarm employment, and real personal income) and four leading (housing permits, manufacturing average weekly hours, Hartford help-wanted advertising, andinitial unemployment claims) economic variables, and are indexed so 1986 = 100.
The Farmington Bank Business Barometer is a measure of overall economic growth in the state of Connecticut that is derived from non-manufacturing employment,real disposable personal income, and manufacturing production.
The Philadelphia Fed’s Coincident Index summarizes current economic condition by using four coincident variables: nonfarm payroll employment, average hoursworked in manufacturing, the unemployment rate, and wage and salary disbursements deflated by the consumer price index (U.S. city average).
2Q 2Q CHANGE 1Q(Seasonally adjusted) 2014 2013 NO. % 2014General Drift Indicator (1986=100)* Leading 109.7 106.9 2.8 2.6 111.5 Coincident 109.7 109.3 0.4 0.4 109.6Farmington Bank Business Barometer (1992=100)** 127.6 127.0 0.6 0.5 127.5
Philadelphia Fed's Coincident Index (July 1992=100)*** AUG AUG JUL(Seasonally adjusted) 2014 2013 2014 Connecticut 156.84 152.42 4.42 2.9 156.59 United States 157.71 153.10 4.61 3.0 157.36
of a home health aide in Connecticutis still well below the statewide meanwage for all occupations of $26.16per hour. The average hourly ratestatewide for home health aides is$14.09, making the average annualsalary $29,300. The labor marketarea with the highest average wage isDanielson at $16.90 and the NewHaven labor market area has thelowest earnings at $12.89 per hour.17
Regulation
In Connecticut, the Departmentof Public Health oversees homehealth care agencies. There arecurrently 104 licensed home healthcare agencies registered with theDepartment- a requirement in orderto do business in the state. ThePublic Health Code of the State ofConnecticut details extensiveregulations that all of the agenciesmust abide by. They covereverything from services performedto personnel specifications. As far asthe employees are concerned, the
agencies are required to keeprecords that at a minimum include: 1. Educational preparation andwork experience; 2. Current licensure, registrationor certification; 3. Written performanceevaluations; 4. Signed contract or letter ofappointment specifying conditions ofemployment; and 5. Record of healthexaminations.18
At the national and state level,home health aides are covered underthe same regulations as personalcare aides.
Conclusion
The home care industry is on therise in Connecticut. The PersonalCare Aide and Home Health Aideoccupations lead the long-termprojections in both net change andpercent change. The increasingdemand for home services will createmany job openings over the next ten
years. The challenge ahead will beto maintain a supply of workers forthis field that pays lower thanaverage and is highly regulated.
______________________1 Connecticut Department of Labor,Occupational Projections2 Connecticut Department of Labor,Quarterly Census of Employment andWages (QCEW)3 United States Census Bureau, 2010Census4 National Center for O*NET Development5 Connecticut Department of Labor,Occupational Employment and Wages6 United States Census Bureau7 Connecticut Department of Labor,QCEW8 National Center for O*NET Development9 Connecticut Department of Labor,Occupational Employment and Wages10 State of Connecticut Department ofConsumer Protection11 United States and ConnecticutDepartment of Labor, Wage and HourDivision12 Connecticut Department of Labor,Occupational Employment and Wages13 United States Census Bureau14 Connecticut Department of Labor,QCEW15 National Center for O*NETDevelopment16 State of Connecticut Department ofPublic Health17 Connecticut Department of Labor,Occupational Employment and Wages18 State of Connecticut Department ofPublic Health
Labor Market Area Average Annual Average Hourly Entry Level (hourly) Mid‐Range (hourly)Statewide $29,300 $14.09 $10.29 $11.25 ‐ $16.23Bridgeport‐Stamford $29,644 $14.25 $10.01 $10.58 ‐ $16.75Danbury $27,428 $13.19 $10.17 $11.50 ‐ $15.06Hartford $30,110 $14.47 $10.81 $12.03 ‐ $17.02New Haven $26,820 $12.89 $10.59 $11.17 ‐ $14.27New London‐Norwich $26,861 $12.91 $8.89 $9.30 ‐ $14.48Waterbury $32,579 $15.67 $11.50 $12.10 ‐ $16.86Torrington $32,488 $15.62 $12.87 $12.94 ‐ $18.29Danielson $35,160 $16.90 $13.29 $14.68 ‐ $19.54
Home Health Aide

THE CONNECTICUT ECONOMIC DIGEST6 October 2014
EMPLOYMENT BY INDUSTRY SECTOR
INCOME
Initial claims forunemployment insurance
decreased from a yearago.
UNEMPLOYMENT
The production workerweekly earnings rose
over the year.
MANUFACTURING ACTIVITY
ECONOMIC INDICATORSTotal nonfarm
employment increasedover the year.
Personal income for firstquarter 2015 is
forecasted to increase 3.2percent from a year
earlier.
Source: Connecticut Department of Labor * Includes Native American tribal government employment
Sources: Connecticut Department of Labor; U.S. Bureau of Labor Statistics
Sources: Connecticut Department of Labor; U.S. Department of Energy*Latest two months are forecasted.
Source: Bureau of Economic Analysis*Forecasted by Connecticut Department of Labor
(Seasonally adjusted) 1Q* 1Q CHANGE 4Q*(Annualized; $ Millions) 2015 2014 NO. % 2014Personal Income $228,698 $221,513 7,185 3.2 $226,552UI Covered Wages $104,604 $102,217 2,387 2.3 $104,256
AUG AUG CHANGE JUL JUN(Not seasonally adjusted) 2014 2013 NO. % 2014 2014Production Worker Avg Weekly Hours 40.2 41.8 -1.6 -3.8 40.6 --Prod. Worker Avg Hourly Earnings 22.41 21.23 1.18 5.6 21.87 --Prod. Worker Avg Weekly Earnings 900.88 887.41 13.47 1.5 887.92 --CT Mfg. Production Index (2005=100) 97.7 98.5 -0.8 -0.8 91.8 93.2 Production Worker Hours (000s) 4,020 4,091 -71 -1.7 3,995 -- Industrial Electricity Sales (mil kWh)* 314 325 -11.1 -3.4 289 295
AUG AUG CHANGE JUL(Seasonally adjusted; 000s) 2014 2013 NO. % 2014TOTAL NONFARM 1,665.3 1,659.7 5.6 0.3 1,668.9 Natural Res & Mining 0.6 0.6 0.0 0.0 0.6 Construction 57.0 54.0 3.0 5.6 56.0 Manufacturing 164.1 163.5 0.6 0.4 162.7 Trade, Transportation & Utilities 303.8 299.4 4.4 1.5 303.0 Information 31.4 32.1 -0.7 -2.2 31.5 Financial Activities 130.7 131.0 -0.3 -0.2 130.6 Professional and Business Services 205.6 207.0 -1.4 -0.7 207.1 Education and Health Services 325.2 322.4 2.8 0.9 326.3 Leisure and Hospitality 150.4 147.3 3.1 2.1 151.4 Other Services 63.5 62.0 1.5 2.4 62.7 Government* 233.0 240.4 -7.4 -3.1 237.0
STATE
AUG AUG CHANGE JUL(Seasonally adjusted) 2014 2013 NO. % 2014Unemployment Rate, resident (%) 6.6 7.8 -1.2 --- 6.6Labor Force, resident (000s) 1,870.4 1,856.8 13.6 0.7 1,872.1 Employed (000s) 1,747.0 1,711.3 35.7 2.1 1,749.3 Unemployed (000s) 123.5 145.5 -22.0 -15.1 122.8Average Weekly Initial Claims 4,052 4,585 -532 -11.6 4,311Avg. Insured Unemp. Rate (%) 3.12 3.26 -0.14 --- 2.93
2Q2014 2Q2013 1Q2014U-6 Rate (%) 13.2 14.6 -1.4 --- 13.6

THE CONNECTICUT ECONOMIC DIGEST 7October 2014
TOURISM AND TRAVEL
ECONOMIC INDICATORSBUSINESS ACTIVITY New auto registrations
fell over the year.
Indian gaming slots fell overthe year.
BUSINESS STARTS AND TERMINATIONS Net business formation, asmeasured by starts minusstops registered with theSecretary of the State, wasup over the year.
STATE REVENUES
Sources: Connecticut Department of Economic and Community Development; U.S. Department of Energy,Energy Information Administration; Connecticut Department of Revenue Services; F.W. Dodge;Connecticut Department of Motor Vehicles; Connecticut Department of Transportation, Bureau ofAviation and Ports
* Estimated by the Bureau of the Census
Sources: Connecticut Secretary of the State; Connecticut Department of Labor
AUG AUG % % (Millions of dollars) 2014 2013 CHG CURRENT PRIOR CHGTOTAL ALL REVENUES* 658.9 688.6 -4.3 11,163.1 11,660.7 -4.3 Corporate Tax 34.3 18.1 89.5 460.2 515.0 -10.6 Personal Income Tax 284.1 329.0 -13.7 6,141.1 6,284.0 -2.3 Real Estate Conv. Tax 13.2 11.4 16.0 119.4 105.3 13.4 Sales & Use Tax 217.9 217.7 0.1 2,631.0 2,603.4 1.1 Indian Gaming Payments** 26.1 26.9 -3.0 186.4 198.2 -5.9
YEAR TO DATE
Sources: Connecticut Department of Revenue Services; Division of Special Revenue*Includes all sources of revenue; Only selected sources are displayed; Most July receipts arecredited to the prior fiscal year and are not shown. **See page 23 for explanation.
Sources: Connecticut Department of Transportation, Bureau of Aviation and Ports; ConnecticutCommission on Culture and Tourism; Division of Special Revenue
*See page 23 for explanation **The Connecticut Economy, University of Connecticut
Y/Y % YEAR TO DATE % MONTH LEVEL CHG CURRENT PRIOR CHG
Info Center Visitors AUG 2014 51,308 9.1 221,339 182,892 21.0Major Attraction Visitors AUG 2014 274,679 2.7 1,195,126 1,224,561 -2.4Air Passenger Count AUG 2014 NA NA NA NA NAIndian Gaming Slots (Mil.$)* AUG 2014 1,239.4 -3.7 8,902.3 9,435.4 -5.6Travel and Tourism Index** 2Q 2014 --- -0.9 --- --- ---
Y/Y % %MO/QTR LEVEL CHG CURRENT PRIOR CHG
STARTS Secretary of the State AUG 2014 2,097 13.8 18,057 17,683 2.1 Department of Labor 4Q2013 1,483 -5.0 7,492 7,997 -6.3TERMINATIONS Secretary of the State AUG 2014 736 -57.2 6,239 9,162 -31.9 Department of Labor 4Q2013 2,067 -27.0 6,831 8,041 -15.0
YEAR TO DATE
STATE
Total all revenues were downfrom a year ago.
Y/Y % YEAR TO DATE % MONTH LEVEL CHG CURRENT PRIOR CHG
New Housing Permits* AUG 2014 419 -53.5 3,766 4,222 -10.8Electricity Sales (mil kWh) JUL 2014 2,754 -10.5 17,591 17,507 0.5Construction Contracts Index (1980=100) AUG 2014 246.6 -48.0 --- --- ---New Auto Registrations AUG 2014 19,028 -8.5 127,376 131,722 -3.3Air Cargo Tons (000s) AUG 2014 NA NA NA NA NAExports (Bil. $) 2Q 2014 3.97 -7.6 8.09 8.50 -4.8S&P 500: Monthly Close AUG 2014 2,003.37 22.7 --- --- ---

THE CONNECTICUT ECONOMIC DIGEST8 October 2014
CONSUMER NEWS
EMPLOYMENT COST INDEXCompensation cost for thenation rose 2.0 percent
over the year.
Conventional mortgagerate fell to 4.12 percent
over the month.
INTEREST RATES
ECONOMIC INDICATORS
U.S. inflation rateincreased 1.7 percent
over the year.
Source: U.S. Department of Labor, Bureau of Labor Statistics
Sources: U.S. Department of Labor, Bureau of Labor Statistics; The Conference Board*Change over prior monthly or quarterly period**The Boston CPI can be used as a proxy for New England and is measured every other month.
Sources: Federal Reserve; Federal Home Loan Mortgage Corp.
AUG JUL AUG(Percent) 2014 2014 2013Prime 3.25 3.25 3.25Federal Funds 0.09 0.09 0.083 Month Treasury Bill 0.03 0.03 0.046 Month Treasury Bill 0.05 0.06 0.071 Year Treasury Note 0.11 0.11 0.133 Year Treasury Note 0.93 0.97 0.70
5 Year Treasury Note 1.63 1.70 1.527 Year Treasury Note 2.08 2.17 2.1510 Year Treasury Note 2.42 2.54 2.7420 Year Treasury Note 2.94 3.07 3.49Conventional Mortgage 4.12 4.13 4.46
Seasonally Adjusted Not Seasonally AdjustedPrivate Industry Workers JUN MAR 3-Mo JUN JUN 12-Mo(Dec. 2005 = 100) 2014 2014 % Chg 2014 2013 % ChgUNITED STATES TOTAL 120.9 119.9 0.8 121.0 118.6 2.0 Wages and Salaries 120.2 119.3 0.8 120.3 118.1 1.9 Benefit Costs 122.5 121.2 1.1 122.7 119.8 2.4
NORTHEAST TOTAL --- --- --- 121.8 119.4 2.0 Wages and Salaries --- --- --- 120.6 118.4 1.9
STATE
(Not seasonally adjusted) MO/QTR LEVEL Y/Y P/P*CONSUMER PRICES CPI-U (1982-84=100) U.S. City Average AUG 2014 237.852 1.7 -0.2 Purchasing Power of $ (1982-84=$1.00) AUG 2014 0.420 -1.7 0.2 Northeast Region AUG 2014 253.185 1.3 -0.3 NY-Northern NJ-Long Island AUG 2014 261.075 1.3 -0.2 Boston-Brockton-Nashua** JUL 2014 255.296 1.7 0.0 CPI-W (1982-84=100) U.S. City Average AUG 2014 234.030 1.6 -0.2
% CHANGE

THE CONNECTICUT ECONOMIC DIGEST 9October 2014
UNEMPLOYMENT RATES
LABOR FORCE
NONFARM EMPLOYMENT
All nine states showed adecrease in its unem-ployment rate over theyear.
All nine states in theregion gained jobs overthe year.
Three states postedincreases in the laborforce from last year.
COMPARATIVE REGIONAL DATA
Source: U.S. Department of Labor, Bureau of Labor Statistics
Source: U.S. Department of Labor, Bureau of Labor Statistics
Source: U.S. Department of Labor, Bureau of Labor Statistics
AUG AUG CHANGE JUL(Seasonally adjusted; 000s) 2014 2013 NO. % 2014Connecticut 1,665.3 1,659.7 5.6 0.3 1,668.9Maine 611.3 603.2 8.1 1.3 609.9Massachusetts 3,415.2 3,360.9 54.3 1.6 3,420.5New Hampshire 642.9 640.2 2.7 0.4 647.7New Jersey 3,949.5 3,946.5 3.0 0.1 3,950.4New York 9,043.0 8,933.2 109.8 1.2 9,039.9Pennsylvania 5,792.7 5,745.7 47.0 0.8 5,792.6Rhode Island 477.9 472.2 5.7 1.2 477.8Vermont 306.7 305.4 1.3 0.4 306.8United States 139,118.0 136,636.0 2,482.0 1.8 138,976.0
AUG AUG CHANGE JUL(Seasonally adjusted; 000s) 2014 2013 NO. % 2014Connecticut 1,870.4 1,856.8 13.6 0.7 1,872.1Maine 705.0 709.6 -4.6 -0.6 706.8Massachusetts 3,517.0 3,486.0 31.0 0.9 3,511.2New Hampshire 740.4 741.2 -0.8 -0.1 743.8New Jersey 4,495.3 4,528.0 -32.7 -0.7 4,494.4New York 9,554.4 9,635.4 -81.0 -0.8 9,598.7Pennsylvania 6,343.6 6,449.2 -105.6 -1.6 6,372.1Rhode Island 556.5 554.4 2.1 0.4 556.5Vermont 350.2 350.9 -0.7 -0.2 351.0United States 155,959.0 155,435.0 524.0 0.3 156,023.0
AUG AUG JUL(Seasonally adjusted) 2014 2013 CHANGE 2014Connecticut 6.6 7.8 -1.2 6.6Maine 5.6 6.7 -1.1 5.5Massachusetts 5.8 7.2 -1.4 5.6New Hampshire 4.4 5.3 -0.9 4.4New Jersey 6.6 8.1 -1.5 6.5New York 6.4 7.7 -1.3 6.6Pennsylvania 5.8 7.4 -1.6 5.7Rhode Island 7.7 9.6 -1.9 7.7Vermont 4.1 4.5 -0.4 3.7United States 6.1 7.2 -1.1 6.2
STATE

THE CONNECTICUT ECONOMIC DIGEST10 October 2014
ECONOMIC INDICATOR TRENDSSTATE
NONFARM EMPLOYMENT (Seasonally adjusted) Month 2012 2013 2014Jan 1,637.2 1,649.2 1,652.6
Feb 1,639.9 1,643.1 1,654.0
Mar 1,643.0 1,649.5 1,658.0
Apr 1,636.9 1,653.3 1,659.7
May 1,636.5 1,653.0 1,665.7
Jun 1,639.5 1,662.1 1,667.9
Jul 1,639.1 1,661.1 1,668.9
Aug 1,640.9 1,659.7 1,665.3
Sep 1,641.8 1,653.1
Oct 1,643.1 1,658.8
Nov 1,645.6 1,661.4
Dec 1,645.1 1,663.5
UNEMPLOYMENT RATE (Seasonally adjusted) Month 2012 2013 2014Jan 8.2 8.0 7.2
Feb 8.1 7.9 7.0
Mar 8.1 7.8 7.0
Apr 8.2 7.8 6.9
May 8.3 7.8 6.9
Jun 8.4 7.9 6.7
Jul 8.5 7.9 6.6
Aug 8.5 7.8 6.6
Sep 8.4 7.7
Oct 8.3 7.6
Nov 8.2 7.5
Dec 8.1 7.4
LABOR FORCE (Seasonally adjusted) Month 2012 2013 2014Jan 1,895.3 1,873.3 1,852.2
Feb 1,893.6 1,870.5 1,857.9
Mar 1,892.6 1,868.1 1,864.8
Apr 1,891.3 1,866.3 1,868.6
May 1,889.7 1,864.5 1,877.6
Jun 1,888.0 1,862.3 1,878.5
Jul 1,886.4 1,859.7 1,872.1
Aug 1,884.8 1,856.8 1,870.4
Sep 1,883.3 1,853.7
Oct 1,881.6 1,850.6
Nov 1,879.2 1,847.9
Dec 1,876.3 1,845.8
AVERAGE WEEKLY INITIAL CLAIMS (Seasonally adjusted) Month 2012 2013 2014Jan 4,953 4,884 4,442
Feb 4,547 4,669 3,775
Mar 4,979 4,452 4,089
Apr 4,789 4,823 4,412
May 4,958 4,672 4,150
Jun 5,312 4,602 4,556
Jul 4,787 5,220 4,311
Aug 4,959 4,585 4,052
Sep 4,878 4,598
Oct 4,832 4,805
Nov 7,601 4,786
Dec 4,824 5,054
1.0
3.0
5.0
7.0
9.0
11.0
00 01 02 03 04 05 06 07 08 09 10 11 12 13 14
Per
cent
1,500
1,540
1,580
1,620
1,660
1,700
1,740
00 01 02 03 04 05 06 07 08 09 10 11 12 13 14
Tho
usan
ds
2,000
3,000
4,000
5,000
6,000
7,000
8,000
9,000
10,000
00 01 02 03 04 05 06 07 08 09 10 11 12 13 14
1,700
1,740
1,780
1,820
1,860
1,900
1,940
00 01 02 03 04 05 06 07 08 09 10 11 12 13 14
Tho
usan
ds

THE CONNECTICUT ECONOMIC DIGEST 11October 2014
ECONOMIC INDICATOR TRENDS STATE
REAL AVG MANUFACTURING HOURLY EARNINGS (Not seasonally adjusted) Month 2012 2013 2014Jan $11.17 $9.97 $9.35
Feb $11.07 $9.83 $9.46
Mar $11.00 $9.72 $9.29
Apr $10.94 $9.67 $9.38
May $10.70 $9.52 $9.28
Jun $10.61 $9.49 $9.25
Jul $10.53 $9.28 $9.33
Aug $10.37 $9.22 $9.58
Sep $10.22 $9.24
Oct $10.11 $9.31
Nov $10.16 $9.35
Dec $10.05 $9.42
AVG MANUFACTURING WEEKLY HOURS (Not seasonally adjusted) Month 2012 2013 2014Jan 40.1 40.5 42.0
Feb 40.5 40.0 40.3
Mar 40.5 40.7 41.4
Apr 40.5 40.8 40.0
May 40.5 40.6 40.4
Jun 40.8 41.1 41.4
Jul 40.4 40.8 40.6
Aug 40.0 41.8 40.2
Sep 39.9 41.5
Oct 40.1 40.9
Nov 40.8 42.0
Dec 41.0 41.9
CT MANUFACTURING PRODUCTION INDEX (NSA, 12 MMA) Month 2012 2013 2014Jan 91.3 90.3 88.8
Feb 91.1 90.0 89.5
Mar 91.0 89.7 89.7
Apr 91.4 89.8 89.5
May 90.9 89.5 89.5
Jun 91.0 89.2 89.7
Jul 90.9 89.2 89.3
Aug 91.1 88.7 89.2
Sep 90.9 88.7
Oct 91.0 88.9
Nov 90.6 88.4
Dec 90.6 88.6
SECRETARY OF STATE'S NET BUSINESS STARTS (NSA, 12 MMA) Month 2012 2013 2014Jan 1,137 1,273 896
Feb 1,175 1,229 886
Mar 1,190 1,184 947
Apr 1,197 1,190 955
May 1,205 1,198 962
Jun 1,208 1,199 978
Jul 1,229 1,117 1,071
Aug 1,237 1,010 1,174
Sep 1,230 966
Oct 1,249 951
Nov 1,262 932
Dec 1,285 900
38
39
40
41
42
43
44
00 01 02 03 04 05 06 07 08 09 10 11 12 13 14
8.0
8.5
9.0
9.5
10.0
10.5
11.0
11.5
12.0
00 01 02 03 04 05 06 07 08 09 10 11 12 13 14
1982
-84
Dol
lars
80
85
90
95
100
105
110
115
120
00 01 02 03 04 05 06 07 08 09 10 11 12 13 14
2005
=100
500
700
900
1,100
1,300
1,500
1,700
1,900
00 01 02 03 04 05 06 07 08 09 10 11 12 13 14

THE CONNECTICUT ECONOMIC DIGEST12 October 2014
Not Seasonally Adjusted
AUG AUG CHANGE JUL2014 2013 NO. % 2014
TOTAL NONFARM EMPLOYMENT…………… 1,656,100 1,648,700 7,400 0.4 1,667,300TOTAL PRIVATE………………………………… 1,438,600 1,424,800 13,800 1.0 1,447,800 GOODS PRODUCING INDUSTRIES………… 226,400 222,100 4,300 1.9 224,200 CONSTRUCTION, NAT. RES. & MINING.…… 61,300 57,800 3,500 6.1 60,100 MANUFACTURING…………………………… 165,100 164,300 800 0.5 164,100 Durable Goods………………………………… 126,500 127,700 -1,200 -0.9 125,500 Fabricated Metal……………………………… 30,600 30,200 400 1.3 30,400 Machinery…………………………………… 14,000 14,200 -200 -1.4 14,100 Computer and Electronic Product………… 12,200 12,700 -500 -3.9 12,200 Transportation Equipment . . . . . . . . . . . . . . 41,300 41,500 -200 -0.5 41,400 Aerospace Product and Parts…………… 28,600 28,800 -200 -0.7 28,300 Non-Durable Goods………………………… 38,600 36,600 2,000 5.5 38,600 Chemical……………………………………… 11,400 11,300 100 0.9 11,500 SERVICE PROVIDING INDUSTRIES………… 1,429,700 1,426,600 3,100 0.2 1,443,100 TRADE, TRANSPORTATION, UTILITIES….. 300,000 295,400 4,600 1.6 300,900 Wholesale Trade……………………………… 65,600 63,400 2,200 3.5 65,400 Retail Trade…………………………………… 183,600 183,800 -200 -0.1 184,000 Motor Vehicle and Parts Dealers…………… 20,900 20,600 300 1.5 20,900 Building Material……………………………… 15,800 15,400 400 2.6 16,300 Food and Beverage Stores………………… 45,400 44,200 1,200 2.7 45,500 General Merchandise Stores……………… 27,600 28,000 -400 -1.4 27,800 Transportation, Warehousing, & Utilities…… 50,800 48,200 2,600 5.4 51,500 Utilities………………………………………… 7,500 7,600 -100 -1.3 7,600 Transportation and Warehousing………… 43,300 40,600 2,700 6.7 43,900 INFORMATION………………………………… 31,700 32,400 -700 -2.2 31,700 Telecommunications………………………… 9,200 9,100 100 1.1 9,300 FINANCIAL ACTIVITIES……………………… 131,100 132,400 -1,300 -1.0 131,400 Finance and Insurance……………………… 111,600 112,900 -1,300 -1.2 111,900 Credit Intermediation………………………… 26,500 26,800 -300 -1.1 26,600 Securities and Commodity Contracts……… 25,300 26,100 -800 -3.1 25,500 Insurance Carriers & Related Activities…… 59,800 60,000 -200 -0.3 59,800 Real Estate and Rental and Leasing……… 19,500 19,500 0 0.0 19,500 PROFESSIONAL & BUSINESS SERVICES 208,100 208,100 0 0.0 209,800 Professional, Scientific……………………… 91,300 90,400 900 1.0 92,400 Legal Services……………………………… 13,300 13,100 200 1.5 13,300 Computer Systems Design………………… 23,100 23,200 -100 -0.4 23,100 Management of Companies………………… 28,900 29,600 -700 -2.4 29,000 Administrative and Support………………… 87,900 88,100 -200 -0.2 88,400 Employment Services……………………… 26,100 28,500 -2,400 -8.4 26,100 EDUCATION AND HEALTH SERVICES…… 318,800 315,000 3,800 1.2 322,900 Educational Services………………………… 56,600 56,300 300 0.5 58,900 Health Care and Social Assistance………… 262,200 258,700 3,500 1.4 264,000 Hospitals……………………………………… 61,000 61,600 -600 -1.0 61,200 Nursing & Residential Care Facilities……… 62,600 62,200 400 0.6 62,800 Social Assistance…………………………… 50,500 50,100 400 0.8 51,600 LEISURE AND HOSPITALITY………………… 158,500 156,300 2,200 1.4 163,200 Arts, Entertainment, and Recreation………… 30,000 30,900 -900 -2.9 32,500 Accommodation and Food Services………… 128,500 125,400 3,100 2.5 130,700 Food Serv., Restaurants, Drinking Places… 115,800 112,400 3,400 3.0 118,000 OTHER SERVICES…………………………… 64,000 63,100 900 1.4 63,700 GOVERNMENT ………………………………… 217,500 223,900 -6,400 -2.9 219,500 Federal Government………………………… 17,400 17,400 0 0.0 17,300 State Government……………………………. 60,800 63,400 -2,600 -4.1 61,200 Local Government**…………………………… 139,300 143,100 -3,800 -2.7 141,000
CONNECTICUT
NONFARM EMPLOYMENT ESTIMATES
Current month’s data are preliminary. Prior months’ data have been revised. All data are benchmarked to March 2013. *Total excludes workers idled due to labor-management disputes. **Includes Indian tribal government employment.
STATE

THE CONNECTICUT ECONOMIC DIGEST 13October 2014
DANBURY LMA
BRIDGEPORT -STAMFORD LMA
NONFARM EMPLOYMENT ESTIMATES
Current month’s data are preliminary. Prior months’ data have been revised. All data are benchmarked to March 2013. *Total excludes workers idled due to labor-management disputes.
LMA
Not Seasonally Adjusted
AUG AUG CHANGE JUL2014 2013 NO. % 2014
TOTAL NONFARM EMPLOYMENT…………… 419,700 412,800 6,900 1.7 426,400TOTAL PRIVATE………………………………… 377,000 369,900 7,100 1.9 382,400 GOODS PRODUCING INDUSTRIES………… 47,300 46,200 1,100 2.4 47,400 CONSTRUCTION, NAT. RES. & MINING.…… 12,800 12,600 200 1.6 12,700 MANUFACTURING…………………………… 34,500 33,600 900 2.7 34,700 Durable Goods………………………………… 24,700 25,000 -300 -1.2 24,600 SERVICE PROVIDING INDUSTRIES………… 372,400 366,600 5,800 1.6 379,000 TRADE, TRANSPORTATION, UTILITIES….. 74,200 71,600 2,600 3.6 74,400 Wholesale Trade……………………………… 13,800 13,700 100 0.7 13,800 Retail Trade…………………………………… 49,600 48,200 1,400 2.9 49,700 Transportation, Warehousing, & Utilities…… 10,800 9,700 1,100 11.3 10,900 INFORMATION………………………………… 12,100 12,100 0 0.0 12,100 FINANCIAL ACTIVITIES……………………… 41,500 42,300 -800 -1.9 41,400 Finance and Insurance……………………… 34,600 35,900 -1,300 -3.6 34,400 Credit Intermediation………………………… 10,100 10,100 0 0.0 10,100 Securities and Commodity Contracts……… 17,100 18,300 -1,200 -6.6 17,300 PROFESSIONAL & BUSINESS SERVICES 71,500 68,600 2,900 4.2 72,200 Professional, Scientific……………………… 29,700 29,800 -100 -0.3 29,900 Administrative and Support………………… 28,600 25,900 2,700 10.4 28,900 EDUCATION AND HEALTH SERVICES…… 68,700 69,000 -300 -0.4 70,400 Health Care and Social Assistance………… 58,400 58,700 -300 -0.5 59,500 LEISURE AND HOSPITALITY………………… 43,400 42,700 700 1.6 46,300 Accommodation and Food Services………… 32,200 30,900 1,300 4.2 34,000 OTHER SERVICES…………………………… 18,300 17,400 900 5.2 18,200 GOVERNMENT ………………………………… 42,700 42,900 -200 -0.5 44,000 Federal………………………………………… 2,500 2,500 0 0.0 2,500 State & Local…………………………………… 40,200 40,400 -200 -0.5 41,500
Not Seasonally Adjusted
AUG AUG CHANGE JUL2014 2013 NO. % 2014
TOTAL NONFARM EMPLOYMENT…………… 68,800 68,300 500 0.7 69,400TOTAL PRIVATE………………………………… 61,300 61,100 200 0.3 61,600 GOODS PRODUCING INDUSTRIES………… 12,000 11,800 200 1.7 12,000 SERVICE PROVIDING INDUSTRIES………… 56,800 56,500 300 0.5 57,400 TRADE, TRANSPORTATION, UTILITIES….. 15,900 15,800 100 0.6 16,100 Retail Trade…………………………………… 11,700 12,100 -400 -3.3 11,700 PROFESSIONAL & BUSINESS SERVICES 7,700 7,900 -200 -2.5 7,700 LEISURE AND HOSPITALITY………………… 6,900 6,800 100 1.5 7,100 GOVERNMENT ………………………………… 7,500 7,200 300 4.2 7,800 Federal………………………………………… 600 600 0 0.0 600 State & Local…………………………………… 6,900 6,600 300 4.5 7,200

THE CONNECTICUT ECONOMIC DIGEST14 October 2014
HARTFORD LMA
NONFARM EMPLOYMENT ESTIMATESLMA
SEASONALLY ADJUSTED TOTAL NONFARM EMPLOYMENT
Current month’s data are preliminary. Prior months’ data have been revised. All data are benchmarked to March 2013. *Total excludes workers idled due to labor-management disputes.
Not Seasonally Adjusted
AUG AUG CHANGE JUL2014 2013 NO. % 2014
TOTAL NONFARM EMPLOYMENT…………… 546,500 542,600 3,900 0.7 549,200TOTAL PRIVATE………………………………… 471,100 465,900 5,200 1.1 472,100 GOODS PRODUCING INDUSTRIES………… 77,100 76,100 1,000 1.3 76,200 CONSTRUCTION, NAT. RES. & MINING.…… 21,200 19,600 1,600 8.2 20,400 MANUFACTURING…………………………… 55,900 56,500 -600 -1.1 55,800 Durable Goods………………………………… 46,300 47,000 -700 -1.5 46,100 Non-Durable Goods………………………… 9,600 9,500 100 1.1 9,700 SERVICE PROVIDING INDUSTRIES………… 469,400 466,500 2,900 0.6 473,000 TRADE, TRANSPORTATION, UTILITIES….. 88,700 87,300 1,400 1.6 88,100 Wholesale Trade……………………………… 18,200 18,100 100 0.6 18,200 Retail Trade…………………………………… 54,900 54,500 400 0.7 54,100 Transportation, Warehousing, & Utilities…… 15,600 14,700 900 6.1 15,800 Transportation and Warehousing………… 12,900 11,900 1,000 8.4 13,100 INFORMATION………………………………… 11,100 11,400 -300 -2.6 11,100 FINANCIAL ACTIVITIES……………………… 59,200 59,500 -300 -0.5 59,400 Depository Credit Institutions……………… 6,100 6,400 -300 -4.7 6,200 Insurance Carriers & Related Activities…… 39,000 39,800 -800 -2.0 39,000 PROFESSIONAL & BUSINESS SERVICES 63,600 65,200 -1,600 -2.5 64,200 Professional, Scientific……………………… 31,400 30,600 800 2.6 31,500 Management of Companies………………… 7,500 7,800 -300 -3.8 7,500 Administrative and Support………………… 24,700 26,800 -2,100 -7.8 25,200 EDUCATION AND HEALTH SERVICES…… 100,200 98,400 1,800 1.8 100,300 Educational Services………………………… 12,100 11,900 200 1.7 12,300 Health Care and Social Assistance………… 88,100 86,500 1,600 1.8 88,000 Ambulatory Health Care…………………… 28,300 27,900 400 1.4 28,100 LEISURE AND HOSPITALITY………………… 49,000 47,000 2,000 4.3 51,000 Accommodation and Food Services………… 39,400 38,000 1,400 3.7 40,300 OTHER SERVICES…………………………… 22,200 21,000 1,200 5.7 21,800 GOVERNMENT ………………………………… 75,400 76,700 -1,300 -1.7 77,100 Federal………………………………………… 5,200 5,000 200 4.0 5,200 State & Local…………………………………… 70,200 71,700 -1,500 -2.1 71,900
Seasonally AdjustedAUG AUG CHANGE JUL
Labor Market Areas 2014 2013 NO. % 2014 BRIDGEPORT-STAMFORD LMA……………… 418,800 412,200 6,600 1.6 420,100 DANBURY LMA………………………………. 69,400 68,900 500 0.7 69,800 HARTFORD LMA………………………………. 553,900 549,900 4,000 0.7 552,900 NEW HAVEN LMA……………………………… 278,100 275,200 2,900 1.1 279,600 NORWICH-NEW LONDON LMA……………… 125,300 127,800 -2,500 -2.0 125,200 WATERBURY LMA……………………………… 64,700 64,300 400 0.6 64,800

THE CONNECTICUT ECONOMIC DIGEST 15October 2014
AUG AUG JUL(Seasonally adjusted) 2014 2013 2014CT Vacancies (000s) 72.9 67.3 70.7 Hartford Vac. (000s) 28.1 25.7 27.4
Connecticut 3.89 3.62 3.78 Hartford 4.77 4.38 4.65
United States 3.34 3.18 3.23Maine 3.99 3.14 3.91Massachusetts 4.48 4.26 4.25New Hampshire 4.20 3.57 3.96Rhode Island 3.79 3.44 3.62Vermont 3.90 3.32 3.77
Labor Demand Rate *
NEW HAVEN LMA
NONFARM EMPLOYMENT ESTIMATES
Current month’s data are preliminary. Prior months’ data have been revised. All data are benchmarked to March 2013. *Total excludes workers idled due to labor-management disputes. **Value less than 50
LMA
HELP WANTED ONLINE
* A percent of advertised vacancies per 100 persons in labor forceSource: The Conference Board
CT Online Labor DemandRose 2,200 in AugustThe Conference Board’s HelpWanted OnLine (HWOL) datareported that there were 72,900advertisements for Connecticut-based jobs in August 2014, a 3.1percent increase over the monthand a 8.3 percent increase over theyear. There were 3.89 advertisedvacancies for every 100 persons inConnecticut’s labor force, higherthan a year ago and a month ago.Hartford’s labor demand rate of 4.77was also higher than both a yearago and a month ago. Nationally, itwas 3.34 percent. Among the NewEngland states, Massachusetts hadthe highest vacancy rate, whileRhode Island had the lowestvacancy rate in August.
The Conference Board Help Wanted OnLine® Data Series (HWOL) measures the number ofnew, first-time online jobs and jobs reposted from the previous month for over 16,000 Internet jobboards, corporate boards and smaller job sites that serve niche markets and smaller geographicareas. Background information and technical notes and discussion of revisions to the series areavailable at: www.conference-board.org/data/helpwantedonline.cfm.
Not Seasonally Adjusted
AUG AUG CHANGE JUL2014 2013 NO. % 2014
TOTAL NONFARM EMPLOYMENT…………… 273,800 269,900 3,900 1.4 277,400 TOTAL PRIVATE………………………………… 245,300 241,100 4,200 1.7 247,800 GOODS PRODUCING INDUSTRIES………… 35,800 35,700 100 0.3 35,800 CONSTRUCTION, NAT. RES. & MINING.…… 10,200 9,900 300 3.0 10,100 MANUFACTURING…………………………… 25,600 25,800 -200 -0.8 25,700 Durable Goods………………………………… 18,900 19,100 -200 -1.0 18,800 SERVICE PROVIDING INDUSTRIES………… 238,000 234,200 3,800 1.6 241,600 TRADE, TRANSPORTATION, UTILITIES….. 50,500 50,300 200 0.4 50,900 Wholesale Trade……………………………… 11,200 11,200 0 0.0 11,200 Retail Trade…………………………………… 29,300 29,400 -100 -0.3 29,600 Transportation, Warehousing, & Utilities…… 10,000 9,700 300 3.1 10,100 INFORMATION………………………………… 4,100 4,200 -100 -2.4 4,100 FINANCIAL ACTIVITIES……………………… 12,400 12,300 100 0.8 12,400 Finance and Insurance……………………… 8,800 8,800 0 0.0 8,800 PROFESSIONAL & BUSINESS SERVICES 28,100 28,700 -600 -2.1 28,500 Administrative and Support………………… 14,300 14,400 -100 -0.7 14,300 EDUCATION AND HEALTH SERVICES…… 76,500 74,800 1,700 2.3 77,900 Educational Services………………………… 25,900 25,900 0 0.0 26,700 Health Care and Social Assistance………… 50,600 48,900 1,700 3.5 51,200 LEISURE AND HOSPITALITY………………… 27,400 24,600 2,800 11.4 27,700 Accommodation and Food Services………… 21,900 20,700 1,200 5.8 22,400 OTHER SERVICES…………………………… 10,500 10,500 0 0.0 10,500 GOVERNMENT ………………………………… 28,500 28,800 -300 -1.0 29,600 Federal………………………………………… 4,800 4,800 0 0.0 4,800 State & Local…………………………………… 23,700 24,000 -300 -1.3 24,800

THE CONNECTICUT ECONOMIC DIGEST16 October 2014
NORWICH - NEWLONDON LMA
Current month’s data are preliminary. Prior months’ data have been revised. All data are benchmarked to March 2013. *Total excludes workers idled due to labor-management disputes. **Includes Indian tribal government employment.
NONFARM EMPLOYMENT ESTIMATES
WATERBURY LMA
LMA
Not Seasonally Adjusted
AUG AUG CHANGE JUL2014 2013 NO. % 2014
TOTAL NONFARM EMPLOYMENT…………… 127,300 129,000 -1,700 -1.3 127,600TOTAL PRIVATE………………………………… 96,000 96,500 -500 -0.5 96,400 GOODS PRODUCING INDUSTRIES………… 18,800 18,400 400 2.2 18,700 CONSTRUCTION, NAT. RES. & MINING.…… 3,900 3,800 100 2.6 3,800 MANUFACTURING…………………………… 14,900 14,600 300 2.1 14,900 Durable Goods………………………………… 11,900 11,400 500 4.4 11,900 Non-Durable Goods………………………… 3,000 3,200 -200 -6.3 3,000 SERVICE PROVIDING INDUSTRIES………… 108,500 110,600 -2,100 -1.9 108,900 TRADE, TRANSPORTATION, UTILITIES….. 22,400 22,700 -300 -1.3 22,400 Wholesale Trade……………………………… 2,600 2,600 0 0.0 2,600 Retail Trade…………………………………… 15,500 15,900 -400 -2.5 15,400 Transportation, Warehousing, & Utilities…… 4,300 4,200 100 2.4 4,400 INFORMATION………………………………… 1,200 1,300 -100 -7.7 1,200 FINANCIAL ACTIVITIES……………………… 3,100 3,200 -100 -3.1 3,100 PROFESSIONAL & BUSINESS SERVICES 8,300 8,700 -400 -4.6 8,400 EDUCATION AND HEALTH SERVICES…… 20,100 20,600 -500 -2.4 20,200 Health Care and Social Assistance………… 18,600 18,400 200 1.1 18,700 LEISURE AND HOSPITALITY………………… 18,500 18,000 500 2.8 18,800 Accommodation and Food Services………… 14,300 14,900 -600 -4.0 14,500 Food Serv., Restaurants, Drinking Places… 12,000 12,500 -500 -4.0 12,200 OTHER SERVICES…………………………… 3,600 3,600 0 0.0 3,600 GOVERNMENT ………………………………… 31,300 32,500 -1,200 -3.7 31,200 Federal………………………………………… 2,600 2,600 0 0.0 2,500 State & Local**………………………………… 28,700 29,900 -1,200 -4.0 28,700
Not Seasonally Adjusted
AUG AUG CHANGE JUL 2014 2013 NO. % 2014
TOTAL NONFARM EMPLOYMENT…………… 63,800 63,400 400 0.6 64,700TOTAL PRIVATE………………………………… 55,400 54,800 600 1.1 55,700 GOODS PRODUCING INDUSTRIES………… 9,800 10,300 -500 -4.9 9,800 CONSTRUCTION, NAT. RES. & MINING.…… 2,500 2,500 0 0.0 2,500 MANUFACTURING…………………………… 7,300 7,800 -500 -6.4 7,300 SERVICE PROVIDING INDUSTRIES………… 54,000 53,100 900 1.7 54,900 TRADE, TRANSPORTATION, UTILITIES….. 12,700 12,600 100 0.8 12,800 Wholesale Trade……………………………… 2,200 2,100 100 4.8 2,200 Retail Trade…………………………………… 8,700 8,800 -100 -1.1 8,800 Transportation, Warehousing, & Utilities…… 1,800 1,700 100 5.9 1,800 INFORMATION………………………………… 600 600 0 0.0 600 FINANCIAL ACTIVITIES……………………… 2,000 2,000 0 0.0 2,000 PROFESSIONAL & BUSINESS SERVICES 4,400 4,700 -300 -6.4 4,500 EDUCATION AND HEALTH SERVICES…… 16,600 16,100 500 3.1 16,700 Health Care and Social Assistance………… 14,900 14,600 300 2.1 15,000 LEISURE AND HOSPITALITY………………… 6,700 6,000 700 11.7 6,700 OTHER SERVICES…………………………… 2,600 2,500 100 4.0 2,600 GOVERNMENT ………………………………… 8,400 8,600 -200 -2.3 9,000 Federal………………………………………… 400 400 0 0.0 400 State & Local…………………………………… 8,000 8,200 -200 -2.4 8,600
THE CONNECTICUT ECONOMIC DIGEST 17October 2014
NONFARM EMPLOYMENT ESTIMATES
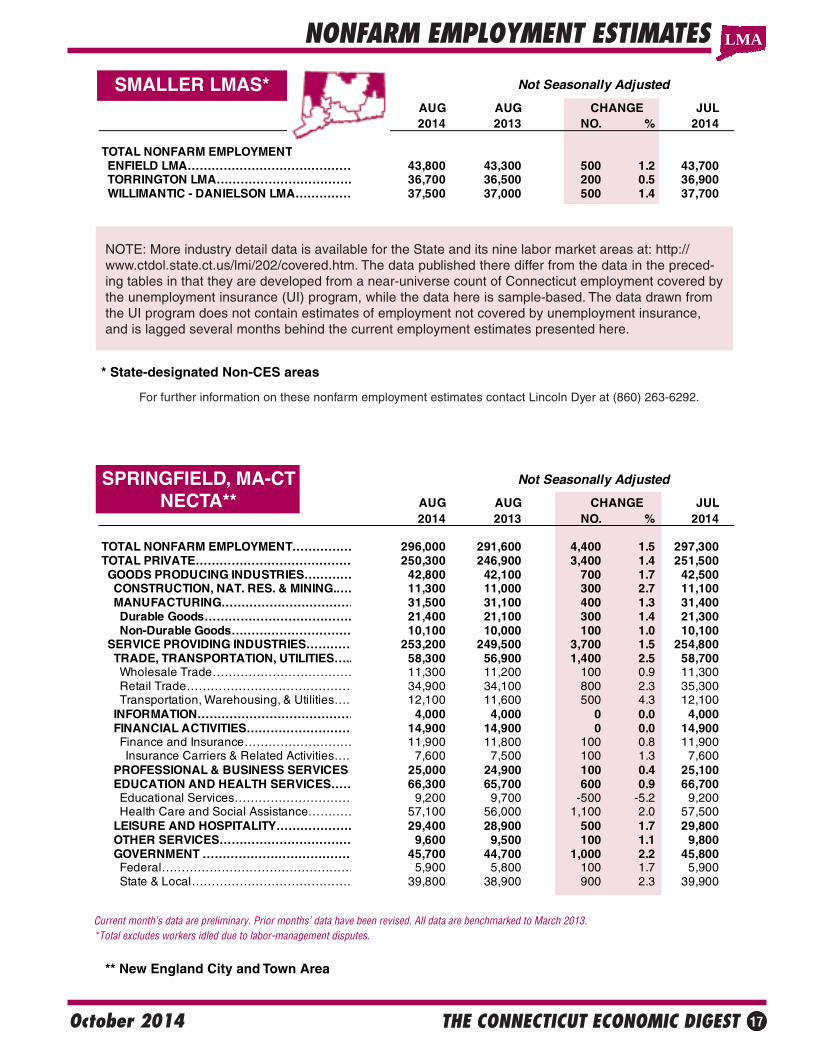
NOTE: More industry detail data is available for the State and its nine labor market areas at: http://www.ctdol.state.ct.us/lmi/202/covered.htm. The data published there differ from the data in the preced-ing tables in that they are developed from a near-universe count of Connecticut employment covered bythe unemployment insurance (UI) program, while the data here is sample-based. The data drawn fromthe UI program does not contain estimates of employment not covered by unemployment insurance,and is lagged several months behind the current employment estimates presented here.
SMALLER LMAS*
Current month’s data are preliminary. Prior months’ data have been revised. All data are benchmarked to March 2013. *Total excludes workers idled due to labor-management disputes.
SPRINGFIELD, MA-CTNECTA**
** New England City and Town Area
LMA
For further information on these nonfarm employment estimates contact Lincoln Dyer at (860) 263-6292.
Not Seasonally Adjusted
AUG AUG CHANGE JUL 2014 2013 NO. % 2014
TOTAL NONFARM EMPLOYMENT ENFIELD LMA…………………………………… 43,800 43,300 500 1.2 43,700 TORRINGTON LMA……………………………… 36,700 36,500 200 0.5 36,900 WILLIMANTIC - DANIELSON LMA…………… 37,500 37,000 500 1.4 37,700
Not Seasonally Adjusted
AUG AUG CHANGE JUL2014 2013 NO. % 2014
TOTAL NONFARM EMPLOYMENT…………… 296,000 291,600 4,400 1.5 297,300TOTAL PRIVATE………………………………… 250,300 246,900 3,400 1.4 251,500 GOODS PRODUCING INDUSTRIES………… 42,800 42,100 700 1.7 42,500 CONSTRUCTION, NAT. RES. & MINING.…… 11,300 11,000 300 2.7 11,100 MANUFACTURING…………………………… 31,500 31,100 400 1.3 31,400 Durable Goods………………………………… 21,400 21,100 300 1.4 21,300 Non-Durable Goods………………………… 10,100 10,000 100 1.0 10,100 SERVICE PROVIDING INDUSTRIES………… 253,200 249,500 3,700 1.5 254,800 TRADE, TRANSPORTATION, UTILITIES….. 58,300 56,900 1,400 2.5 58,700 Wholesale Trade……………………………… 11,300 11,200 100 0.9 11,300 Retail Trade…………………………………… 34,900 34,100 800 2.3 35,300 Transportation, Warehousing, & Utilities…… 12,100 11,600 500 4.3 12,100 INFORMATION………………………………… 4,000 4,000 0 0.0 4,000 FINANCIAL ACTIVITIES……………………… 14,900 14,900 0 0.0 14,900 Finance and Insurance……………………… 11,900 11,800 100 0.8 11,900 Insurance Carriers & Related Activities…… 7,600 7,500 100 1.3 7,600 PROFESSIONAL & BUSINESS SERVICES 25,000 24,900 100 0.4 25,100 EDUCATION AND HEALTH SERVICES…… 66,300 65,700 600 0.9 66,700 Educational Services………………………… 9,200 9,700 -500 -5.2 9,200 Health Care and Social Assistance………… 57,100 56,000 1,100 2.0 57,500 LEISURE AND HOSPITALITY………………… 29,400 28,900 500 1.7 29,800 OTHER SERVICES…………………………… 9,600 9,500 100 1.1 9,800 GOVERNMENT ………………………………… 45,700 44,700 1,000 2.2 45,800 Federal………………………………………… 5,900 5,800 100 1.7 5,900 State & Local…………………………………… 39,800 38,900 900 2.3 39,900
* State-designated Non-CES areas

THE CONNECTICUT ECONOMIC DIGEST18 October 2014
LABOR FORCE ESTIMATES
Current month’s data are preliminary. Prior months’ data have been revised. All data are benchmarked to March 2013.
EMPLOYMENT AUG AUG CHANGE JUL(Not seasonally adjusted) STATUS 2014 2013 NO. % 2014
CONNECTICUT Civilian Labor Force 1,889,700 1,876,100 13,600 0.7 1,900,400Employed 1,759,600 1,728,000 31,600 1.8 1,771,100
Unemployed 130,100 148,100 -18,000 -12.2 129,300Unemployment Rate 6.9 7.9 -1.0 --- 6.8
BRIDGEPORT - STAMFORD LMA Civilian Labor Force 488,300 482,000 6,300 1.3 493,500Employed 457,100 446,500 10,600 2.4 462,300
Unemployed 31,200 35,500 -4,300 -12.1 31,200Unemployment Rate 6.4 7.4 -1.0 --- 6.3
DANBURY LMA Civilian Labor Force 93,200 92,600 600 0.6 93,900Employed 88,100 86,700 1,400 1.6 88,800
Unemployed 5,100 5,900 -800 -13.6 5,100Unemployment Rate 5.5 6.4 -0.9 --- 5.4
ENFIELD LMA Civilian Labor Force 50,300 49,500 800 1.6 50,200Employed 47,100 46,100 1,000 2.2 47,200
Unemployed 3,200 3,400 -200 -5.9 3,000Unemployment Rate 6.3 6.9 -0.6 --- 6.0
HARTFORD LMA Civilian Labor Force 593,200 589,800 3,400 0.6 594,500Employed 551,600 542,500 9,100 1.7 553,000
Unemployed 41,600 47,300 -5,700 -12.1 41,500Unemployment Rate 7.0 8.0 -1.0 --- 7.0
NEW HAVEN LMA Civilian Labor Force 315,800 312,700 3,100 1.0 318,500Employed 293,000 286,800 6,200 2.2 295,800
Unemployed 22,800 26,000 -3,200 -12.3 22,600Unemployment Rate 7.2 8.3 -1.1 --- 7.1
NORWICH - NEW LONDON LMA Civilian Labor Force 146,500 148,500 -2,000 -1.3 146,800Employed 136,400 136,800 -400 -0.3 136,700
Unemployed 10,100 11,700 -1,600 -13.7 10,200Unemployment Rate 6.9 7.9 -1.0 --- 6.9
TORRINGTON LMA Civilian Labor Force 54,800 54,700 100 0.2 54,900Employed 51,400 50,900 500 1.0 51,500
Unemployed 3,400 3,800 -400 -10.5 3,400Unemployment Rate 6.1 7.0 -0.9 --- 6.1
WATERBURY LMA Civilian Labor Force 101,000 100,700 300 0.3 101,900Employed 91,900 90,300 1,600 1.8 92,900
Unemployed 9,200 10,500 -1,300 -12.4 9,000Unemployment Rate 9.1 10.4 -1.3 --- 8.9
WILLIMANTIC-DANIELSON LMA Civilian Labor Force 58,300 57,500 800 1.4 58,200Employed 54,000 52,500 1,500 2.9 53,900
Unemployed 4,300 5,000 -700 -14.0 4,200Unemployment Rate 7.4 8.6 -1.2 --- 7.3
UNITED STATES Civilian Labor Force 156,434,000 155,971,000 463,000 0.3 157,573,000Employed 146,647,000 144,509,000 2,138,000 1.5 147,265,000
Unemployed 9,787,000 11,462,000 -1,675,000 -14.6 10,307,000Unemployment Rate 6.3 7.3 -1.0 --- 6.5
LMA

THE CONNECTICUT ECONOMIC DIGEST 19October 2014
HOURS AND EARNINGS
Current month’s data are preliminary. Prior months’ data have been revised. All data are benchmarked to March 2013.
BUSINESS AND EMPLOYMENT CHANGES ANNOUNCED IN THE NEWS MEDIA
In August 2014, Memry Corp., a manufacturer in Bethel, announced it would expand andcreate 76 jobs over the next four years. TOMZ, a medical and aerospace device manufac-turer in Berlin, is expanding and will create 30 jobs over the next ten years. Dave andBuster’s, an arcade and restaurant, will open a new location in Manchester this Septem-ber, bringing 200 jobs to the area. C. Cowles & Co., a manufacturer, will create 59 jobs inNorth Haven as it moves some operations from Massachusetts. Walmart created 80 jobsin Manchester as it recently expanded its current store.
In August 2014, Smiths Detection, a defense contractor in Danbury, announced it will cut130 jobs in February 2015 as it moves its headquarters to Maryland.
Business & Employment Changes Announced in the News Media lists start-ups, expansions, staff reductions, and layoffs reportedby the media, both current and future. The report provides company name, the number of workers involved, date of the action, theprincipal product or service of the company, a brief synopsis of the action, and the source and date of the media article. Thispublication is available in both HTML and PDF formats at the Connecticut Department of Labor Web site, http://www.ctdol.state.ct.us/lmi/busemp.htm.
LMA
AVG WEEKLY EARNINGS AVG WEEKLY HOURS AVG HOURLY EARNINGSAUG CHG JUL AUG CHG JUL AUG CHG JUL
(Not seasonally adjusted) 2014 2013 Y/Y 2014 2014 2013 Y/Y 2014 2014 2013 Y/Y 2014
PRODUCTION WORKERMANUFACTURING $900.88 $887.41 $13.47 $887.92 40.2 41.8 -1.6 40.6 $22.41 $21.23 $1.18 $21.87 DURABLE GOODS 920.09 913.75 6.34 902.72 39.9 42.5 -2.6 40.3 23.06 21.50 1.56 22.40 NON-DUR. GOODS 840.09 806.75 33.34 842.87 41.0 39.8 1.2 41.5 20.49 20.27 0.22 20.31CONSTRUCTION 1,168.50 1,066.80 101.70 1,154.03 38.0 40.0 -2.0 37.8 30.75 26.67 4.08 30.53
ALL EMPLOYEESSTATEWIDETOTAL PRIVATE 944.37 933.74 10.63 940.57 33.8 33.6 0.2 33.7 27.94 27.79 0.15 27.91GOODS PRODUCING 1,193.15 1,205.37 -12.22 1,200.01 39.3 40.3 -1.0 39.5 30.36 29.91 0.45 30.38 Construction 1,197.57 1,178.48 19.09 1,180.28 38.2 39.8 -1.6 38.0 31.35 29.61 1.74 31.06 Manufacturing 1,177.27 1,209.17 -31.90 1,196.39 39.4 40.4 -1.0 39.8 29.88 29.93 -0.05 30.06SERVICE PROVIDING 898.72 884.52 14.20 894.67 32.8 32.4 0.4 32.7 27.40 27.30 0.10 27.36 Trade, Transp., Utilities 791.91 810.10 -18.18 799.98 33.4 33.6 -0.2 33.5 23.71 24.11 -0.40 23.88 Financial Activities 1,633.54 1,594.25 39.29 1,639.62 37.7 36.7 1.0 37.4 43.33 43.44 -0.11 43.84 Prof. & Business Serv. 1,114.42 1,039.68 74.74 1,116.96 35.3 34.2 1.1 35.8 31.57 30.40 1.17 31.20 Education & Health Ser. 802.33 780.94 21.39 787.51 31.7 31.2 0.5 31.4 25.31 25.03 0.28 25.08 Leisure & Hospitality 405.55 395.03 10.51 393.47 26.3 26.8 -0.5 25.7 15.42 14.74 0.68 15.31 Other Services 671.75 666.65 5.10 676.19 30.3 31.7 -1.4 30.5 22.17 21.03 1.14 22.17
LABOR MARKET AREAS: TOTAL PRIVATE Bridgeport-Stamford 1,040.36 1,048.40 -8.03 1,022.11 33.8 34.9 -1.1 33.8 30.78 30.04 0.74 30.24 Danbury 936.33 925.29 11.04 925.13 34.5 32.8 1.7 33.9 27.14 28.21 -1.07 27.29 Hartford 995.63 969.80 25.83 992.42 34.8 34.5 0.3 34.7 28.61 28.11 0.50 28.60 New Haven 901.06 902.42 -1.36 919.43 34.3 33.9 0.4 34.5 26.27 26.62 -0.35 26.65 Norwich-New London 834.90 899.08 -64.18 847.35 34.6 33.8 0.8 34.6 24.13 26.60 -2.47 24.49 Waterbury 728.78 758.60 -29.82 717.73 31.7 32.6 -0.9 31.8 22.99 23.27 -0.28 22.57

THE CONNECTICUT ECONOMIC DIGEST20 October 2014
LABOR FORCE ESTIMATES BY TOWN
AUGUST 2014(By Place of Residence - Not Seasonally Adjusted)
The civilian labor force comprises all state residents age 16 years and older classified as employed or unemployed in accordance with criteria described below.Excluded are members of the military and persons in institutions (correctional and mental health, for example).
The employed are all persons who did any work as paid employees or in their own business during the survey week, or who have worked 15 hours or more asunpaid workers in an enterprise operated by a family member. Persons temporarily absent from a job because of illness, bad weather, strike or for personalreasons are also counted as employed whether they were paid by their employer or were seeking other jobs.
The unemployed are all persons who did not work, but were available for work during the survey week (except for temporary illness) and made specific efforts tofind a job in the prior four weeks. Persons waiting to be recalled to a job from which they had been laid off need not be looking for work to be classified asunemployed.
LABOR FORCE CONCEPTS
Town
LMA/TOWNS LABOR FORCE EMPLOYED UNEMPLOYED % LMA/TOWNS LABOR FORCE EMPLOYED UNEMPLOYED %BRIDGEPORT-STAMFORD HARTFORD cont…
488,313 457,066 31,247 6.4 Canton 5,822 5,557 265 4.6Ansonia 10,375 9,473 902 8.7 Colchester 9,093 8,581 512 5.6Bridgeport 67,429 60,374 7,055 10.5 Columbia 3,088 2,923 165 5.3Darien 9,488 9,080 408 4.3 Coventry 7,114 6,661 453 6.4Derby 7,128 6,569 559 7.8 Cromwell 8,090 7,638 452 5.6Easton 3,833 3,647 186 4.9 East Granby 2,926 2,804 122 4.2Fairfield 29,766 28,102 1,664 5.6 East Haddam 5,284 4,999 285 5.4Greenwich 30,240 28,921 1,319 4.4 East Hampton 7,116 6,721 395 5.6Milford 30,679 28,830 1,849 6.0 East Hartford 26,736 24,184 2,552 9.5Monroe 10,832 10,190 642 5.9 Ellington 9,457 8,959 498 5.3New Canaan 9,004 8,590 414 4.6 Farmington 13,023 12,351 672 5.2Newtown 14,975 14,155 820 5.5 Glastonbury 18,783 17,937 846 4.5Norwalk 50,325 47,525 2,800 5.6 Granby 6,311 5,994 317 5.0Oxford 7,561 7,171 390 5.2 Haddam 5,164 4,913 251 4.9Redding 4,895 4,686 209 4.3 Hartford 50,146 43,156 6,990 13.9Ridgefield 12,212 11,634 578 4.7 Hartland 1,201 1,155 46 3.8Seymour 9,500 8,833 667 7.0 Harwinton 3,108 2,962 146 4.7Shelton 23,257 21,760 1,497 6.4 Hebron 5,635 5,372 263 4.7Southbury 9,204 8,681 523 5.7 Lebanon 4,259 4,020 239 5.6Stamford 69,910 65,829 4,081 5.8 Manchester 33,293 31,028 2,265 6.8Stratford 27,729 25,512 2,217 8.0 Mansfield 13,442 12,635 807 6.0Trumbull 18,650 17,635 1,015 5.4 Marlborough 3,648 3,458 190 5.2Weston 4,954 4,748 206 4.2 Middlefield 2,449 2,296 153 6.2Westport 12,948 12,320 628 4.9 Middletown 26,331 24,504 1,827 6.9Wilton 8,691 8,273 418 4.8 New Britain 35,681 32,166 3,515 9.9Woodbridge 4,726 4,527 199 4.2 New Hartford 3,834 3,627 207 5.4
Newington 16,872 15,985 887 5.3DANBURY 93,211 88,111 5,100 5.5 Plainville 10,241 9,594 647 6.3Bethel 11,123 10,544 579 5.2 Plymouth 6,817 6,267 550 8.1Bridgewater 938 888 50 5.3 Portland 5,290 4,950 340 6.4Brookfield 9,316 8,785 531 5.7 Rocky Hill 11,132 10,515 617 5.5Danbury 46,471 43,880 2,591 5.6 Simsbury 11,926 11,341 585 4.9New Fairfield 7,543 7,146 397 5.3 Southington 24,595 23,197 1,398 5.7New Milford 15,918 15,056 862 5.4 South Windsor 14,508 13,767 741 5.1Sherman 1,901 1,812 89 4.7 Stafford 6,866 6,411 455 6.6
Thomaston 4,510 4,217 293 6.5ENFIELD 50,299 47,137 3,162 6.3 Tolland 8,388 8,022 366 4.4East Windsor 6,698 6,254 444 6.6 Union 533 504 29 5.4Enfield 23,675 22,116 1,559 6.6 Vernon 16,888 15,806 1,082 6.4Somers 4,959 4,650 309 6.2 West Hartford 30,123 28,346 1,777 5.9Suffield 7,829 7,436 393 5.0 Wethersfield 13,582 12,697 885 6.5Windsor Locks 7,136 6,681 455 6.4 Willington 3,764 3,546 218 5.8
Windsor 16,332 15,167 1,165 7.1HARTFORD 593,199 551,568 41,631 7.0Andover 2,001 1,896 105 5.2Ashford 2,532 2,365 167 6.6Avon 9,609 9,155 454 4.7Barkhamsted 2,230 2,106 124 5.6Berlin 11,406 10,739 667 5.8Bloomfield 10,091 9,229 862 8.5Bolton 2,900 2,754 146 5.0Bristol 33,581 31,209 2,372 7.1Burlington 5,448 5,182 266 4.9
All Labor Market Areas(LMAs) in Connecticut except three are federally-designated areas for developing labor statistics. For the sake of simplicity, the federal Bridgeport-Stamford-Norwalk NECTA is referred to in Connecticut DOL publications as the 'Bridgeport-Stamford LMA', and the Hartford-West Hartford-East Hartford NECTA is referred to as the 'Hartford LMA'. The Bureau of Labor Statistics has identified 17 towns in the northwest part of the State as a separate area for reporting labor force data. For the convenience of our data users, these towns are included in the Torrington LMA. For the same purpuse, five towns which are part of the Springfield, MA area are published as the 'Enfield LMA'. Similarly the towns of Putnam, Thompson and Woodstock (part of the Worcester, MA area), plus four towns estimated separately are included in the Willimantic-Danielson LMA.

THE CONNECTICUT ECONOMIC DIGEST 21October 2014
LABOR FORCE ESTIMATES BY TOWN
The unemployment rate represents the number unemployed as a percent of the civilian labor force.
With the exception of those persons temporarily absent from a job or waiting to be recalled to one, persons with no job and who are not actively looking for oneare counted as "not in the labor force".
Over the course of a year, the size of the labor force and the levels of employment undergo fluctuations due to such seasonal events as changes in weather,reduced or expanded production, harvests, major holidays and the opening and closing of schools. Because these seasonal events follow a regular pattern eachyear, their influence on statistical trends can be eliminated by adjusting the monthly statistics. Seasonal Adjustment makes it easier to observe cyclical and othernonseasonal developments.
(By Place of Residence - Not Seasonally Adjusted)
AUGUST 2014
LABOR FORCE CONCEPTS (Continued)
Town
LMA/TOWNS LABOR FORCE EMPLOYED UNEMPLOYED % LMA/TOWNS LABOR FORCE EMPLOYED UNEMPLOYED %NEW HAVEN 315,760 292,973 22,787 7.2 TORRINGTON 54,770 51,408 3,362 6.1Bethany 3,113 2,944 169 5.4 Bethlehem 2,047 1,931 116 5.7Branford 16,647 15,658 989 5.9 Canaan 672 644 28 4.2Cheshire 14,723 13,888 835 5.7 Colebrook 801 767 34 4.2Chester 2,503 2,377 126 5.0 Cornwall 795 755 40 5.0Clinton 7,679 7,234 445 5.8 Goshen 1,533 1,456 77 5.0Deep River 2,538 2,375 163 6.4 Kent 1,599 1,531 68 4.3Durham 4,260 4,035 225 5.3 Litchfield 4,283 4,043 240 5.6East Haven 16,418 15,168 1,250 7.6 Morris 1,311 1,233 78 5.9Essex 3,670 3,502 168 4.6 Norfolk 971 920 51 5.3Guilford 12,928 12,278 650 5.0 North Canaan 1,694 1,598 96 5.7Hamden 32,464 30,132 2,332 7.2 Roxbury 1,325 1,276 49 3.7Killingworth 3,604 3,432 172 4.8 Salisbury 1,838 1,748 90 4.9Madison 9,731 9,267 464 4.8 Sharon 1,436 1,366 70 4.9Meriden 32,424 29,638 2,786 8.6 Torrington 19,919 18,461 1,458 7.3New Haven 58,647 52,878 5,769 9.8 Warren 784 749 35 4.5North Branford 8,239 7,818 421 5.1 Washington 1,898 1,790 108 5.7North Haven 13,137 12,328 809 6.2 Winchester 6,201 5,786 415 6.7Old Saybrook 5,323 5,009 314 5.9 Woodbury 5,663 5,353 310 5.5Orange 7,273 6,890 383 5.3Wallingford 25,453 23,865 1,588 6.2 WATERBURY 101,018 91,853 9,165 9.1West Haven 31,159 28,647 2,512 8.1 Beacon Falls 3,437 3,181 256 7.4Westbrook 3,826 3,610 216 5.6 Middlebury 3,967 3,759 208 5.2
Naugatuck 16,809 15,393 1,416 8.4*NORWICH-NEW LONDON Prospect 5,353 5,012 341 6.4
134,839 125,486 9,353 6.9 Waterbury 50,479 44,876 5,603 11.1Bozrah 1,518 1,414 104 6.9 Watertown 11,991 11,220 771 6.4Canterbury 3,055 2,845 210 6.9 Wolcott 8,983 8,412 571 6.4East Lyme 9,384 8,794 590 6.3Franklin 1,178 1,106 72 6.1 WILLIMANTIC-DANIELSONGriswold 7,192 6,699 493 6.9 58,264 53,953 4,311 7.4Groton 18,369 17,039 1,330 7.2 Brooklyn 4,137 3,805 332 8.0Ledyard 8,097 7,621 476 5.9 Chaplin 1,339 1,234 105 7.8Lisbon 2,539 2,365 174 6.9 Eastford 950 910 40 4.2Lyme 1,241 1,187 54 4.4 Hampton 1,093 1,008 85 7.8Montville 10,410 9,706 704 6.8 Killingly 9,370 8,631 739 7.9New London 13,888 12,654 1,234 8.9 Plainfield 8,441 7,725 716 8.5No. Stonington 3,177 2,978 199 6.3 Pomfret 2,305 2,187 118 5.1Norwich 21,912 20,148 1,764 8.1 Putnam 5,334 5,021 313 5.9Old Lyme 4,076 3,864 212 5.2 Scotland 979 945 34 3.5Preston 2,663 2,478 185 6.9 Sterling 2,173 2,007 166 7.6Salem 2,516 2,388 128 5.1 Thompson 5,409 5,113 296 5.5Sprague 1,716 1,579 137 8.0 Windham 12,192 11,042 1,150 9.4Stonington 10,089 9,561 528 5.2 Woodstock 4,541 4,325 216 4.8Voluntown 1,514 1,424 90 5.9Waterford 10,307 9,637 670 6.5
*Connecticut portion only. For whole NECTA, including Rhode Island town, see below. Not Seasonally Adjusted:NORWICH-NEW LONDON CONNECTICUT 1,889,700 1,759,600 130,100 6.9
146,520 136,402 10,118 6.9 UNITED STATES 156,434,000 146,647,000 9,787,000 6.3Westerly, RI 11,681 10,916 765 6.5Labor Force estimates are prepared following statistical procedures developed Seasonally Adjusted:by the U.S. Department of Labor, Bureau of Labor Statistics. CONNECTICUT 1,870,400 1,747,000 123,500 6.6
UNITED STATES 155,959,000 146,368,000 9,591,000 6.1

THE CONNECTICUT ECONOMIC DIGEST22 October 2014
HOUSING PERMIT ACTIVITY BY TOWN
For further information on the housing permit data, contact Kolie Sun of DECD at (860) 270-8167.
TOWN AUG YR TO DATE TOWN AUG YR TO DATE TOWN AUG YR TO DATE2014 2014 2013 2014 2014 2013 2014 2014 2013
Andover 0 2 5 Griswold na na na Preston 0 0 8Ansonia 0 0 1 Groton 1 13 15 Prospect na na naAshford 0 5 3 Guilford 2 10 28 Putnam 0 2 1Avon 2 16 29 Haddam 2 9 3 Redding na na naBarkhamsted na na na Hamden 1 4 2 Ridgefield 3 30 11Beacon Falls na na na Hampton 0 1 2 Rocky Hill 0 10 93Berlin 1 16 71 Hartford 3 14 19 Roxbury na na naBethany na na na Hartland na na na Salem 0 5 4Bethel 8 62 33 Harwinton 0 2 1 Salisbury na na naBethlehem na na na Hebron na na na Scotland 0 0 1
Bloomfield na na na Kent 0 1 1 Seymour 0 4 11Bolton 0 6 8 Killingly 0 9 12 Sharon 0 4 1Bozrah 0 2 2 Killingworth na na na Shelton 1 26 18Branford na na na Lebanon 2 4 3 Sherman na na naBridgeport 4 15 157 Ledyard 0 9 20 Simsbury 2 173 96Bridgewater na na na Lisbon 0 2 3 Somers 1 8 7Bristol 8 65 78 Litchfield na na na South Windsor 2 16 12Brookfield na na na Lyme 1 4 2 Southbury 2 16 23Brooklyn 0 10 6 Madison 3 10 13 Southington 8 49 72Burlington 0 21 21 Manchester 0 14 14 Sprague 0 0 4
Canaan 0 0 0 Mansfield 1 9 8 Stafford na na naCanterbury 1 11 8 Marlborough 0 3 4 Stamford 12 261 229Canton 1 7 9 Meriden 0 3 12 Sterling na na naChaplin 0 0 0 Middlebury na na na Stonington 3 14 21Cheshire 4 31 36 Middlefield 4 4 7 Stratford 3 38 129Chester na na na Middletown 6 51 18 Suffield 4 15 19Clinton 1 8 9 Milford 15 143 126 Thomaston na na naColchester 1 22 26 Monroe 1 3 3 Thompson na na naColebrook 0 1 1 Montville 1 7 7 Tolland 3 9 6Columbia 1 2 6 Morris 0 0 0 Torrington 0 2 2
Cornwall 1 2 1 Naugatuck 1 15 15 Trumbull 0 2 6Coventry 1 22 16 New Britain na na na Union 0 0 2Cromwell 3 17 23 New Canaan 4 37 27 Vernon 2 9 30Danbury 31 266 139 New Fairfield na na na Voluntown 0 1 1Darien na na na New Hartford 1 4 6 Wallingford 2 19 23Deep River 2 2 4 New Haven 1 302 32 Warren 0 2 0Derby na na na New London 3 24 28 Washington na na naDurham 0 2 3 New Milford 3 10 15 Waterbury 0 42 26East Granby 0 1 6 Newington 0 5 3 Waterford 1 8 10East Haddam 1 6 12 Newtown 1 13 8 Watertown 3 22 18
East Hampton 1 14 10 Norfolk 1 2 0 West Hartford 6 42 44East Hartford na na na North Branford na na na West Haven na na naEast Haven 0 8 14 North Canaan 0 0 0 Westbrook 1 10 8East Lyme 2 175 29 North Haven 2 12 17 Weston na na naEast Windsor 1 8 13 North Stonington 1 5 4 Westport 5 117 67Eastford 0 2 4 Norwalk 138 212 65 Wethersfield na na naEaston 0 2 4 Norwich 0 21 5 Willington 0 2 2Ellington 3 71 31 Old Lyme na na na Wilton na na naEnfield na na na Old Saybrook 2 15 15 Winchester 4 19 16Essex 0 2 6 Orange na na na Windham 1 10 4
Fairfield 7 72 120 Oxford 2 50 15 Windsor na na naFarmington 6 19 34 Plainfield 1 8 11 Windsor Locks na na naFranklin 0 2 1 Plainville 2 16 8 Wolcott 2 13 13Glastonbury 2 17 21 Plymouth 0 5 4 Woodbridge na na naGoshen 0 8 3 Pomfret 0 2 0 Woodbury 1 2 7Granby 1 7 8 Portland 0 4 7 Woodstock 0 6 5Greenwich 8 71 54
Town

THE CONNECTICUT ECONOMIC DIGEST 23October 2014
TECHNICAL NOTESBUSINESS STARTS AND TERMINATIONSRegistrations and terminations of business entities as recorded with the Secretary of the State and the ConnecticutDepartment of Labor (DOL) are an indication of new business formation and activity. DOL business starts include newemployers which have become liable for unemployment insurance taxes during the quarter, as well as new establish-ments opened by existing employers. DOL business terminations are those accounts discontinued due to inactivity (noemployees) or business closure, and accounts for individual business establishments that are closed by still activeemployers. The Secretary of the State registrations include limited liability companies, limited liability partnerships, andforeign-owned (out-of-state) and domestic-owned (in-state) corporations.
CONSUMER PRICE INDEXThe Consumer Price Index (CPI), computed and published by the U.S. Bureau of Labor Statistics, is a measure of theaverage change in prices over time in a fixed market basket of goods and services. It is based on prices of food, clothing,shelter, fuels, transportation fares, charges for doctors’ and dentists’ services, drugs and other goods and services thatpeople buy for their day-to-day living. The Northeast region is comprised of the New England states, New York, NewJersey and Pennsylvania.
EMPLOYMENT COST INDEXThe Employment Cost Index (ECI) covers both wages and salaries and employer costs for employee benefits for alloccupations and establishments in both the private nonfarm sector and state and local government. The ECI measuresemployers’ labor costs free from the influences of employment shifts among industries and occupations. The base periodfor all data is June 1989 when the ECI is 100.
HOURS AND EARNINGS ESTIMATESProduction worker earnings and hours estimates include full- and part-time employees working within manufacturingindustries. Hours worked and earnings data are computed based on payroll figures for the week including the 12th of themonth. Average hourly earnings are affected by such factors as premium pay for overtime and shift differential as well aschanges in basic hourly and incentive rates of pay. Average weekly earnings are the product of weekly hours worked andhourly earnings. These data are developed in cooperation with the U.S. Department of Labor, Bureau of Labor Statistics.
INDIAN GAMING DATAIndian Gaming Payments are amounts received by the State as a result of the slot compact with the two Federallyrecognized tribes in Connecticut, which calls for 25 percent of net slot receipts to be remitted to the State. IndianGaming Slots are the total net revenues from slot machines only received by the two Federally recognized Indian tribes.
INITIAL CLAIMSAverage weekly initial claims are calculated by dividing the total number of new claims for unemployment insurancereceived in the month by the number of weeks in the month. A minor change in methodology took effect with datapublished in the March 1997 issue of the DIGEST. Data have been revised back to January 1980.
INSURED UNEMPLOYMENT RATEPrimarily a measure of unemployment insurance program activity, the insured unemployment rate is the 13-weekaverage of the number of people claiming unemployment benefits divided by the number of workers covered by theunemployment insurance system.
LABOR FORCE ESTIMATESLabor force estimates are a measure of the work status of people who live in Connecticut. Prepared under the direction ofthe U.S. Bureau of Labor Statistics, the statewide estimates are the product of a signal-plus noise model, which usesresults from the Current Population Survey (CPS), a monthly survey of Connecticut households, counts of claimants forunemployment benefits, and establishment employment estimates. Beginning with the publication of January 2005 data,an improved methodology is being used to develop labor force estimates, by which monthly state model-based employ-ment and unemployment estimates are controlled to add to the national CPS levels. This will ensure that nationaleconomic events are reflected in the state estimates, and it will significantly reduce end-of-year revisions. (For moreinformation, please see the Connecticut Economic Digest, December 2004 issue.) Labor force data, reflecting personsemployed by place of residence, are not directly comparable to the place-of-work industry employment series. In thelabor force estimates, workers involved in labor disputes are counted as employed. The labor force data also includesagricultural workers, unpaid family workers, domestics and the self-employed. Because of these conceptual differences,total labor force employment is almost always different from nonfarm wage and salary employment.
LABOR MARKET AREASAll Labor Market Areas (LMAs) in Connecticut except three are federally-designated areas for developing labor statistics.For the sake of simplicity, the federal Bridgeport-Norwalk-Stamford Metropolitan Statistical Area (MSA) is referred to inConnecticut Department of Labor publications as the Bridgeport-Stamford LMA, and the Hartford-West Hartford-EastHartford MSA is called the Hartford LMA. The Bureau of Labor Statistics has identified the 17 towns in the in the north-western part of the state as a separate area for reporting labor force data. For the convenience of our data users, data forthese towns are included in the Torrington LMA. For the same purpose, data for the towns of East Windsor, Enfield,Somers, Suffield and Windsor Locks, which are officially part of the Springfield MSA, are published as the Enfield LMA.Similarly, the towns of Putnam, Thompson and Woodstock - part of the Worcester MSA - are included in the Willimantic-Danielson LMA. Also, data for Westerly, Rhode Island are included in the Norwich-New London LMA. Industry employ-ment and labor force data estimates contained in Connecticut Department of Labor publications are prepared followingthe same statistical procedures developed by the U.S. Department of Labor, Bureau of Labor Statistics, whether forfederally designated or state-determined areas.
NONFARM EMPLOYMENT ESTIMATESNonfarm employment estimates are derived from a survey of businesses to measure jobs by industry. The estimatesinclude all full- and part-time wage and salary employees who worked during or received pay for the pay period whichincludes the 12th of the month. Excluded from these estimates are proprietors, self-employed workers, private householdemployees and unpaid family workers. In some cases, due to space constraints, all industry estimates are not shown.Call (860) 263-6275 for a more comprehensive breakout of nonfarm employment estimates. These data are developed incooperation with the U.S. Department of Labor, Bureau of Labor Statistics.
UI COVERED WAGESUI covered wages is the total amount paid to those employees who are covered under the Connecticut’s UnemploymentInsurance (UI) law for services performed during the quarter. The fluctuations in the 1992-93 period reflect the effect ofthe changes in the tax law and the massive restructuring in the state’s economy.

ECONOMIC INDICATORS AT A GLANCE
Leading General Drift Indicator ..... +2.6Coincident General Drift Indicator +0.4Farmington Bank Bus. Barometer +0.5Phil. Fed’s CT Coincident Index .... +2.9
Total Nonfarm Employment........... +0.3
Unemployment Rate ..................... -1.2* Labor Force ................................... +0.7 Employed ....................................... +2.1 Unemployed .................................. -15.1
Average Weekly Initial Claims ...... -11.6Avg Insured Unempl. Rate ........... -0.14*U-6 Rate ......................................... -1.4*
Prod. Worker Avg Wkly Hrs, Mfg ..... -3.8PW Avg Hourly Earnings, Mfg ....... +5.6PW Avg Weekly Earnings, Mfg ...... +1.5CT Mfg. Production Index ............... -0.8 Production Worker Hours ................ -1.7 Industrial Electricity Sales ............... -3.4
Personal Income ............................ +3.2UI Covered Wages .......................... +2.3
Business Activity New Housing Permits .................... -53.5 Electricity Sales ............................ -10.5 Construction Contracts Index ........ -48.0 New Auto Registrations ................... -8.5 Air Cargo Tons ................................. NA Exports ........................................... -7.6 S&P 500: Monthly Close .............. +22.7
Business Starts Secretary of the State .................. +13.8 Dept. of Labor ................................. -5.0
Business Terminations Secretary of the State ................... -57.2 Dept. of Labor ............................... -27.0
State Revenues ............................... -4.3 Corporate Tax ............................... +89.5 Personal Income Tax ...................... -13.7 Real Estate Conveyance Tax ......... +16.0 Sales & Use Tax .............................. +0.1 Indian Gaming Payments ................. -3.0
Tourism and Travel Info Center Visitors ......................... +9.1 Attraction Visitors ........................... +2.7 Air Passenger Count ........................ NA Indian Gaming Slots ........................ -3.7 Travel and Tourism Index ................. -6.6
Employment Cost Index (U.S.) Total ............................................... +2.0 Wages & Salaries........................... +1.9 Benefit Costs ................................. +2.4
Consumer Prices U.S. City Average ........................... +1.7 Northeast Region ........................... +1.3 NY-NJ-Long Island ......................... +1.3 Boston-Brockton-Nashua ............... +1.7
Interest Rates Prime ............................................ 0.00* Conventional Mortgage ................ -0.34*
Mailing address:
Connecticut Economic DigestConnecticut Department of Labor
Office of Research200 Folly Brook Boulevard
Wethersfield, CT 06109-1114
THE CONNECTICUT ECONOMIC DIGEST
*Percentage point change; **Less than 0.05 percent; NA = Not Available
The Connecticut Economic Digest is available on the internet at:
http://www.ctdol.state.ct.us/lmi
October 2014
(Percent change from prior year; see pages 4-8 for reference months or quarters)
THE CONNECTICUT
A joint publication of The Connecticut Departments of Labor and Economic and Community Development
ECONOMIC DIGEST
If you wish to have your name removed from our mailing list, pleasecheck here and return this page (or a photocopy) to the address at left.
If your address has changed, please check here, make the necessarychanges to your address label and return this page to the address at left.
If you receive more than one copy of this publication, please checkhere and return this page from the duplicate copy to the address at left.
DO YOU WANT TO BE NOTIFIED BY EMAIL WHEN THEDIGEST IS PUBLISHED EACH MONTH?
Simply email to [email protected] with only the following inthe body of the message, leave subject blank:SUBSCRIBE DOL-CTEconomicDigest your_name(type in your name where it says your_name)