Embed Size (px)
Citation preview
THE CONNECTICUT
ECONOMIC DIGESTSEPTEMBER 2016
September 2016
Economic Indicators on the Overall Economy ......................... 5 Individual Data Items ......................... 6-8Comparative Regional Data .............. 9Economic Indicator Trends ........ 10-11Help Wanted OnLine ........................ 15Business and Employment ChangesAnnounced in the News Media ...... 19Labor Market Areas: Nonfarm Employment .................... 12-17 Sea. Adj. Nonfarm Employment ..........14 Labor Force ............................................ 18 Hours and Earnings .............................. 19Cities and Towns: Labor Force ..................................... 20-21 Housing Permits .................................... 22Technical Notes ............................... 23At a Glance ....................................... 24
Long Term Industry andOccupational Projections:2014-2024 ........................ 1-5
IN THIS ISSUE...
In July...Nonfarm Employment Connecticut..................... 1,693,000 Change over month ........... +0.10% Change over year ................ +1.2%
United States .............. 144,448,000 Change over month ........... +0.18% Change over year ................. +1.7%
Unemployment Rate Connecticut............................. 5.7% United States .......................... 4.9%
Consumer Price Index United States ...................... 240.647 Change over year .................. +0.8%
Vol.21 No.9 A joint publication of the Connecticut Department of Labor & the Connecticut Department of Economic and Community Development
N
Long Term Industry andOccupational Projections:2014-2024By Matthew Krzyzek and Patrick J. Flaherty, DOL
ATIONAL PROJECTIONSEvery two years, the U.S.
Bureau of Labor Statisticsproduces 10 year projections ofthe U.S. labor force andemployment by industry andoccupation. The latest projectionsare for the period 2014 to 2024.
Labor Force The U.S. labor force isprojected to increase by 9.8million workers from 2014 to 2024(a 0.6% annualized growth rate)with the 2024 labor forceprojected to be older and morediverse. The number of workersaged 55 and older is expected toincrease by more than 6.7 million(+19.8%) while the number aged16 to 24 is projected to decreaseby 2.8 million (-13.1%) with thelargest labor force cohort – thoseaged 25 to 54 (also known asprime-age workers) up just 3.9million (+3.9%). As a percent ofthe labor force, the 16-24 cohortwill fall 2.1 percentage points to14.1% in 2024; increasedpostsecondary enrollment is aprimary cause of this sharedecrease. The increase of older workersas a share of the labor force hasbeen a long-term trend in recentdecades and is projected tocontinue through 2024. In 1994,workers aged 55 and over were11.8% of the labor force, but theirshare increased to 15.6% tenyears later and was 21.7% in
2014. This age cohort traditionallyhas a lower labor forceparticipation rate than prime-agedworkers, but as quality of life andlife expectancy increase, labor forceparticipation is expected to risefrom 21.7% in 2014 to 24.8% in2024. Overall labor force participationis expected to decrease from 62.9percent in 2014 to 60.9 by 2024.Participation has been decliningsince the early 2000s and isexpected to level off to just below59 percent by about 2050. Other characteristics of thelabor force are changing as well.The portion of the workforceclassified as White Non-Hispanic isprojected to decline 4.9 percentagepoints to 59.6% by 2024. Otherrace and ethnic groups areexpected to increase: Hispanicethnicity (+3.6 percentage points to19.8%), Asian (+1.0 percentagepoints to 6.6%) and Black/AfricanAmerican (+0.6 percentage pointsto 12.7%). Overall, the non-whiteproportion of the labor force hasbeen steadily increasing fordecades, increasing from 23.3% in1994, to 30.0% in 2004, 35.4% in2014 and expected to be 40.4% by2024.
Industry The demographic changesoutlined in the previous sectionwill have corresponding impacts onexpected industrial shifts. Theaging population will continue to
THE CONNECTICUT ECONOMIC DIGEST2 September 2016
ConnecticutDepartment of Labor
Connecticut Departmentof Economic andCommunity Development
THE CONNECTICUT
The Connecticut Economic Digest ispublished monthly by the ConnecticutDepartment of Labor, Office of Research, andthe Connecticut Department of Economic andCommunity Development. Its purpose is toregularly provide users with a comprehensivesource for the most current, up-to-date dataavailable on the workforce and economy of thestate, within perspectives of the region andnation.
The annual subscription is $50. Sendsubscription requests to: The ConnecticutEconomic Digest, Connecticut Department ofLabor, Office of Research, 200 Folly BrookBoulevard, Wethersfield, CT 06109-1114.Make checks payable to the ConnecticutDepartment of Labor. Back issues are $4 percopy. The Digest can be accessed free ofcharge from the DOL Web site. Articles fromThe Connecticut Economic Digest may bereprinted if the source is credited. Please sendcopies of the reprinted material to the ManagingEditor. The views expressed by the authors aretheirs alone and may not reflect those of theDOL or DECD.
Managing Editor: Jungmin Charles Joo
Associate Editor: Erin C. Wilkins
We would like to acknowledge the contributionsof many DOL Research and DECD staff andRob Damroth to the publication of the Digest.
Catherine Smith, CommissionerTim Sullivan, Deputy CommissionerBart Kollen, Deputy Commissioner
505 Hudson StreetHartford, CT 06106-2502Phone: (860) 270-8000Fax: (860) 270-8200E-Mail: [email protected]: http://www.decd.org
Scott D. Jackson, CommissionerKurt Westby, Deputy Commissioner
Andrew Condon, Ph.D., DirectorOffice of Research200 Folly Brook BoulevardWethersfield, CT 06109-1114Phone: (860) 263-6275Fax: (860) 263-6263E-Mail: [email protected]: http://www.ctdol.state.ct.us/lmi
ECONOMIC DIGEST
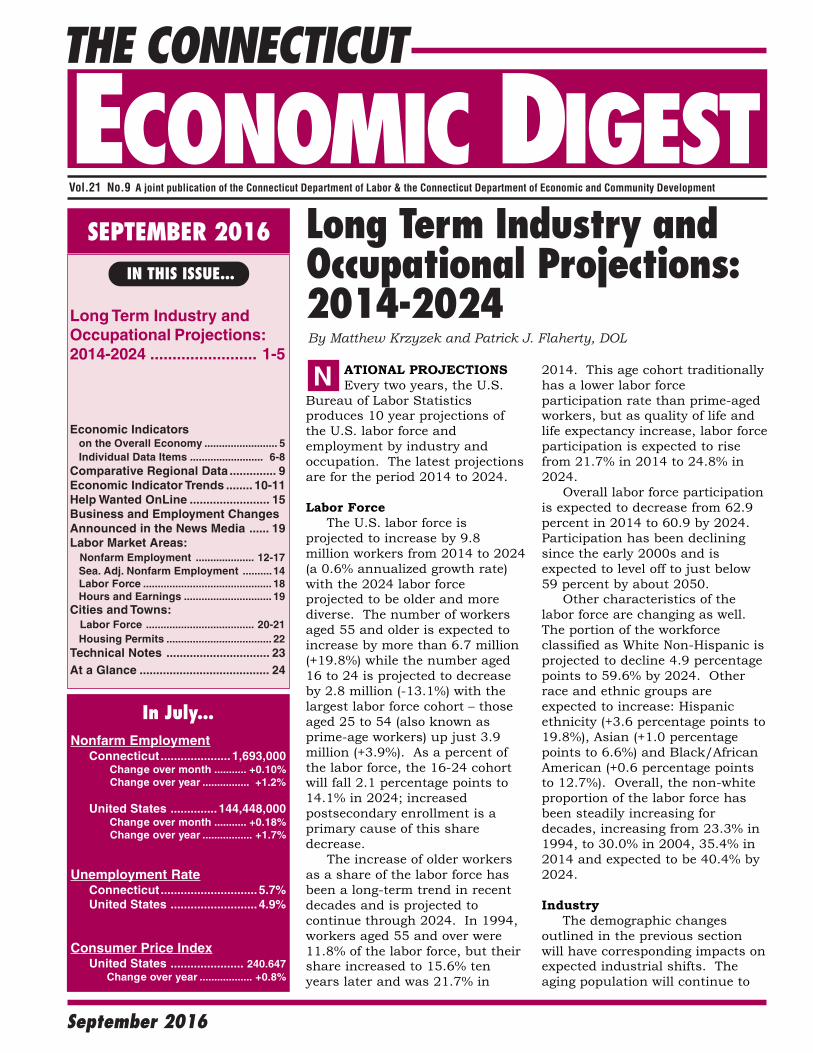
increase demand for Health Care,which is the fastest growingindustry sector and is projected toincrease 3.8 million jobs, or 1.9%per year through 2024 (Chart 1).This increase is more than triplethe 0.6% compound annualizedgrowth expected for totalemployment. Additional sectors with largeexpected growth includeProfessional and BusinessServices, which is projected toincrease by 1.9 million jobs to 21million. Leisure and Hospitality isalso expected to increase by 9.4million, or 0.6% annualizedgrowth, the same rate as theoverall economy. After significantemployment losses in the wake ofthe housing bubble and recession,where employment fell by 838,000from 2004 to 2014, Construction isexpected to increase by 790,000 to6.9 million, which will bringemployment in that sector back tonear pre-recession levels. Four industry sectors havenegative employment forecaststhrough 2024, which areManufacturing, FederalGovernment, Utilities, andInformation. These four sectorshave respective projectedemployment change of -814,100
(-7.2%), -383,400 (-16.3%),-47,900 (-9.5%) and -27,100(-1.0%). In terms of labor marketshare, Service Providingindustries have increased from83.5% of nonfarm employment in2004, to 86.3% in 2014 and areexpected to be 87.1% by 2024,while Goods Producing industrieshave experienced and willexperience correspondingdeclines.
Occupation Six occupations are projectedto increase by over 300,000 jobsin the next ten years: PersonalCare Aides (+458,100, +25.9%),Registered Nurses (+439,300,+16.0%), Home Health Aides(+348,400, +38.1%), CombinedFood Preparation and ServingWorkers (+343,500, +10.9%),Retail Salespersons (+314,200,+6.8%) and Nursing Assistants(+262,000 +17.6%). Of theseoccupations, four are in thehealth care sector, and those fouroccupations show significantoccupational growth, increasingbetween 16.0 percent and 38.1percent through 2024. This trendis driven in large part byaforementioned demographic
‐3,000
‐2,000
‐1,000 0
1,000
2,000
3,000
4,000
5,000
Manufacturing
Federal government
Utilities
Information
Mining
Transportation and warehousing
Other services
Wholesale trade
Educational services; private
Financial activities
State and local government
Retail trade
Construction
Leisure and hospitality
Professional and business services
Health care and social assistance
change in emp. (000's)
Chart 1: U.S. Industry History and Projections
2014 to 2024 2004 to 2014
THE CONNECTICUT ECONOMIC DIGEST 3September 2016
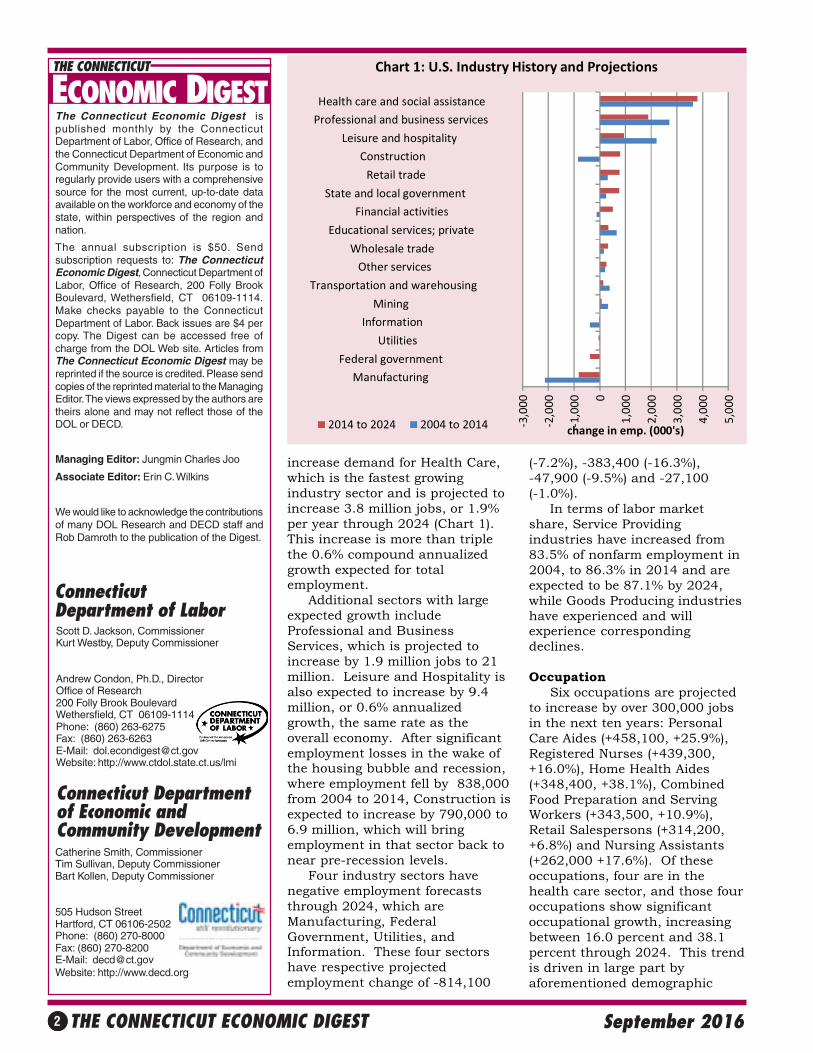
shifts as the population ages. Theother two occupations, RetailSalespersons and Combined FoodPreparation and Serving Workers,have in recent years been steadilyincreasing, a trend projected tocontinue. Nearly everyoccupational group is expected toexperience an employment
increase over the next ten years(see Chart 2), with the exceptionof the Farming, Fishing, andForestry sector and theProduction occupations.
CONNECTICUT PROJECTIONS Connecticut projections areprepared using the national
projections, forecasts of stateemployment growth, and ananalysis of trends affectingindustries and occupations in theConnecticut economy. The longterm (2014 to 2024) projectionsassume a full-employmenteconomy at the end of the periodbecause the Labor Departmentdoes not attempt to forecast theups and downs of the businesscycle that far into the future.
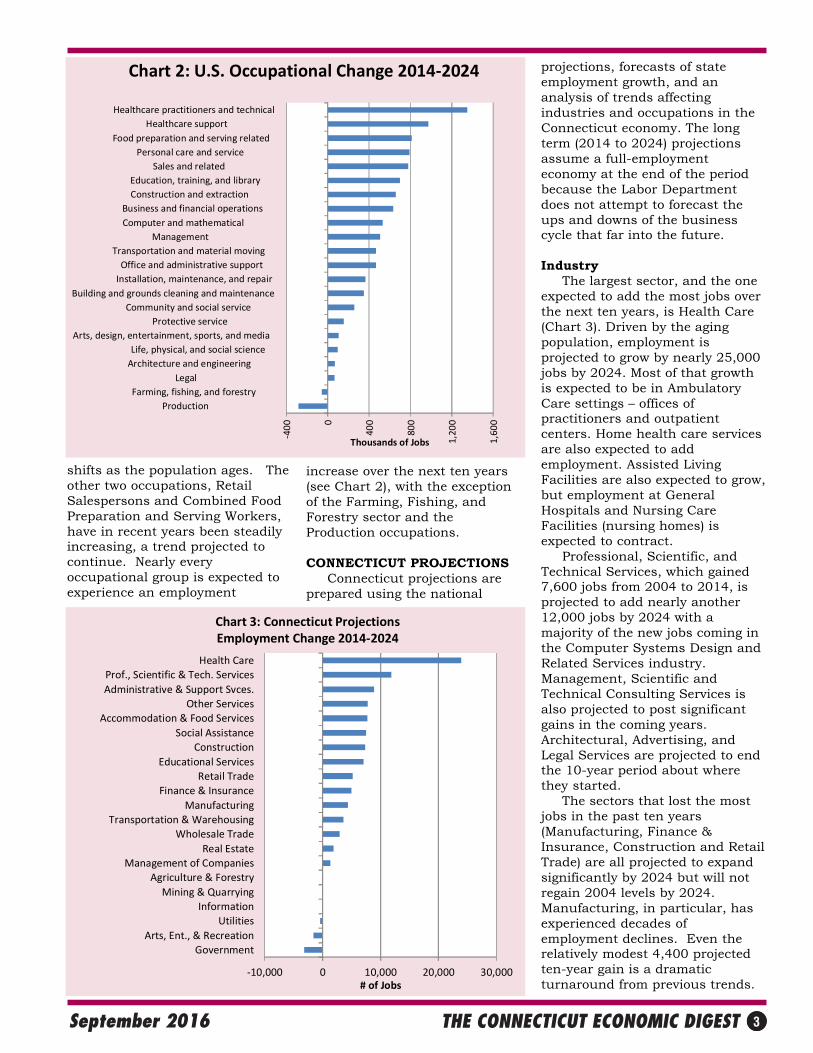
Industry The largest sector, and the oneexpected to add the most jobs overthe next ten years, is Health Care(Chart 3). Driven by the agingpopulation, employment isprojected to grow by nearly 25,000jobs by 2024. Most of that growthis expected to be in AmbulatoryCare settings – offices ofpractitioners and outpatientcenters. Home health care servicesare also expected to addemployment. Assisted LivingFacilities are also expected to grow,but employment at GeneralHospitals and Nursing CareFacilities (nursing homes) isexpected to contract. Professional, Scientific, andTechnical Services, which gained7,600 jobs from 2004 to 2014, isprojected to add nearly another12,000 jobs by 2024 with amajority of the new jobs coming inthe Computer Systems Design andRelated Services industry.Management, Scientific andTechnical Consulting Services isalso projected to post significantgains in the coming years.Architectural, Advertising, andLegal Services are projected to endthe 10-year period about wherethey started. The sectors that lost the mostjobs in the past ten years(Manufacturing, Finance &Insurance, Construction and RetailTrade) are all projected to expandsignificantly by 2024 but will notregain 2004 levels by 2024.Manufacturing, in particular, hasexperienced decades ofemployment declines. Even therelatively modest 4,400 projectedten-year gain is a dramaticturnaround from previous trends.
‐400 0
400
800
1,20
0
1,60
0
Production
Farming, fishing, and forestry
Legal
Architecture and engineering
Life, physical, and social science
Arts, design, entertainment, sports, and media
Protective service
Community and social service
Building and grounds cleaning and maintenance
Installation, maintenance, and repair
Office and administrative support
Transportation and material moving
Management
Computer and mathematical
Business and financial operations
Construction and extraction
Education, training, and library
Sales and related
Personal care and service
Food preparation and serving related
Healthcare support
Healthcare practitioners and technical
Thousands of Jobs
Chart 2: U.S. Occupational Change 2014‐2024
‐10,000 0 10,000 20,000 30,000
Government
Arts, Ent., & Recreation
Utilities
Information
Mining & Quarrying
Agriculture & Forestry
Management of Companies
Real Estate
Wholesale Trade
Transportation & Warehousing
Manufacturing
Finance & Insurance
Retail Trade
Educational Services
Construction
Social Assistance
Accommodation & Food Services
Other Services
Administrative & Support Svces.
Prof., Scientific & Tech. Services
Health Care
# of Jobs
Chart 3: Connecticut ProjectionsEmployment Change 2014‐2024
THE CONNECTICUT ECONOMIC DIGEST4 September 2016
On the other hand, EducationalServices, which grew by nearly20,000 over the past ten years, isprojected to see growth slow downsignificantly. Employment is stillprojected to increase by over 7,000jobs but this growth is only a bitmore than one-third the growth ofthe previous decade. Theslowdown is driven by slowerprojected growth in the school-aged population with elementaryand secondary schools projected toshow employment growth justabove zero.
Three sectors that are expectedto decline over the next ten yearsare Utilities, Arts, Entertainment,and Recreation and Government(excluding Education andHospitals). The Utilities decline issmall and represents productivityimprovements in that sector.Arts, Entertainment andRecreation will be held back byincreased competition in thecasino gaming industry.Continued fiscal pressures areprojected to lead to furtherreductions in government
employment at both the federaland state levels. In the ten years ending 2014 (aperiod that included the “greatrecession”) employment grewsignificantly less than 2%.Overall, Connecticut employmentis expected to grow more thanthree times faster (on average) forthe 2014-2024 period to achieve afull employment economy at thattime.
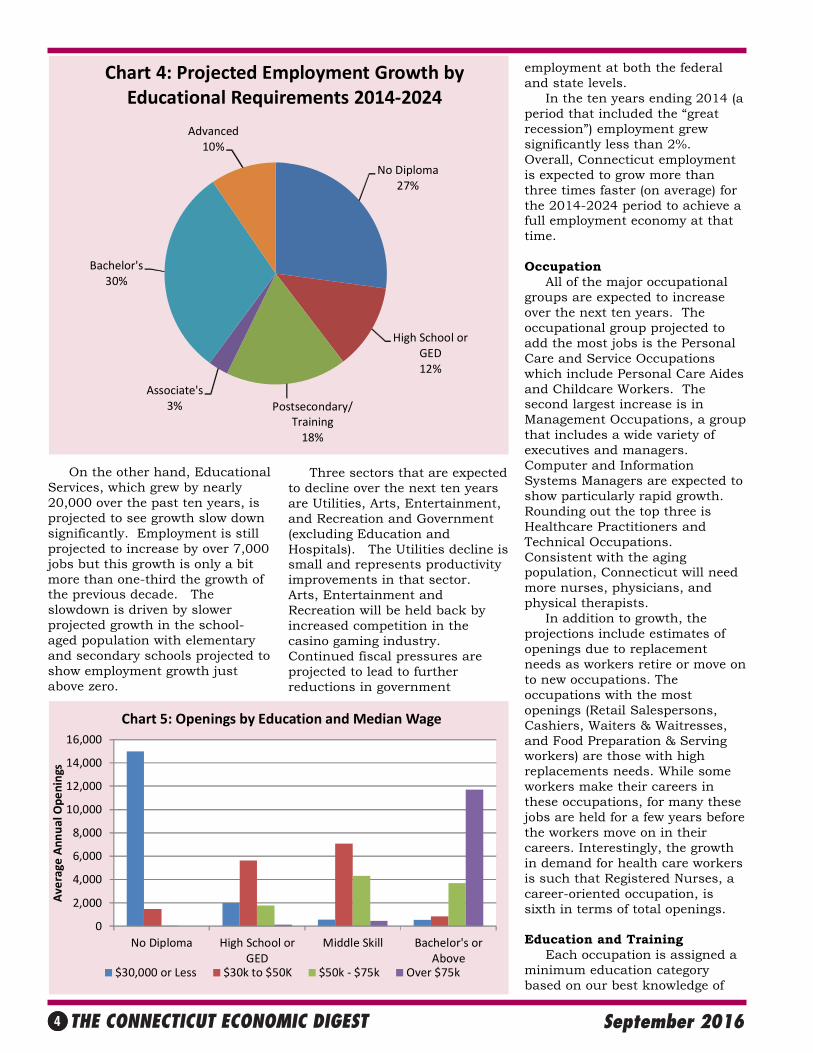
Occupation All of the major occupationalgroups are expected to increaseover the next ten years. Theoccupational group projected toadd the most jobs is the PersonalCare and Service Occupationswhich include Personal Care Aidesand Childcare Workers. Thesecond largest increase is inManagement Occupations, a groupthat includes a wide variety ofexecutives and managers.Computer and InformationSystems Managers are expected toshow particularly rapid growth.Rounding out the top three isHealthcare Practitioners andTechnical Occupations.Consistent with the agingpopulation, Connecticut will needmore nurses, physicians, andphysical therapists. In addition to growth, theprojections include estimates ofopenings due to replacementneeds as workers retire or move onto new occupations. Theoccupations with the mostopenings (Retail Salespersons,Cashiers, Waiters & Waitresses,and Food Preparation & Servingworkers) are those with highreplacements needs. While someworkers make their careers inthese occupations, for many thesejobs are held for a few years beforethe workers move on in theircareers. Interestingly, the growthin demand for health care workersis such that Registered Nurses, acareer-oriented occupation, issixth in terms of total openings.
Education and Training Each occupation is assigned aminimum education categorybased on our best knowledge of
No Diploma27%
High School or GED12%
Postsecondary/Training18%
Associate's3%
Bachelor's30%
Advanced10%
Chart 4: Projected Employment Growth by Educational Requirements 2014‐2024
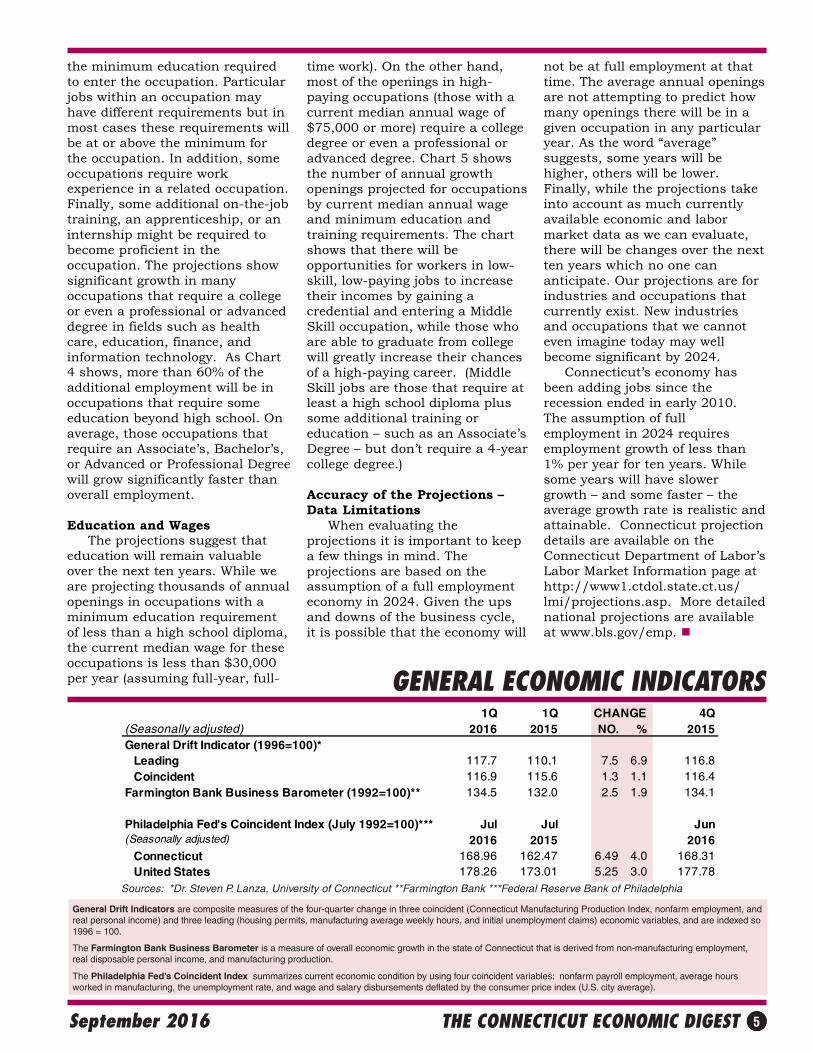
0
2,000
4,000
6,000
8,000
10,000
12,000
14,000
16,000
No Diploma High School orGED
Middle Skill Bachelor's orAbove
Average Annual Openings
Chart 5: Openings by Education and Median Wage
$30,000 or Less $30k to $50K $50k ‐ $75k Over $75k
THE CONNECTICUT ECONOMIC DIGEST 5September 2016
GENERAL ECONOMIC INDICATORS
Sources: *Dr. Steven P. Lanza, University of Connecticut **Farmington Bank ***Federal Reserve Bank of Philadelphia
General Drift Indicators are composite measures of the four-quarter change in three coincident (Connecticut Manufacturing Production Index, nonfarm employment, andreal personal income) and three leading (housing permits, manufacturing average weekly hours, and initial unemployment claims) economic variables, and are indexed so1996 = 100.
The Farmington Bank Business Barometer is a measure of overall economic growth in the state of Connecticut that is derived from non-manufacturing employment,real disposable personal income, and manufacturing production.
The Philadelphia Fed’s Coincident Index summarizes current economic condition by using four coincident variables: nonfarm payroll employment, average hoursworked in manufacturing, the unemployment rate, and wage and salary disbursements deflated by the consumer price index (U.S. city average).
1Q 1Q CHANGE 4Q(Seasonally adjusted) 2016 2015 NO. % 2015General Drift Indicator (1996=100)* Leading 117.7 110.1 7.5 6.9 116.8 Coincident 116.9 115.6 1.3 1.1 116.4Farmington Bank Business Barometer (1992=100)** 134.5 132.0 2.5 1.9 134.1
Philadelphia Fed's Coincident Index (July 1992=100)*** Jul Jul Jun(Seasonally adjusted) 2016 2015 2016 Connecticut 168.96 162.47 6.49 4.0 168.31 United States 178.26 173.01 5.25 3.0 177.78
the minimum education requiredto enter the occupation. Particularjobs within an occupation mayhave different requirements but inmost cases these requirements willbe at or above the minimum forthe occupation. In addition, someoccupations require workexperience in a related occupation.Finally, some additional on-the-jobtraining, an apprenticeship, or aninternship might be required tobecome proficient in theoccupation. The projections showsignificant growth in manyoccupations that require a collegeor even a professional or advanceddegree in fields such as healthcare, education, finance, andinformation technology. As Chart4 shows, more than 60% of theadditional employment will be inoccupations that require someeducation beyond high school. Onaverage, those occupations thatrequire an Associate’s, Bachelor’s,or Advanced or Professional Degreewill grow significantly faster thanoverall employment.
Education and Wages The projections suggest thateducation will remain valuableover the next ten years. While weare projecting thousands of annualopenings in occupations with aminimum education requirementof less than a high school diploma,the current median wage for theseoccupations is less than $30,000per year (assuming full-year, full-
time work). On the other hand,most of the openings in high-paying occupations (those with acurrent median annual wage of$75,000 or more) require a collegedegree or even a professional oradvanced degree. Chart 5 showsthe number of annual growthopenings projected for occupationsby current median annual wageand minimum education andtraining requirements. The chartshows that there will beopportunities for workers in low-skill, low-paying jobs to increasetheir incomes by gaining acredential and entering a MiddleSkill occupation, while those whoare able to graduate from collegewill greatly increase their chancesof a high-paying career. (MiddleSkill jobs are those that require atleast a high school diploma plussome additional training oreducation – such as an Associate’sDegree – but don’t require a 4-yearcollege degree.)
Accuracy of the Projections –Data Limitations When evaluating theprojections it is important to keepa few things in mind. Theprojections are based on theassumption of a full employmenteconomy in 2024. Given the upsand downs of the business cycle,it is possible that the economy will
not be at full employment at thattime. The average annual openingsare not attempting to predict howmany openings there will be in agiven occupation in any particularyear. As the word “average”suggests, some years will behigher, others will be lower.Finally, while the projections takeinto account as much currentlyavailable economic and labormarket data as we can evaluate,there will be changes over the nextten years which no one cananticipate. Our projections are forindustries and occupations thatcurrently exist. New industriesand occupations that we cannoteven imagine today may wellbecome significant by 2024. Connecticut’s economy hasbeen adding jobs since therecession ended in early 2010.The assumption of fullemployment in 2024 requiresemployment growth of less than1% per year for ten years. Whilesome years will have slowergrowth – and some faster – theaverage growth rate is realistic andattainable. Connecticut projectiondetails are available on theConnecticut Department of Labor’sLabor Market Information page athttp://www1.ctdol.state.ct.us/lmi/projections.asp. More detailednational projections are availableat www.bls.gov/emp.
THE CONNECTICUT ECONOMIC DIGEST6 September 2016
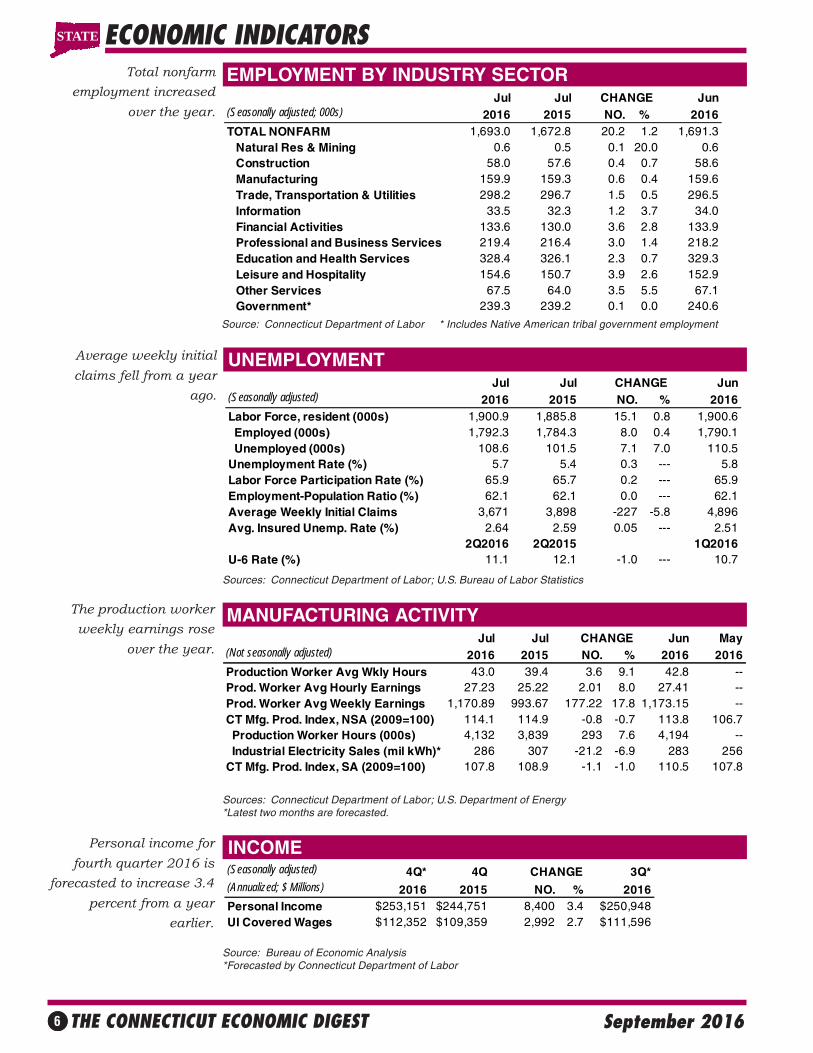
EMPLOYMENT BY INDUSTRY SECTOR
INCOME
Average weekly initial
claims fell from a year
ago.
UNEMPLOYMENT
The production worker
weekly earnings rose
over the year.
MANUFACTURING ACTIVITY
ECONOMIC INDICATORSTotal nonfarm
employment increased
over the year.
Personal income for
fourth quarter 2016 is
forecasted to increase 3.4
percent from a year
earlier.
Source: Connecticut Department of Labor * Includes Native American tribal government employment
Sources: Connecticut Department of Labor; U.S. Bureau of Labor Statistics
Sources: Connecticut Department of Labor; U.S. Department of Energy*Latest two months are forecasted.
Source: Bureau of Economic Analysis*Forecasted by Connecticut Department of Labor
(Seasonally adjusted) 4Q* 4Q CHANGE 3Q*(Annualized; $ Millions) 2016 2015 NO. % 2016Personal Income $253,151 $244,751 8,400 3.4 $250,948UI Covered Wages $112,352 $109,359 2,992 2.7 $111,596
Jul Jul CHANGE Jun(Seasonally adjusted; 000s) 2016 2015 NO. % 2016TOTAL NONFARM 1,693.0 1,672.8 20.2 1.2 1,691.3 Natural Res & Mining 0.6 0.5 0.1 20.0 0.6 Construction 58.0 57.6 0.4 0.7 58.6 Manufacturing 159.9 159.3 0.6 0.4 159.6 Trade, Transportation & Utilities 298.2 296.7 1.5 0.5 296.5 Information 33.5 32.3 1.2 3.7 34.0 Financial Activities 133.6 130.0 3.6 2.8 133.9 Professional and Business Services 219.4 216.4 3.0 1.4 218.2 Education and Health Services 328.4 326.1 2.3 0.7 329.3 Leisure and Hospitality 154.6 150.7 3.9 2.6 152.9 Other Services 67.5 64.0 3.5 5.5 67.1 Government* 239.3 239.2 0.1 0.0 240.6
STATE
Jul Jul CHANGE Jun May(Not seasonally adjusted) 2016 2015 NO. % 2016 2016Production Worker Avg Wkly Hours 43.0 39.4 3.6 9.1 42.8 --Prod. Worker Avg Hourly Earnings 27.23 25.22 2.01 8.0 27.41 --Prod. Worker Avg Weekly Earnings 1,170.89 993.67 177.22 17.8 1,173.15 --CT Mfg. Prod. Index, NSA (2009=100) 114.1 114.9 -0.8 -0.7 113.8 106.7 Production Worker Hours (000s) 4,132 3,839 293 7.6 4,194 -- Industrial Electricity Sales (mil kWh)* 286 307 -21.2 -6.9 283 256CT Mfg. Prod. Index, SA (2009=100) 107.8 108.9 -1.1 -1.0 110.5 107.8
Jul Jul CHANGE Jun(Seasonally adjusted) 2016 2015 NO. % 2016Labor Force, resident (000s) 1,900.9 1,885.8 15.1 0.8 1,900.6 Employed (000s) 1,792.3 1,784.3 8.0 0.4 1,790.1 Unemployed (000s) 108.6 101.5 7.1 7.0 110.5Unemployment Rate (%) 5.7 5.4 0.3 --- 5.8Labor Force Participation Rate (%) 65.9 65.7 0.2 --- 65.9Employment-Population Ratio (%) 62.1 62.1 0.0 --- 62.1Average Weekly Initial Claims 3,671 3,898 -227 -5.8 4,896Avg. Insured Unemp. Rate (%) 2.64 2.59 0.05 --- 2.51
2Q2016 2Q2015 1Q2016U-6 Rate (%) 11.1 12.1 -1.0 --- 10.7
THE CONNECTICUT ECONOMIC DIGEST 7September 2016
TOURISM AND TRAVEL
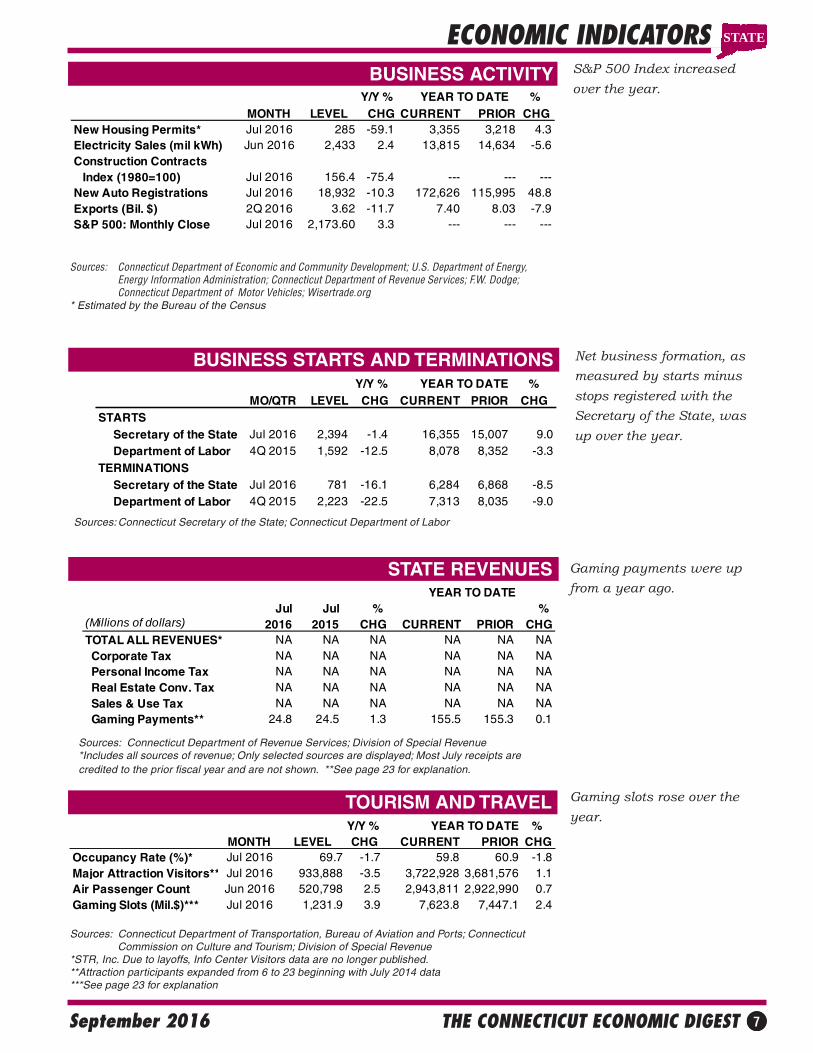
ECONOMIC INDICATORSBUSINESS ACTIVITY S&P 500 Index increased
over the year.
Gaming slots rose over the
year.
BUSINESS STARTS AND TERMINATIONS Net business formation, as
measured by starts minus
stops registered with the
Secretary of the State, was
up over the year.
STATE REVENUES
Sources: Connecticut Department of Economic and Community Development; U.S. Department of Energy,Energy Information Administration; Connecticut Department of Revenue Services; F.W. Dodge;Connecticut Department of Motor Vehicles; Wisertrade.org
* Estimated by the Bureau of the Census
Sources: Connecticut Secretary of the State; Connecticut Department of Labor
Jul Jul % % (Millions of dollars) 2016 2015 CHG CURRENT PRIOR CHGTOTAL ALL REVENUES* NA NA NA NA NA NA Corporate Tax NA NA NA NA NA NA Personal Income Tax NA NA NA NA NA NA Real Estate Conv. Tax NA NA NA NA NA NA Sales & Use Tax NA NA NA NA NA NA Gaming Payments** 24.8 24.5 1.3 155.5 155.3 0.1
YEAR TO DATE
Sources: Connecticut Department of Revenue Services; Division of Special Revenue*Includes all sources of revenue; Only selected sources are displayed; Most July receipts arecredited to the prior fiscal year and are not shown. **See page 23 for explanation.
Sources: Connecticut Department of Transportation, Bureau of Aviation and Ports; ConnecticutCommission on Culture and Tourism; Division of Special Revenue
*STR, Inc. Due to layoffs, Info Center Visitors data are no longer published.**Attraction participants expanded from 6 to 23 beginning with July 2014 data***See page 23 for explanation
Y/Y % YEAR TO DATE % MONTH LEVEL CHG CURRENT PRIOR CHG
Occupancy Rate (%)* Jul 2016 69.7 -1.7 59.8 60.9 -1.8Major Attraction Visitors** Jul 2016 933,888 -3.5 3,722,928 3,681,576 1.1Air Passenger Count Jun 2016 520,798 2.5 2,943,811 2,922,990 0.7Gaming Slots (Mil.$)*** Jul 2016 1,231.9 3.9 7,623.8 7,447.1 2.4
Y/Y % %MO/QTR LEVEL CHG CURRENT PRIOR CHG
STARTS Secretary of the State Jul 2016 2,394 -1.4 16,355 15,007 9.0 Department of Labor 4Q 2015 1,592 -12.5 8,078 8,352 -3.3
TERMINATIONS Secretary of the State Jul 2016 781 -16.1 6,284 6,868 -8.5 Department of Labor 4Q 2015 2,223 -22.5 7,313 8,035 -9.0
YEAR TO DATE
STATE
Gaming payments were up
from a year ago.
Y/Y % YEAR TO DATE % MONTH LEVEL CHG CURRENT PRIOR CHG
New Housing Permits* Jul 2016 285 -59.1 3,355 3,218 4.3Electricity Sales (mil kWh) Jun 2016 2,433 2.4 13,815 14,634 -5.6Construction Contracts Index (1980=100) Jul 2016 156.4 -75.4 --- --- ---New Auto Registrations Jul 2016 18,932 -10.3 172,626 115,995 48.8Exports (Bil. $) 2Q 2016 3.62 -11.7 7.40 8.03 -7.9S&P 500: Monthly Close Jul 2016 2,173.60 3.3 --- --- ---
THE CONNECTICUT ECONOMIC DIGEST8 September 2016
CONSUMER NEWS
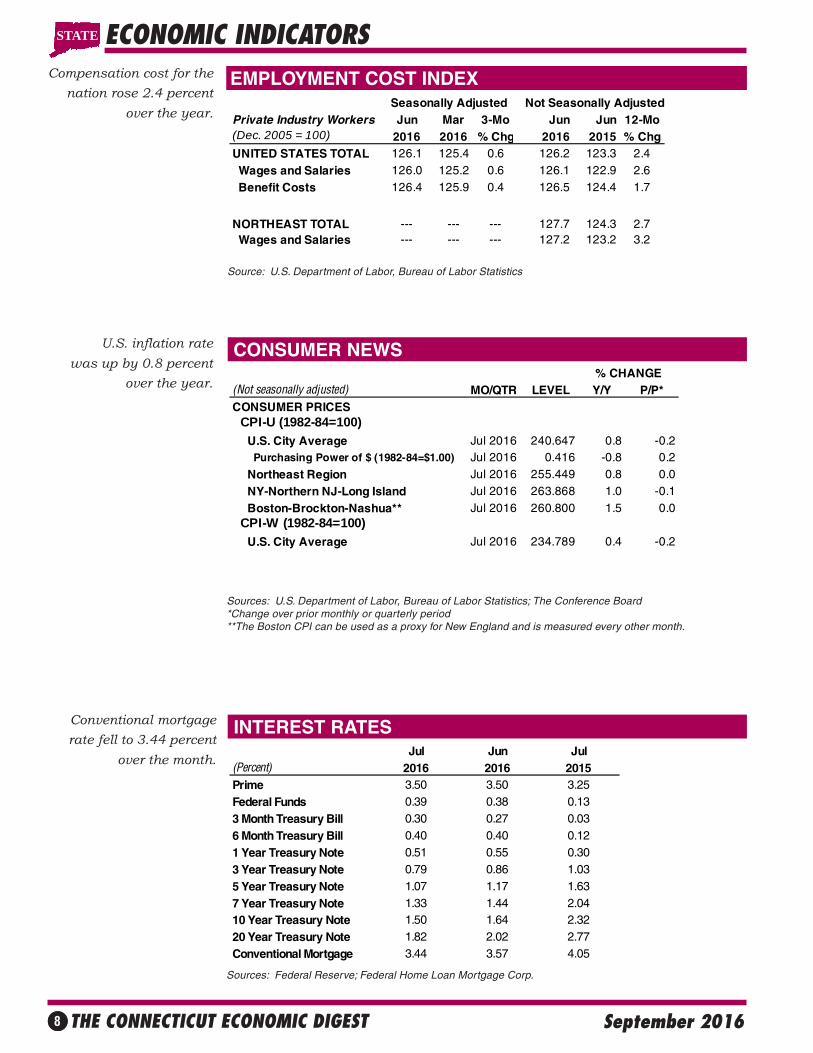
EMPLOYMENT COST INDEXCompensation cost for the
nation rose 2.4 percent
over the year.
Conventional mortgage
rate fell to 3.44 percent
over the month.
INTEREST RATES
ECONOMIC INDICATORS
U.S. inflation rate
was up by 0.8 percent
over the year.
Source: U.S. Department of Labor, Bureau of Labor Statistics
Sources: U.S. Department of Labor, Bureau of Labor Statistics; The Conference Board*Change over prior monthly or quarterly period**The Boston CPI can be used as a proxy for New England and is measured every other month.
Sources: Federal Reserve; Federal Home Loan Mortgage Corp.
Jul Jun Jul(Percent) 2016 2016 2015Prime 3.50 3.50 3.25
Federal Funds 0.39 0.38 0.13
3 Month Treasury Bill 0.30 0.27 0.03
6 Month Treasury Bill 0.40 0.40 0.12
1 Year Treasury Note 0.51 0.55 0.30
3 Year Treasury Note 0.79 0.86 1.03
5 Year Treasury Note 1.07 1.17 1.63
7 Year Treasury Note 1.33 1.44 2.0410 Year Treasury Note 1.50 1.64 2.32
20 Year Treasury Note 1.82 2.02 2.77
Conventional Mortgage 3.44 3.57 4.05
Seasonally Adjusted Not Seasonally AdjustedPrivate Industry Workers Jun Mar 3-Mo Jun Jun 12-Mo(Dec. 2005 = 100) 2016 2016 % Chg 2016 2015 % ChgUNITED STATES TOTAL 126.1 125.4 0.6 126.2 123.3 2.4
Wages and Salaries 126.0 125.2 0.6 126.1 122.9 2.6
Benefit Costs 126.4 125.9 0.4 126.5 124.4 1.7
NORTHEAST TOTAL --- --- --- 127.7 124.3 2.7 Wages and Salaries --- --- --- 127.2 123.2 3.2
STATE
(Not seasonally adjusted) MO/QTR LEVEL Y/Y P/P*CONSUMER PRICES CPI-U (1982-84=100)
U.S. City Average Jul 2016 240.647 0.8 -0.2 Purchasing Power of $ (1982-84=$1.00) Jul 2016 0.416 -0.8 0.2
Northeast Region Jul 2016 255.449 0.8 0.0
NY-Northern NJ-Long Island Jul 2016 263.868 1.0 -0.1
Boston-Brockton-Nashua** Jul 2016 260.800 1.5 0.0 CPI-W (1982-84=100)
U.S. City Average Jul 2016 234.789 0.4 -0.2
% CHANGE
THE CONNECTICUT ECONOMIC DIGEST 9September 2016
UNEMPLOYMENT RATES
LABOR FORCE
NONFARM EMPLOYMENT
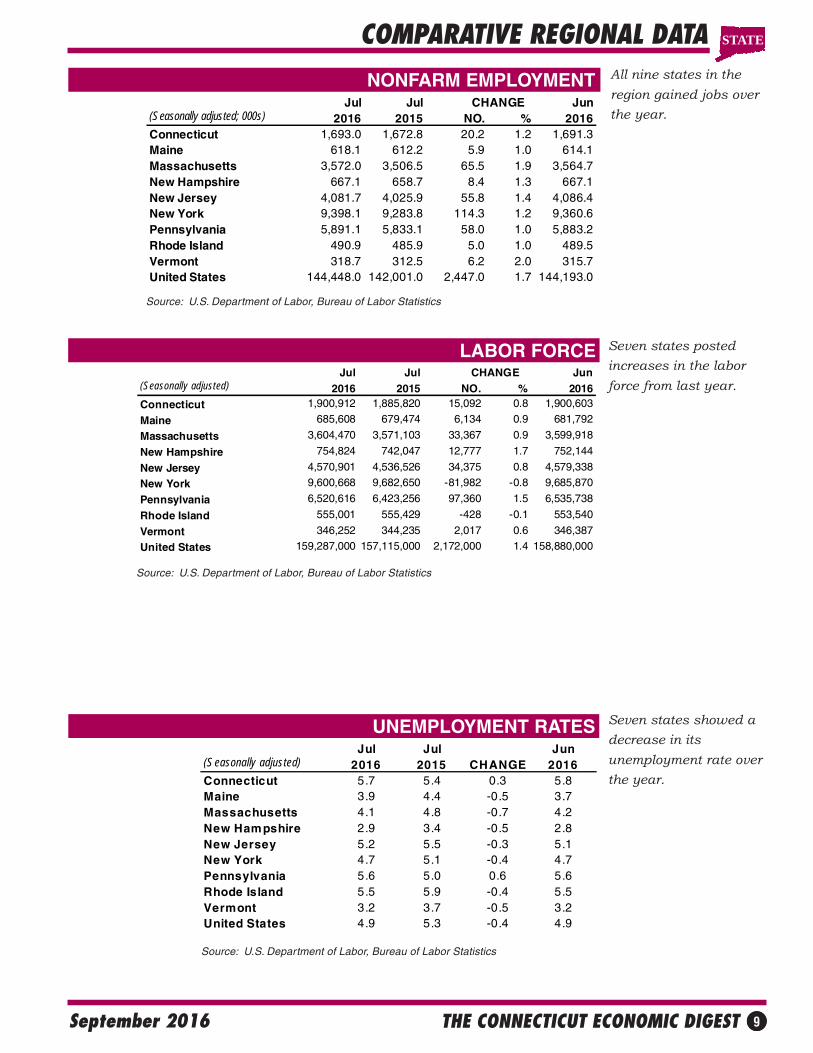
Seven states showed a
decrease in its
unemployment rate over
the year.
All nine states in the
region gained jobs over
the year.
Seven states posted
increases in the labor
force from last year.
COMPARATIVE REGIONAL DATA
Source: U.S. Department of Labor, Bureau of Labor Statistics
Source: U.S. Department of Labor, Bureau of Labor Statistics
Source: U.S. Department of Labor, Bureau of Labor Statistics
Jul Jul CHANGE Jun(Seasonally adjusted; 000s) 2016 2015 NO. % 2016Connecticut 1,693.0 1,672.8 20.2 1.2 1,691.3Maine 618.1 612.2 5.9 1.0 614.1Massachusetts 3,572.0 3,506.5 65.5 1.9 3,564.7New Hampshire 667.1 658.7 8.4 1.3 667.1New Jersey 4,081.7 4,025.9 55.8 1.4 4,086.4New York 9,398.1 9,283.8 114.3 1.2 9,360.6Pennsylvania 5,891.1 5,833.1 58.0 1.0 5,883.2Rhode Island 490.9 485.9 5.0 1.0 489.5Vermont 318.7 312.5 6.2 2.0 315.7United States 144,448.0 142,001.0 2,447.0 1.7 144,193.0
Jul Jul CHANGE Jun(Seasonally adjusted) 2016 2015 NO. % 2016Connecticut 1,900,912 1,885,820 15,092 0.8 1,900,603
Maine 685,608 679,474 6,134 0.9 681,792
Massachusetts 3,604,470 3,571,103 33,367 0.9 3,599,918
New Hampshire 754,824 742,047 12,777 1.7 752,144
New Jersey 4,570,901 4,536,526 34,375 0.8 4,579,338
New York 9,600,668 9,682,650 -81,982 -0.8 9,685,870
Pennsylvania 6,520,616 6,423,256 97,360 1.5 6,535,738
Rhode Island 555,001 555,429 -428 -0.1 553,540
Vermont 346,252 344,235 2,017 0.6 346,387
United States 159,287,000 157,115,000 2,172,000 1.4 158,880,000
Jul Jul Jun(Seasonally adjusted) 2016 2015 CHANGE 2016Connecticut 5.7 5.4 0.3 5.8Maine 3.9 4.4 -0.5 3.7Massachusetts 4.1 4.8 -0.7 4.2New Hampshire 2.9 3.4 -0.5 2.8New Jersey 5.2 5.5 -0.3 5.1New York 4.7 5.1 -0.4 4.7Pennsylvania 5.6 5.0 0.6 5.6Rhode Island 5.5 5.9 -0.4 5.5Vermont 3.2 3.7 -0.5 3.2United States 4.9 5.3 -0.4 4.9
STATE
THE CONNECTICUT ECONOMIC DIGEST10 September 2016
ECONOMIC INDICATOR TRENDSSTATE
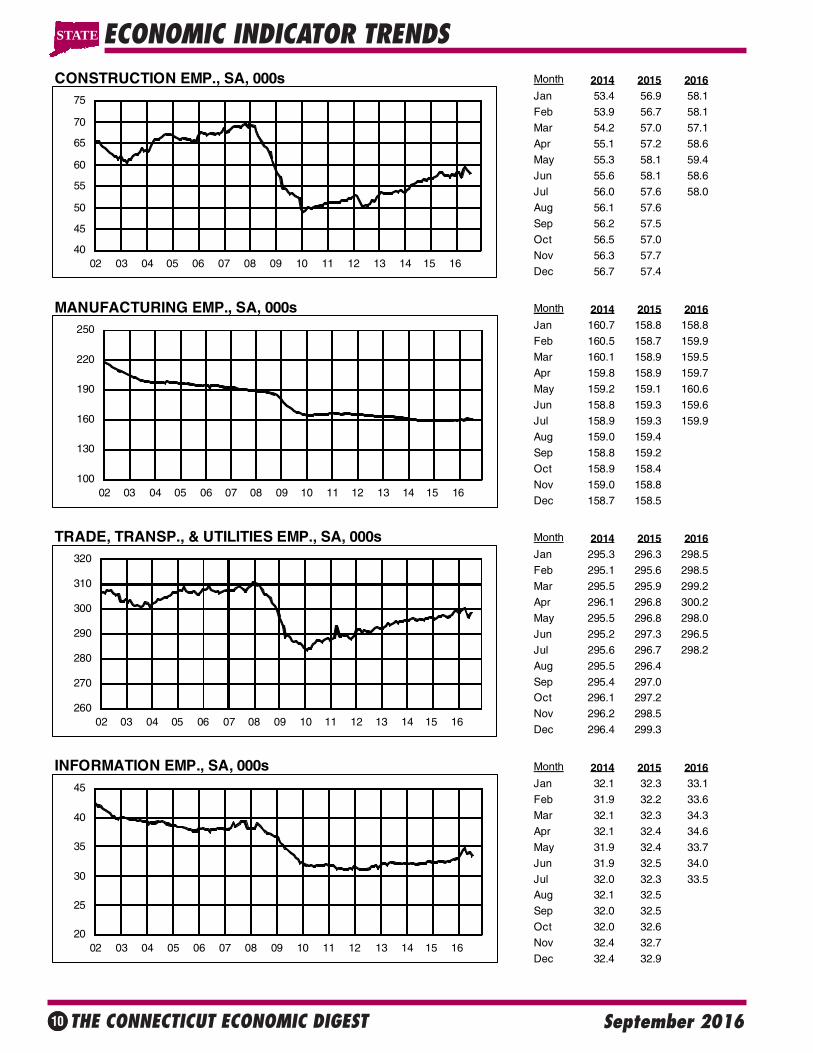
CONSTRUCTION EMP., SA, 000s Month 2014 2015 2016Jan 53.4 56.9 58.1
Feb 53.9 56.7 58.1
Mar 54.2 57.0 57.1
Apr 55.1 57.2 58.6
May 55.3 58.1 59.4
Jun 55.6 58.1 58.6
Jul 56.0 57.6 58.0
Aug 56.1 57.6
Sep 56.2 57.5
Oct 56.5 57.0
Nov 56.3 57.7
Dec 56.7 57.4
MANUFACTURING EMP., SA, 000s Month 2014 2015 2016Jan 160.7 158.8 158.8
Feb 160.5 158.7 159.9
Mar 160.1 158.9 159.5
Apr 159.8 158.9 159.7
May 159.2 159.1 160.6
Jun 158.8 159.3 159.6
Jul 158.9 159.3 159.9
Aug 159.0 159.4
Sep 158.8 159.2
Oct 158.9 158.4
Nov 159.0 158.8
Dec 158.7 158.5
TRADE, TRANSP., & UTILITIES EMP., SA, 000s Month 2014 2015 2016Jan 295.3 296.3 298.5
Feb 295.1 295.6 298.5
Mar 295.5 295.9 299.2
Apr 296.1 296.8 300.2
May 295.5 296.8 298.0
Jun 295.2 297.3 296.5
Jul 295.6 296.7 298.2
Aug 295.5 296.4
Sep 295.4 297.0Oct 296.1 297.2
Nov 296.2 298.5
Dec 296.4 299.3
INFORMATION EMP., SA, 000s Month 2014 2015 2016Jan 32.1 32.3 33.1
Feb 31.9 32.2 33.6
Mar 32.1 32.3 34.3
Apr 32.1 32.4 34.6
May 31.9 32.4 33.7
Jun 31.9 32.5 34.0
Jul 32.0 32.3 33.5Aug 32.1 32.5
Sep 32.0 32.5
Oct 32.0 32.6
Nov 32.4 32.7
Dec 32.4 32.9
100
130
160
190
220
250
02 03 04 05 06 07 08 09 10 11 12 13 14 15 16
40
45
50
55
60
65
70
75
02 03 04 05 06 07 08 09 10 11 12 13 14 15 16
20
25
30
35
40
45
02 03 04 05 06 07 08 09 10 11 12 13 14 15 16
260
270
280
290
300
310
320
02 03 04 05 06 07 08 09 10 11 12 13 14 15 16
THE CONNECTICUT ECONOMIC DIGEST 11September 2016
ECONOMIC INDICATOR TRENDS STATE
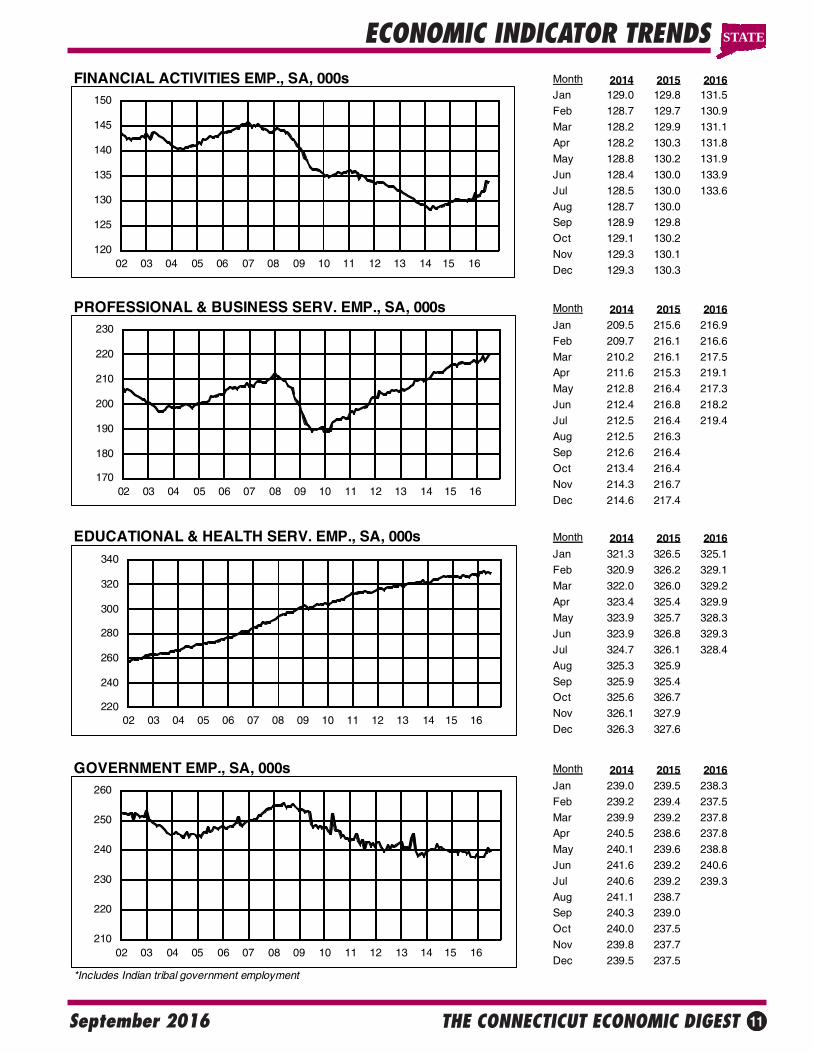
FINANCIAL ACTIVITIES EMP., SA, 000s Month 2014 2015 2016Jan 129.0 129.8 131.5
Feb 128.7 129.7 130.9
Mar 128.2 129.9 131.1
Apr 128.2 130.3 131.8
May 128.8 130.2 131.9
Jun 128.4 130.0 133.9
Jul 128.5 130.0 133.6
Aug 128.7 130.0Sep 128.9 129.8
Oct 129.1 130.2
Nov 129.3 130.1
Dec 129.3 130.3
PROFESSIONAL & BUSINESS SERV. EMP., SA, 000s Month 2014 2015 2016Jan 209.5 215.6 216.9
Feb 209.7 216.1 216.6
Mar 210.2 216.1 217.5Apr 211.6 215.3 219.1
May 212.8 216.4 217.3
Jun 212.4 216.8 218.2
Jul 212.5 216.4 219.4
Aug 212.5 216.3
Sep 212.6 216.4
Oct 213.4 216.4
Nov 214.3 216.7
Dec 214.6 217.4
EDUCATIONAL & HEALTH SERV. EMP., SA, 000s Month 2014 2015 2016Jan 321.3 326.5 325.1
Feb 320.9 326.2 329.1
Mar 322.0 326.0 329.2
Apr 323.4 325.4 329.9
May 323.9 325.7 328.3
Jun 323.9 326.8 329.3
Jul 324.7 326.1 328.4
Aug 325.3 325.9
Sep 325.9 325.4Oct 325.6 326.7
Nov 326.1 327.9
Dec 326.3 327.6
170
180
190
200
210
220
230
02 03 04 05 06 07 08 09 10 11 12 13 14 15 16
220
240
260
280
300
320
340
02 03 04 05 06 07 08 09 10 11 12 13 14 15 16
120
125
130
135
140
145
150
02 03 04 05 06 07 08 09 10 11 12 13 14 15 16
GOVERNMENT EMP., SA, 000s Month 2014 2015 2016Jan 239.0 239.5 238.3
Feb 239.2 239.4 237.5
Mar 239.9 239.2 237.8Apr 240.5 238.6 237.8
May 240.1 239.6 238.8
Jun 241.6 239.2 240.6
Jul 240.6 239.2 239.3
Aug 241.1 238.7Sep 240.3 239.0
Oct 240.0 237.5
Nov 239.8 237.7
Dec 239.5 237.5*Includes Indian tribal government employment
210
220
230
240
250
260
02 03 04 05 06 07 08 09 10 11 12 13 14 15 16
THE CONNECTICUT ECONOMIC DIGEST12 September 2016
Not Seasonally Adjusted
Jul Jul CHANGE Jun2016 2015 NO. % 2016
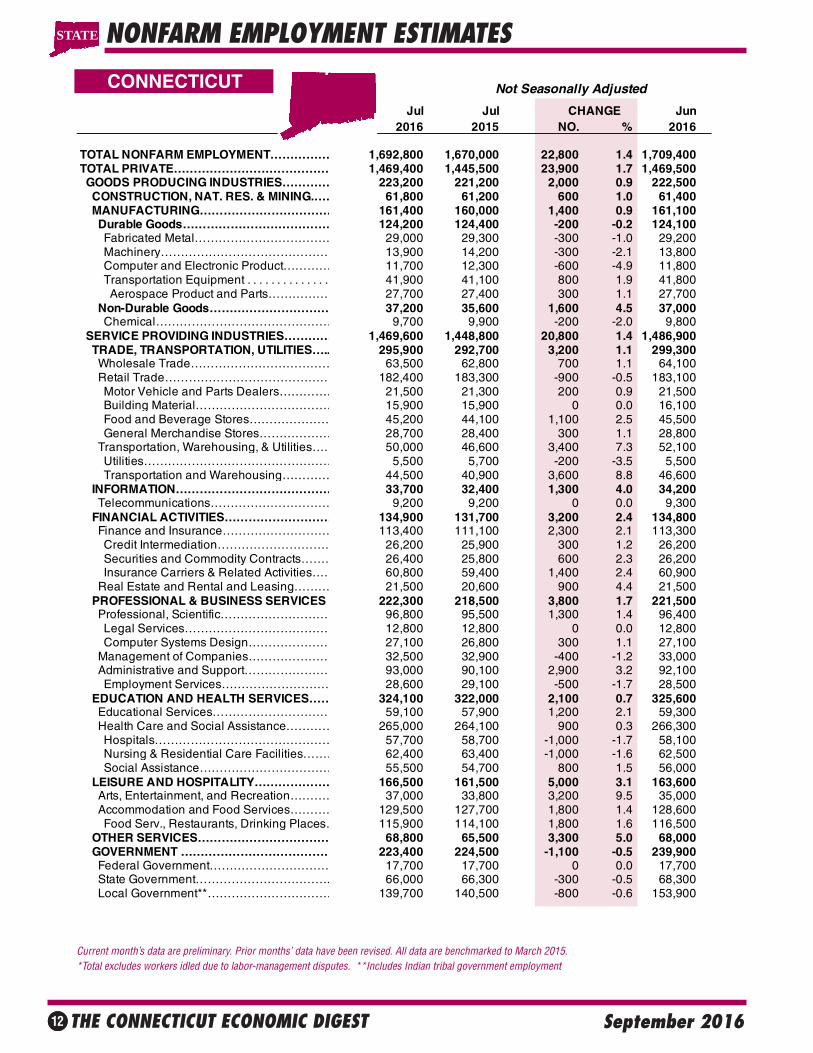
TOTAL NONFARM EMPLOYMENT…………… 1,692,800 1,670,000 22,800 1.4 1,709,400TOTAL PRIVATE………………………………… 1,469,400 1,445,500 23,900 1.7 1,469,500 GOODS PRODUCING INDUSTRIES………… 223,200 221,200 2,000 0.9 222,500 CONSTRUCTION, NAT. RES. & MINING.…… 61,800 61,200 600 1.0 61,400 MANUFACTURING…………………………… 161,400 160,000 1,400 0.9 161,100 Durable Goods………………………………… 124,200 124,400 -200 -0.2 124,100 Fabricated Metal……………………………… 29,000 29,300 -300 -1.0 29,200 Machinery…………………………………… 13,900 14,200 -300 -2.1 13,800 Computer and Electronic Product………… 11,700 12,300 -600 -4.9 11,800 Transportation Equipment . . . . . . . . . . . . . . 41,900 41,100 800 1.9 41,800 Aerospace Product and Parts…………… 27,700 27,400 300 1.1 27,700 Non-Durable Goods………………………… 37,200 35,600 1,600 4.5 37,000 Chemical……………………………………… 9,700 9,900 -200 -2.0 9,800 SERVICE PROVIDING INDUSTRIES………… 1,469,600 1,448,800 20,800 1.4 1,486,900 TRADE, TRANSPORTATION, UTILITIES….. 295,900 292,700 3,200 1.1 299,300 Wholesale Trade……………………………… 63,500 62,800 700 1.1 64,100 Retail Trade…………………………………… 182,400 183,300 -900 -0.5 183,100 Motor Vehicle and Parts Dealers…………… 21,500 21,300 200 0.9 21,500 Building Material……………………………… 15,900 15,900 0 0.0 16,100 Food and Beverage Stores………………… 45,200 44,100 1,100 2.5 45,500 General Merchandise Stores……………… 28,700 28,400 300 1.1 28,800 Transportation, Warehousing, & Utilities…… 50,000 46,600 3,400 7.3 52,100 Utilities………………………………………… 5,500 5,700 -200 -3.5 5,500 Transportation and Warehousing………… 44,500 40,900 3,600 8.8 46,600 INFORMATION………………………………… 33,700 32,400 1,300 4.0 34,200 Telecommunications………………………… 9,200 9,200 0 0.0 9,300 FINANCIAL ACTIVITIES……………………… 134,900 131,700 3,200 2.4 134,800 Finance and Insurance……………………… 113,400 111,100 2,300 2.1 113,300 Credit Intermediation………………………… 26,200 25,900 300 1.2 26,200 Securities and Commodity Contracts……… 26,400 25,800 600 2.3 26,200 Insurance Carriers & Related Activities…… 60,800 59,400 1,400 2.4 60,900 Real Estate and Rental and Leasing……… 21,500 20,600 900 4.4 21,500 PROFESSIONAL & BUSINESS SERVICES 222,300 218,500 3,800 1.7 221,500 Professional, Scientific……………………… 96,800 95,500 1,300 1.4 96,400 Legal Services……………………………… 12,800 12,800 0 0.0 12,800 Computer Systems Design………………… 27,100 26,800 300 1.1 27,100 Management of Companies………………… 32,500 32,900 -400 -1.2 33,000 Administrative and Support………………… 93,000 90,100 2,900 3.2 92,100 Employment Services……………………… 28,600 29,100 -500 -1.7 28,500 EDUCATION AND HEALTH SERVICES…… 324,100 322,000 2,100 0.7 325,600 Educational Services………………………… 59,100 57,900 1,200 2.1 59,300 Health Care and Social Assistance………… 265,000 264,100 900 0.3 266,300 Hospitals……………………………………… 57,700 58,700 -1,000 -1.7 58,100 Nursing & Residential Care Facilities……… 62,400 63,400 -1,000 -1.6 62,500 Social Assistance…………………………… 55,500 54,700 800 1.5 56,000 LEISURE AND HOSPITALITY………………… 166,500 161,500 5,000 3.1 163,600 Arts, Entertainment, and Recreation………… 37,000 33,800 3,200 9.5 35,000 Accommodation and Food Services………… 129,500 127,700 1,800 1.4 128,600 Food Serv., Restaurants, Drinking Places… 115,900 114,100 1,800 1.6 116,500 OTHER SERVICES…………………………… 68,800 65,500 3,300 5.0 68,000 GOVERNMENT ………………………………… 223,400 224,500 -1,100 -0.5 239,900 Federal Government………………………… 17,700 17,700 0 0.0 17,700 State Government……………………………. 66,000 66,300 -300 -0.5 68,300 Local Government**…………………………… 139,700 140,500 -800 -0.6 153,900
CONNECTICUT
NONFARM EMPLOYMENT ESTIMATES
Current month’s data are preliminary. Prior months’ data have been revised. All data are benchmarked to March 2015. *Total excludes workers idled due to labor-management disputes. **Includes Indian tribal government employment
STATE
THE CONNECTICUT ECONOMIC DIGEST 13September 2016
DANBURY LMA
BRIDGEPORT -STAMFORD LMA
NONFARM EMPLOYMENT ESTIMATES
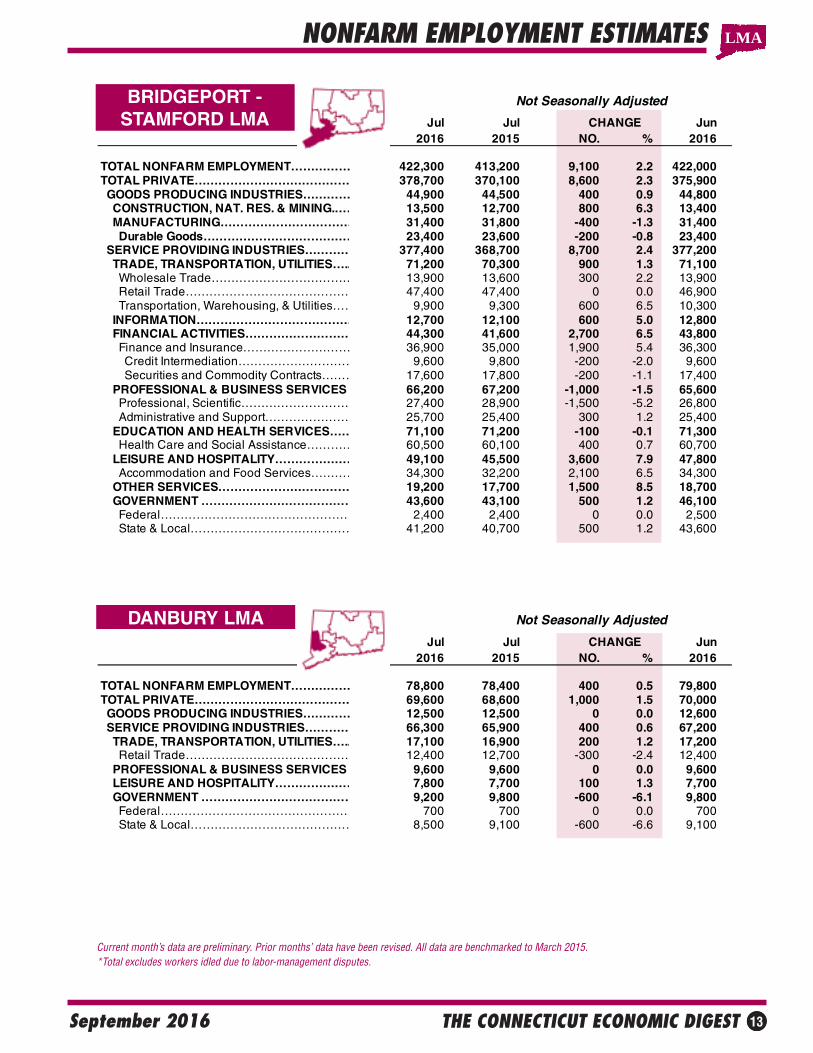
Current month’s data are preliminary. Prior months’ data have been revised. All data are benchmarked to March 2015. *Total excludes workers idled due to labor-management disputes.
LMA
Not Seasonally Adjusted
Jul Jul CHANGE Jun2016 2015 NO. % 2016
TOTAL NONFARM EMPLOYMENT…………… 422,300 413,200 9,100 2.2 422,000TOTAL PRIVATE………………………………… 378,700 370,100 8,600 2.3 375,900 GOODS PRODUCING INDUSTRIES………… 44,900 44,500 400 0.9 44,800 CONSTRUCTION, NAT. RES. & MINING.…… 13,500 12,700 800 6.3 13,400 MANUFACTURING…………………………… 31,400 31,800 -400 -1.3 31,400 Durable Goods………………………………… 23,400 23,600 -200 -0.8 23,400 SERVICE PROVIDING INDUSTRIES………… 377,400 368,700 8,700 2.4 377,200 TRADE, TRANSPORTATION, UTILITIES….. 71,200 70,300 900 1.3 71,100 Wholesale Trade……………………………… 13,900 13,600 300 2.2 13,900 Retail Trade…………………………………… 47,400 47,400 0 0.0 46,900 Transportation, Warehousing, & Utilities…… 9,900 9,300 600 6.5 10,300 INFORMATION………………………………… 12,700 12,100 600 5.0 12,800 FINANCIAL ACTIVITIES……………………… 44,300 41,600 2,700 6.5 43,800 Finance and Insurance……………………… 36,900 35,000 1,900 5.4 36,300 Credit Intermediation………………………… 9,600 9,800 -200 -2.0 9,600 Securities and Commodity Contracts……… 17,600 17,800 -200 -1.1 17,400 PROFESSIONAL & BUSINESS SERVICES 66,200 67,200 -1,000 -1.5 65,600 Professional, Scientific……………………… 27,400 28,900 -1,500 -5.2 26,800 Administrative and Support………………… 25,700 25,400 300 1.2 25,400 EDUCATION AND HEALTH SERVICES…… 71,100 71,200 -100 -0.1 71,300 Health Care and Social Assistance………… 60,500 60,100 400 0.7 60,700 LEISURE AND HOSPITALITY………………… 49,100 45,500 3,600 7.9 47,800 Accommodation and Food Services………… 34,300 32,200 2,100 6.5 34,300 OTHER SERVICES…………………………… 19,200 17,700 1,500 8.5 18,700 GOVERNMENT ………………………………… 43,600 43,100 500 1.2 46,100 Federal………………………………………… 2,400 2,400 0 0.0 2,500 State & Local…………………………………… 41,200 40,700 500 1.2 43,600
Not Seasonally Adjusted
Jul Jul CHANGE Jun2016 2015 NO. % 2016
TOTAL NONFARM EMPLOYMENT…………… 78,800 78,400 400 0.5 79,800TOTAL PRIVATE………………………………… 69,600 68,600 1,000 1.5 70,000 GOODS PRODUCING INDUSTRIES………… 12,500 12,500 0 0.0 12,600 SERVICE PROVIDING INDUSTRIES………… 66,300 65,900 400 0.6 67,200 TRADE, TRANSPORTATION, UTILITIES….. 17,100 16,900 200 1.2 17,200 Retail Trade…………………………………… 12,400 12,700 -300 -2.4 12,400 PROFESSIONAL & BUSINESS SERVICES 9,600 9,600 0 0.0 9,600 LEISURE AND HOSPITALITY………………… 7,800 7,700 100 1.3 7,700 GOVERNMENT ………………………………… 9,200 9,800 -600 -6.1 9,800 Federal………………………………………… 700 700 0 0.0 700 State & Local…………………………………… 8,500 9,100 -600 -6.6 9,100

THE CONNECTICUT ECONOMIC DIGEST14 September 2016
HARTFORD LMA
NONFARM EMPLOYMENT ESTIMATESLMA
SEASONALLY ADJUSTED TOTAL NONFARM EMPLOYMENT
Current month’s data are preliminary. Prior months’ data have been revised. All data are benchmarked to March 2015.*Total excludes workers idled due to labor-management disputes
** Unofficial seasonally adjusted estimates produced by the Connecticut Department of Labor
Not Seasonally Adjusted
Jul Jul CHANGE Jun2016 2015 NO. % 2016
TOTAL NONFARM EMPLOYMENT…………… 571,300 564,400 6,900 1.2 578,300TOTAL PRIVATE………………………………… 489,900 482,700 7,200 1.5 492,000 GOODS PRODUCING INDUSTRIES………… 77,300 76,800 500 0.7 77,100 CONSTRUCTION, NAT. RES. & MINING.…… 21,200 21,100 100 0.5 21,000 MANUFACTURING…………………………… 56,100 55,700 400 0.7 56,100 Durable Goods………………………………… 46,400 46,200 200 0.4 46,500 Non-Durable Goods………………………… 9,700 9,500 200 2.1 9,600 SERVICE PROVIDING INDUSTRIES………… 494,000 487,600 6,400 1.3 501,200 TRADE, TRANSPORTATION, UTILITIES….. 88,400 87,800 600 0.7 89,900 Wholesale Trade……………………………… 17,000 18,000 -1,000 -5.6 17,100 Retail Trade…………………………………… 55,400 55,500 -100 -0.2 55,900 Transportation, Warehousing, & Utilities…… 16,000 14,300 1,700 11.9 16,900 Transportation and Warehousing………… 15,100 13,400 1,700 12.7 16,000 INFORMATION………………………………… 12,000 11,900 100 0.8 12,200 FINANCIAL ACTIVITIES……………………… 58,400 58,000 400 0.7 58,500 Depository Credit Institutions……………… 6,100 6,100 0 0.0 6,100 Insurance Carriers & Related Activities…… 38,000 38,200 -200 -0.5 38,100 PROFESSIONAL & BUSINESS SERVICES 75,300 74,100 1,200 1.6 75,500 Professional, Scientific……………………… 34,500 34,600 -100 -0.3 34,600 Management of Companies………………… 10,000 10,000 0 0.0 10,000 Administrative and Support………………… 30,800 29,500 1,300 4.4 30,900 EDUCATION AND HEALTH SERVICES…… 105,700 103,500 2,200 2.1 106,600 Educational Services………………………… 11,600 11,500 100 0.9 12,300 Health Care and Social Assistance………… 94,100 92,000 2,100 2.3 94,300 Ambulatory Health Care…………………… 31,500 30,900 600 1.9 31,900 LEISURE AND HOSPITALITY………………… 49,500 48,700 800 1.6 49,100 Accommodation and Food Services………… 40,200 39,100 1,100 2.8 40,200 OTHER SERVICES…………………………… 23,300 21,900 1,400 6.4 23,100 GOVERNMENT ………………………………… 81,400 81,700 -300 -0.4 86,300 Federal………………………………………… 5,400 5,400 0 0.0 5,400 State & Local…………………………………… 76,000 76,300 -300 -0.4 80,900
Seasonally AdjustedJul Jul CHANGE Jun
Labor Market Areas 2016 2015 NO. % 2016 BRIDGEPORT-STAMFORD LMA……………… 415,200 409,100 6,100 1.5 414,500 DANBURY LMA**……………………………… 78,800 78,500 300 0.4 78,700 HARTFORD LMA………………………………. 575,100 568,500 6,600 1.2 573,200 NEW HAVEN LMA……………………………… 284,400 279,300 5,100 1.8 284,200 NORWICH-NEW LONDON LMA……………… 128,800 127,700 1,100 0.9 128,800 WATERBURY LMA**…………………………… 67,600 66,200 1,400 2.1 67,600 ENFIELD LMA**………………………………… 45,700 45,700 0 0.0 45,400 TORRINGTON-NORTHWEST LMA**………… 33,900 33,700 200 0.6 34,000 DANIELSON-NORTHEAST LMA**…………… 27,200 26,900 300 1.1 27,200
THE CONNECTICUT ECONOMIC DIGEST 15September 2016
NEW HAVEN LMA
NONFARM EMPLOYMENT ESTIMATES
Current month’s data are preliminary. Prior months’ data have been revised. All data are benchmarked to March 2015. *Total excludes workers idled due to labor-management disputes. **Value less than 50
LMA
HELP WANTED ONLINE
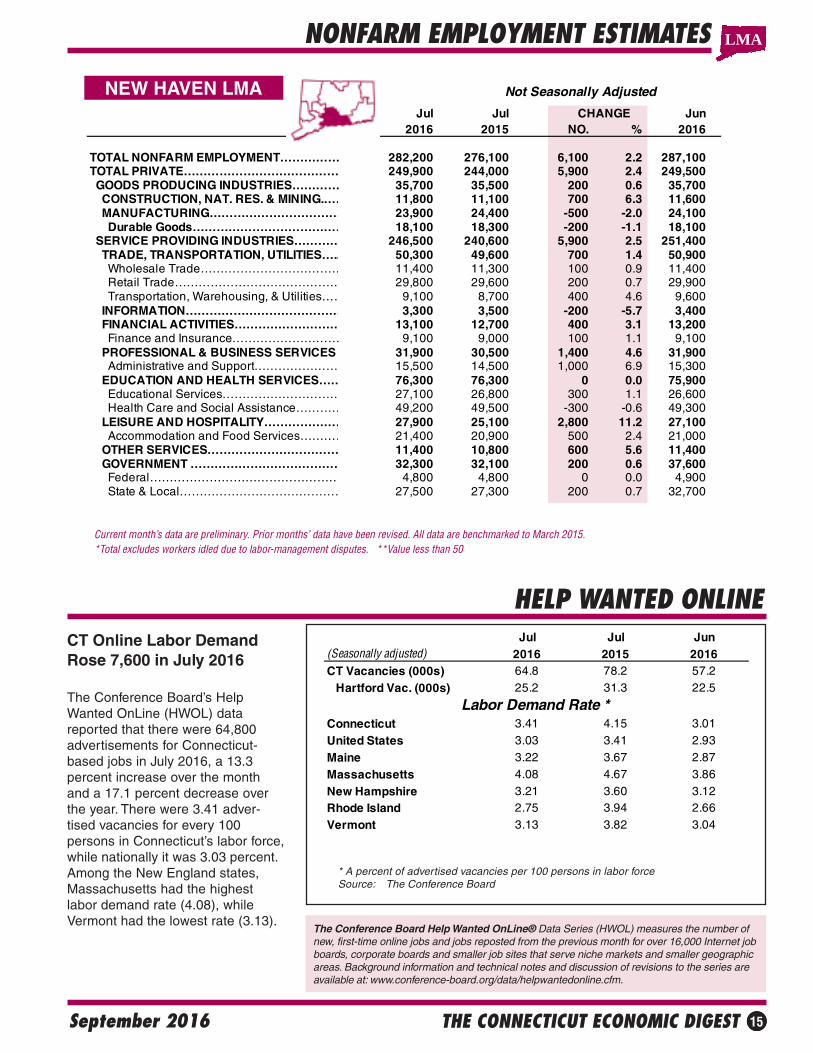
* A percent of advertised vacancies per 100 persons in labor forceSource: The Conference Board
CT Online Labor DemandRose 7,600 in July 2016
The Conference Board’s HelpWanted OnLine (HWOL) datareported that there were 64,800advertisements for Connecticut-based jobs in July 2016, a 13.3percent increase over the monthand a 17.1 percent decrease overthe year. There were 3.41 adver-tised vacancies for every 100persons in Connecticut’s labor force,while nationally it was 3.03 percent.Among the New England states,Massachusetts had the highestlabor demand rate (4.08), whileVermont had the lowest rate (3.13).
The Conference Board Help Wanted OnLine® Data Series (HWOL) measures the number ofnew, first-time online jobs and jobs reposted from the previous month for over 16,000 Internet jobboards, corporate boards and smaller job sites that serve niche markets and smaller geographicareas. Background information and technical notes and discussion of revisions to the series areavailable at: www.conference-board.org/data/helpwantedonline.cfm.
Not Seasonally Adjusted
Jul Jul CHANGE Jun2016 2015 NO. % 2016
TOTAL NONFARM EMPLOYMENT…………… 282,200 276,100 6,100 2.2 287,100 TOTAL PRIVATE………………………………… 249,900 244,000 5,900 2.4 249,500 GOODS PRODUCING INDUSTRIES………… 35,700 35,500 200 0.6 35,700 CONSTRUCTION, NAT. RES. & MINING.…… 11,800 11,100 700 6.3 11,600 MANUFACTURING…………………………… 23,900 24,400 -500 -2.0 24,100 Durable Goods………………………………… 18,100 18,300 -200 -1.1 18,100 SERVICE PROVIDING INDUSTRIES………… 246,500 240,600 5,900 2.5 251,400 TRADE, TRANSPORTATION, UTILITIES….. 50,300 49,600 700 1.4 50,900 Wholesale Trade……………………………… 11,400 11,300 100 0.9 11,400 Retail Trade…………………………………… 29,800 29,600 200 0.7 29,900 Transportation, Warehousing, & Utilities…… 9,100 8,700 400 4.6 9,600 INFORMATION………………………………… 3,300 3,500 -200 -5.7 3,400 FINANCIAL ACTIVITIES……………………… 13,100 12,700 400 3.1 13,200 Finance and Insurance……………………… 9,100 9,000 100 1.1 9,100 PROFESSIONAL & BUSINESS SERVICES 31,900 30,500 1,400 4.6 31,900 Administrative and Support………………… 15,500 14,500 1,000 6.9 15,300 EDUCATION AND HEALTH SERVICES…… 76,300 76,300 0 0.0 75,900 Educational Services………………………… 27,100 26,800 300 1.1 26,600 Health Care and Social Assistance………… 49,200 49,500 -300 -0.6 49,300 LEISURE AND HOSPITALITY………………… 27,900 25,100 2,800 11.2 27,100 Accommodation and Food Services………… 21,400 20,900 500 2.4 21,000 OTHER SERVICES…………………………… 11,400 10,800 600 5.6 11,400 GOVERNMENT ………………………………… 32,300 32,100 200 0.6 37,600 Federal………………………………………… 4,800 4,800 0 0.0 4,900 State & Local…………………………………… 27,500 27,300 200 0.7 32,700
Jul Jul Jun(Seasonally adjusted) 2016 2015 2016CT Vacancies (000s) 64.8 78.2 57.2
Hartford Vac. (000s) 25.2 31.3 22.5
Connecticut 3.41 4.15 3.01
United States 3.03 3.41 2.93
Maine 3.22 3.67 2.87
Massachusetts 4.08 4.67 3.86
New Hampshire 3.21 3.60 3.12Rhode Island 2.75 3.94 2.66
Vermont 3.13 3.82 3.04
Labor Demand Rate *
THE CONNECTICUT ECONOMIC DIGEST16 September 2016
NORWICH-NEW LONDON-WESTERLY, CT-RI LMA
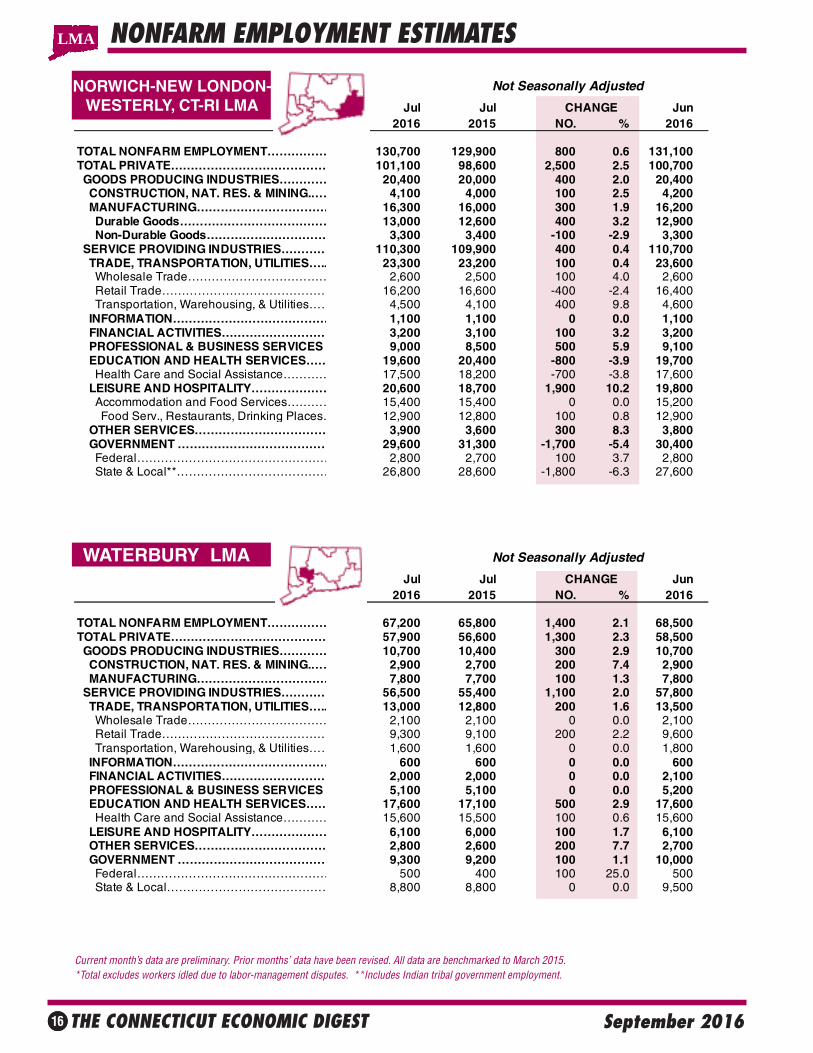
Current month’s data are preliminary. Prior months’ data have been revised. All data are benchmarked to March 2015. *Total excludes workers idled due to labor-management disputes. **Includes Indian tribal government employment.
NONFARM EMPLOYMENT ESTIMATES
WATERBURY LMA
LMA
Not Seasonally Adjusted
Jul Jul CHANGE Jun2016 2015 NO. % 2016
TOTAL NONFARM EMPLOYMENT…………… 130,700 129,900 800 0.6 131,100TOTAL PRIVATE………………………………… 101,100 98,600 2,500 2.5 100,700 GOODS PRODUCING INDUSTRIES………… 20,400 20,000 400 2.0 20,400 CONSTRUCTION, NAT. RES. & MINING.…… 4,100 4,000 100 2.5 4,200 MANUFACTURING…………………………… 16,300 16,000 300 1.9 16,200 Durable Goods………………………………… 13,000 12,600 400 3.2 12,900 Non-Durable Goods………………………… 3,300 3,400 -100 -2.9 3,300 SERVICE PROVIDING INDUSTRIES………… 110,300 109,900 400 0.4 110,700 TRADE, TRANSPORTATION, UTILITIES….. 23,300 23,200 100 0.4 23,600 Wholesale Trade……………………………… 2,600 2,500 100 4.0 2,600 Retail Trade…………………………………… 16,200 16,600 -400 -2.4 16,400 Transportation, Warehousing, & Utilities…… 4,500 4,100 400 9.8 4,600 INFORMATION………………………………… 1,100 1,100 0 0.0 1,100 FINANCIAL ACTIVITIES……………………… 3,200 3,100 100 3.2 3,200 PROFESSIONAL & BUSINESS SERVICES 9,000 8,500 500 5.9 9,100 EDUCATION AND HEALTH SERVICES…… 19,600 20,400 -800 -3.9 19,700 Health Care and Social Assistance………… 17,500 18,200 -700 -3.8 17,600 LEISURE AND HOSPITALITY………………… 20,600 18,700 1,900 10.2 19,800 Accommodation and Food Services………… 15,400 15,400 0 0.0 15,200 Food Serv., Restaurants, Drinking Places… 12,900 12,800 100 0.8 12,900 OTHER SERVICES…………………………… 3,900 3,600 300 8.3 3,800 GOVERNMENT ………………………………… 29,600 31,300 -1,700 -5.4 30,400 Federal………………………………………… 2,800 2,700 100 3.7 2,800 State & Local**………………………………… 26,800 28,600 -1,800 -6.3 27,600
Not Seasonally Adjusted
Jul Jul CHANGE Jun 2016 2015 NO. % 2016
TOTAL NONFARM EMPLOYMENT…………… 67,200 65,800 1,400 2.1 68,500TOTAL PRIVATE………………………………… 57,900 56,600 1,300 2.3 58,500 GOODS PRODUCING INDUSTRIES………… 10,700 10,400 300 2.9 10,700 CONSTRUCTION, NAT. RES. & MINING.…… 2,900 2,700 200 7.4 2,900 MANUFACTURING…………………………… 7,800 7,700 100 1.3 7,800 SERVICE PROVIDING INDUSTRIES………… 56,500 55,400 1,100 2.0 57,800 TRADE, TRANSPORTATION, UTILITIES….. 13,000 12,800 200 1.6 13,500 Wholesale Trade……………………………… 2,100 2,100 0 0.0 2,100 Retail Trade…………………………………… 9,300 9,100 200 2.2 9,600 Transportation, Warehousing, & Utilities…… 1,600 1,600 0 0.0 1,800 INFORMATION………………………………… 600 600 0 0.0 600 FINANCIAL ACTIVITIES……………………… 2,000 2,000 0 0.0 2,100 PROFESSIONAL & BUSINESS SERVICES 5,100 5,100 0 0.0 5,200 EDUCATION AND HEALTH SERVICES…… 17,600 17,100 500 2.9 17,600 Health Care and Social Assistance………… 15,600 15,500 100 0.6 15,600 LEISURE AND HOSPITALITY………………… 6,100 6,000 100 1.7 6,100 OTHER SERVICES…………………………… 2,800 2,600 200 7.7 2,700 GOVERNMENT ………………………………… 9,300 9,200 100 1.1 10,000 Federal………………………………………… 500 400 100 25.0 500 State & Local…………………………………… 8,800 8,800 0 0.0 9,500
THE CONNECTICUT ECONOMIC DIGEST 17September 2016
NONFARM EMPLOYMENT ESTIMATES
NOTE: More industry detail data is available for the State and its nine labor market areas at: http://www.ctdol.state.ct.us/lmi/202/covered.htm. The data published there differ from the data in the preced-ing tables in that they are developed from a near-universe count of Connecticut employment covered bythe unemployment insurance (UI) program, while the data here is sample-based. The data drawn fromthe UI program does not contain estimates of employment not covered by unemployment insurance, andis lagged several months behind the current employment estimates presented here.
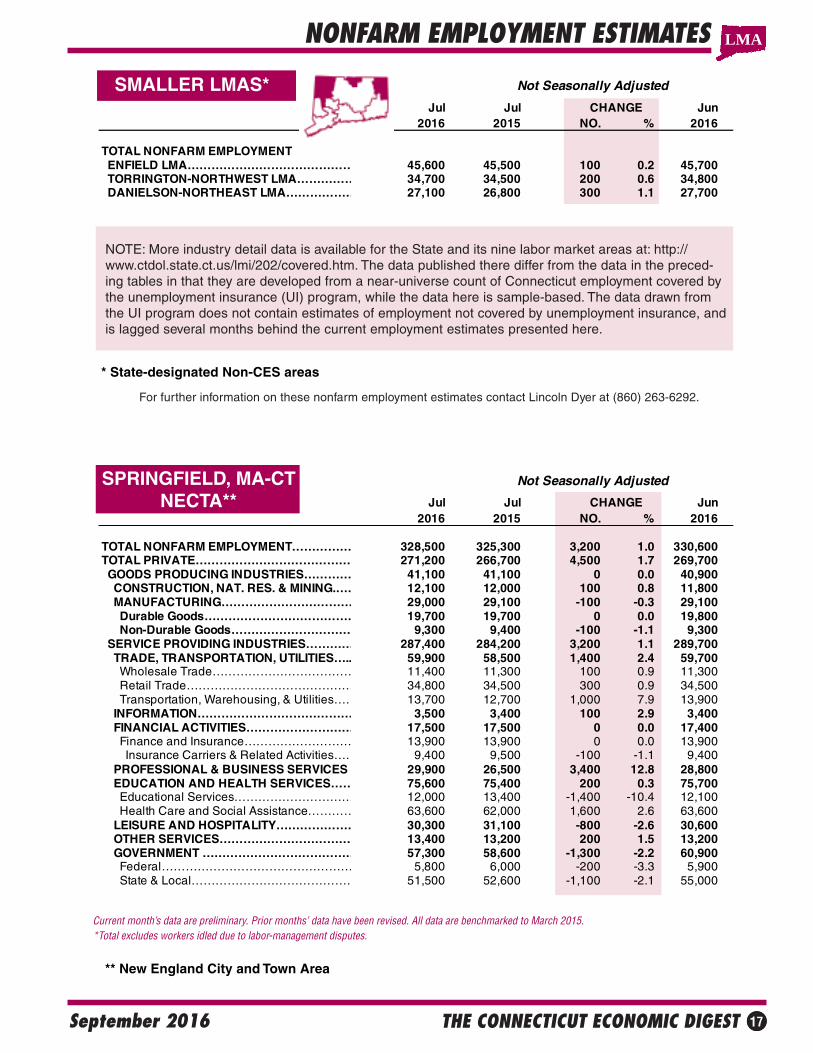
SMALLER LMAS*
Current month’s data are preliminary. Prior months’ data have been revised. All data are benchmarked to March 2015. *Total excludes workers idled due to labor-management disputes.
SPRINGFIELD, MA-CTNECTA**
** New England City and Town Area
LMA
For further information on these nonfarm employment estimates contact Lincoln Dyer at (860) 263-6292.
Not Seasonally Adjusted
Jul Jul CHANGE Jun 2016 2015 NO. % 2016
TOTAL NONFARM EMPLOYMENT ENFIELD LMA…………………………………… 45,600 45,500 100 0.2 45,700 TORRINGTON-NORTHWEST LMA…………… 34,700 34,500 200 0.6 34,800 DANIELSON-NORTHEAST LMA……………… 27,100 26,800 300 1.1 27,700
Not Seasonally Adjusted
Jul Jul CHANGE Jun2016 2015 NO. % 2016
TOTAL NONFARM EMPLOYMENT…………… 328,500 325,300 3,200 1.0 330,600TOTAL PRIVATE………………………………… 271,200 266,700 4,500 1.7 269,700 GOODS PRODUCING INDUSTRIES………… 41,100 41,100 0 0.0 40,900 CONSTRUCTION, NAT. RES. & MINING.…… 12,100 12,000 100 0.8 11,800 MANUFACTURING…………………………… 29,000 29,100 -100 -0.3 29,100 Durable Goods………………………………… 19,700 19,700 0 0.0 19,800 Non-Durable Goods………………………… 9,300 9,400 -100 -1.1 9,300 SERVICE PROVIDING INDUSTRIES………… 287,400 284,200 3,200 1.1 289,700 TRADE, TRANSPORTATION, UTILITIES….. 59,900 58,500 1,400 2.4 59,700 Wholesale Trade……………………………… 11,400 11,300 100 0.9 11,300 Retail Trade…………………………………… 34,800 34,500 300 0.9 34,500 Transportation, Warehousing, & Utilities…… 13,700 12,700 1,000 7.9 13,900 INFORMATION………………………………… 3,500 3,400 100 2.9 3,400 FINANCIAL ACTIVITIES……………………… 17,500 17,500 0 0.0 17,400 Finance and Insurance……………………… 13,900 13,900 0 0.0 13,900 Insurance Carriers & Related Activities…… 9,400 9,500 -100 -1.1 9,400 PROFESSIONAL & BUSINESS SERVICES 29,900 26,500 3,400 12.8 28,800 EDUCATION AND HEALTH SERVICES…… 75,600 75,400 200 0.3 75,700 Educational Services………………………… 12,000 13,400 -1,400 -10.4 12,100 Health Care and Social Assistance………… 63,600 62,000 1,600 2.6 63,600 LEISURE AND HOSPITALITY………………… 30,300 31,100 -800 -2.6 30,600 OTHER SERVICES…………………………… 13,400 13,200 200 1.5 13,200 GOVERNMENT ………………………………… 57,300 58,600 -1,300 -2.2 60,900 Federal………………………………………… 5,800 6,000 -200 -3.3 5,900 State & Local…………………………………… 51,500 52,600 -1,100 -2.1 55,000
* State-designated Non-CES areas
THE CONNECTICUT ECONOMIC DIGEST18 September 2016
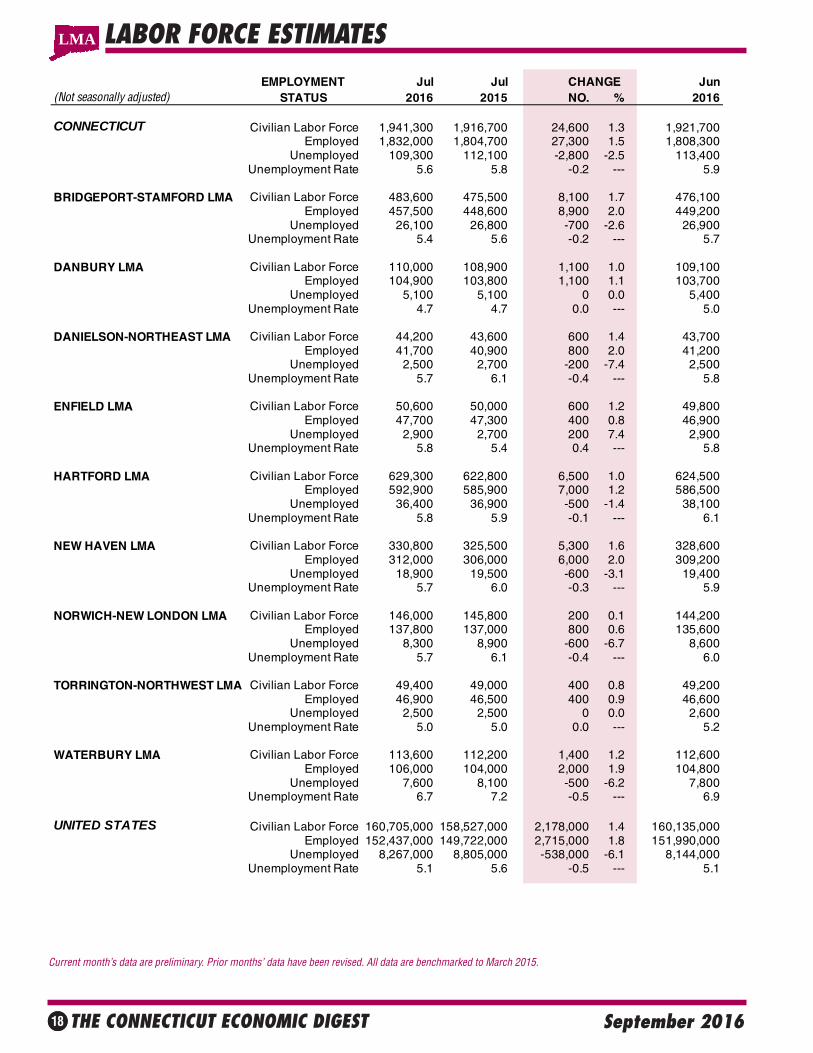
LABOR FORCE ESTIMATES
Current month’s data are preliminary. Prior months’ data have been revised. All data are benchmarked to March 2015.
EMPLOYMENT Jul Jul CHANGE Jun(Not seasonally adjusted) STATUS 2016 2015 NO. % 2016
CONNECTICUT Civilian Labor Force 1,941,300 1,916,700 24,600 1.3 1,921,700Employed 1,832,000 1,804,700 27,300 1.5 1,808,300
Unemployed 109,300 112,100 -2,800 -2.5 113,400Unemployment Rate 5.6 5.8 -0.2 --- 5.9
BRIDGEPORT-STAMFORD LMA Civilian Labor Force 483,600 475,500 8,100 1.7 476,100Employed 457,500 448,600 8,900 2.0 449,200
Unemployed 26,100 26,800 -700 -2.6 26,900Unemployment Rate 5.4 5.6 -0.2 --- 5.7
DANBURY LMA Civilian Labor Force 110,000 108,900 1,100 1.0 109,100Employed 104,900 103,800 1,100 1.1 103,700
Unemployed 5,100 5,100 0 0.0 5,400Unemployment Rate 4.7 4.7 0.0 --- 5.0
DANIELSON-NORTHEAST LMA Civilian Labor Force 44,200 43,600 600 1.4 43,700Employed 41,700 40,900 800 2.0 41,200
Unemployed 2,500 2,700 -200 -7.4 2,500Unemployment Rate 5.7 6.1 -0.4 --- 5.8
ENFIELD LMA Civilian Labor Force 50,600 50,000 600 1.2 49,800Employed 47,700 47,300 400 0.8 46,900
Unemployed 2,900 2,700 200 7.4 2,900Unemployment Rate 5.8 5.4 0.4 --- 5.8
HARTFORD LMA Civilian Labor Force 629,300 622,800 6,500 1.0 624,500Employed 592,900 585,900 7,000 1.2 586,500
Unemployed 36,400 36,900 -500 -1.4 38,100Unemployment Rate 5.8 5.9 -0.1 --- 6.1
NEW HAVEN LMA Civilian Labor Force 330,800 325,500 5,300 1.6 328,600Employed 312,000 306,000 6,000 2.0 309,200
Unemployed 18,900 19,500 -600 -3.1 19,400Unemployment Rate 5.7 6.0 -0.3 --- 5.9
NORWICH-NEW LONDON LMA Civilian Labor Force 146,000 145,800 200 0.1 144,200Employed 137,800 137,000 800 0.6 135,600
Unemployed 8,300 8,900 -600 -6.7 8,600Unemployment Rate 5.7 6.1 -0.4 --- 6.0
TORRINGTON-NORTHWEST LMA Civilian Labor Force 49,400 49,000 400 0.8 49,200Employed 46,900 46,500 400 0.9 46,600
Unemployed 2,500 2,500 0 0.0 2,600Unemployment Rate 5.0 5.0 0.0 --- 5.2
WATERBURY LMA Civilian Labor Force 113,600 112,200 1,400 1.2 112,600Employed 106,000 104,000 2,000 1.9 104,800
Unemployed 7,600 8,100 -500 -6.2 7,800Unemployment Rate 6.7 7.2 -0.5 --- 6.9
UNITED STATES Civilian Labor Force 160,705,000 158,527,000 2,178,000 1.4 160,135,000Employed 152,437,000 149,722,000 2,715,000 1.8 151,990,000
Unemployed 8,267,000 8,805,000 -538,000 -6.1 8,144,000Unemployment Rate 5.1 5.6 -0.5 --- 5.1
LMA
THE CONNECTICUT ECONOMIC DIGEST 19September 2016
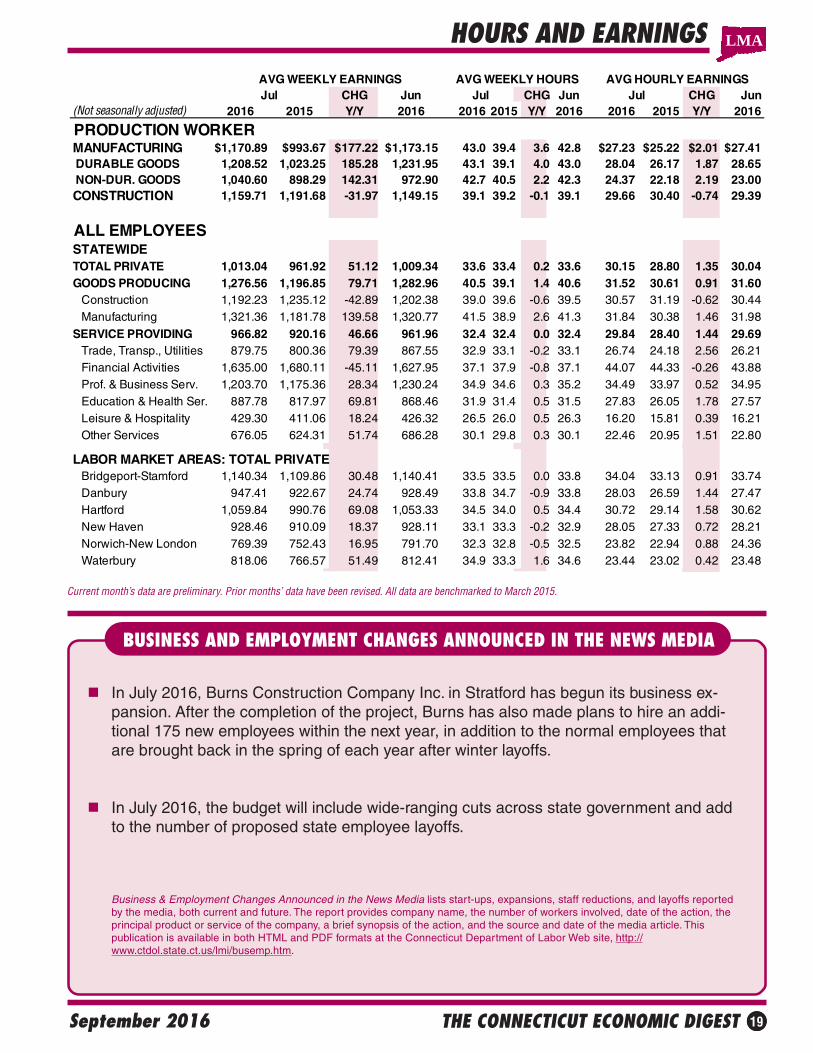
HOURS AND EARNINGS
Current month’s data are preliminary. Prior months’ data have been revised. All data are benchmarked to March 2015.
BUSINESS AND EMPLOYMENT CHANGES ANNOUNCED IN THE NEWS MEDIA
In July 2016, Burns Construction Company Inc. in Stratford has begun its business ex-pansion. After the completion of the project, Burns has also made plans to hire an addi-tional 175 new employees within the next year, in addition to the normal employees thatare brought back in the spring of each year after winter layoffs.
In July 2016, the budget will include wide-ranging cuts across state government and addto the number of proposed state employee layoffs.
Business & Employment Changes Announced in the News Media lists start-ups, expansions, staff reductions, and layoffs reportedby the media, both current and future. The report provides company name, the number of workers involved, date of the action, theprincipal product or service of the company, a brief synopsis of the action, and the source and date of the media article. Thispublication is available in both HTML and PDF formats at the Connecticut Department of Labor Web site, http://www.ctdol.state.ct.us/lmi/busemp.htm.
LMA
AVG WEEKLY EARNINGS AVG WEEKLY HOURS AVG HOURLY EARNINGSJul CHG Jun Jul CHG Jun Jul CHG Jun
(Not seasonally adjusted) 2016 2015 Y/Y 2016 2016 2015 Y/Y 2016 2016 2015 Y/Y 2016
PRODUCTION WORKERMANUFACTURING $1,170.89 $993.67 $177.22 $1,173.15 43.0 39.4 3.6 42.8 $27.23 $25.22 $2.01 $27.41 DURABLE GOODS 1,208.52 1,023.25 185.28 1,231.95 43.1 39.1 4.0 43.0 28.04 26.17 1.87 28.65 NON-DUR. GOODS 1,040.60 898.29 142.31 972.90 42.7 40.5 2.2 42.3 24.37 22.18 2.19 23.00CONSTRUCTION 1,159.71 1,191.68 -31.97 1,149.15 39.1 39.2 -0.1 39.1 29.66 30.40 -0.74 29.39
ALL EMPLOYEESSTATEWIDETOTAL PRIVATE 1,013.04 961.92 51.12 1,009.34 33.6 33.4 0.2 33.6 30.15 28.80 1.35 30.04GOODS PRODUCING 1,276.56 1,196.85 79.71 1,282.96 40.5 39.1 1.4 40.6 31.52 30.61 0.91 31.60 Construction 1,192.23 1,235.12 -42.89 1,202.38 39.0 39.6 -0.6 39.5 30.57 31.19 -0.62 30.44 Manufacturing 1,321.36 1,181.78 139.58 1,320.77 41.5 38.9 2.6 41.3 31.84 30.38 1.46 31.98SERVICE PROVIDING 966.82 920.16 46.66 961.96 32.4 32.4 0.0 32.4 29.84 28.40 1.44 29.69 Trade, Transp., Utilities 879.75 800.36 79.39 867.55 32.9 33.1 -0.2 33.1 26.74 24.18 2.56 26.21 Financial Activities 1,635.00 1,680.11 -45.11 1,627.95 37.1 37.9 -0.8 37.1 44.07 44.33 -0.26 43.88 Prof. & Business Serv. 1,203.70 1,175.36 28.34 1,230.24 34.9 34.6 0.3 35.2 34.49 33.97 0.52 34.95 Education & Health Ser. 887.78 817.97 69.81 868.46 31.9 31.4 0.5 31.5 27.83 26.05 1.78 27.57 Leisure & Hospitality 429.30 411.06 18.24 426.32 26.5 26.0 0.5 26.3 16.20 15.81 0.39 16.21 Other Services 676.05 624.31 51.74 686.28 30.1 29.8 0.3 30.1 22.46 20.95 1.51 22.80
LABOR MARKET AREAS: TOTAL PRIVATE Bridgeport-Stamford 1,140.34 1,109.86 30.48 1,140.41 33.5 33.5 0.0 33.8 34.04 33.13 0.91 33.74 Danbury 947.41 922.67 24.74 928.49 33.8 34.7 -0.9 33.8 28.03 26.59 1.44 27.47 Hartford 1,059.84 990.76 69.08 1,053.33 34.5 34.0 0.5 34.4 30.72 29.14 1.58 30.62 New Haven 928.46 910.09 18.37 928.11 33.1 33.3 -0.2 32.9 28.05 27.33 0.72 28.21 Norwich-New London 769.39 752.43 16.95 791.70 32.3 32.8 -0.5 32.5 23.82 22.94 0.88 24.36 Waterbury 818.06 766.57 51.49 812.41 34.9 33.3 1.6 34.6 23.44 23.02 0.42 23.48
THE CONNECTICUT ECONOMIC DIGEST20 September 2016
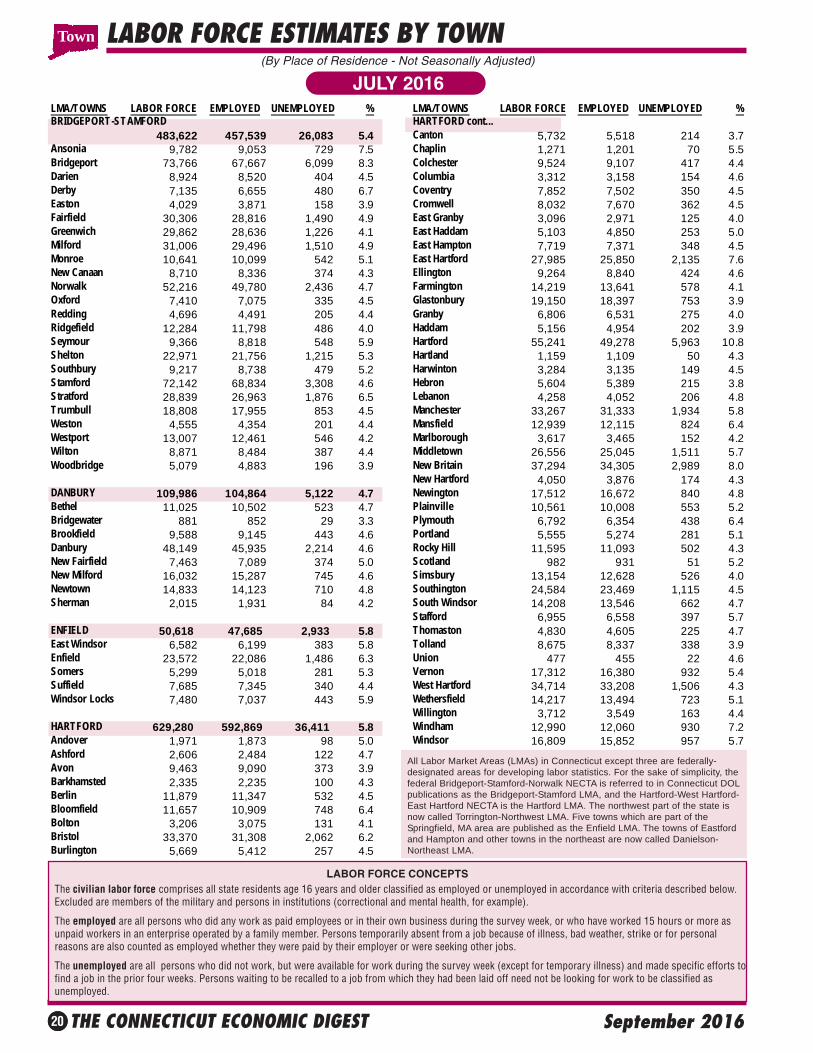
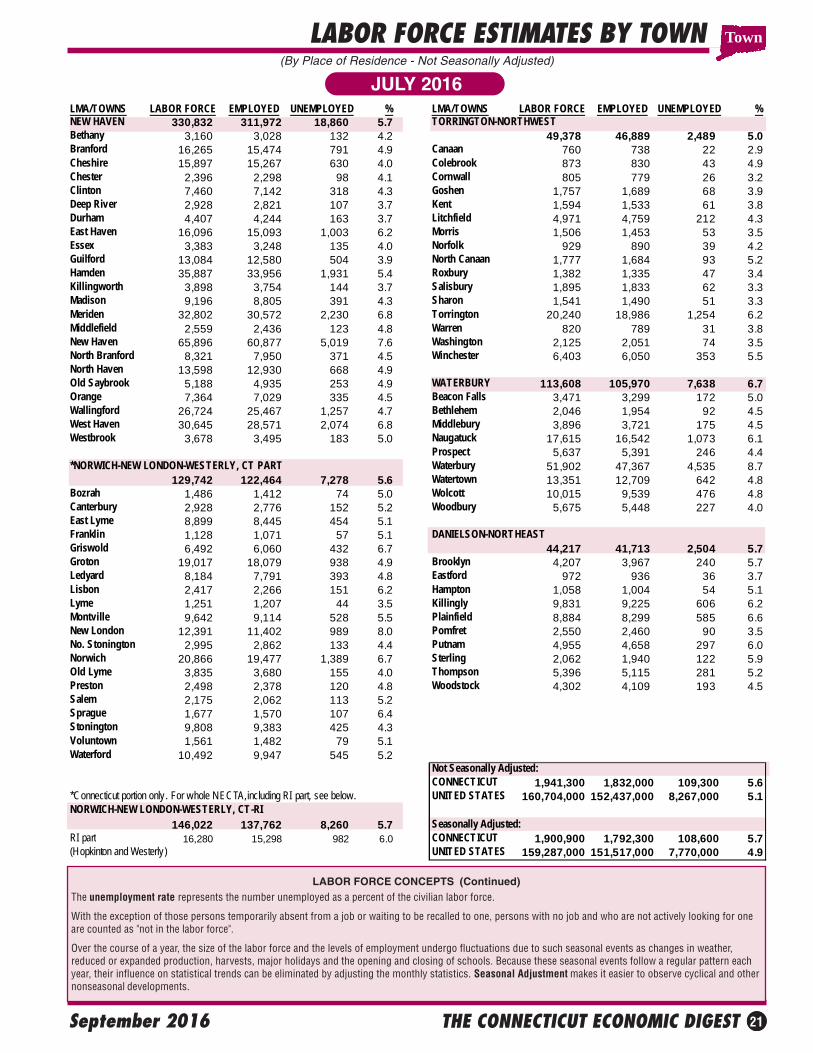
LABOR FORCE ESTIMATES BY TOWN
JULY 2016(By Place of Residence - Not Seasonally Adjusted)
The civilian labor force comprises all state residents age 16 years and older classified as employed or unemployed in accordance with criteria described below.Excluded are members of the military and persons in institutions (correctional and mental health, for example).
The employed are all persons who did any work as paid employees or in their own business during the survey week, or who have worked 15 hours or more asunpaid workers in an enterprise operated by a family member. Persons temporarily absent from a job because of illness, bad weather, strike or for personalreasons are also counted as employed whether they were paid by their employer or were seeking other jobs.
The unemployed are all persons who did not work, but were available for work during the survey week (except for temporary illness) and made specific efforts tofind a job in the prior four weeks. Persons waiting to be recalled to a job from which they had been laid off need not be looking for work to be classified asunemployed.
LABOR FORCE CONCEPTS
Town
All Labor Market Areas (LMAs) in Connecticut except three are federally-designated areas for developing labor statistics. For the sake of simplicity, thefederal Bridgeport-Stamford-Norwalk NECTA is referred to in Connecticut DOLpublications as the Bridgeport-Stamford LMA, and the Hartford-West Hartford-East Hartford NECTA is the Hartford LMA. The northwest part of the state isnow called Torrington-Northwest LMA. Five towns which are part of theSpringfield, MA area are published as the Enfield LMA. The towns of Eastfordand Hampton and other towns in the northeast are now called Danielson-Northeast LMA.
LMA/TOWNS LABOR FORCE EMPLOYED UNEMPLOYED % LMA/TOWNS LABOR FORCE EMPLOYED UNEMPLOYED %BRIDGEPORT-STAMFORD HARTFORD cont...
483,622 457,539 26,083 5.4 Canton 5,732 5,518 214 3.7Ansonia 9,782 9,053 729 7.5 Chaplin 1,271 1,201 70 5.5Bridgeport 73,766 67,667 6,099 8.3 Colchester 9,524 9,107 417 4.4Darien 8,924 8,520 404 4.5 Columbia 3,312 3,158 154 4.6Derby 7,135 6,655 480 6.7 Coventry 7,852 7,502 350 4.5Easton 4,029 3,871 158 3.9 Cromwell 8,032 7,670 362 4.5Fairfield 30,306 28,816 1,490 4.9 East Granby 3,096 2,971 125 4.0Greenwich 29,862 28,636 1,226 4.1 East Haddam 5,103 4,850 253 5.0Milford 31,006 29,496 1,510 4.9 East Hampton 7,719 7,371 348 4.5Monroe 10,641 10,099 542 5.1 East Hartford 27,985 25,850 2,135 7.6New Canaan 8,710 8,336 374 4.3 Ellington 9,264 8,840 424 4.6Norwalk 52,216 49,780 2,436 4.7 Farmington 14,219 13,641 578 4.1Oxford 7,410 7,075 335 4.5 Glastonbury 19,150 18,397 753 3.9Redding 4,696 4,491 205 4.4 Granby 6,806 6,531 275 4.0Ridgefield 12,284 11,798 486 4.0 Haddam 5,156 4,954 202 3.9Seymour 9,366 8,818 548 5.9 Hartford 55,241 49,278 5,963 10.8Shelton 22,971 21,756 1,215 5.3 Hartland 1,159 1,109 50 4.3Southbury 9,217 8,738 479 5.2 Harwinton 3,284 3,135 149 4.5Stamford 72,142 68,834 3,308 4.6 Hebron 5,604 5,389 215 3.8Stratford 28,839 26,963 1,876 6.5 Lebanon 4,258 4,052 206 4.8Trumbull 18,808 17,955 853 4.5 Manchester 33,267 31,333 1,934 5.8Weston 4,555 4,354 201 4.4 Mansfield 12,939 12,115 824 6.4Westport 13,007 12,461 546 4.2 Marlborough 3,617 3,465 152 4.2Wilton 8,871 8,484 387 4.4 Middletown 26,556 25,045 1,511 5.7Woodbridge 5,079 4,883 196 3.9 New Britain 37,294 34,305 2,989 8.0
New Hartford 4,050 3,876 174 4.3DANBURY 109,986 104,864 5,122 4.7 Newington 17,512 16,672 840 4.8Bethel 11,025 10,502 523 4.7 Plainville 10,561 10,008 553 5.2Bridgewater 881 852 29 3.3 Plymouth 6,792 6,354 438 6.4Brookfield 9,588 9,145 443 4.6 Portland 5,555 5,274 281 5.1Danbury 48,149 45,935 2,214 4.6 Rocky Hill 11,595 11,093 502 4.3New Fairfield 7,463 7,089 374 5.0 Scotland 982 931 51 5.2New Milford 16,032 15,287 745 4.6 Simsbury 13,154 12,628 526 4.0Newtown 14,833 14,123 710 4.8 Southington 24,584 23,469 1,115 4.5Sherman 2,015 1,931 84 4.2 South Windsor 14,208 13,546 662 4.7
Stafford 6,955 6,558 397 5.7ENFIELD 50,618 47,685 2,933 5.8 Thomaston 4,830 4,605 225 4.7East Windsor 6,582 6,199 383 5.8 Tolland 8,675 8,337 338 3.9Enfield 23,572 22,086 1,486 6.3 Union 477 455 22 4.6Somers 5,299 5,018 281 5.3 Vernon 17,312 16,380 932 5.4Suffield 7,685 7,345 340 4.4 West Hartford 34,714 33,208 1,506 4.3Windsor Locks 7,480 7,037 443 5.9 Wethersfield 14,217 13,494 723 5.1
Willington 3,712 3,549 163 4.4HARTFORD 629,280 592,869 36,411 5.8 Windham 12,990 12,060 930 7.2Andover 1,971 1,873 98 5.0 Windsor 16,809 15,852 957 5.7Ashford 2,606 2,484 122 4.7Avon 9,463 9,090 373 3.9Barkhamsted 2,335 2,235 100 4.3Berlin 11,879 11,347 532 4.5Bloomfield 11,657 10,909 748 6.4Bolton 3,206 3,075 131 4.1Bristol 33,370 31,308 2,062 6.2Burlington 5,669 5,412 257 4.5
THE CONNECTICUT ECONOMIC DIGEST 21September 2016
LABOR FORCE ESTIMATES BY TOWN
The unemployment rate represents the number unemployed as a percent of the civilian labor force.
With the exception of those persons temporarily absent from a job or waiting to be recalled to one, persons with no job and who are not actively looking for oneare counted as "not in the labor force".
Over the course of a year, the size of the labor force and the levels of employment undergo fluctuations due to such seasonal events as changes in weather,reduced or expanded production, harvests, major holidays and the opening and closing of schools. Because these seasonal events follow a regular pattern eachyear, their influence on statistical trends can be eliminated by adjusting the monthly statistics. Seasonal Adjustment makes it easier to observe cyclical and othernonseasonal developments.
(By Place of Residence - Not Seasonally Adjusted)
JULY 2016
LABOR FORCE CONCEPTS (Continued)
Town
LMA/TOWNS LABOR FORCE EMPLOYED UNEMPLOYED % LMA/TOWNS LABOR FORCE EMPLOYED UNEMPLOYED %NEW HAVEN 330,832 311,972 18,860 5.7 TORRINGTON-NORTHWESTBethany 3,160 3,028 132 4.2 49,378 46,889 2,489 5.0Branford 16,265 15,474 791 4.9 Canaan 760 738 22 2.9Cheshire 15,897 15,267 630 4.0 Colebrook 873 830 43 4.9Chester 2,396 2,298 98 4.1 Cornwall 805 779 26 3.2Clinton 7,460 7,142 318 4.3 Goshen 1,757 1,689 68 3.9Deep River 2,928 2,821 107 3.7 Kent 1,594 1,533 61 3.8Durham 4,407 4,244 163 3.7 Litchfield 4,971 4,759 212 4.3East Haven 16,096 15,093 1,003 6.2 Morris 1,506 1,453 53 3.5Essex 3,383 3,248 135 4.0 Norfolk 929 890 39 4.2Guilford 13,084 12,580 504 3.9 North Canaan 1,777 1,684 93 5.2Hamden 35,887 33,956 1,931 5.4 Roxbury 1,382 1,335 47 3.4Killingworth 3,898 3,754 144 3.7 Salisbury 1,895 1,833 62 3.3Madison 9,196 8,805 391 4.3 Sharon 1,541 1,490 51 3.3Meriden 32,802 30,572 2,230 6.8 Torrington 20,240 18,986 1,254 6.2Middlefield 2,559 2,436 123 4.8 Warren 820 789 31 3.8New Haven 65,896 60,877 5,019 7.6 Washington 2,125 2,051 74 3.5North Branford 8,321 7,950 371 4.5 Winchester 6,403 6,050 353 5.5North Haven 13,598 12,930 668 4.9Old Saybrook 5,188 4,935 253 4.9 WATERBURY 113,608 105,970 7,638 6.7Orange 7,364 7,029 335 4.5 Beacon Falls 3,471 3,299 172 5.0Wallingford 26,724 25,467 1,257 4.7 Bethlehem 2,046 1,954 92 4.5West Haven 30,645 28,571 2,074 6.8 Middlebury 3,896 3,721 175 4.5Westbrook 3,678 3,495 183 5.0 Naugatuck 17,615 16,542 1,073 6.1
Prospect 5,637 5,391 246 4.4*NORWICH-NEW LONDON-WESTERLY, CT PART Waterbury 51,902 47,367 4,535 8.7
129,742 122,464 7,278 5.6 Watertown 13,351 12,709 642 4.8Bozrah 1,486 1,412 74 5.0 Wolcott 10,015 9,539 476 4.8Canterbury 2,928 2,776 152 5.2 Woodbury 5,675 5,448 227 4.0East Lyme 8,899 8,445 454 5.1Franklin 1,128 1,071 57 5.1 DANIELSON-NORTHEASTGriswold 6,492 6,060 432 6.7 44,217 41,713 2,504 5.7Groton 19,017 18,079 938 4.9 Brooklyn 4,207 3,967 240 5.7Ledyard 8,184 7,791 393 4.8 Eastford 972 936 36 3.7Lisbon 2,417 2,266 151 6.2 Hampton 1,058 1,004 54 5.1Lyme 1,251 1,207 44 3.5 Killingly 9,831 9,225 606 6.2Montville 9,642 9,114 528 5.5 Plainfield 8,884 8,299 585 6.6New London 12,391 11,402 989 8.0 Pomfret 2,550 2,460 90 3.5No. Stonington 2,995 2,862 133 4.4 Putnam 4,955 4,658 297 6.0Norwich 20,866 19,477 1,389 6.7 Sterling 2,062 1,940 122 5.9Old Lyme 3,835 3,680 155 4.0 Thompson 5,396 5,115 281 5.2Preston 2,498 2,378 120 4.8 Woodstock 4,302 4,109 193 4.5Salem 2,175 2,062 113 5.2Sprague 1,677 1,570 107 6.4Stonington 9,808 9,383 425 4.3Voluntown 1,561 1,482 79 5.1Waterford 10,492 9,947 545 5.2
Not Seasonally Adjusted:CONNECTICUT 1,941,300 1,832,000 109,300 5.6
*Connecticut portion only. For whole NECTA,including RI part, see below. UNITED STATES 160,704,000 152,437,000 8,267,000 5.1NORWICH-NEW LONDON-WESTERLY, CT-RI
146,022 137,762 8,260 5.7 Seasonally Adjusted:RI part 16,280 15,298 982 6.0 CONNECTICUT 1,900,900 1,792,300 108,600 5.7(Hopkinton and Westerly) UNITED STATES 159,287,000 151,517,000 7,770,000 4.9
THE CONNECTICUT ECONOMIC DIGEST22 September 2016
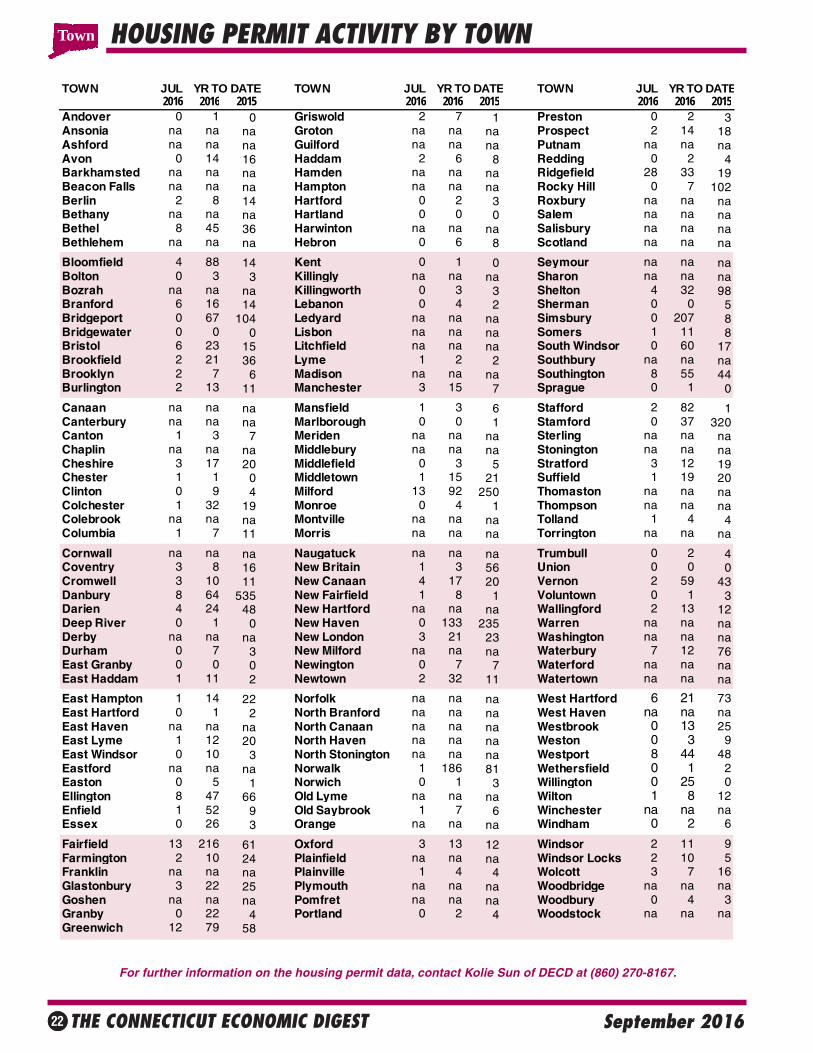
HOUSING PERMIT ACTIVITY BY TOWN
For further information on the housing permit data, contact Kolie Sun of DECD at (860) 270-8167.
TOWN JUL YR TO DATE TOWN JUL YR TO DATE TOWN JUL YR TO DATE2016 2016 2015 2016 2016 2015 2016 2016 2015
Andover 0 1 0 Griswold 2 7 1 Preston 0 2 3Ansonia na na na Groton na na na Prospect 2 14 18Ashford na na na Guilford na na na Putnam na na naAvon 0 14 16 Haddam 2 6 8 Redding 0 2 4Barkhamsted na na na Hamden na na na Ridgefield 28 33 19Beacon Falls na na na Hampton na na na Rocky Hill 0 7 102Berlin 2 8 14 Hartford 0 2 3 Roxbury na na naBethany na na na Hartland 0 0 0 Salem na na naBethel 8 45 36 Harwinton na na na Salisbury na na naBethlehem na na na Hebron 0 6 8 Scotland na na na
Bloomfield 4 88 14 Kent 0 1 0 Seymour na na naBolton 0 3 3 Killingly na na na Sharon na na naBozrah na na na Killingworth 0 3 3 Shelton 4 32 98Branford 6 16 14 Lebanon 0 4 2 Sherman 0 0 5Bridgeport 0 67 104 Ledyard na na na Simsbury 0 207 8Bridgewater 0 0 0 Lisbon na na na Somers 1 11 8Bristol 6 23 15 Litchfield na na na South Windsor 0 60 17Brookfield 2 21 36 Lyme 1 2 2 Southbury na na naBrooklyn 2 7 6 Madison na na na Southington 8 55 44Burlington 2 13 11 Manchester 3 15 7 Sprague 0 1 0
Canaan na na na Mansfield 1 3 6 Stafford 2 82 1Canterbury na na na Marlborough 0 0 1 Stamford 0 37 320Canton 1 3 7 Meriden na na na Sterling na na naChaplin na na na Middlebury na na na Stonington na na naCheshire 3 17 20 Middlefield 0 3 5 Stratford 3 12 19Chester 1 1 0 Middletown 1 15 21 Suffield 1 19 20Clinton 0 9 4 Milford 13 92 250 Thomaston na na naColchester 1 32 19 Monroe 0 4 1 Thompson na na naColebrook na na na Montville na na na Tolland 1 4 4Columbia 1 7 11 Morris na na na Torrington na na na
Cornwall na na na Naugatuck na na na Trumbull 0 2 4Coventry 3 8 16 New Britain 1 3 56 Union 0 0 0Cromwell 3 10 11 New Canaan 4 17 20 Vernon 2 59 43Danbury 8 64 535 New Fairfield 1 8 1 Voluntown 0 1 3Darien 4 24 48 New Hartford na na na Wallingford 2 13 12Deep River 0 1 0 New Haven 0 133 235 Warren na na naDerby na na na New London 3 21 23 Washington na na naDurham 0 7 3 New Milford na na na Waterbury 7 12 76East Granby 0 0 0 Newington 0 7 7 Waterford na na naEast Haddam 1 11 2 Newtown 2 32 11 Watertown na na na
East Hampton 1 14 22 Norfolk na na na West Hartford 6 21 73East Hartford 0 1 2 North Branford na na na West Haven na na naEast Haven na na na North Canaan na na na Westbrook 0 13 25East Lyme 1 12 20 North Haven na na na Weston 0 3 9East Windsor 0 10 3 North Stonington na na na Westport 8 44 48Eastford na na na Norwalk 1 186 81 Wethersfield 0 1 2Easton 0 5 1 Norwich 0 1 3 Willington 0 25 0Ellington 8 47 66 Old Lyme na na na Wilton 1 8 12Enfield 1 52 9 Old Saybrook 1 7 6 Winchester na na naEssex 0 26 3 Orange na na na Windham 0 2 6
Fairfield 13 216 61 Oxford 3 13 12 Windsor 2 11 9Farmington 2 10 24 Plainfield na na na Windsor Locks 2 10 5Franklin na na na Plainville 1 4 4 Wolcott 3 7 16Glastonbury 3 22 25 Plymouth na na na Woodbridge na na naGoshen na na na Pomfret na na na Woodbury 0 4 3Granby 0 22 4 Portland 0 2 4 Woodstock na na naGreenwich 12 79 58
Town
THE CONNECTICUT ECONOMIC DIGEST 23September 2016
TECHNICAL NOTESBUSINESS STARTS AND TERMINATIONSRegistrations and terminations of business entities as recorded with the Secretary of the State and the ConnecticutDepartment of Labor (DOL) are an indication of new business formation and activity. DOL business starts include newemployers which have become liable for unemployment insurance taxes during the quarter, as well as new establish-ments opened by existing employers. DOL business terminations are those accounts discontinued due to inactivity (noemployees) or business closure, and accounts for individual business establishments that are closed by still activeemployers. The Secretary of the State registrations include limited liability companies, limited liability partnerships, andforeign-owned (out-of-state) and domestic-owned (in-state) corporations.
CONSUMER PRICE INDEXThe Consumer Price Index (CPI), computed and published by the U.S. Bureau of Labor Statistics, is a measure of theaverage change in prices over time in a fixed market basket of goods and services. It is based on prices of food, clothing,shelter, fuels, transportation fares, charges for doctors’ and dentists’ services, drugs and other goods and services thatpeople buy for their day-to-day living. The Northeast region is comprised of the New England states, New York, NewJersey and Pennsylvania.
EMPLOYMENT COST INDEXThe Employment Cost Index (ECI) covers both wages and salaries and employer costs for employee benefits for alloccupations and establishments in both the private nonfarm sector and state and local government. The ECI measuresemployers’ labor costs free from the influences of employment shifts among industries and occupations. The base periodfor all data is December 2005 when the ECI is 100.
GAMING DATAIndian Gaming Payments are amounts received by the State as a result of the slot compact with the two Federallyrecognized tribes in Connecticut, which calls for 25 percent of net slot receipts to be remitted to the State. IndianGaming Slots are the total net revenues from slot machines only received by the two Federally recognized Indian tribes.
HOURS AND EARNINGS ESTIMATESProduction worker earnings and hours estimates include full- and part-time employees working within manufacturingindustries. Hours worked and earnings data are computed based on payroll figures for the week including the 12th of themonth. Average hourly earnings are affected by such factors as premium pay for overtime and shift differential as well aschanges in basic hourly and incentive rates of pay. Average weekly earnings are the product of weekly hours worked andhourly earnings. These data are developed in cooperation with the U.S. Department of Labor, Bureau of Labor Statistics.
INITIAL CLAIMSAverage weekly initial claims are calculated by dividing the total number of new claims for unemployment insurancereceived in the month by the number of weeks in the month. A minor change in methodology took effect with datapublished in the March 1997 issue of the DIGEST. Data have been revised back to January 1980.
INSURED UNEMPLOYMENT RATEPrimarily a measure of unemployment insurance program activity, the insured unemployment rate is the 13-weekaverage of the number of people claiming unemployment benefits divided by the number of workers covered by theunemployment insurance system.
LABOR FORCE ESTIMATESLabor force estimates are a measure of the work status of people who live in Connecticut. Prepared under the direction ofthe U.S. Bureau of Labor Statistics, the statewide estimates are the product of a signal-plus noise model, which usesresults from the Current Population Survey (CPS), a monthly survey of Connecticut households, counts of claimants forunemployment benefits, and establishment employment estimates. The 2015 LAUS Redesign includes improved time-series models for the census divisions, states, select substate areas, and the balances of those states; an improved real-time benchmarking procedure to the national Current Population Survey (CPS) estimates; an improved smoothedseasonal adjustment procedure; and improved treatment of outliers. Non-modeled area estimation improvements in-clude: updated Dynamic Residency Ratios (DRR); more accurate estimates for all-other employment; more accurateestimation of agricultural employment; and improved estimation of non-covered agricultural unemployment. Handbookestimation is now done at the city/town level instead of at the Labor Market Area (LMA) level in Connecticut, whichbetter reflects local conditions. The Redesign also introduces estimation inputs from the American Community Survey(ACS) to replace inputs that were previously obtained from the decennial census long-form survey. Labor force data,reflecting persons employed by place of residence, are not directly comparable to the place-of-work industry employmentseries. In the labor force estimates, workers involved in labor disputes are counted as employed. The labor force data alsoincludes agricultural workers, unpaid family workers, domestics and the self-employed. Because of these conceptualdifferences, total labor force employment is almost always different from nonfarm wage and salary employment.
LABOR MARKET AREASAll Labor Market Areas (LMAs) in Connecticut except three are federally-designated areas for developing labor statistics.For the sake of simplicity, the federal Bridgeport-Stamford-Norwalk NECTA is referred to in Connecticut DOL publica-tions as the Bridgeport-Stamford LMA, and the Hartford-West Hartford-East Hartford NECTA is the Hartford LMA. Thenorthwest part of the state is now called Torrington-Northwest LMA. Five towns which are part of the Springfield, MAarea are published as the Enfield LMA. The towns of Eastford and Hampton and other towns in the northeast are nowcalled Danielson-Northeast LMA. Industry employment and labor force data estimates contained in Connecticut Depart-ment of Labor publications are prepared following the same statistical procedures developed by the U.S. Department ofLabor, Bureau of Labor Statistics, whether for federally designated or state-determined areas.
NONFARM EMPLOYMENT ESTIMATESNonfarm employment estimates are derived from a survey of businesses to measure jobs by industry. The estimatesinclude all full- and part-time wage and salary employees who worked during or received pay for the pay period whichincludes the 12th of the month. Excluded from these estimates are proprietors, self-employed workers, private householdemployees and unpaid family workers. In some cases, due to space constraints, all industry estimates are not shown.These data are developed in cooperation with the U.S. Department of Labor, Bureau of Labor Statistics.
UI COVERED WAGESUI covered wages is the total amount paid to those employees who are covered under the Connecticut’s UnemploymentInsurance (UI) law for services performed during the quarter. The fluctuations in the 1992-93 period reflect the effect ofthe changes in the tax law and the massive restructuring in the state’s economy.
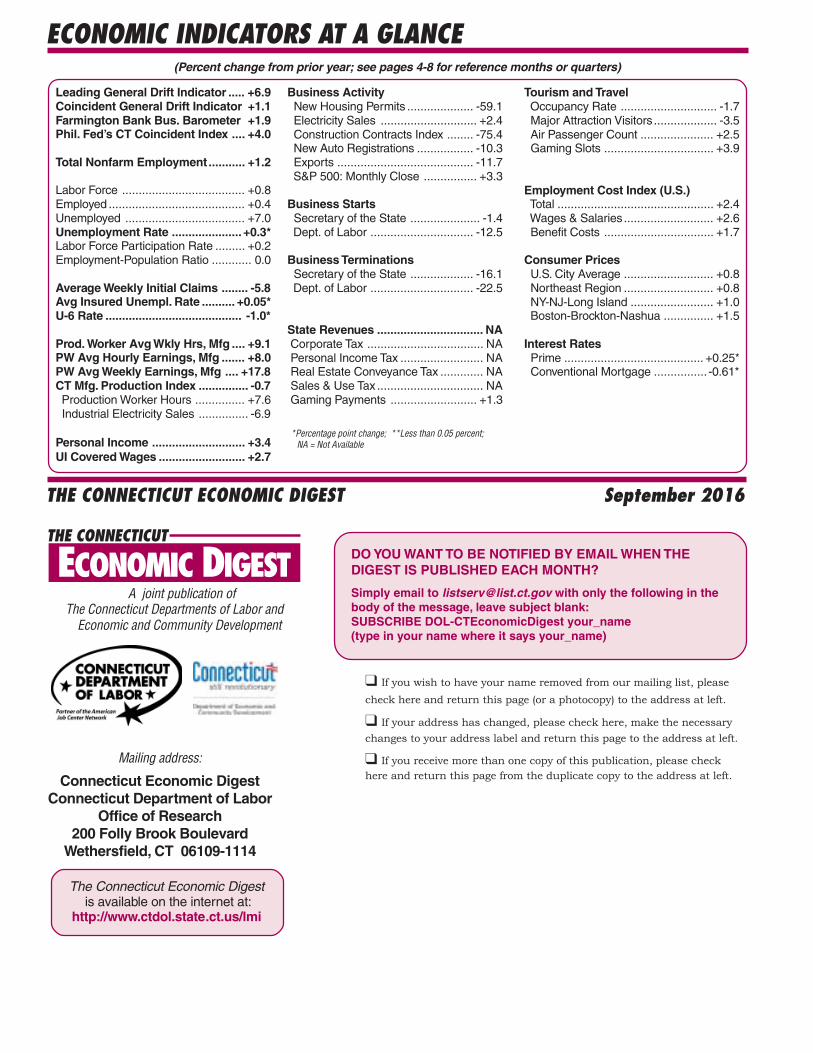
ECONOMIC INDICATORS AT A GLANCE
Leading General Drift Indicator ..... +6.9Coincident General Drift Indicator +1.1Farmington Bank Bus. Barometer +1.9Phil. Fed’s CT Coincident Index .... +4.0
Total Nonfarm Employment........... +1.2
Labor Force ..................................... +0.8Employed ......................................... +0.4Unemployed .................................... +7.0Unemployment Rate ..................... +0.3*Labor Force Participation Rate ......... +0.2Employment-Population Ratio ............ 0.0
Average Weekly Initial Claims ........ -5.8Avg Insured Unempl. Rate .......... +0.05*U-6 Rate ......................................... -1.0*
Prod. Worker Avg Wkly Hrs, Mfg .... +9.1PW Avg Hourly Earnings, Mfg ....... +8.0PW Avg Weekly Earnings, Mfg .... +17.8CT Mfg. Production Index ............... -0.7 Production Worker Hours ............... +7.6 Industrial Electricity Sales ............... -6.9
Personal Income ............................ +3.4UI Covered Wages .......................... +2.7
Business Activity New Housing Permits .................... -59.1 Electricity Sales ............................. +2.4 Construction Contracts Index ........ -75.4 New Auto Registrations ................. -10.3 Exports ......................................... -11.7 S&P 500: Monthly Close ................ +3.3
Business Starts Secretary of the State ..................... -1.4 Dept. of Labor ............................... -12.5
Business Terminations Secretary of the State ................... -16.1 Dept. of Labor ............................... -22.5
State Revenues ................................ NA Corporate Tax ................................... NA Personal Income Tax ......................... NA Real Estate Conveyance Tax ............. NA Sales & Use Tax ................................ NA Gaming Payments .......................... +1.3
Tourism and Travel Occupancy Rate ............................. -1.7 Major Attraction Visitors................... -3.5 Air Passenger Count ...................... +2.5 Gaming Slots ................................. +3.9
Employment Cost Index (U.S.) Total ............................................... +2.4 Wages & Salaries........................... +2.6 Benefit Costs ................................. +1.7
Consumer Prices U.S. City Average ........................... +0.8 Northeast Region ........................... +0.8 NY-NJ-Long Island ......................... +1.0 Boston-Brockton-Nashua ............... +1.5
Interest Rates Prime .......................................... +0.25* Conventional Mortgage ................ -0.61*
Mailing address:
Connecticut Economic DigestConnecticut Department of Labor
Office of Research200 Folly Brook Boulevard
Wethersfield, CT 06109-1114
THE CONNECTICUT ECONOMIC DIGEST
*Percentage point change; **Less than 0.05 percent; NA = Not Available
The Connecticut Economic Digest is available on the internet at:
http://www.ctdol.state.ct.us/lmi
September 2016
(Percent change from prior year; see pages 4-8 for reference months or quarters)
THE CONNECTICUT
A joint publication of The Connecticut Departments of Labor and Economic and Community Development
ECONOMIC DIGEST
If you wish to have your name removed from our mailing list, please
check here and return this page (or a photocopy) to the address at left.
If your address has changed, please check here, make the necessary
changes to your address label and return this page to the address at left.
If you receive more than one copy of this publication, please check
here and return this page from the duplicate copy to the address at left.
DO YOU WANT TO BE NOTIFIED BY EMAIL WHEN THEDIGEST IS PUBLISHED EACH MONTH?
Simply email to [email protected] with only the following in thebody of the message, leave subject blank:SUBSCRIBE DOL-CTEconomicDigest your_name(type in your name where it says your_name)