Embed Size (px)
Citation preview
The Biogeographical Roots of the Wealth ofNations
Oded Galor
Ther Berglas Lecture
Tel-Aviv University, June 2015
Oded Galor Biogeographical Roots 1 / 100

Introduction Comparative Development
Income per Capita across the Globe in 2010
0-1000
1000-3
000
3000-5
000
5000-1
0000
10000-
15000
15000-
20000
20000-
30000
30000-
40000
40000+
Oded Galor Biogeographical Roots 2 / 100

Introduction Comparative Development
Divergence across Regions: 1820—2010
0
5,000
10,000
15,000
20,000
25,000
30,000
1820 1850 1880 1910 1940 1970 2000
GD
P P
er C
apit
a (1
99
0 In
t'l $
)
Western Europe Western Offshoots Eastern Europe
Latin America Asia Africa
Source: Maddison Project (2013)
Oded Galor Biogeographical Roots 3 / 100

Introduction Comparative Development
Regional Income per Capita: 1—2010
0
5,000
10,000
15,000
20,000
25,000
30,000
0 500 1000 1500 2000
GD
P P
er C
apit
a (1
99
0 In
t'l $
)
Western Europe Western Offshoots Eastern Europe
Latin America Asia Africa
Oded Galor Biogeographical Roots 4 / 100

Introduction Comparative Development
Inferences from Growth Theory
Diminishing returns to physical and human capital accumulation
Diminishing effect of technological progress on productivity
=⇒ Reduction in inequality
=⇒ Convergence
Oded Galor Biogeographical Roots 5 / 100

Introduction Comparative Development
Income Distribution in 1960
.05
.1.1
5.2
.25
Den
sity
of C
ount
ries
4 6 8 10 12Log Income per Capita
1960
Oded Galor Biogeographical Roots 6 / 100

Introduction Comparative Development
Lack of Convergence across Nations: 1960—1980
file:///C|/Users/Oded_Galor/Dropbox/Files2007/BOOKS/PUP-Revised/new material for chapter 2/denstiyR-1960 1980.gif[12/15/2013 1:22:42 PM]
Oded Galor Biogeographical Roots 7 / 100

Introduction Comparative Development
Lack of Convergence across Nations: 1960—2000
.05
.1.1
5.2
.25
Den
sity
of C
ount
ries
4 6 8 10 12Log Income per Capita
1960 1980 2000
Oded Galor Biogeographical Roots 8 / 100

Introduction Comparative Development
Persistent Inequality across Nations: 1980—2010
ALB
AGO
ATGARG
AUSAUT
BHSBHR
BGD
BRB
BEL
BLZ
BEN
BMU
BTN
BOL
BWA
BRA
BGR
BFA
BDI
KHM
CMR
CAN
CPV
CAF
TCD
CHL
CHN COL
COM
COD
COG
CRI
CIV
CYP
DNK
DJI
DMA
DOM
ECU
EGY
SLV
GNQ
ETH
FJI
FIN FRA
GAB
GMB
DEU
GHA
GRC
GRD
GTM
GINGNB
HND
HKG
HUN
ISL
IND
IDN
IRN
IRQ
IRL
ISR
ITA
JAM
JPN
JOR
KEN
KOR
LAO
LBN
LSO
LBR
LUX
MAC
MDGMWI
MYS
MDV
MLI
MLT
MRT
MUS
MEX
MNG
MAR
MOZ
NAM
NPL
NLD
NZL
NER
NGA
NOR
OMN
PAK
PAN
PRY
PER
PHL
POL
PRT
ROU
RWA
STP
SAU
SEN
SLE
SGP
ZAF
ESP
LKA
KNA
LCAVCT
SDN
SUR
SWZ
SWE
CHE
SYR
TWN
TZA
THA
TGO
TTO
TUN
TUR
UGA
GBR
USA
URY
VEN
VNM
ZMB
ZWE
.6.7
.8.9
11.
1Ln
GD
P p
er C
apita
in 2
010
(rel
ativ
e to
the
US
)
.6 .7 .8 .9 1 1.1Ln GDP per Capita in 1980 (relative to the US)
Oded Galor Biogeographical Roots 9 / 100

Introduction Comparative Development
Fundamental Research Questions
What is the origin of the vast inequality in income per capita acrosscountries and regions?
What accounts for the divergence in per-capita income across countriesin the past two centuries?
What are the factors that inhibited the convergence of poor economiestoward richer ones in the past decades?
What is the role of historical factors in explaining the observed patternsof comparative development?
Oded Galor Biogeographical Roots 10 / 100

Phases of Development
Phases of Development
The Malthusian Epoch
The Post-Malthusian Regime
The Modern Growth Regime
Oded Galor Biogeographical Roots 11 / 100
Phases of Development
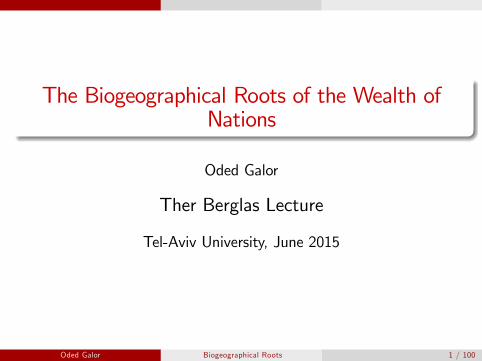
Phases of Development: Timeline of the Most Developed Economies
Malthusian Epoch (99.8%)
200K BP 1750s
Oded Galor Biogeographical Roots 12 / 100

Phases of Development
Phases of Development: Timeline of the Most Developed Economies
Malthusian Epoch (99.8%)
200K BP 1750s
Post-Malthusian (0.1%)
1750s 1870s 2014
Oded Galor Biogeographical Roots 13 / 100

Phases of Development
Phases of Development: Timeline of the Most Developed Economies
Malthusian Epoch (99.8%)
200K BP 1750s
Post-Malthusian (0.1%)
1750s 1870s 2014
1870s 2014
Modern Growth (0.1%)
Oded Galor Biogeographical Roots 14 / 100

Phases of Development The Malthusian Epoch
The Malthusian Epoch
Characterized by stagnation and the absence of economic growth
Central characteristics of the period:
Positive effect of income (above subsistence) on population growthDiminishing returns to labor (reflecting the existence of fixed factor)
Technological progress over this period
(temporarily) increases the marginal productivity of laborIncome per capita increases (above subsistence)Population increases, as long as income remains above subsistenceMarginal productivity of labor declines towards its long-run levelIncome per capita returnes to the subsistence level in the long-run
Technologically advanced & land-rich economies:
Higher population densitySimilar levels of income per-capita in the long-run
Oded Galor Biogeographical Roots 15 / 100

Phases of Development The Malthusian Epoch
Land Productivity and Population Density in 1500
Conditional on transition timing, geographical factors, and continental fixed effects.
Source: Ashraf-Galor (AER 2011)
Oded Galor Biogeographical Roots 16 / 100

Phases of Development The Malthusian Epoch
Land Productivity and Income per Capita in 1500
Conditional on transition timing, geographical factors, and continental fixed effects.
Source: Ashraf-Galor (AER 2011)
Oded Galor Biogeographical Roots 17 / 100

Phases of Development The Malthusian Epoch
Technology and Population Density in 1500
Years elapsed since the Neolithic Transition reflects the technological level in 1500.
Conditional on land productivity, geographical factors, and continental fixed effects.
Source: Ashraf-Galor (AER 2011)
Oded Galor Biogeographical Roots 18 / 100

Phases of Development The Malthusian Epoch
Technology and Income per Capita in 1500
Years elapsed since the Neolithic Transition reflects the technological level in 1500.
Conditional on land productivity, geographical factors, and continental fixed effects.
Source: Ashraf-Galor (AER 2011)
Oded Galor Biogeographical Roots 19 / 100

Phases of Development The Post-Malthusian Regime
The Post-Malthusian Regime
Characterized by the onset of economic growth:
Technological progress accelerates
Income per capita still has a positive effect on population growth
Technological progress:
Increases output more than population=⇒ growth in income per capita
Oded Galor Biogeographical Roots 20 / 100

Phases of Development The Post-Malthusian Regime
Regional Variation in the Timing of the Take-off
0
5,000
10,000
15,000
20,000
25,000
30,000
1700 1750 1800 1850 1900 1950 2000
GD
P P
er C
apit
a (1
99
0 In
t'l $
)
Western Europe Western Offshoots Eastern Europe
Latin America Asia Africa
Oded Galor Biogeographical Roots 21 / 100

Phases of Development The Modern Growth Regime
The Modern Growth Regime
Sustained economic growth
Acceleration in technological progress
=⇒ Industrial demand for human capital
Human capital formation
=⇒ Decline in fertility rates (substitution of quantity by quality)
The decline in population growth
=⇒ Freed the growth process from counterbalancing effects ofpopulation growth
Technological progress, human capital formation & decline in populationgrowth
=⇒ Sustained economic growth
Oded Galor Biogeographical Roots 22 / 100

Phases of Development The Demographic Transition
Years Elapsed since the Onset of the Fertility Decline
0-15
15-30
30-45
45-60
60-75
75-90 90+ N.A
Oded Galor Biogeographical Roots 23 / 100

Phases of Development The Demographic Transition
Timing of the Demographic Transition and Current Income per Capita
NPL
BTN LAOMLI
AGO
GINNGATGO
LBR
NAM
MDG
SYR
ERI
IRN
BDILSOKHMCOM
PRY
HTI
RWA
ETH
MNGNER
CAF
GTM
HND
LBYSAU
BGDGMB
NICDJI
MRT
JOR
KWT
ZAF
DZASWZBENVNMCHNSDNZMB
CIV
GHA
BWA
SENGEO
MWI
ALB
KGZ
UZB
AZEARM
BHR
TUN
LBN
BOL
CMR
MAR
MEXKOR
ZWE
EGY
CHL
ISR
DOM
JPN
BLZMUS
IND
THASLV
ROM
ATGPAN
TZA
TTO
FINCANBRACRI
PER
BGR
ITA
PRT
DNKNORUSA
GBRAUTVENNLD
PHL
CHEBEL
IDN
DEUESPFRA
LKA
ARGGUYHUN
SYC
SWECOLSUR
JAMURY
KEN
ECU
MYS4
20
24
Log
Inco
me
Per C
apita
in 2
005
2 1 0 1 2Years Elapsed since the Demographic Transition
coef = 1.3462847, (robust) se = .10852591, t = 12.41
Conditional on absolute latitude.
Oded Galor Biogeographical Roots 24 / 100

Phases of Development The Demographic Transition
Regional Variation in Growth of Income per Capita: 1950—2000
500
5,000
50,000
1950 1960 1970 1980 1990 2000
GD
P P
er C
apit
a (l
og
scal
e)
Western Europe Western Offshoots Africa
Asia Eastern Europe Latin America
Oded Galor Biogeographical Roots 25 / 100

Challenges for Growth Theory The Malthusian Epoch
Fundamental Research Questions: The Malthusian Epoch
What accounts for the epoch of stagnation that characterized most ofhuman history?
Why did episodes of technological progress in the pre-industrializationera fail to generate sustained economic growth?
Why did increased productivity generated population growth rather thangrowth in income per capita?
Oded Galor Biogeographical Roots 26 / 100

Challenges for Growth Theory The Transition from Stagnation to Growth
Fundamental Research Questions: Transition from Stagnation to Growth
What are the factors that generated the transition from stagnation togrowth of DCs?
What are the hurdles faced by LDCs in the transition from stagnationto growth?
What triggered the demographic transition?
Is the demographic transition a necessary condition for sustained eco-nomic growth?
Oded Galor Biogeographical Roots 27 / 100

Challenges for Growth Theory Comparative Development
Fundamental Research Questions: Comparative Development
What accounts for the transition from stagnation to growth in somecountries and the persistent stagnation in others?
What governs the differential timing of the demographic transitionacross nations?
What is the origin of the vast inequality that emerged across countriesin the past two centuries?
What is the contribution of deep rooted factors to the vast inequalityacross countries?
Oded Galor Biogeographical Roots 28 / 100

Challenges for Growth Theory Comparative Development
Non-Unified Growth Theory
Captures the role of factor accumulation and technological progress in themodern growth regime
Not designed to shed light on:
The forces that triggered the transition of DCs from stagnation to growth
The factors that hindered convergence across countries
The historical origins of vast and persistent inequality across countries
Oded Galor Biogeographical Roots 29 / 100

Unified Growth Theory
Unified Growth Theory
Oded Galor Biogeographical Roots 30 / 100

Unified Growth Theory
Unified Growth Theory
Captures the process of development in its entirety
Identifies the forces that generated the transition from stagnation to growth
Examines the origins of the uneven distribution of wealth across the globe
Underlines the role of deep-rooted factors in comparative development
Oded Galor Biogeographical Roots 31 / 100

Deep Roots of Comparative Development
Deep Roots of Comparative Development
Persistent effects of geographical and historical human characteristics
Biogeographical conditions (domesticable species, orientation of continent)
Variation in the onset of the Neolithic Revolution (Diamond, 1997)
=⇒ Comparative economic development
Migratory distance from Africa to indigenous settlements
Variation human composition (genetic diversity) across ethnic groups,countries, and regions (Ashraf-Galor, AER 2013)=⇒ Comparative economic development
Geographical characteristics (climate, soil quality, latitude, isolation, disease environment)
Variation in institutions conducive to development (AJR, AER 2001)Variation in productivity (Sachs et al, 1999), Andersen-Dalgaard-Seaya, RES 2016)
Variation in cultural characteristics conducive for development (Alesina-Giuliano-Nunn, QJE 2013, Galor-Ozak, AER 2016)
Oded Galor Biogeographical Roots 32 / 100

The Neolithic Revolution
The Neolithic Origins of Comparative Development
The transition from hunter-gatherer tribes to agricultural communities:
Emergence of a non-food-producing class:
=⇒ Knowledge creation (science, technology & written languages)
Technological head start and its persistent effect via:
Urbanization, nation states, colonization, culture and institutions
Cross continents variations in biogeographical characteristics conducive forthe NR :
=⇒ Origins of the observed patterns of comparative development
Oded Galor Biogeographical Roots 33 / 100

The Neolithic Revolution
Variation in the Onset of the Neolithic Revolution
0-2000
2000-4
000
4000-6
000
6000-8
000
8000-1
0000
10000+
Oded Galor Biogeographical Roots 34 / 100

The Neolithic Revolution
Biogeographical Origins of the Onset of the Neolithic Revolution
Geographical factors that maximized biodiversity (climate, latitude, landmass)
Availability of domesticable species of plants and animals
=⇒ Onset of domestication
Orientation of continents:
=⇒ Diffusion of agricultural practices along similar latitudes
Oded Galor Biogeographical Roots 35 / 100

The Neolithic Revolution Testable Predictions
The Diamond Hypothesis
The domination of Euro-Asia in the pre-colonial era reflects:
Larger number of domesticable species of plants and animals
East-West orientation
=⇒ Technological head start and its implications
The economic domination of Europeans and their offshoots in the post-colonial era reflects
Persistence of technological head startResistance to infectious diseases evolved in the aftermath of the NR
The Neolithic Revolution is at the origins comparative development in:
1491Contemporary period
Oded Galor Biogeographical Roots 36 / 100

Out of Africa
The "Out of Africa" Origins of Comparative Development
The migration of humans out of Africa 70,000-90,000 BP affected
The distribution of genetic diversity across the globe
Comparative economic development
Accounts for 16% of the variation in the income per capita acrosscountries
Oded Galor Biogeographical Roots 37 / 100

Foundations
Main Building Blocks of the Proposed Hypothesis
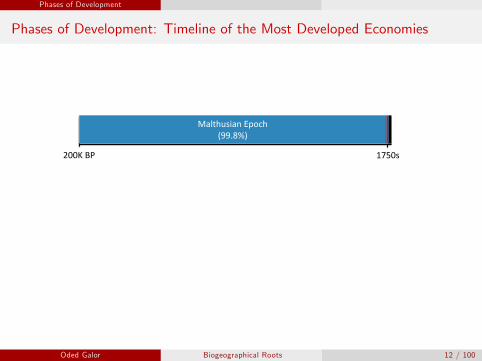
The Serial Founder Effect:
Lower genetic diversity among indigenous populations at greater migra-tory distances from East Africa
Existence of an optimal level of genetic diversity (for each stage of develop-ment)
Balances between:
The negative effect on the cohesiveness of societyThe positive effect on innovations
Oded Galor Biogeographical Roots 38 / 100

Foundations The Serial Founder Effect
The Serial Founder Effect
Exodus of modern humans from Africa (70-90K BP)
Departing populations carry only a subset of the genetic diversity of theirparental colonies
=⇒ Lower genetic diversity among indigenous populations at greatermigratory distances from East Africa
Oded Galor Biogeographical Roots 39 / 100

Foundations The Serial Founder Effect
An Illustration of the Serial Founder Effect
3 Alleles
Original Population
Oded Galor Biogeographical Roots 40 / 100

Foundations The Serial Founder Effect
An Illustration of the Serial Founder Effect
3 Alleles
Original Population
2 Alleles
Founder Population
Increasing Migratory Distance
Oded Galor Biogeographical Roots 41 / 100

Foundations The Serial Founder Effect
An Illustration of the Serial Founder Effect
3 Alleles
Original Population
2 Alleles
Founder Population
1 Allele (each)
Sub-founder Populations
Increasing Migratory Distance
Oded Galor Biogeographical Roots 42 / 100

Foundations Genetic Diversity
Genetic Diversity —Measurement
Expected Heterozygosity
The probability that two individuals, selected at random from a givenpopulation, are different from one another in a given spectrum of genes
Oded Galor Biogeographical Roots 43 / 100

Foundations Genetic Diversity
Human Genome Diversity Project (HGDP)
Consists of 53 ethnic groups (52 originally)
Resided in the same geographical location for a prolonged period of time
Isolated geographically
Display insignificant genetic admixture with other ethnic groups
Oded Galor Biogeographical Roots 44 / 100

Foundations Genetic Diversity
HGDP Ethnic Groups
Oded Galor Biogeographical Roots 45 / 100

Foundations Genetic Diversity
The Spatial Distribution of the HGDP Ethnic Groups
Prince Rupert
Anadyr
Phnom Penh
Addis Ababa
Cairo
Istanbul
Papuan Karitiana
Orcadian
+ Marks the location of an HGDP ethnic group.
o Marks an approximate critical juncture in the journey of humankind from Africa.
Oded Galor Biogeographical Roots 46 / 100
Foundations Genetic Diversity
Migratory Distance from Africa and Genetic Diversity
.55
.6.6
5.7
.75
Exp
ecte
d he
tero
zygo
sity
0 5 10 15 20 25
Migratory distance from East Africa (in thousand km)
Africa Middle East Europe Asia Oceania Americas
Oded Galor Biogeographical Roots 47 / 100

Foundations Trade-offs: Human Diversity and Productivity
Trade-offs: Human Diversity and Productivity
Existence of an optimal level of genetic diversity (for each stage of develop-ment)
Balances between:
The negative effect on the cohesiveness of societyThe positive effect on innovations
Oded Galor Biogeographical Roots 48 / 100

Foundations Trade-offs: Human Diversity and Productivity
The Costs of Diversity
Genetic diversity increases the incidence of:
Mistrust
Civil conflicts
=⇒ Ineffi ciency in the operation of the economy relative to its PPF
Oded Galor Biogeographical Roots 49 / 100

Foundations Trade-offs: Human Diversity and Productivity
The Benefits of Diversity
Genetic diversity
Increases the likelihood for the existence of traits that are complementaryto the adoption of newly technologies
Generates complementary in the production process
Increases the upper tail of the ability distribution that matters for inno-vations
=⇒ Diversity fosters innovations & expands the production possibilities
Oded Galor Biogeographical Roots 50 / 100
Foundations Trade-offs: Human Diversity and Productivity
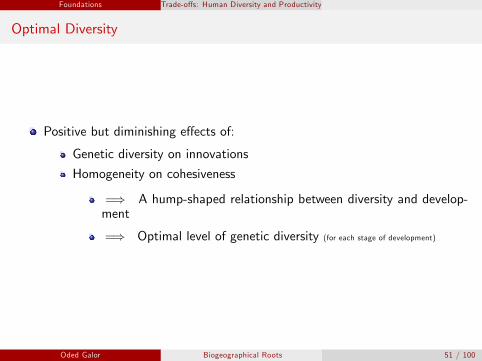
Optimal Diversity
Positive but diminishing effects of:
Genetic diversity on innovations
Homogeneity on cohesiveness
=⇒ A hump-shaped relationship between diversity and develop-ment
=⇒ Optimal level of genetic diversity (for each stage of development)
Oded Galor Biogeographical Roots 51 / 100

Foundations Trade-offs: Human Diversity and Productivity
The Optimal Level of Genetic Diversity
0 1
)(y
*
Oded Galor Biogeographical Roots 52 / 100

Foundations Trade-offs: Human Diversity and Productivity
The Rise in the Optimal Diversity —Faster Technological Progress
0 1
);( gy
)(* Lg
);( Hgy
);( Lgy
)(* Hg
Oded Galor Biogeographical Roots 53 / 100

Empirical Analysis Comparative Development: 1500 CE
Comparative Development in the Pre-Colonial Era
Productivity
(Population Density)
Oded Galor Biogeographical Roots 54 / 100

Empirical Analysis Comparative Development: 1500 CE
Comparative Development in the Pre-Colonial Era
Productivity
(Population Density)
Human Genetic
Diversity
Oded Galor Biogeographical Roots 55 / 100
Empirical Analysis Comparative Development: 1500 CE
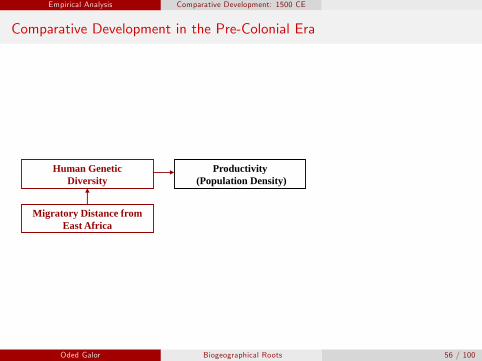
Comparative Development in the Pre-Colonial Era
Productivity
(Population Density)
Human Genetic
Diversity
Migratory Distance from
East Africa
Oded Galor Biogeographical Roots 56 / 100

Empirical Analysis Comparative Development: 1500 CE
Comparative Development in the Pre-Colonial Era
Productivity
(Population Density)
Human Genetic
Diversity
Migratory Distance from
East Africa
Timing of the Neolithic
Revolution
Oded Galor Biogeographical Roots 57 / 100

Empirical Analysis Comparative Development: 1500 CE
Comparative Development in the Pre-Colonial Era
Productivity
(Population Density)
Human Genetic
Diversity
Migratory Distance from
East Africa
Timing of the Neolithic
Revolution
Land Productivity • Percentage of Arable Land
• Suitability of Land for Agriculture
• Absolute Latitude
Oded Galor Biogeographical Roots 58 / 100

Empirical Analysis Analysis using Predicted Diversity
Projected Genetic Diversity across Countries in the Pre-Colonial Era
0,57-0
,62
0,62-0
,65
0,65-0
,71
0,71-0
,73
0,73-0
,74
0,74-0
,75
0,75-0
,760,7
6+
Oded Galor Biogeographical Roots 59 / 100

Empirical Analysis Analysis using Predicted Diversity
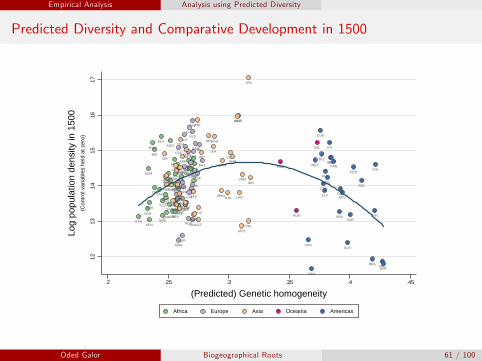
Predicted Diversity and Comparative Development in 1500
(1) (2) (3) (4) (5) (6)
Dependent Variable is Log Population Density in 1500
Predicted Diversity 250.99*** 213.54*** 203.02*** 195.42*** 199.73**(68.26) (63.50) (61.05) (56.09) (80.51)
Predicted Diversity Sqr. -177.40*** -152.11*** -141.98*** -137.98*** -146.17***(50.22) (46.65) (44.83) (40.84) (56.26)
Log Years since NR 1.29*** 1.05*** 1.16*** 1.24***(0.18) (0.19) (0.15) (0.24)
Log % of Arable Land 0.52*** 0.40*** 0.39***(0.12) (0.09) (0.10)
Log Absolute Latitude -0.17* -0.34*** -0.42***(0.09) (0.09) (0.12)
Log Agri. Suitability 0.19 0.31*** 0.26***(0.12) (0.10) (0.10)
Optimal Diversity 0.707 0.702 0.715 0.708 0.683(0.021) (0.025) (0.110) (0.051) (0.110)
Continent Dummies No No No No No Yes
Observations 145 145 145 145 145 145
R-squared 0.22 0.26 0.38 0.50 0.67 0.69
Bootstrap standard errors in parentheses; *** p<0.01, ** p<0.05, * p<0.1.
Oded Galor Biogeographical Roots 60 / 100
Empirical Analysis Analysis using Predicted Diversity
Predicted Diversity and Comparative Development in 1500
AGO
BDI
BEN
BFA
BWA
CAF
CIV
CMR
COG DZA
EGY
ETH
GAB
GHA
GIN
GMB
GNB
KEN
LBR
LBYLSO
MARMDG
MLI
MOZ MRT
MWI
NAM
NER
NGA
RWA
SDN
SENSLESOM
SWZTCD TGO
TUN
TZA
UGAZAF
ZMB
ZWE
ALB
AUT
BEL
BGR
BIH
BLR
CHE
CZEDEU
DNK
ESP
EST
FIN
FRA
GBR
GRC
HRVHUN
IRLITA
LTU
LVA
MDA
MKD
NLD
NORPOL
PRT
ROM
RUS
SVN
SWE
UKR
AFG
ARE
ARMAZE
BGD
CHN
GEO
IDN
IND
IRN
IRQ
ISR
JOR
JPN
KAZ
KGZ
KHM
KOR
KWT
LAO
LBN
LKA
MMR
MNG
MYS
NPL
OMN
PAK
PHL
PRK
QATSAU
SYR
THA
TJK
TKM
TUR
UZB
VNM
YEM
AUS
NZL
PNG
ARG
BLZ
BOL
BRA
CAN
CHL
COL
CRI
CUB
DOM
ECU
GTM
GUY
HND
HTI
MEX
NIC
PAN
PER
PRY
SLV
SUR
URY
USA
VEN
1213
1415
1617
.2 .25 .3 .35 .4 .45
Africa Europe Asia Oceania Americas
(Con
trol
var
iabl
es h
eld
at z
ero)
Log
popu
latio
n de
nsity
in 1
500
(Predicted) Genetic homogeneity
Oded Galor Biogeographical Roots 61 / 100

Empirical Analysis Analysis using Predicted Diversity
Robustness: Distances from Placebo Origins
(1) (2) (3) (4) (5)
Dependent Variable: Log Population Density in 1500
Distance calculated from: Addis Ababa Addis Ababa London Tokyo Mexico City
Migratory Distance 0.138** -0.040 0.052 -0.063(0.061) (0.063) (0.145) (0.099)
Migratory Distance Sqr. -0.008*** -0.002 -0.006 0.005(0.002) (0.002) (0.007) (0.004)
Aerial Distance -0.008(0.106)
Aerial Distance Sqr. -0.005(0.006)
Log Years since NR 1.160*** 1.158*** 1.003*** 1.047*** 1.619***(0.144) (0.138) (0.164) (0.225) (0.277)
Log % of Arable Land 0.401*** 0.488*** 0.357*** 0.532*** 0.493***(0.091) (0.102) (0.092) (0.089) (0.094)
Log Absolute Latitude -0.342*** -0.263*** -0.358*** -0.334*** -0.239***(0.091) (0.097) (0.112) (0.099) (0.083)
Log Agri. Suitability 0.305*** 0.254** 0.344*** 0.178** 0.261***(0.091) (0.102) (0.092) (0.080) (0.092)
Observations 145 145 145 145 145
R-squared 0.67 0.59 0.67 0.59 0.63
Robust standard errors in parentheses; *** p<0.01, ** p<0.05, * p<0.1.
Oded Galor Biogeographical Roots 62 / 100

Empirical Analysis Analysis using Predicted Diversity
Robustness to Distance from Regional Technological Frontiers
(1) (2) (3)
Log Population Density Log Population Density Log Population Density
1500 CE 1000 CE 1 CE
Predicted Diversity 156.74** 183.77** 215.86**(77.98) (91.20) (106.50)
Predicted Diversity Sqr. -114.63** -134.61** -157.72**(54.67) (63.65) (74.82)
Log Years since NR Yes Yes Yes
Land Prod. Controls Yes Yes Yes
Log Distance to -0.19***Frontier in 1500 CE (0.07)
Log Distance to -0.23**Frontier in 1000 CE (0.11)
Log Distance to -0.30***Frontier in 1 CE (0.10)
Optimal Diversity 0.684 0.683 0.684(0.169) (0.218) (0.266)
Continent Dummies Yes Yes Yes
Observations 145 140 126
R-squared 0.72 0.64 0.66
Bootstrap standard errors in parentheses; *** p<0.01, ** p<0.05, * p<0.1.
Oded Galor Biogeographical Roots 63 / 100

Empirical Analysis Analysis using Predicted Diversity
Genetic Diversity and Urbanization Rates in 1500
DZA
EGY
MAR
TUN
ALB
AUT
BEL
BGR
BLR
CHECZE
DEUDNK
ESP
EST
FINFRA
GBR
GRC
HRV
HUN
ITA
LTULVA
MDA
MKD
NLD
NOR
POL
PRT
ROM
RUS
SVN
SWE
UKR
BGD
CHN
IDN
IND
IRN
ISR
JPN
KAZ
KOR
LAO
LKA
MYS
PAK
PHL
SAU
SYR
THA
TUR
UZB
VNM
AUS
NZL
ARG
BLZ
BOL
BRA
CAN
CHL
COL
CRI
DOM
ECU
GTM
GUY
HND
HTI
MEX
NICPAN
PER
PRY
SLV
URY
USA
VEN
2728
2930
31
.25 .3 .35 .4 .45
Africa Europe Asia Oceania Americas
(Con
trol
var
iabl
es h
eld
at z
ero)
Log
urba
niza
tion
rate
in 1
500
(Predicted) Genetic homogeneity
Oded Galor Biogeographical Roots 64 / 100

Contemporary Analysis
Genetic Diversity in Contemporary Countries
The index of genetic diversity reflects:
Proportional representation of each ethnic group within a country
GD within each the ancestral population of each ethnic group
Genetic distance between each pair of ethnic groups
Oded Galor Biogeographical Roots 65 / 100

Contemporary Analysis
Genetic Distance
0.0
5.1
.15
.2.2
5P
airw
ise
Fst
gen
etic
dis
tanc
e
0 10 20 30
Pairwise migratory distance (in thousand km)
Oded Galor Biogeographical Roots 66 / 100

Contemporary Analysis
Genetic Diversity across Countries in 2000
0,62-0
,66
0,66-0
,69
0,69-0
,72
0,72-0
,73
0,73-0
,74
0,74-0
,75
0,75-0
,760,7
6+
Oded Galor Biogeographical Roots 67 / 100
Contemporary Analysis Empirical Findings
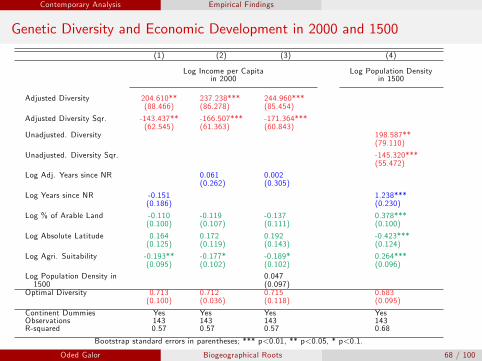
Genetic Diversity and Economic Development in 2000 and 1500
(1) (2) (3) (4)
Log Income per Capita Log Population Densityin 2000 in 1500
Adjusted Diversity 204.610** 237.238*** 244.960***(88.466) (86.278) (85.454)
Adjusted Diversity Sqr. -143.437** -166.507*** -171.364***(62.545) (61.363) (60.843)
Unadjusted. Diversity 198.587**(79.110)
Unadjusted. Diversity Sqr. -145.320***(55.472)
Log Adj. Years since NR 0.061 0.002(0.262) (0.305)
Log Years since NR -0.151 1.238***(0.186) (0.230)
Log % of Arable Land -0.110 -0.119 -0.137 0.378***(0.100) (0.107) (0.111) (0.100)
Log Absolute Latitude 0.164 0.172 0.192 -0.423***(0.125) (0.119) (0.143) (0.124)
Log Agri. Suitability -0.193** -0.177* -0.189* 0.264***(0.095) (0.102) (0.102) (0.096)
Log Population Density in 0.0471500 (0.097)
Optimal Diversity 0.713 0.712 0.715 0.683(0.100) (0.036) (0.118) (0.095)
Continent Dummies Yes Yes Yes YesObservations 143 143 143 143R-squared 0.57 0.57 0.57 0.68
Bootstrap standard errors in parentheses; *** p<0.01, ** p<0.05, * p<0.1.
Oded Galor Biogeographical Roots 68 / 100
Contemporary Analysis Empirical Findings
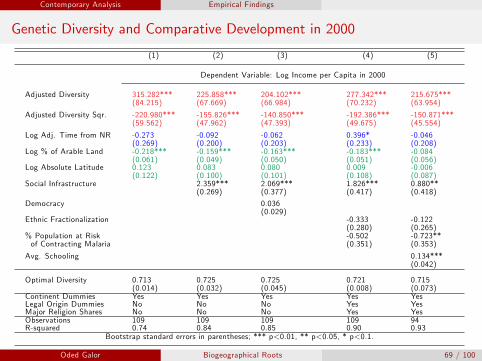
Genetic Diversity and Comparative Development in 2000
(1) (2) (3) (4) (5)
Dependent Variable: Log Income per Capita in 2000
Adjusted Diversity 315.282*** 225.858*** 204.102*** 277.342*** 215.675***(84.215) (67.669) (66.984) (70.232) (63.954)
Adjusted Diversity Sqr. -220.980*** -155.826*** -140.850*** -192.386*** -150.871***(59.562) (47.962) (47.393) (49.675) (45.554)
Log Adj. Time from NR -0.273 -0.092 -0.062 0.396* -0.046(0.269) (0.200) (0.203) (0.233) (0.208)
Log % of Arable Land -0.218*** -0.159*** -0.163*** -0.183*** -0.084(0.061) (0.049) (0.050) (0.051) (0.056)
Log Absolute Latitude 0.123 0.083 0.080 0.009 -0.006(0.122) (0.100) (0.101) (0.108) (0.087)
Social Infrastructure 2.359*** 2.069*** 1.826*** 0.880**(0.269) (0.377) (0.417) (0.418)
Democracy 0.036(0.029)
Ethnic Fractionalization -0.333 -0.122(0.280) (0.265)
% Population at Risk -0.502 -0.723**of Contracting Malaria (0.351) (0.353)
Avg. Schooling 0.134***(0.042)
Optimal Diversity 0.713 0.725 0.725 0.721 0.715(0.014) (0.032) (0.045) (0.008) (0.073)
Continent Dummies Yes Yes Yes Yes YesLegal Origin Dummies No No No Yes YesMajor Religion Shares No No No Yes YesObservations 109 109 109 109 94R-squared 0.74 0.84 0.85 0.90 0.93
Bootstrap standard errors in parentheses; *** p<0.01, ** p<0.05, * p<0.1.
Oded Galor Biogeographical Roots 69 / 100

Contemporary Analysis Empirical Findings
Genetic Diversity and Comparative Development in 2000
AGO
BDI
BEN
BFA
BWA
CAF
CIV
CMR
COG
DZA
EGY
ETH
GAB
GHA
GIN
GMB
GNB
KEN
LSO
MAR
MDG
MLI
MOZMRT
MWI
NAM
NER
NGA
RWA
SDN
SEN
SLE
SOM
SWZ
TCD
TGO
TUN
TZA
UGA
ZAF
ZMB
ZWE
AUT
BEL
BGR
CHECYPDEU
DNK
ESP
FIN
FRA
GBR
GRC
HUNIRL
ITA
NLD
NORPOL
PRT
ROMSWE
BGD
CHN
IDN
IND
IRN
IRQ
ISR
JOR
JPN
KOR
LKA
MYS
OMN
PAK
PHL
SAU
SYR
THA
TUR
AUS
NZL
PNG
ARG
BOL
BRA
CAN
CHL
COL
CRI
DOM
ECU
GTM
GUY
HND
HTI
JAM
MEX
NIC
PAN
PER
PRY
SLV
TTO
URY
USA
VEN
13.5
1414
.515
15.5
16
.2 .25 .3 .35 .4
Africa Europe Asia Oceania Americas
(Con
trol
var
iabl
es h
eld
at z
ero)
Log
inco
me
per
capi
ta in
200
0
(Predicted) Ancestry−adjusted genetic homogeneity
Oded Galor Biogeographical Roots 70 / 100

Contemporary Analysis Interpretations
Interpretations —Diversity and Comparative Development in 2000
Optimal GD in 2000 = 0.7208 ≈ GD in US = 0.7206
Increasing GD of the most homogeneous country, Bolivia (0.63), by 0.09:
=⇒ 5.4-fold increase income per capita in 2000
From 8% to 40% of that of the US
Decreasing GD of the most heterogeneous country, Ethiopia (0.77), by 0.05:
=⇒ 1.7-fold increase in income per capita in 2000
From 2% to 4% of that of the US
Oded Galor Biogeographical Roots 71 / 100

Robustness Nightlight
Genetic Diversity and Light Intensity per Capita 1992-2012
DZA
AGO
BWA
BDI
CMR
CAF
TCD
COG
ZAR
BEN
ETH
GAB
GMBGHA
GIN
CIV
KEN
LSOMDG
MWI
MLIMRT
MAR
MOZ
NAM
NER
NGA
GNB
RWA
SEN
SLE
SOM
ZAFZWE
SDNSWZ
TGO
TUN
UGA
EGY
TZA
BFA
ZMB
AUT
BELBGR
CYP
DNK
FIN
FRA
DEU
GRCHUN IRL
ITA
NLD
NOR
POL
PRTROM
ESP
SWE
CHE
GBR BGD
MMR
LKA
CHN
INDIDN
IRN
IRQ
ISR
JPN
JOR
KOR
MYS
OMNPAK
PHL
SAU
SYR
THA
TURAUS
NZL
PNG
ARG
BOL
BRA
CAN
CHL
COL
CRIDOM
ECU
SLV
GTM
GUY
HTI
HND
JAM
MEX
NIC
PAN
PRY
PER
TTO
USA
URY
VEN
2324
2526
27
.2 .25 .3 .35 .4
Africa Europe Asia Oceania Americas
(Con
trol
var
iabl
es h
eld
at z
ero)
Log
light
inte
nsity
per
cap
ita, 1
992−
2012
(Predicted) Ancestry−adjusted genetic homogeneity
Source: Ashraf-Galor-Klemp (2014)
Oded Galor Biogeographical Roots 72 / 100

Robustness Ethnic Groups
Observed Genetic Diversity - 232 Ethnic Groups
Oded Galor Biogeographical Roots 73 / 100

Robustness Ethnic Groups
Migratory Distance from Africa and Genetic Diversity
DZA
TZAKEN
SDN
CMR
KEN CMR
TZA
CMRTZA
TCDTCD
ZAR
ERI
KEN
ZAR CIV
KEN
TZA
KENKEN
KEN
CMRGABTCD
KENCOG
NGACMRKEN
CMR
SDN
TCDKENKEN CMR
NGA
CMR
TZA
ZAFTZATZA
TZA
CMRTCD
CMRKEN NGA
CMR
ETH KEN
TZASEN
TZA
KENNGACMR
TZA
TCD
GABTZACMR
CMR
NGAKEN
CMR
CMRNGA
SSD
ZAFTZA
ZAF
KEN AGOCMRCMR
CMR
GAB
SSD
CAF
KEN
TCDRWA
KEN
NGA
TCD
KEN
CMRGHA
TCDKEN
TZAKENCMR
CMRNGA
CMR
NGA
ZARCMR
GHACMR
ETHKEN
NAM
KENCMR
TZA NGA
CMR
SSD
TZA
CHN CHN
CHN
CHN
CHN
TWN
CHN
CHN
TWN
CHN
MNG
JPN
CHN
CHN
KHM
CHN
CHN
CHN
CHN
RUS
RUS
RUS
RUSPSESYR
YEMSYR
INDPAK
IND
PAK
INDIND
INDAFG
PAKIND
INDIND
PAKIND
PAK IND
IND
PAK
IND
IND
PAK
PAK
GBR
FRA
ITA
RUS ITA
ITA
ESP
MEX
GTM
PAN
MEX
MEX
MEX
MEX
PAN
CANCAN
CAN
PNG
PNG
PNGPNGPNG
PNG
PNG
PNG
PNG
PNG
NZL
PNG
PNG
PNG
PNG
PNG
PNG
PNG
PNGPNGPNGPNG
PNG
PNG
PNG
PNG
WSM
PNG
PNG
PNG
PNGPNGPNG
PNG
PNG
PER
BRA
PER
BRA
COL
COL
BRA
COL
COL
BRA
PER
COL
COL BRACOL
ARG
0.56
0.77
0.0 2.5
South America North America Oceania Australia Asia Europe Africa
Gen
etic
Dive
rsity
Migratory Distance from East Africa (in 10,000 km)
Oded Galor Biogeographical Roots 74 / 100

Robustness Ethnic Groups
Genetic Diversity and Productivity of Ethnic Group - (IV Regressions)
DZA
TZA
KEN
SDN
CMR
KENCMR
TZA
CMR
TZATCDTCD ZAR
ERI
KEN
ZAR
CIV
KENTZA
KEN
KEN
KEN
CMR
GAB
TCD
KEN
COG
NGACMR
KEN
CMR
SDN
TCD
KEN
KEN
CMR
NGACMR
TZA
ZAF
TZA
TZATZA
CMR
TCD
CMR
KEN
NGA
CMR
ETH
KENTZA
SEN
TZA KENNGACMR
TZA
TCD GAB
TZA
CMRCMR
NGA
KEN
CMR
CMR
NGA
SSD
ZAF
TZA
ZAF
KEN
AGO
CMRCMR
CMR
GAB
SSD
CAF
KEN
TCD
RWA
KEN
NGA
TCD
KEN
CMRGHA
TCD
KENTZA
KEN
CMR
CMR
NGA
CMR
NGA
ZAR
CMR
GHA
CMR
ETH
KEN
NAM
KEN
CMRTZANGA
CMR
SSD
TZA
CHN
CHN
CHN
CHN
CHNTWN
CHN
CHN
TWN
CHN
MNG
JPN
CHN
CHN
KHM
CHN CHN
CHN
CHNRUS
RUS
RUS
RUS
PSE
SYRYEM
SYR
IND
PAK
IND
PAKIND
IND
IND
AFG
PAK
INDIND
IND
PAK
IND
PAK
IND
IND
PAK
INDIND
PAK
PAK
GBR
FRA
ITARUS
ITA
ITA
ESP
MEX
GTM
PAN
MEX
MEXMEXMEX
PAN
CANCAN
CAN
PNG
PNG
PNG
PNGPNG
PNG
PNG
PNG
PNG
PNG
NZL PNG
PNG
PNG
PNGPNG
PNGPNG
PNG
PNG
PNG
PNG
PNG
PNG
PNG
PNG
WSM
PNG
PNG
PNG
PNG
PNG
PNG
PNGPNG
PER
BRA
PER
BRA
COL
COL
BRA
COL
COL
BRA
PER
COL
COL
BRA
COL
ARG
350
364
0.561 0.768
South America North America Oceania Australia Asia Europe Africa
Cont
rol v
aria
bles
hel
d at
zer
oLo
g Lu
min
osity
Genetic Diversity
Source: Ashraf-Galor-Klemp (2015)
Oded Galor Biogeographical Roots 75 / 100

Robustness Ethnic Groups
Predicted Genetic Diversity - 1331 Ethnic Groups
Oded Galor Biogeographical Roots 76 / 100

Robustness Ethnic Groups
Predicted Genetic Diversity - 1331 Ethnic Groups
ESP
DZA
EGY
LBY
TUN
DZA
DZA
DZA
MAR
DZADZA
TUN
ESH
DZA
MAR
EGY
EGY
MAR
EGY
MAR
MAR
MAR
MAR
DZA
MAR
DZA
DZA
TUN
UGA
ZAR
ETH
TCD
KEN
SSD
MRT
MRT
ZAR
NGA
BENNGA TZA
AGO
SEN
CIV
MLI
TZA
GHA
SDN
GHA
TCD
NGA
NGA KEN
MLI
TZA
ZMB
ZAR
NGA
TCD
ZAR
ETH
ZAR
CAF
UGA
NGA
TZA
ZAR
TZA
ZAF
KEN
SDN
NGA
CMR
NGALBR
TZAUGAKEN
NGA
NGA
ZAR
CIV
NGA
NGA
TZA
TZA
CMRKEN
ZAR
TZA
TZA
CAF
LBR
NGA
SDN
CIV
ZAR
CMR
CAF
MDG
ZAR
ETH
TZA
NGA
NGA
ZAR
TZABFA
NGA
CMR
BEN
MLI
CMRMLI
BFAKEN
GHA
ZAR
SDN
SDN
NGANAM
NGA
AGO
TZA
SSD
NGA
KENZARSDNGINETH
CMR
NGA
GINAGO
ZAR
ZAR
TZA
ETH
ZARSDN
MWIZMB
CMR
ETH
ERINGA
GHA
ZAR
SEN
CMR
CMR
AGO
NGA
LBR
KENKEN
SSD
CIV
ETH
TZA
ZAR
ZMB
ETH
ZMB
SSD
ZAF NAM
ZAR
KEN
ZAR
GHA
CMR
NAM
ETHZAR
GIN
GIN
ZAR
KEN
ZAR
CIV
SDN
NGA
ZAF
UGA
MDG
ZMB
AGOGAB
ETH
GHA
ZAR
UGA
CMRTGO
TZANGA
TZA
TGO
NGAGHA
RWA
NGA
CIV
ETH
NGA
SSD
TZA
MOZ
SENCIV
GHA
ZAR
GIN
GAB
BDI
CMR
ETH
CIV
MLI
BFA TZA
TCD
SDN
KEN
GHA
SDN
COG
BFA
KENNER
CMRSDN
ZAR
NGA
NGA
ZAR
CMR
GNB
MLIMLI
TZA
SEN
ETH
COG
NAM
TZA
ETHUGA
TZA
TGO
NGA
SSDERI
AGO
NGA
MOZ
SSD
CIV
ZMB
MLI
NGA
ZMB MWISLE
CIV
CMR
ETH
GABBFA
ETH
KEN
TZA
TZA
ZAF
GHA
SSD
ETH
BFA
ZAF
KEN
SDN
KEN
UGASSD
ETH
NGA
SLE
ETH
ZAF
ERI
NER
NGA
UGA
NGA
CMR
ZARZMB
CMR
KEN
NGA
TZA
SSD
ZAF
ZAR
GHA
ZAFNGA
ETH
NGA
ZARCMR
TGO
KEN
TCD
CMR
TZA
SEN
ZAR
TZA
TGO
ZAF
UGANER
MRT
ZAR
TZA
TCD UGA
ETH
CMR
BFA
NGA
ZAR
UGAGHA
SSD
UGA
NGA
MOZ
LBR
NGA
TZAETH
KEN
ZAF
MDG
SDN
BFA
CMR
ZAR
NGACMR
TZA
ZAR
NGA
NGA
TCD
NGA
CIV BEN
ZAF
TCD
KEN
ZAR
CMR
CMR
ZAR
ERI
NGAMOZ TCD
TZA
BFA MWI
NGA
TCD
TZA
MLI
ETH
ZAR
SEN
ZAR
SDNKEN
SDN
AGO
TZAMLI
AGO TZA
LBRSLE
ETH
TGO
TZA
CAF
TCD
NGA
ETH
GHACMR
NGA
CMR
SWZ
MDG
SSD
ETH
MOZ
TZA
CMR
KEN
ZWEZAR
MRT
TZA
ZARZAR
GHA
ETH
CMR
NGA
NGA
MDG
NGA
NGA
TCD
AGOSDN
SHN
CMR
SDNCMR
ZAR
TZACMR
NGA
TZA
GNB
ETH
UGA
GHA
ETH
CMR
LBR
CMR
ZAR
MLI
SDN
ETH
ZMB
ZAR
KEN
CIV
TZA
ZAR
MOZ
CMR
NGA
KEN
ZAR
SDN
CMR
TCD
KEN
CMR
ZAR
NER
CIV
CMR
KEN
KEN
NGA
ZMB
GAB
MOZ
CMR
MOZ
NGA
TCD
NGA
NGA
NGA
NGA
NGA
NGA
TCD
BFAAGO
SDN
ETH
GNB
MLI
SEN
ZMB
BFA
BFA
BWA
GHA
COGNGA
NGA
CMR
ZMB
SSD
CMR
NGA
GHA
KEN
MOZ
CMR
ZAR
ZAR
GIN
SSD
KEN
SDN
MOZ
ZARKEN
UGA
KEN
CMR
NAM
CMR
UGA
UGA
SSD
ETH
CMR
KEN
GHA
ZAR
ZAR
ZAR
CMR
SSD
MDGCMR
CMRCIV
CMR
ZAR
SSD
GAB
TZA
SLE
ETH
GNB
TGO
ETH
ZAR
KEN
ZAR
SSD
CMR
NGA
MOZ
SDN
BFA
ERI
GHA
NGA
CMR
KEN
ZAR
MLI
LBR
KEN
NGA
PHL
IDN
CHN
CHN
PNG
IDN
PNG
MMR
PNG
CHN
PNG
PNGPNG
IDN
IDN
TWN
PHL
IDN
MYS
IDN
IDN
CHN
IDN
CHN
PNG THA
CHN
IDN
IDN
PNGPHL
JPN
CHN
PHL
PHL
IDN
PHL
MMR
PNG
IDN
VNM
PNG
PNG
PHL
MMR
VNM
IDN
VNM
CHN
MMR
IDN
JPN
CHN
PNG
CHN
TWN
IDN
THA
IDN
PNG
PNG
PNG
PHL
IDNIDN
MYS
PHL
MMR
TWN
CHN
CHN
IDN
CHN
CHN
MYS
PNG
IDN
CHN
PNG
MMR
IDN
IDNPNG
PNG
CHN
TWN
IDNJPN
IDN
LAO
PNG
VNM
MYS
CHN
IDN
MYS
KHM
PNG
PNG
PNG
THA
PHL
MMR
MMR
CHN
KHM
PNG
PNG
PNG
CHN
JPN
CHNTLS
PNG
PNG
TWNCHN
VNM
IDN
PNG
IDN
IDN
JPN
PNG
PNGPNG
IDNPHL
PNG
CHN
VNM
TWN
MNG
PNG
CHN
CHN
IDN
RUS
PSE
RUS
RUS
ARM
RUS
RUS
RUS
RUS
GEO
RUS
RUSGEO
RUS
GEO
RUS
TUR
GEO
RUS
KAZ
RUS
SYR
IRQ
SAU
YEM
IRN
SAU
SYR
IRN
ISR
IRN
IRN
ISR
LBN
IRN
IRQ
SYR
IND
PAK
PAK
IND
IND
IND
IND
IND
AFGINDIND
IND
PAK
IND
IND
IND
IND
IND
IND
IND
IND
PAK
PAK
IND
IND
IND
IND
NPL
IND
PAK
BGD
BGD
AFG
IND
IND
IND LKA
PAK
BGD
IND
IND
IND
AFG
AFG
PAK
IND
PAK
IND
IND
IND
INDIND
IND
IND
IND
IND
IND
IND
IND
AFG
IND
NPL
IND
IND
LKA
IND
IND
AUS
AUS
AUS
AUS
AUS
AUS
AUSAUS
AUS
AUS
AUS
AUS
AUS
AUS
ITA
GBR
RUS
ESP
FRA
UKR
LTU
HUN
CZE
RUS
RUS
RUS
ROU
ITA
RUS
GRC
ISL
UKR
ESP
ALB
NLD
PRT
RUSITA SRB
ITA
IRL
BEL
ESP
RUS
BLR
BGR
GRL
MEXHND
MEXMEX
MEX
GTM
MEX
MEX
GTM
GTM
MEX
MEX
MEX
MEX
MEX
PAN
MEX
HND
BLZ
MEX
MEX
MEX
MEX
MEX
MEX
PAN
GTMHND
BHS
MEX
MEX
MEX
GTM
HTI
MEX
MEX
DMA
MEX
MEX
MEX
GTM
MEX
USA
CAN
CANUSA
USA
CANCAN
USA
USA
USA
USA
USA
USAUSA
USA
USA
USA
USA
USA
USA
USAUSA
USA
USACAN
USA
USA
USA
USA
USA
USA
USACAN
USA
CAN
USA
USA
USA
CANCAN CAN
USA
USA
CAN
USA
USA
USA
USAUSAUSA
USA
USA
USA
USA
USA
CAN
USAUSA
USA
USA
USAUSA
USA
USA
USA
USA
USA
USA
CAN
USA
USA
USA USA
USA
USA
USA
USAUSAUSA USA
USAUSA
USA
CAN
USA
USA
USA
USA
USA
USA
USAUSAUSA
USA
CAN
USA
USA
USA
USA
USA USA
USAUSA
CAN
CAN
USACAN
CAN
USA
USA
CAN
CANUSA USA
USA
USAUSA
USA
USA
USA
USA
USA
USA
USA
USA
USAUSA
CAN
USA
USAUSA
CANUSA
CAN
USA
USA
USA
CAN
CANUSA
USA
USA
USA
USA
USA
USA
USA
USA
USACAN
USA
USA
USA
USA
USA
USA
USA
USAUSA
USA
USA
USA USA
CAN
USA
CAN
USAUSA
USA
USA
USA
USA
CAN
USA
USA
CAN
USA
CAN
USA
USA
USA
USA
USA
USA
CAN
USA
USA
USA
CAN
USA
USA
USA
USA
USAUSA
USAUSA
USA
USA
USA
USA
USACAN
CAN
USA
USA
USA
USA
USA
CAN
USA
CAN
USA
USA
USA
USA
USA
CANUSA
USA
USA
USA
USA
USA
USA
CAN
USA
USA
CAN
USACAN
USA CAN
USAUSA
USA
USA
USA USA
USA
USA
CAN
USA
USA
CAN
CAN
USA
USA
CAN
PNG
SLB
PNG
TKL
PNGPNG
MHL
PNG
PYF
WSM
PLW
NRU
PNG
VUT
VUT
SLB
WLF
WSM
PNG
TON
TUV
WLF
SLB PNG
PNG
SLB
PYF
PNG
PNGPNG
PNG
PNG
SLB
MHL
SLB
COK
SLB
PNG
PNG
FSM
VUT
VUT
PNG
NCL
PNG
PNG
PNG
PNG
KIR
PNG
FSM
KIR
MNPNCL
PNG
COK
FJI
PNG
FJI
PNG
SLB
PNG
PNG
NIU
PNG
FSM
PNG
PNG
PNG
FJI
VUT
PYF
COK FSM
FJI
SLB
PNG
PNGPNG
NZL
GUM
MHL
VUT
PNG
PNG
PNGPNG
FSM
PNG
BRABRA
ECU
PRY
BOL
PERARGBRA COL
BRA
COL
PER
VEN
COL
BOL
VEN
PAN
BRA
BRA
VEN
PER
BRA
VEN
COL
BRA
PER
VEN
PERBRA
BRA
COL
COL
COL
BRA
GUY
COL
BRA
VEN
SUR
BRA
VEN
GUF
BRA
COL
ECU
VEN
COL
BRA
PRY
ARG
COL
BRA
PER
BRA
ARG
SUR
COL
BRA
ARG
BRA
ARGVEN
BRA
ARG
BOL
BRA
PER
BRA
PRY
BRA
PERPER
GUF PAN
COL
ARG
COL
BRA
BRA
BOL
GUY
VEN
CHL
COL
BRA
VEN
VEN
BRA
BOL
VEN
BRA
BRA
BRACOL
BRA
BRA
BRA
BRA
COL
91
103
0.579 0.768
South America North America Oceania Australia Asia Europe Africa
Cont
rol v
aria
bles
hel
d at
zer
oLo
g Av
erag
e Li
ght p
er C
apita
(Predicted) Expected Heterozygosity
Source: Ashraf-Galor-Klemp (2015)
Oded Galor Biogeographical Roots 77 / 100

Mechanisms Cost of Diversity
Cost of Diversity: Genetic Diversity & Cultural Fragmentation
AGO
BDI
BEN
BFA
BWA
CAF
CIV
CMR
COG
DZA
EGY
ETH
GAB
GHA
GIN
GMBGNB
KEN
LBR
LBYLSO
MAR
MDG
MLI
MOZ
MRT
MWI
NAM
NER
NGA
RWA
SDN
SEN
SLE
SOM
SWZ
TCD
TGO
TUN
TZA
UGA
ZAF
ZAR
ZMB
ZWE
ALB
AUT
BEL
BGR
BIH
BLR
CHE
CZE
DEU
DNK
ESP
EST
FIN
FRA
GBR
GRC
HRV
HUN
IRL
ITA
LTU
LVAMDA
MKD
NLD
NOR
POL
PRT
ROM
RUS
SVN
SWE
UKR
YUG
AFG
ARE ARM
AZE
BGD
BTN
CHN
GEO
IDNIND
IRN
IRQISR
JOR
JPN
KAZ
KGZ
KHM
KOR
KWT
LAO
LBN
LKA
MMR
MNG
MYS
NPL
OMN
PAK
PHL
PRK
SAU
SYR
THA
TJK
TKM
TUR UZB
VNMAUS
NZL
PNG
CAN CRI
CUB
DOM
GTM
HND
HTI
MEX
NIC
PAN
SLV
USA
ARG
BOL
BRA
CHL
COL
ECU GUY
PER
PRY
URY
VEN
−1
−.5
0.5
1
−.05 0 .05
Africa Europe Asia Oceania N. America S. America
(Con
trol
var
iabl
es h
eld
at z
ero)
Log
num
ber
of e
thni
c gr
oups
(Control variables held at zero)
Genetic diversity (ancestry adjusted)
Relationship conditional on historical and geographical controls, as well as continent fixed effectsSlope coefficient = 6.397; (robust) standard error = 1.973; t−statistic = 3.242; partial R−squared = 0.059; observations = 144
Source: Ashraf and Galor (2013b)
Source: Ashraf-Galor (AER, May 2013)
Oded Galor Biogeographical Roots 78 / 100

Mechanisms Cost of Diversity
Cost of Diversity: Genetic Diversity & Trust
BFA
DZA
EGY
ETH
GHA
MAR
MLI
NGA
RWA
TZA
UGA
ZAF
ZMB
ZWE
ALBAUT
BELBGR
BIHBLR
CHE
CZE
DEU
DNK
ESP
EST
FIN
FRA
GBR
GRCHRV
HUN
IRL
ITA
LTU
LUX
LVA
MDA
MKD
NLD
NOR
POL
PRT
ROM
RUS
SVK
SVN
SWE
UKR
YUG
ARM
AZEBGD
CHN
GEO
IDN
INDIRN
IRQ
ISR
JOR
JPN
KGZ
KOR
MYS
PAK
SAUTHA
TUR
VNM
AUS
NZL
CAN
GTMMEX SLV
USA
ARG
BRA
CHL
COL
PER
URY
VEN
−.2
−.1
0.1
.2.3
−.04 −.02 0 .02 .04
Africa Europe Asia Oceania N. America S. America
(Con
trol
var
iabl
es h
eld
at z
ero)
Pre
vale
nce
of in
terp
erso
nal t
rust
(Control variables held at zero)
Genetic diversity (ancestry adjusted)
Relationship conditional on geographical controls and region fixed effectsSlope coefficient = −2.151; (robust) standard error = 0.756; t−statistic = −2.845; partial R−squared = 0.105; observations = 84
Source: Arbatli, Ashraf, and Galor (2015)
Oded Galor Biogeographical Roots 79 / 100

Mechanisms Cost of Diversity
Cost of Diversity: Genetic Diversity & Heterogeneity in Preferences
BFA
DZA
EGY
ETH
GHA
MAR
MLI
NGA
RWA
TZA
UGA
ZAF
ZMB
ZWE
ALB
AUT
BEL
BGR
BIH
BLRCHECZE
DEU
DNKESP
EST
FIN
FRA
GBR
GRC
HRVHUN
IRL
ITA
LTU
LUX
LVA
MDA
MKD
NLD
NOR
POL
PRT ROM
RUS
SVK
SVN
SWE
UKR
YUG
ARM
AZE
BGD
GEO
IDN
IND
IRN
IRQISR
JOR
JPN
KGZ
KOR
PAK
THA
TUR
VNM
AUS
NZL CAN
GTM
MEX
SLV
USA
ARG
BRA
CHL
COL
PER
URY
VEN
−2
−1
01
2
−.04 −.02 0 .02 .04
Africa Europe Asia Oceania N. America S. America
(Con
trol
var
iabl
es h
eld
at z
ero)
Het
erog
enei
ty in
pol
itica
l pre
fere
nces
(Control variables held at zero)
Genetic diversity (ancestry adjusted)
Relationship conditional on geographical controls and region fixed effectsSlope coefficient = 16.963; (robust) standard error = 5.954; t−statistic = 2.849; partial R−squared = 0.111; observations = 81
Source: Arbatli, Ashraf, and Galor (2015)
Oded Galor Biogeographical Roots 80 / 100

Mechanisms Cost of Diversity
Cost of Diversity: Genetic Diversity & Ethnic Civil Conflict
AGO
BDI
BEN
BFA
BWACAF
CIVCMR
COG
DZA
EGY
ERI
ETH
GABGHAGIN
GMBGNB
GNQKEN
LBR
LBY
LSO
MAR
MDGMLI
MOZMRT
MWI
NAM
NER
NGA
RWA
SDNSEN SLE
SOM
SWZ TCD
TGOTUN
TZA
UGA
ZAF
ZAR
ZMB
ZWE
ALBAUTBEL
BGR
BIH
BLR
CHE
CZEDEU
DNK
ESPESTFIN FRA
GBR
GRC
HRV
HUNIRL
ITA
LTULUX
LVA
MDAMKD
NLDNOR POL
PRT
ROM
RUS
SVKSVN
SWE
UKR
YUG
AFGARE
ARM
AZE
BGD
BTN
CHN
GEO
IDN
IND
IRN
IRQISR
JOR
JPN
KAZ
KGZ
KHM
KOR
KWT
LAOLBN
LKA
MMR
MNG
MYS
NPL
OMN
PAK
PHL
PRK
QAT
SAUSYR
THA
TJK
TKM
TURUZB
VNM
YEM
AUS
NZL
PNG
BLZ
CAN
CRICUB
DOM
GTMHND
HTIMEX
NIC PANSLV
USA
ARGBOLBRA
CHLCOL
ECU
GUYPERPRY
URY
VEN
−.0
50
.05
.1.1
5
−.1 −.05 0 .05
Africa Europe Asia Oceania N. America S. America
(Con
trol
var
iabl
es h
eld
at z
ero)
Log
annu
al fr
eque
ncy
of c
ivil
conf
licts
, 196
0−20
08
(Control variables held at zero)
Genetic diversity (ancestry adjusted)
Relationship conditional on geographical controlsSlope coefficient = 0.445; (robust) standard error = 0.117; t−statistic = 3.790; partial R−squared = 0.112; observations = 151
Source: Arbatli, Ashraf, and Galor (2015)
Source: Arbatli-Ashraf-Galor-Klemp (2016)
Oded Galor Biogeographical Roots 81 / 100

Mechanisms The Benefit of Diversity
Benefits of Diversity —Genetic Diversity & Scientific Research
BDI
BEN
BWA
CAFCMR
COG
DZA
EGY
ETH
GHA
GMB
KEN
LSO
MLI
MOZ
MRT
MWI
NER
RWA
SDN
SEN
SLE
SWZ
TGOTUN
UGAZAF
ZAR
ZMB
ZWE
AUT
BEL
BGR
CHE
CYP
DEU
DNK
ESP
FIN
FRA
GBR
GRC
HUN
IRL
ITA
NLD
NOR
POLPRT ROM
SWE
BGD
CHN
IDN
IND
IRN
IRQ
JPN
KOR
LKA
MMR
MYS
PAK
PHL
SYR
THA
TUR
AUS
NZL
PNG
CAN
CRI
DOM
GTMHND
HTI
MEX
NIC
PAN
SLV
TTO
USA
ARG
BOL
BRA
CHL
COL
ECU
GUY
PER
PRY URYVEN
−.4
−.2
0.2
.4
−.05 0 .05
Africa Europe Asia Oceania N. America S. America
(Con
trol
var
iabl
es h
eld
at z
ero)
Ave
rage
ann
ual s
cien
tific
art
icle
s pe
r ca
pita
, 198
1−20
00
(Control variables held at zero)
Genetic diversity (ancestry adjusted)
Relationship conditional on historical, geographical, and institutional controls, as well as continent fixed effectsSlope coefficient = 2.484; (robust) standard error = 0.511; t−statistic = 4.864; partial R−squared = 0.131; observations = 93
Source: Ashraf and Galor (2013a)
Oded Galor Biogeographical Roots 82 / 100
Conclusion
Conclusions: Roots of Comparative Development
The migration of humans out of Africa 70,000-90,000 BP affected
The distribution of genetic diversity across the globe
Comparative economic development
Accounts for 16% of the variation in the income per capita acrosscountries
Variation in the onset of the Neolithic Revolution
Affected comprative developmemt till around 1500
Has no persistent effect on comparative development in the modern era
Oded Galor Biogeographical Roots 83 / 100

Conclusion
Policy Implications
Education policy
In overly-diverse societies:
Education geared towards: social cohesiveness & tolerance=⇒ Mitigating the cost of diversity
In overly-homogeneous societies:
cultivation of cultural diversity=⇒ substitute for low genetic diversity
Optimal level of cultural assimilation
Oded Galor Biogeographical Roots 84 / 100
AppendixSelection: Distance from East Africa and
Phenotypes
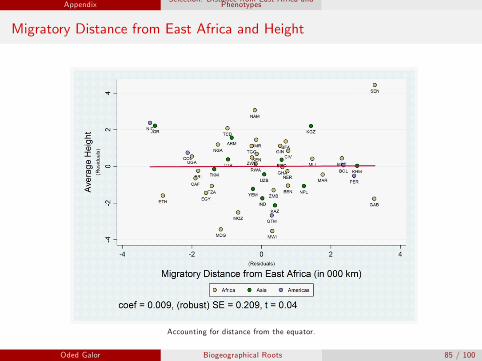
Migratory Distance from East Africa and Height
Accounting for distance from the equator.
Oded Galor Biogeographical Roots 85 / 100

AppendixSelection: Distance from East Africa and
Phenotypes
Migratory Distance from East Africa and Weight
Accounting for distance from the equator.
Oded Galor Biogeographical Roots 86 / 100

AppendixSelection: Distance from East Africa and
Phenotypes
Migratory Distance from East Africa and Skin Reflectance
Accounting for distance from the equator.
Oded Galor Biogeographical Roots 87 / 100

AppendixSelection: Distance from East Africa and
Phenotypes
Migratory Distance from East Africa and IQ
Accounting for distance from the equator.
Oded Galor Biogeographical Roots 88 / 100

AppendixSelection: Distance from East Africa and
Phenotypes
Expected Heterozygosity in Microsatellites
Expected heterozygosity calculated for the 53 ethnic groups in the HGDPusing allelic frequencies for 783 microsatellite loci
Advantage of using microsatellites — a class of non-protein-coding regions ofthe human genome:
Selectively neutral
Ensures that the observed cross-sectional variation in diversity isnot due to differential forces of natural selection
Expected heterozygosity in microsatellites is positively correlated withphenotypic and cultural diversity
Permitting an exploration of the effect of GD on economic outcomes
Oded Galor Biogeographical Roots 89 / 100
AppendixSelection: Distance from East Africa and
Phenotypes
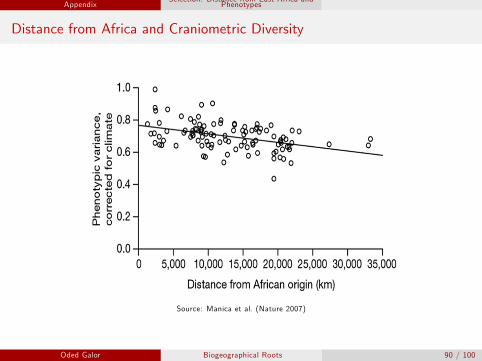
Distance from Africa and Craniometric Diversity
Source: Manica et al. (Nature 2007)
Oded Galor Biogeographical Roots 90 / 100
AppendixSelection: Distance from East Africa and
Phenotypes
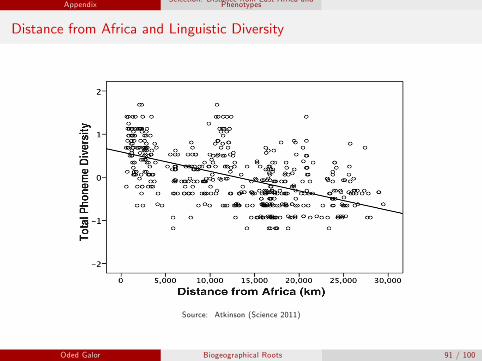
Distance from Africa and Linguistic Diversity
Source: Atkinson (Science 2011)
Oded Galor Biogeographical Roots 91 / 100

AppendixSelection: Distance from East Africa and
Phenotypes
Distance from Africa and Dental Diversity
Source: Hanihara (American Journal of Physical Anthropology, 2008)
Oded Galor Biogeographical Roots 92 / 100

AppendixSelection: Distance from East Africa and
Phenotypes
Distance from Africa and Height Diversity
Source: Galor and Klemp (2014)
Oded Galor Biogeographical Roots 93 / 100
AppendixSelection: Distance from East Africa and
Phenotypes
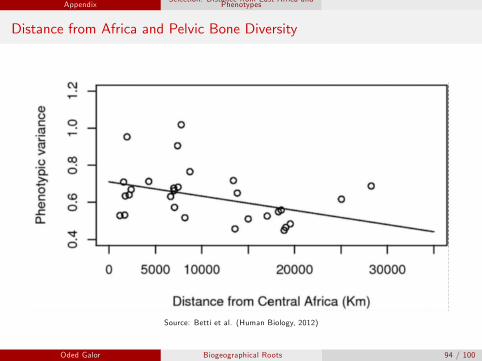
Distance from Africa and Pelvic Bone Diversity
Source: Betti et al. (Human Biology, 2012)
Oded Galor Biogeographical Roots 94 / 100

AppendixSelection: Distance from East Africa and
Phenotypes
Robustness to Microgeographic Factors
(1) (2) (3) (4) (5)
Dependent Variable: Log Population Density in 1500
Predicted Diversity 159.92*** 153.20*** 157.07** 150.02*** 157.06**(56.00) (53.39) (78.82) (49.36) (68.61)
Predicted Diversity Sqr. -110.39*** -105.33*** -112.78** -102.76*** -114.99**(41.08) (39.11) (55.48) (36.23) (48.26)
Log Years since NR Yes Yes Yes Yes Yes
Land Prod. Controls Yes Yes Yes Yes Yes
Mean Elevation -0.48** 0.51* 0.50*(0.23) (0.27) (0.27)
Roughness 5.15*** 3.09* 4.08**(1.77) (1.74) (1.84)
Roughness Sqr. -7.05** -7.05** -7.63***(3.11) (2.96) (2.91)
Distance to Nearest -0.49*** -0.44** -0.47** -0.39**Waterway (0.18) (0.18) (0.18) (0.18)
% Land within 100 km 0.70** 0.73** 1.11*** 1.18***of Waterway (0.28) (0.31) (0.29) (0.29)
Optimal Diversity 0.724 0.727 0.696 0.730 0.683(0.201) (0.190) (0.187) (0.229) (0.095)
Continent Dummies No No Yes No Yes
Observations 145 145 145 145 145
R-squared 0.69 0.74 0.75 0.76 0.78
Bootstrap standard errors in parentheses; *** p<0.01, ** p<0.05, * p<0.1.
Oded Galor Biogeographical Roots 95 / 100

AppendixSelection: Distance from East Africa and
Phenotypes
Robustness to Biogeography
(1) (2) (3) (4) (5)
Dependent Variable is Log Population Density in 1500
Predicted Diversity 216.85*** 252.08*** 174.41*** 212.12*** 274.92***(62.06) (70.81) (62.75) (72.13) (72.12)
Predicted Diversity Sqr. -154.75*** -180.65*** -125.14*** -151.58*** -197.12***(45.19) (51.89) (45.72) (52.79) (52.40)
Log Years since NR 1.30*** 1.16***(0.16) (0.31)
Land Prod. Controls Yes Yes Yes Yes Yes
Climate 0.62*** 0.42 0.37*(0.14) (0.27) (0.22)
Orientation of Axis 0.28 0.04 -0.17(0.33) (0.30) (0.27)
Size of Continent -0.01 -0.01 -0.01(0.02) (0.01) (0.01)
Domesticable Plants 0.02 -0.01 0.00(0.02) (0.02) (0.02)
Domesticable Animals 0.15** 0.12 -0.01(0.06) (0.07) (0.07)
Optimal Diversity 0.701 0.698 0.697 0.700 0.697(0.123) (0.016) (0.159) (0.045) (0.041)
Observations 96 96 96 96 96
R-squared 0.74 0.70 0.70 0.72 0.78
Bootstrap standard errors in parentheses; *** p<0.01, ** p<0.05, * p<0.1.
Oded Galor Biogeographical Roots 96 / 100

AppendixSelection: Distance from East Africa and
Phenotypes
Income Per Capita and Nightlight Observed by Satellites: 1992-2012
DZA
AGO
BWA
BDI
CMR
CAF TCD
COG
ZAR
BEN
ETH
GAB
GMBGHA
GIN
CIV
KEN
LSO
MDG
MWI
MLI
MRT
MAR
MOZ NAM
NER
NGA
GNB
RWASEN
SLE
ZAF
SDN
SWZ
TGO
TUN
UGA
EGY
TZABFA
ZMB
AUT
BEL
BGR
CYPDNK
FIN
FRADEU
GRCHUN IRL
ITA
NLD
NOR
POLPRT
ROM
ESP
SWE
CHEGBR
BGD
LKA
CHN
IND
IDN
IRN
IRQ
ISRJPN
JOR
KOR
MYS
OMN
PAK
PHL SAU
SYRTHA
TUR
AUS
NZL
PNG
ARG
BOL
BRACANCHL
COL
CRIDOM
ECU
SLV
GTM
GUY
HTI
HND
JAM
MEX
NIC
PAN
PRYPER
TTO
USA
URY
VEN
-2.7
-1.8
-.9
0
.9
1.8
2.7
-2.7 -1.8 -.9 0 .9 1.8 2.7
Log
per-a
rea
light
inte
nsity
(sta
ndar
dize
d)
Log GDP per capita in 1992-2012 (standardized)A
DZA
AGO
BWA
BDI
CMR
CAFTCD
COG
ZAR
BEN
ETH
GAB
GMB
GHA
GIN
CIV
KEN
LSO
MDG
MWI MLI
MRT
MAR
MOZ
NAM
NER
NGA
GNBRWA
SEN
SLE
ZAF
SDN
SWZ
TGO
TUN
UGA
EGY
TZABFA
ZMB
AUTBEL
BGR
CYP DNK
FIN
FRA
DEUGRCHUN
IRL
ITANLD
NOR
POL PRT
ROM
ESP
SWE
CHEGBR
BGD
LKACHNIND
IDN
IRN
IRQ
ISR
JPNJORKOR
MYS
OMN
PAK
PHL
SAU
SYR
THA
TUR
AUSNZL
PNG
ARG
BOL
BRA
CAN
CHL
COL
CRI
DOM
ECU
SLVGTM
GUY
HTI
HND
JAM MEX
NIC
PANPRY
PER
TTO
USA
URYVEN
-2.7
-1.8
-.9
0
.9
1.8
2.7
-2.7 -1.8 -.9 0 .9 1.8 2.7
Log
per-c
apita
light
inte
nsity
(sta
ndar
dize
d)
Log GDP per capita in 1992-2012 (standardized)B
Africa Europe Asia Oceania Americas
Source: Ashraf-Galor-Klemp (2014)
Oded Galor Biogeographical Roots 97 / 100

AppendixSelection: Distance from East Africa and
Phenotypes
Migratory Distance from East Africa vs. Genetic Diversity
(1) (2) (3) (4) (5)
Dependent Variable: Log Population Density in 1500
Genetic Diversity 417.003*** 300.978*** 361.421**(90.909) (76.371) (121.429)
Genetic Diversity Sqr. -306.218*** -241.755*** -268.515***(68.308) (61.099) (87.342)
Migratory Distance 0.463*** -0.003(0.142) (0.178)
Migratory Distance Sqr. -0.021*** -0.010(0.006) (0.009)
Mobility Index 0.353** 0.051(0.127) (0.154)
Mobility Index Sqr. -0.012*** -0.003(0.004) (0.006)
Observations 18 18 18 18 18
R-squared 0.43 0.30 0.30 0.47 0.43
P-value for:Joint Sig. of Diversity and its Sqr. 0.006 0.027Joint Sig. of Distance and its Sqr. 0.320Joint Sig. of Mobility and its Sqr. 0.905
Robust standard errors in parentheses; *** p<0.01, ** p<0.05, * p<0.1.
Oded Galor Biogeographical Roots 98 / 100

AppendixSelection: Distance from East Africa and
Phenotypes
Addressing Endogenous Post-1500 Migrations
(1) (2) (3) (4) (5) (6)
Full Non w/o Neo w/o Latin w/o Sub >0.97Sample OECD Europes America Sahara Indigenous
Dependent Variable is Log Income per Capita in 2000
Adjusted Diversity 277.342*** 271.979*** 261.367*** 412.222*** 264.805** 304.735**(70.232) (88.479) (70.533) (148.584) (111.365) (111.588)
Adjusted Diversity Sqr. -192.386*** -188.974*** -181.811*** -287.067*** -183.863** -213.389**(49.675) (62.096) (49.671) (101.906) (80.398) (77.255)
Log Adj. Time of NR 0.396* 0.390 0.355 0.518* 0.068 0.448*(0.233) (0.281) (0.231) (0.298) (0.442) (0.254)
Log % of Arable Land -0.183*** -0.236*** -0.201*** -0.189*** -0.211** -0.104(0.051) (0.060) (0.055) (0.050) (0.097) (0.061)
Log Absolute Latitude 0.009 -0.021 -0.025 -0.139 0.218 -0.074(0.108) (0.119) (0.111) (0.126) (0.242) (0.130)
Social Infrastructure 1.826*** 1.313** 1.416*** 2.044*** 1.585*** 1.311*(0.417) (0.579) (0.507) (0.545) (0.486) (0.716)
Ethnic Frac. -0.333 -0.437 -0.390 -0.752** 0.104 -0.044(0.280) (0.375) (0.300) (0.348) (0.408) (0.412)
% Population at Risk -0.502 -0.605 -0.591 -0.308 -0.425 -0.153of Malaria (0.351) (0.381) (0.370) (0.486) (0.581) (0.434)
% Population Living -0.319 -0.196 -0.302 -0.520** -0.528 -0.339in Tropical Zones (0.204) (0.239) (0.219) (0.252) (0.341) (0.312)
Optimal Diversity 0.721 0.720 0.719 0.718 0.720 0.714(0.083) (0.085) (0.015) (0.023) (0.180) (0.012)
Observations 109 83 105 87 71 37R-squared 0.90 0.82 0.89 0.93 0.86 0.98
Bootstrap standard errors in parentheses; *** p<0.01, ** p<0.05, * p<0.1.
Oded Galor Biogeographical Roots 99 / 100
AppendixSelection: Distance from East Africa and
Phenotypes
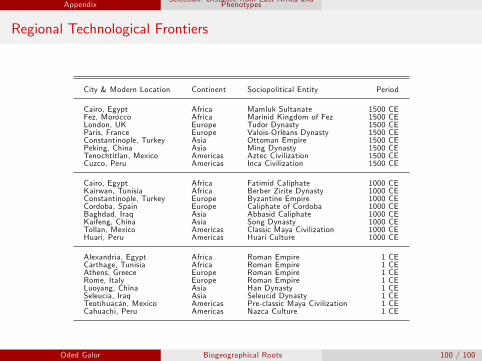
Regional Technological Frontiers
City & Modern Location Continent Sociopolitical Entity Period
Cairo, Egypt Africa Mamluk Sultanate 1500 CEFez, Morocco Africa Marinid Kingdom of Fez 1500 CELondon, UK Europe Tudor Dynasty 1500 CEParis, France Europe Valois-Orléans Dynasty 1500 CEConstantinople, Turkey Asia Ottoman Empire 1500 CEPeking, China Asia Ming Dynasty 1500 CETenochtitlan, Mexico Americas Aztec Civilization 1500 CECuzco, Peru Americas Inca Civilization 1500 CE
Cairo, Egypt Africa Fatimid Caliphate 1000 CEKairwan, Tunisia Africa Berber Zirite Dynasty 1000 CEConstantinople, Turkey Europe Byzantine Empire 1000 CECordoba, Spain Europe Caliphate of Cordoba 1000 CEBaghdad, Iraq Asia Abbasid Caliphate 1000 CEKaifeng, China Asia Song Dynasty 1000 CETollan, Mexico Americas Classic Maya Civilization 1000 CEHuari, Peru Americas Huari Culture 1000 CE
Alexandria, Egypt Africa Roman Empire 1 CECarthage, Tunisia Africa Roman Empire 1 CEAthens, Greece Europe Roman Empire 1 CERome, Italy Europe Roman Empire 1 CELuoyang, China Asia Han Dynasty 1 CESeleucia, Iraq Asia Seleucid Dynasty 1 CETeotihuacán, Mexico Americas Pre-classic Maya Civilization 1 CECahuachi, Peru Americas Nazca Culture 1 CE
Oded Galor Biogeographical Roots 100 / 100