Embed Size (px)
Citation preview

ORIGINALARTICLE
Incubator birds: biogeographical originsand evolution of underground nesting inmegapodes (Galliformes: Megapodiidae)Rebecca B. Harris1,2*, Sharon M. Birks2 and Adam D. Leach!e1,2
1Department of Biology, University of
Washington, Seattle, WA 98195, USA, 2Burke
Museum of Natural History and Culture,
University of Washington, Seattle, WA 98195,
USA
*Correspondence: Rebecca B. Harris, Box351800 Kincaid Hall, University ofWashington, Seattle, WA 98195, USA.E-mail: [email protected]
ABSTRACT
Aim Unique amongst birds, megapodes (family Megapodiidae) have exchangedthe strategy of incubating eggs with the warmth of their bodies for incubation
behaviours that rely entirely on environmental heat sources. Typically, mound-
builders capture heat released from the decomposition of organic materials,while burrow-nesters lay their eggs in geothermal or solar-heated soils. The
evolutionary path towards novel incubation behaviours has led to ecological
and physiological adaptations unique to megapodes. Here, we present a speciestree for all extant megapodes that settles long-standing debates about mega-
pode evolution: namely, their biogeographical origins and ancestral nesting
behaviour.
Location Australasia.
Methods A time-calibrated multilocus species tree for all extant megapodes
was constructed using *beast. We estimated and compared divergence dates
for megapodes obtained from molecular rates, fossils, and a combination offossils and rates. Using this tree, Bayesian estimation of ancestral nesting
behaviour was conducted in BayesTraits and ancestral ranges were estimated
in BioGeoBEARS.
Results Recent dispersal has led to the recolonization of mainland Australia
and New Guinea by Megapodius. Bayesian estimation of ancestral states indi-cates that mound building is the most probable ancestral nesting behaviour in
megapodes (posterior probability = 0.75). Burrow nesting was acquired early
in the diversification of the family (at least 14 Ma), followed by a single switchback to mound building.
Main conclusions Divergence dates and biogeographical reconstructionsstrongly suggest that dispersal, and not vicariance, led to the isolation of mega-
podes in Australasia. We propose that flight-mediated dispersal to environmen-
tally variable islands is responsible for the behavioural lability in nestingbehaviours observed in some Megapodius species today.
Keywords*BEAST, Australian biogeography, BayesTraits, BIOGEOBEARS, dispersal, fossil
calibration, Megapodius, nesting behaviour, phylogeography.
INTRODUCTION
Megapodes (family Megapodiidae) represent the extreme of
precocial birds and are, by behaviour and morphology, the
most distinctive family of order Galliformes. By exploiting
environmental rather than body heat to incubate their eggs,
megapodes have been released from the constraints of post-
hatching parental care. Most megapodes build mounds by
raking together large piles of damp organic materials and
harnessing heat generated by microbial decomposition. These
mounds can reach heights of 4 m and weigh over 5 tonnes.
Other megapode species burrow into substrates with pre-
existing heat sources, such as sun-exposed beaches, geother-
mal energy or rotting roots (Table 1) (Jones et al., 1995).
ª 2014 John Wiley & Sons Ltd http://wileyonlinelibrary.com/journal/jbi 2045doi:10.1111/jbi.12357
Journal of Biogeography (J. Biogeogr.) (2014) 41, 2045–2056

Hatchlings of all species must dig themselves out of the incu-
bation site: a daunting undertaking that can take anywhere
from hours to days. Once at the surface, there is no parent
waiting and hatchlings are immediately able to run, forage
and fly for short bursts (Jones et al., 1995).
In addition to their peculiar nesting behaviour, the early
divergence of megapodes, their distribution in Australasia,
and the distribution of extant Galliformes in the Southern
Hemisphere have led to conflicting theories about their geo-
graphical origin (Olson, 1978; Crowe et al., 2006). Multiple
molecular studies of galliform divergence times have found
support for a Gondwanan origin of megapodes and diver-
gence from other Galliformes in the Cretaceous (Crowe
et al., 2006; Pereira & Baker, 2006a). However, these studies
used contentious fossil calibrations that conflict with a palae-
ontological record devoid of Neornithes until the Late Creta-
ceous (Mayr, 2008; Ksepka, 2009). Thus, the geographical
origins of megapodes remain equivocal. Recent studies have
shown that many clades originally thought to be the result of
Gondwanan vicariance are too young to be caused by conti-
nental breakup (de Queiroz, 2005). In such cases, oceanic
dispersal is the preferred explanatory process for current spe-
cies distributions.
The earliest known fossil megapode, Ngawupodius minya,
demonstrates that megapodes were present on Australia dur-
ing the Oligocene (Boles & Ivison, 1999). During the Plio-
cene, when the Australian plate moved closer to Asia and sea
levels changed, megapodes are thought to have dispersed
outwards through the Indonesian archipelago and eastwards
towards Polynesia, using islands as stepping stones (Dekker,
2007). Isolated on new islands, ancestral megapodes presum-
ably diversified and evolved the reproductive strategies
observed today.
The evolutionary path of megapodes towards alternative
incubation strategies has led to ecological and physiological
adaptations unique to this group (Jones et al., 1995; Booth
& Jones, 2001). Nearly all stages of megapode development
have adaptations specific to their peculiar nesting behaviours.
Eggs and chicks, which are buried up to half a metre or
more underground during incubation, must survive the
extraordinary conditions this environment imposes, includ-
ing extreme humidity, variable incubation temperatures, high
carbon dioxide and low oxygen levels. Megapode eggs have
multiple adaptations that facilitate gas exchange, including
thin eggshells and egg pores that broaden throughout the
course of development. Megapodes have unusually large eggs,
high yolk content and long incubation periods. As a result,
the emerging megapode chicks are the most developmentally
advanced of any bird and are completely independent from
their parents. However, the conspicuous nature of mounds
Table 1 Conservation status, nest attributes and geographical range of megapodes.
Species Status Nest type Heat Source ‘Ancestral’ biogeographical range
‘Brush turkey’ cladeAepypodius arfakianus LC M C AUS + PNG
Aepypodius bruijnii EN M C AUS + PNGAlectura lathami LC M C AUS + PNG
Leipoa ocellata VU M C, S AUS + PNGTalegalla cuvieri* LC M C AUS + PNG
Talegalla fuscirostris LC M C AUS + PNGTalegalla jobiensis† LC M C AUS + PNG
‘Scrubfowl’ cladeEulipoa wallacei VU B S Wallacea
Megapodius bernsteinii* VU M C WallaceaMegapodius cumingii† LC B, M C, R PHL + Palawan, Wallacea
Megapodius decollatus† LC M C AUS + PNGMegapodius eremita LC B, M C, G, R, S AUS + PNG
Megapodius forstenii LC M C WallaceaMegapodius freycinet LC M C Wallacea
Megapodius geelvinkianus* VU ? ? AUS + PNG
Megapodius laperouse EN B, M C, G, S IslandsMegapodius layardi VU B, M C, G, R, S Islands
Megapodius nicobariensis* VU M C NicobarMegapodius pritchardii EN B G, R? S? Islands
Megapodius reinwardt LC M C, S AUS + PNG, WallaceaMegapodius tenimberensis NT M C Wallacea
Macrocephalon maleo EN B G, S Wallacea
*Species represented by museum toe-pad samples only and excluded from the ‘full coverage’ data matrix.
†Species represented by fresh tissue and museum toe-pad samples.Status: LC, least concern; EN, endangered; VU, vulnerable; NT, near threatened. Nest type: M, mound; B, burrow; N, typical nest; ?, unknown.
Heat source: C, compost; S, sun; H, body heat; G, geothermal; R, decaying roots; ?, unknown. Biogeographical range: AUS, Australia; PHL, Phil-ippines; PNG, Papua New Guinea.
Journal of Biogeography 41, 2045–2056ª 2014 John Wiley & Sons Ltd
2046
R. B. Harris et al.
and communal burrowing grounds make megapodes highly
susceptible to predation on eggs and chicks, especially by
humans (Jones et al., 1995). It is likely that recent extinction
is high due to the impact of human colonization (Steadman,
1993).
The evolutionary sequence of nesting behaviours in mega-
podes remains unresolved, and previous studies have pro-
posed two alternative hypotheses. If nesting behaviours
evolved with increasing complexity, then burrow nesting
would be the original megapode incubation strategy (Frith,
1956; Immelmann & Sossinka, 1986). In this scenario, ances-
tral megapodes built nests on top of naturally occurring heat
sources, and over evolutionary time became dependent on
those heat sources (e.g. solar radiation or geothermal heat).
Alternatively, mound building could have evolved from a
habit of covering eggs with debris to hide them from preda-
tors (Booth & Jones, 2001). Assuming a hot moist habitat,
ambient temperatures protected eggs from chill and pro-
moted decomposition of the organic material left on top.
With increasing amounts of debris, eggs could be left unat-
tended for longer periods of time, and eventually these
megapodes stopped using body heat to incubate, having
become entirely reliant upon mounds (Booth & Jones, 2001).
Yet, mound building and burrow nesting are not mutually
exclusive, and given that some species within the genus Meg-
apodius currently utilize both incubation strategies, it is pos-
sible that the ancestral megapode was also behaviourally
labile.
To test these hypotheses regarding the sequence of mega-
pode incubation strategies, biogeographical origins and colo-
nization history, we constructed a multilocus time-calibrated
species tree of all 22 extant megapode species. We then used
species relationships to reconstruct ancestral nesting behav-
iour and biogeographical areas. Taken together, these analy-
ses allow us to examine the mechanisms that aided in the
diversification of megapode incubation strategies and their
current distribution in Australasia.
MATERIALS AND METHODS
Taxon sampling
Our study represents the first complete phylogenetic analyses
of the 22 currently recognized extant species of megapodes
(Jones et al., 1995). We sampled a total of 75 megapode
individuals representing all species from all seven genera (see
Appendix S1 in Supporting Information), including six
megapode species never before included in phylogenetic
analysis: the recently re-discovered Aepypodius bruijnii (Heiji
& Post, 2001; Mauro, 2005), two species from the genus
Talegalla (T. jobiensis and T. cumingii), and four species
from the genus Megapodius (M. nicobariensis, M. bernsteinii,
M. geelvinkianus and both subspecies of M. laperouse).
Whenever possible, multiple individuals of each species were
included to increase the information available for the coales-
cent-based species tree analysis (Appendix S1). To account
for variation within species, we sampled across species’
ranges and included all available subspecies.
We used fresh tissue samples or whole genomic DNA
when available. However, owing to the small populations,
remote distributions, endangered status and cryptic nature of
many megapodes, it was impossible to get fresh samples
from some species (Table 1). In such cases, we use toe-pad
samples from voucher specimens in museum collections.
Most recent classifications place Megapodiidae as sister to
all other families in the Galliformes (Crowe et al., 2006; Cox
et al., 2007; Wang et al., 2013). Therefore, we included out-
groups representing all major families of Galliformes: two
from the family Cracidae (Ortalis wagleri and Penelope pur-
purascens), one from Phasianidae (Phasianus colchicus), one
from Odontophoridae (Callipepla californica), and one from
Numididae (Numida meleagris). We included one species
from the order Anseriformes (Branta bernicla), the sister
order to the Galliformes, to aid calculation of divergence
times. Total sampling included 28 species (Table 1) and 81
individuals (Appendix S1).
Data collection
For fresh tissue samples, genomic DNA was extracted using
the DNeasy Kit (QIAGEN, Valencia, CA, USA) following the
manufacturer’s protocol. A total of 14 nuclear loci and two
mitochondrial (mtDNA) genes were included (Table 2). Loci
were PCR amplified and sequenced using standard procedures.
Cycle-sequence products were cleaned using ExoSAP-IT (USB
Corporation, Cleveland, OH, USA) before being analysed on
an ABI 3730 DNA Analyzer (Applied Biosystems, Foster City,
CA, USA) at the University of Washington Comparative Ge-
nomics Center. We confirmed the identity of each locus using
a BLAST search (Altschul et al., 1990) against the chicken
(Gallus gallus) genome.
DNA from toe-pad samples was extracted in a degraded-
DNA laboratory with physical separation and air-handling
isolation at Cornell University. Toe-pad extractions and PCR
reactions were conducted at a laminar flow clean bench with
sterilized surfaces. We interspersed negative controls at both
the extraction and PCR steps to increase the chance of iden-
tifying contamination. For these degraded samples, we
amplified short (150–300 bp), overlapping regions of the
ND2 and cytb gene, as well as highly variable 250 bp regions
of four nuclear introns (see Appendix S2).
We aligned sequences with mafft (Katoh et al., 2002) and
visually edited sequences using Geneious Pro 5.3.6 (Drum-
mond et al., 2010). Indels were present in 13 of 14 nuclear
loci and gaps were coded as missing data. Ambiguity codes
represent polymorphisms in heterozygous individuals.
Gene tree analyses
Gene trees were estimated using MrBayes 3.1.2 (Huelsen-
beck & Ronquist, 2001) and RAxML 7.2.8 (Stamatakis et al.,
2005, 2008). We estimated gene trees for each individual
Journal of Biogeography 41, 2045–2056ª 2014 John Wiley & Sons Ltd
2047
Biogeography and evolution of nesting behaviour in megapodes

nuclear locus separately, all 14 nuclear loci concatenated, the
combined mtDNA data, and all 16 genes concatenated. The
best fitting substitution model was selected for each gene
using jModelTest 0.1.1 (Posada, 2008) under the Akaike
information criterion (AIC) and AIC corrected for small
sample size (AICc) (Table 2). Each analysis used six Markov
chains that were run for 10 million generations for the analy-
sis of separate genes and 15 million generations for the com-
bined datasets (samplefreq = 5000). To ensure convergence,
analyses were run until the potential scale reduction factor
for estimated parameters was approximately 1.0 and the
average standard deviation of split frequencies was < 0.01.
Chain convergence was further assessed using Tracer 1.5
(Rambaut & Drummond, 2007) and convergence of the
cumulative posterior probabilities of clades was assessed
using the online program awty (Nylander et al., 2008). Pos-
terior probability (PP) values were obtained by summarizing
the posterior distribution of trees with a 50% majority rule
consensus tree and 50% burn-in.
A maximum likelihood RAxML analysis estimated the
optimal likelihood tree by conducting a search for the best
scoring maximum-likelihood tree using the GTR+G model.
We assessed nodal support using a nonparametric bootstrap
analysis with 1000 replicates (Felsenstein, 1985). To help
RAxML distinguish amongst trees with similar likelihood
scores, the likelihood epsilon was set to !1.0 9 10!5.
Species tree analyses
We estimated a time-calibrated species tree using *beast
(Heled & Drummond, 2010), with time-calibration informa-
tion incorporated as outlined in McCormack et al. (2010).
We estimated and compared divergence dates for megapodes
obtained from three separate analyses that utilized: (1) fossil
information only; (2) molecular rate calibrations only; and
(3) a combination of fossils and rates. To explore the impact
of missing data, we analysed two datasets: (1) a near ‘full
coverage’ matrix containing the 24 out of 28 species with
both nuclear and mtDNA data; and (2) an ‘all species’ data
matrix containing all 28 species, which contained missing
data at some loci for four species (Table 1). See Appendix S1
for detailed information on sampling coverage at nuclear
loci. In all analyses, six independent runs of the ‘all species’
dataset were performed for one billion generations, sampling
every 100,000 generations. Each locus was treated as a sepa-
rate data partition by unlinking gene trees, rates and substi-
tution models (Table 2). However, the gene trees were linked
for the mtDNA genes (ND2 and cytb). We used random
starting gene trees under the coalescent model, a birth–deathprocess for the species-tree prior, and a constant population
size over the entire time interval, both with default priors.
Because the monophyly of the megapodes is well established
(Birks & Edwards, 2002), we enforced the monophyly of the
group. The mean clock (ucld.mean) was set to an exponen-
tial distribution with a mean of 10.
We assessed convergence of model parameters and node
heights by plotting the marginal posterior distributions in
Tracer, checking for overlapping posterior distributions
across independent analyses, and ensuring high effective sam-
ple size (ESS) values ≥ 200. The post-burn-in samples (25%)
were combined using LogCombiner 1.7.5 (Drummond &
Rambaut, 2007). A maximum clade credibility (MCC) tree
was constructed using TreeAnnotator 1.7.5 (Drummond
& Rambaut, 2007) with median node heights.
Estimating divergence time
Choosing an appropriate way to time-calibrate the megapode
species tree is a difficult problem: in addition to a sparse
galliform fossil record, previous Galliformes molecular dating
analyses have used controversial fossils to estimate the rate of
mtDNA sequence evolution (Mayr, 2008; Ksepka, 2009). The
Table 2 Loci used in the study. Descriptive values are calculated from megapodes (outgroups excluded).
Locus Primers (Fwd, Rev) Source Length (bp) Model
Identical
Sites (%) % GC
GenBank Accession
numbers
NGF AIINGF50, AIINGF30 Kimball et al. (2009) 737 HKY 80.2 51.0 KF814728–4780ARNTL ARNTL.12F, ARNTL.13R Kimball et al. (2009) 784 HKY 79.8 40.6 KF833401–3461CLTCL1 CLTCL1.e7F, CLTCL1.e8Ralt Kimball et al. (2009) 526 HKY 83.0 39.6 KF833462–3523CSDE1 CSDE.5F, CSDE6R Kimball et al. (2009) 495 HKY 80.5 33.6 KF833524–3583cytb H15646, L14996 Sorenson et al. (1999) 866 HKY+G 41.3 49.4 KF833584–3639EEF2 EEF2.6F, EEF2.7R Kimball et al. (2009) 410 K80+G 81.1 49.4 KF833640–3698FGB Fib5, Fib6 Kimball et al. (2009) 596 HKY+I+G 76.6 37.4 KF833699–3756IRF2 IRF2.2F, IRF2.3R Kimball et al. (2009) 660 HKY+G 83.5 38.8 KF833757–3817NAT15 NAT.4F, NAT.5R Kimball et al. (2009) 1024 GTR+G 61.9 58.5 KF833818–3868NADH-2 L5145, H6394 Birks and Edwards (2002) 1077 GTR+G 15.1 47.0 KF854310–4340PARK7 PARK.2F, PARK3R Kimball et al. (2009) 728 HKY 84.1 36.1 KF833869–3921PAXIP1 PAX.20F, PAX.21R Kimball et al. (2009) 463 HKY 75.5 31.9 KF833922–3978PER2 PER.9F, PER.10R Kimball et al. (2009) 578 HKY 68.5 23.9 KF833979–4035RDP1 RDP1.U1, RDP1.L1 Birks and Edwards (2002) 901 HKY+G 80.7 46.3 KF834036–4073TGFB2 TGFB2.5F, TGFB.6R Kimball et al. (2009) 586 HKY 81.9 42.0 KF834074–4130TXNDC12 TXN.6F, TXN.7R Kimball et al. (2009) 488 HKY+G 80.7 41.6 KF834131–4185
Journal of Biogeography 41, 2045–2056ª 2014 John Wiley & Sons Ltd
2048
R. B. Harris et al.

Galliformes fossil record lacks undisputed, phylogenetically
placed fossils (Mayr & Weidig, 2004; Mayr, 2005, 2008;
Ksepka, 2009). Therefore, we used the Late Cretaceous fossil
Anseriformes, Vegavis iaai, as the upper bound for the Galli-
formes–Anseriformes split (Clarke et al., 2005), applying a
gamma prior G(2, 9) with an offset of 66 Ma to the root Galli-
formes–Anseriformes split.
Recent studies have shown estimated rates of molecular
evolution to be dependent on the time-scale of measurement
(Ho et al., 2011). The widely used avian mtDNA clock of
2.1% is consistent over the past 12 Myr (Weir & Schluter,
2008); however, Galliformes are an early diverging group
with stem fossils placed in the Eocene (Mayr, 2005) and esti-
mates of molecular rates have consistently been well below
the standard 2.1% (Kimball et al., 1997; Crowe et al., 2006;
Pereira & Baker, 2006a). Here, we conducted analyses using
three rates of cytb sequence evolution in Galliformes: 0.7%
(Kimball et al., 1997), 1.2% (Pereira & Baker, 2006b), and
2.1% (Weir & Schluter, 2008). All genes had their own un-
correlated lognormal relaxed clock model and a mean rate of
0.0001 was chosen for a smoother starting point for the
nuclear clock rate estimation. In addition, we conducted
three analyses using a combination of each rate and the Veg-
avis iaai fossil (Table 3).
The posterior distribution of species trees is a product of
both priors defined by the user and the data. To explore the
influence of our priors on our posterior, we ran all *beast
analyses with empty alignments (Drummond et al., 2006).
Biogeography
To investigate the biogeographical origins of megapodes,
ancestral ranges were inferred using BioGeoBEARS imple-
mented in R (Matzke, 2013a). This program allows for both
probabilistic inference of ancestral geographical ranges and
statistical comparisons of different models of range expansion
[e.g. dispersal–extinction–cladogenesis (DEC), dispersal–vicar-iance analysis (DIVA) and BayArea] using a time-calibrated
species tree. Additionally, BioGeoBEARS incorporates foun-
der-event speciation (+J), a process important in island
systems, into all models (Matzke, 2013b). BioGeoBEARS is
fully parameterized and includes a number of novel features
that increase the flexibility of hypothesis testing. Here, we
defined an ‘areas allowed’ matrix, a supplement to the dis-
persal matrix used in DEC models, such as the widely used
program Lagrange. Prior to the development of BioGeo-
BEARS, users of DEC models specified the relative probability
of dispersal between areas at different time strata; however, this
is not the same as specifying the disappearance of areas in the
past and can potentially be translated as long-term persistence.
We compared models using the likelihood ratio test and AIC.
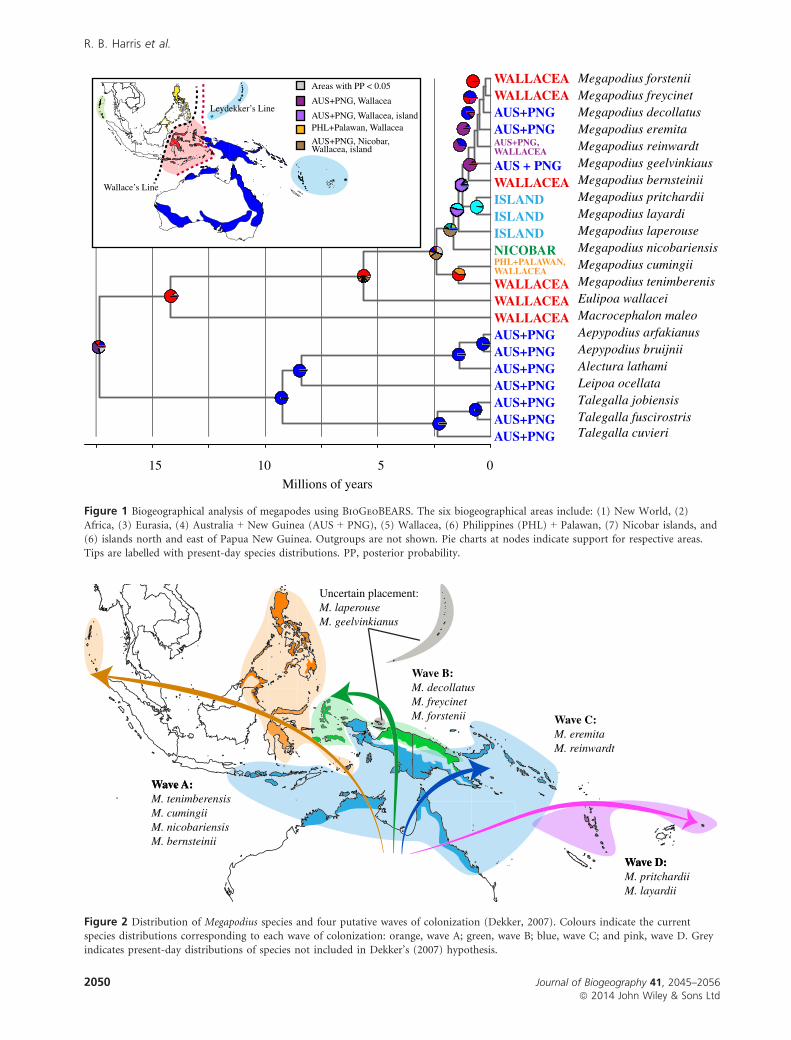
We defined eight geographical areas based on our knowl-
edge of the biology and geographical history of the birds: (1)
Africa, (2) New World, (3) Eurasia, (4) Australia + New
Guinea, (5) Wallacea, (6) Nicobar Islands, (7) Philippines +Palawan, and (8) islands (Vanuatu + Tonga + Palau +Northern Marianas) (Fig. 1). Until approximately 5 Ma,
Australia and New Guinea were intermittently connected
(Hall, 1998), so we grouped these two areas together in our
analysis. Despite their markedly different biogeographical his-
tories, we defined Palawan and the Philippines as a single
area in our analyses (Siler et al., 2012): Megapodius cumingii
is the only resident species, and delineating between the two
islands would not be informative. We included the Solomon
Islands with New Guinea, as the only species in the Solomon
Islands, M. eremita, is known to hybridize with M. reinwardt,
a widespread species resident to Australia, New Guinea and
Wallacea. Within megapodes, species were assigned to their
corresponding geographical area(s), whereas outgroup species
were used as exemplars for all members of that family or
order (Table 1). We set the maximum number of areas equal
to eight because Anseriformes are present in all regions
defined in the analysis. Two areas were constrained using
maximum age based on information from the geological
record: (1) Wallacea was submerged before 45 Ma (Hall,
1998); and (2) the oldest ‘island’ was not formed until
c. 10 Ma (Hall, 2009).
Based on an earlier phylogeny of Megapodiidae (Birks &
Edwards, 2002), Dekker (2007) presents the most recent
biogeographical hypothesis for species in the genus Megapo-
Table 3 Divergence time estimates (in million years ago, Ma) of megapodes from time-calibrated *beast analyses, using: fossil (Vegavisiaai) information only; three rates of cytb sequence evolution in Galliformes (0.7%, 1.2% and 2.1%); and a combination of fossils andmolecular rates.
Time-calibration
Galliformes/AnseriformesBrush-turkey/scrubfowl Megapodius
Mean from prior(95% HPD)
Mean from posteriorsample (95% HPD)
Mean from posteriorsample (95% HPD)
Mean from posteriorsample (95% HPD)
Fossil 80.9 (66.3–101.9) 70.9 (66.1–80.7) 14.4 (11.9–17.2) 1.9 (1.5–2.4)0.7% – 132.0 (98.8–170.4) 29.6 (22.1–37.7) 4.1 (3.0–5.6)1.2% – 75.1 (54.5–96.9) 17.6 (13.0–23.0) 2.3 (1.7–3.1)2.1% – 42.2 (32.4–54.2) 10.0 (7.7–13.0) 1.4 (1.0–1.8)Fossil + 0.7% 82.4 (66.4–105.0) 110.1 (85.1–135.7) 27.8 (22.0–34.6) 3.6 (2.7–4.7)Fossil + 1.2% 82.5 (66.4–105.6) 74.2 (66.7–85.8) 18.2 (15.2–21.9) 2.5 (1.9–3.3)Fossil + 2.1% 82.3 (67.1–104.4) 70.4 (66.1–78.7) 13.4 (10.8–16.8) 1.8 (1.3–2.5)
HPD, highest posterior density.
Journal of Biogeography 41, 2045–2056ª 2014 John Wiley & Sons Ltd
2049
Biogeography and evolution of nesting behaviour in megapodes
AUS+PNGAUS+PNGAUS+PNGAUS+PNGAUS+PNGAUS+PNGAUS+PNGWALLACEAWALLACEA
PHL+PALAWAN,WALLACEA
WALLACEA
NICOBARISLANDISLANDISLAND
AUS + PNGWALLACEA
AUS+PNGAUS+PNG
WALLACEAWALLACEA
AUS+PNG, WALLACEA
051015
Talegalla cuvieriTalegalla fuscirostrisTalegalla jobiensisLeipoa ocellataAlectura lathami
Aepypodius arfakianus Aepypodius bruijnii
Macrocephalon maleoEulipoa wallaceiMegapodius tenimberenisMegapodius cumingiiMegapodius nicobariensisMegapodius laperouseMegapodius layardiMegapodius pritchardiiMegapodius bernsteiniiMegapodius geelvinkiausMegapodius reinwardtMegapodius eremitaMegapodius decollatusMegapodius freycinetMegapodius forstenii
Millions of years
AUS+PNG, Wallacea
AUS+PNG, Wallacea, islandPHL+Palawan, Wallacea
AUS+PNG, Nicobar, Wallacea, island
Areas with PP < 0.05
Wallace’s Line
Leydekker’s Line
Figure 1 Biogeographical analysis of megapodes using BioGeoBEARS. The six biogeographical areas include: (1) New World, (2)Africa, (3) Eurasia, (4) Australia + New Guinea (AUS + PNG), (5) Wallacea, (6) Philippines (PHL) + Palawan, (7) Nicobar islands, and(6) islands north and east of Papua New Guinea. Outgroups are not shown. Pie charts at nodes indicate support for respective areas.Tips are labelled with present-day species distributions. PP, posterior probability.
Wave D:Wave D:M. pritchardiiM. layardii
Wave C:M. eremitaM. reinwardt
Wave B:M. decollatusM. freycinetM. forstenii
Wave A:Wave A:M. tenimberensisM. cumingiiM. nicobariensisM. bernsteinii
Uncertain placement:M. laperouseM. geelvinkianus
Figure 2 Distribution of Megapodius species and four putative waves of colonization (Dekker, 2007). Colours indicate the currentspecies distributions corresponding to each wave of colonization: orange, wave A; green, wave B; blue, wave C; and pink, wave D. Greyindicates present-day distributions of species not included in Dekker’s (2007) hypothesis.
Journal of Biogeography 41, 2045–2056ª 2014 John Wiley & Sons Ltd
2050
R. B. Harris et al.
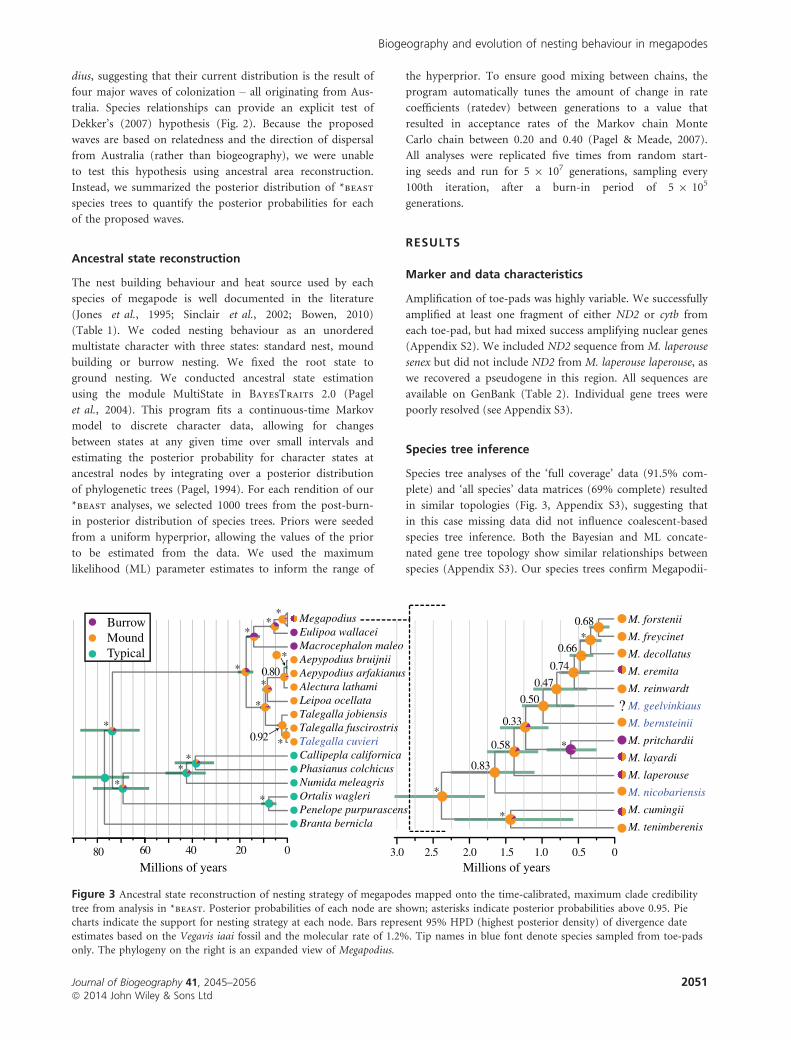
dius, suggesting that their current distribution is the result of
four major waves of colonization – all originating from Aus-
tralia. Species relationships can provide an explicit test of
Dekker’s (2007) hypothesis (Fig. 2). Because the proposed
waves are based on relatedness and the direction of dispersal
from Australia (rather than biogeography), we were unable
to test this hypothesis using ancestral area reconstruction.
Instead, we summarized the posterior distribution of *beast
species trees to quantify the posterior probabilities for each
of the proposed waves.
Ancestral state reconstruction
The nest building behaviour and heat source used by each
species of megapode is well documented in the literature
(Jones et al., 1995; Sinclair et al., 2002; Bowen, 2010)
(Table 1). We coded nesting behaviour as an unordered
multistate character with three states: standard nest, mound
building or burrow nesting. We fixed the root state to
ground nesting. We conducted ancestral state estimation
using the module MultiState in BayesTraits 2.0 (Pagel
et al., 2004). This program fits a continuous-time Markov
model to discrete character data, allowing for changes
between states at any given time over small intervals and
estimating the posterior probability for character states at
ancestral nodes by integrating over a posterior distribution
of phylogenetic trees (Pagel, 1994). For each rendition of our
*beast analyses, we selected 1000 trees from the post-burn-
in posterior distribution of species trees. Priors were seeded
from a uniform hyperprior, allowing the values of the prior
to be estimated from the data. We used the maximum
likelihood (ML) parameter estimates to inform the range of
the hyperprior. To ensure good mixing between chains, the
program automatically tunes the amount of change in rate
coefficients (ratedev) between generations to a value that
resulted in acceptance rates of the Markov chain Monte
Carlo chain between 0.20 and 0.40 (Pagel & Meade, 2007).
All analyses were replicated five times from random start-
ing seeds and run for 5 9 107 generations, sampling every
100th iteration, after a burn-in period of 5 9 105
generations.
RESULTS
Marker and data characteristics
Amplification of toe-pads was highly variable. We successfully
amplified at least one fragment of either ND2 or cytb from
each toe-pad, but had mixed success amplifying nuclear genes
(Appendix S2). We included ND2 sequence from M. laperouse
senex but did not include ND2 from M. laperouse laperouse, as
we recovered a pseudogene in this region. All sequences are
available on GenBank (Table 2). Individual gene trees were
poorly resolved (see Appendix S3).
Species tree inference
Species tree analyses of the ‘full coverage’ data (91.5% com-
plete) and ‘all species’ data matrices (69% complete) resulted
in similar topologies (Fig. 3, Appendix S3), suggesting that
in this case missing data did not influence coalescent-based
species tree inference. Both the Bayesian and ML concate-
nated gene tree topology show similar relationships between
species (Appendix S3). Our species trees confirm Megapodii-
Millions of years Millions of years
*
*
*
*
0.83
0.58
0.33
0.500.47
0.74
0.66
0.68
2.5 02.0 1.5 1.0 0.53.0
?
M. tenimberenis
M. cumingii
M. nicobariensis
M. laperouse
M. layardi
M. pritchardii
M. bernsteinii
M. geelvinkiaus
M. reinwardt
M. eremita
M. decollatus
M. freycinet
M. forstenii
Branta bernicla Penelope purpurascens Ortalis wagleriNumida meleagrisPhasianus colchicus Callipepla californica Talegalla cuvieriTalegalla fuscirostrisTalegalla jobiensisLeipoa ocellataAlectura lathamiAepypodius arfakianus Aepypodius bruijnii Macrocephalon maleoEulipoa wallaceiMegapodius
**
**
*
*
*
*
*
0.92
0.80
**
*
*
020406080
MoundBurrow
Typical
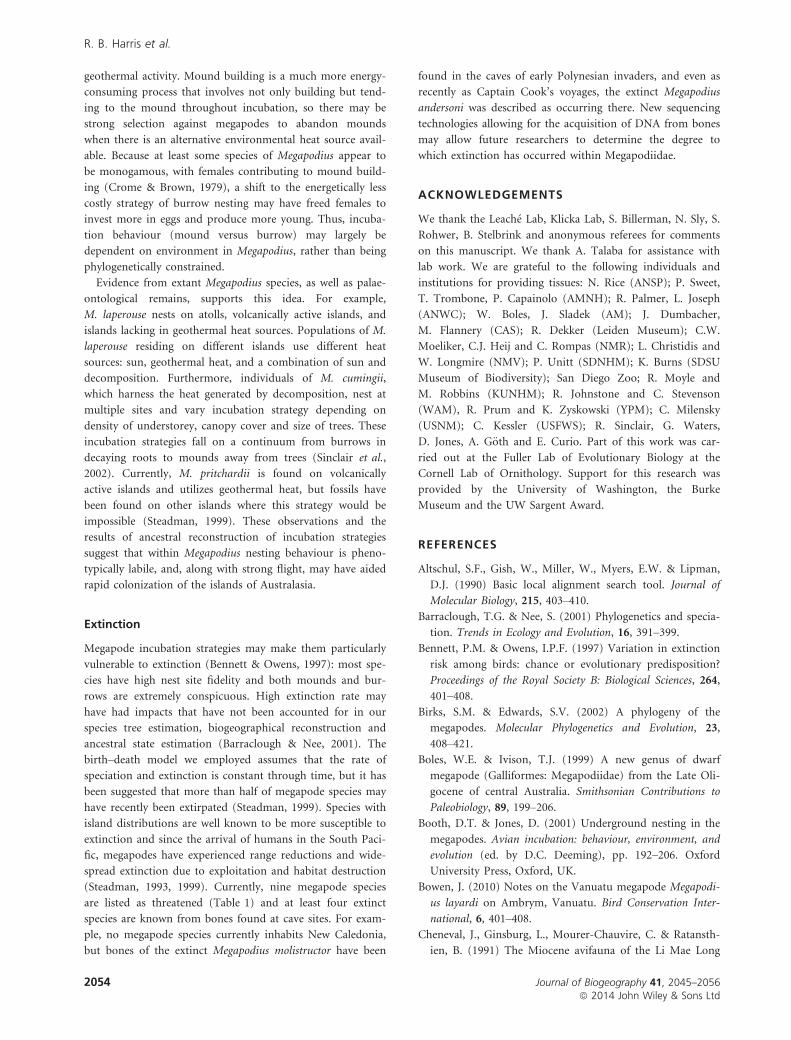
Figure 3 Ancestral state reconstruction of nesting strategy of megapodes mapped onto the time-calibrated, maximum clade credibilitytree from analysis in *beast. Posterior probabilities of each node are shown; asterisks indicate posterior probabilities above 0.95. Piecharts indicate the support for nesting strategy at each node. Bars represent 95% HPD (highest posterior density) of divergence dateestimates based on the Vegavis iaai fossil and the molecular rate of 1.2%. Tip names in blue font denote species sampled from toe-padsonly. The phylogeny on the right is an expanded view of Megapodius.
Journal of Biogeography 41, 2045–2056ª 2014 John Wiley & Sons Ltd
2051
Biogeography and evolution of nesting behaviour in megapodes

dae as sister to all other galliform families, followed by the
Cracidae. Within Megapodiidae, we found a deep split
between the clade containing the brush-turkeys (Alectura and
Aepypodius), talegallas (Talegalla) and malleefowl (Leipoa),
which we refer to here as the ‘brush-turkey clade’ for sim-
plicity, and the clade containing Eulipoa and Megapodius
(historically known as ‘scrubfowl’), which is consistent with
previous phylogenetic estimates (Birks & Edwards, 2002). A
key feature of the tree topology is the placement of maleo
(Macrocephalon maleo) at the base of the scrubfowl clade
with high support, rather than with the brush-turkeys, as the
mtDNA gene tree (Appendix S3) and previous molecular
phylogeny would suggest (Birks & Edwards, 2002). An
endangered, charismatic species confined to Sulawesi, the
maleo is the only burrow-nesting megapode not closely
related to the scrubfowl; it has a unique morphology includ-
ing a dramatic knob-like head casque and distinct webbing
between its toes. Thus, its phylogenetic placement has been
of particular interest, but hampered by the fact that the
divergence of its lineage came early within the megapodes,
and that there are currently no closely related species. Within
the brush-turkeys, we resolve Leipoa as sister to (Alectura,
Aepypodius) with high support. With the addition of
Talegalla cuvieri, T. jobiensis and Aepypodius bruijnii, the
genera Talegalla and Aepypodius remain monophyletic. The
relationships within Megapodius generally resemble those
found by Birks et al. (2005). Both studies found an initial
split off of M. cumingii and M. tenimberensis, strong support
for M. layardi as sister to M. pritchardii (but low support for
the clade’s position in the tree), and high support for the
clade formed by M. decollatus, M. forstenii and M. freycinet
(Fig. 3).
The addition of four megapode species sampled from only
toe-pads (T. cuvieri, M. nicobariensis, M. geelvinkianus and
M. bernsteinii) with short fragmentary sequences and consid-
erable missing data did not change the species tree topology.
Overall, these species are placed with relatively low support,
and each contributes to a ladder-shaped (pectinate) species
tree. The placement of M. nicobariensis has been of particular
interest, as it occupies the Nicobar Islands at the far western
edge of the megapode distribution, disjunct from all other
species. Based on geographical proximity, Dekker (2007) pre-
dicted a close relationship with M. cumingii, while Jones
et al. (1995) predicted a close relationship with M. pritchardii
based on morphology. Interestingly, M. nicobariensis diverged
early in the genus and is not sister to either of these species,
suggesting that geographical proximity may be a poor pre-
dictor of phylogenetic relationships in this genus (see below).
Divergence times
The species tree provided different divergence times depend-
ing on the priors used for time calibration (Table 3). Using
the cytb molecular rate of 0.7%, we date the split between
Galliformes and Anseriformes at c. 130 Ma, which is around
the age of Early Cretaceous fossil sites, such as the Chinese
Jehol Biota, which have yet to produce a single Neornithes
fossil (Mayr, 2008), and only 20 Myr after Archaeopteryx – a
highly unlikely scenario. The standard avian rate of 2.1% is
no more realistic, as it dates this split at c. 42 Ma, which
post-dates the well-established Vegavis iaai fossil by over
25 Myr. A molecular rate of 1.2%, however, places the Galli-
formes/Anseriformes split at c. 75 Ma, within the 95% confi-
dence interval of our fossil prior calibration that we assumed
in other analyses.
The disparity in our divergence time estimates using dif-
ferent molecular rates highlights the need for well-placed fos-
sils. Without such information, divergence time estimates
can be profoundly overestimated. Divergence dates estimated
from the root fossil and the 1.2% rate calibrations alone, and
in combination, are consistent with each other (Table 3).
Therefore, in all figures, we present the results for the tree
estimated using both the fossil and rate of 1.2%.
Biogeography
Our biased sampling towards megapodes does not permit us
to make inferences about the geographical origin of Gallifor-
mes, and inferring the route ancestral megapodes took to
Australasia is beyond the scope of this study. Regardless,
ancestral megapodes reached the Australasian region – colo-
nizing islands in Wallacea, as well as mainland Australia and
New Guinea. Lineages represented in the brush-turkey clade
continued on mainland Australia and New Guinea, while lin-
Table 4 Megapode ancestral range reconstruction inferred in BioGeoBEARS and the relative probabilities of each model calculatedfrom the AICc weights. Models include dispersal–extinction–cladogenesis (DEC), dispersal–vicariance analysis (DIVA) and BayArea, aswell as these three models allowing for founder-event speciation (+J).
Model LnL No. of parameters d e j AIC AICc
Relative
Probability
DEC !59.1 2 0.004 0 0 122.2 124.6 11%
DEC+J !54.6 3 0.004 0 0.025 115.2 121.2 61%DIVA !64.8 2 0.006 0 0 133.6 136 0%
DIVA+J !55.4 3 0.004 0 0.021 116.8 122.8 27%BayArea !86.9 2 0.013 0.055 0 177.8 180.2 0%
BayArea+J !60.1 3 0.003 0 0.041 126.2 132.2 0%
LnL, log-likelihood; d, rate of dispersal; e, rate of extinction; j, relative probability of founder-event speciation at cladogenesis; AIC, Akaike’s
information criterion; AICc, Akaike’s information criterion corrected for small sample size.
Journal of Biogeography 41, 2045–2056ª 2014 John Wiley & Sons Ltd
2052
R. B. Harris et al.

eages ancestral to Macrocephalon and the scrubfowl propa-
gated in the islands of Wallacea (Fig. 1). Megapodius appears
to have had a predominantly island distribution, extending
from the Indian Ocean to the South Pacific. Recent dispersal
has led to the recolonization of Megapodius to mainland
Australia and New Guinea. Model comparisons show that
the three models implemented (DIVA, DEC and BayArea)
with founder-speciation (+J) are favoured over the standard
implementation (Table 4). We show the model with the
highest relative probability (Table 4), DEC+J, in Fig. 1.
Ancestral area reconstruction did not depend on time cali-
bration and we present the results from the species tree esti-
mated from the fossil and the 1.2% molecular rate.
Using the posterior distribution of species trees, we found
low support for Dekker’s wave C (PP = 0.22), and no sup-
port for wave A (PP = 0.0). Given the results of our *beast
analyses (Fig. 3), the high support for waves B (PP = 0.98)
and D (PP = 1.0) was unsurprising.
Ancestral state reconstruction
We reconstruct mound building as the most probable ances-
tral nesting behaviour in megapodes and find that burrow
nesting evolved independently three times (Fig. 3). The
ancestral megapode to the brush-turkey clade was a mound
builder (PP = 0.87), as all species in this clade share this
nesting strategy. The node separating Macrocephalon from
the scrubfowl is reconstructed as burrow nesting, albeit with
equivocal support (PP = 0.56).
Within Megapodius, mound building is the ancestral
strategy, but unlike in other megapode genera, nesting
strategy is variable. Four species are polymorphic for
mound and burrow nesting but are not closely related and
do not have overlapping distributions. There is high sup-
port for burrow nesting as the ancestral behaviour for M.
pritchardii and M. layardi, the two species that have distri-
butions in the eastern South Pacific on small, remote
islands (Figs 2 & 3).
DISCUSSION
Biogeographical origins
The new time-calibrated species tree for megapodes (Fig. 3)
indicates that they have been restricted to Australasia
throughout their evolutionary history. This finding supports
what was previously inferred from the palaeontological
record. The absence of megapode fossils from New Zealand
suggests that ancestral megapodes were not yet present on
the Australian landmass at the time of New Zealand’s separa-
tion (c. 85 Ma) and the abundance of fossil phasianids and
absence of fossil megapodes in the Miocene deposits of
mainland Asia suggests that megapodes were confined to the
Indo-Australian region at that time (Cheneval et al., 1991;
Steadman, 1999). However, we note that the absence of fos-
sils could result from poor conditions for fossilization or
insufficient fieldwork, and should not be considered as proof
that megapodes were absent for that locality.
The current megapode distribution was previously believed
to be a result of Gondwanan vicariance, with ancestral mega-
podes originating in Australia. However, we date the split
between megapodes and all other Galliformes at 70–75 Ma,
well after Australia had begun its movement northwards
(Hall, 2002), which strongly suggests that dispersal, and not
vicariance, led to the isolation of megapodes in Australasia.
We reconstruct Australia, New Guinea and Wallacea as the
ancestral range of all megapodes (c. 18 Ma). At this time,
the Philippines were connected to mainland Asia via a shal-
low sea, the Australian continent was continuous with the
southern portion of New Guinea, and part of Sulawesi was
above water (Hall, 1998).
Approximately 5 Ma, New Guinea experienced a large cli-
matic shift, which resulted in new habitats and occurred in
conjunction with a rapid increase in land area and range ele-
vations (Hall, 2002). Within the past 2 Ma, the islands of
the Banda Arc formed and the rest of New Guinea emerged
(Lohman et al., 2011). The formation of more islands during
this time would have led to increased opportunity for dis-
persal and, consequently, allopatric speciation. These events
coincide with the observed Megapodius radiation (Fig. 1).
Evolution of nesting strategy
We found new evidence for multiple origins of burrow nesting
in megapodes (Fig. 3). Historically, megapode incubation
strategy has been viewed as a dichotomous trait (but see Booth
& Jones, 2001) and with the exception of Megapodius, all
megapode genera are strictly mound or burrow nesters. Spe-
cies within Megapodius show variation in nesting strategy and
heat source usage (Table 1). Megapodius has a widespread,
predominantly island distribution, whereas most other genera
are restricted to mainland Australia and New Guinea and/or
have limited ranges. This distribution may be due to flight
ability: whereas Megapodius and Eulipoa species are strong fly-
ers, other megapodes are generally heavy-bodied and poor fly-
ers, incapable of long-distance water crossings (Dekker, 2007).
In adaptive radiations, ecological opportunity can directly
promote changes in behaviour, morphology and physiology
(Price et al., 2003). In megapodes, temporal and spatial vari-
ation in heat sources available for nesting should favour the
evolution of behavioural lability, whereby species can change
incubation strategy when faced with an immediate change in
environment. We propose that strong flight capability
allowed Megapodius to follow a distinct evolutionary trajec-
tory: by dispersing throughout the newly formed islands of
Australasia c. 2 Ma, these species encountered variable nest-
ing substrates and heat sources, which led to the evolution
of phenotypic lability in incubation strategy. Mound building
may have been favoured in environments with ample
vegetative material and rainfall and no alternative heat
sources, whereas burrow nesting probably would have been
favoured in areas with nesting substrates heated by sun or
Journal of Biogeography 41, 2045–2056ª 2014 John Wiley & Sons Ltd
2053
Biogeography and evolution of nesting behaviour in megapodes
geothermal activity. Mound building is a much more energy-
consuming process that involves not only building but tend-
ing to the mound throughout incubation, so there may be
strong selection against megapodes to abandon mounds
when there is an alternative environmental heat source avail-
able. Because at least some species of Megapodius appear to
be monogamous, with females contributing to mound build-
ing (Crome & Brown, 1979), a shift to the energetically less
costly strategy of burrow nesting may have freed females to
invest more in eggs and produce more young. Thus, incuba-
tion behaviour (mound versus burrow) may largely be
dependent on environment in Megapodius, rather than being
phylogenetically constrained.
Evidence from extant Megapodius species, as well as palae-
ontological remains, supports this idea. For example,
M. laperouse nests on atolls, volcanically active islands, and
islands lacking in geothermal heat sources. Populations of M.
laperouse residing on different islands use different heat
sources: sun, geothermal heat, and a combination of sun and
decomposition. Furthermore, individuals of M. cumingii,
which harness the heat generated by decomposition, nest at
multiple sites and vary incubation strategy depending on
density of understorey, canopy cover and size of trees. These
incubation strategies fall on a continuum from burrows in
decaying roots to mounds away from trees (Sinclair et al.,
2002). Currently, M. pritchardii is found on volcanically
active islands and utilizes geothermal heat, but fossils have
been found on other islands where this strategy would be
impossible (Steadman, 1999). These observations and the
results of ancestral reconstruction of incubation strategies
suggest that within Megapodius nesting behaviour is pheno-
typically labile, and, along with strong flight, may have aided
rapid colonization of the islands of Australasia.
Extinction
Megapode incubation strategies may make them particularly
vulnerable to extinction (Bennett & Owens, 1997): most spe-
cies have high nest site fidelity and both mounds and bur-
rows are extremely conspicuous. High extinction rate may
have had impacts that have not been accounted for in our
species tree estimation, biogeographical reconstruction and
ancestral state estimation (Barraclough & Nee, 2001). The
birth–death model we employed assumes that the rate of
speciation and extinction is constant through time, but it has
been suggested that more than half of megapode species may
have recently been extirpated (Steadman, 1999). Species with
island distributions are well known to be more susceptible to
extinction and since the arrival of humans in the South Paci-
fic, megapodes have experienced range reductions and wide-
spread extinction due to exploitation and habitat destruction
(Steadman, 1993, 1999). Currently, nine megapode species
are listed as threatened (Table 1) and at least four extinct
species are known from bones found at cave sites. For exam-
ple, no megapode species currently inhabits New Caledonia,
but bones of the extinct Megapodius molistructor have been
found in the caves of early Polynesian invaders, and even as
recently as Captain Cook’s voyages, the extinct Megapodius
andersoni was described as occurring there. New sequencing
technologies allowing for the acquisition of DNA from bones
may allow future researchers to determine the degree to
which extinction has occurred within Megapodiidae.
ACKNOWLEDGEMENTS
We thank the Leach!e Lab, Klicka Lab, S. Billerman, N. Sly, S.
Rohwer, B. Stelbrink and anonymous referees for comments
on this manuscript. We thank A. Talaba for assistance with
lab work. We are grateful to the following individuals and
institutions for providing tissues: N. Rice (ANSP); P. Sweet,
T. Trombone, P. Capainolo (AMNH); R. Palmer, L. Joseph
(ANWC); W. Boles, J. Sladek (AM); J. Dumbacher,
M. Flannery (CAS); R. Dekker (Leiden Museum); C.W.
Moeliker, C.J. Heij and C. Rompas (NMR); L. Christidis and
W. Longmire (NMV); P. Unitt (SDNHM); K. Burns (SDSU
Museum of Biodiversity); San Diego Zoo; R. Moyle and
M. Robbins (KUNHM); R. Johnstone and C. Stevenson
(WAM), R. Prum and K. Zyskowski (YPM); C. Milensky
(USNM); C. Kessler (USFWS); R. Sinclair, G. Waters,
D. Jones, A. G€oth and E. Curio. Part of this work was car-
ried out at the Fuller Lab of Evolutionary Biology at the
Cornell Lab of Ornithology. Support for this research was
provided by the University of Washington, the Burke
Museum and the UW Sargent Award.
REFERENCES
Altschul, S.F., Gish, W., Miller, W., Myers, E.W. & Lipman,
D.J. (1990) Basic local alignment search tool. Journal of
Molecular Biology, 215, 403–410.Barraclough, T.G. & Nee, S. (2001) Phylogenetics and specia-
tion. Trends in Ecology and Evolution, 16, 391–399.Bennett, P.M. & Owens, I.P.F. (1997) Variation in extinction
risk among birds: chance or evolutionary predisposition?
Proceedings of the Royal Society B: Biological Sciences, 264,
401–408.Birks, S.M. & Edwards, S.V. (2002) A phylogeny of the
megapodes. Molecular Phylogenetics and Evolution, 23,
408–421.Boles, W.E. & Ivison, T.J. (1999) A new genus of dwarf
megapode (Galliformes: Megapodiidae) from the Late Oli-
gocene of central Australia. Smithsonian Contributions to
Paleobiology, 89, 199–206.Booth, D.T. & Jones, D. (2001) Underground nesting in the
megapodes. Avian incubation: behaviour, environment, and
evolution (ed. by D.C. Deeming), pp. 192–206. Oxford
University Press, Oxford, UK.
Bowen, J. (2010) Notes on the Vanuatu megapode Megapodi-
us layardi on Ambrym, Vanuatu. Bird Conservation Inter-
national, 6, 401–408.Cheneval, J., Ginsburg, L., Mourer-Chauvire, C. & Ratansth-
ien, B. (1991) The Miocene avifauna of the Li Mae Long
Journal of Biogeography 41, 2045–2056ª 2014 John Wiley & Sons Ltd
2054
R. B. Harris et al.

locality, Thailand: systematics and paleoecology. Journal of
Southeast Asian Earth Sciences, 6, 117–126.Clarke, J.A., Tambussi, C.P., Noriega, J.I., Erickson, G.M. &
Ketcham, R.A. (2005) Definitive fossil evidence for the
extant avian radiation in the Cretaceous. Nature, 433,
305–308.Cox, W.A., Kimball, R.T. & Braun, E.L. (2007) Phylogenetic
position of the New World quail (Odontophoridae): eight
nuclear loci and three mitochondrial regions contradict
morphology and the Sibley-Ahlquist tapestry. The Auk,
124, 71–84.Crome, F.H.J. & Brown, H.E. (1979) Notes on social organi-
zation and breeding of the Orange-footed Scrubfowl Meg-
apodius reinwardt. Emu, 79, 111–119.Crowe, T.M., Bowie, R.C.K., Bloomer, P., Mandiwana, T.G.,
Hedderson, T.A.J., Randi, E., Pereira, S.L. & Wakeling, J.
(2006) Phylogenetics, biogeography and classification of,
and character evolution in, gamebirds (Aves: Galliformes):
effects of character exclusion, data partitioning and miss-
ing data. Cladistics, 22, 495–532.Dekker, R.W.R.J. (2007) Distribution and speciation of
megapodes (Megapodiidae) and subsequent development
of their breeding behaviour. Biogeography, time, and place:
distributions, barriers, and islands (ed. by W. Renema), pp.
93–102. Springer, Dordrecht, The Netherlands.Drummond, A.J. & Rambaut, A. (2007) BEAST: Bayesian
evolutionary analysis by sampling trees. BMC Evolutionary
Biology, 7, 214.
Drummond, A.J., Ho, S.Y.W., Phillips, M.J. & Rambaut, A.
(2006) Relaxed phylogenies and dating with confidence.
PLoS Biology, 4, 699–710.Drummond, A.J., Ashton, B., Buxton, S., Cheung, M., Coo-
per, A., Heled, J., Kearse, M., Moir, R., Stones-Havas, S.,
Sturrock, S., Thierer, T. & Wilson, A. (2010) Geneious.
Available at: http://www.geneious.com/ (last accessed 15
March 2013).
Felsenstein, J. (1985) Confidence limits on phylogenies: an
approach using the bootstrap. Evolution, 39, 783–791.Frith, H.J. (1956) Breeding habits of the family Megapodii-
dae. Ibis, 98, 620–640.Hall, R. (1998) The plate tectonics of Cenozoic SE Asia and
the distribution of land and sea. Biogeography and geologi-
cal evolution of SE Asia (ed. by R. Hall and J.D. Holloway),
pp. 99–131. Backhuys Publishers, Leiden, The Netherlands.Hall, R. (2002) Cenozoic geological and plate tectonic evolu-
tion of SE Asia and the SW Pacific: computer-based
reconstructions, model and animations. Journal of Asian
Earth Sciences, 20, 353–431.Hall, R. (2009) Southeast Asia’s changing palaeogeography.
Blumea, 54, 148–161.Heiji, C.J. & Post, J.N.J. (2001) Bruijn’s Brush-turkey
Aepypodius bruijnii rediscovered on Waigeo. Megapode
Newsletter, 15, 2–5.Heled, J. & Drummond, A.J. (2010) Bayesian inference of
species trees from multilocus data. Molecular Biology and
Evolution, 27, 570–580.
Ho, S.Y.W., Lanfear, R., Bromham, L., Phillips, M.J., Soubrier,
J., Rodrigo, A.G. & Cooper, A. (2011) Time-dependent rates
of molecular evolution. Molecular Ecology, 20, 3087–3101.Huelsenbeck, J. & Ronquist, F. (2001) MrBayes: Bayesian
inference and phylogenetic trees. Bioinformatics, 17, 747–755.
Immelmann, K. & Sossinka, R. (1986) Parental behaviour in
birds. Parental behaviour (ed. by W. Sluckin and M. Her-
bert), pp. 8–43. Blackwell, Oxford, UK.
Jones, D., Dekker, R.W.R.J. & Roselaar, C.S. (1995) The
megapodes. Oxford University Press, Oxford, UK.
Katoh, K., Misawa, K., Kuma, K. & Miyata, T. (2002) MA-
FFT: a novel method for rapid multiple sequence align-
ment based on fast Fourier transform. Nucleic Acids
Research, 30, 3059–3066.Kimball, R.T., Braun, E.L. & Ligon, J.D. (1997) Resolution of
the phylogenetic position of the Congo peafowl, Afropavo
congensis: a biogeographic and evolutionary enigma. Pro-
ceedings of the Royal Society B: Biological Sciences, 264,
1517–1523.Kimball, R.T., Braun, E.L., Barker, F.K., Bowie, R.C.K.,
Braun, M.J., Chojnowski, J.L., Hackett, S.J., Han, K.-L.,
Harshman, J., Heimer-Torres, V., Holznagel, W., Huddle-
ston, C.J., Marks, B.D., Miglia, K.J., Moore, W.S., Reddy,
S., Sheldon, F.H., Smith, J.V., Witt, C.C. & Yuri, T. (2009)
A well-tested set of primers to amplify regions spread
across the avian genome. Molecular Phylogenetics and Evo-
lution, 50, 654–660.Ksepka, D.T. (2009) Broken gears in the avian molecular
clock: new phylogenetic analyses support stem galliform
status for Gallinuloides wyomingensis and rallid affinities
for Amitabha urbsinterdictensis. Cladistics, 25, 173–197.Lohman, D.J., de Bruyn, M., Page, T., von Rintelen, K., Hall,
R., Ng, P.K.L., Shih, H.-T., Carvalho, G.R. & von Rintelen,
T. (2011) Biogeography of the Indo-Australian Archipel-
ago. Annual Review of Ecology, Evolution, and Systematics,
42, 205–226.Matzke, N.J. (2013a) BioGeoBEARS: BioGeography with Bayes-
ian (and likelihood) Evolutionary Analysis in R Scripts.
Available at: http://cran.r-project.org/web/packages/
BioGeoBEARS/ (last accessed 5 March 2014).
Matzke, N.J. (2013b) Probabilistic historical biogeography:
new models for founder-event speciation, imperfect
detection, and fossils allow improved accuracy and model-
testing. Frontiers of Biogeography, 5, 242–248.Mauro, I. (2005) Field discovery, mound characteristics, bare
parts, vocalisations and behaviour of Bruijn’s Brush-turkey
(Aepypodius bruijnii). Emu, 105, 273–281.Mayr, G. (2005) The Paleogene fossil record of birds in Eur-
ope. Biological reviews of the Cambridge Philosophical Soci-
ety, 80, 515–542.Mayr, G. (2008) The fossil record of galliform birds: com-
ments on Crowe et al. (2006). Cladistics, 24, 74–76.Mayr, G. & Weidig, I. (2004) The Early Eocene bird Gallinu-
loides wyomingensis—a stem group representative of Galli-
formes. Acta Palaeontologica Polonica, 49, 211–217.
Journal of Biogeography 41, 2045–2056ª 2014 John Wiley & Sons Ltd
2055
Biogeography and evolution of nesting behaviour in megapodes
McCormack, J.E., Heled, J., DeLaney, K.S., Peterson, A.T. &
Knowles, L.L. (2010) Calibrating divergence times on spe-
cies trees versus gene trees: implications for speciation his-
tory of Aphelocoma jays. Evolution, 65, 184–202.Nylander, J.A.A., Wilgenbusch, J.C., Warren, D.L. & Swof-
ford, D.L. (2008) AWTY (are we there yet?): a system for
graphical exploration of MCMC convergence in Bayesian
phylogenetics. Bioinformatics, 24, 581–583.Olson, S.L. (1978) The significance of the distribution of the
Megapodiidae. Emu, 80, 21–24.Pagel, M. (1994) Detecting correlated evolution on phyloge-
nies: a general method for the comparative analysis of dis-
crete characters. Proceedings of the Royal Society B:
Biological Sciences, 255, 37–45.Pagel, M. & Meade, A. (2007) BayesTraits v2.0. Available
at: http://www.evolution.rdg.ac.uk/BayesTraits.html (last
accessed 1 June 2013).
Pagel, M., Meade, A. & Barker, D. (2004) Bayesian estima-
tion of ancestral character states on phylogenies. Systematic
Biology, 53, 673–684.Pereira, S.L. & Baker, A.J. (2006a) A molecular timescale for
galliform birds accounting for uncertainty in time esti-
mates and heterogeneity of rates of DNA substitutions
across lineages and sites. Molecular Phylogenetics and Evo-
lution, 38, 499–509.Pereira, S.L. & Baker, A.J. (2006b) A mitogenomic timescale
for birds detects variable phylogenetic rates of molecular
evolution and refutes the standard molecular clock. Molec-
ular Biology and Evolution, 23, 1731–1740.Posada, D. (2008) jModelTest: phylogenetic model averaging.
Molecular Biology and Evolution, 25, 1253–1256.Price, T.D., Qvarnstrom, A. & Irwin, D.E. (2003) The role of
phenotypic plasticity in driving genetic evolution. Proceedings
of the Royal Society B: Biological Sciences, 270, 1433–1440.de Queiroz, A. (2005) The resurrection of oceanic dispersal
in historical biogeography. Trends in Ecology and Evolu-
tion, 20, 68–73.Rambaut, A. & Drummond, A.J. (2007) Tracer v1.4. Available
at: http://tree.bio.ed.ac.uk/software/tracer/ (last accessed 1
November 2013).
Siler, C.D., Oaks, J.R., Welton, L.J., Linkem, C.W., Swab,
J.C., Diesmos, A.C. & Brown, R.M. (2012) Did geckos ride
the Palawan raft to the Philippines? Journal of Biogeogra-
phy, 39, 1217–1234.Sinclair, J.R., O’Brien, T.G. & Kinnaird, M.F. (2002) The
selection of incubation sites by the Philippine megapode,
Megapodius cumingii, in North Sulawesi, Indonesia. Emu,
102, 151–158.
Sorenson, M.D., Ast, J.C., Dimcheff, D.E., Yuri, T. & Min-
dell, D.P. (1999) Primers for a PCR-based approach to
mitochondrial genome sequencing in birds and other ver-
tebrates. Molecular Phylogenetics and Evolution, 12, 105–114.
Stamatakis, A., Ludwig, T. & Meier, H. (2005) RAxML-III: a
fast program for maximum likelihood-based inference of
large phylogenetic trees. Bioinformatics, 21, 456–463.Stamatakis, A., Hoover, P. & Rougemont, J. (2008) A rapid
bootstrap algorithm for the RAxML web servers. System-
atic Biology, 57, 758–771.Steadman, D.W. (1993) Biogeography of Tongan birds before
and after human impact. Proceedings of the National Acad-
emy of Sciences USA, 90, 818–822.Steadman, D.W. (1999) The biography and extinction of mega-
podes in Oceania. Zoologische Verhandelingen, 327, 1–16.Wang, N., Kimball, R.T., Braun, E.L., Liang, B. & Zhang, Z.
(2013) Assessing phylogenetic relationships among gallifor-
mes: a multigene phylogeny with expanded taxon sampling
in Phasianidae. PLoS ONE, 8, 1–12.Weir, J.T. & Schluter, D. (2008) Calibrating the avian molec-
ular clock. Molecular Ecology, 17, 2321–2328.
SUPPORTING INFORMATION
Additional Supporting Information may be found in the
online version of this article:
Appendix S1 Specimen IDs, vouchers and abbreviated sam-
pling localities.
Appendix S2 Nuclear and mitochondrial ancient DNA pri-
mer information.
Appendix S3 Gene trees and ‘full coverage’ data matrix
species tree not included in the manuscript.
BIOSKETCHES
Rebecca B. Harris is interested in the evolution of traits in
avian systems and the biological factors influencing species
tree inference.
Sharon M. Birks is interested in the evolution of birds,
with an emphasis on reproductive behaviour and mating sys-
tems.
Adam D. Leach!e studies phylogenetics, phylogeography
and species delimitation, mostly in lizards.
Editor: Michael Patten
Journal of Biogeography 41, 2045–2056ª 2014 John Wiley & Sons Ltd
2056
R. B. Harris et al.