Embed Size (px)
Citation preview
© 2016 The Authors Journal of the Royal Statistical Society: Series A (Statistics in Society)Published by John Wiley & Sons Ltd on behalf of the Royal Statistical Society.This is an open access article under the terms of the Creative Commons Attribution-NonCommercial-NoDerivsLicense, which permits use and distribution in any medium, provided the original work is properly cited, the use isnon-commercial and no modifications or adaptations are made.
0964–1998/17/179000
J. R. Statist. Soc. A (2016)
The association between asymmetric information,hospital competition and quality of healthcare:evidence from Italy
Paolo Berta,
University of Milan Bicocca, Italy, and Brunel University London, UK
Gianmaria Martini,
University of Bergamo, Italy
Francesco Moscone
Brunel University London, UK
and Giorgio Vittadini
University of Milan Bicocca, Italy
[Received November 2014. Final revision May 2016]
Summary. We study the effect of competition on adverse hospital health outcomes in a contextin which information about hospital quality is not publicly available.We use data on patients whowere admitted to hospitals in the Lombardy region of Italy. Although risk-adjusted hospital rank-ings are estimated yearly in this region, such rankings are provided to hospital managers onlyand are not available to general practitioners or citizens. Hence, patients may choose the hospi-tal where to be admitted on the basis of different criteria such as their geographical closeness tothe hospital, local network information and referrals by general practitioners. We first estimate amodel of patient hospital choices and include among the determinants a variable capturing so-cial interaction, which represents a proxy for the quality of hospitals perceived by patients. Usingpatient-predicted choice probabilities, we then construct a set of competition indices and mea-sure their effect on a composite index of mortality and readmission rates that represents, in oursettings, hospital quality in terms of adverse health outcomes. Our results show that no associa-tion exists between such adverse events and hospital competition. Our finding may be the resultof asymmetric information, as well as the difficulty of building good quality health indicators.
Keywords: Asymmetric information; Hospital competition; Multilevel model; Network effect;Patients’ choice; Quality
1. Introduction
A great debate exists, both at the national and at the international level, on the role of competi-tion in different sectors of the economy, including the healthcare sector. In recent years, manygovernments have introduced competition between healthcare providers to meet the growingdemand for healthcare in a climate of fiscal austerity. For example, the last Labour administra-tion in the UK introduced competition in the form of increased patient freedom to choose a
Address for correspondence: Francesco Moscone, Room ESGW 210, Brunel University London, Uxbridge,UB8 3PH, UK.E-mail: [email protected]

2 P. Berta, G. Martini, F. Moscone and G. Vittadini
healthcare provider with the intent of reaching higher quality without increasing expenditures.Similarly, at the beginning of the 1990s, some regional governments in Italy (e.g. Lombardy)implemented healthcare reforms to give patients increased freedom of choice to stimulate com-petition between hospitals. These interventions originate from a well-known theoretical resultin economics: when prices are fixed and firms compete, a higher degree of competition is likelyto produce better quality. Economists have gathered empirical evidence on the effects of com-petition in the healthcare sector, finding mixed results on the size and direction of these effects(Gaynor, 2006). Some empirical studies have corroborated the hypothesis that more competi-tion between hospitals leads to better health outcomes (e.g. Gaynor et al. (2012)) whereas otherstudies reject this hypothesis, arguing that more competition may harm people’s health (e.g.Propper et al. (2004)).
This paper sheds light on why empirical literature often rejects the theoretical result that morecompetition leads to better health outcomes in a fixed price setting. For this, we use data from194020 patients admitted to one of the 126 hospitals in the Lombardy region of Italy in 2012. Wefirst estimate a model of patient hospital choice. In the Lombardy region, although risk-adjustedhospital rankings based on different quality and efficiency indicators are estimated yearly, suchrankings are provided to hospital managers only and are not available to general practitioners(GPs) and citizens.
Hence, to adjust for asymmetric information on the quality of hospitals, having taken distanceinto account, we include a GP effect, and a local network proxy. We then construct a set ofcompetition indices and measure their effect on hospital performance in terms of quality. Asquality indicators, we consider outcome variables such as readmission and mortality rates within30 days from discharge (Romano and Mutter, 2004), as well as a composite index of mortalityand readmission rates (Neuman et al., 2014).
Our results show that, after controlling for patient characteristics, the choice of a specifichospital seems to depend on the number of people who live in the same area who have previouslychosen the hospital. Further, ceteris paribus, we provide evidence that there is no statisticallysignificant relationship between hospitals facing more competition and their adverse event healthoutcomes. Hence, our results indicate that, in the absence of publicly available informationon hospital rankings, there is no association between adverse health outcomes and hospitalcompetition. One interpretation for this result is that asymmetric information may act as abarrier for competition to work effectively. A further explanation is the lack of health outcomeindicators that are sufficiently able to capture quality.
We explore these issues by implementing an empirical strategy based on two stages. In the firststage we estimate a mixed logit model to investigate the determinants of patient hospital choice.We then use the predicted probabilities of the mixed logit model to compute a set of Herfindahl–Hirschman indices (HHIs) of competition, following the approach by Kessler and McClellan(2000) to avoid distortion in defining the hospital’s catchment area. In the second stage we esti-mate a multilevel model to study the effect of hospital competition on adverse health outcomes.
We carry out our analysis at the ward level, using patients who were admitted to three differ-ent wards—cardiac surgery, cardiology and general medicine. We expect that patients choosehospitals according to the treatment that they need; hence, they look specifically at the wardrather than the hospital as a whole. As noted by Carey and Burgess (1999), page 519,
‘the hospital level of analysis is too general to be capable of revealing variation in quality as measuredby rate-based adverse events’.
This suggests that hospital level health outcome measures may be too broad to capture the effec-tiveness that is achieved by different departments operating within the same hospital. Another
Asymmetric Information, Hospital Competition and Quality of Healthcare 3
alternative would be to measure hospital quality at the surgical or medical team level. In fact,patients could choose their provider depending on the national and international reputation ofa particular surgeon or medical team. Although we have no data on surgeon quality, hospitalquality at the ward level may be a good proxy.
We have selected different wards to test the sensitivity of our results when changing wards,i.e. when moving from a more specialized, high technology ward such as cardiac surgery to awider department with a more extensive range of treatments and pathologies such as generalmedicine. We would expect patients who need more complicated and risky interventions, suchas heart surgery, to be more conscientious about gathering information on the quality of theward when compared with patients who face less complex or life threatening interventions.
Another feature of this paper is that, contrary to previous work, we consider only non-urgent,or elective, patients in our analysis. The reason for excluding urgent patients is that these patientsneed immediate care typically at the closest hospital and in an emergency department. As such,patients’ choice sets would be very limited and confined to places that are close to where theylive (Tay, 2003) whereas elective patients are less constrained by geographical factors.
The remainder of the paper is organized as follows. Section 2 reviews the literature on theinfluence of competition on health outcomes and discusses the indicator to consider in the rela-tionship between hospital quality and competition. Section 3 briefly introduces the Lombardyhealthcare system. Section 4 describes the data. Section 5 introduces the econometric strategyand Section 6 presents some descriptive statistics. Section 7 discusses estimation results. Finally,Section 8 concludes with some suggestions for future research. In Table 1, we report the detailsof the variables that are included in the empirical analysis.
2. The influence of competition on health outcomes
Four key factors exist that may shape how competition between hospitals impacts quality:
(a) institutional settings of the hospital market supply side (Kessler and McClellan, 2000;Tay, 2003; Propper et al., 2004, 2008; Gaynor, 2006; Moscone et al., 2012, Gaynor et al.,2012),
(b) the degree of patient freedom of choice (Luft et al., 1990; Tay, 2003; Howard, 2005,Cooper et al., 2011; Beckert et al., 2012; Varkevisser et al., 2012; Moscone et al., 2012),
(c) hospital competitive strategy (Kessler and McClellan, 2000; Tay, 2003; Cooper et al.,2011) and
(d) the degree of information regarding hospital quality (Dranove et al., 2003; Dranove andSfekas, 2008).
The first factor is related to how competition is implemented in healthcare systems in whichprices are fixed. In some countries, such as the UK, the criteria are dependent on hospitalmarket performances whereas other countries boost hospital competition by providing patientinformation on where to obtain the best treatment. Italy encourages competition by expandingpatient choice sets and offering private hospitals per-treatment public reimbursement funding.The degree of hospital competition also depends on patients’ freedom of choice of where tobe treated. Some markets have complete freedom (e.g. in the USA)—i.e. patients can chooseany hospital in the relevant market—whereas others have limited freedom (e.g. Italy) eitherbecause patients are free to choose but do not know the hospital quality or because they mustselect between a limited number of hospitals. The third factor (hospital competitive strategy)describes how hospitals compete with other hospitals. In some markets, hospitals can chooseboth price and quality (e.g. in the USA), whereas, in others (e.g. in the UK and Italy), prices
4 P. Berta, G. Martini, F. Moscone and G. Vittadini
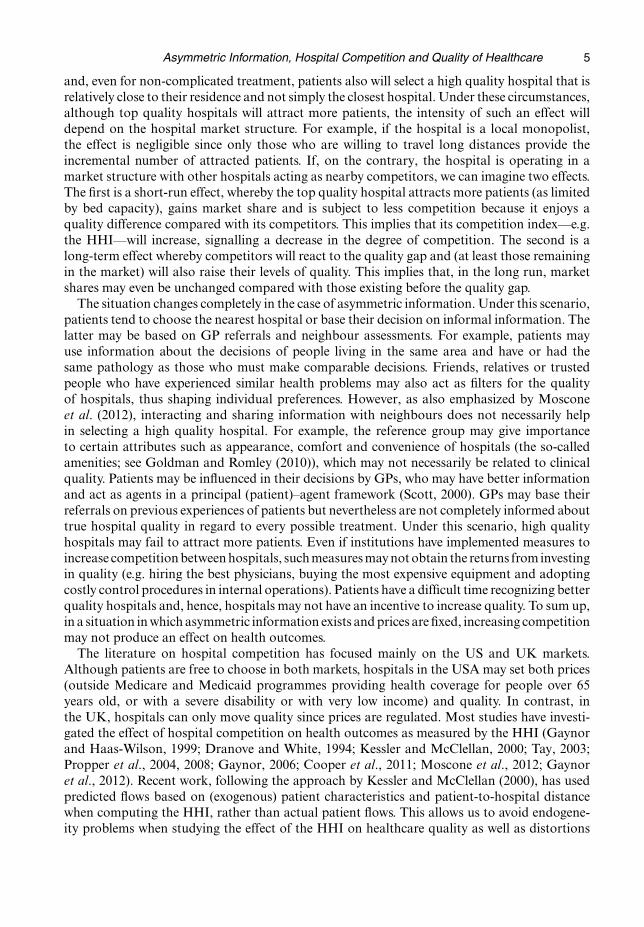
Table 1. List of variable definitions
Variable Definition
Individual-specific variablesChoiceij 1 if patient i is admitted to hospital jDistanceij Time distance from residence of patient i and hospital j (in minutes)Networki,wj % of residents living in the same municipality as patient i admitted in ward w of
hospital j in the 12 months previous to the analysisAgei Patient i age in yearsMalei 1 if patient i is maleGpi 100 × the number of patients in the zip code sharing their GP with i/the number of
patients in the zip code
Ward- and hospital-specific variablesDeathwj Hospital j 30-day mortality rate in ward wReadmissionwj Hospital j 30-day after discharge readmission rate in ward wAdverseoutwj Hospital j composite index of adverse health outcomes (i.e. 30-day mortality or
readmission) in ward wMalewj % of males in ward w of hospital jAge65wj % of patients over 65 years old in ward w of hospital jICUwj % of transits in intensive care unit for patients in ward w of hospital jDRGWEIwj Average DRG weight in ward w of hospital jPrivatej 1 if hospital j’s ownership is for profitNFPj 1 if hospital j’s ownership is not for profitMonoj 1 if hospital j is mono specializedTeachingj 1 if hospital j is a teaching hospitalTechnologyj 1 if the hospital has a high technology assessment (i.e. an intensive care unit
department) and 0 otherwiseHeartwj 1 if ward w in hospital j is cardiac surgeryCardiowj 1 if ward w in hospital j is cardiologyMedicinewj 1 if ward w in hospital j is general medicineBedswj Number of beds in ward w of hospital jRankingwj Percentile rank of ward w in hospital j in the league table of the Lombardy quality
evaluation programme
are regulated by a central or local government and they can compete only through quality thatis usually measured in terms of a set of health outcomes. Finally, the degree of competitiondepends on the level of hospital information that is available to patients when they choosewhere to be admitted. In some markets, like in the USA and the UK, patients are fully in-formed since hospital rankings are publicly advertised through league tables. See, for instance,the Web sites www.medicare.gov/hospitalcompare/search.html (for the USA) andwww.chooseandbook.nhs.uk (for the UK). In other countries (Italy), patients are free tochoose but, as they are not privy to hospital rankings, this choice is mainly based on informalinformation such as word of mouth, reputation and the media.
Our analysis considers a setting in which hospital competition is quality based and dependson the number of hospitals that a patient can reach in a reasonable time as well as fixed pricesand asymmetric information regarding the quality of providers. In this context, it is importantto understand the possible effects of hospital competition under different degrees of informationregarding quality that is available to patients. We are working under the assumption that patientsare rational agents who will maximize their utility if properly informed regarding quality andthat they will choose the hospital that provides the best combination between quality andgeographical distance (or travel time) from their residence. It is reasonable also to assume that,for more complicated treatment, patients will be willing to travel for a high quality hospital
Asymmetric Information, Hospital Competition and Quality of Healthcare 5
and, even for non-complicated treatment, patients also will select a high quality hospital that isrelatively close to their residence and not simply the closest hospital. Under these circumstances,although top quality hospitals will attract more patients, the intensity of such an effect willdepend on the hospital market structure. For example, if the hospital is a local monopolist,the effect is negligible since only those who are willing to travel long distances provide theincremental number of attracted patients. If, on the contrary, the hospital is operating in amarket structure with other hospitals acting as nearby competitors, we can imagine two effects.The first is a short-run effect, whereby the top quality hospital attracts more patients (as limitedby bed capacity), gains market share and is subject to less competition because it enjoys aquality difference compared with its competitors. This implies that its competition index—e.g.the HHI—will increase, signalling a decrease in the degree of competition. The second is along-term effect whereby competitors will react to the quality gap and (at least those remainingin the market) will also raise their levels of quality. This implies that, in the long run, marketshares may even be unchanged compared with those existing before the quality gap.
The situation changes completely in the case of asymmetric information. Under this scenario,patients tend to choose the nearest hospital or base their decision on informal information. Thelatter may be based on GP referrals and neighbour assessments. For example, patients mayuse information about the decisions of people living in the same area and have or had thesame pathology as those who must make comparable decisions. Friends, relatives or trustedpeople who have experienced similar health problems may also act as filters for the qualityof hospitals, thus shaping individual preferences. However, as also emphasized by Mosconeet al. (2012), interacting and sharing information with neighbours does not necessarily helpin selecting a high quality hospital. For example, the reference group may give importanceto certain attributes such as appearance, comfort and convenience of hospitals (the so-calledamenities; see Goldman and Romley (2010)), which may not necessarily be related to clinicalquality. Patients may be influenced in their decisions by GPs, who may have better informationand act as agents in a principal (patient)–agent framework (Scott, 2000). GPs may base theirreferrals on previous experiences of patients but nevertheless are not completely informed abouttrue hospital quality in regard to every possible treatment. Under this scenario, high qualityhospitals may fail to attract more patients. Even if institutions have implemented measures toincrease competition between hospitals, such measures may not obtain the returns from investingin quality (e.g. hiring the best physicians, buying the most expensive equipment and adoptingcostly control procedures in internal operations). Patients have a difficult time recognizing betterquality hospitals and, hence, hospitals may not have an incentive to increase quality. To sum up,in a situation in which asymmetric information exists and prices are fixed, increasing competitionmay not produce an effect on health outcomes.
The literature on hospital competition has focused mainly on the US and UK markets.Although patients are free to choose in both markets, hospitals in the USA may set both prices(outside Medicare and Medicaid programmes providing health coverage for people over 65years old, or with a severe disability or with very low income) and quality. In contrast, inthe UK, hospitals can only move quality since prices are regulated. Most studies have investi-gated the effect of hospital competition on health outcomes as measured by the HHI (Gaynorand Haas-Wilson, 1999; Dranove and White, 1994; Kessler and McClellan, 2000; Tay, 2003;Propper et al., 2004, 2008; Gaynor, 2006; Cooper et al., 2011; Moscone et al., 2012; Gaynoret al., 2012). Recent work, following the approach by Kessler and McClellan (2000), has usedpredicted flows based on (exogenous) patient characteristics and patient-to-hospital distancewhen computing the HHI, rather than actual patient flows. This allows us to avoid endogene-ity problems when studying the effect of the HHI on healthcare quality as well as distortions
6 P. Berta, G. Martini, F. Moscone and G. Vittadini
in defining the geographical area representing the potential hospital market (Kessler andMcClellan, 2000). The geographical area, if defined by using observed choices, may be in-fluenced by hospital quality, which leads to larger areas for high quality hospitals, and remainsunobserved by the researchers. The approach by Kessler and McClellan (2000) proposes to useonly exogenous patient characteristics factors affecting patient’s choice that are not linked tothe selection process.
Several studies have investigated the effects of hospital competition on hospital quality in theUS market. Kessler and McClellan (2000) have individual data on non-rural elderly Medicarepatients hospitalized for heart attack treatment in 1985, 1988, 1991 and 1994. They providedordinary least squares estimates of the effect of hospital competition and showed that com-petition leads to better health outcomes, lowering 30-day mortality hospital rates, reducingtreatment costs. Tay (2003) used data from 1994 for patients with acute myocardial infarction(AMI). She estimated a mixed logit model and showed the importance of quality in patientchoice and provided evidence that they are willing to travel more if the quality of treatment ishigher. Ho and Hamilton (2000) investigated the effects of hospital mergers on mortality rates,using a data set from patients who were admitted to hospitals in California for AMI treatmentsbetween 1991 and 1996. They estimated Cox regressions and found no effect of increased marketpower (through a merger) on mortality rates as well as a moderate effect on readmission andearly discharges rates.
Various studies have analysed the influence of competition on healthcare quality in the UK.Propper et al. (2004, 2008) studied hospital mortality rates for AMI and found a negative effectof competition. They used aggregated hospital level measures and tried to avoid endogeneityproblems in the HHI by estimating potential demand rather than observed choice. Cooper et al.(2011) implemented a difference-in-differences econometric model to study the effect of recentUK pro-competition reforms on mortality rates and found that they fell after the reforms inmore competitive hospital markets. In a more recent study, Gaynor et al. (2012) adopted patientlevel data for a coronary artery bypass graft procedure and investigated the effect of patients’freedom of choice on mortality rates. They found that giving patients the possibility of selectingtheir hospitals when they know the quality of the hospitals significantly reduces mortality rates.Gaynor et al. (2012) tackled the issue of freedom of choice and information on hospital qualityand the results are very close in spirit to our contribution.
Little empirical work exists on the effect of competition on the healthcare sector in Italy.Moscone et al. (2012) studied the effect of patient hospital choice of an imperfect measureof hospital quality (the effect of word-of-mouth social interaction given by the percentage ofpatients living in the same area who have previously made the same treatment choice). Theystudied the choices of patients suffering from heart disease who were receiving treatment in oneItalian region (Lombardy). Using administrative data that include the whole population, theyshowed that the informal neighbourhood effect has no effects on health outcomes and even maylead patients to make suboptimal selections.
Last, only a few references have explored the possible effects of asymmetric information inhealthcare despite the relevant insights that are achieved by some very famous early contribu-tions (e.g. Akerlof (1970) and Spence (1973)) and the massive number of subsequent references(an excellent review is in Mas-Colell et al. (1995)). Dranove et al. (2003) analysed the effectof disclosing hospital report cards in the USA and showed that it may induce selection ofpatients—i.e. hospitals may not admit patients with bad health statuses because they do notwant to worsen their rankings. Dranove and Sfekas (2008) showed that spreading informationon hospital quality does not necessarily improve the performances of top ranking hospitals,probably because the rankings confirm patients’ informal perceptions on the different quality
Asymmetric Information, Hospital Competition and Quality of Healthcare 7
levels. Although Varkevisser et al. (2012) provided evidence that patients tend to choose betterquality hospitals in the Netherlands, their study did not show whether this choice produces amarket premium for top quality hospitals. It is important to observe that we expect the prob-lem of patient selection to have a mild effect in Lombardy. In fact, as explained in Section 3,hospital managers are unaware of their institutions’ exact rankings unless the institution has arisk-adjusted health outcome that is significantly above, equal to or below the regional average.
Another key factor in the relationship between hospital quality and competition is the choiceof variables representing health outcomes. Several works in the literature use the mortality rateas the quality indicator (see, among others, Kessler and McClellan (2000), Tay (2003), Propperet al. (2004, 2008), Beckert et al. (2012) and Cooper et al. (2011)). Although most of thesereferences focused on treatments for AMI, some researchers (see among others Goldstein andSpiegelhalter (1996), Iezzoni et al. (1996) and Lilford et al. (2004)) have criticized the use ofmortality in treatments different from AMI as many diseases (e.g. chronic illness) have very lowmortality risks associated. In the USA, there is growing evidence (Neuman et al., 2014) thatmortality rates alone cannot capture hospital differences in treatment provided to patients.
Other references (e.g. Kessler and McClellan (2000) and Kessler and Geppert (2005)) haveconsidered another health outcome indicator: readmission rates. Repeated admissions are in-cluded in this analysis either as a single indicator in the relationship between hospital qualityand competition or separated by mortality rate (evaluating the previous relationship by usingtwo dimensions of quality). Readmission rates may be a good proxy of hospital quality for manydiseases (e.g. surgical operations) since repeated admissions for the same patient may be a signalof poor prior treatment. However, in some cases, poor treatment quality may lead to deathwithout readmission: an event that is considered an adverse health outcome and contributesto the level of hospital quality. As a result, as suggested by Neuman et al. (2014), a compositeindex of mortality and readmission rates may be a better indicator of quality of treatment in aspecific hospital. The composite index is a proxy for the frequency of adverse health outcomesthat are incurred by patients who are admitted in a specific ward of a given hospital. This indi-cator increases the frequency of adverse outcomes (which may also be very low if we focus onlyon mortality rates in some wards) and may cover different episodes of bad treatment. Hence,differently from previous contributions on the relationship between hospital quality and com-petition, we use a composite index of mortality and readmission rates as a quality indicator inour empirical application.
3. The Lombardy healthcare system
In Italy, universal coverage for healthcare services is provided by the Italian National HealthcareSystem and funded through general taxation. Financial resources are transferred to the variousregions that are in charge of managing their individual systems. In 1992, a major reform of theNational Healthcare System transformed the local health authorities into companies known asan Azienda Sanitaria Locale (ASL) and introduced a separation between the healthcare servicebuyers (the ASL) and the providers (i.e. the hospitals).
Among the Italian regions, Lombardy, with population 10 millon, is a very interesting envi-ronment in which to study the effects of asymmetric information on hospital competition. In1997, the regional government implemented pro-competition healthcare reform with the aimof improving the quality of services in a financially sustainable environment. Such reform hasgiven patients the freedom to choose between all the hospitals in the region. It has also intro-duced competition between public and private hospitals by allowing the latter to be accreditedas suppliers of healthcare, thus providing free healthcare and public reimbursement entitlement.
8 P. Berta, G. Martini, F. Moscone and G. Vittadini
Since 1995, the Lombardy region has used a financing mechanism known as the prospectivepayment system. This is a financing system in which the region pays a predetermined fixedreimbursement to the hospital for each patient on the basis of his or her diagnosis-relatedgroup (DRG) that is established by using clinical information that is reported in the hospitaldischarge chart. The ex post reimbursement for a specific DRG does not vary if the length ofstay falls within a given threshold. The DRG tariffs are set at the regional level and cover allhealthcare services relative to hospital admissions as well as outpatient activity (see Berta et al.(2010, 2013) and Vittadini et al. (2012) for further details). Hence, in our analysis, price is not astrategic variable when dealing with hospital competition. As previously mentioned, we assumethat competition is based on quality and is affected by the present number of hospitals in themarket.
Since 2002, the regional Lombardy government also implemented a quality evaluation pro-gramme within which a set of indicators is computed every year to evaluate the performanceof healthcare providers in terms of quality of care. In line with the international literature onthe relative effectiveness of hospitals (see, for example, the Agency for Healthcare Research andQuality (2012)), these measures include the following five outcomes:
(a) mortality within 30 days from discharge (including intrahospital mortality);(b) discharges against medical advice;(c) additional surgery room readmission;(d) readmission for the same condition in the major diagnostic categories within 12 months
from the date of discharge;(e) transfer to a different hospital.
We have decided to focus on mortality and readmission (by using a composite index) as patienttransfer and voluntary discharge may depend on factors that are unrelated to treatment and ad-ditional surgery may be relevant for specific treatments only. Lastly, we do not have informationon intrahospital infections and complications.
Using data from hospital discharge charts, the region estimates a set of risk-adjusted mul-tilevel logistic models to evaluate the relative effectiveness of each hospital ward. This class ofmodels exploits the hierarchical structure of the data, accounting for heterogeneity between andwithin hospitals (see Hox (1995), Goldstein (1995), Rice and Leyland (1996) and Goldstein andSpiegelhalter (1996)). Every year, the region publishes the results on a Web portal in which onlyhospitals that are included in the regional healthcare system can log in, access their performanceresults (at ward level) and compare the results with the average performance. For each ward theregion provides a hospital classification into three groups depending on whether the quality issignificantly (at 5% confidence level) above the regional average (group 1), not different (group2) or significantly below the regional average (group 3). By allowing hospitals to look at theirown performance relative to others, the aim is to promote an improvement in health quality.
4. Data
We gathered administrative data from 2012 on all patients who were admitted to the cardiacsurgery, cardiology and general medicine wards in any public or private hospital in the Lombardyregion that was financed by regional public funds. The Lombardy region provided data forresearch purposes.
Data on each patient were extracted from the hospital discharge chart and include socio-demographic characteristics such as age, gender and place of residence (the municipality), clin-ical information such as principal diagnosis and codiagnosis, main and secondary procedures,
Asymmetric Information, Hospital Competition and Quality of Healthcare 9
comorbidity, length of stay, type of admission (planned or via the emergency room) the ward ofadmission and type of discharge (e.g. death), financial information such as the DRG and hos-pital discharge chart reimbursement. Such data were matched with information on hospitals(ownership and teaching status, technology, etc.), and on the travel distance in minutes from thepatient’s residence (the municipality) to the hospital. Information on travel distance, expressedin units of time, was computed by using GoogleMaps. The algorithm computes the fastest routefrom an individual’s residence to the hospital by car. The distance is set to 0 if an individual’sstreet address and the hospital location are identical.
We also gathered information on the GPs with whom patients are registered from the GeneralRegister Office, which was provided by the Lombardy region and represents the 7605 GPsoperating in the region.
We removed from the data set any patient whose source of admission was other than elective.We define as elective all booked or planned admissions in which patients have been given adate or approximate date at the time that the decision to admit was made. After this cleaningprocedure, we are left with a total of 194020 patients of whom 9121 were admitted to cardiacsurgery, 71499 to cardiology and 113400 to general medicine. These patients were admitted tothe cardiac surgery ward of 20 hospitals, the cardiology ward of 76 hospitals and to the generalmedicine ward of 124 hospitals in the Lombardy region.
Table 1 reports a list of variables and their definitions. We observe that, in the computationof readmission rates, patients not surviving past the 30-day window were excluded from thedenominator.
5. The econometric strategy
To study the effect of competition between hospitals on health outcomes we adopt a two-stage approach. In the first stage we study patient hospital choices as a function of a set ofpatient characteristics, the hospital travel distance and the network effect. In the second stage,we compute a set of HHIs (one for each ward and for each hospital) by using the predictedchoice probabilities estimated in the first stage and then analyse their effect on hospital quality.As previously mentioned, we focus on a composite index of mortality and readmission rates,namely ward level rates of mortality and readmission within 30 days from discharge.
In the first stage, we investigate patient choices by using a discrete choice model. Patientsmaximize their utility functions given their characteristics and hospital travel distance. Giventhat information on the quality of hospitals is not publicly available, we assume that informationregarding the quality of past treatment received at a specific hospital is transmitted throughsocial interaction among the population living in the same neighbourhood. As patients withina neighbourhood interact, the choice of one patient is influenced by the choice of neighbouringpatients (Brock and Dourlaf, 2001). Suppose that, for ward w, the observable choice of individuali of being admitted to hospital j, yi,wj, is related to the expected utility of i choosing j, yÅ
i,wj,according to yi,wj =1 if yÅ
i,wj > 0. Our choice model is
yÅi,wj =ρwdi,wj + δwj Networki,wj +γwj GPi +π′
wjxi + "i,wj, .1/
where dij is the distance between patient i and hospital j, GPi is the percentage of patients livingin the zip code as patient i and sharing their GP with patient i and xi are a set of exogenous, patientlevel characteristics. As for the distance variable, we have taken the travel distance expressed inminutes. The variable Networki,wj is a continuous variable given by the share of people livingin the same municipality as patient i and admitted to ward w of the same hospital j, in the
10 P. Berta, G. Martini, F. Moscone and G. Vittadini
12 months before patient i’s admission. In the Lombardy region, like in the rest of Italy, most ofthe population is concentrated in small-to-medium sized municipalities that are characterized bya strong historical and cultural identity as well as autonomy guaranteed by the Italian legislativestructure. Family members usually live within the same municipality and meeting with friendsand relatives is encouraged through local associations, cultural events, activities of the localparishes and so forth. Within the same municipality, historical, political, social and religiousforces may encourage interaction between people, which is the main reason for using it as areference area for building the network variable.
A positive and significant coefficient attached to the network effect and relative to hospital jmeans that a subset of the population, sharing informal information on the quality of the jthhospital, increases the conditional probability of choosing it for each member of this subset. Anegative and significant coefficient implies that, ceteris paribus, a patient will make a choice thatis different from that of her neighbours. The key mechanism underlying a significant coefficientattached to the jth hospital, either positive or negative, is the existence of clusters of informalinformation on the quality of the jth hospital. Such information, which we call a network effect,shapes the preferences of individuals and ultimately influences their decisions. A statisticallyinsignificant coefficient means that patients do not use information from the network to choosethat hospital and hence their choice is driven only by personal characteristics.
In equation (1) vector x of patient characteristics includes as regressors a dummy equal to 1if patient i is over 65 years old, Agei, and a dummy equal to 1 if patient i is male, Malei. We alsoinclude a variable measuring the fraction of patients in the postal code area of patient i sharinga GP with patient i, GPi. By including this variable, we aim to capture the potential correlationthat arises from GP advice on the hospital at which to be treated. We estimate equation (1)for each ward separately by maximum likelihood using a mixed logit approach (Tay, 2003;Varkevisser et al., 2012). To estimate our model, we have applied the asclogit procedure inthe statistical software Stata 13 (StataCorp, 2013).
We then calculate the HHI of competition by computing the theoretical patient flows byusing the predicted choice probabilities that are obtained from the first stage. This is doneto avoid potential endogeneity in patient flows and in defining hospital catchment areas asunderlined by Kessler and McClellan (2000). In fact, real patient flows can be influenced byvariables such as the teaching status or the size of a hospital, which are connected with healthoutcomes and hospital quality. The endogeneity problem may also arise because hospitals withhigher quality could obtain higher market shares and thus the index of competition may beaffected by the dependent variable. Such endogeneity may bias results when regressing theHHI on health outcomes. Moreover, defining hospital geographic markets as a function ofactual choices may lead to areas that are increasing in the unobservable quality. This has aninfluence on the HHIs and may give rise to competition effect estimates on hospital outcomesthat are due both to the true effect and to the unobservable quality. As indicated by Kesslerand McClellan (2000), building theoretical patients based on exogenous factors may overcomethese problems. Hence, in our empirical application we compute the HHI indices for each wardor hospital with a three-stage approach: first, we estimate patient level hospital choice as afunction of exogenous determinants of the admission decision (e.g. age and distance). Thisproduces predicted probabilities of admission for each patient in each ward or hospital of therelevant geographical area. Summing these predicted probabilities at the ward or hospital levelgives the predicted flow of patients who are admitted to each ward or hospital in the sample onthe basis of exogenous characteristics of patients and hospitals. Second, we compute the HHIby using the exogenously determined patient flows that are assigned to each ward or hospital.Third, in the quality–competition relationship, we insert this HHI as a regressor.

Asymmetric Information, Hospital Competition and Quality of Healthcare 11
Previous literature defines potential markets of hospital-specific HHIs as the area surroundingeach hospital by using an array of arbitrary lengths—e.g. 30 km (Bloom et al., 2010; Siciliani andMartin, 2007). To avoid the possible biases in computing the HHI by using these ad hoc methods,we follow Kessler and McClellan (2000) and use the predicted flows that are estimated with model(1) to compute HHI indices by exogenously assigning each patient to a given geographic areaidentified by the local healthcare zone, called the ASL (local health authority). In Lombardy,there are 15 ASLs and each patient is exogenously assigned to one. Let π̂i,wj be the predictedprobability that patient i chooses hospital j (in ward w/, obtained from equation (1). The shareof patients living in ASL area q who are predicted to choose hospital j over the predicted flowof patients living in ASL q to all the hospitals is
αq,wj =!
∀ i living in q
π̂i,wj
"J!
j=1
!
∀ i living in q
π̂i,wj, .2/
where J is the number of hospitals operating within a given ward (e.g. cardiology) in Lombardy.Expression (2) is computed for each hospital in Lombardy and for each ward that are consideredin the analysis. Hence, we can compute the ASL q competition index HHIwq, given by
HHIwq =J!
j=1α2
q,wj: .3/
The next step consists of defining the weight for hospital j of ASL area q relative to all ASLareas in Lombardy:
β̂q,wj =!
∀ i living in q
π̂i,wj
#Nwj!i=1
π̂i,wj, .4/
where Nwj is the total number of patients admitted in ward w of hospital j in Lombardy. Thelast step is computing the HHI for ward w in hospital j, given by
HHIwj =10000Q!
q=1β̂q,wj HHIwq: .5/
Hence, each ward–hospital has an HHI competition index that is a weighted average (using eachhospital patient share in ASL q/ of the exogenously defined ASL q competition index. HHIwj
varies between 10000 × 1/J (competition) and 10000 (monopoly), with larger values indicatinga decrease in the degree of competition.
The second stage of our econometric approach is designed to verify the influence of com-petition on hospital adverse health outcomes. Let ywj be the adverse health outcome (eithermortality or readmission) for ward w of hospital j. In our second stage we consider the follow-ing multilevel model for ywj:
ywj =α+!k
βkxk,wj +!m
γmzm,j +θ HHIwj +uj + "wj, .6/
where xk,wj is a set of ward and hospital-specific characteristics zmj is a set of hospital-specificattributes and uj is a hospital-specific random effect. We consider, as adverse health outcomesywj, the (ward-specific) 30-day mortality rate Deathwj and the readmission rate Readmissionwj
in hospital j. We consider also an adverse outcome index given by the combination of read-mission and mortality. As regressors, in addition to the HHI, our key variable, we control alsofor some other variables. We include the percentage of patients who are older than 65 years toaccount for patient health status given that age is highly correlated with chronic conditions. Wehave also included the ward or hospital average DRG weight DRGwj, identification of treatment
12 P. Berta, G. Martini, F. Moscone and G. Vittadini
complexity and the percentage of patients receiving treatment in the intensive care unit, ICUwj.Further, we have included dummies indicating whether the hospital specializes in a particulararea of treatment, Monoj, is a university, Teachingj, a not-for-profit, NFPi, or a private hospi-tal, Privatej, and whether the hospital uses advanced technology for patient treatment, Techj.Since we do not have information on specific technological equipment, we adopt the presencein hospital i of an intensive care unit as proxy for hospital classification. Although this featurefits well in the case of general medicine and cardiology, for heart surgery we identify a set oftreatments that require high technology equipment such as
(a) repair of atrial and ventricular septa with prostheses,(b) total repair of certain congenital cardiac anomalies and(c) heart replacement procedures.
We include ward dummies Heartwj and Cardiowj and an interaction term identifying theeffect of the HHI for not-for-profit and private hospitals only. This is to include the interwardvariability in the relation adverse outcomes–competition. Lastly, we take into account also thatsome choices are repeated in our patient level data. In other words, a patient making a secondhospital choice for the same treatment is more informed than when the patient made the firstdecision. Hence, we include in the analysis the percentage of repeated choices (made by the samepatient) that are different from the first choice at the hospital level. This variable identifies ashare of patients who were admitted for the first time in hospital i who did not repeat the samechoice later—i.e. a possible signal of poor treatment in hospital i. This may explain the level ofadverse health outcomes in hospital i. The average percentage of these choices is 4% in cardiacsurgery, 8.4% in cardiology and 8.1% in general medicine. However, as this percentage was notstatistically significant, we dropped it from our empirical results.
We estimate multilevel model (6) (Goldstein and Spiegelhalter, 1996; Leyland and Goldstein,2001) by applying the Mixed procedure in Stata. Multilevel models are very suitable for ourapplication given the hierarchical structure of data in which patients are nested within wardsand hospitals. Various alternative techniques have been proposed in the literature to estimatemultilevel equation (6). One important approach is the use of Bayesian methods for hierarchi-cal models that estimate posterior distributions for provider-specific parameters that influencepatient outcomes (see, among others, McClellan and Staiger (1999)). The comparison of multi-level and Bayesian models when data have a hierarchical structure has not been widely studied.Browne and Draper (2006) performed several comparisons and found a better performance byusing a Bayesian estimator only in a three-level, random-effects logistic regression. Our analysisconcerns a large sample and, as also observed in the conclusion of Browne et al. (2006), the log-likelihood approach should not give rise to concerns of lower performance than the Bayesianapproaches.
The main focus in this second stage is on the magnitude and significance of the parameterattached to the HHI. A positive and significant coefficient indicates that more competitionincreases the level of quality that is offered by hospitals, whereas a coefficient that is statisticallyinsignificant would point to no effect of competition.
In this last stage, as a final check, we also test whether there is a relationship between theregional risk-adjusted, hospital quality ranking and patient-predicted choices. Specifically, weestimate the following multilevel model by using data at the patient level:
π̂i,wj =α+β Rankingwj +γ Bedswj +Heartwj +Cardiowj +uj + "i,wj, .7/
where π̂i,wj is patient i’s maximum probability among all her predicted probabilities (obtainedfrom equation (1)) of selecting each hospital in the region with ward w, and Rankingwj is
Asymmetric Information, Hospital Competition and Quality of Healthcare 13
the hospital level ranking calculated by the Lombardy region within the quality evaluationprogramme. Bedswj is the number of beds for each ward and Heartj and Cardioj are wardfixed effects to control for hospital-specific characteristics. An insignificant coefficient for theranking variable indicates that actual levels of quality do not drive patients’ choice of hospital.We observe that, as emphasized by Austin et al. (2015), hospital quality as measured by rankingmay offer a poor representation of the true level of hospital quality.
6. Descriptive statistics
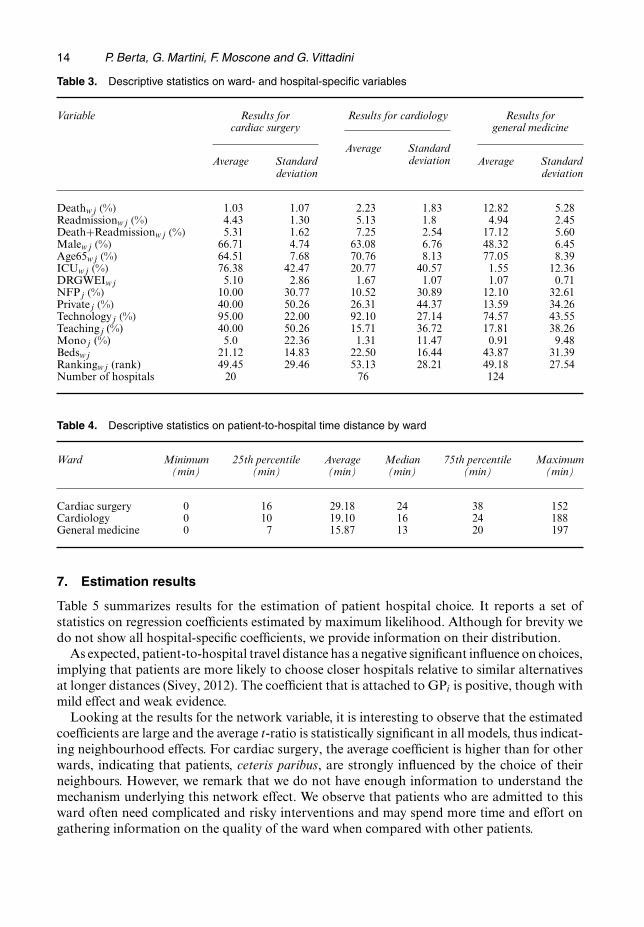
Table 2 summarizes the set of patient-specific characteristics that are included in our analysis.Table 3 displays some descriptive statistics for the hospital-specific variables.
The statistics show that cardiac pathology affects more males than females and that patientsin cardiology and general medicine are older than patients in cardiac surgery. Looking at thedistance variables, we note that patients who are admitted to cardiac surgery are more willingto travel longer distances and that their network size is smaller compared with cardiology andgeneral medicine patients.
Focusing on the ward and hospital level variables, we note that general medicine has high mor-tality rates. As expected, patients who are admitted to cardiac surgery are (relatively) young andare undergoing highly specialized expensive treatment and interventions. Conversely, patientswho are admitted to cardiology and general medicine are older, often affected by a number ofcomorbidities, and admitted for a variety of treatments and interventions.
Table 3 shows also that the three wards have different compositions in terms of ownership andteaching status. Private and teaching hospitals often have cardiac surgery wards, whereas public,non-teaching hospitals often have cardiology and general medicine wards. Also, as expected,cardiac surgery wards have high technology equipment.
Table 4 offers a set of descriptive statistics on patient-to-hospital distance, measured in minutesof time, for the three wards. It is interesting to observe that the average distance to the cardiologyward is much shorter than for the cardiac surgery ward: about 19 min for the former versus 29min for the latter. This may be explained by the fact that patients who are admitted for cardiacsurgery may face more complex interventions and thus are more willing to travel further toreceive high quality treatment. Table 4 shows that, overall, patients tend to choose nearbyhospitals, showing little propensity to travel for hospital treatments in a context of asymmetricinformation regarding hospital quality in Lombardy.
Table 2. Descriptive statistics on individual-specific variables
Variable Results for Results for Results forcardiac surgery cardiology general medicine
Average Standard Average Standard Average Standarddeviation deviation deviation
Distanceij 29.18 20.72 19.10 15.72 15.87 13.02Networki, wj 38.01 29.77 66.10 33.59 77.86 29.15Agei 64.78 17.11 69.34 13.82 72.91 15.68Malei .%/ 65.52 47.50 64.78 47.77 49.56 50.00GPi 14.11 17.85 14.23 18.02 18.27 20.54
14 P. Berta, G. Martini, F. Moscone and G. Vittadini
Table 3. Descriptive statistics on ward- and hospital-specific variables
Variable Results for Results for cardiology Results forcardiac surgery general medicine
Average StandardAverage Standard
Average Standarddeviation
deviationdeviation
Deathwj .%/ 1.03 1.07 2.23 1.83 12.82 5.28Readmissionwj .%/ 4.43 1.30 5.13 1.8 4.94 2.45Death+Readmissionwj .%/ 5.31 1.62 7.25 2.54 17.12 5.60Malewj .%/ 66.71 4.74 63.08 6.76 48.32 6.45Age65wj .%/ 64.51 7.68 70.76 8.13 77.05 8.39ICUwj .%/ 76.38 42.47 20.77 40.57 1.55 12.36DRGWEIwj 5.10 2.86 1.67 1.07 1.07 0.71NFPj .%/ 10.00 30.77 10.52 30.89 12.10 32.61Privatej .%/ 40.00 50.26 26.31 44.37 13.59 34.26Technologyj .%/ 95.00 22.00 92.10 27.14 74.57 43.55Teachingj (%) 40.00 50.26 15.71 36.72 17.81 38.26Monoj (%) 5.0 22.36 1.31 11.47 0.91 9.48Bedswj 21.12 14.83 22.50 16.44 43.87 31.39Rankingwj (rank) 49.45 29.46 53.13 28.21 49.18 27.54Number of hospitals 20 76 124
Table 4. Descriptive statistics on patient-to-hospital time distance by ward
Ward Minimum 25th percentile Average Median 75th percentile Maximum(min) (min) (min) (min) (min) (min)
Cardiac surgery 0 16 29.18 24 38 152Cardiology 0 10 19.10 16 24 188General medicine 0 7 15.87 13 20 197
7. Estimation results
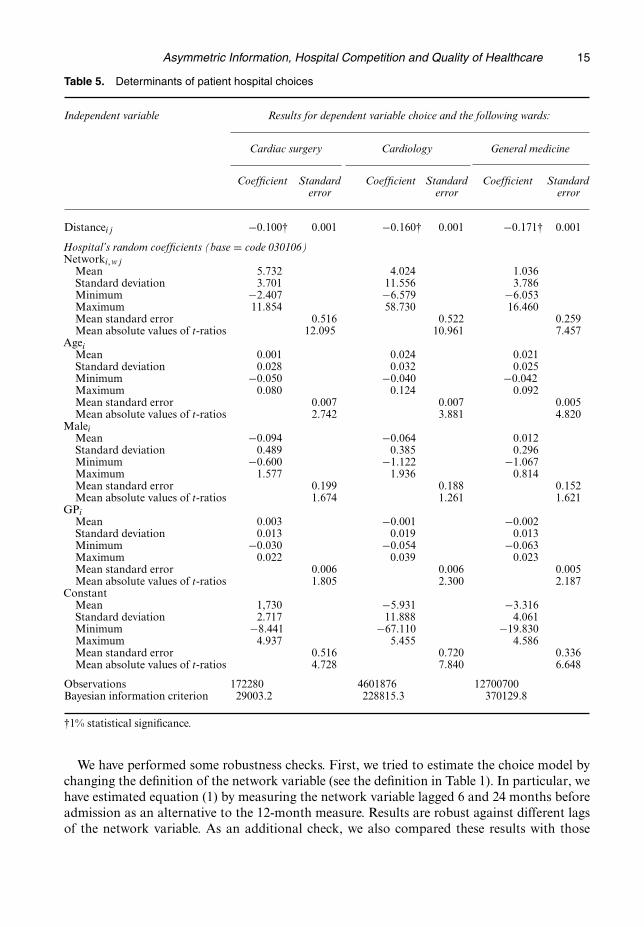
Table 5 summarizes results for the estimation of patient hospital choice. It reports a set ofstatistics on regression coefficients estimated by maximum likelihood. Although for brevity wedo not show all hospital-specific coefficients, we provide information on their distribution.
As expected, patient-to-hospital travel distance has a negative significant influence on choices,implying that patients are more likely to choose closer hospitals relative to similar alternativesat longer distances (Sivey, 2012). The coefficient that is attached to GPi is positive, though withmild effect and weak evidence.
Looking at the results for the network variable, it is interesting to observe that the estimatedcoefficients are large and the average t-ratio is statistically significant in all models, thus indicat-ing neighbourhood effects. For cardiac surgery, the average coefficient is higher than for otherwards, indicating that patients, ceteris paribus, are strongly influenced by the choice of theirneighbours. However, we remark that we do not have enough information to understand themechanism underlying this network effect. We observe that patients who are admitted to thisward often need complicated and risky interventions and may spend more time and effort ongathering information on the quality of the ward when compared with other patients.
Asymmetric Information, Hospital Competition and Quality of Healthcare 15
Table 5. Determinants of patient hospital choices
Independent variable Results for dependent variable choice and the following wards:
Cardiac surgery Cardiology General medicine
Coefficient Standard Coefficient Standard Coefficient Standarderror error error
Distanceij −0:100† 0.001 −0:160† 0.001 −0:171† 0.001
Hospital’s random coefficients (base = code 030106)Networki,wj
Mean 5.732 4.024 1.036Standard deviation 3.701 11.556 3.786Minimum −2:407 −6:579 −6:053Maximum 11.854 58.730 16.460Mean standard error 0.516 0.522 0.259Mean absolute values of t-ratios 12.095 10.961 7.457
AgeiMean 0.001 0.024 0.021Standard deviation 0.028 0.032 0.025Minimum −0:050 −0:040 −0:042Maximum 0.080 0.124 0.092Mean standard error 0.007 0.007 0.005Mean absolute values of t-ratios 2.742 3.881 4.820
MaleiMean −0:094 −0:064 0.012Standard deviation 0.489 0.385 0.296Minimum −0:600 −1:122 −1:067Maximum 1.577 1.936 0.814Mean standard error 0.199 0.188 0.152Mean absolute values of t-ratios 1.674 1.261 1.621
GPiMean 0.003 −0:001 −0:002Standard deviation 0.013 0.019 0.013Minimum −0:030 −0:054 −0:063Maximum 0.022 0.039 0.023Mean standard error 0.006 0.006 0.005Mean absolute values of t-ratios 1.805 2.300 2.187
ConstantMean 1,730 −5:931 −3:316Standard deviation 2.717 11.888 4.061Minimum −8:441 −67:110 −19:830Maximum 4.937 5.455 4.586Mean standard error 0.516 0.720 0.336Mean absolute values of t-ratios 4.728 7.840 6.648
Observations 172280 4601876 12700700Bayesian information criterion 29003.2 228815.3 370129.8
†1% statistical significance.
We have performed some robustness checks. First, we tried to estimate the choice model bychanging the definition of the network variable (see the definition in Table 1). In particular, wehave estimated equation (1) by measuring the network variable lagged 6 and 24 months beforeadmission as an alternative to the 12-month measure. Results are robust against different lagsof the network variable. As an additional check, we also compared these results with those
16 P. Berta, G. Martini, F. Moscone and G. Vittadini
Table 6. Descriptive statistics on computed HHIs in the three wards
Ward Mean Minimum 25th Median 75th Maximum(standard percentile percentiledeviation)
Cardiac 2323.27 1438.92 1641.56 2007.57 2532.19 6480.12surgery (1140.86) Ca’ Granda Niguarda C. Poma Mantua
Cardiology 1319.98 564.94 875.74 1201.26 1538.25 3739.27(630.86) Fatebenefratelli Milan Valcamonica Esine
General 1041.85 550.50 642.11 949.65 1115.02 5238.45medicine (601.20) San Pellegrino Terme Valcamonica Esine
obtained by multinomial and conditional logit model approaches. The results are very similarand therefore not reported.
We note that the coefficients that are attached to the network variable might not only reflectsocial influences but also the effect of other factors. In particular, such interdependence mayarise because of contextual effects, i.e. if individual action varies with observed attributes thatdefines her group membership—or correlated effects—and if individuals in the same grouptend to behave similarly because they have similar characteristics or similar opportunities andconstraints (Manski, 1993; Brock and Durlauf, 2001). In addition, our data do not allow usto know whether patients, when choosing a hospital, use sources of information other thanthe local network such as advice from a specialist or forum groups on the Web. Such externalsources may have an influence on the network effect and reduce its size.
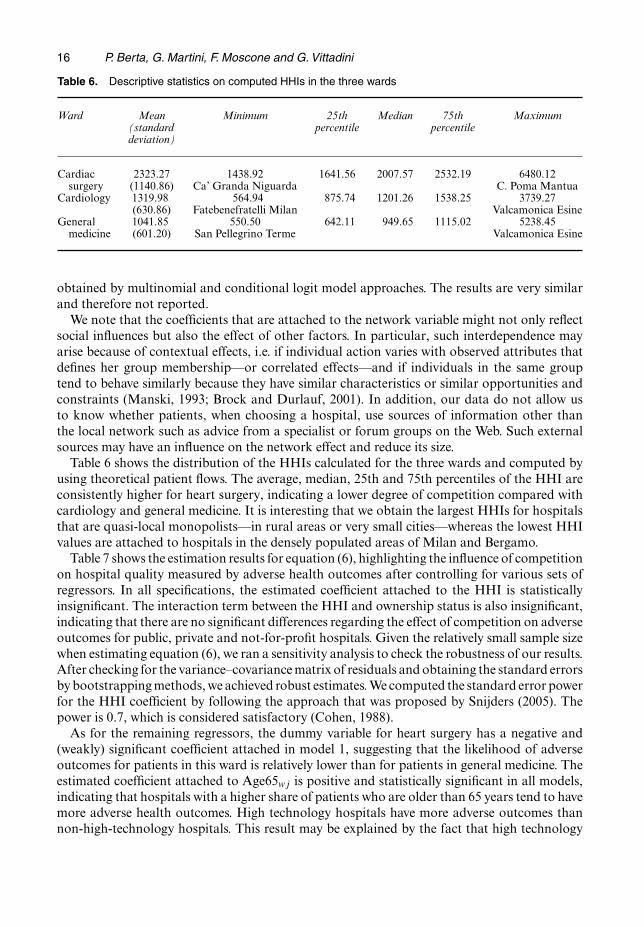
Table 6 shows the distribution of the HHIs calculated for the three wards and computed byusing theoretical patient flows. The average, median, 25th and 75th percentiles of the HHI areconsistently higher for heart surgery, indicating a lower degree of competition compared withcardiology and general medicine. It is interesting that we obtain the largest HHIs for hospitalsthat are quasi-local monopolists—in rural areas or very small cities—whereas the lowest HHIvalues are attached to hospitals in the densely populated areas of Milan and Bergamo.
Table 7 shows the estimation results for equation (6), highlighting the influence of competitionon hospital quality measured by adverse health outcomes after controlling for various sets ofregressors. In all specifications, the estimated coefficient attached to the HHI is statisticallyinsignificant. The interaction term between the HHI and ownership status is also insignificant,indicating that there are no significant differences regarding the effect of competition on adverseoutcomes for public, private and not-for-profit hospitals. Given the relatively small sample sizewhen estimating equation (6), we ran a sensitivity analysis to check the robustness of our results.After checking for the variance–covariance matrix of residuals and obtaining the standard errorsby bootstrapping methods, we achieved robust estimates. We computed the standard error powerfor the HHI coefficient by following the approach that was proposed by Snijders (2005). Thepower is 0.7, which is considered satisfactory (Cohen, 1988).
As for the remaining regressors, the dummy variable for heart surgery has a negative and(weakly) significant coefficient attached in model 1, suggesting that the likelihood of adverseoutcomes for patients in this ward is relatively lower than for patients in general medicine. Theestimated coefficient attached to Age65wj is positive and statistically significant in all models,indicating that hospitals with a higher share of patients who are older than 65 years tend to havemore adverse health outcomes. High technology hospitals have more adverse outcomes thannon-high-technology hospitals. This result may be explained by the fact that high technology

Asymmetric Information, Hospital Competition and Quality of Healthcare 17
Table 7. Effect of competition on hospital health outcomes†
Independent Results for dependent variable hospital composite index ofvariable adverse health outcomes and the following models:
Model 1 Model 2 Model 3
Coefficient Coefficient Coefficient(standard error) (standard error) (standard error)
HHIwj 0.031 (0.051) 0.013 (0.039) 0.018 (0.056)Age65wj 0.193 (0.047)‡ 0.212 (0.048)‡ 0.215 (0.055)‡Genderwj −0:111 .0:090/ −0:046 .0:104/ −0:046 .0:105/Drgwj 0.006 (0.018) 0.006 (0.014) 0.008 (0.014)ICUwj −0:009 .0:026/ −0:037 .0:029/ −0:037 .0:031/Techj 0.022 (0.008)‡ 0.022 (0.010)§Monoj −0:005 .0:020/ −0:005 .0:022/Teachingj −0:004 .0:008/ −0:002 .0:008/NFPj −0:026 .0:013/§ −0:014 .0:038/Privatej −0:013 .0:007/§§ −0:017 .0:017/Hearthwj −0:137 .0:072/§§ −0:105 .0:064/ −0:109 .0:062/§§Cardiowj −0:106 .0:014/‡ −0:095 .0:016/‡ −0:096 .0:020/‡HHIjÅNFPj −0:110 .0:274/HHIjÅPrivatej 0.034 (0.134)Constant 0.069 (0.050) 0.016 (0.043) 0.013 (0.056)
Number of observations 220 220 220Log-likelihood 382.51 391.82 392.19ICC 0.065 0.066 0.075
†Results show estimates of multilevel model (6) by pseudolikelihood techniques by maxi-mum likelihood. Standard errors are obtained by block bootstrapping at the ward level.‡1% significance.§5% significance.§§10% significance.
hospitals generally also have an intensive care unit. There is weak statistically significant evidencein model 2 that private hospitals have lower adverse outcome rates than public hospitals.
The absence of evidence of a relationship between quality and competition may be explainedby the presence of asymmetric information about the ‘true’ quality of hospitals, which was alsosuggested by Moscone et al. (2012). In fact, the presence of asymmetric information may actas a barrier for competition to work effectively, since it may reduce the possible returns frominvesting in hospital quality. A complementary explanation, of lack of such evidence, is thedifficulty of using health outcomes that are sufficiently sensitive to detect differences in wardlevel quality as discussed at the end of Section 2.
Table 8 reports results for the estimation of the effect of hospital quality ranking on patient-predicted choice probabilities obtained from the three wards in stage 1. It is interesting that the ef-fect of hospital rankings on predicted probabilities is always statistically insignificant. This resultreinforces the role that is played by the presence of asymmetric information on elective patients.
8. Concluding remarks
In this paper we investigated how competition affects the health of patients in quasi-healthcarein the Lombardy regional market. We found that more competition does not seem to have a

18 P. Berta, G. Martini, F. Moscone and G. Vittadini
Table 8. Impact of hospital quality ranking on patient-predicted choiceprobabilities†
Independent Results for dependent variable patient-predictedvariable probability of choice
Coefficient Standard error
Rankingj −0:000001 0.00003Bedsj 0.001‡ 0.00002Heartj 0.140‡ 0.0025Cardioj 0.076‡ 0.0014Constant 0.430‡ 0.021
Number of observations 171616ICC 0.67
†Results show estimates of multilevel model (6) by pseudolikelihood techniquesby maximum likelihood.‡1% significance.
significant influence on the quality of hospitals. One explanation for this result is a lack of pub-licly available information on the quality of hospitals. The presence of such asymmetric informa-tion may exacerbate the influence of information that is gathered locally. It may also result in a re-duced freedom of choice for patients, a lower degree of competition between hospitals and a lackof market premium for top quality hospitals. Our results point to the network effect as a barrierfor competition to work effectively and indicate that patient choice is likely to be not affected bythe true quality of hospitals. Our analysis may shed light on why empirical literature often rejectsthe theoretical result that more competition should lead to better health when prices are fixed.
Our contribution has two important policy implications. First, the results show that it isnecessary and urgent to disclose information regarding hospital quality ranking computedwithin the regional quality evaluation programme, to GPs, patients and the wider public. Asshown by Austin et al. (2015), a set of indicators delivered to the public must remain fixed for asufficiently long period of time to avoid misunderstandings and confusion. As such, the presenceof asymmetric information will be reduced and patients will tend to choose high quality hospitalsand to enjoy the benefits of having invested in better healthcare. Although publicly availablehospital rankings may certainly support patient choice and encourage providers to improve theirquality, this may not be enough to encourage low quality hospitals to improve their quality ofcare. Hence, our second policy implication is that the regional government should make a specialintervention on behalf of these hospitals. For instance, such an intervention may give hospitalswith only one or two wards, which is significantly below the regional average (i.e. indicated asbelonging to group 3 within the quality evaluation programme), a time period—say, 1–2 years—within which they must make improvements. If a ward is still ranked in the bottom quality groupafter this period of time, it would be closed or receive a monetary penalty. These interventionsin the regional hospital structure are essential to form a competitive hospital market.
Our results are open to further new research developments. In this paper, following Mosconeet al. (2012), we have used hospital network effects as a proxy for patient sensitivity to localinformation or social interaction. However, we observe that social interaction may be the resultof other forces such as contextual or correlated effects (Manski, 1993; Brock and Durlauf, 2001).Future work will consider strategies for disentangling social interaction from the effect of otherfactors. A limitation of our work is that the study focuses on only a single cross-section. Future

Asymmetric Information, Hospital Competition and Quality of Healthcare 19
work will explore whether our results are consistent when using panel data. Another interestingextension is the analysis of healthcare quality at the surgical or team level or using the averagesurgical quality within the ward weighted by the number of surgeries. In fact, patients couldchoose their provider depending on the national and international reputation of a particularsurgeon or medical team and average surgical quality is a more accurate measure of quality.
Finally, we remark that the indicators that are usually used in the literature are not sufficientlysensitive to detect variations in ward level quality. Although in our paper we have mitigated thisissue by using a composite index of adverse health outcomes, future work should include otherindicators for hospital quality—e.g. clinical indicators describing the quality of the treatmentthat is used in various pathological conditions (Iezzoni et al., 1996; Damberg et al., 1998), processmeasures such as the frequency of using best practices in the treatment of a pathology (JointCommission on Accreditation of Healthcare Organization, 1994), sentinel events representingunexpected occurrences (e.g. death or severe physical or psychological injury) (Joint Commissionon Accreditation of Healthcare Organization, 1994) and quality-of-life outcomes indicating thegeneral health condition of the patient (Damberg et al., 1998).
Acknowledgements
We thank Arnaud Chevalier, John Mullahy, Luigi Siciliani, Jonathan Skinner and two refereesfor helpful comments.
ReferencesAgency for Healthcare Research and Quality (2012) Guide to inpatient quality indicators. US Department of
Health and Human Services, Rockville.Akerlof, G. A. (1970) The market for lemons. Q. J. Econ., 84, 488–500.Austin, J. M., Jha, A. K., Romano, P. S., Singer, S. J., Vogus, T. J., Wachter, R. M. and Pronovost, P. J. (2015)
National hospital ratings systems share few common scores and may generate confusion instead of clarity. HlthAff., 34, 423–430.
Beckert, W., Christensen, M. and Collyer, K. (2012) Choice of NHS-funded hospital services in England. Econ.J., 122, 400–417.
Berta, P., Callea, G., Martini, G. and Vittadini, G. (2010) The effects of upcoding, cream-skimming and readmis-sions on the Italian hospital efficiency: a population-based investigation. Econ. Modllng, 27, 812–821.
Berta, P., Seghieri, C. and Vittadini, G. (2013) Comparing health outcomes among hospitals: the experience ofthe Lombardy Region. Hlth Care Mangmnt Sci., 16, 245–257.
Bloom, N., Propper, C., Seiler, S. and Reenen, J. V. (2010) The impact of competition on management quality:evidence from public hospitals. Working Paper 16032. National Bureau of Economic Research, Cambridge.
Brock, W. A. and Durlauf, S. N. (2001) Interactions-based models. In Handbook of Econometrics, vol. 5 (eds J. J.Heckman and E. Leamer), pp. 3297–3380. Amsterdam: North-Holland.
Browne, W. J. and Draper, D. (2006) A comparison of Bayesian and likelihood-based methods for fitting multilevelmodels. Baysn Anal., 1, 473–514.
Carey, K. and Burgess, J. F. (1999) On measuring the hospital cost/quality trade-off. Hlth Econ., 8, 509–520.Cohen, J. (1988) Statistical Power Analysis for the Behavioral Sciences. Mahwah: Erlbaum.Cooper, Z., Gibbons, S., Jones, S. and McGuire, A. (2011) Does hospital competition save lives?: Evidence from
the English NHS patient choice reforms. Econ. J., 121, F228–F260.Damberg, C., Kerr, E. A. and McGlynn, E. A. (1998) Description of data sources and related issues. In Health
Information Systems: Design Issues and Analytic Application (eds E. A. McGlynn and J. Escance), pp. 43–76.Rand Health Corporation.
Dranove, D., Kessler, D., McClellan, M. and Satterthwaite, M. (2003) Is more information better?: The effectsof “report cards” on health care providers. J. Polit. Econ., 111, 555–588.
Dranove, D. and Sfekas, A. (2008) Start spreading the news: a structural estimate of the effects of New YorkHospital report cards. J. Hlth Econ., 27, 1201–1207.
Dranove, D. and White, W. D. (1994) Recent theory and evidence on competition in hospital markets. J. Econ.Mangmnt Strat., 3, 169–209.
Gaynor, M. (2006) What do we know about competition and quality in health care markets? Working Paper12301. National Bureau of Economic Research, Cambridge.

20 P. Berta, G. Martini, F. Moscone and G. Vittadini
Gaynor, M. and Haas-Wilson, D. (1999) Change, consolidation, and competition in health care markets. J. Econ.Perspect., 13, 141–164.
Gaynor, M., Propper, C. and Seiler, S. (2012) Free to choose?: reform and demand response in the EnglishNational Health Service. Working Paper 18574. National Bureau of Economic Research, Cambridge.
Goldman, D. and Romley, J. A. (2010) Hospitals as hotels: the role of patient amenities in hospital demand.Mimeo. University of Southern California, Los Angeles.
Goldstein, H. (1995) Multilevel Statistical Models, 2nd edn. London: Arnold.Goldstein, H. and Spiegelhalter, D. J. (1996) League tables and their limitations: statistical issues in comparisons
of institutional performance (with discussion). J. R. Statist. Soc. A, 159, 385–443.Ho, V. and Hamilton, B. H. (2000) Hospital mergers and acquisitions: does market consolidation harm patients?
J. Hlth Econ., 19, 767–791.Howard, D. H. (2005) Quality and consumer choice in healthcare: evidence from kidney transplantation. Top.
Econ. Anal. Poly, 5, 1–20.Hox, J. J. (1995) Applied Multilevel Analysis. Amsterdam: TT-publikaties.Iezzoni, L. I., Ash, S. A., Schwartz, M., Daley, J., Hughes, J. S. and Mackiernan, Y. D. (1996) Judging hospitals
by severity-adjusted mortality rates: the influence of the severity adjustment method. Am. J. Publ. Hlth, 86,1379–1387.
Joint Commission on Accreditation of Healthcare Organization (1994) A guide to establishing programs forassessing outcomes in clinical settings. Joint Commission on Accreditation of Healthcare Organizations,Oak Brook.
Kessler, D. P. and Geppert, J. J. (2005) The effects of competition on variation in the quality and cost of medicalcare. J. Econ. Mangmnt Strat., 14, 575–589.
Kessler, D. P. and McClellan, M. B. (2000) Is hospital competition socially wasteful? Q. J. Econ., 115, 577–615.Leyland, A. H. and Goldstein, H. (2001) Multilevel Models of Health Statistics. Chichester: Wiley.Lilford, R., Mohammed, M. A., Spiegelhalter, D. J. and Thomson, R. (2004) Use and misuse of process and
outcome data in managing performance of acute medical care: avoiding institutional stigma. Lancet, 364,1147–1154.
Luft, H. S., Garnick, D. W., Mark, D. H., Peltzman, D. J., Phibbs, C. S., Lichtenberg, E. and McPhee, S. J. (1990)Does quality influence choice of hospital? J. Am. Med. Ass., 263, 2899–2906.
Manski, C. (1993) Identification of endogenous social effects: the reaction problem. Rev. Econ. Stud., 60, 531–542.Mas-Colell, A., Whinston, M. D. and Green, J. R. (1995) Microeconomic Theory. Oxford: Oxford University
Press.McClellan, M. and Staiger, D. O. (1999) The quality of health care providers. Working Paper 7327. National
Bureau of Economic Research, Cambridge.Moscone, F., Tosetti, E. and Vittadini, G. (2012) Social interaction in patients’ hospital choice: evidence from
Italy. J. R. Statist. Soc. A, 175, 453–472.Neuman, M. D., Wirtalla, C. and Werner, R. M. (2014) Skilled nursing facility quality and hospital readmissions.
J. Am. Med. Ass., 312, 1542–1551.Propper, C., Burgess, S. and Gossage, D. (2008) Competition and quality: evidence from the NHS internal market
1991-9. Econ. J., 118, 138–170.Propper, C., Burgess, S. and Green, K. (2004) Does competition between hospitals improve the quality of care?:
Hospital death rates and the NHS internal market. J. Publ. Econ., 88, 1247–1272.Rice, N. and Leyland, A. (1996) Multilevel models: applications to health data. J. Hlth Serv. Res., 1, 154–164.Romano, P. S. and Mutter, R. (2004) The evolving science of quality measurement for hospitals: implications for
studies of competition and consolidation. Int. J. Hlth Care Finan. Econ., 4, 131–157.Scott, A. (2000) Economics of general practice. In Handbook of Health Economics (eds A. J. Culyer and J. P.
Newhouse), pp. 1175–2000. Amsterdam: Elsevier Science.Siciliani, L. and Martin, S. (2007) An empirical investigation of the impact of choice on waiting times. Hlth Econ.,
16, 763–779.Sivey, P. (2012) The effect of waiting times and distance of hospital choice for English cataract patients. Hlth
Econ., 21, 444–456.Snijders, T. A. B. (2005) Power and sample size in multilevel linear models. In Encyclopedia of Statistics in
Behavioral Science, vol. 3 (eds B. S. Everitt and D. C. Howell), pp. 1570–1573. Chichester: Wiley.Spence, M. (1973) Job market signaling. Q. J. Econ., 87, 355–374.StataCorp (2013) Stata Statistical Software: Release 13. College Station: StataCorp.Tay, A. (2003) Assessing competition in hospital care markets: the importance of accounting for quality differ-
entiation. RAND J. Econ., 34, 786–814.Varkevisser, M., van der Geest, S. A. and Schut, F. T. (2012) Do patients choose hospitals with high quality
ratings?: Empirical evidence from the market for angioplasty in the Netherlands. J. Hlth Econ., 31, 371–378.Vittadini, G., Berta, P., Martini, G. and Callea, G. (2012) The effect of a law limiting upcoding on hospital
admissions: evidence from Italy. Empir. Econ., 42, 563–582.