Embed Size (px)
DESCRIPTION
The AS-AD Model. Requires equilibrium in the goods, financial, and labor markets Aggregate supply focuses on equilibrium in the labor market Aggregate demand focuses on equilibrium in the goods and financial markets. Aggregate Supply. Captures the effects of output on the price level - PowerPoint PPT Presentation
Citation preview
The AS-AD Model Slide #1Econ 302
The The AS-ADAS-AD Model Model
Requires equilibrium in the goods, financial, and labor markets
Aggregate supply focuses on equilibrium in the labor market
Aggregate demand focuses on equilibrium in the goods and financial markets
The AS-AD Model Slide #2Econ 302
Aggregate SupplyAggregate Supply
Captures the effects of output on the price level
It is derived from equilibrium in the labor market

The AS-AD Model Slide #3Econ 302
The Determination of Aggregate Supply
Aggregate SupplyAggregate Supply
The nominal wage (W) = PeF(u,z)Price level (P) = (1+)WP = Pe(1+) F (u,z)
The AS-AD Model Slide #4Econ 302
According to:
Aggregate SupplyAggregate Supply
P = Pe(1+) F (u,z)
The price level (P) is a function of:• Pe: The expected price level• u: The unemployment rate
The AS-AD Model Slide #5Econ 302
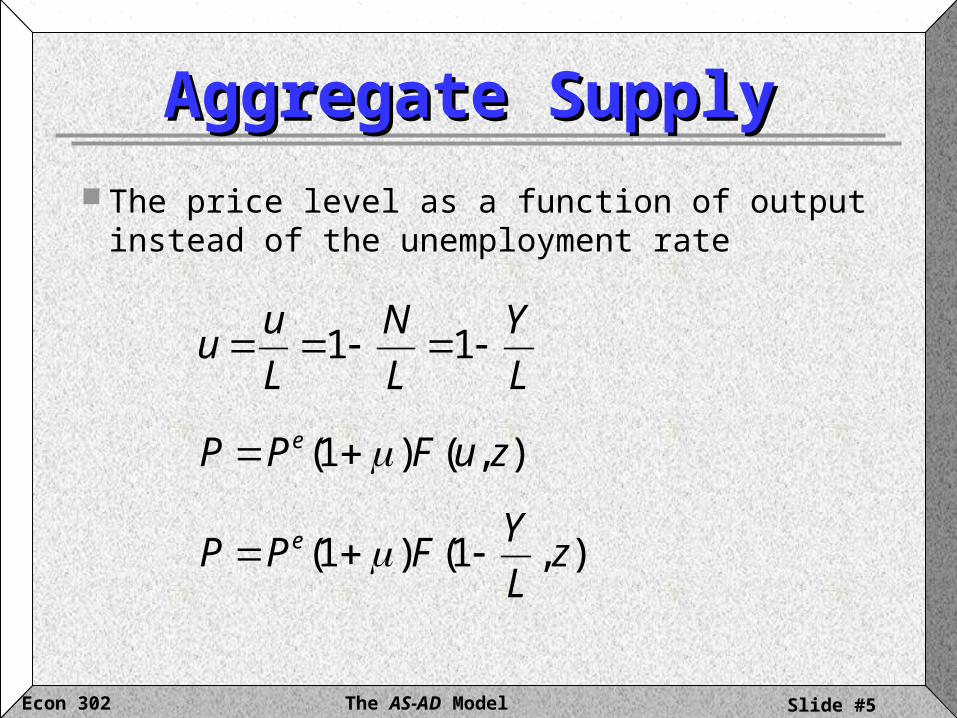
The price level as a function of output instead of the unemployment rate
Aggregate SupplyAggregate Supply
L
Y
L
N
L
uu 11
),()1( zuFPP e
),1()1( zL
YFPP e
The AS-AD Model Slide #6Econ 302
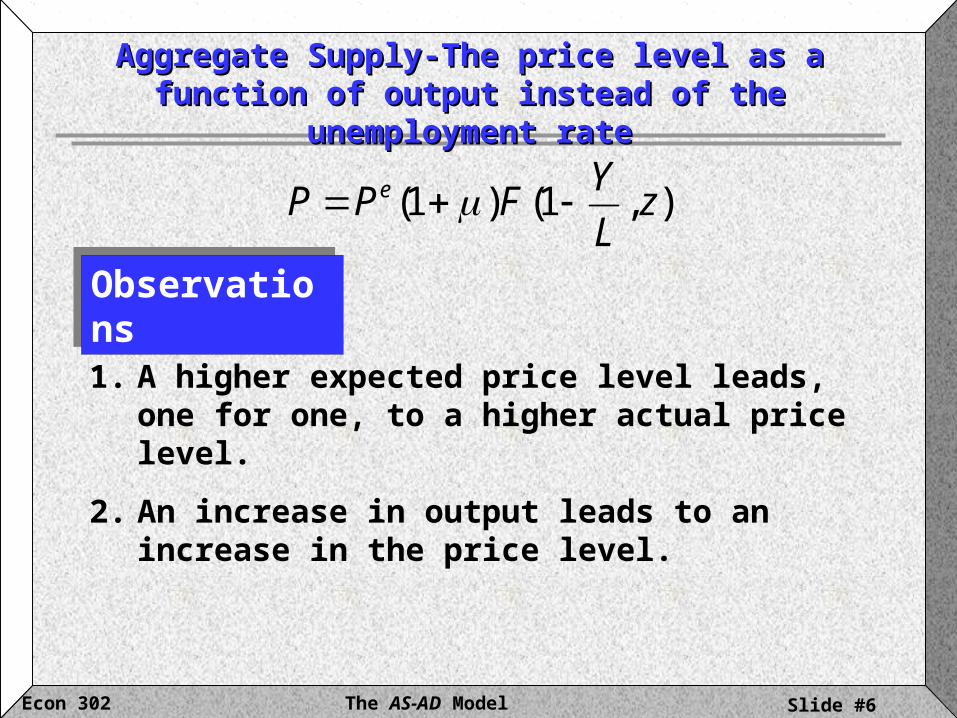
Aggregate Supply-The price level as a function of Aggregate Supply-The price level as a function of output instead of the unemployment rateoutput instead of the unemployment rate
),1()1( zL
YFPP e
ObservationsObservations
1. A higher expected price level leads, one for one, to a higher actual price level.
2. An increase in output leads to an increase in the price level.

The AS-AD Model Slide #7Econ 302
Aggregate SupplyAggregate Supply
Higher Pehigher P
PeWP
W=PeF(u,z) (PeW)
P=(1+µ)W (WP)

The AS-AD Model Slide #8Econ 302
Aggregate SupplyAggregate Supply
Higher Outputhigher P
YuWP
Y=N(YN)
)()1( uNL
Nu
The AS-AD Model Slide #9Econ 302
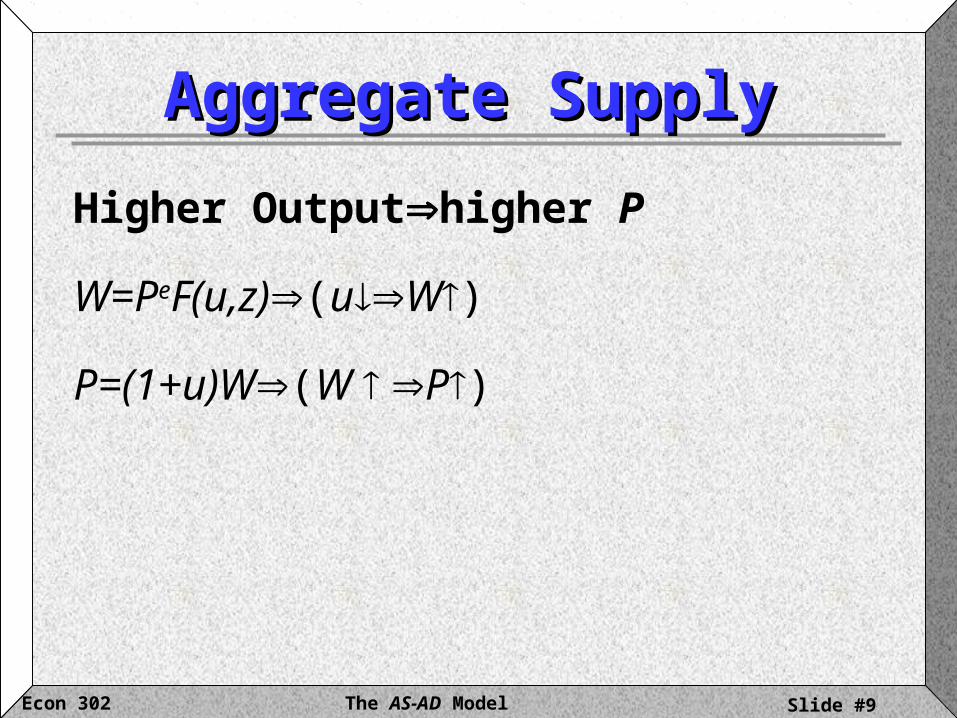
Aggregate SupplyAggregate Supply
Higher Outputhigher P
W=PeF(u,z)(uW)
P=(1+u)W(W P)
The AS-AD Model Slide #10Econ 302
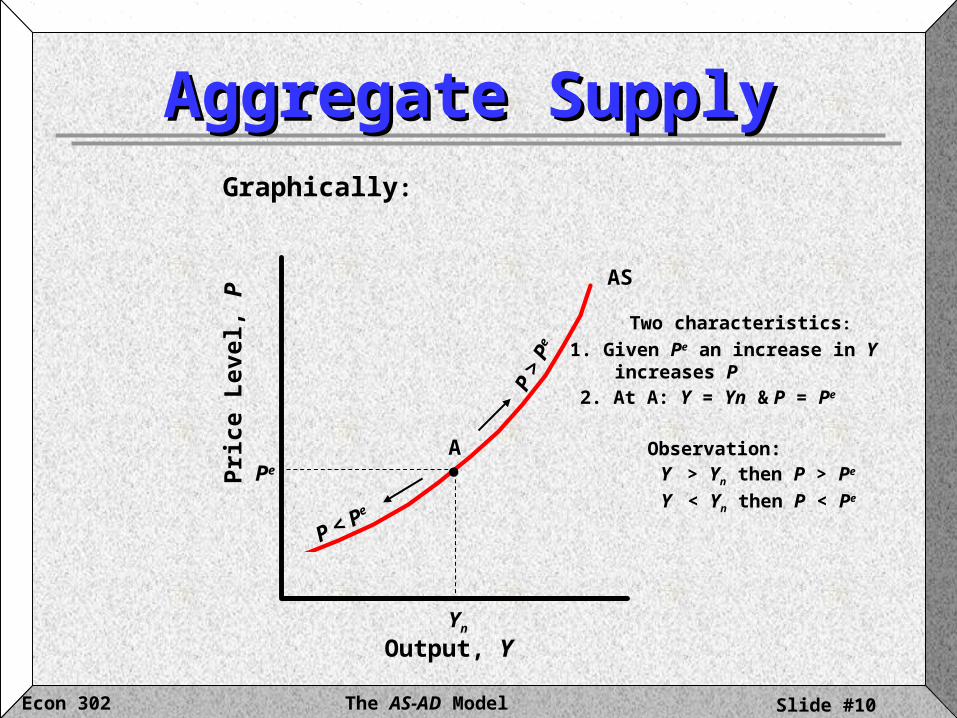
AS
Aggregate SupplyAggregate Supply
Output, Y
Pri
ce L
evel
, P
Yn
Pe
Graphically:
P >
Pe
P < Pe
A
Two characteristics:
1. Given Pe an increase in Y increases P2. At A: Y = Yn & P = Pe
Observation:Y > Yn then P > Pe
Y < Yn then P < Pe

The AS-AD Model Slide #11Econ 302
AS´ (Pe´ > Pe)
AS (Pe)
Output, Y
Pri
ce L
evel
, P
Yn
Pe
A
Aggregate SupplyAggregate Supply
Pe´
A´Observation:
Given Yn: changes in Pe shift the AS curve
Illustrating the impact of an increase in Pe

The AS-AD Model Slide #12Econ 302
Aggregate DemandAggregate Demand
Aggregate Demand:Aggregate Demand:
• Captures the effect of the price level on output
• Is derived from equilibrium in the Goods (IS) and financial (LM) markets

The AS-AD Model Slide #13Econ 302
Aggregate DemandAggregate Demand
Goods Market (IS):Goods Market (IS):
GiYITYCY ),()(
Financial Market (LM):Financial Market (LM):
)(iYLP
M

The AS-AD Model Slide #14Econ 302
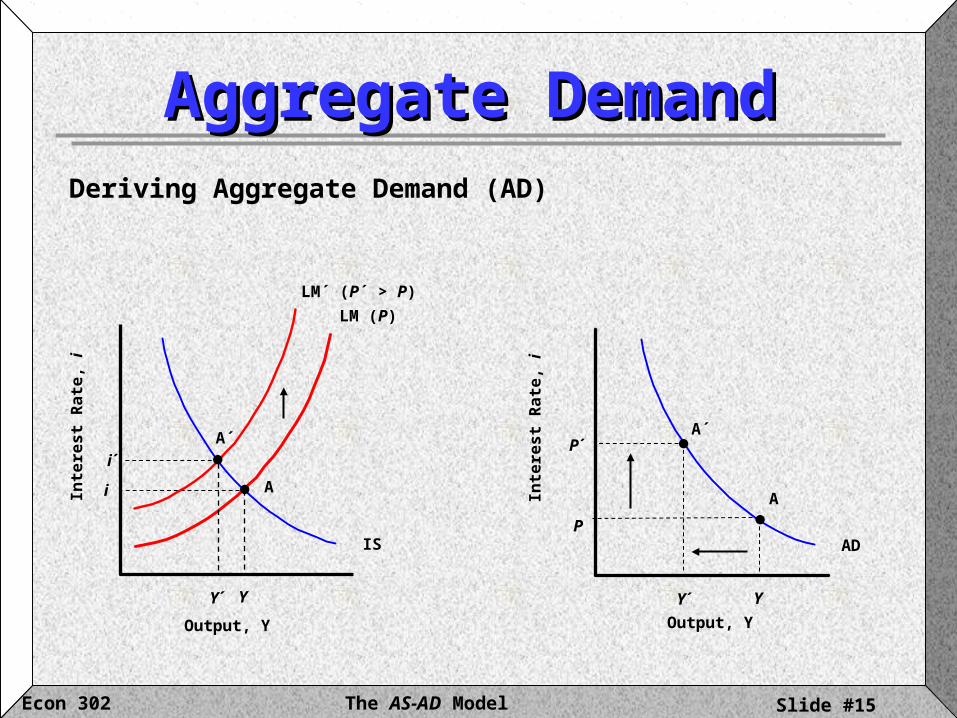
LM´ (P´ > P)
LM (P)
Output, Y
Inte
rest
Rat
e, i
IS
Y
iA
Initial Equilibrium
Aggregate DemandAggregate DemandIS – LM Equilibrium
A´i´
Y´
• falls to P
M
´P
M
• LM shifts to LM´ (P´ > P)
• Equilibrium to A´
• i to i´ & Y to Y´
• Assume P increases to P´ & M is fixed
The AS-AD Model Slide #15Econ 302
LM (P)
IS
Y
i
Inte
res
t R
ate
, i
Output, Y
Inte
res
t R
ate
, i
Output, Y
A
AD
Aggregate DemandAggregate Demand
Y
A
P
LM´ (P´ > P)
A´P´
Y´
Deriving Aggregate Demand (AD)
Y´
i´
A´
The AS-AD Model Slide #16Econ 302
LM (P)
IS
Y
i
Inte
res
t R
ate
, i
Output, Y
AD
Y
Inte
res
t R
ate
, i
Output, Y
P
A
A
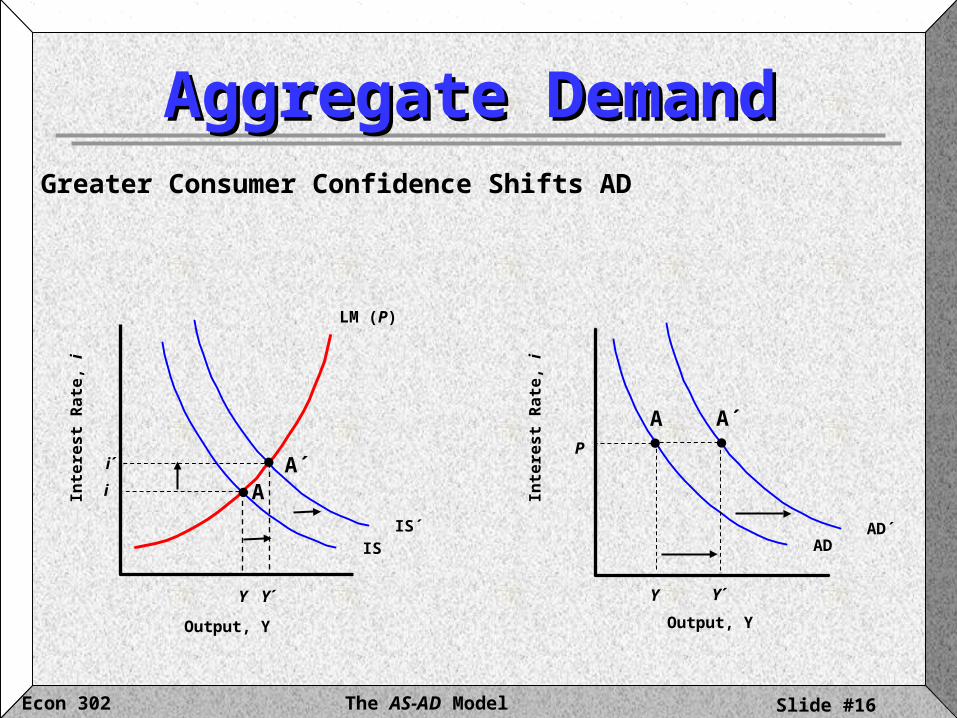
IS´ AD´
Aggregate DemandAggregate DemandGreater Consumer Confidence Shifts AD
Y´
A´
Y´
i´ A´

The AS-AD Model Slide #17Econ 302
IS
LM (P)
Y
i
Inte
res
t R
ate
, i
Output, Y
AD
Y
Inte
res
t R
ate
, i
Output, Y
P
A
A
AD´
Aggregate DemandAggregate Demand
LM´ (P)
Contractionary Monetary Policy Shifts AD
Y´
i´ A´
Y´
A´
The AS-AD Model Slide #18Econ 302
Aggregate DemandAggregate Demand
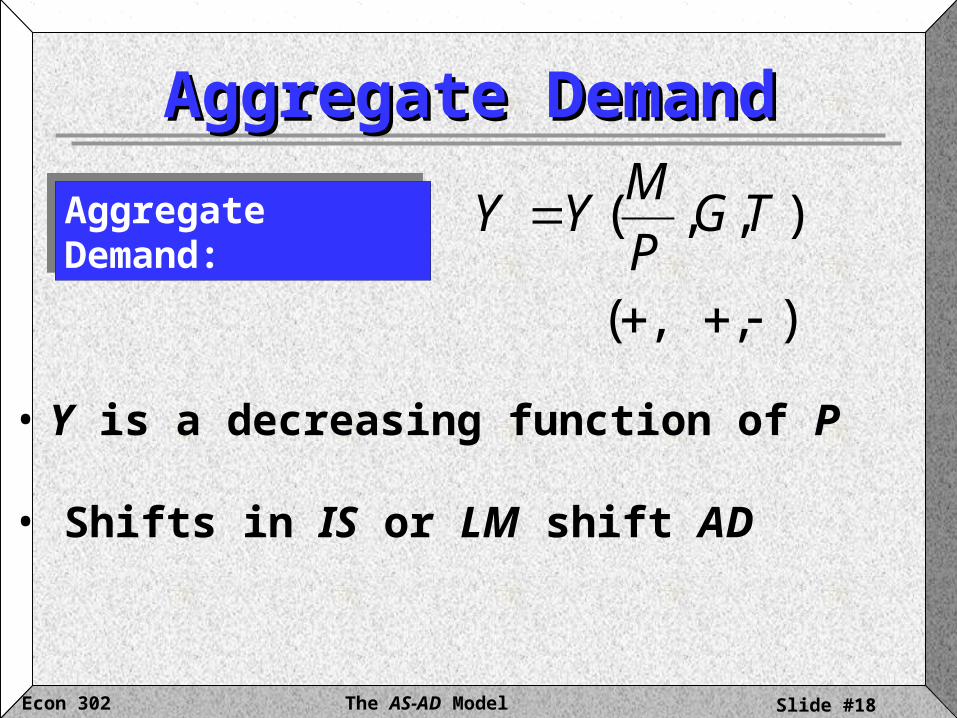
Aggregate Demand:Aggregate Demand:
),,(
),,(
TGP
MYY
• Y is a decreasing function of P
• Shifts in IS or LM shift AD

The AS-AD Model Slide #19Econ 302
Equilibrium Output in the Short Equilibrium Output in the Short and the Medium Runand the Medium Run
),1()1(:AS zL
YFPP e
),,(:AD TGP
MYY
The AS-AD Model Slide #20Econ 302
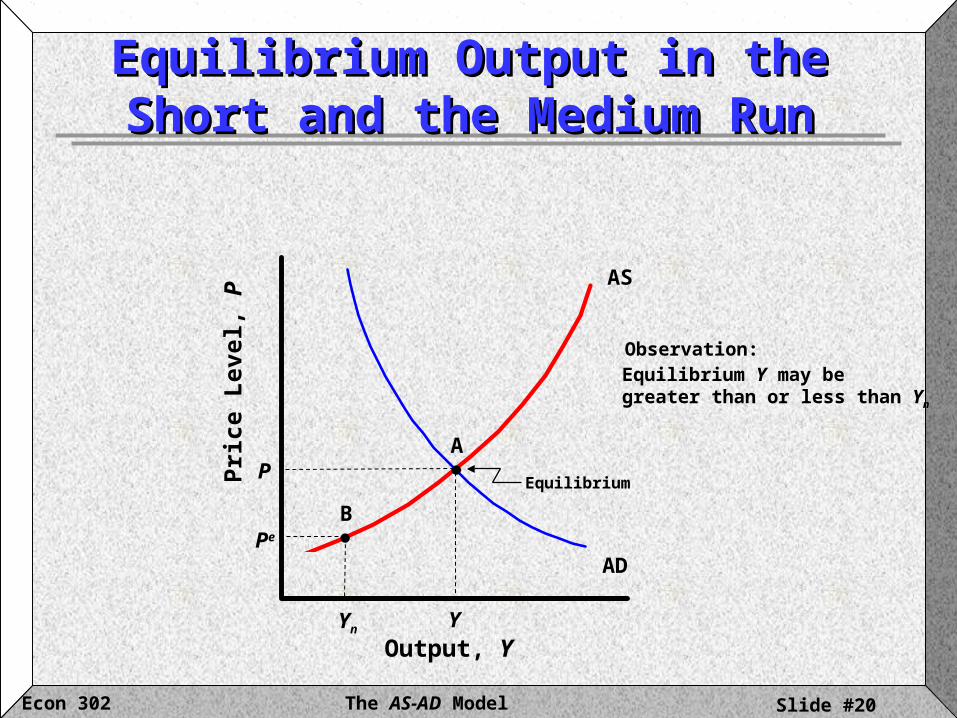
Equilibrium Output in the Short Equilibrium Output in the Short and the Medium Runand the Medium Run
AS
Output, Y
Pri
ce L
evel
, P
AD
Y
A
EquilibriumP
Pe
Yn
B
Observation:Equilibrium Y may be greater than or less than Yn
The AS-AD Model Slide #21Econ 302
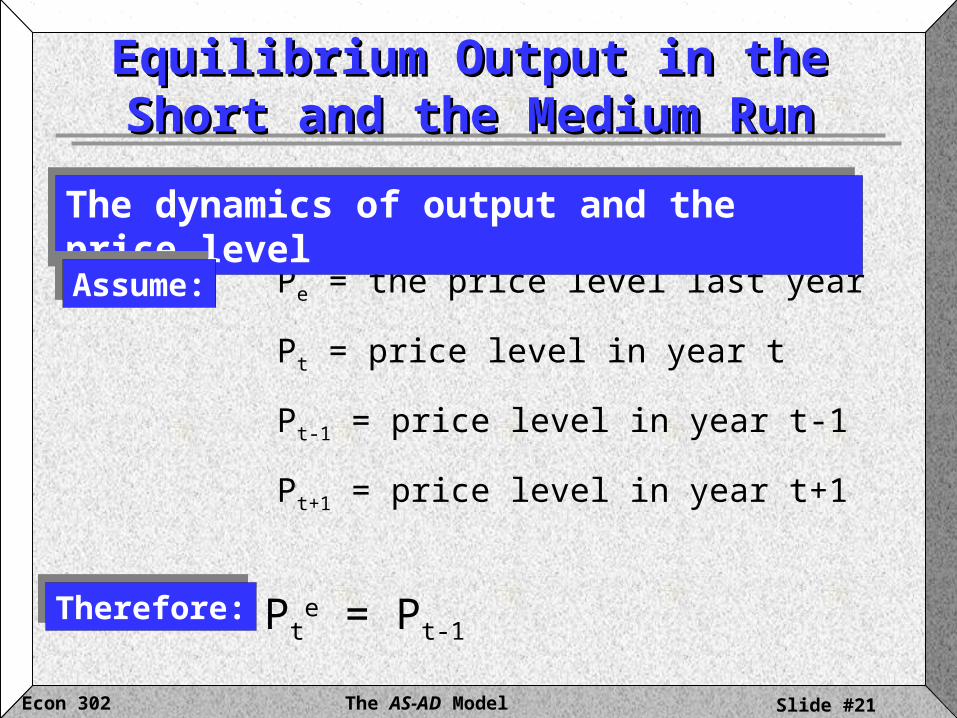
Pe = the price level last year
Pt = price level in year t
Pt-1 = price level in year t-1
Pt+1 = price level in year t+1
Equilibrium Output in the Short Equilibrium Output in the Short and the Medium Runand the Medium Run
The dynamics of output and the price levelThe dynamics of output and the price level
Assume:Assume:
Therefore:Therefore: Pte = Pt-1

The AS-AD Model Slide #22Econ 302
Equilibrium Output in the Short Equilibrium Output in the Short and the Medium Runand the Medium Run
The dynamics of output and the price levelThe dynamics of output and the price level
Given:Given:
Note:Note:
Pte = Pt-1
),1()1(:AS 1 zL
YFPP tt
),,(:AD TGP
MYY
tt
µ, z, M, G and T are assumed to be constant
The AS-AD Model Slide #23Econ 302
AS(t)
Output, Y
Price Level, P
AD(t)
Yt
Pet+1 = Pt
A
Yn
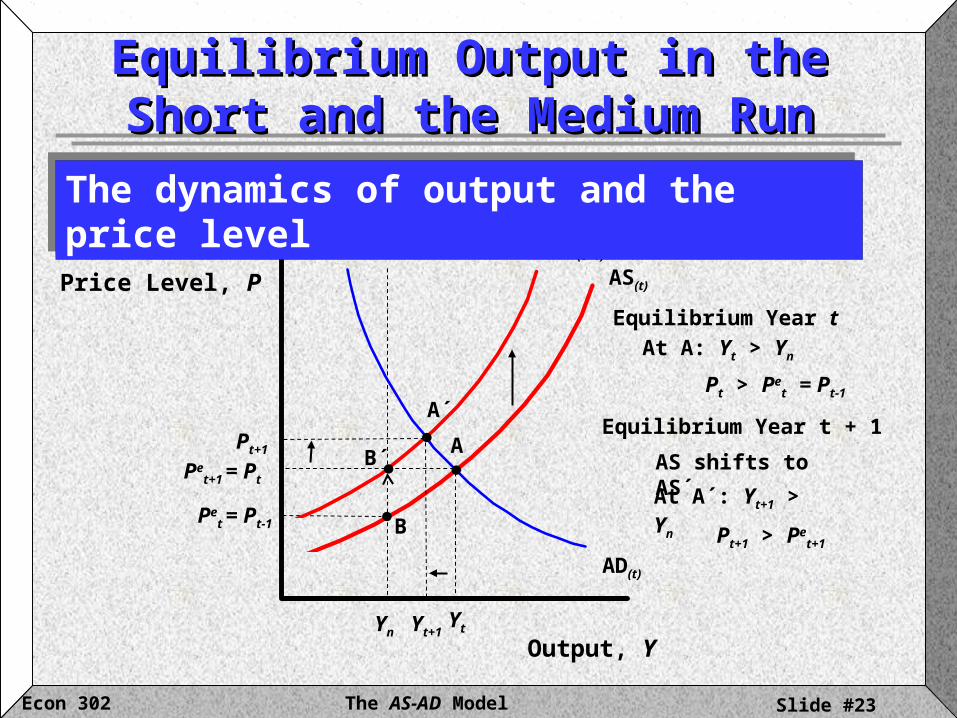
Equilibrium Year t
At A: Yt > Yn
Pt > Pet = Pt-1
Pet = Pt-1 B
AS´ (t+1)
Equilibrium Output in the Short Equilibrium Output in the Short and the Medium Runand the Medium Run
Equilibrium Year t + 1
At A´: Yt+1 > Yn
A´
Pt+1
Yt+1
Pt+1 > Pet+1
The dynamics of output and the price levelThe dynamics of output and the price level
B´ AS shifts to AS´
The AS-AD Model Slide #24Econ 302
AS
Output, Y
Price Level, P
AD
Yt
Pt
A
Yn
AS´´
Equilibrium Output in the Short Equilibrium Output in the Short and the Medium Runand the Medium Run
AS´
Yt+1
Pn
A´
A´´
Pt+1
The dynamics of output and the price levelThe dynamics of output and the price level
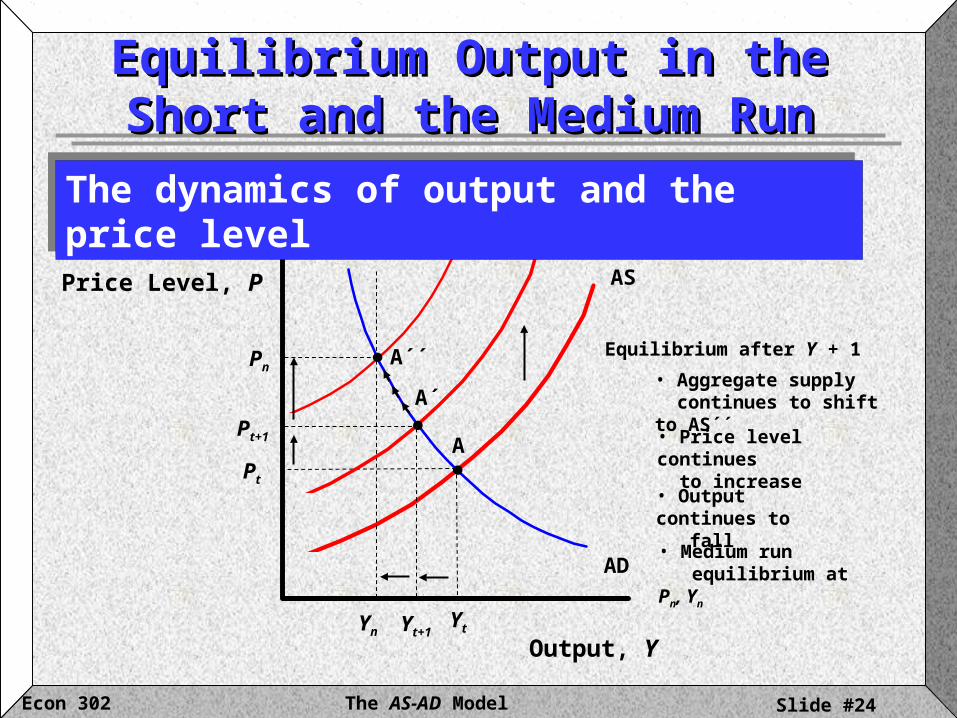
Equilibrium after Y + 1
• Output continues to fall
• Medium run equilibrium at Pn, Yn
• Aggregate supply continues to shift to AS´´
• Price level continues to increase
The AS-AD Model Slide #25Econ 302
Equilibrium Output in the Short Equilibrium Output in the Short and the Medium Runand the Medium Run
The dynamics of output and the price levelThe dynamics of output and the price level
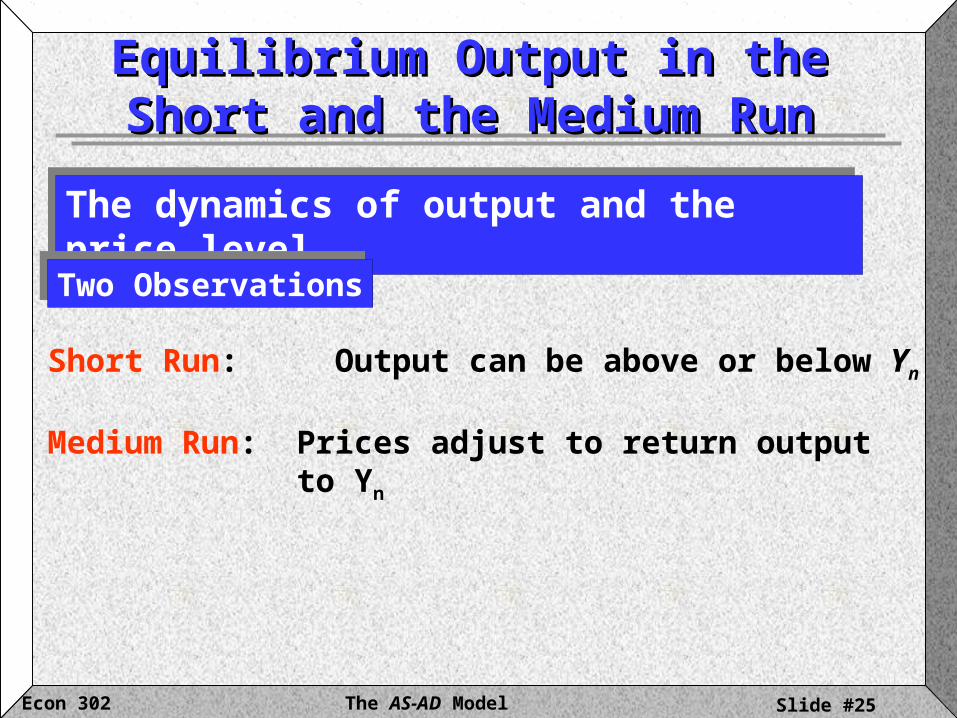
Two ObservationsTwo Observations
Short Run: Output can be above or below Yn
Medium Run: Prices adjust to return output to Yn
The AS-AD Model Slide #26Econ 302
AD
AS
Output, Y
Price Level, P
Yn
Pn A
AD´
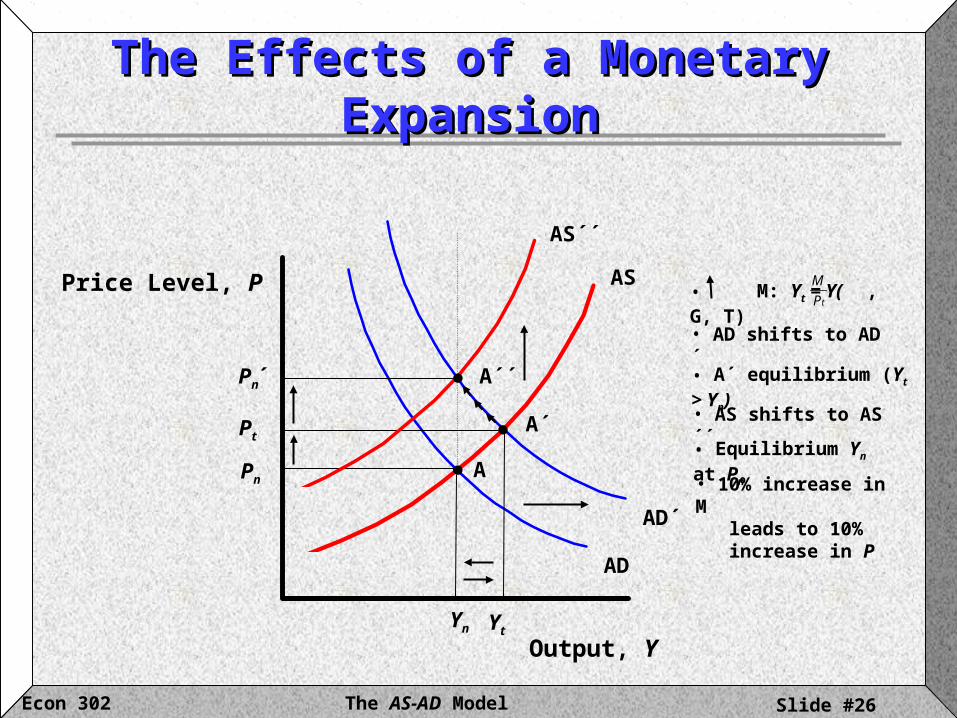
The Effects of a Monetary The Effects of a Monetary ExpansionExpansion
Yt
A´Pt
• A´ equilibrium (Yt > Yn)
AS´´
A´´Pn´
• AD shifts to AD´
• M: Yt = Y( , G, T)tP
M
• AS shifts to AS´´
• Equilibrium Yn at Pn
• 10% increase in M leads to 10% increase in P
The AS-AD Model Slide #27Econ 302
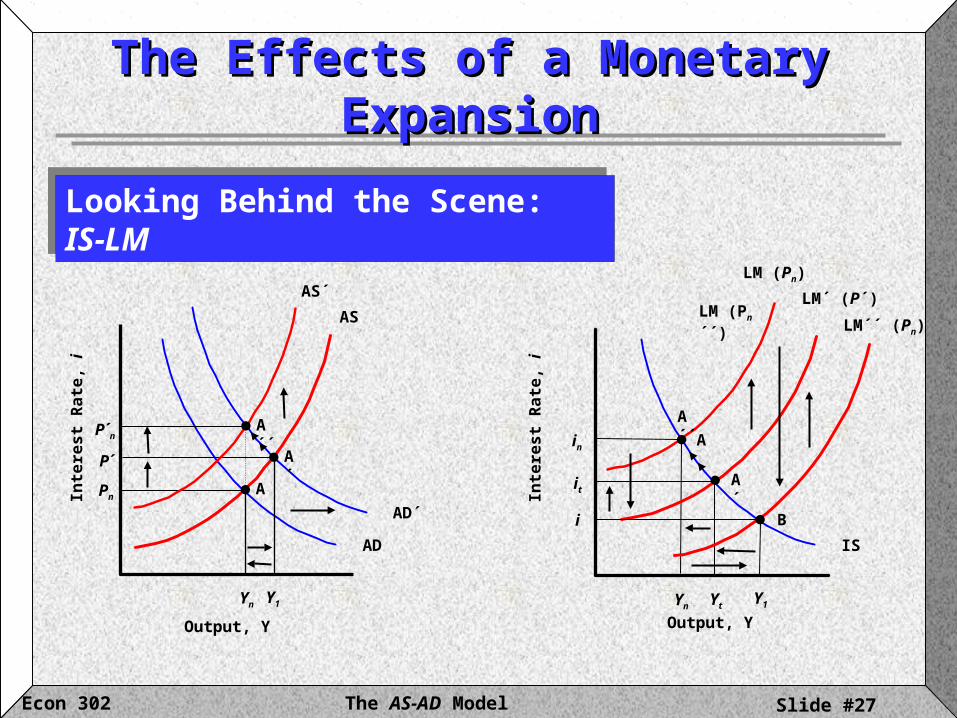
LM (Pn)
Yn
Pn
AS
AD IS
Inte
res
t R
ate
, i
Output, Y
Inte
res
t R
ate
, i
Output, Y
A
in
Yn
A
LM´ (P´)
A´
Yt
it
LM´´ (Pn)
i
Y1
BAD´
The Effects of a Monetary The Effects of a Monetary ExpansionExpansion
Looking Behind the Scene: IS-LMLooking Behind the Scene: IS-LM
Y1
P´ A´
AS´
P´nA´´ A´´
LM (Pn´´)
The AS-AD Model Slide #28Econ 302
The Effects of a Monetary The Effects of a Monetary ExpansionExpansion
A Summary
The Neutrality of MoneyThe Neutrality of Money
Short-run: M Y and P The relative change in P and Y depends on the slope of AS
Medium run: Prices continue to increase until P and Y return to their original level, i.e., money is neutral
The AS-AD Model Slide #29Econ 302
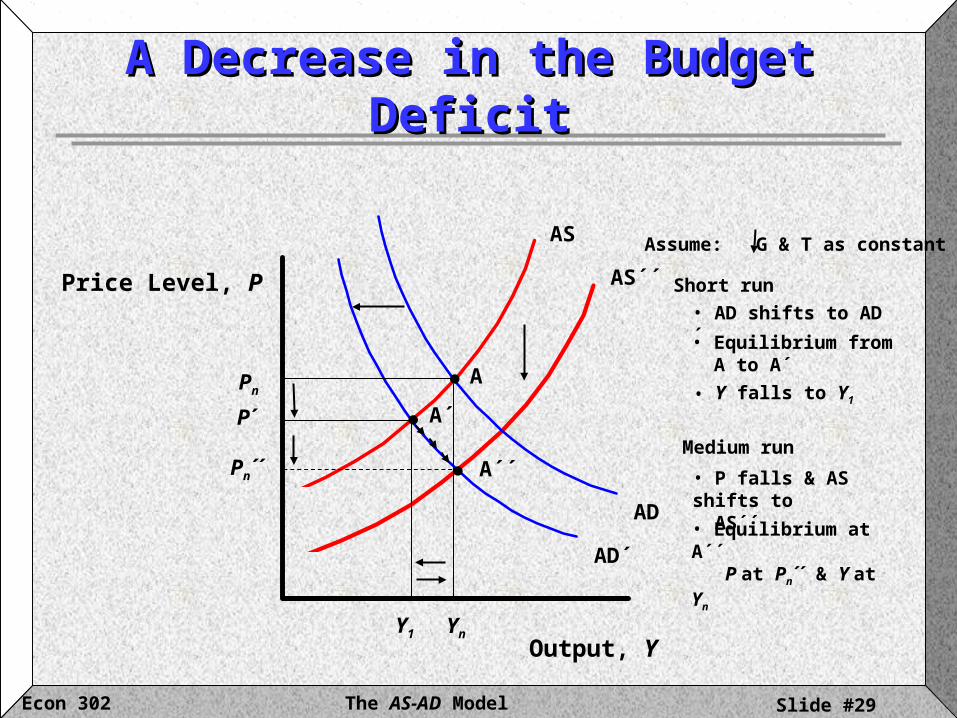
A Decrease in the Budget DeficitA Decrease in the Budget Deficit
AD´
AS´´
AD
AS
Output, Y
Price Level, P
Yn
PnA
Y1
A´P´
A´´Pn´´
Assume: G & T as constant
• Equilibrium from A to A´
• AD shifts to AD´
• Y falls to Y1
Short run
• P falls & AS shifts to AS´´
• Equilibrium at A´´ P at Pn´´ & Y at Yn
Medium run

The AS-AD Model Slide #30Econ 302
AD
AS
Yn
PnA
IS
LM
Ai
Yn
Output, Y
Pri
ce
Le
ve
l, P
Inte
res
t R
ate
, i
Output, Y
AD´
Y1
A´P´
IS´
Y´
i´ B
LM´´
i´´ A´´
AS´´
Pn´´ A´´
LM´
Y2
A´i1´
A Decrease in the Budget DeficitA Decrease in the Budget Deficit
The Dynamic Effects of a Decrease in the Budget DeficitThe Dynamic Effects of a Decrease in the Budget Deficit
The AS-AD Model Slide #31Econ 302
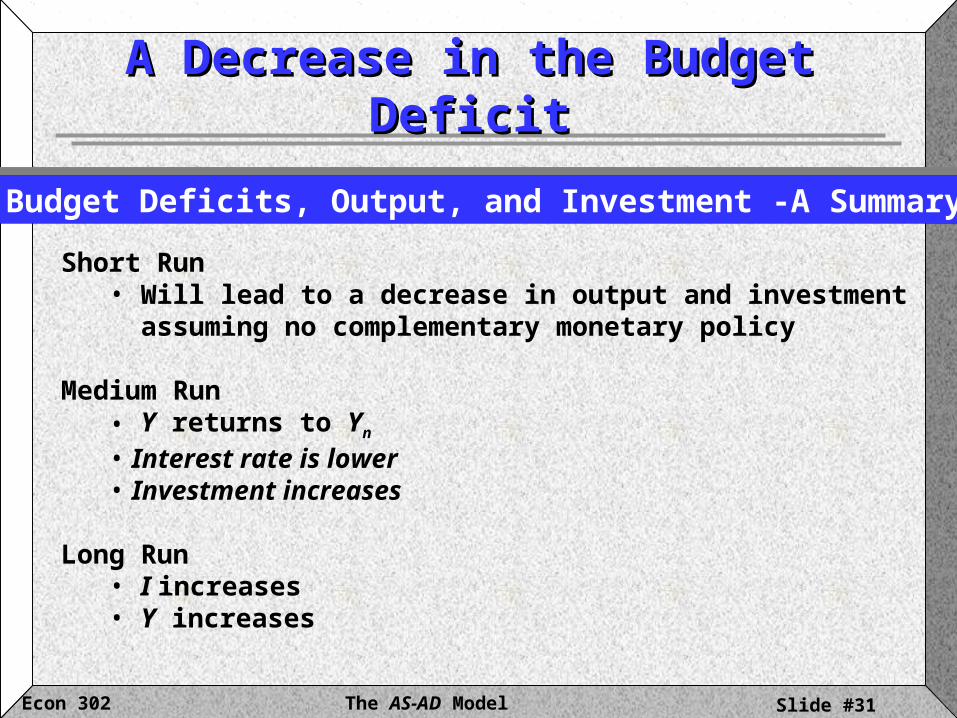
A Decrease in the Budget DeficitA Decrease in the Budget Deficit
Budget Deficits, Output, and Investment -A SummaryBudget Deficits, Output, and Investment -A Summary
Short Run• Will lead to a decrease in output and investment assuming no complementary monetary policy
Medium Run• Y returns to Yn • Interest rate is lower• Investment increases
Long Run• I increases• Y increases
The AS-AD Model Slide #32Econ 302
Rea
l W
age,
W/P
WS
11
PS ( )
un Unemployment Rate, u
A
´1
1
PS´ ( ´ > )
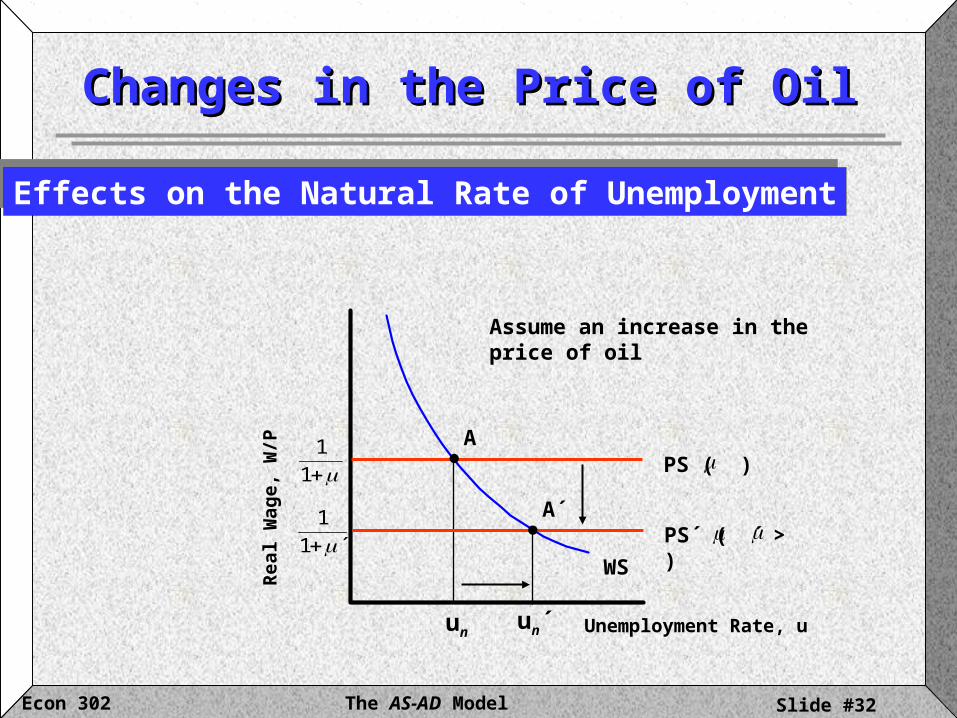
Changes in the Price of OilChanges in the Price of Oil
Effects on the Natural Rate of UnemploymentEffects on the Natural Rate of Unemployment
un´
A´
Assume an increase in the price of oil

The AS-AD Model Slide #33Econ 302
AS´
AS
Output, Y
Price Level, P
AD
APt-1
Yn
Changes in the Price of OilChanges in the Price of Oil
The Dynamics of AdjustmentThe Dynamics of AdjustmentAS´´
A´´Pt+n
A´P´
Y´
When oil prices increase:
• Yn decreases to Yn´
• AS shifts up
• A to A´ short-run change
• A to A´´ medium-run change
• increases
B
Y´n