Embed Size (px)
Citation preview
www.timetric.com
Emerging Opportunities in
Thailand’s Cards and
Payments Industry
Market Size, Trends and Drivers,
Strategies, Products and Competitive
Landscape
Report Code: VR0904MR
Published Date: March 2013
TABLE OF CONTENTS
Emerging Opportunities in Thailand’s Cards and Payments Industry Page 2
© Timetric. This product is licensed and is not to be photocopied Published: March 2013
TABLE OF CONTENTS
1 Executive Summary .............................................................................................................................. 8 2 Market Attractiveness and Future Prospects of Cards and Payments Industry ............................ 9 3 Analysis of Thailand Cards and Payments Industry Drivers .......................................................... 11
3.1 Infrastructure Drivers ............................................................................................................................. 12
3.1.1 True Money mobile payment solutions .................................................................................................. 12
3.1.2 M-Pesa .................................................................................................................................................. 12
3.1.3 Smart Purse ........................................................................................................................................... 12
3.1.4 EMV Cards ............................................................................................................................................ 12
3.1.5 NFC and contactless payments ............................................................................................................. 12
3.1.6 Growing number of ATMs ...................................................................................................................... 13
3.1.7 Growing number of POSs ...................................................................................................................... 14
3.2 Business Drivers .................................................................................................................................... 15
3.2.1 Retail sector ........................................................................................................................................... 15
3.2.2 Growth in E-commerce .......................................................................................................................... 15
3.2.3 Growing mobile commerce .................................................................................................................... 16
3.2.4 Outbound business and leisure travel and tourism ............................................................................... 17
3.3 Other Growth Drivers ............................................................................................................................. 18
3.3.1 GDP growth ........................................................................................................................................... 18
3.3.2 Inflation rate ........................................................................................................................................... 19
3.3.3 Consumer Confidence Index ................................................................................................................. 20
3.4 Card Fraud Statistics ............................................................................................................................. 21
3.5 Regulatory Framework .......................................................................................................................... 22
3.5.1 Regulation on credit cards ..................................................................................................................... 22
3.5.2 Regulations in credit card for foreigners ................................................................................................ 22
3.5.3 Policy responses relating to internet and mobile payments .................................................................. 22
3.5.4 Restructuring of payment systems fees and charges ........................................................................... 23
4 Emerging Consumer Attitudes and Trends ...................................................................................... 24
4.1 Market Segmentation and Targeting ..................................................................................................... 24
4.2 Retail Segment ...................................................................................................................................... 25
4.2.1 Targeting high net worth individuals (HNWIs) ....................................................................................... 25
4.2.2 Cards targeted at outbound leisure tourists .......................................................................................... 26
4.2.3 Cards targeted towards niche segments ............................................................................................... 27
4.3 Corporate Segment ............................................................................................................................... 27
4.3.1 Businesses and departments ................................................................................................................ 27
4.4 Consumer Preference ........................................................................................................................... 28
4.4.1 Price ....................................................................................................................................................... 28
4.4.2 Services ................................................................................................................................................. 28
4.4.3 Convenience .......................................................................................................................................... 29
4.5 Online Buying Behaviour ....................................................................................................................... 30
4.6 Preferred Payments Methods ................................................................................................................ 31
5 Competitive Landscape and Industry Dynamics ............................................................................. 32
5.1 Market Share Analysis by Payment Channels ...................................................................................... 32
TABLE OF CONTENTS
Emerging Opportunities in Thailand’s Cards and Payments Industry Page 3
© Timetric. This product is licensed and is not to be photocopied Published: March 2013
5.1.1 Overview of payment channels ............................................................................................................. 32
5.1.2 Credit transfers ...................................................................................................................................... 34
5.1.3 Direct debit ............................................................................................................................................. 35
5.1.4 Cards payments..................................................................................................................................... 36
5.1.5 Check payments .................................................................................................................................... 37
5.2 Debit Cards ............................................................................................................................................ 38
5.2.1 By bank .................................................................................................................................................. 38
5.2.2 By scheme ............................................................................................................................................. 39
5.3 Credit Cards ........................................................................................................................................... 40
5.3.1 By bank .................................................................................................................................................. 40
5.3.2 By scheme ............................................................................................................................................. 41
5.4 Charge Cards ........................................................................................................................................ 42
6 Strategies Adopted by Key Operators .............................................................................................. 43
6.1 Market Entry Strategies ......................................................................................................................... 43
6.2 Marketing / Product Strategy ................................................................................................................. 44
6.2.1 Credit cards ........................................................................................................................................... 45
6.2.2 Debit cards ............................................................................................................................................. 48
6.2.3 Prepaid cards ......................................................................................................................................... 48
6.3 Pricing Strategies................................................................................................................................... 49
6.3.1 Comparison between the credit cards pricing strategy of Bangkok Bank and Krungsri Bank .............. 49
6.3.2 Comparison between the pricing strategy of Bangkok Bank and Krungsri Bank .................................. 49
7 Market Size and Growth Potential of the Payment Card Industry .................................................. 50
7.1 Market Share Analysis by Type of Card ................................................................................................ 50
7.2 Total Market Size and Forecast of the Card Industry ............................................................................ 52
7.2.1 Analysis by number of cards ................................................................................................................. 52
7.2.2 Analysis by transaction value ................................................................................................................ 53
7.2.3 Analysis by transaction volume ............................................................................................................. 54
7.3 Debit Cards Category Size and Forecast .............................................................................................. 55
7.3.1 Analysis by number of cards ................................................................................................................. 55
7.3.2 Analysis by transaction value ................................................................................................................ 56
7.3.3 Analysis by transaction volume ............................................................................................................. 57
7.3.4 Other key performance indicators ......................................................................................................... 58
7.4 Prepaid Card Category Size and Forecast ............................................................................................ 60
7.4.1 Analysis by segments – open and closed-loop cards ........................................................................... 61
7.4.2 Analysis by transaction value ................................................................................................................ 63
7.5 Charge Card Category Size and Forecast ............................................................................................ 64
7.5.1 Analysis by number of cards ................................................................................................................. 64
7.5.2 Analysis by transaction value ................................................................................................................ 65
7.5.3 Analysis by transaction volume ............................................................................................................. 66
7.5.4 Frequency of use ................................................................................................................................... 67
7.6 Credit Card Category Size and Forecast .............................................................................................. 68
7.6.1 Analysis by number of cards ................................................................................................................. 68
7.6.2 Analysis by transaction value ................................................................................................................ 69

TABLE OF CONTENTS
Emerging Opportunities in Thailand’s Cards and Payments Industry Page 4
© Timetric. This product is licensed and is not to be photocopied Published: March 2013
7.6.3 Analysis by transaction volume ............................................................................................................. 70
7.6.4 Other key performance indicators ......................................................................................................... 71
8 Company Profiles, Product, and Marketing Strategies ................................................................... 73
8.1 Bangkok Bank ........................................................................................................................................ 73
8.1.1 Strategies ............................................................................................................................................... 73
8.1.2 Bangkok Bank key financials ................................................................................................................. 74
8.2 Krungthai Bank ...................................................................................................................................... 75
8.2.1 Strategies ............................................................................................................................................... 75
8.2.2 Krungthai Bank key financials ............................................................................................................... 76
8.3 Krungsri Bank ........................................................................................................................................ 77
8.3.1 Strategies ............................................................................................................................................... 77
8.3.2 Krungsri Bank key financials ................................................................................................................. 78
9 Appendix .............................................................................................................................................. 79
9.1 Methodology .......................................................................................................................................... 79
9.2 Contact Us ............................................................................................................................................. 80
9.3 About Timetric ........................................................................................................................................ 80
9.3.1 Timetric’s approach ............................................................................................................................... 80
9.4 Services ................................................................................................................................................. 81
9.5 Disclaimer .............................................................................................................................................. 82
9.5.1 Our approach ......................................................................................................................................... 83
9.6 Services ................................................................................................................................................. 83
9.7 Disclaimer .............................................................................................................................................. 84

TABLE OF CONTENTS
Emerging Opportunities in Thailand’s Cards and Payments Industry Page 5
© Timetric. This product is licensed and is not to be photocopied Published: March 2013
LIST OF FIGURES
Figure 1: Growth of Payment Cards, Review Period (2008–2012) and Forecast Period (2013–2017) in Thailand ........................................ 9 Figure 2: Growth Potential of Thailand Cards and Payments Industry by Area of Use ............................................................................... 10 Figure 3: Thailand Cards and Payments Industry Drivers .......................................................................................................................... 11 Figure 4: Number of ATMs in Thailand(Thousands), 2008−2017 ............................................................................................................... 13 Figure 5: Number of POS Terminals in Thailand (Thousands), 2008−2017 ............................................................................................... 14 Figure 6: Retail Sales Index in Thailand (%), 2011−2012........................................................................................................................... 15 Figure 7: Proportion of Mobile Purchases made through Smartphones in Thailand (%), 2011 ................................................................... 16 Figure 8: Outbound Expenditure on Travel and Tourism (THB Billion), 2008–2012 .................................................................................... 17 Figure 9: GDP Growth Rate (%), 2008–2017 ............................................................................................................................................. 18 Figure 10: Thailand Inflation (%), 2008–2017 ............................................................................................................................................ 19 Figure 11: Consumer Confidence Index, 2011−2013 ................................................................................................................................. 20 Figure 12: Thailand Card Fraud Statistics (THB Million), 2008–2012 ......................................................................................................... 21 Figure 13: Restructuring of Fees and Charges by the Thai Banker’s Association and the Central Bank ..................................................... 23 Figure 14: Thai Cards and Payments Industry Segmentation by Card Type .............................................................................................. 24 Figure 15: Total HNWIs Population, 2012 .................................................................................................................................................. 25 Figure 16: Cards for Premium Customers in Thailand ................................................................................................................................ 26 Figure 17: Travel and Tourism Cards in Thailand ...................................................................................................................................... 26 Figure 18: Corporate Cards Offered in Thailand ........................................................................................................................................ 27 Figure 19: Consumer Preferences According to Type of Card ................................................................................................................... 28 Figure 20: Type of Goods or Services Purchased Online, 2010 ................................................................................................................. 30 Figure 21: Expenditure on Goods and Services Purchased Online, Per Individual, 2010 ......................................................................... 30 Figure 22: Share of Different Online Payment Options in Thailand (%), 2010 ............................................................................................ 31 Figure 23: Shares of Payment Channels in Thailand (%), 2012 ................................................................................................................. 33 Figure 24: Thai Credit Transfers (THB Million), 2008–2012 ....................................................................................................................... 34 Figure 25: Thai Direct Debits (THB Million), 2008–2012 ............................................................................................................................ 35 Figure 26: Thai Cards Payments (THB Million), 2008–2012 ....................................................................................................................... 36 Figure 27: Thai Check Payments (THB Million), 2008–2012 ...................................................................................................................... 37 Figure 28: Thai Debit Cards by Issuing Banks (%), 2011 ........................................................................................................................... 38 Figure 29: Thai Debit Card Category Share by Scheme (%), 2011 ............................................................................................................ 39 Figure 30: Thai Credit Card Category Shares by Bank (%), 2011 .............................................................................................................. 40 Figure 31: Thai Credit Card Category Shares by Scheme (%), 2011 ......................................................................................................... 41 Figure 32: Thai Charge Card Category Shares by Scheme (%), 2011 ....................................................................................................... 42 Figure 33: Market Entry Strategies of Foreign Banks in Thailand, 2012 ..................................................................................................... 43 Figure 34: Thailand Marketing Strategies Based on Card Type ................................................................................................................. 44 Figure 35: Benefits Offered by Krungsri Bank ............................................................................................................................................ 45 Figure 36: Type of Business Credit Cards Offered by Banks in Thailand ................................................................................................... 47 Figure 37: Credit Card Pricing Strategies of Various Service Providers ..................................................................................................... 49 Figure 38: Debit Card Pricing Strategies of Various Service Providers ....................................................................................................... 49 Figure 39: Thai Cards Industry by Type of Card (%), 2008–2017 ............................................................................................................... 51 Figure 40: Thai Cards Industry Size by Volume (Thousands), 2008–2017 ................................................................................................. 52 Figure 41: Thai Cards Industry Size by Transaction Value (THB Million), 2008–2017 ................................................................................ 53 Figure 42: Thai Cards Industry Size by Transaction Volume (Million), 2008–2017 ..................................................................................... 54 Figure 43: Thai Debit Card Category Size (Thousands), 2008–2017 ......................................................................................................... 55 Figure 44: Thai Debit Card Category Size (THB Million), 2008–2017 ......................................................................................................... 56 Figure 45: Thai Debit Card Category Size by Transaction Volume (Million), 2008–2017 ............................................................................ 57 Figure 46: Thai Card Category Size by Frequency of Use (Annual Transactions Per Card), 2008–2017 ................................................... 58 Figure 47: Debit Card Use at ATMs and POS Terminals (Thousands), 2008–2017 ................................................................................... 59 Figure 48: Thai Prepaid Card Category Size (Thousands), 2008–2017 ..................................................................................................... 60 Figure 49: Thai Open-Loop Prepaid Cards Category Size (Thousands), 2008–2017 ................................................................................. 61 Figure 50: Thai Closed-Loop Prepaid Cards Category Size (Thousands), 2008–2017 ............................................................................... 62 Figure 51: Thai Prepaid Cards Category Size (THB Million), 2008–2017 ................................................................................................... 63 Figure 52: Thai Charge Card Category Size (Thousands), 2008–2017 ...................................................................................................... 64 Figure 53: Thai Charge Card Category Size (THB Million), 2008–2017 ..................................................................................................... 65 Figure 54: Thai Charge Card Category Size by Transaction Volume (Million), 2008–2017......................................................................... 66 Figure 55: Thai Charge Card Category Size by Frequency of Use (Annual Transactions Per Card), 2008–2017 ................................... 67 Figure 56: Thai Credit Card Category Size by Volume (Thousands), 2008–2017 ....................................................................................... 68 Figure 57: Thai Credit Card Category Size by Transaction Value (THB Million), 2008–2017 ...................................................................... 69 Figure 58: Thai Credit Card Category Size by Transaction Volume (Million), 2008–2017 ........................................................................... 70 Figure 59: Thai Credit Card Category Size by Frequency of Use, 2008–2017 ........................................................................................... 71 Figure 60: Thai Credit Card Category Size by Average Transaction Value (THB), 2008–2017 .................................................................. 72 Figure 61: Cards Offered by Bangkok Bank ............................................................................................................................................... 73 Figure 62: Cards Offered by Krungthai Bank ............................................................................................................................................. 75 Figure 63: Cards Offered by Krungsri Bank ............................................................................................................................................... 77

TABLE OF CONTENTS
Emerging Opportunities in Thailand’s Cards and Payments Industry Page 6
© Timetric. This product is licensed and is not to be photocopied Published: March 2013
Figure 64: Benefits Offered by Krungsri Bank on Central Credit Card ........................................................................................................ 78
TABLE OF CONTENTS
Emerging Opportunities in Thailand’s Cards and Payments Industry Page 7
© Timetric. This product is licensed and is not to be photocopied Published: March 2013
LIST OF TABLES
Table 1: Thai Payment Channels (THB Million), 2008–2012 ...................................................................................................................... 32 Table 2: Thai Cards Industry by Type of Card (Thousands), 2008–2017 ................................................................................................... 50 Table 3: Thai Cards Industry Size by Volume (Thousands), 2008–2017 .................................................................................................... 52 Table 4: Thai Cards Industry Size by Transaction Value (THB Million), 2008–2017 ................................................................................... 53 Table 5: Thai Cards Industry Size by Transaction Value (US$ Million), 2008–2017 ................................................................................... 53 Table 6: Thai Cards Industry Size by Transaction Volume (Million), 2008–2017 ........................................................................................ 54 Table 7: Thai Debit Card Category Size (Thousands), 2008–2017 ............................................................................................................ 55 Table 8: Thai Debit Card Category Size (THB Million), 2008–2017 ............................................................................................................ 56 Table 9: Thai Debit Card Category Size (US$ Million), 2008–2017 ............................................................................................................ 56 Table 10: Thai Debit Card Category Size by Transaction Volume (Million), 2008–2017 ............................................................................. 57 Table 11: Thai Card Category Size by Frequency of Use (Annual Transactions Per Card ), 2008–2017 .................................................... 58 Table 12: Thai Prepaid Card Category Size (Thousands), 2008–2017 ....................................................................................................... 60 Table 13: Thai Open-Loop Prepaid Cards Category Size (Thousands), 2008–2017 .................................................................................. 61 Table 14: Thai Closed-Loop Prepaid Cards Category Size (Thousands), 2008–2017 ................................................................................ 62 Table 15: Thai Prepaid Cards Category Size (THB Million), 2008–2017 .................................................................................................... 63 Table 16: Thai Prepaid Cards Category Size (US$ Million), 2008–2017 .................................................................................................... 63 Table 17: Thai Charge Card Category Size (Thousands), 2008–2017 ....................................................................................................... 64 Table 18: Thai Charge Card Category Size (THB Million), 2008–2017 ....................................................................................................... 65 Table 19: Thai Charge Card Category Size (US$ Million), 2008–2017 ....................................................................................................... 65 Table 20: Thai Charge Card Category Size by Transaction Volume (Million), 2008–2017 .......................................................................... 66 Table 21: Thai Charge Card Category Size by Frequency of Use (Annual Transactions Per Card), 2008–2017 ........................................ 67 Table 22: Thai Credit Card Category Size by Volume (Thousands), 2008–2017 ........................................................................................ 68 Table 23: Thai Credit Card Category Size by Transaction Value (THB Million), 2008–2017 ....................................................................... 69 Table 24: Thai Credit Card Category Size by Transaction Value (US$ Million), 2008–2017 ....................................................................... 69 Table 25: Thai Credit Card Category Size by Transaction Volume (Million), 2008–2017 ............................................................................ 70 Table 26: Thai Credit Card Category Size by Frequency of Use (Annual Transactions Per Card), 2008–2017 .......................................... 71 Table 27: Thai Credit Card Category Size by Average Transaction Value (THB), 2008–2017 .................................................................... 72 Table 28: Thai Credit Card Category Size by Average Transaction Value (US$), 2008–2017 .................................................................... 72 Table 29: Bangkok Bank Key Financial Indicators, 2010–2011 .................................................................................................................. 74 Table 30: Krungthai Bank Key Financial Indicators, 2010–2011 ................................................................................................................ 76 Table 31: Krungsri Bank Key Financial Indicators, 2010–2011 .................................................................................................................. 78
EXECUTIVE SUMMARY
Emerging Opportunities in Thailand’s Cards and Payments Industry Page 8
© Timetric. This product is licensed and is not to be photocopied Published: March 2013
1 Executive Summary
Thailand is an export-driven economy. Indeed, exports accounted for more than half of the nation’s GDP in
2011. The increasingly diversified manufacturing sector is one of the largest contributors to growth, followed
by the travel tourism sector which accounted for approximately X% of the country’s GDP in 2011.
Thailand cards and payments industry fosters positive growth potential
The card industry as a whole grew at a CAGR of XX.XX% during the review period and is expected to post a
CAGR of X.XX% over the forecast period. The growth was mainly driven by the prepaid card category, which
recorded a CAGR of XX.XX%, followed by the debit cards category which grew at a CAGR of XX.XX%, and
the charge and credit cards categories which grew at respective CAGRs of X.XX% and X.XX%. In volume
terms, the industry grew at a CAGR of XX.XX% during the review period, from XX.X million cards in
circulation in 2008 to XX.X million cards in 2012. In value terms, the industry grew at a CAGR of XX.XX%
during the review period, from THBX.X trillion (US$XXX.X trillion) in 2008 to THBX.X trillion (US$XXX.X
trillion) in 2012.
As customers become increasingly sophisticated, banks must differentiate their product offerings. Services
such as internet banking are an attempt at this.
Infrastructural improvements have supported industry growth
The emergence of near-field communication (NFC) payment technology, EMV cards and digital wallets have
enhanced the ways in which consumers transact. EMV cards were introduced in 2005 by Bangkok Bank and
Kasikornbank. Kasikornbank issued XX,XXX EMV cards that year and installed over X,XXX EMV card-
accepting terminals. EMV cards are produced by dz card, a domestic manufacturer with accreditation from
MasterCard and Visa.
Similarly, Bangkok Bank launched its Visa pay wave trial in collaboration with Advanced Info Services (AIS), a
mobile operator, in 2008, enabling customers to download a Visa pay wave app to their Nokia NFC phones to
make payments of up to THBX,XXX at over X,XXX participating merchants.
Growth of mobile commerce to drive the industry
M-commerce has been enhanced by the increase in smartphone usage in Thailand. The capabilities of
smartphone devices, an exponential rise in mobile device apps and declining prices have been instrumental in
driving m-commerce. As of October 2012, there were XX million internet and XX million smartphone users in
Thailand. Moreover, Google picked Thailand as the first country in Southeast Asia to launch its GoMo
campaign in order to encourage businesses to capitalize on the proliferation of smartphone users.
Consumer preference plays a key role in purchasing decisions
Consumer preference in Thailand plays a key role in the decision making of customers, who consider pricing,
service, and utility, speed of delivery, product selection and security as important. Banks and card issuers
adopt various marketing strategies based on these paradigms.
Card payments make it easier for customers and unbanked individuals to access funds and make payments.
Krungthai Bank offers common flexibility features such access to POS terminals and ATMs, and enables the
holder to pay utility bills.
MARKET ATTRACTIVENESS AND FUTURE PROSPECTS OF
CARDS AND PAYMENTS INDUSTRY
Emerging Opportunities in Thailand’s Cards and Payments Industry Page 9
© Timetric. This product is licensed and is not to be photocopied Published: March 2013
2 Market Attractiveness and Future Prospects of Cards and Payments
Industry
Thailand is an emerging economy. The government offers tax and non-tax benefits for investors via its
Investment Promotion Act in order to establish manufacturing operations for domestic and international
business.
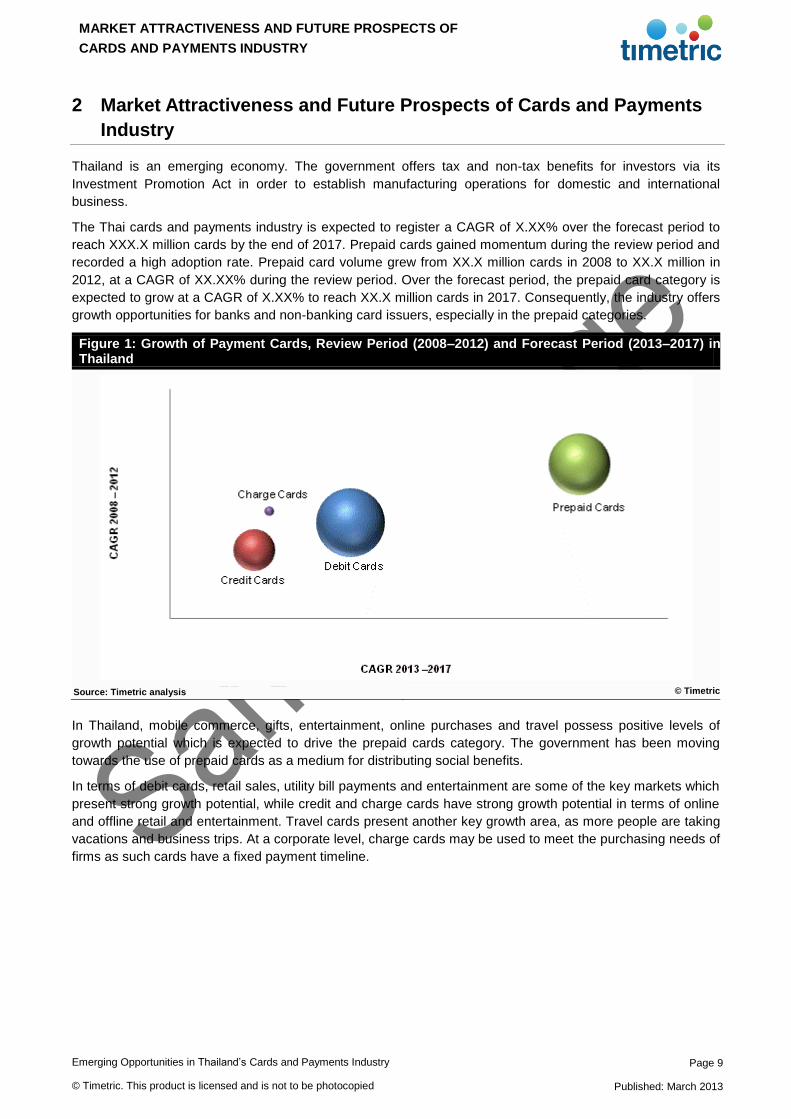
The Thai cards and payments industry is expected to register a CAGR of X.XX% over the forecast period to
reach XXX.X million cards by the end of 2017. Prepaid cards gained momentum during the review period and
recorded a high adoption rate. Prepaid card volume grew from XX.X million cards in 2008 to XX.X million in
2012, at a CAGR of XX.XX% during the review period. Over the forecast period, the prepaid card category is
expected to grow at a CAGR of X.XX% to reach XX.X million cards in 2017. Consequently, the industry offers
growth opportunities for banks and non-banking card issuers, especially in the prepaid categories.
Figure 1: Growth of Payment Cards, Review Period (2008–2012) and Forecast Period (2013–2017) in Thailand
Source: Timetric analysis © Timetric
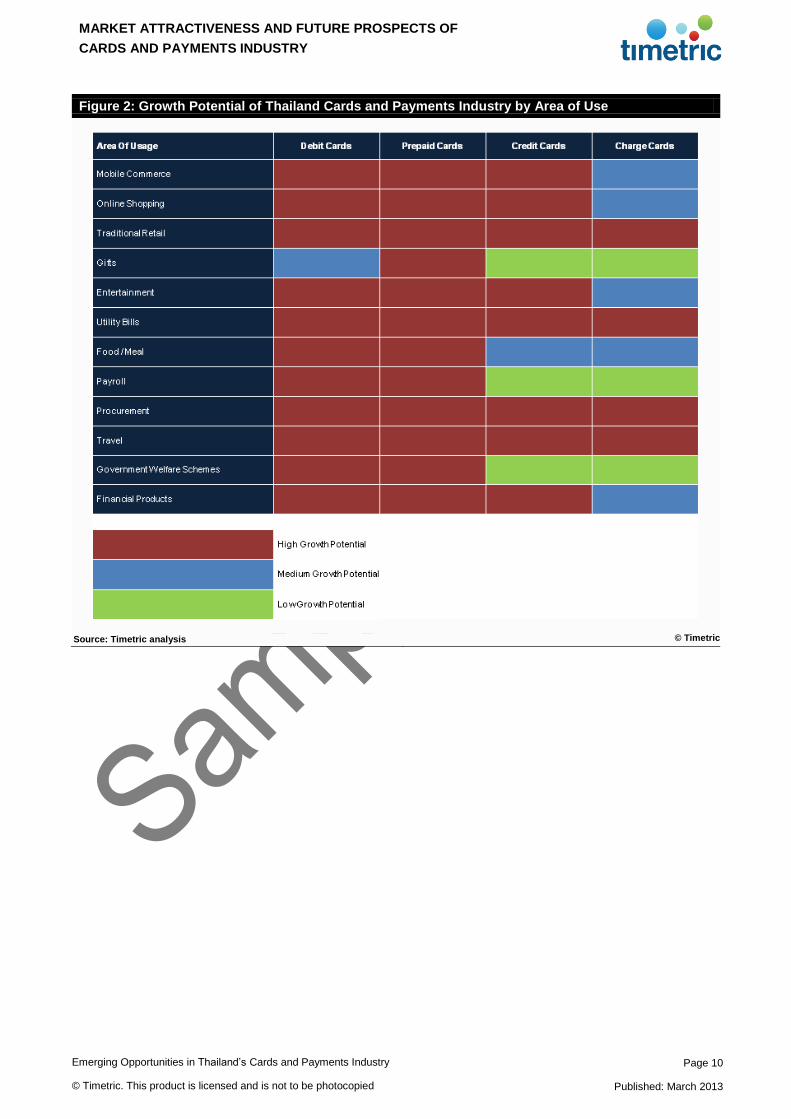
In Thailand, mobile commerce, gifts, entertainment, online purchases and travel possess positive levels of
growth potential which is expected to drive the prepaid cards category. The government has been moving
towards the use of prepaid cards as a medium for distributing social benefits.
In terms of debit cards, retail sales, utility bill payments and entertainment are some of the key markets which
present strong growth potential, while credit and charge cards have strong growth potential in terms of online
and offline retail and entertainment. Travel cards present another key growth area, as more people are taking
vacations and business trips. At a corporate level, charge cards may be used to meet the purchasing needs of
firms as such cards have a fixed payment timeline.
MARKET ATTRACTIVENESS AND FUTURE PROSPECTS OF
CARDS AND PAYMENTS INDUSTRY
Emerging Opportunities in Thailand’s Cards and Payments Industry Page 10
© Timetric. This product is licensed and is not to be photocopied Published: March 2013
Figure 2: Growth Potential of Thailand Cards and Payments Industry by Area of Use
Source: Timetric analysis © Timetric

ANALYSIS OF CARDS AND PAYMENTS MARKET DRIVERS
Emerging Opportunities in Thailand’s Cards and Payments Industry Page 11
© Timetric. This product is licensed and is not to be photocopied Published: March 2013
3 Analysis of Thailand Cards and Payments Industry Drivers
The Thai prepaid cards industry recorded growth during the review period. This not only resulted in an
increase in the volume of cards issued, but also ushered in improvements in terms of process and functions.
Cards issued by Thai banks are now accepted worldwide.
The industry is becoming highly competitive, with banks and card-issuing companies now forced to offer more
attractive products in order to retain their market positions. The emergence of highly secure payment
gateways increased public confidence in payment cards and had a positive impact on the industry’s
development. The rapid expansion of the nation’s online retail and outbound travel industries also supported
the industry.
Figure 3: Thailand Cards and Payments Industry Drivers
Source: Timetric analysis © Timetric

ANALYSIS OF CARDS AND PAYMENTS MARKET DRIVERS
Emerging Opportunities in Thailand’s Cards and Payments Industry Page 12
© Timetric. This product is licensed and is not to be photocopied Published: March 2013
3.1 Infrastructure Drivers
3.1.1 True Money mobile payment solutions
Launched in 2005, True Money is a mobile payment services and was used by over X million customers in
2010. The system processed over THBXX.X billion (US$XXX million) electronic payments and XXX million
transactions annually. Mobile payment solutions offer customers the opportunity to recharge, pay, transfer and
withdraw funds through an e-wallet which can be loaded with cash and used at a network of X,XXX bill
payment agencies known as True Money Express (TMX). The service enables customers to purchase airtime,
pay for True Group services, pay bills and transfer money.
3.1.2 M-Pesa
Safaricom, in partnership with Vodafone, offers the M-Pesa money transfer and micro financing service for
mobile phones in Thailand. The service offered annual person-to-person (P2P) transfers of THBXXX.X billion
(US$X.X billion) in 2010 and has over X.X million customers. With over XX,XXX M-Pesa agents customers
can instantly load their e-wallet electronically in most locations.
3.1.3 Smart Purse
Thai Smart Card Company Limited launched Smart Purse in 2005 in collaboration with Bank of Ayudhya,
Krung Thai Bank, The Government Savings Bank, Siam City Bank, True Corporation, Loxley and SVOA to
offer 8,000 payment terminals. The firm distributed over X.X million Smart Purse cards in the year of launch.
3.1.4 EMV Cards
EMV chip cards were rolled out by Bangkok Bank and Kasikornbank in 2005 in Thailand. Kasikornbank issued
XX,XXX EMV cards in the same year. The bank also installed over X,XXX EMV card-accepting terminals.
EMV cards are produced by dz card, a domestic manufacturer with accreditation from MasterCard and Visa.
3.1.5 NFC and contactless payments
Contactless payments use radio frequency identification technology (RFID) to enable mobile subscribers to
make payments simply by waving their mobile phone or a smart card directly in front of an NFC-enabled
terminal. In 2008, Bangkok Bank launched a Visa pay wave trial, in collaboration with Advanced Info Services
(AIS), enabling customers to download a Visa pay wave app to in their Nokias to make payments of up to
THBX,XXX.
Similarly, SAI Biz Solutions developed an NFC-based ordering system in 2012. The technology has been
installed at Big Mama Pizzeria in Bangkok enabling customers to make orders by tapping the NFC-enabled
phone at the menu card, saving time and overcoming language barriers.
ANALYSIS OF CARDS AND PAYMENTS MARKET DRIVERS
Emerging Opportunities in Thailand’s Cards and Payments Industry Page 13
© Timetric. This product is licensed and is not to be photocopied Published: March 2013
3.2 Regulatory Framework
Regulatory reforms in Thailand are implemented by the Central Bank of Thailand. Besides its role to maintain
monetary and financial institution stability, the bank is also responsible for maintaining the stability of payment
systems. The Payment System Committee (PSC) of Thailand envisaged the Payment Systems Roadmap
2012−2016 implemented on November 4th 2011, with the aim of establishing payment systems that are
efficient, safe and comply with international standards.
3.2.1 Regulation on credit cards
In order to protect consumers in Thailand, the Central Bank issued the guidelines effective from 2002, on
lending products, credit cards and personal loans. Cardholders are able to repay their debt obligations in
installments where each payment must be a minimum of X% of the remaining outstanding balance.
3.2.2 Regulations in credit card for foreigners
Banks in Thailand issue credit cards to foreign nationals on terms and policies based on income, employment
duration, work permit and bank statements.
Income: Banks have a minimum income requirement when offering credit cards to foreigners. To be
eligible for a credit card the requirement is THBXX,XXX. Foreign citizens are therefore asked to submit
income proof in the form of a pay slip or a tax letter.
Job tenure: Foreign citizens are required to have worked at the same company for a year before
applying for a credit card.
Work permit: Foreign citizens are required to have a work permit and a valid passport before applying
for a credit card. The work permit should be valid for six months from the date on the application form.
Bank statements: Banks in Thailand allows foreign nationals to apply for credit cards on account of
having a solid financial and employment background.
3.2.3 Policy responses relating to internet and mobile payments
The Central Bank refers to BIS Standards for security control and risk management in e-banking operations.
In this regard, commercial banks comply with the Internet Banking Technology Risk Management Guidelines.
Moreover, commercial banks submit details of procedures, duration, security measures for systems and data,
risk management, system technology development and internal control for the Bank of Thailand’s
consideration prior to launching products. In this regard, Bank of Thailand allows only commercial banks to
provide internet and mobile payment schemes, for which the issuers have to carry a banking license.
EMERGING CONSUMER ATTITUDES AND TRENDS
Emerging Opportunities in Thailand’s Cards and Payments Industry Page 14
© Timetric. This product is licensed and is not to be photocopied Published: March 2013
4 Emerging Consumer Attitudes and Trends
Consumer attitudes and preferences play a key role in the success of a product in any industry. Organizations
need to be aware of their target markets and age groups, income levels and locality.
4.1 Market Segmentation and Targeting
The Thai cards and payments industry grew during the review period, at a CAGR of XX.XX%, from XX.X
million cards in 2008 to XX.X million in 2012. Large domestic and foreign banks are making a concerted effort
to segment the industry and target the most profitable segments.
4.1.1 Cards targeted at outbound leisure tourists
Thailand’s travel and tourism sector grew during the review period. Expenditure incurred on domestic and
outbound tourists increased from THBXXX.X billion in 2009 to THBXXX.X billion in 2012. Since Thailand is
considered to be one of the most traveled to destinations in the world demand for travel cards is anticipated to
increase.
4.1.2 Cards targeted towards niche segments
Various service providers in Thailand target females with credit and debit cards which cater to their lifestyle
choices and spending patterns. The Krungsri Lady Titanium MasterCard is one such example. Provided by
Krungsri Bank the card offers a X% discount on gasoline at participating filling stations. Travel accident
insurance of up to THBX million is also provided.
4.2 Corporate Segment
Banks and card service provides classify the corporate segment by need, type and specific service
requirements. Banks are adopting marketing strategies and providing specialized promotional offers based on
the type and size.
EMERGING CONSUMER ATTITUDES AND TRENDS
Emerging Opportunities in Thailand’s Cards and Payments Industry Page 15
© Timetric. This product is licensed and is not to be photocopied Published: March 2013
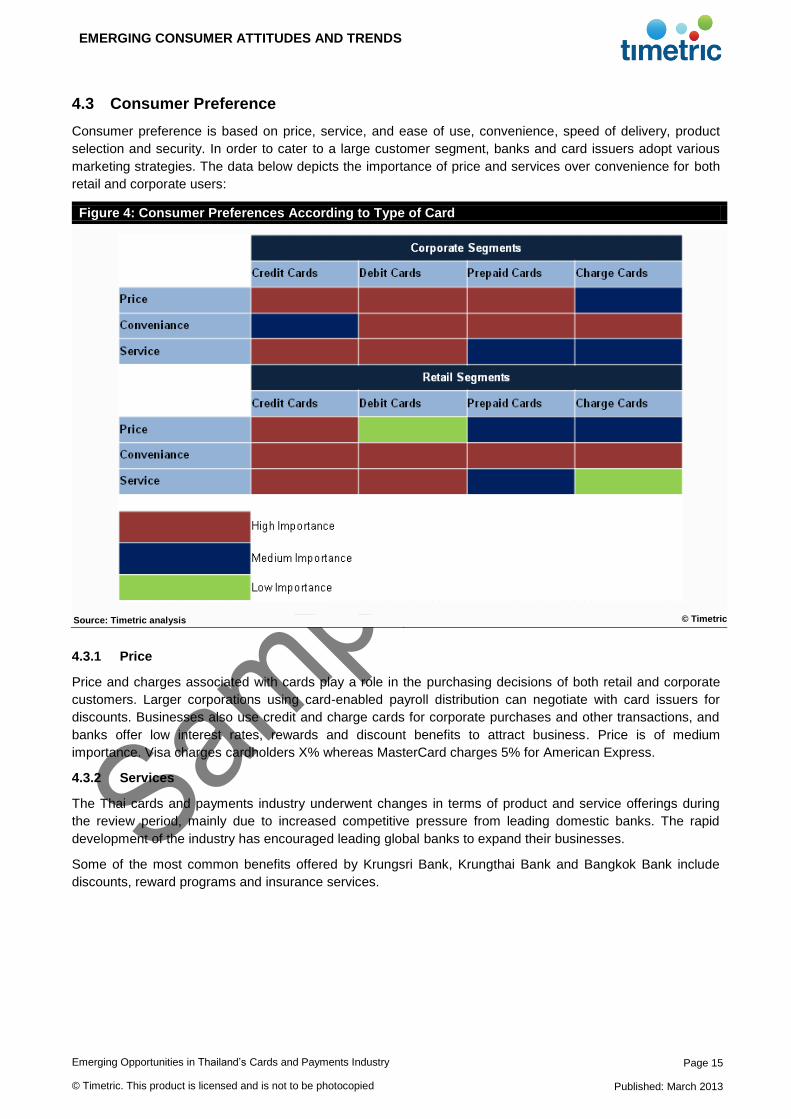
4.3 Consumer Preference
Consumer preference is based on price, service, and ease of use, convenience, speed of delivery, product
selection and security. In order to cater to a large customer segment, banks and card issuers adopt various
marketing strategies. The data below depicts the importance of price and services over convenience for both
retail and corporate users:
Figure 4: Consumer Preferences According to Type of Card
Source: Timetric analysis © Timetric
4.3.1 Price
Price and charges associated with cards play a role in the purchasing decisions of both retail and corporate
customers. Larger corporations using card-enabled payroll distribution can negotiate with card issuers for
discounts. Businesses also use credit and charge cards for corporate purchases and other transactions, and
banks offer low interest rates, rewards and discount benefits to attract business. Price is of medium
importance. Visa charges cardholders X% whereas MasterCard charges 5% for American Express.
4.3.2 Services
The Thai cards and payments industry underwent changes in terms of product and service offerings during
the review period, mainly due to increased competitive pressure from leading domestic banks. The rapid
development of the industry has encouraged leading global banks to expand their businesses.
Some of the most common benefits offered by Krungsri Bank, Krungthai Bank and Bangkok Bank include
discounts, reward programs and insurance services.
STRATEGIES ADOPTED BY KEY PLAYERS
Emerging Opportunities in Thailand’s Cards and Payments Industry Page 16
© Timetric. This product is licensed and is not to be photocopied Published: March 2013
5 Strategies Adopted by Key Operators
The Thai cards and payments industry is highly fragmented with the four-leading banks holding only XX.X% of
the debit card category. The industry registered a CAGR of XX.XX% during the review period and is expected
to grow at a CAGR of X.XX% over the forecast period. Increasing per capita income, employment and growth
in online and mobile commerce provide positive prospects for the industry.
State-owned, private, commercial and foreign banks are adopting marketing and growth strategies to stay
ahead of the competition and enlarge their customer base. This section discusses the marketing strategies
adopted by commercial banks alongside their pricing and operational strategies.
5.1 Market Entry Strategies
Banking operations are governed by the Central Bank which commenced its operations in 1942. The Thai
banking sector can be divided into three main categories:
Commercial banks
Special purposes banks
The Government Savings Bank
Commercial banking in Thailand commenced with the establishment of Hong Kong and Shanghai Banking
Corporation’s foreign branch in 1888. In order to increase the presence of domestic banks, The Central Bank
of Thailand restricted the opening of any foreign branches between 1978−1996 resulting in a reduction in
foreign ownership. As of 2011, foreign participation has been capped at XX% and the Financial Institution
Business Act relaxed these restrictions and allowed foreign shareholders to hold up to XX% of a financial
institutions shares. Thailand’s banking industry consisted of XX registered foreign bank branches and one
foreign bank subsidiary in 2011. Of these, five are European banks, three are US banks and three are
Japanese. With effect from December 15th 2011, these branches were allowed to form a subsidiary that was
permitted to open up to XX branches and have 20 ATM machines. The existing subsidiary will have the same
rights.
5.2 Marketing / Product Strategy
This section details the marketing strategies adopted by banks in order to increase their customer base. Most
banks have established strategies such as providing discounts, rewards and elite privileges to customers and
are targeting frequent fliers. Domestic and foreign banks also provide cards that cover the basic and
preferential needs of customers.
With innovative and customer-friendly websites, banks are able to provide an informative experience for
customers. The cards covered under this section include credit cards, debit cards and charge cards.

COMPANY PROFILES, PRODUCT, AND MARKETING STRATEGIES
Emerging Opportunities in Thailand’s Cards and Payments Industry Page 17
© Timetric. This product is licensed and is not to be photocopied Published: March 2013
6 Company Profiles, Product, and Marketing Strategies
6.1 Bangkok Bank
Established in 1944, Bangkok Bank is one of the largest commercial banks and comprises a customer base
which is one of the largest in Thailand. The bank’s business division consists of commercial banking services
including arranging syndicated loans, debt securities underwriting, trade finance and project finance. The
business line also includes custodial services, SMEs and merchant services.
With an asset base of THBX.X trillion in the financial year ending 2011 (FY2011), the bank comprised XX
million accounts, over XXX business centers and a network of X,XXX branches in Thailand. The bank
operates a self-service network consisting of X,XXX ATMs and cash deposit machines, phone and internet
banking service. The bank also has the largest overseas branch network of any Thai bank with a market
presence in China, Beijing, Shanghai, Xiamen and Shenzhen.
Travel benefits
With the Visa Platinum Travel Credit Card, Bangkok Bank offers holiday benefits to their cardholders. The
card provides cardholders with roadside and medical assistance, and concierge services. Additionally,
complimentary travel insurance of up to THBX,XXX,XXX (US$XXX,XXXX) is offered. The bank also has a
reward program, where on every THBXX spent, the cardholder earns a point, which when saved up, can be
redeemed for gifts.
Strategic alliance with Toyota
Bangkok Bank has partnered with Toyota, a multinational automaker to offer co-branded cards for car owners
to avail benefits at Toyota service centres. The Visa Platinum Toyota Credit Card allows discounts of up to
XX% on spare parts and XX% cash back on purchases made with the card. The card also enables X
Bualuang Thank You Reward point for every THBXX spent. Other benefits include complimentary travel
insurance of up to US$XXX,XXX, roadside assistance, discounts and offers at participating restaurants,
hotels, resorts, golf courses and spas.
Targeting patients with hospital credit cards
Bangkok Bank offers hospital credit cards. Health benefits and privileges such as XX hour emergency
assistance, consultancy services and emergency ambulance transfers are the card’s primary benefits. The
Titanium Ramathibodi Hospital Card offers cash back of up to X% on transactions. Moreover, the bank also
donates X.X% of the amount spent with the card to the hospital.
Similarly, the bank’s Titanium Piyavate Hospital Card enables cardholders to benefit from cashback offers of
up to X% on every THBXXX,XXX spent. The cardholder receives discounts of XX% on medical services.
COMPANY PROFILES, PRODUCT, AND MARKETING STRATEGIES
Emerging Opportunities in Thailand’s Cards and Payments Industry Page 18
© Timetric. This product is licensed and is not to be photocopied Published: March 2013
6.2 Krungthai Bank
Krungthai Bank was established in 1966, following the merger of two government-owned banks: Kaset Bank
and Monton Bank. The bank operates retail, corporate and government services. Its retail business is driven
by financial products such as deposits, loans and payment platforms. The Business Centre Group offers
services such as loans with a total credit line of over THBXX−XXX million.
With a total asset base of THBX.X trillion in 2011, the bank operated through a branch network of X,XXX in
Thailand. In 2011, the bank established XX new branches and XX foreign exchange booths.
Co-branded travel cards
Krungthai Bank entered into a strategic alliance with Bangkok Airways to offer co-branded cards for travelers.
The card enables a discount of up to XX% when shopping during traveling and a discount of X% for tour
packages. The card also permits an extra XXkg baggage allowance on flights.
Bangkok Hospital Group Titanium MasterCard
Krungthai Bank offers the Bangkok Hospital Group Titanium MasterCard. The card offers discounts of up to
X% on room charges, medicines and dentistry services, a discount of THBXXX on ambulance service and a
XX% discount on helicopter services in the case of medical emergencies.
Targeting Thai HNWIs with Visa Platinum Card
Krungthai Bank offers the Visa Platinum Card with complimentary insurance coverage of up to THBX million
and up to THBXX,XXX for the loss and damage of luggage on international flights. Discounts of up to X% on
domestic airfares and X% on domestic destinations are offered. Similarly, MasterCard Gold offers a maximum
credit line of up to five times the cardholder’s income and complimentary travel insurance of up to THBX
million.
COMPANY PROFILES, PRODUCT, AND MARKETING STRATEGIES
Emerging Opportunities in Thailand’s Cards and Payments Industry Page 19
© Timetric. This product is licensed and is not to be photocopied Published: March 2013
6.3 Krungsri Bank
Established in 1945, Krungsri Bank is one of the largest commercial banks in Thailand. In 2012, the bank’s
board of directors approved the acquisition of HSBC Thailand retail banking business including credit cards,
personal loans, mortgages and deposits. The bank’s business line includes retail banking, deposits,
investment products, loan and card products and bancassurance. Its corporate line includes relationship
management, investment and transaction banking, fund management and brokerage services.
With an asset base of THBX.X trillion in June 2012, the bank has XX,XXX staff and a network base of over
XXX domestic branches and four overseas branches. The bank has X,XXX ATMs, XX exchange booths, XX
banking zones and XX business centres in Thailand.
Attractive promotional offers and discounts for credit and debit cards
Additional benefits and promotional offers motivate cardholders to use cards more regularly. Krungsri Bank
offers multiple offers and discounts on various credit and debit cards. For example, the Krungsri Exclusive
Visa Platinum offers a X% gasoline discount when used at participating Bangchak gasoline stations. The card
also enables free access to Royal First Lounges at Suvarnabhumi Airport, Thailand.
Targeting female users
Bank offers an extensive range of credit cards for female customers in Thailand. Through the Krungsri Lady
Titanium MasterCard, the bank offers a X% discount on gasoline at participating Bangchak gasoline stations.
Accident insurance of up to THBX.X million is also offered, alongside coverage for lost baggage.
Targeting niche segments
The Bank offers the Visa Doctor Card targeting Thai doctors. Card benefits include discounts of up to X% on
gasoline at participating Bangchak gasoline stations, free access to VIP Lounges at Suvarnabhumi Airport
twice a year. Roadside assistance is provided free of charge alongside travel insurance of up to THBXX
million for foreign trips. Interest free credit of up to XX days and a cash advance of up to XXX% on the credit
line is an added benefit.
APPENDIX
Emerging Opportunities in Thailand’s Cards and Payments Industry Page 20
© Timetric. This product is licensed and is not to be photocopied Published: March 2013
7 Appendix
7.1 Methodology
All Timetric cards and payments reports are created by following a comprehensive, four-stage methodology.
This includes market study, research, analysis and quality control.
1) Market Study
A. Standardization
Definitions are specified using recognized industry classifications. The same definition is
used for every country.
Annual average currency exchange rates are used for the latest completed year. These
are then applied across both the Review and forecast data to remove exchange rate
fluctuations.
B. Internal audit
Review of in-house databases to gather existing data:
Historic market databases and reports
Company database
C. Trend monitoring
Review of the latest cards and payments companies and industry trends
2) Research
A. Sources
Collection of the latest market-specific data from a wide variety of industry sources:
Government statistics
Industry associations
Company filings
International organizations
Cards and payments regulatory agencies
B. Expert opinion
Collation of opinion taken from leading cards and payments industry experts
Analysis of third-party opinion and forecasts:
Broker reports
Media
Official government sources
C. Data consolidation and verification
Consolidation of data and opinion to create Review datasets
Creation of models to benchmark data across sectors and regions
3) Analysis
A. Market forecasts
Feeding forecast data into market models:
Macroeconomic indicators
Industry-specific drivers
Analysis of cards and payments industry database to identify trends:
Latest cards and payments trends
Key drivers of the cards and payments industry

APPENDIX
Emerging Opportunities in Thailand’s Cards and Payments Industry Page 21
© Timetric. This product is licensed and is not to be photocopied Published: March 2013
B. Report writing
Analysis of market data
Discussion of company and industry trends and issues
Review of financial deals and cards and payments trends
4) Quality Control
A. Templates
Detailed process manuals
Standardized report templates and accompanying style guides
Complex forecasting tool used to ensure forecast methodologies are consistently applied
Quality-control checklists
B. Quality control process
Peer review
Senior-level QC
Random spot checks on data integrity
Benchmark checks across databases
Market data cross-checked for consistency with accumulated data from:
Company filings
Government sources.
7.2 Contact Us
If you have any queries about this report, or would like any further information, please contact
7.3 About Timetric
Timetric is an innovative, fast-growing economic and business research firm that provides critical intelligence
on emerging economies and key global industries. Timetric provides detailed independent economic and
sector research, business insights and authoritative, independent commentary, all delivered using
sophisticated content delivery and data visualization technologies.
Timetric collects data through an extensive primary and secondary research network using robust
methodologies and highly innovative data acquisition and storage technologies. Its highly qualified teams of
economists and analysts draw on their collective industry experience to deliver analysis, comment, opinion
and advice on the latest country and market trends and conditions. Timetric provides extensive data services
and commentary to influential business media operations around the globe.
The Timetric product team is based in London, San Francisco, Hyderabad, Sydney and Singapore, and
consists of over 300 economists, analysts, journalists and researchers, and a team of 40 software engineers.
7.3.1 Timetric’s approach
All Timetric’s products and services are founded on three key principles:
High-quality data
All Timetric’s services are grounded in high-quality data. Timetric collects data in a number of innovative ways
– including extensive business and consumer surveys conducted through sophisticated market research
technology, exclusive industry research programmes and models, the systematic collection and curation of
huge public data sets such as national statistics sites, regulatory filings and procurement databases, mining of
business and government ‘exhaust data’, plus analysis of business and social media sentiment.
APPENDIX
Emerging Opportunities in Thailand’s Cards and Payments Industry Page 22
© Timetric. This product is licensed and is not to be photocopied Published: March 2013
Combined, the Timetric data assets consist of well over 1 billion time series, and tens of billions of data points,
creating a powerful resource for data models, forecasts and analysis.
Expert analysis
Timetric’s intelligence services are provided by in-house teams of economists, analysts and researchers,
working to programs that are guided by global advisory boards of leading economists and industry advisors.
Our analysts collectively have hundreds of years of research experience from leading institutions.
Timetric analysis draws on high-quality data sources, including proprietary panel and survey data, and is
grounded in proprietary data analysis methodologies, analysis frameworks and forecasts.
Powerful delivery and visualization tools
Timetric understands that its users want to spend more time analyzing information than finding it, so it has
created a highly intuitive and extremely responsive user interface that organizes data in subject-specific
modules, coupled with powerful search and index technologies to enable data to be easily found, classified
and cross-referenced. The Timetric interface is designed by specialized UI experts, and builds on a platform
constructed specifically to enable fast, powerful access, visualizations and analytics of big data and content
sets.
7.4 Services
Timetric offers a range of economic, industry and consulting services:
Economic Intelligence Services
Timetric leverages its extensive data assets, through the use of innovative technologies, in order to produce
thought-provoking analytical content delivered in the form of economic briefing services. Timetric also enables
users to access the data components that power this analysis, enabling the reader to understand further, dig
deeper or create their own assessments.
Industry Intelligence
Timetric’s industry Intelligence Centers are premium web-based services that provide access to interactive
tools, comprehensive research and expert analysis in key industry sectors. They provide invaluable decision
support presented in an easily digestible format and grounded in deep research.
Consulting
Timetric specializes in the development and delivery of innovative research solutions that are designed to
provide competitive advantage and profitability to its clients. Timetric’s cutting-edge research processes,
ground-breaking technology and expert researchers and analysts can be used to produce timely, cost-
effective, insightful and actionable recommendations to support users’ growth strategies.

APPENDIX
Emerging Opportunities in Thailand’s Cards and Payments Industry Page 23
© Timetric. This product is licensed and is not to be photocopied Published: March 2013
7.5 Disclaimer
All rights reserved.
No part of this publication may be reproduced, stored in a retrieval system or transmitted in any form by any
means, electronic, mechanical, photocopying, recording or otherwise, without the prior permission of the
publisher, Timetric.
The facts of this report are believed to be correct at the time of publication but cannot be guaranteed. Please
note that the findings, conclusions and recommendations that Timetric delivers will be based on information
gathered in good faith from both primary and secondary sources, the accuracy of which Timetric is not always
in a position to guarantee. Timetric will accept no liability whatsoever for actions taken based on any
information that may subsequently prove to be incorrect.

APPENDIX
Emerging Opportunities in Thailand’s Cards and Payments Industry Page 24
© Timetric. This product is licensed and is not to be photocopied Published: March 2013
7.5.1 Our approach
All of Timetric’s products and services are founded on three key principles:
High-quality data
All our services are grounded in high-quality data. We collect data in a number of innovative ways, including
extensive business and consumer surveys conducted via our sophisticated market research technology,
exclusive industry research programs and models, the systematic collection and curation of huge public data
sets such as national statistics sites, regulatory filings and procurement databases, mining of business and
government ‘exhaust data’, plus analysis of business and social media sentiment.
Combined, the Timetric data assets consist of well over 1 billion time series and tens of billions of data points,
creating a powerful resource for our data models, forecasts and analysis.
Expert analysis
Our intelligence services are provided by in-house teams of economists, analysts and researchers, working
for programs that are guided by global advisory boards of leading economists and industry advisors. Our
analysts collectively have decades of research experience and pedigrees from leading institutions.
Timetric analysis draws on high-quality data sources, including proprietary panel and survey data, and is
grounded in proprietary data analysis methodologies, analysis frameworks and forecasts.
Powerful delivery and visualization tools
We understand that our users want to spend more time analyzing information than finding it, so we have
created a highly intuitive and extremely responsive user interface that organizes data in subject-specific
modules, coupled with powerful search and index technologies to enable data to be easily found, classified
and cross-referenced. The Timetric interface is designed by specialized UI experts, and built on a platform
constructed specifically to enable fast, powerful access, visualizations and analytics of big data and content
sets.
7.6 Services
Timetric offers a range of economic, industry and consulting services.
Economic intelligence services
Timetric uses its extensive data assets, through the use of innovative technology, in order to produce thought-
provoking analytical content delivered in the form of economic briefing services. We also enable users to
access the data components that power this analysis, so that they can understand further, dig deeper or
create their own assessments.
Industry intelligence
Our industry Intelligence Centers are premium web-based services that provide access to interactive tools,
comprehensive research and expert analysis in key industry sectors. They provide invaluable decision support
presented in an easily digestible format and grounded in deep research.
Consulting
Timetric specializes in the development and delivery of innovative research solutions that are designed to
provide competitive advantage and profitability to our clients. Our cutting-edge research processes, ground-
breaking technology, and expert researchers and analysts can be employed to produce timely, cost-effective,
insightful and actionable recommendations to support growth strategies.

APPENDIX
Emerging Opportunities in Thailand’s Cards and Payments Industry Page 25
© Timetric. This product is licensed and is not to be photocopied Published: March 2013
7.7 Disclaimer
All rights reserved.
No part of this publication may be reproduced, stored in a retrieval system or transmitted in any form by any
means, electronic, mechanical, photocopying, recording or otherwise, without the prior permission of the
publisher, Timetric.
The facts of this report are believed to be correct at the time of publication but cannot be guaranteed. Please
note that the findings, conclusions and recommendations that Timetric delivers will be based on information
gathered in good faith from both primary and secondary sources, the accuracy of which Timetric is not always
in a position to guarantee. Timetric will accept no liability whatsoever for actions taken based on any
information that may subsequently prove to be incorrect.