Embed Size (px)
Citation preview
Sri Lanka Focus 24th August 2012 ASIA RESEARCH TEAM 1
Major Price Movements Large Trades
IN THIS ISSUE;
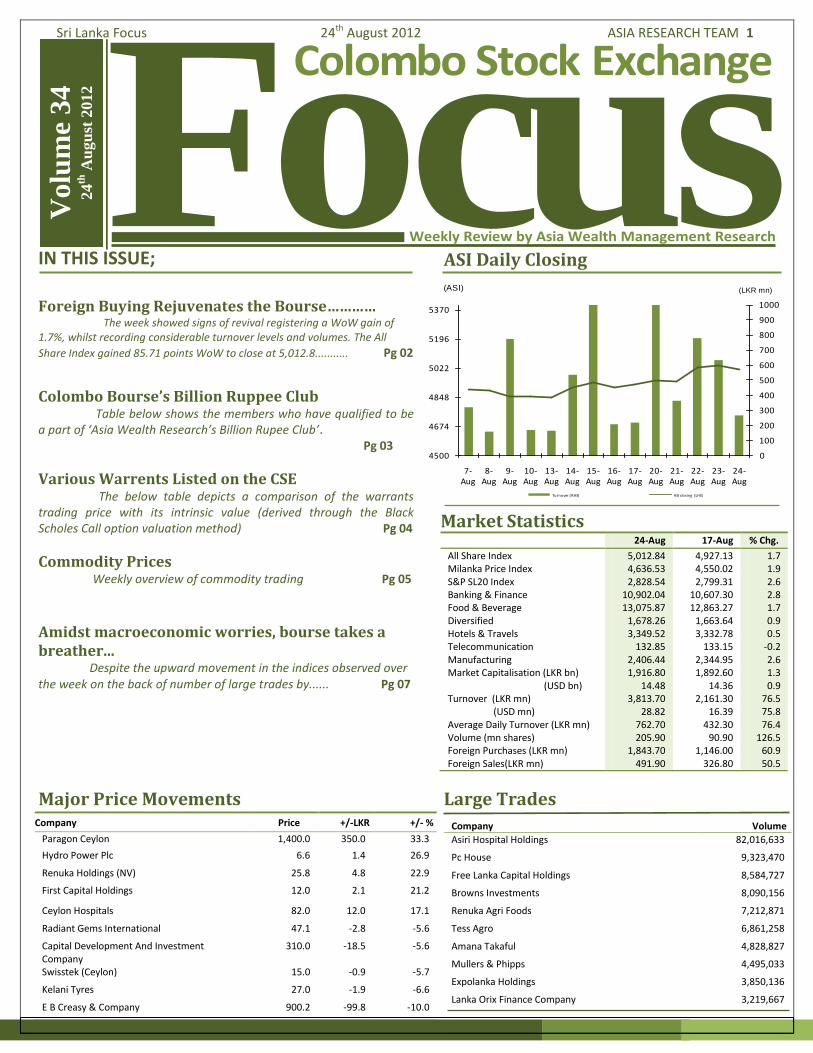
Foreign Buying Rejuvenates the Bourse………… The week showed signs of revival registering a WoW gain of 1.7%, whilst recording considerable turnover levels and volumes. The All
Share Index gained 85.71 points WoW to close at 5,012.8........... Pg 02
Colombo Bourse’s Billion Ruppee Club Table below shows the members who have qualified to be a part of ‘Asia Wealth Research’s Billion Rupee Club’. Pg 03
Various Warrents Listed on the CSE The below table depicts a comparison of the warrants trading price with its intrinsic value (derived through the Black Scholes Call option valuation method) Pg 04
Commodity Prices Weekly overview of commodity trading Pg 05
Amidst macroeconomic worries, bourse takes a breather... Despite the upward movement in the indices observed over the week on the back of number of large trades by...... Pg 07
Market Statistics 24-Aug 17-Aug % Chg.
All Share Index 5,012.84 4,927.13 1.7 Milanka Price Index 4,636.53 4,550.02 1.9 S&P SL20 Index 2,828.54 2,799.31 2.6 Banking & Finance 10,902.04 10,607.30 2.8 Food & Beverage 13,075.87 12,863.27 1.7 Diversified 1,678.26 1,663.64 0.9 Hotels & Travels 3,349.52 3,332.78 0.5 Telecommunication 132.85 133.15 -0.2 Manufacturing 2,406.44 2,344.95 2.6 Market Capitalisation (LKR bn) 1,916.80 1,892.60 1.3 (USD bn) 14.48 14.36 0.9 Turnover (LKR mn) 3,813.70 2,161.30 76.5 (USD mn) 28.82 16.39 75.8 Average Daily Turnover (LKR mn) 762.70 432.30 76.4 Volume (mn shares) 205.90 90.90 126.5 Foreign Purchases (LKR mn) 1,843.70 1,146.00 60.9 Foreign Sales(LKR mn) 491.90 326.80 50.5
Company Price +/-LKR +/- %
Paragon Ceylon 1,400.0 350.0 33.3
Hydro Power Plc 6.6 1.4 26.9
Renuka Holdings (NV) 25.8 4.8 22.9
First Capital Holdings 12.0 2.1 21.2
Ceylon Hospitals 82.0 12.0 17.1
Radiant Gems International 47.1 -2.8 -5.6
Capital Development And Investment Company
310.0 -18.5 -5.6
Swisstek (Ceylon) 15.0 -0.9 -5.7
Kelani Tyres 27.0 -1.9 -6.6
E B Creasy & Company 900.2 -99.8 -10.0
ASI Daily Closing
Weekly Review by Asia Wealth Management Research
Colombo Stock Exchange
Focus Vol
um
e 38
7th
Oct
ob
er 2
011
Weekly Review by Asia Wealth Management Research
Colombo Stock Exchange
Focus Vol
um
e 38
7th
Oct
ob
er 2
011
Weekly Review by Asia Wealth Management Research
Colombo Stock Exchange
Focus Vo
lum
e 38
7th
Oct
ober
201
1
Wee kly Review by Asia Wealth Management Re se arch
Colombo Stock Exchange
Focus Vo
lum
e 38
7th
Oct
ober
201
1
Volu
me
34
24
th A
ugu
st 2
012
Company Volume
Asiri Hospital Holdings 82,016,633
Pc House 9,323,470
Free Lanka Capital Holdings 8,584,727
Browns Investments 8,090,156
Renuka Agri Foods 7,212,871
Tess Agro 6,861,258
Amana Takaful 4,828,827
Mullers & Phipps 4,495,033
Expolanka Holdings 3,850,136
Lanka Orix Finance Company 3,219,667
0
100
200
300
400
500
600
700
800
900
1000
4500
4674
4848
5022
5196
5370
7-Aug
8-Aug
9-Aug
10-Aug
13-Aug
14-Aug
15-Aug
16-Aug
17-Aug
20-Aug
21-Aug
22-Aug
23-Aug
24-Aug
Turnover (RHS) ASI closing (LHS)
(LKR mn)(ASI)

Sri Lanka Focus 24th August 2012 ASIA RESEARCH TEAM 2
Features
Foreign Buying Rejuvenates the Bourse… The week showed signs of revival registering a WoW gain of 1.7%, whilst recording considerable turnover levels and volumes. The All Share Index gained 85.71 points WoW to close at 5,012.8 points (1.7%), whilst the Milanka Price Index rose 86.5 points WoW to close at 4,636.5 points (1.9%). Indices benefited mainly on the back of the gains made by Ceylon Tobacco (2.2% WoW), Hatton National Bank (5.2% WoW), Lanka Orix Leasing Company (10.2% WoW), Sampath Bank (6.7% WoW) and Ceylinco Insurance (12% WoW). The bourse which was going through a lackluster momentum was rejuvenated for a certain extent with the number of crossings witnessed during the week. The crossings which triggered during the week contributed a circa of 37% to the total turnover. The world market indices demonstrated volatile sentiments during the week mainly on the back of the weak economic indicators from the United States and China while the gloomy economic outlook on Europe created more expectations on stimulus packages from central banks. Despite the negative global economic outlook the bourse managed to lure significant foreign inflows which boosted turnover levels especially on the fundamentally strong counters. As at Thursday, bourse witnessed net foreign buying for consecutive 24 days which created an inflow of LKR4.8bn. It is evident that these investors are focusing on a long term investment horizon to take advantage of the undervalued counters which are attractively priced and the depreciating exchange rate regime of the country. The weekly turnover was mainly led by strategic crossings which took place in Asiri Hospitals Holdings and Asiri Central Hospitals, which contributed a circa 16% to the total weekly turnover. Foreign investment fund Actis Investments bought a circa of 11% stake in Asiri Central Hospitals where the selling party being Softlogic Holdings. Further Softlogic Holdings increased its stake in Asiri Hospitals Holdings by purchasing 9.1% of the stake of the company where the selling party being SSP Corporate Services. In addition crossings witnessed were on Lion Brewery Ceylon, Ceylon Beverage Holdings, Central Finance Company, Chevron Lubricants Lanka, John Keells Holdings and Renuka Agri Foods which boosted the daily turnover levels. During the week Banking, Finance and Insurance index made a noteworthy gain of 2.8% mainly on the back of institutional interest in Sampath Bank and Commercial Bank. Further Beverage Food and Tobacco and Diversified sectors followed by creating week on week gains of 1.7% and 0.9% respectively. In addition the resignation of the chairman of the market regulator which was confirmed on Friday brought in curiosity among the investors over the next appointment. Furthermore, Asiri Hospitals Holdings, PC House, Free Lanka Capital Holdings, Browns Investments, Renuka Agri Foods and Tess Agro topped the list in terms of volume traded during the week. The average daily turnover of the week was LKR 762.7mn whilst the average daily volume was 205.9mn shares. The week saw foreign purchases amounting to LKR1,843.7 mn whilst foreign sales amounted to LKR491.9mn. Market capitalisation stood at LKR 1,916.8bn, and the YTD performance is -17.5%.

Sri Lanka Focus 24th August 2012 ASIA RESEARCH TEAM 3
Table below shows the members who have qualified to be a part of ‘Asia Wealth Research’s Billion Rupee Club’. The eligibility criteria lie with their earnings reaching LKR1 bn mark. The list will be refreshed on a quarterly basis identifying the new qualifying members whilst eliminating the disqualifying.
Colombo Bourse’s Billion Rupee Club
Name Price(LKR) ROE
Net
Profit(Mn) PE PBV MCap
JOHN KEELLS HOLDINGS 195.00 13.73% 9,775.01 17.0 2.3 165,891.20
COMMERCIAL BANK [V] 103.00 19.12% 8,879.50 9.7 1.8 80,248.54
COMMERCIAL BANK [NV] 80.20 19.12% 8,879.50 7.5 1.4 4,288.59
CEYLON TOBACCO 690.00 196.00% 7,244.00 17.8 35.0 129,253.39
HNB [V] 141.00 15.90% 6,460.84 8.7 1.4 44,736.27
HNB [NV] 97.00 15.90% 6,460.84 6.0 0.9 7,707.41
LOLC 42.20 32.87% 6,379.39 3.1 1.0 20,053.44
DISTILLERIES 120.00 16.30% 5,981.64 6.0 1.0 36,000.00
CARSON CUMBERBATCH 417.10 21.05% 5,762.76 14.2 3.0 81,912.98
BUKIT DARAH 671.00 22.42% 5,280.05 13.0 2.9 68,442.00
SAMPATH BANK 176.10 20.76% 4,664.77 6.1 1.3 28,612.37
PEOPLE’S LEASING 10.70 24.06% 4,503.00 3.7 0.9 16,692.00
SRI LANKA TELECOM 38.50 7.34% 3,851.00 18.0 1.3 69,487.11
AITKEN SPENCE 111.00 14.52% 3,709.16 12.1 1.8 45,065.56
DIALOG TELEKOM 6.20 11.23% 3,663.94 13.8 1.5 50,491.43
DFCC BANK 114.50 11.36% 2,914.92 10.4 1.2 30,353.69
OVERSEAS REALTY 13.20 14.21% 2,765.56 4.0 0.6 11,133.99
NDB 117.50 15.88% 2,737.07 7.0 1.1 19,293.72
DIMO 605.00 36.13% 2,697.31 2.0 0.7 5,370.24
CENTRAL FINANCE 137.00 20.05% 2,675.49 5.4 1.1 14,369.02
BROWNS INVESTMENTS PLC 3.20 23.21% 2,525.83 2.4 0.5 5,952.00
HAYLEYS 300.20 13.88% 2,519.73 8.9 1.2 22,515.00
NESTLE LANKA 1,175.10 65.34% 2,479.62 25.5 16.6 63,132.79
RICHARD PIERIS 7.80 40.29% 2,340.72 6.5 2.6 15,122.84
UNITED MOTORS 74.20 38.97% 2,275.36 2.2 0.9 4,991.22
CHEVRON LUBRICANTS 180.50 58.88% 2,248.62 9.6 5.7 21,660.00
CEYLON COLD STORES 124.10 30.75% 2,242.41 5.3 1.6 11,794.46
ASIAN HOTEL & PROPERTIES 78.20 14.36% 2,150.56 16.1 2.3 34,625.03
CEYLON GUARDIAN 150.50 17.23% 2,097.21 5.9 1.0 12,355.56
COLOMBO DOCKYARD 200.00 22.38% 2,084.39 6.9 1.5 14,371.78
VALLIBEL ONE LIMITED 15.00 6.77% 2,025.42 8.0 0.5 16,298.39
ROYAL CERAMICS 85.00 29.83% 1,958.43 4.8 1.4 9,417.10
DIPPED PRODUCTS 89.00 35.25% 1,866.63 2.9 1.0 5,327.67
CEYLON TEA SERVICES 646.00 24.62% 1,665.96 7.8 1.9 12,920.00
LB FINANCE 119.00 40.56% 1,625.08 5.1 2.1 8,241.60
CEYLINCO INSURANCE [V] 790.00 14.89% 1,584.80 13.2 2.0 15,800.00
CEYLINCO INSURANCE [NV] 300.00 14.89% 1,584.80 5.0 0.7 1,924.34
NATIONS TRUST BANK 51.60 18.33% 1,563.74 7.6 1.4 11,899.34
BROWNS 116.90 14.03% 1,526.34 5.4 0.8 8,285.29
AIT. SPENCE HOTEL HOLD. 69.00 12.52% 1,395.29 16.6 2.1 23,204.01
SINGER SRI LANKA 109.00 31.79% 1,375.43 9.9 3.2 13,647.85
LION BREWERY 229.90 24.23% 1,262.23 14.6 3.5 18,392.00
LANKA ASHOK 1999.90 55.21% 1,258.32 5.8 3.2 7,241.32
LANKA ORIX FINANCE 3.50 26.17% 1,245.79 7.9 2.1 9,800.00
CEYLON THEATRES 130.50 9.90% 1,242.12 19.2 1.9 23,894.19
HEMAS HOLDINGS 24.00 11.20% 1,208.78 10.2 1.1 12,366.97
SEYLAN BANK [V] 54.00 6.50% 1,169.25 15.6 1.0 9,360.00
SEYLAN BANK [NV] 27.00 6.50% 1,169.25 7.8 0.5 4,448.16
COLONIAL MOTORS 194.70 45.84% 1,162.30 1.5 0.7 1,776.50
JOHN KEELLS HOTELS 13.00 8.02% 1,105.27 17.1 1.4 18,929.91
CARGILLS 135.00 14.43% 1,105.02 27.4 3.9 30,240.00
EXPOLANKA HOLDINGS 6.20 12.58% 1,054.73 11.5 1.4 12,120.47
COLOMBO FORT LAND 27.10 21.28% 1,052.43 4.6 1.0 4,878.00

Sri Lanka Focus 24th August 2012 ASIA RESEARCH TEAM 4
Analysis of Various Warrants Listed on the CSE The below table depicts a comparison of the warrants trading price with its intrinsic value (derived through the Black
Scholes Call option valuation method). The 6th column to the right depicts the difference between the intrinsic value
and the traded price. Hence, the positive figures would explain the potential for the respective warrant to further
appreciate. Thus, the negative value would denote that the warrant is overvalued at the current price (assuming the
underlying stock price to be constant). However, it is noted that the intrinsic value is derived based on the current
value of the underlying stock price, its volatility, period to maturity and the risk free rate. Hence, any adverse
movement of the mentioned assumptions would have an adverse impact on the warrant value, and any favourable
movement would positively impact the warrant value (E.g.: if in case the asset price appreciates from the existing, it
would invariably increase the value of the warrant.
Exercise
price
Share Price
(2012/08/24)Expiry Date
Warrant Price
(2012/08/24)
Price According to Black
Scholes model (Intrinsic
value)
Undervalued/
(Overvalued)
CLPL-W-0013 118.00 78.50 25-Aug-14 10.50 0.00 (10.50)
CLPL-W-0014 142.00 78.50 25-Aug-15 10.20 0.00 (10.20)
GREG-W-0003 36.00 14.90 24-Feb-14 4.90 0.00 (4.90)
GREG-W-0006 39.00 14.90 24-Feb-15 5.30 0.00 (5.30)
CSF-W-0021 12.00 8.20 31-Jul-13 2.60 0.00 (2.60)
REEF-W-0019 40.00 29.00 15-Jun-15 5.60 0.01 (5.59)
Warrants Valuation
Features

Sri Lanka Focus 24th August 2012 ASIA RESEARCH TEAM 5
Date as at 03.08.12 10.08.12 17.08.12 24.08.12 WoW % Change
Brent Crude Oil (USD/Barrel ) 105.9 113.2 116.9 114.5 -2.1
METALS
Gold (USD/Ounce ) 1,624 1,618 1,615 1,662 2.9
Copper LME (USD/Ton) 7,386 7,495 7,464 7,667 2.7
AGRI
Date as at 30.07.12 08.08.12 15.08.12 22.08.12 WoW % change
Tea LKR/Kg 408.47 393.61 406.51 407.03 0.1
Date as at 03.08.12 07.08.12 14.08.12 23.08.12 WoW % change
Rubber (RSS 1) LKR /Kg 379 448 350 360 2.9
Exchange Rates (LKR) 03.08.12 10.08.12 17.08.12 24.08.12 WoW % change
USD 131.86 131.99 133.05 132.35 -0.5
EURO 160.72 162.28 162.62 165.89 2.0
STG (GBP) 204.68 206.30 207.64 209.72 1.0
YEN 1.69 1.68 1.66 1.68 1.2
YUAN (CNY) 20.69 20.74 20.75 20.83 0.4
OIL
Oil prices fell below USD 115/barrel on uncertainty concerning U.S Fed’s stimulus effort to revive world’s largest economy,
coupled with deteriorating Euro zone economic conditions. Further, the pessimism shown by EU leaders in extending deadline
set for Greece’s bailout driven reforms, also added to the downward pressure on oil prices.
GOLD
Gold hit a four month high on recent data indicating a slowdown in Chinese manufacturing output growth. Investors moved
towards the safe haven asset on negative outlook of the Euro zone growth prospects coupled with waning hopes for U.S stimulus
measures to boost demand. Furthermore, it’s reported that applications for U.S unemployment benefits have also increased
during the week, indicating a sluggish U.S. recovery.
Commodity Prices
Source: Bloomberg, CBSL, CRTASL

Sri Lanka Focus 24th August 2012 ASIA RESEARCH TEAM 6
COPPER
Copper prices eased during the week on the back of weak recovery of the U.S job market coupled with the doubts reigning over
the minds of investors on Fed’s efforts to revive the ailing U.S economy. The strict stance of the EU on Greek reforms coupled
with the drop in Chinese manufacturing output further added to the downward run on copper prices.
USD USD is expected to weaken against a range of internationally traded currencies over the worsening fiscal situation compared to
the EU. U.S fiscal mismatch is significantly above the Euro zone creating conditions for the market to take note of things sooner
or later. In addition, this points to the fact that mild U.S recovery from the recession was mainly spearheaded by government
stimulus efforts. Further, healthy manufacturing output of Germany and France which outperformed forecasts dragged the USD
down against the Euro by 0.12 percent in yesterday’s trading.
Commodity Prices
Sources: Bloomberg, AFP, Reuters

Sri Lanka Focus 24th August 2012 ASIA RESEARCH TEAM 7
Amidst macroeconomic worries, bourse takes a breather... Despite the upward movement in the indices observed over the week on the back of number of large trades by institutional parties, macroeconomic worries and uncertainty over the securities regulatory environment continues to dampen local retail investor sentiment. The data released by the Central Bank concerning the external and monetary position of the economy is an indicator of the likely future challenges. The external sector performance for June 2012 revealed that the trade deficit for 1HCY12 expanded 11.8% YoY albeit at a slower rate. The most worrisome factor is the slowdown in agricultural and industrial exports due to a drop in prices of primary commodities in the case of the former and a slowdown in global consumption in the case of the latter. This has been mirrored in slowing revenue growth for 1QFY12of export oriented counters such as Hayleys and Textured Jersey which we believe is likely to continue. Contemporaneously, rates on 6-month and 1-year treasury securities indicate that borrowing costs are facingupward pressure. This has already begun to negatively impact the earnings of highly leveraged counters and would lead to a downward revision of firm values. In spite of these challenges, the continued presence of foreign institutional investors which has resulted in a year to date net foreign inflow of LKR 28.2b and has contributed towards a net foreign inflow of LKR 1,351 mn over the course of the week is a testament to the fact that fundamentally sound counters continue to remain attractively priced.Alongside the growth in foreign direct investment (FDI) observed during 1HCY12 we expect a renewed interest in equities at the Colombo bourseby institutional players. All in all, we reiterate that a stronger securities regulatory environment and a focus on attractively priced fundamentally sound countersis a prerequisite for a sustained recovery to take place at the Colombo bourse.
Conclusion

Sri Lanka Focus 24th August 2012 ASIA RESEARCH TEAM 8
Charts Sourced from Asia Wealth Research
Tokyo Cement Manufacturing
N – LKR 28.50 X – LKR 19.70
John Keells Holdings Diversified
N – LKR 195.00
TKYO, being the joint market leader in the cement industry, has its grinding facility located in Trincomalee, ideally located for the rebuilding boom. TKYO, a direct beneficiary of construction sector upturn, is in a strong position to take advantage of increasing demand in current excess capacity. TKYO completed a 10 MW bio mass power plant which provides them significant cost advantage together with additional boost to top line.
Going forward, with the growth in GDP, per capita income and increase in tourist arrivals we anticipate the consumer retail and the leisure sector to boom. Going forward, with the satisfactory 1H results and booming economy JKH is expected to perform healthy towards medium to long term.
Key Buys
Focus on Investment
Sampath Bank Banking & Finance
N – LKR 176.10
Bank will continue its aggressive expansion to ensure its spread of service through the island. As the pioneer in blending IT with banking, the company will revamp its existing products and innovate new customer focus products. And the company is well poised to take advantage in the prevailing economic boom in the country. However the interest rates in the economy are showing an upward trend consequent to the increased policy rates in the beginning of February 2012, yet the performance of SAMP would not get largely affected due to availability of various funding avenues and unimpeded credit demand.
Peoples’s Leasing Company Banking & Finance
N – LKR10.70
PLC is the largest specialized leasing company in Sri Lanka, a subsidiary of Peoples Bank- the 2nd largest commercial bank of the country, a holding of 75%. Principal business activity of the PLC is the provision of finance leasing, operating leasing, HP facilities etc... The current financial performance of the company is sound with an interest margin of 10.02% for FY2012. However, the financial sector in the economy is facing a challenge with high interest rates and accompanied low demand for credit. This would dampen the growth in loan volumes yet profitability would remain satisfactory. Further, due to tense competition posed through other finance institutions including LCB’s RFC’s, LSB’s, the market share of PLC would deplete but would remain as a key player in SLC’s sector. Going by these, we believe PLC is a medium to long term healthy investment to consider.
0
50
100
150
200
250
300
8/25/2011 10/10/2011 11/25/2011 1/9/2012 2/24/2012 4/10/2012 5/28/2012 7/11/2012 8/23/2012
LK
R
SAMP
0
10
20
30
40
50
60
8/25/2011 10/10/2011 11/25/2011 1/9/2012 2/24/2012 4/10/2012 5/28/2012 7/11/2012 8/23/2012
LKR
TKYO
0
5
10
15
20
25
30
35
40
45
8/25/2011 10/10/2011 11/25/2011 1/9/2012 2/24/2012 4/10/2012 5/28/2012 7/11/2012 8/23/2012
LKR
TKYOX
0
50
100
150
200
250
8/25/2011 10/10/2011 11/25/2011 1/9/2012 2/24/2012 4/10/2012 5/28/2012 7/11/2012 8/23/2012
LK
R
JKH
0
5
10
15
20
LK
R
PLC

Sri Lanka Focus 24th August 2012 ASIA RESEARCH TEAM 9
Focus on Investment
Asian Hotels Hotels & Travels
N – LKR 78.20
CIC Holdings Chemicals & Pharmaceuticals
N – LKR 68.00 X –LKR 57.00
Commercial Bank Banking & Finance
N – LKR 103.00 X – LKR 80.20
Distilleries Company Bev Food & Tobacco
N – LKR 120.00
Asian Hotels and Property Development PLC is well poised to ride the expected growth in the hotel sector of the country. We expect to see a healthy growth in the industry, shouldered by the improvement in both the tourist arrivals to the country as well as the growth in the overall economy.
CIC is considered as the only “seed to shelf” agricultural company in Sri Lanka.The Company also has foot prints in consumer and pharmecuitical industries, Paints, Industrial raw material and Packaging. Acquisition of dairy farms in north & east region coupled with CIC’s plans to expand overseas will strengthens company’s earnings in the medium to long term.
Commercial Bank is the largest private sector commercial bank with an asset base of LKR441.1 bn as at end 2011, and operates with above 500 ATM points, which is also the largest single network in the country. Towards the future, bank is well positioned with capital, consequent to the recently concluded Rights issue of circa LKR5 bn enabling the bank to extend its credit further. The spike in interest rates in the economy consequent to the increased policy rates in the beginning of February 2012 and the limit imposed on credit growth, there would be pressure posed on performance, yet the bank is well diversified with differing loan products and income avenues which would minimize impact from the aforesaid limitations.
The growth in the key liquor business with the expected rise in tourism, improved sales in the previously war torn North & East and anticipated increase in disposable income would shoulder the growth in DIST. Currently the core beverages business of the group operates with a well diversified product portfolio and DIST has been successful in introducing new products to the market viz, ‘Narikela’ and ‘Economic Special’. Further with the new eco friendly distilling unit in Seeduwa and the investment in caustic soda recovery plant would strengthen future growth of the company. However, taking into account the plantation business of the group, we do not expect much prospects in the sector due to unaffordable labour cost pertaining to the industry, adverse weather conditions persist in the plantation growing areas and adverse price movements of tea in the world market.
0
20
40
60
80
100
8/25/2011 10/10/2011 11/25/2011 1/9/2012 2/24/2012 4/10/2012 5/28/2012 7/11/2012 8/23/2012
LK
R
AHPL
0
20
40
60
80
100
120
140
160
8/25/2011 10/10/2011 11/25/2011 1/9/2012 2/24/2012 4/10/2012 5/28/2012 7/11/2012 8/23/2012
LKR
CIC
0
10
20
30
40
50
60
70
80
90
100
8/25/2011 10/10/2011 11/25/2011 1/9/2012 2/24/2012 4/10/2012 5/28/2012 7/11/2012 8/23/2012
LKR
CICX
0
50
100
150
200
250
8/25/2011 10/10/2011 11/25/2011 1/9/2012 2/24/2012 4/10/2012 5/28/2012 7/11/2012 8/23/2012
LKR
COMB
0
20
40
60
80
100
120
140
160
180
8/25/2011 10/10/2011 11/25/2011 1/9/2012 2/24/2012 4/10/2012 5/28/2012 7/11/2012 8/23/2012
LKR
COMBX
0
20
40
60
80
100
120
140
160
180
200
8/25/2011 10/10/2011 11/25/2011 1/9/2012 2/24/2012 4/10/2012 5/28/2012 7/11/2012 8/23/2012
LK
R
DIST

Sri Lanka Focus 24th August 2012 ASIA RESEARCH TEAM 10
Hatton National Bank Banking & Finance
N – LKR 141.00 X – LKR 97.00
Piramal Glass Manufacturing
N – LKR 5.10
Chevron Lubricants Manufacturing
N – LKR 180.50 .0
LB Finance Banking & Finance
N – LKR 119.00
.0
HNB is the second largest private commercial bank with a total asset base of LKR388.6 bn as at end 2011, and number one private bank in terms of branches with a strong network of over 240. Bank is well positioned with its capital consequent to fres h capital raised through a rights issue amounting to LKR 6 bn. HNB which has a relatively larger retail deposit base is projected to enjoy higher interest spreads and would also benefit from the growth in SME lending. However, the spike in interest rates consequent to the increased policy rates in the beginning of February 201 2 would pose pressure on performance, yet the bank’s strong positioning in the sector would combat the performance showing a significant impact. .
LLUB with a renowned history in paying high dividends, during FY10 company paid LKR1,470mn as dividends which is a payout of 98% opposed to 96% dividend payout in FY09(LLUB paid LKR1440mn dividends in FY09). However, during FY11, the dividend payout of the company was reduced to 54% on account of financing the upcoming new blending plant. Neverheless, going forward we expect the company to maintain stable dividend policy. Hence, LLUB would find its way to an equity portfolio based on recurring income in terms of dividends.
LB Finance is a leading registered finance company engag ed in Leasing and Hire Purchase business. Company is operating with a total asset base of LKR 38 bn as at end December 2011, and an island wide branch net work of 26. With satisfactory liquidity levels and capital adequacies, company is poised to take advantage in any growth in credit demand. However, with the recent rise in interest rates and limit imposed on credit growth we do not expect an exceptional performance in coming quarters, yet company would stay ahead of other finance companies consequent to its strong fundamentals, high interest margins, high ROE etc...Therefore we rate LFIN as a worthwhile investment with a time span of medium to long term.
Glass giant Piramal Glass Ceylon PLC (GLAS) is a domestic monopoly and a manufacturer of flacconage glass for food and beverages, cosmetics, perfumery, as well as pharmaceutical sectors. The company continues with its simple yet steadfast objective of fully serving the domestic market which is well on its way to recovery as well as increasing the business in the specialized liquor and beverage segment in the international markets. Thus, given the expected growth in the manufacturing sector steered by economic development in the island together with the company’s change in product mix from generic to premium, the glass giant expects to deliver robust ROE’s in medium to long term.
Focus on Investment
0
50
100
150
200
250
8/25/2011 10/10/2011 11/25/2011 1/9/2012 2/24/2012 4/10/2012 5/28/2012 7/11/2012 8/23/2012
LKR
HNB
0
20
40
60
80
100
120
8/25/2011 10/10/2011 11/25/2011 1/9/2012 2/24/2012 4/10/2012 5/28/2012 7/11/2012 8/23/2012
LKR
HNBX
140
145
150
155
160
165
170
175
180
185
190
8/25/2011 10/10/2011 11/25/2011 1/9/2012 2/24/2012 4/10/2012 5/28/2012 7/11/2012 8/23/2012
LK
R
LLUB
0
20
40
60
80
100
120
140
160
180
200
8/25/2011 10/10/2011 11/25/2011 1/9/2012 2/24/2012 4/10/2012 5/28/2012 7/11/2012 8/23/2012
LK
R
LFIN
0
1
2
3
4
5
6
7
8
9
10
8/25/2011 10/10/2011 11/25/2011 1/9/2012 2/24/2012 4/10/2012 5/28/2012 7/11/2012 8/23/2012
LK
R
GLAS

Sri Lanka Focus 24th August 2012 ASIA RESEARCH TEAM 11
Focus on Investment
Ceylon Tobacco Company Bev Food & Tobacco
N – LKR 690.00
Ceylon Tobacco's (CTC) is the monopoly market operator for manufacturing, marketing and importing cigarettes in Sri Lanka. The company segregates the market based on income levels and markets Dunhill and Bensons for high income category along with Gold leaf for the middle income category, followed by Four Aces, Three Roses and Capstan for the low income category and Pall Mall as a value for money product. Company has paid circa LKR6.5bn during FY11. This records a payout of 98.7%. Going forward we do not expect a drastic change in their Dividend policies.
0
100
200
300
400
500
600
700
800
8/25/2011 10/10/2011 11/25/2011 1/9/2012 2/24/2012 4/10/2012 5/28/2012 7/11/2012 8/23/2012
LK
R
CTC

Sri Lanka Focus 24th August 2012 ASIA RESEARCH TEAM 12
As at 24th of August 2012
Rights issues
Pelwatte Sugar* : 01 for 04 rights issue at LKR18.00 * Rights issue would be delayed until the outcome of the proposed Act with regard to acquisition of its land by the State is known.
Infrastructure Developers : 01 for 03 right issue at LKR 80.0;XR 16-08-2012; Right Trading Commence 22-08-2012 Last Date of
Acceptance & Payment 30-08-2012 Regnis Lanka : 01 for 06 rights issue at LKR69.00 (Dates to be notified)
Scrip Dividend
Chilaw Finance: one (01) for every 17.7778 existing shares held at a consideration of LKR12.0
Stock Exchange Anouncements

Sri Lanka Focus 24th August 2012 ASIA RESEARCH TEAM 13
Dividend Announcements
Company Dividend per share XD Date Payment Date
The Kandy Hotels Company Final Dividend of LKR 0.015 20.08.2012 28.08.2012
Arpico Finance Company PLC First & Final Dividend of LKR 2.00 23.08.2012 03.09.2012
Lanka Walltiles Final Dividend of LKR 3.00
Trade Finance & Investments Final Dividend of LKR 0.65 03.09.2012 11.09.2012
Distilleries Company of Sri Lanka Final Dividend of LKR3.00
Harischandra Mills Final Dividend of LKR20.00 24.09.2012 02.10.2012
Lanka Ventures Plc Final Dividend of LKR1.50 17-09-2012 25-09-2012
Swadeshi Industrial Works Final Dividend of LKR1.00 17-09-2012 25-09-2012
Lanka Ventures Plc Final Dividend of LKR1.50 17.09.2012 25.09.2012
Lanka Ashok Leyland Plc First & Final Dividends of LKR60.00 18.09.2012 26.09.2012
Orient Finance Plc Final Dividend of LKR0.15
ACL Plastics Interim Dividend of LKR1.00 20.08.2012 29.08.2012
Commercial Credit and finance Plc First & Final Dividend LKR 1.00 24-09-2012 02-10-2012
Convenience Foods (Lanka)Plc First & Final Dividend LKR 1.00 20-09-2012 28-09-2012
J.L Morison sons & Jones (Ceylon) Plc Second & Final Dividend LKR2.00 (tax free)
Senkadagala Finance Plc Final Dividend of LKR 0.55 16-08-2012 24-08-2012
Lanka Aluminium Industries Plc First & Final Dividend LKR 0.50 25-09-2012 03-10-2012
Free Lanka Capital Holdings Plc First & Final Dividends LKR 0.05 27-09-2012 05-10-2012
Commercial Credit & Finance Plc First and Final Dividend LKR 1.00 24-09-2012 02-10-2012
Lanka Ceramic Plc Final Dividend of LKR 1.10
CT Land Development Plc Final Dividend of LKR 0.80 17-09-2012 25-09-2012
Ceylon Tea Brokers Plc First & Final Dividend LKR 0.25 28-08-2012 07-09-2012
Royal Palms Beach Hotels First & Final Dividend LKR 0.80 03-09-2012 12-09-2012
Tangarine Beach Hotels First & Final Dividend LKR 0.50 03-09-2012 12-09-2012
Abans Electricals Final Dividend of LKR 2.00 18-09-2012 26-09-2012
Lanka Milk Foods (CWE) First & Final Dividend LKR 1.00 19-09-2012 25-09-2012
Cargills (Ceylon) Final Div of LKR1.30 (Out of Dividend Income-net of Tax) 21-09-2012 01-10-2012
Renuka City Hotels First & Final Dividend LKR 6.00 24-09-2012 28-09-2012
Cargo Boat Development Company First & Final Dividend LKR 2.00 24-09-2012 28-09-2012
Gestetner of Ceylon Final Dividend of LKR 1.50 26-09-2012 28-09-2012
Office Equipment Final Dividend of LKR 30.00 01-10-2012 09-10-2012
Lake House Printers And Publishers Final Dividend of LKR 1.00 28-09-2012 08-10-2012
Kelani Cables Second Interim Dividend of LKR 1.00 05-09-2012 14-09-2012
The Autodrome Interim Dividend of LKR3.00 05-09-2012 14-09-2012
Stock Exchange Anouncements

Sri Lanka Focus 24th August 2012 ASIA RESEARCH TEAM 14
Company
YE
SH(mn)
M.CAP(Bn)
Price
Earnings (LKR mn) EPS PE DPS
DY
ROE
BVPS
PBV FY10 FY11 FY12 FY13E FY14E FY10 FY11 FY12 FY13E FY14E FY10 FY11 FY12 FY13E FY14E
FINANCIAL SERVICES
HNB Dec 317.28 44.7 141.0 4,786.8 6,148.8 8,265.4 10,003.5 11,625.6 12.1 15.5 20.8 25.2 29.3 11.7 9.1 6.8 5.6 4.8 7.50 5.3% 15% 101.8 1.4
HNB(NV) Dec 79.46 7.7 97.0 4,786.8 6,148.8 8,265.4 10,003.5 11,625.6 12.1 15.5 20.8 25.2 29.3 8.0 6.3 4.7 3.8 3.3 7.50 7.7% 15% 101.8 1.0
Commercial Bank Dec 779.11 80.2 103.0 5,508.0 8,094.7 9,689.9 10,791.3 12,960.3 6.6 9.7 11.6 13.0 15.6 15.6 10.6 8.9 7.9 6.6 6.00 5.8% 18% 53.5 1.9
Commercial Bank(NV) Dec 53.47 4.3 80.2 5,508.0 8,094.7 9,689.9 10,791.3 12,960.3 6.6 9.7 11.6 13.0 15.6 12.1 8.2 6.9 6.2 5.2 6.00 7.5% 18% 53.5 1.5
Sampath Bank Dec 162.48 28.6 176.1 3,484.5 4,150.6 5,422.9 6,818.3 8,146.1 21.4 25.5 33.4 42.0 50.1 8.2 6.9 5.3 4.2 3.5 9.00 5.1% 20% 128.2 1.4
NDB Bank Dec 164.20 19.3 117.5 2,102.6 2,705.5 3,184.6 3,997.5 4,973.1 12.8 16.5 19.4 24.3 30.3 9.2 7.1 6.1 4.8 3.9 3.50 3.0% 15% 104.1 1.1
CONGLOMERATES
John Keells Hold. Mar 850.72 165.9 195.0 5,201.5 8,245.6 9,775.0 10,975.6 12,425.0 6.1 9.7 11.5 12.9 14.6 31.9 20.1 17.0 15.1 13.4 3.00 1.5% 12% 83.7 2.3
Aitken Spence Hold. Mar 406.00 45.1 111.0 2,059.6 2,536.0 3,709.2 3,788.5 5,089.4 5.1 6.2 9.1 9.3 12.5 21.9 17.8 12.1 11.9 8.9 0.63 0.6% 12% 56.9 1.9
FOOD & BEVERAGE
Distilleries Mar 300.00 36.0 120.0 2,135.7 8,124.0 4,796.5 6,456.3 8,918.3 7.1 27.1 16.0 21.5 29.7 16.9 4.4 7.5 5.6 4.0 3.00 2.5% 24% 112.5 1.1
Ceylon Tobacco Dec 187.32 129.3 690.0 5,097.1 6,568.8 8,194.5 10,122.7 12,358.4 27.2 35.1 43.7 54.0 66.0 25.4 19.7 15.8 12.8 10.5 43.31 6.3% 184% 19.0 36.3
TOURISM
Asian Hotels & Properties Mar 442.8 34.6 78.2 629.8 1,774.5 2,150.6 2,580.7 2,941.2 1.4 4.0 4.9 5.8 6.6 52.7 18.7 16.1 13.4 11.8 1.00 1.3% 13% 33.8 2.3
Aitken Spence Hotel Mar 336.3 23.2 69.0 523.8 1,034.1 1,395.3 2,034.2 2,442.5 1.6 3.1 4.1 6.0 7.3 44.3 22.4 16.6 11.4 9.5 0.00 0.0% 12% 33.1 2.1
MANUFACTURING
Chevron Lubricants Dec 120.00 21.7 180.5 1,501.3 2,000.6 2,361.4 2,754.2 3,206.0 12.5 16.7 19.7 23.0 26.7 14.4 10.8 9.2 7.9 6.8 9.00 5.0% 63% 26.3 6.9
Tokyo (V) Mar 202.50 5.8 28.5 369.3 855.7 978.9 1,414.0 1,461.6 1.2 2.8 3.2 4.7 4.8 23.4 10.1 8.8 6.1 5.9 1.00 3.5% 16% 20.6 1.4
Tokyo (NV) Mar 101.25 2.0 19.7 369.3 855.7 978.9 1,622.7 1,780.1 1.2 2.8 3.2 5.3 5.9 16.2 7.0 6.1 3.7 3.4 1.00 5.1% 16% 20.7 1.0
Piramal Glass Mar 950.09 4.8 5.1 (61.1) 578.7 686.4 803.1 735.6 (0.1) 0.6 0.7 0.8 0.8 N/A 8.4 7.1 6.0 6.6 0.36 7.1% 21% 3.4 1.5
CHEMICAL & PHARM
CIC Holdings (V) Mar 72.90 4,957.2 68.0 589.6 926.6 916.5 1,078.2 1,394.0 8.1 12.7 12.6 14.8 19.1 8.4 5.4 5.4 4.6 3.6 2.80 4.1% 13% 76.3 0.9
CIC Holdings (NV) Mar 21.87 1,246.6 57.0 589.6 926.6 916.5 1,078.2 1,394.0 27.0 42.4 41.9 49.3 63.7 2.1 1.3 1.4 1.2 0.9 2.80 4.9% 13% 76.3 0.7
MOTOR
DIMO Mar 8.88 5.4 605.0 278.3 2,121.8 2,697.3 2,613.6 2,866.0 31.4 239.0 344.4 324.1 358.8 19.3 2.5 2.2 2.4 2.1 12.50 2.1% 41% 800.4 0.8
PLANTATIONS
Kegalle Plantations Mar 25.00 2.3 93.0 376.1 837.7 681.5 759.8 764.0 15.0 33.5 27.3 30.4 30.6 6.2 2.8 3.4 3.1 3.0 3.00 3.2% 24% 115.6 0.8
Namunukula Plantations Mar 23.75 1.3 56.7 146.7 409.3 374.7 509.1 645.1 6.2 17.2 15.8 21.4 27.2 9.2 3.3 3.6 2.6 2.1 1.00 1.8% 24% 65.8 0.9
Kotagala Plantations Mar 32.00 1.8 54.8 323.2 667.8 438.6 569.3 620.9 10.1 20.9 13.7 17.8 19.4 5.4 2.6 4.0 3.1 2.8 10.00 18.2% 18% 71.6 0.8
Laugfs Gas (Voting) Mar 335.00 7.1 21.2 243.1 852.7 942.3 968.0 1,185.1 0.6 2.2 2.4 2.5 3.1 33.7 9.6 8.7 8.5 6.9 1.50 7.1% 18% 15.9 1.3
Laugfs Gas (Non voting) Mar 52.00 0.7 13.8 243.1 852.7 942.3 968.0 1,185.1 0.6 2.2 2.4 2.5 3.1 22.0 6.3 5.7 5.5 4.5 1.50 10.9% 18% 17.5 0.8
Valuation Guide
*Companies with their financial year ending in December would carry forecasted figure for FY12.

Sri Lanka Focus 24th August 2012 ASIA RESEARCH TEAM 15
Broad Market Guide
Company Year End
Price (LKR)
Price Performance Shares Mn
Trailing ROE
BVPS
Net Profits 4 Qtrs trailing
Net Profits (mn) Trailing EPS
Trailing PE
PBV
Market Cap (mn) 1W(%) 1M(%) 1Q(%) Mar'12 Dec'11 Sep'11 Jun'11
MARKET 16.16% 165,539.89 45,577.35 39,162.64 44,337.08 34,800.12 11.58 1.87 1,916,800.00
FINANCIAL SERVICES - - - 16.34% 45,910.90 11,077.28 10,558.85 10,777.40 8,666.54 9.94 1.63
Banking 29,580.32 7,092.24 6,586.11 5,704.73 4,861.60
COMMERCIAL BANK [V] COMB MainB D 103.00 0.69 5.98 (2.10) 779.11 19.12% 55.77 8,879.50 2,849.70 1,989.00 2,064.80 1,976.00 10.66 9.7 1.8 80,248.54
COMMERCIAL BANK [NV] COMB MainB D 80.20 0.25 5.11 1.52 53.47 19.12% 55.77 8,879.50 2,849.70 1,989.00 2,064.80 1,976.00 10.66 7.5 1.4 4,288.59
DFCC BANK DFCC MainB M 114.50 2.23 8.74 (1.80) 265.10 11.36% 96.82 2,914.92 765.47 936.83 529.58 683.04 11.00 10.4 1.2 30,353.69
HNB [V] HNB MainB D 141.00 5.22 0.71 (7.54) 317.28 15.90% 102.45 6,460.84 1,533.32 2,254.16 1,380.84 1,292.53 16.28 8.7 1.4 44,736.27
HNB [NV] HNB MainB D 97.00 1.04 6.01 3.19 79.46 15.90% 102.45 6,460.84 1,533.32 2,254.16 1,380.84 1,292.53 16.28 6.0 0.9 7,707.41
NATIONS TRUST BANK NTB MainB D 51.60 6.17 12.42 7.72 230.61 18.33% 37.00 1,563.74 405.70 363.94 433.70 360.40 6.78 7.6 1.4 11,899.34
NDB NDB MainB D 117.50 0.09 14.08 1.29 164.20 15.88% 104.99 2,737.07 720.87 998.63 620.89 396.68 16.67 7.0 1.1 19,293.72
PAN ASIA BANK PABC MainB D 19.00 1.06 11.76 (0.52) 295.04 23.49% 11.90 824.53 196.55 209.19 208.77 210.03 2.79 6.8 1.6 5,605.78
SAMPATH BANK SAMP MainB D 176.10 6.61 15.72 7.91 162.48 20.76% 138.30 4,664.77 1,494.20 886.54 1,149.23 1,134.80 28.71 6.1 1.3 28,612.37
SEYLAN BANK [V] SEYB MainB D 54.00 0.37 2.86 (8.47) 173.33 6.50% 53.18 1,169.25 412.49 664.15 396.51 (303.90) 3.46 15.6 1.0 9,360.00
SEYLAN BANK [NV] SEYB MainB D 27.00 2.66 8.00 17.39 164.75 6.50% 53.18 1,169.25 412.49 664.15 396.51 (303.90) 3.46 7.8 0.5 4,448.16
HDFC HDFC MainB D 51.70 1.96 1.56 1.56 64.71 16.25% 34.77 365.70 125.36 111.62 8.20 120.52 5.65 9.1 1.5 3,345.53
UNION BANK UBC MainB D 13.40 - - (13.07) 349.25 6.01% 15.07 316.35 74.92 107.52 62.68 71.23 0.91 14.8 0.9 4,679.95
Finance Co.s & / Merchant Banks 26.52% 12,810.09 3,428.17 2,052.40 4,723.89 3,112.99
ASIA CAPITAL ACAP MainB M 30.90 2.66 (3.44) (7.21) 110.00 68.52% 9.46 712.69 (72.52) (195.27) 979.84 0.64 6.48 4.8 3.3 3,399.00
ALLIANCE FINANCE ALLI MainB M 624.90 1.53 4.03 17.88 2.43 33.06% 514.24 413.14 117.71 117.65 95.85 81.93 170.02 3.7 1.2 1,518.51
ARPICO FINANCE ARPI MainB M 83.80 (3.12) 3.46 1.95 4.46 10.42% 77.65 36.10 14.90 8.33 9.11 3.76 8.09 10.4 1.1 373.96
CENTRAL FINANCE CFIN MainB M 137.00 5.96 6.37 0.22 104.88 20.05% 127.24 2,675.49 648.67 739.97 668.66 618.20 25.51 5.4 1.1 14,369.02
NATION LANKA CSF MainB M 8.20 6.41 9.21 1.22 249.91 na 2.24 (151.89) (80.37) (27.98) (8.78) (34.77) na na 3.7 2,049.29
LOLC LOLC MainB M 42.20 5.00 10.53 31.25 475.20 32.87% 40.84 6,379.39 1,992.41 673.82 1,988.12 1,725.04 13.42 3.1 1.0 20,053.44
LB FINANCE LFIN MainB M 119.00 1.02 7.21 6.73 69.26 40.56% 57.85 1,625.08 487.04 437.87 349.15 351.02 23.46 5.1 2.1 8,241.60
MERCHANT BANK MBSL MainB D 22.30 (4.70) 6.70 10.95 135.00 7.63% 22.96 236.49 16.52 45.57 126.16 48.23 1.75 12.7 1.0 3,010.50
PEOPLE'S MERCHANT PMB MainB M 13.40 3.08 3.88 2.29 67.50 2.86% 13.91 26.90 (110.23) (3.84) 5.90 135.06 0.40 33.6 1.0 904.50
SMB LEASING PLC [V] SEMB MainB D 1.00 - - - 1191.77 na 0.50 (11.23) 6.63 (6.18) 10.48 (22.15) na na 2.0 1,191.77
SMB LEASING PLC [NV] SEMB MainB D 0.40 - - - 614.07 na 0.50 (11.23) 6.63 (6.18) 10.48 (22.15) na na 0.8 245.63
THE FINANCE TFC MainB M 20.10 (3.48) (3.00) (8.92) 57.97 na na (196.76) (212.61) (17.50) 6.96 26.39 na na na 1,165.12
THE FINANCE[NV] TFC MainB M 5.00 4.17 4.17 - 100.00 na na (196.76) (212.61) (17.50) 6.96 26.39 na na na 500.00
SOFTLOGIC FINANCE CRL DiriSaviB M 28.20 (3.09) (14.55) (23.78) 37.45 9.47% 29.79 105.63 52.38 53.25 2.82 10.0 0.9 1,056.20
PEOPLES LEASING FINANCE SMLL DiriSaviB D 26.30 (2.59) 5.20 13.85 74.58 18.02% 25.22 339.03 200.21 138.83 4.55 5.8 1.0 1,961.37
VALLIBEL FINANCE VFIN MainB M 32.10 0.31 7.72 (6.96) 41.55 34.05% 16.32 230.94 57.03 65.60 60.15 48.15 5.56 5.8 2.0 1,333.77
SINHAPUTRA SFL DiriSaviB M 75.30 (5.88) (4.08) 2.59 6.30 9.26% 124.64 72.69 30.08 32.61 11.55 6.5 0.6 474.08
SINGER FINANCE SFIN MainB M 13.20 7.38 19.09 (2.24) 165.33 18.44% 6.59 200.99 46.04 57.34 46.34 51.27 1.22 10.9 2.0 2,182.40
BIMPUTH LANKA INVESTMENTS BLI DiriSaviB M 20.30 (5.58) (13.62) (3.33) 20.20 4.06% 11.98 9.82 - 3.40 0.49 41.7 1.7 410.06
TRADE FINANCE TFIL DiriSaviB M 12.00 6.78 - - 56.80 17.93% 10.20 103.90 54.11 1.83 6.6 1.2 681.60

Sri Lanka Focus 24th August 2012 ASIA RESEARCH TEAM 16
Broad Market Guide
Company Year Price Price Performance Shares Trailing BVPS Net Profit Net Profits Trailing Trailing PBV Mkt Cap Mn
End (LKR) 1W(%) 1M(%) 1Q(%) Mn ROE 4Qtrs Mar'12 Dec'11 Sep'11 Jun'11 EPS PE
CITIZENS DEVELOPMENT FINANCE CDB MainB M 34.90 (0.29) 9.06 5.76 46.30 27.58% 42.25 632.77 234.27 157.03 161.27 80.20 11.65 3.0 0.8 1,615.84
CITIZENS DEVELOPMENT FINANCE [NV] CDB MainB M 28.30 2.17 4.44 (36.91) 8.01 27.58% 42.25 632.77 234.27 157.03 161.27 80.20 11.65 2.4 0.7 226.57
SENKADAGALA FINANCE SFCL DiriSaviB M 20.00 - - - 53.37 34.42% 29.01 532.98 153.74 145.84 128.64 104.76 9.99 2.0 0.7 1,067.36
SWARNAMAHAL FINANCE SFS DiriSaviB M 5.70 (3.45) (9.68) (26.32) 500.00 32.39% 0.87 140.75 64.17 76.58 0.28 20.2 6.6 2,850.00
CHILAW FINANCE LIMITED CFL DiriSaviB M 16.00 3.40 4.83 9.35 28.08 12.24% 11.57 39.78 21.18 18.60 1.42 11.3 1.4 449.34
COMMERCIAL CREDIT LIMITED COCR DiriSaviB M 14.90 (0.67) 4.93 (0.67) 218.07 65.39% 5.73 816.58 551.05 265.53 3.74 4.0 2.6 3,249.31
MERCANTILE INVESTMENTS MERC DiriSaviB M 2200.00 - - - 3.01 8.85% 1766.87 470.29 (152.64) 622.67 156.45 14.1 1.2 6,613.20
MULTI FINANCE MFL DiriSaviB M 21.70 7.43 4.83 29.17 22.46 5.56% 20.15 25.16 14.20 10.96 1.12 19.4 1.1 487.43
LANKA ORIX FINANCE LOFC DiriSaviB M 3.50 2.94 9.38 12.90 2800.00 26.17% 1.70 1,245.79 628.31 617.48 0.44 7.9 2.1 9,800.00
ABANS FINANCIAL SERVICES AFSL DiriSaviB M 35.50 6.61 (6.08) 25.89 37.00 13.22% 10.92 53.41 32.08 21.33 1.44 24.6 3.3 1,313.50
CENTRAL INV & FINPLC CIFL MainB M 3.90 (2.50) - (2.50) 83.43 1.14% 8.44 8.00 0.83 1.52 2.75 0.10 40.7 0.5 325.36
ASSOCIATED MOTOR FINANCE PLC AMF DiriSaviB M 350.00 - 2.94 - 5.61 28.34% 87.60 139.21 79.92 47.33 28.93 24.82 14.1 4.0 1,962.92
CAPITAL ALLIANCE FINANCE LIMITED CALF DiriSaviB M 26.80 (0.37) (3.55) 8.37 33.92 6.82% 6.86 15.87 7.84 10.50 0.47 57.3 3.9 909.06
NANDA INVESTMENTS AND FINANCE NIFL DiriSaviB M 6.00 - 9.26 1.72 100.72 8.73% 5.01 44.06 31.40 6.90 0.44 13.7 1.2 604.30
SOFTLOGIC CAPITAL LIMITED SCAP DiriSaviB M 6.70 (0.93) (1.85) (1.85) 299.20 na na (182.66) (402.06) 83.76 na na na 2,004.64
ENTRUST ESL DiriSaviB M 17.70 0.57 4.12 12.74 33.00 3.31% 18.30 20.00 (46.80) 0.61 29.2 1.0 584.10
PEOPLE’S LEASING PLC MainB M 10.70 (0.93) (1.85) (1.85) 1560.00 24.06% 12.00 4,503.00 1,154.00 832.00 2.89 3.7 0.9 16,692.00
ASIA ASSET FINANCE LIMITED AAF DiriSaviB M 2.70 - - (7.14) 559.47 na na na na na na 1,510.57
ORIENT FINANCIAL SERVICE ORIN DiriSaviB M 18.90 6.78 18.13 - 115.63 na na na na na na 2,185.31
SANASA DEVELOPMENT BANK SDB DiriSaviB M 75.00 (3.85) (13.59) - 25.18 na na na na na na 1,888.15
COMMERCIAL LEASING & FINANCE CLC DiriSaviB M 3.10 3.33 - - 6377.71 na na na na na na 19,770.90
Insurance 3,138.22 389.22 1,969.91 189.97 586.54
AMANA TAKAFUL INS. ATL DiriSaviB D 1.60 - - (5.88) 1000.00 na 0.88 (74.75) (85.91) 11.20 na na 1.8 1,600.00
ASIAN ALLIANCE AAIC DiriSaviB D 85.00 (1.16) (3.52) (1.16) 37.50 na 33.22 na 44.73 (172.50) na na 2.6 3,187.50
CEYLINCO INSURANCE [V] CINS MainB D 790.00 12.02 6.03 (7.06) 20.00 14.89% 403.03 1,584.80 220.66 929.03 90.76 344.36 60.00 13.2 2.0 15,800.00
CEYLINCO INSURANCE [NV] CINS MainB D 300.00 5.23 (3.23) (5.57) 6.41 14.89% 403.03 1,584.80 220.66 929.03 90.76 344.36 60.00 5.0 0.7 1,924.34
AVIVA NDB CTCE MainB D 275.00 (1.79) 66.77 77.42 30.00 na 119.68 na 63.35 27.61 34.20 na na 2.3 8,250.00
HNB ASSURANCE HASU MainB D 44.60 4.94 11.50 11.50 50.00 18.18% 30.67 278.84 28.95 211.87 13.40 24.62 5.58 8.0 1.5 2,230.00
UNION ASSURANCE UAL MainB D 97.00 6.48 15.48 12.53 75.00 24.34% 39.06 713.04 76.27 514.02 58.21 64.55 9.51 10.2 2.5 7,275.00
JANASHAKTHI JINS DiriSaviB D 10.10 2.02 2.02 3.06 363.00 21.39% 8.20 636.29 356.17 280.12 1.75 5.8 1.2 3,666.30
Venture Capital Co.s 382.27 167.65 -49.58 158.80 105.40
CAPITAL DEV & INV COMPANY CDIC MainB D 310.00 2.11 24.00 33.74 43.86 6.59% 123.00 355.70 88.69 163.86 72.17 30.97 8.11 38.2 2.5 13,595.05
FIRST CAPITAL CFVF MainB M 12.00 25.77 28.42 22.00 101.25 na 11.25 (173.84) (73.30) (214.88) 57.39 56.94 na na 1.1 1,215.00
LANKA VENTURES LVEN MainB M 32.80 8.97 21.93 21.03 50.00 21.64% 18.52 200.42 152.26 1.44 29.23 17.50 4.01 8.2 1.8 1,640.00

Sri Lanka Focus 24th August 2012 ASIA RESEARCH TEAM 17
Broad Market Guide
Company Year Price Price Performance Shares Trailing BVPS Net Profit Net Profits Trailing Trailing PBV Mkt Cap Mn
End (LKR) 1W(%) 1M(%) 1Q(%) Mn ROE 4Qtrs Mar'12 Dec'11 Sep'11 Jun'11 EPS PE
BEVERAGE FOOD AND TOBACCO - - - 29.46% 24,768.80 8,255.73 5,321.25 6,095.97 5,099.25 13.39 3.95
BAIRAHA FARMS BFL MainB M 133.30 2.54 9.17 19.77 16.00 36.05% 98.37 567.38 149.99 283.71 78.50 55.18 35.46 3.8 1.4 2,132.80
CARGILLS CARG MainB M 135.00 (1.59) 0.59 (11.24) 224.00 14.43% 34.20 1,105.02 322.24 237.46 219.35 325.97 4.93 27.4 3.9 30,240.00
CEYLON BREWERY BREW MainB M 320.00 16.28 3.26 (8.57) 20.99 36.56% 128.37 984.94 92.39 406.88 309.42 176.25 46.93 6.8 2.5 6,716.19
CEYLON COLD STORES CCS MainB M 124.10 0.08 4.73 28.60 95.04 30.75% 76.72 2,242.41 1,546.06 383.38 188.68 124.29 23.59 5.3 1.6 11,794.46
CEYLON TEA SERVICES CTEA MainB M 646.00 (0.63) (1.37) 2.54 20.00 24.62% 338.35 1,665.96 834.87 476.43 104.08 250.58 83.30 7.8 1.9 12,920.00
CEYLON TOBACCO CTC MainB D 690.00 2.22 2.99 2.83 187.32 196.00% 19.73 7,244.00 1,489.0 1,951.00 1,985.00 1,819.00 38.67 17.8 35.0 129,253.39
COCO LANKA [V] COCO MainB M 52.30 (0.19) 14.35 20.37 21.60 11.20% 57.72 151.23 18.61 62.75 51.59 18.28 6.46 8.1 0.9 1,129.68
COCO LANKA [NV] COCO MainB M 37.90 (0.79) 10.50 22.26 1.80 11.20% 57.72 151.23 18.61 62.75 51.59 18.28 6.46 5.9 0.7 68.22
CONVENIENCE FOOD SOY MainB M 151.90 4.11 (0.07) 6.82 2.75 22.97% 91.80 57.98 5.43 15.02 25.81 11.73 21.08 7.2 1.7 417.73
DISTILLERIES DIST MainB M 120.00 0.84 (1.64) (11.41) 300.00 16.30% 122.32 5,981.64 2,857.87 273.50 1,611.34 1,238.92 19.94 6.0 1.0 36,000.00
HARISCHANDRA MILLS HARI MainB M 2600.00 (0.96) 8.33 4.00 0.96 17.50% 612.37 102.84 42.74 23.57 23.41 13.13 107.14 24.3 4.2 2,495.48
KEELLS FOOD PRODUCTS KFP MainB M 64.90 4.33 (18.65) 64.90 64.90 28.65% 6.97 129.64 45.00 51.09 17.73 15.82 2.00 32.5 9.3 4,212.01
KOTMALE HOLDINGS LAMB MainB M 31.50 6.78 11.31 4.65 31.40 11.02% 19.56 67.69 7.95 21.93 15.71 22.09 2.16 14.6 1.6 989.10
LION BREWERY LION MainB M 229.90 9.48 9.48 9.48 80.00 24.23% 65.12 1,262.23 186.85 443.18 299.81 332.40 15.78 14.6 3.5 18,392.00
LANKA MILK FOODS LMF MainB M 90.00 (0.22) (0.22) 11.41 40.00 9.01% 51.99 187.33 (39.16) 49.75 119.33 57.41 4.68 19.2 1.7 3,599.82
NESTLE LANKA NEST MainB D 1,175.10 (0.37) (2.08) 2.18 53.73 65.34% 70.64 2,479.62 461.82 605.60 767.85 644.35 46.15 25.5 16.6 63,132.79
THREE ACRE FARMS TAFL MainB D 50.20 (1.95) (9.03) 21.74 23.55 22.22% 35.04 183.33 64.81 37.03 78.46 3.03 7.79 6.4 1.4 1,181.96
RENUKA AGRI RAL DiriSaviB M 4.40 4.88 4.40 4.40 561.75 27.85% 2.11 330.15 160.62 172.93 0.59 7.5 2.1 2,471.70
TEA SMALLHOLDERS TSML MainB M 44.90 13.74 - (8.20) 30.00 na 21.11 (1.29) 0.56 (1.03) 8.35 (9.18) na na 2.1 1,347.00
RAIGAM WAYAMBA SALTERNS LTD RWSL DiriSaviB M 2.70 12.00 7.69 16.67 282.21 3.78% 2.51 26.72 8.10 18.62 0.09 28.5 1.1 761.96
HVA FOODS HVA DiriSaviB M 13.20 (0.75) 5.56 31.68 66.43 2.17% 7.14 10.28 6.98 4.99 0.15 85.3 1.8 876.86
CHEMICALS & PHARMACEUTICALS 1.50 (2.07) (14.07) 12.34% 2,532.05 505.78 1,070.90 413.81 541.55 7.16 0.88
CHEMANEX CHMX MainB M 68.10 0.74 (6.07) (9.32) 15.75 0.48% 78.67 5.96 (8.49) 22.99 (9.69) 1.14 0.38 180.1 0.9 1,072.58
CHEMICAL INDUSTRIES [V] CIC MainB M 68.00 (2.86) (11.69) (27.66) 72.90 12.47% 77.52 916.46 155.60 369.99 187.07 203.80 9.67 7.0 0.9 4,957.20
CHEMICAL INDUSTRIES [NV] CIC X MainB M 57.00 3.26 3.07 (5.00) 21.87 12.47% 77.52 916.46 155.60 369.99 187.07 203.80 9.67 5.9 0.7 1,246.59
HAYCARB HAYC MainB M 158.00 6.76 6.04 5.26 29.71 15.34% 118.28 539.02 132.72 140.50 141.03 124.77 18.14 8.7 1.3 4,694.56
INDUSTRIAL ASPHALTS ASPH MainB M 262.00 2.15 (12.73) (18.19) 0.67 4.16% 10.98 2.96 1.11 0.51 0.73 0.61 4.44 59.0 23.9 174.64
J.L. MORISON [V] MORI MainB M 180.00 0.06 0.33 - 5.81 11.26% 247.21 210.09 81.41 52.24 38.99 37.45 27.82 6.5 0.7 1,045.49
J.L. MORISON [NV] MORI MainB M 120.00 3.45 (4.00) 21.83 1.74 11.26% 247.21 210.09 81.41 52.24 38.99 37.45 27.82 4.3 0.5 209.10
LANKEM CEYLON LCEY MainB M 132.00 3.94 1.54 (19.51) 24.00 14.15% 162.60 552.21 42.27 403.01 (4.29) 111.22 23.01 5.7 0.8 3,168.00
SINGALANKA SING MainB M 64.90 - 9.08 13.86 5.54 na 52.12 (7.20) (13.77) 6.79 (0.11) (0.11) na na 1.2 359.60
MULLERS MULL MainB M 1.60 6.25 13.33 6.25 283.00 28.98% 0.53 43.51 19.06 7.10 8.82 8.53 0.15 10.4 3.0 452.80
UNION CHEMICALS UCAR MainB D 493.70 0.33 (1.48) (14.14) 1.50 21.33% 184.27 58.96 14.47 15.53 12.27 16.70 39.30 12.6 2.7 740.55
PC PHARMA PCP DiriSaviB 11.30 (4.24) (1.74) (20.42) 101.00 47.38% 2.70 129.06 46.36 na 1.28 8.8 4.2 1,141.30
CONSTRUCTIONS 1.11 1.37 (5.59) 11.90% 1,629.57 394.17 592.24 492.45 150.71 10.96 1.31
COLOMBO DOCKYARD DOCK MainB D 200.00 1.07 6.10 (0.80) 71.86 22.38% 129.59 2,084.39 745.17 673.27 455.47 210.49 29.01 6.9 1.5 14,371.78
LANKEM DEVELOPMENTS LDEV MainB M 6.80 4.62 - (1.45) 60.00 na 14.17 (470.13) (250.85) (69.54) (148.13) (1.61) na na 0.5 408.00
MTD WALKERS KAPI MainB M 27.00 - 21.08 56.98 114.36 0.43% 30.84 15.30 (100.14) (11.50) 185.11 (58.16) 0.13 201.8 0.9 3,087.64
ACCESS ENGINEERING LIMITED AEL DiriSaviB M 16.00 1.27 (5.33) (15.79) 1000.00 765.52 765.52 16,000.00

Sri Lanka Focus 24th August 2012 ASIA RESEARCH TEAM 18
Broad Market Guide
Company Year Price Price Performance Shares Trailing BVPS Net Profit Net Profits Trailing Trailing PBV Mkt Cap Mn
End (LKR) 1W(%) 1M(%) 1Q(%) Mn ROE 4Qtrs Mar'12 Dec'11 Sep'11 Jun'11 EPS PE
DIVERSIFIED 0.88 2.29 (2.32) 18.46% 34,266.55 10,898.21 6,097.25 12,062.17 6,985.09 12.56 2.08
AITKEN SPENCE SPEN MainB M 111.00 1.65 0.45 0.91 406.00 14.52% 62.93 3,709.16 1,756.50 818.74 583.18 550.74 9.14 12.1 1.8 45,065.56
CARSON CUMBERBATCH CARS MainB M 417.10 (0.74) (9.17) (10.65) 196.39 21.05% 139.43 5,762.76 1,383.67 252.55 620.22 3,506.32 29.34 14.2 3.0 81,912.98
CEYLON THEATRES CTHR MainB M 130.50 3.08 (4.82) (11.89) 183.10 9.90% 68.50 1,242.12 439.74 277.40 280.92 244.05 6.78 19.2 1.9 23,894.19
COLOMBO FORT LAND CFLB MainB M 27.10 1.86 9.60 4.58 180.00 21.28% 27.47 1,052.43 385.72 477.78 98.61 90.32 5.85 4.6 1.0 4,878.00
FINLAYS COLOMBO JFIN MainB D 260.00 (8.77) 4.00 26.15 35.00 5.49% 152.26 292.46 83.71 82.72 65.65 60.38 8.36 31.1 1.7 9,100.00
HAYLEYS HAYL MainB M 300.20 0.07 (3.16) (14.23) 75.00 13.88% 242.13 2,519.73 178.40 293.18 1,779.57 268.58 33.60 8.9 1.2 22,515.00
HEMAS HOLDINGS HHL MainB M 24.00 4.78 8.56 9.55 515.29 11.20% 20.94 1,208.78 372.08 350.54 224.20 261.97 2.35 10.2 1.1 12,366.97
JOHN KEELLS HOLDINGS JKH MainB M 195.00 0.05 9.42 (0.86) 850.72 13.73% 83.66 9,775.01 4,096.65 2,733.40 1,577.35 1,367.61 11.49 17.0 2.3 165,891.20
DUNAMIS CAPITAL CSEC MainB M 10.00 5.26 11.11 (13.04) 123.00 na 9.03 (230.26) (73.92) (186.59) 18.32 11.92 na na 1.1 1,229.97
RICHARD PIERIS RICH MainB M 7.80 5.48 11.59 14.93 1938.83 40.29% 3.00 2,340.72 481.07 610.96 1,237.84 10.84 1.21 6.5 2.6 15,122.84
SUNSHINE HOLDINGS SUN MainB M 25.50 0.39 (1.53) 19.53 133.33 15.27% 20.94 426.34 243.30 125.33 (5.57) 63.28 3.20 8.0 1.2 3,400.00
SOFTLOGIC HOLDINGS SHL MainB M 9.90 5.38 (1.01) (2.00) 779.00 6.67% 9.49 493.60 (74.14) 67.86 224.33 275.55 0.63 15.6 1.0 7,712.10
EXPOLANKA HOLDINGS EXPO MainB M 6.20 5.08 5.08 5.08 1954.92 12.58% 4.29 1,054.73 286.48 193.37 301.34 273.54 0.54 11.5 1.4 12,120.47
FREE LANKA CAPITAL HOLDINGS FLCH DiriSaviB M 2.20 4.76 22.22 37.50 1368.00 1.04% 4.76 67.74 153.45 (85.72) 0.05 44.4 0.5 3,009.60
VALLIBEL ONE LIMITED VONE DiriSaviB M 15.00 2.03 3.42 2.03 1086.56 6.77% 27.55 2,025.42 1,054.31 1,787.05 1.86 8.0 0.5 16,298.39
BROWNS INVESTMENTS PLC BIL DiriSaviB M 3.20 14.29 18.52 23.08 1860.00 23.21% 5.85 2,525.83 131.18 3,354.88 1.36 2.4 0.5 5,952.00
PCH HOLDINGS LIMITED PCHH 11.90 1.71 (6.30) - 252.00 65.21% 8.53 1,402.50 5.57 2.1 1.4 2,998.80
FOOTWEAR AND TEXTILES 2.45 12.34 13.01 -11.66% (785.08) (236.86) (104.84) (177.09) (266.30) na 1.17
CEYLON LEATHER CLPL MainB M 78.50 4.39 5.80 3.84 34.23 2.88% 85.51 84.18 (15.42) 38.70 40.50 20.41 2.46 31.9 0.9 2,687.35
HAYLEYS - MGT MGT MainB M 8.30 3.75 - 3.75 152.34 (863.69) 6.96 (863.69) (369.86) (156.75) (168.21) (168.87) na na 1.2 1,264.45
KURUWITA TEXTILES KURU MainB M 25.60 2.40 11.30 11.30 25.00 (207.59) 39.76 (207.59) 68.59 13.21 (171.55) (117.84) na na 0.6 640.00
ODEL ODEL DiriSaviB M 22.60 0.44 24.86 26.97 144.95 202.01 12.10 202.01 79.84 122.17 1.39 16.2 1.9 3,275.87
ORIENT GARMENTS OGL DiriSaviB M 17.70 - 5.36 27.34 54.92 82.80 12.78 82.80 68.34 18.74 1.51 11.7 1.4
HOTELS AND TRAVELS 0.50 3.03 6.99 6.13% 5,166.26 2,183.97 1,821.50 583.79 553.39 27.42 2.02
City Hotels 2,210.18 504.87 677.89 480.50 546.92
ASIAN HOTEL & PROPERTIES AHPL MainB M 78.20 (2.35) (4.23) 5.21 442.78 14.36% 33.83 2,150.56 970.15 522.66 361.08 296.67 4.86 16.1 2.3 34,625.03
GALADARI GHLL MainB D 13.30 6.35 (0.74) 8.94 182.43 na 2.91 (926.62) (663.02) (199.69) (45.49) (18.43) na na 4.6 2,426.37
HOTEL DEVELOPERS HDEV DefaultB M 94.80 - - - 45.23 na na na na na na 4,287.43
HOTEL SERVICES SERV MainB M 14.00 0.71 0.71 8.46 176.00 na 8.11 (189.08) (199.64) 13.25 (0.37) (2.32) na na 1.7 2,464.00
RENUKA CITY HOTEL RENU MainB M 213.30 2.84 6.65 6.65 7.00 20.23% 296.63 420.01 118.47 123.89 \ 177.65 60.00 3.6 0.7 1,493.10
TAJ LANKA TAJ MainB M 27.00 3.45 5.47 3.45 139.64 5.91% 15.11 124.76 6.73 50.64 45.24 22.15 0.89 30.2 1.8 3,770.21
TRANS ASIA TRAN MainB M 73.00 2.10 11.45 21.87 200.00 12.03% 26.21 630.55 272.18 167.15 120.03 71.20 3.15 23.2 2.8 14,600.00

Sri Lanka Focus 24th August 2012 ASIA RESEARCH TEAM 19
Broad Market Guide
Company Year Price Price Performance Shares Trailing BVPS Net Profit Net Profits Trailing Trailing PBV Mkt Cap Mn
End (LKR) 1W(%) 1M(%) 1Q(%) Mn ROE 4Qtrs Mar'12 Dec'11 Sep'11 Jun'11 EPS PE
Resort Hotels 2,956.08 1,679.10 1,143.60 103.29 6.47
AIT. SPENCE HOTEL HOLD. AHUN MainB M 69.00 (0.57) 5.80 1.91 336.29 12.52% 33.13 1,395.29 697.77 507.35 104.99 85.18 4.15 16.6 2.1 23,204.01
AMAYA LEISURE CONN MainB M 72.00 5.88 5.88 (4.00) 48.03 14.01% 43.98 296.05 113.77 83.35 48.01 50.93 6.16 11.7 1.6 3,458.47
BROWNS BEACH HOTELS BBH MainB M 13.60 1.48 3.79 0.74 129.60 4.64% 21.44 129.01 40.99 33.01 26.01 29.00 1.00 13.7 0.6 1,762.56
CEYLON HOTELS CORP. CHOT MainB M 18.60 (1.05) 1.62 (2.08) 171.83 0.05% 34.52 2.74 34.36 (8.26) (2.07) (21.29) 0.02 1166.4 0.5 3,195.95
CONFIFI HOTEL HLDG. PALM MainB M 173.00 11.35 26.91 26.91 7.20 na 168.97 (512.45) (328.80) (48.57) (71.72) (63.37) na na 1.0 1,245.60
RIVERINA HOTELS BHR MainB M 84.50 (5.06) 24.08 42.98 14.18 na 107.79 (535.58) (367.03) (36.68) (84.22) (47.66) na na 0.8 1,198.35
BERUWALA WALK INN BINN MainB D 59.70 12.22 2.05 (7.44) 0.90 na na (0.30) (66.85) 75.38 (4.38) (4.45) na na na 53.73
EDEN HOTELS EDEN MainB M 29.50 (1.67) (1.67) (1.99) 52.80 9.57% 28.85 145.82 95.93 49.75 21.27 (21.13) 2.76 10.7 1.0 1,557.60
HOTEL SIGIRIYA HSIG MainB M 73.50 (3.16) (2.00) 4.85 5.86 21.93% 36.48 46.88 17.99 11.49 13.31 4.08 8.00 9.2 2.0 430.64
HUNAS FALLS HUNA MainB M 56.40 (2.42) (11.04) 8.25 5.63 20.94% 16.40 19.32 3.52 2.62 8.09 5.08 3.43 16.4 3.4 317.25
KANDY HOTELS KHC MainB M 6.20 3.33 6.90 24.00 577.50 1.59% 9.87 90.87 40.41 16.34 24.70 9.42 0.16 39.4 0.6 3,580.50
JOHN KEELLS HOTELS KHL MainB M 13.00 - 5.69 10.17 1456.15 8.02% 9.46 1,105.27 698.09 285.96 113.95 7.27 0.76 17.1 1.4 18,929.91
LIGHT HOUSE HOTEL LHL DiriSaviB M 46.80 7.34 9.35 1.30 46.00 4.58% 52.01 109.58 78.80 23.85 9.55 (2.62) 2.38 19.6 0.9 2,152.80
MIRAMAR MIRA DefaultB M 93.00 8.14 3.33 (33.05) 2.75 na na na na na na na 255.75
MAHAWELI REACH MRH MainB M 20.70 1.97 10.70 15.00 47.07 na 19.25 (118.83) 26.79 10.02 (141.97) (13.67) na na 1.1 974.28
NUWARA ELIYA NEH MainB M 1100.00 4.23 (3.17) 3.08 2.00 6.71% 1006.46 135.36 78.94 24.62 31.01 0.78 67.55 16.3 1.1 2,204.26
PEGASUS PEG MainB M 34.40 7.50 4.24 11.69 30.39 9.31% 39.78 112.49 41.02 28.03 21.78 21.67 3.70 9.3 0.9 1,045.47
REEFCOMBERS REEF MainB M 29.00 2.11 3.20 23.40 79.68 na 29.24 (16.44) 80.57 (54.99) (24.82) (17.20) na na 1.0 2,310.63
ROYAL PALMS RPBH MainB M 46.70 1.08 7.85 12.53 50.00 8.60% 29.31 126.00 85.46 34.00 5.37 1.17 2.52 18.5 1.6 2,335.00
SIGIRIYA VILLAGE SIGV MainB M 62.00 5.44 (4.76) - 9.00 7.64% 58.84 40.48 16.21 17.17 10.93 (3.83) 4.50 13.8 1.1 558.00
STAFFORD/DOLPHIN STAF MainB M 31.60 9.72 12.86 22.96 31.62 10.39% 27.71 91.04 39.73 28.57 11.19 11.54 2.88 11.0 1.1 999.24
TANGERINE TANG MainB M 75.00 1.35 (3.23) 8.70 20.00 6.46% 100.23 129.41 69.10 42.60 13.02 4.70 6.47 11.6 0.7 1,500.00
SERENDIB HOTELS [V] SHOT MainB M 22.30 1.36 6.70 (3.04) 75.51 1.96% 13.76 30.10 22.89 17.99 (5.26) (5.52) 0.27 82.6 1.6 1,683.98
SERENDIB HOTELS [NV] SHOT MainB M 14.50 (0.68) 5.07 14.50 36.01 1.96% 13.76 30.10 22.89 17.99 (5.26) (5.52) 0.27 53.7 1.1 522.16
MARAWILA RESORTS MARA DiriSaviB M 7.00 2.99 6.15 11.29 122.50 1.72% 7.12 14.96 38.58 (23.62) (23.62) 0.12 57.3 1.0 857.50
FORTRESS RESORTS RHTL DiriSaviB M 14.80 2.10 8.15 21.67 110.89 15.91% 6.75 119.01 120.86 (1.84) 1.07 13.8 2.2 1,641.12
KALPITIYA BEACH RESORT CITK DiriSaviB M 5.70 - (1.72) (10.94) 161.20 2.71% 10.38 45.38 (45.38) 0.28 20.2 0.5 918.84
WASKADUWA BEACH RESORT CITW DiriSaviB M 7.70 4.05 (3.75) 16.67 155.60 1.98% 10.36 31.99 31.99 0.21 37.5 0.7 1,198.12
INVESTMENT TRUST 5.02 4.86 0.38 13.39% 3,334.17 263.33 (171.09) 691.09 2,550.84 7.90 1.06
ASIAN COTTON MILLS ASCO MainB M 199.00 (0.40) (0.50) 0.45 7.99 na 67.99 (33.78) (15.00) (12.57) (3.87) (2.34) na na 2.9 1,589.12
CEYLON GUARDIAN GUAR MainB M 150.50 3.04 0.45 (5.64) 82.10 17.23% 148.27 2,097.21 112.90 (121.66) 391.64 1,714.33 25.55 5.9 1.0 12,355.56
CEYLON INVESTMENT CINV MainB M 69.00 9.70 1.47 (1.43) 98.51 13.52% 71.96 958.41 112.93 (66.06) 211.88 699.66 9.73 7.1 1.0 6,797.53
COLOMBO FORT INV. CFI MainB M 106.00 29.27 9.84 (24.34) 5.00 8.39% 34.48 14.46 1.66 2.18 9.08 1.54 2.89 36.7 3.1 530.00
COLOMBO INV. TRUST CIT MainB M 105.00 15.26 3.96 (19.85) 5.50 10.32% 23.51 13.35 1.16 1.15 9.57 1.47 2.43 43.3 4.5 577.50
SHAW WALLACE SHAW MainB M 283.50 (3.96) 37.27 40.77 5.12 na 420.91 (51.62) (30.39) (22.38) (34.13) 35.28 na na 0.7 1,451.67
RENUKA HOLDINGS [V] RHL MainB M 33.00 10.00 17.02 1.85 44.52 16.83% 41.71 357.61 91.84 60.60 104.20 100.97 7.02 4.7 0.8 1,469.07
RENUKA HOLDINGS [NV] RHL MainB M 25.80 22.86 12.17 14.67 6.43 16.83% 41.71 357.61 91.84 60.60 104.20 100.97 7.02 3.7 0.6 165.85
GUARDIAN CAPITAL WAPO DiriSaviB M 53.70 2.09 14.74 16.49 25.83 na 19.58 (21.48) (11.77) (12.35) 2.71 (0.07) na na 2.7 1,387.28

Sri Lanka Focus 24th August 2012 ASIA RESEARCH TEAM 20
Broad Market Guide
Company Year Price Price Performance Shares Trailing BVPS Net Profit Net Profits Trailing Trailing PBV Mkt Cap Mn
End (LKR) 1W(%) 1M(%) 1Q(%) Mn ROE 4Qtrs Mar'12 Dec'11 Sep'11 Jun'11 EPS PE
LAND AND PROPERTY 1.72 4.77 0.76 10.76% 4,486.81 896.25 2,685.80 438.69 466.05 7.07 0.76
C T LAND CTLD MainB M 25.90 (1.54) 0.79 10.87 48.75 10.66% 49.05 254.81 154.43 33.60 34.04 32.74 5.23 5.0 0.5 1,262.63
CARGO BOAT CABO MainB M 75.00 2.88 11.94 7.14 10.20 24.00% 71.96 176.14 12.60 29.39 18.88 115.26 17.27 4.3 1.0 765.00
CEYLINCO HOUSING CHOU MainB M 12.10 (3.20) 21.00 15.24 13.38 7.52% 7.16 7.20 6.07 19.80 (1.26) (17.40) 0.54 22.5 1.7 161.90
CEYLINCO SEYLAN CSD MainB M 6.90 4.48 2.94 - 147.96 1.01% 29.94 44.96 25.09 (55.20) 20.13 54.95 0.30 22.7 0.2 1,020.96
COLOMBO LAND CLND MainB D 32.00 (1.54) 2.24 (7.51) 199.88 0.41% 16.66 13.72 (1.80) (3.81) 19.25 0.07 0.07 466.3 1.9 6,396.19
COMMERCIAL DEVELOP. COMD MainB D 62.00 9.73 12.73 (26.89) 12.00 30.81% 91.10 336.82 13.03 285.20 17.40 21.19 28.07 2.2 0.7 744.00
EAST WEST EAST MainB M 13.50 2.99 13.11 15.00 138.24 0.45% 9.67 6.02 1.27 (4.67) 4.65 4.77 0.04 310.2 1.4 1,866.24
EQUITY ONE EQIT MainB M 27.50 (8.03) 5.77 (16.41) 40.32 5.57% 38.10 85.58 69.80 8.12 3.50 4.17 2.12 13.0 0.7 1,108.85
EQUITY TWO ETWO MainB M 21.20 0.95 30.86 41.33 31.00 7.83% 17.78 43.17 38.33 0.70 1.68 2.45 1.39 15.2 1.2 657.20
HUEJAY HUEJ MainB M 72.00 2.86 20.00 2.86 1.80 na 1.21 (4.79) (2.93) (1.59) (1.43) 1.16 na na 59.7 129.60
KELSEY DEVELOPMENTS KDL MainB M 15.20 1.33 23.58 56.70 17.43 na 6.42 (19.12) (2.13) (4.51) (8.52) (3.96) na na 2.4 264.92
ON'ALLY HOLDINGS ONAL MainB M 52.00 9.70 (0.76) 0.19 17.50 4.45% 58.49 45.59 5.10 13.92 12.80 13.77 2.60 20.0 0.9 910.04
OVERSEAS REALTY OSEA MainB D 13.20 1.54 1.54 1.54 843.48 14.21% 23.07 2,765.56 183.34 2,266.75 152.90 162.57 3.28 4.0 0.6 11,133.99
PROPERTY DEVELOPMENT PDL MainB D 44.90 16.62 18.16 22.01 66.00 15.85% 29.58 309.53 77.22 92.85 68.46 71.00 4.69 9.6 1.5 2,963.40
SERENDIB LAND SLND MainB M 1650.00 - (10.81) (17.50) 0.36 14.15% 642.81 32.74 28.24 1.33 1.48 1.69 90.93 18.1 2.6 594.00
YORK ARCADE YORK MainB M 18.70 6.86 46.09 55.83 12.00 14.37% 9.80 16.90 7.20 3.93 4.14 1.63 1.41 13.3 1.9 224.40
INFRASTRUCTURE IDL DiriSaviB M 115.10 (14.44) (19.93) (26.85) 4.86 1.16 0.54 3.02 3.02 0.62 185.36 215.0 559.10
TOUCHWOOD TWOD DiriSaviB M 13.40 0.75 3.85 0.75 71.27 0.11 46.30 368.98 278.38 90.59 5.18 2.59 0.3 955.02

Sri Lanka Focus 24th August 2012 ASIA RESEARCH TEAM 21
Broad Market Guide
Company Year Price Price Performance Shares Trailing BVPS Net Profit Net Profits Trailing Trailing PBV Mkt Cap Mn
End (LKR) 1W(%) 1M(%) 1Q(%) Mn ROE 4Qtrs Mar'12 Dec'11 Sep'11 Jun'11 EPS PE
MANUFACTURING 2.62 2.49 2.38 21.31% 11,839.49 3,301.60 2,935.03 4,680.23 2,259.10 7.10 1.51
ABANS ABAN MainB M 96.50 3.88 (3.60) (3.50) 4.26 15.96% 101.18 68.79 25.14 5.81 6.72 31.11 16.15 6.0 1.0 410.97
ACL CABLES ACL MainB M 58.40 4.74 11.00 (0.69) 59.89 11.24% 74.78 503.49 193.97 101.83 121.80 85.90 8.41 6.9 0.8 3,497.79
ACL PLASTICS APLA MainB M 89.90 1.93 15.26 3.33 4.21 10.86% 122.52 56.03 22.04 6.19 13.65 14.15 13.30 6.8 0.7 378.70
ACME ACME MainB M 14.60 0.69 16.80 31.53 25.61 1.34% 21.02 7.24 35.55 (40.27) 12.94 (0.99) 0.28 51.7 0.7 373.95
ALUFAB ALUF MainB M 26.90 3.86 0.75 62.05 12.06 na 21.09 (1.05) 4.97 2.78 (9.28) 0.47 na na 1.3 324.37
BLUE DIAMONDS [V] BLUE MainB M 4.30 2.38 (2.27) (4.44) 103.30 6.86% 1.24 21.88 (0.85) (23.79) 24.19 22.33 0.09 50.5 3.5 444.19
BLUE DIAMONDS [NV] BLUE MainB M 1.80 - (5.56) (10.53) 153.37 6.86% 1.24 21.88 (0.85) (23.79) 24.19 22.33 0.09 21.1 1.4 276.07
BOGALA GRAPHITE BOGA MainB D 20.40 7.37 7.37 7.37 47.32 9.02% 3.60 15.38 (15.02) 11.76 15.15 3.49 0.33 62.7 5.7 965.26
CENTRAL INDUSTRIES CIND MainB M 68.60 5.21 4.73 16.27 9.88 12.09% 88.65 105.90 34.73 24.65 28.03 18.51 10.71 6.4 0.8 678.06
GRAIN ELEVATORS GRAN MainB D 50.00 1.01 6.40 22.91 60.00 8.26% 54.67 271.07 0.58 64.14 121.51 84.84 4.52 11.1 0.9 3,000.00
CHEVRON LUBRICANTS LLUB MainB D 180.50 3.62 4.94 9.53 120.00 58.88% 31.83 2,248.62 661.10 561.44 603.44 422.63 18.74 9.6 5.7 21,660.00
DANKOTUWA DPL MainB D 13.00 3.17 7.44 21.50 72.25 na 9.82 (97.86) (3.44) (15.94) (45.96) (32.52) na na 1.3 939.19
DIPPED PRODUCTS DIPD MainB M 89.00 4.71 5.95 (4.30) 59.86 35.25% 88.46 1,866.63 136.35 150.65 1,189.26 390.37 31.18 2.9 1.0 5,327.67
HAYLEYS EXPORTS HEXP MainB M 23.00 3.14 (4.17) (0.43) 8.00 na 43.03 (7.97) 9.36 (7.00) (2.82) (7.51) na na 0.5 184.00
KELANI CABLES KCAB MainB M 69.60 (3.33) 10.48 1.75 21.80 14.99% 87.02 284.36 107.88 48.45 79.26 48.78 13.04 5.3 0.8 1,517.28
KELANI TYRES TYRE MainB M 27.00 (4.26) 7.14 14.89 80.40 20.90% 17.64 296.38 123.73 87.02 66.72 18.91 3.69 7.3 1.5 2,170.80
LANKA ALUMINIUM LALU MainB M 26.60 1.53 2.31 47.78 13.70 1.10% 42.07 6.35 13.92 0.08 (2.22) (5.43) 0.46 57.4 0.6 364.50
LANKA CEMENT LCEM MainB D 8.80 2.50 - 1.23 173.51 na na na (4.93) (0.66) (3.73) na na na 1,526.89
LANKA CERAMIC CERA MainB M 65.00 (3.13) 1.56 - 30.00 17.13% 89.65 460.64 193.52 140.86 91.36 34.90 15.35 4.2 0.7 1,950.00
LANKA TILES TILE MainB M 56.70 (6.67) (6.67) (8.20) 53.05 21.82% 52.19 604.17 321.62 140.45 72.77 69.33 11.39 5.0 1.1 3,007.96
LANKA WALLTILES LWL MainB M 60.00 1.35 (3.23) 5.08 54.60 18.51% 75.35 761.33 387.08 182.07 138.21 53.97 13.94 4.3 0.8 3,276.00
LAXAPANA LITE MainB M 5.90 (1.64) - (3.23) 39.00 na 4.75 (73.90) (41.84) (9.69) (18.99) (3.38) na na 1.2 230.10
SWISSTEK (CEYLON) PLC PARQ MainB M 15.00 (5.66) (4.46) 26.05 27.37 3.89% 21.84 23.23 39.41 8.52 (2.38) (22.32) 0.85 17.7 0.7 410.58
PELWATTE SUGAR SUGA MainB M 23.50 - - - 67.98 na na na 778.07 83.66 na na na 1,597.46
PIRAMAL GLASS GLAS MainB M 5.10 2.04 (3.85) (7.41) 950.09 21.48% 3.36 686.45 97.76 204.97 242.43 141.29 0.72 7.1 1.5 4,845.44
PRINT CARE CARE MainB M 29.90 34.68 (1.97) (0.33) 85.97 16.70% 13.10 188.17 67.34 67.34 15.36 38.13 2.19 13.7 2.3 2,570.40
REGNIS REG MainB D 65.00 (2.69) (30.26) (41.76) 9.66 17.07% 57.35 94.57 38.73 13.37 24.45 18.01 9.79 6.6 1.1 627.78
RICH PIERIS EXPORTS REXP MainB M 25.00 7.76 14.68 25.63 11.16 na na 40.36 27.23 15.54 8.63 (11.03) 3.62 6.9 na 279.09
ROYAL CERAMICS RCL MainB M 85.00 0.95 (5.56) (14.23) 110.79 29.83% 59.26 1,958.43 475.37 595.71 495.88 391.48 17.68 4.8 1.4 9,417.10
SAMSON INTERNATIONAL SIL MainB M 97.90 2.51 8.90 20.72 3.85 10.14% 98.14 38.30 29.92 5.24 1.86 1.27 9.95 9.8 1.0 376.72
SINGER INDUSTRIES SINI MainB D 150.00 (2.08) (0.27) 0.20 3.85 2.87% 206.45 22.81 2.93 1.27 (5.24) 23.85 5.93 25.3 0.7 576.95
SWADESHI SWAD MainB M 12825.00
- 237.50 237.50 0.13 239.41% 992.53 310.50 13.42 109.39 102.00 85.69 1.53 8369.6 12.9 1,675.79
TOKYO CEMENT [V] TKYO MainB M 28.50 7.55 2.52 (3.39) 202.50 15.55% 20.72 978.90 130.24 275.47 359.11 214.08 3.22 8.8 1.4 5,771.25
TOKYO CEMENT [NV] TKYO MainB M 19.70 2.60 1.03 (1.01) 101.25 15.55% 20.72 978.90 130.24 275.47 359.11 214.08 3.22 6.1 1.0 1,994.63
SIERRA CABLES SIRA MainB M 2.60 4.17 8.70 - 537.51 7.41% 2.52 100.31 (44.86) 19.46 76.84 48.87 0.19 13.9 1.0 1,397.53
TEXTURED JERSEY TJL MainB M 7.90 1.28 (2.47) 5.33 655.00 11.48% 8.35 628.02 218.66 187.27 78.12 143.97 0.96 8.2 0.9 5,174.52
AGSTAR FERTILIZERS LIMITED AGST DiriSaviB M 8.3 (2.38) (7.87) (6.82) 307.53 15.34% 6.07 286.47 157.20 0.93 8.9 1.4 2,552.47
AGSTAR FERTILIZERS LIMITED AGSTX DiriSaviB M 15 - - - 17.47 15.34% 106.85 286.47 157.20 16.39 0.9 0.1 262.11

Sri Lanka Focus 24th August 2012 ASIA RESEARCH TEAM 22
Broad Market Guide
Company Year Price Price Performance Shares Trailing BVPS Net Profit Net Profits Trailing Trailing PBV Mkt Cap Mn
End (LKR) 1W(%) 1M(%) 1Q(%) Mn ROE 4Qtrs Mar'12 Dec'11 Sep'11 Jun'11 EPS PE
MOTORS 4.03 5.97 5.11 39.22% 7,607.70 2,104.52 1,892.54 2,082.29 1,528.35 2.80 1.10
AUTODROME AUTO MainB M 720.00 1.41 3.73 (7.67) 1.20 7.82% 469.33 44.07 6.65 9.40 17.76 10.27 36.73 19.6 1.5 864.00
COLONIAL MOTORS COLO MainB M 194.70 1.69 (1.53) (3.45) 9.12 45.84% 277.91 1,162.30 659.81 200.18 159.30 143.01 127.38 1.5 0.7 1,776.50
DIMO DIMO MainB M 605.00 1.65 0.80 8.66 8.88 36.13% 841.03 2,697.31 427.34 712.59 920.98 636.40 303.87 2.0 0.7 5,370.24
LANKA ASHOK ASHO MainB M 1999.90 8.10 11.11 11.11 3.62 55.21% 629.48 1,258.32 280.11 309.00 390.21 279.00 347.52 5.8 3.2 7,241.32
SATHOSA MOTORS SMOT MainB M 181.00 (0.55) (5.24) (9.05) 6.03 23.87% 118.26 170.34 42.31 38.79 40.02 49.22 28.23 6.4 1.5 1,092.09
UNITED MOTORS UML MainB M 74.20 3.35 10.93 2.63 67.27 38.97% 86.81 2,275.36 688.30 622.59 554.02 410.45 33.83 2.2 0.9 4,991.22
OIL PALMS 3.55 (6.10) (9.32) 31.22% 6,177.81 1,914.06 276.53 876.39 3,110.83 16.5 5.2
BUKIT DARAH BUKI MainB M 671.00 0.40 (10.19) (14.15) 102.00 22.42% 230.92 5,280.05 1,561.69 164.69 609.72 2,943.95 51.77 13.0 2.9 68,442.00
GOOD HOPE GOOD MainB M 1199.90 1.17 (0.01) (0.01) 6.87 13.65% 226.68 212.64 110.09 15.70 53.45 33.40 30.95 38.8 5.3 8,244.88
INDO MALAY INDO MainB M 1600.00 10.34 6.67 12.68 7.00 9.64% 227.75 153.58 41.40 27.58 58.40 26.20 21.94 72.9 7.0 11,197.44
SELINSING SELI MainB M 1102.00 29.65 0.27 (10.41) 6.94 13.11% 353.03 321.20 126.38 38.39 88.01 68.41 46.28 23.8 3.1 7,647.97
SHALIMAR SHAL MainB M 949.00 5.44 6.71 6.99 6.94 10.63% 285.23 210.34 74.50 30.17 66.81 38.87 30.31 31.3 3.3 6,586.14
PLANTATIONS 0.48 1.32 2.08 3.58% 714.91 1,292.22 419.85 (285.35) (629.58) 29.4 1.05
AGALAWATTE AGAL MainB D 31.00 (1.90) 3.68 (13.65) 25.00 9.51% 39.08 92.97 30.87 28.29 56.16 (22.36) 3.72 8.3 0.8 775.00
BALANGODA BALA MainB D 26.80 6.25 8.97 21.43 23.64 3.21% 59.71 45.24 67.25 (49.80) (56.37) 84.16 1.91 14.0 0.4 633.45
BOGAWANTALAWA BOPL MainB M 8.60 13.16 13.16 7.50 83.75 na 8.38 (296.30) (96.44) (28.08) (127.60) (44.18) na na 1.0 720.25
HAPUGASTENNE HAPU MainB D 39.90 (5.00) (5.67) (0.99) 46.32 na 25.75 (244.85) 25.75 (174.09) (60.92) (35.60) na na 1.5 1,848.00
HORANA HOPL MainB M 20.50 4.59 0.49 1.49 25.00 6.80% 41.25 70.15 50.79 33.67 (1.01) (13.30) 2.81 7.3 0.5 512.50
KAHAWATTE KAHA MainB D 32.40 (0.92) (4.14) 36.71 79.89 na 14.03 (37.23) 30.96 12.92 34.63 (115.74) na na 2.3 2,588.43
KEGALLE KGAL MainB M 93.00 (1.59) 1.20 (6.90) 25.00 23.59% 115.64 681.95 246.28 148.46 255.84 31.37 27.28 3.4 0.8 2,325.00
KELANI VALLEY KVAL MainB D 78.10 (2.86) (4.76) (13.22) 34.00 14.35% 61.66 300.94 85.57 186.81 77.83 (49.26) 8.85 8.8 1.3 2,655.40
KOTAGALA KOTA MainB M 54.80 (3.83) (3.83) (23.81) 32.00 19.13% 71.65 438.61 204.10 139.36 68.78 26.37 13.71 4.0 0.8 1,753.60
MADULSIMA MADU MainB D 10.30 3.00 13.19 28.75 29.00 na 57.59 (330.08) (57.18) 69.37 (225.40) (116.86) na na 0.2 298.70
MALWATTE VALLEY MALX MainB D 3.50 (3.03) 2.94 (5.41) 224.59 0.27% 7.86 5.29 101.34 (169.78) (18.88) 92.61 0.02 163.8 0.4 786.07
MALWATTE VALLEY MAL MainB D 3.20 2.94 (8.57) 3.23 23.00 0.27% 7.86 5.29 101.34 (169.78) (18.88) 92.61 0.02 149.7 0.4 73.60
MASKELIYA MASK MainB M 13.90 6.92 25.23 20.87 26.98 na 43.78 (370.38) 165.87 (14.56) (203.94) (317.75) na na 0.3 374.98
NAMUNUKULA NAMU MainB M 56.70 4.81 5.78 (1.39) 23.75 23.98% 65.78 374.66 105.01 105.74 162.65 1.26 15.78 3.6 0.9 1,346.63
TALAWAKELLE TPL MainB D 17.40 8.75 (5.95) 2.35 23.75 na 47.79 (163.79) 6.81 49.77 (144.58) (75.79) na na 0.4 413.25
UDAPUSSELLAWA UDPL DiriSaviB D 20.10 2.03 8.65 0.50 19.40 na 13.95 (175.81) 16.60 (76.26) (82.36) (33.79) na na 1.4 389.92
WATAWALA PLANTATIONS WATA MainB M 9.20 6.98 10.84 26.03 236.67 14.57% 11.97 412.59 267.69 158.03 27.59 (40.73) 1.74 5.3 0.8 2,177.33
ELPITIYA ELPL DiriSaviB M 13.60 (5.56) 0.74 27.10 72.87 6.77% 19.68 97.03 40.94 56.09 1.33 10.2 0.7 990.98
MET.RES.HOL MPRH DiriSaviB M 21.00 10.53 25.00 25.00 17.26 na 30.83 (186.09) (103.86) na na 0.7 362.56
HEALTH SERVICES 0.79 3.21 7.38 12.92% 2,458.43 687.41 916.34 545.83 308.85 12.3 1.58
ASIRI CENTRAL ASHA DiriSaviB M 205.20 (17.99) (18.02) (6.73) 22.33 na 90.64 (101.73) (74.11) (27.61) na na 2.3 4,582.93
ASIRI SURGICAL AMSL MainB M 7.50 1.35 4.17 (1.32) 528.46 27.13% 4.52 647.81 111.95 323.37 122.79 89.7 1.23 6.1 1.7 3,963.43
ASIRI HOSPITAL ASIR MainB M 8.50 8.86 10.26 7.50 889.26 13.44% 3.55 423.90 84.55 117.03 148.49 73.8 0.48 17.8 2.4 7,558.74
CEYLON HOSPITALS [V] CHL MainB M 82.00 17.00 9.20 6.36 25.53 10.27% 72.7 250.16 102.55 54.29 54.82 38.5 7.39 11.1 1.1 2,093.24
CEYLON HOSPITALS [NV] CHL MainB M 65.00 - 4.84 10.17 8.35 10.28% 72.7 250.16 102.55 54.29 54.82 38.5 7.39 8.8 0.9 542.45
LANKA HOSPITALS LHCL MainB M 32.10 (0.31) 9.18 22.99 223.73 12.93% 15.29 442.46 84.46 189.84 102.01 66.2 1.98 16.2 2.1 7,181.80
NAWALOKA NHL MainB M 3.00 7.14 7.14 11.11 1409.51 17.19% 2.25 545.67 275.47 177.51 90.51 2.2 0.39 7.7 1.3 4,228.52

Sri Lanka Focus 24th August 2012 ASIA RESEARCH TEAM 23
Broad Market Guide
Company Year Price Price Performance Shares Trailing BVPS Net Profit Net Profits Trailing Trailing PBV Mkt Cap Mn
End (LKR) 1W(%) 1M(%) 1Q(%) Mn ROE 4Qtrs Mar'12 Dec'11 Sep'11 Jun'11 EPS PE
SERVICES 1.32 8.45 3.04 26.91% 863.43 669.72 57.03 88.51 25.97 6.10 1.64
JOHN KEELLS LIMITED JKL MainB M 58.50 (1.18) 3.54 (2.50) 60.80 33.94% 42.08 868.20 673.28 60.88 67.37 66.67 14.28 4.1 1.4 3,556.80
LAKE HOUSE PRINTING LPRT MainB M 94.50 (0.42) 26.00 11.05 2.94 9.28% 46.44 12.66 2.27 4.01 4.38 2.00 4.31 21.9 2.0 277.57
MERC. SHIPPINGS MSL MainB M 199.10 13.90 32.73 34.53 2.84 na 92.37 (29.77) 1.80 (11.92) (9.25) (10.40) na na 2.2 566.44
CEYLON PRINTERS CPRT MainB M 1450.00 7.24 543.42 865.13 0.04 na 302.77 (34.36) (4.56) 3.14 (0.64) (32.30) na na 4.8 50.76
KALAMAZOO KZOO MainB M 1700.00 5.95 41.67 (24.44) 0.05 na 668.44 (0.70) (1.97) 0.63 0.92 na na 2.5 85.00
PARAGON PARA MainB M 1400.00 33.33 (6.67) 7.69 0.10 na 53.39 (0.73) (1.10) 0.29 0.07 na na 26.2 140.04
CEYLON TEA BROKERS CTBL DiriSaviB M 5.20 - 6.12 8.33 114.00 23.85% 1.77 48.13 na na 25.66 0.42 12.3 2.9 592.80
STORES AND SUPPLIES (4.19) (4.13) (6.27) 6.90% 227.19 228.86 50.85 (141.21) 88.69 21.91 1.51
COLOMBO PHARMACY PHAR MainB M 584.90 3.63 2.31 11.01 1.27 9.59% 701.09 85.55 90.70 (2.77) (5.67) 3.29 67.21 8.7 0.8 744.49
E B CREASY EBCR MainB M 900.20 (9.59) (8.49) (17.81) 2.54 na 1.04 (5.79) 118.37 0.21 (188.97) 64.60 na na 862.2 2,282.42
GESTETNER GEST MainB M 200.00 11.11 1.01 (0.50) 2.28 41.55% 34.52 32.67 2.65 16.84 7.34 5.85 14.34 13.9 5.8 455.63
HUNTERS HUNT MainB M 290.40 (3.04) (1.56) 6.53 5.15 4.95% 450.55 114.74 17.14 36.56 46.09 14.96 22.30 13.0 0.6 1,494.11
TRADING 5.82 10.98 12.12 13.30% 3,625.53 887.45 639.13 1,613.24 500.84 8.90 1.18
BROWNS BRWN MainB M 116.90 6.27 6.27 (12.11) 70.88 14.03% 153.53 1,526.34 131.18 177.81 1,130.65 86.69 21.54 5.4 0.8 8,285.29
C W MACKIE CWM MainB D 56.60 1.25 (2.41) (5.67) 35.99 23.25% 45.98 384.76 106.85 93.56 82.16 102.19 10.69 5.3 1.2 2,036.95
CEYLON FOREIGN TRADES CFT MainB M 5.30 1.96 4.00 8.33 140.20 2.60% 4.37 15.89 (4.40) 3.21 10.48 6.60 0.11 46.8 1.2 743.04
EASTERN MERCHANTS EMER MainB M 12.10 9.01 17.48 39.08 117.45 7.63% 7.82 70.04 67.80 (28.60) 1.55 29.29 0.60 20.3 1.5 1,421.10
ENVIRONMENTAL RESOURCES GREG MainB M 14.90 4.20 8.76 12.88 349.37 2.91% 24.33 247.55 243.26 (46.39) 67.44 (16.77) 0.71 21.0 0.6 5,205.57
RADIANT GEMS RGEM MainB M 47.10 (4.66) (10.46) 4.67 2.40 na 9.67 (11.95) (1.51) (0.97) (3.23) na na 4.9 113.04
SINGER SRI LANKA SINS MainB D 109.00 6.03 14.74 32.76 125.21 31.79% 34.55 1,375.43 337.87 431.60 313.12 292.84 10.98 9.9 3.2 13,647.85
OFFICE EQUIPMENT OFEQ MainB M 4000.00 11.11 191.74 556.38 0.08 na 509.86 na 8.90 na na 7.8 333.42
TESS AGRO TESS DiriSaviB M 2.60 8.70 8.70 19.05 180.00 5.65% 1.72 17.47 6.40 11.07 0.10 26.8 1.5 468.00
POWER & ENERGY 0.67 2.95 (8.20) 9.54% 1,497.01 22.16 807.07 484.74 183.04 10.75 1.03
HEMAS POWER HPWR MainB M 18.00 4.05 1.69 (5.76) 125.20 9.53% 22.67 270.33 24.17 81.45 77.87 86.85 2.16 8.3 0.8 2,253.60
LANKA IOC LIOC MainB M 15.80 (3.07) (0.63) (9.71) 532.53 8.95% 19.00 905.94 41.24 623.09 277.85 (36.25) 1.70 9.3 0.8 8,413.97
VIDULLANKA VLL MainB M 3.70 2.78 (2.63) (32.73) 477.27 7.25% 1.93 66.80 (27.63) 47.52 8.60 38.31 0.14 26.4 1.9 1,765.90
VALLIBEL POWER VPEL MainB M 4.90 4.26 (3.92) (22.22) 747.11 13.96% 2.43 253.95 (15.61) 55.01 120.42 94.12 0.34 14.4 2.0 3,660.84
LAUGFS GAS LGL DiriSaviB M 21.20 (1.84) 10.36 1.91 335.00 14.72% 16.55 942.73 539.21 403.06 2.44 8.7 1.3 7,102.00
LAUGFS GAS [NV] LGL DiriSaviB M 13.80 2.96 6.92 13.93 52.00 14.72% 16.55 942.73 539.21 403.06 2.44 5.7 0.8 717.60
HYDRO POWER HPFL MainB M 6.60 26.92 20.00 29.41 109.09 0.76% 7.22 6.00 (25.85) 4.08 10.17 17.60 0.06 120.0 0.9 719.98
PANASIAN POWER PAP MainB M 2.60 4.00 8.33 23.81 500.00 14.15% 1.60 113.15 7.13 39.78 6.11 60.13 0.23 11.5 1.6 1,300.00
MACKWOODS ENERGY LIMITED MEL DiriSaviB M 11.50 8.49 7.48 (3.36) 100.00 na na na na na na 1,150.00
INFORMATION TECHNOLOGY 0.65 (1.26) (4.45) 49.26% 73.88 3.23 - 71.22 - na na
E-CHANNELLING ECL DiriSaviB M 4.50 2.27 (4.26) 9.76 122.13 49.26% 1.23 73.88 3.23 71.22 0.60 7.4 3.7 549.59
PC HOUSE PCH MainB M 6.00 - - (9.23) 228.93 9.10% 6.23 129.76 (29.05) 53.99 47.13 57.69 0.57 10.6 1.0 1,373.60
TELECOMMUNICATIONS (0.23) (0.23) 9.31 8.83% 7,514.94 (165.91) 2,704.20 2,450.46 2,526.19 15.97 1.41
DIALOG TELEKOM DIAL MainB D 6.20 1.67 1.67 15.09 8143.78 11.23% 4.01 3,663.94 (530.91) 1,418.20 1,392.46 1,384.19 0.45 13.8 1.5 50,491.43
SRI LANKA TELECOM SLTL MainB D 38.50 (1.54) (1.54) 5.51 1804.86 7.34% 29.06 3,851.00 365.00 1,286.00 1,058.00 1,142.00 2.13 18.0 1.3 69,487.11
Note: Since Laugfs Gas was listed in December 2010, four quarter financials are unavailable.
Note: Counters which are newly listed will not have 4 quarter trailing statistics. Counters which publish six months financials will also not have 4 quarter trailing statistics.

Trade on-line at http://www.cdax.lk
Research
Manager - Research Assistant Manager - Research
Balakrishnan Nirmalan (94-11)5320362 Amali Perera (94-11)5320256 [email protected] [email protected]
Corporates Economy
Minoli Mallawaarachchi (94-11)5320259 Dhanusha Pathirana (94-11)5320254 Dilan Wijekoon (94-11)5320249 Travis Gomez (94-11)5320254 Shan Silva (94-11)5320251
Yogini Yogarasa (94-11)5320361 Statistician
Nuwan Pradeep (94-11)5320257
Sales
Institutional Sales Retail Sales Sabri Marikar (94-11) 5320224 077 3-576868 [email protected] ShiyamSubaulla (011)- 5320218 0773-502016 [email protected]
Niroshan Wijayakoon (94-11) 5320208 0777-713645 [email protected] GaganiJayawardhana (011)- 5320236 0714-084953 [email protected]
Niyaz Aboobucker (94-11) 5320213 0777-727352 [email protected] PriyanthaHingurage (011)- 5320217 0773-502015 [email protected]
Anura Hedigallage (94-11) 5320211 0777 -713663 [email protected] Neluka Rodrigo (011)- 5320214 0777-366280 [email protected]
Manjula Kumarasinghe (94-11) 5320211 0777 -874310 [email protected] Subeeth Perera (011)- 5320227 0714-042683 [email protected]
Chelaka Hapugoda (94-11)5320240 0777 -256740 [email protected]
Chaminda Mahanama (94-11) 5320223 0777 -556582 [email protected] Hiran Bibile (94-11) 5320238 0777 -352032 [email protected] Arshwin Amarasekara (94-11) 5320215 0773 -717220 [email protected]
Branches CSE Floor CSE,01-04, World Trade Centre, Colombo – 1. ThusharaAdhikari (011)-5735122 0773-688202 [email protected] M G Suranjana (011)-5763539 0773-954994
Kiribathgoda Level 2-6,Udeshi City Shopping complex, No 94,Makola Rd,Kiribathgoda DanushkaBoteju (011)-5634803 0716-270527 [email protected] Kasun Navoda Kurunegala Union Assurance Building, No.6,1stFloor,Rajapilla Rd, Kurunagala. AsankaSamarakoon (037)-5628844 0773-690749 [email protected] GayanNishsanka (037)-5642717 0777-105356 [email protected] Matara E.H.Cooray Building, Mezzanine Floor, No:24, AnagarikaDarmapala Mw, SumedaJayawardena (041)-5677525 0773-687307 [email protected] Matara LalindaLiyanapathirana (041)-5677526 0778-628798 [email protected] Galle Peoples Leasing Building,2nd Floor,No.118,MataraRoad,Galle RuchiraHasantha (091)-5629998 0773-687027 [email protected] Negombo Asia Asset Finance, 171/1, Station Road, Negombo. UthpalaKarunatilake (031)-5676881 0773-691685 [email protected] GayanPerera (031)-5676880 0772-544044 [email protected]
Service Centers Kandy k3-L1,Level 01,kcc, No 5 ,DaldaVeediya, Kandy. NilupulHettiarachchi (081)-5628500 0773-691816 [email protected] RadhikaHettiarachchi (081)-5625577 0777-810694 [email protected] Hambantota Hambanthota Chamber of Commerce, ThangalleRoad,Hambantota. TarinduPriyanka SherminRanasinghe 0772-378352 [email protected] Ampara 2nd Floor, T.K.S. Building, D.S. Senanayake Street, Ampara. Ravi De Mel (063)-5679071 0772-681995 [email protected] Jaffna 11-8, First Floor, Stanley Road, Jaffna GratianNirmalan (021)-5671800 0777-567933 [email protected] S.Puviraj (021)-5671801 0775-096969 [email protected] Moratuwa Asia Asset Finance, No.18, New De Zoysa Rd, Moratuwa. HashanLalantha (011)-5238662 [email protected] CharithPerera (011)-5238663 [email protected] Panadura Asian Alliance Building, 293, Galle Road, Panadura RanganathWijetunga (038)-5670400 0715-120723 [email protected] AsankaChaminda (038)-5670407 0713-559552 [email protected]
The report has been prepared by Asia Wealth Management Co (Private) Limited. The information and opinions contained herein has been compiled or arrived at based upon information obtained from sources believed to be reliable and in good faith. Such
information has not been independently verified and no guaranty, representation or warranty, express or implied is made as to its accuracy, completeness or correctness, reliability or suitability. All such information and opinions are subject to change without
notice. This document is for information purposes only, descriptions of any company or companies or their securities mentioned herein are not intended to be complete and this document is not, and should not be construed as, an offer, or solicitation of an offer,
to buy or sell any securities or other financial instruments. In no event will Asia Wealth Management Co (Private) Limited be liable for any loss or damage including without limitation, indirect or consequential loss or damage, or any loss or damage whatsoever
arising out of, or in connection with the use of this report and any reliance you place on such information is therefore strictly at your own risk.
Asia Wealth Management Co (Private) Limited may, to the extent permissible by applicable law or regulation, use the above material, conclusions, research or analysis in which they are based before the material is disseminated to their customers. Not all
customers will receive the material at the same time. Asia Wealth Management Co (Private) Limited, their respective directors, officers, representatives, employees, related persons and/or Asia Wealth Management Co (Private) Limited, may have a long or
short position in any of the securities or other financial instruments mentioned or issuers described herein at any time and may make a purchase and/or sale, or offer to make a purchase and/or sale of any such securities or other financial instruments from
time to time in the open market or otherwise, in each case either as principal or agent. Asia Wealth Management Co (Private) Limited may make markets in securities or other financial instruments described in this publication, in securities of issuers described
herein or in securities underlying or related to such securities. Asia Wealth Management Co (Private) Limited may have recently underwritten the securities of an issuer mentioned herein. The information contained in this report is for general information
purposes only. This report and its content is copyright of Asia Wealth Management Co (Private) Limited and all rights reserved. This report- in whole or in part- may not, except with the express written permission of Asia Wealth Management Co (Private)
Limited be reproduced or distributed or commercially exploited in any material form by any means whether graphic, electronic, mechanical or any means. Nor may you transmit it or store it in any other website or other form of electronic retrieval system. Any
unauthorised use of this report will result in immediate proceedings.