Embed Size (px)
Citation preview
16th Annual Report Arizona Pollutant Discharge Elimination System
Stormwater Discharge Permit No. AZS000002 Pima County, Arizona
October 2013
Construction
County Facilities
Industrial Facility Public Participation
Illicit Discharge Detection & Elimination
Public Awareness

Water and Wastewater Division Stormwater Management Plan
Stormwater Management Program Pima County Department of Environmental Quality
33 N. Stone Avenue, Suite 700 Tucson, Arizona 85701-1429
Pima County 2013 Annual Report
AZPDES Permit No. AZS000002 Page i of iv
TABLE OF CONTENTS
Executive Summary 1. General Information 2. Annual Report Certification, Legal Authority 3. Narrative Summary of Stormwater Management Program
A. Public Awareness B. Public Participation C. Illicit Discharge Detection and Elimination D. County Facilities E. Industrial and Commercial Facilities F. Construction G. Post Construction H. References
4. Numeric Summary of Stormwater Management Program 5. Evaluation of Stormwater Management Program 6. Stormwater Management Program Modifications 7. Monitoring Site Information 8. Storm Event Records 9. Summary of Monitoring Site Data 10. Assessment of Monitoring Data
A. Stormwater Quality B. Surface Water Quality Standards (SWQS) C. Pollutant Concentration Greater than Applicable SWQS D. References
11. Estimate of Annual Pollutant Loadings
A. Statistical Methods B. Results and Evaluation of Calculations C. Limitation of Methodology D. References
12. Annual Expenditures
Pima County 2013 Annual Report
AZPDES Permit No. AZS000002 Page ii of iv
Appendices
A. Public Awareness: Outreach Materials B. Public Participation: Adopt-A-Roadway Program C. Public Participation: Household Hazardous Waste Program D. Illicit Discharge Detection and Elimination Program: Complaints
E. Illicit Discharge Detection and Elimination Program: Enforcement
F. Outfalls
F-1. Outfall Inventory F-2. Outfall Site Inspection Reports
G. County Industrial Facilities
G-1. County Facility Inventory G-2. Inventory of Facilities with Potential for Hazardous Substances
H. GIS Map Inventory
I. Infrastructure Maintenance: Roadway System I-1. Summary of Road Maintenance I-2. Log of Road Maintenance Activities
J. Infrastructure Maintenance: Drainageway System K. Conservation Properties
L. Industrial Facilities
L-1 . Industrial Facility Inventory L-2. Industrial Facilities Site Inspection Reports
M. Plan Reviews for stormwater-related ordinances N. Floodplain Use Permits (FPUP) and Floodprone Land Acquisition Program (FLAP)
O. Construction Sites
O-1. Construction Site Inventory O-2. Construction Site Inspection Reports
P. Post Construction
P-1. Post Construction Inventory P-2. Post-construction Site Inventory Reports
Pima County 2013 Annual Report
AZPDES Permit No. AZS000002 Page iii of iv
Q. Water Quality Laboratory Reports for Monitor Sites #1 - #5
LIST OF FIGURES 1-1. Permit Area Map LIST OF TABLES 3-1. Summary of Business Assistance Program for Stormwater Requirements 3-2. Spills within Permit Area 4-1. Numeric Summary of Stormwater Management Program Activities 5-1. Distribution of Notices of Violation within the Four Watersheds of the Permit Area 6-1. Facilities removed from 2012 County Facility Inventory 7-1. Monitor Site Location and Equipment Information 8-1. Storm Event Records for Monitor Sites 9-1. Water Quality Data from Monitor Site #1 9-2. Water Quality Data from Monitor Site #2 9-3. Water Quality Data from Monitor Site #3 9-4. Water Quality Data from Monitor Site #4 9-5. Water Quality Data from Monitor Site #5 10-1. List of Pollutants with Concentrations Greater than Standards 11-1. Pollutant Loading Estimates for Monitor Sites 12-1. Annual Expenditures and Proposed Budget

Pima County 2013 Annual Report
AZPDES Permit No. AZS000002 Page iv of iv
(This page is intentionally blank).
Pima County 2013 Annual Report. Executive Summary
AZPDES Permit No. AZS000002 Page 1 of 2
Executive Summary
Introduction This report describes activities performed and data collected for Pima County’s Arizona Pollutant Discharge System (AZPDES) Permit No. AZS000002 between July 1, 2012 and June 30, 2013. This permit authorizes Pima County to discharge stormwater from a municipal separate storm sewer system (MS4) to waters of the United States. This report is the second annual report prepared under the new state permit issued on June 16, 2011 and effective on July 18, 2011, herein referred to as the 2011 MS4 permit. Under the previous EPA MS4 permit issued on February 14, 1997, 14 annual reports were prepared. Certification Pima County’s principal executive officer signs and certifies this annual report was prepared by qualified personnel to properly gather and evaluate the information submitted (Part 2). Stormwater Management Program (SWMP) Best management practices (BMPs) were implemented in accordance with the SWMP during the reporting period. Information for the SWMP is found in the following parts: Narrative summary of SWMP activities (Part 3 and Appendices), Numeric summary of SWMP activities (Part 4), Evaluation of SWMP (Part 5), and Modifications to SWMP (Part 6). Wet Weather Monitoring Water quality samples were collected from the five Monitoring Sites (Part 7). Storm event records were automatically recorded and summarized (Part 8). Analytical results for the water quality samples (Part 9), the water quality assessment (Part 10) and the estimate of annual pollutant loadings (Part 11) document the quality of surface water flows. Expenditures and Proposed Budget A summary of the annual expenditures and the proposed budget are summarized (Part 12). Conclusions Pima County implemented the SWMP and Wet Weather Monitoring Program. Activities included maintenance of the roadways and drainage systems. Inspections were performed at 39 outfalls, 123 construction sites and 10 industrial facilities. The public reported 1,366 environmental complaints. Most were inspection resulting in 523 Notices of Violation and 501 remediated sites. Nine stormwater samples were collected at five monitor sites. Analysis of the water quality results for 134 parameters shows copper and E. Coli are the only pollutants detected above Arizona’s Surface Water Quality Standards indicating the surface waters in Pima County are clean.

Pima County 2013 Annual Report. Executive Summary
AZPDES Permit No. AZS000002 Page 2 of 2
(This page is intentionally blank).
Pima County 2013 Annual Report. Part 1
AZPDES Permit No. AZS000002 Page 1 of 4
PART 1: GENERAL INFORMATION
A. Name of Permittee: Pima County
B. Permit Number: AZS000002
C. Reporting Period: July 1, 2012 - June 30, 2013 D. Name of Stormwater Management Program Contact: Marie Light
Title: Principal Hydrologist
Mailing Address: 33. N. Stone, Suite 700
City: Tucson
Zip: 85701-1429 Phone: 520-724-7400
Fax Number: 520-838-7432
Email Address: [email protected]
E. Name of Certifying Official: John M. Bernal
Title: Deputy County Administrator for Public Works Mailing Address: 130 W. Congress
City: Tucson
Zip: 85701-1317 Phone: 520-724-8474
Fax Number: 520-740-8171 Email Address: [email protected]
Pima County 2013 Annual Report. Part 1
AZPDES Permit No. AZS000002 Page 2 of 4
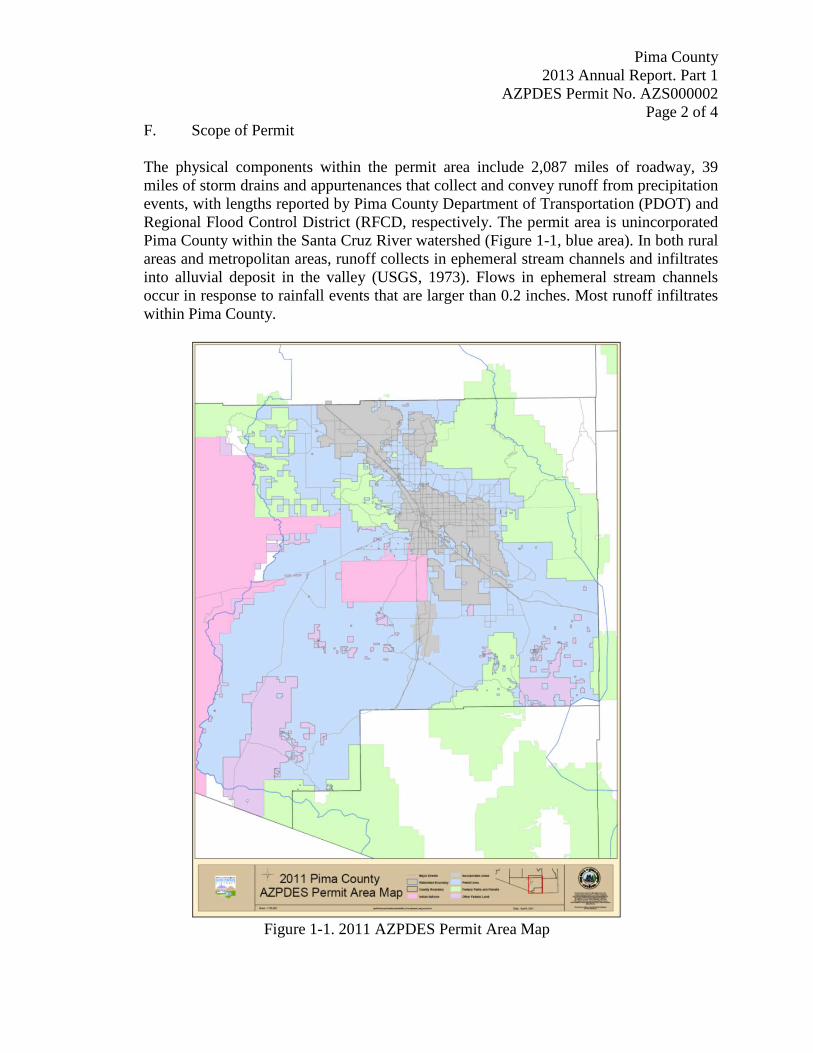
F. Scope of Permit The physical components within the permit area include 2,087 miles of roadway, 39 miles of storm drains and appurtenances that collect and convey runoff from precipitation events, with lengths reported by Pima County Department of Transportation (PDOT) and Regional Flood Control District (RFCD, respectively. The permit area is unincorporated Pima County within the Santa Cruz River watershed (Figure 1-1, blue area). In both rural areas and metropolitan areas, runoff collects in ephemeral stream channels and infiltrates into alluvial deposit in the valley (USGS, 1973). Flows in ephemeral stream channels occur in response to rainfall events that are larger than 0.2 inches. Most runoff infiltrates within Pima County.
Figure 1-1. 2011 AZPDES Permit Area Map
Pima County 2013 Annual Report. Part 1
AZPDES Permit No. AZS000002 Page 3 of 4
Managements Activities Management of the program includes coordinating with Pima County departments maintain roadways and drainageways, purchasing open space to conserve land and manage stormwater operations between five county departments. Pima County collaborates with local jurisdictions, businesses, educational institutions, and interested members of the public to engage the public in restoring and maintaining the integrity of surface waters in the county. Education and training include teaching techniques to keep water clean and using stormwater as a resource for landscape irrigation and other beneficial uses. Staff engages the novice to the profession as well as kids to great grandparents. Field Activities Pima County inspects outfalls, construction sites, industrial facilities, and reported environmental complaints that could lead to illicit discharge detection and elimination. To characterize water quality, Pima County collects water samples at five monitor sites representing low density residences, medium density residences, high density residences, commercial, and industrial land uses. This report documents these activities and results. References USGS, 1973. Geohydrology and Water Resources of the Tucson Basin, Arizona, Geological
Survey Water-Supply Paper 1939-E, 80 pp.
Pima County 2013 Annual Report. Part 1
AZPDES Permit No. AZS000002 Page 4 of 4
(This page is intentionally blank.)
Pima County 2013 Annual Report, Part 3
AZPDES Permit No. AZS000002 Page 1 of 10
3. NARRATIVE SUMMARY OF STORMWATER MANAGEMENT PROGRAM Pima County’s municipal separate storm sewer storm drain system consists of 2,087 miles of roadways, 39 miles of stormdrains, and infrastructure collecting runoff into drainageways or discharging runoff to ephemeral stream channels. Pima County utilizes a Public Awareness Program and a Public Participation Program to invest in behaviors protecting the quality of stormwater as it flows through the county. The public is encouraged to report illegal dumping and unusual environmental conditions to remove materials in washes or on land that could be transported into a wash during rainfall events. Management of Pima County Facilities includes maintenance of infrastructure and acquisition of property to prevent stormwater pollution. Inspections of Industrial Facilities and Construction Sites also reduce stormwater pollution. Post Construction activities include inspections once construction is completed at a site as well as implementation of Green Infrastructure and Low Impact Development (GI/LID).
A. Public Awareness
The public awareness program involves on-going education of the public and businesses, participation in environmental education events and stormwater educational events. The methods of delivering the keep-stormwater-clean message are literature, handouts, presentations, and assistance to business by Pima County DEQ staff. A wide range of literature is provided to the public (Appendix A). Conferences, Seminars and Presentations Pima County DEQ participated in the multi-jurisdictional regional 2013 Stormwater Construction Seminar on May 8, 2013. There were 94 participants, with 57% attending from the municipal sector. Christopher Henninger, ADEQ Supervisor of the Stormwater and General Permits Unit, described the new AZPDES Construction General Permit and stormwater managers from the local jurisdictions were available to answer questions. The seminar was developed and sponsored by the Pima Association of Governments (PAG), Pima County, City of Tucson, Town of Marana, Town of Oro Valley, ADEQ and Arizona Department of Transportation. Pima Community College requests a three hour presentation on stormwater management for the lecture Building/Construction Technology 265 Sustainability. Class sizes range between 5 to 30 people, depending upon the number of people registered in a semester. This fiscal year the topic addressed the application of Low Impact Development and Green Infrastructure to achieve sustainable water use. Presentations were made on September 18, 2012 and February 5, 2013. Additional presentations were made to the public. Training was presented to KE&G on December 12, 2012 to address continuing compliance issues on a Pima County road construction project. The methods of applying stormwater management as a drought adaptation technique was presented to Pima County’s Local Drought Impact Group on May 8, 2013. The importance of using stormwater management as a water harvesting technique was presented to the Water Resources Research Center on May 21, 2013.
Pima County 2013 Annual Report, Part 3
AZPDES Permit No. AZS000002 Page 2 of 10
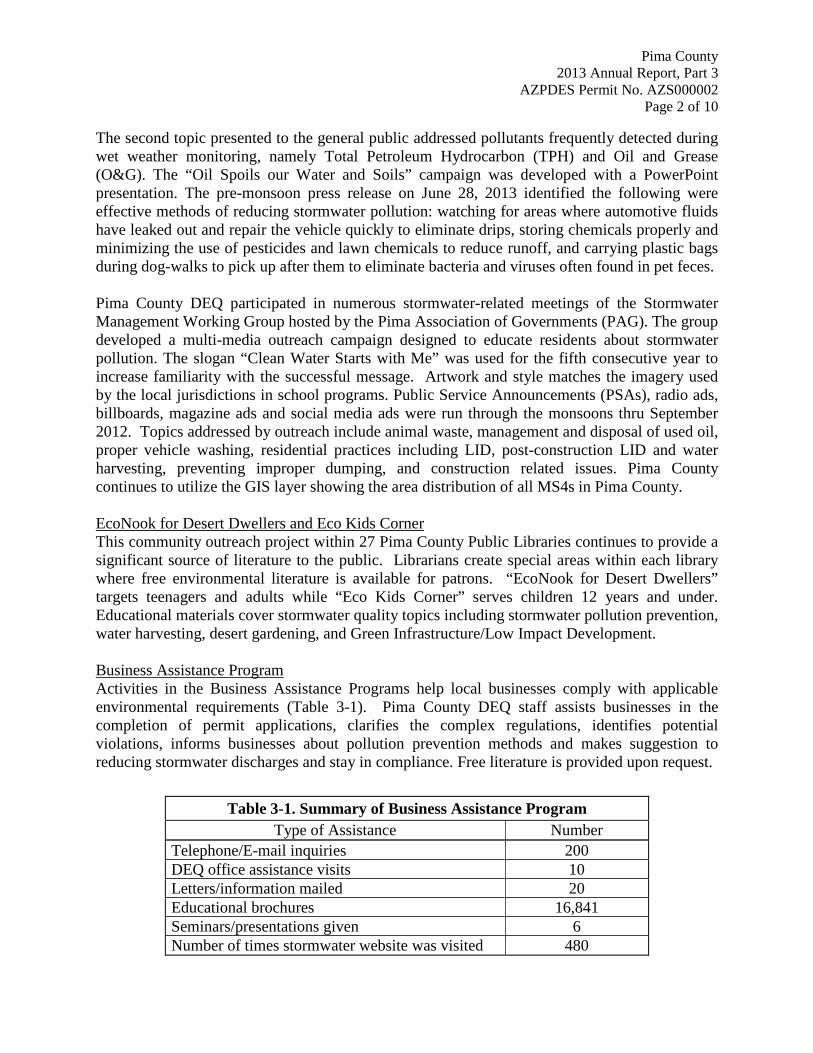
The second topic presented to the general public addressed pollutants frequently detected during wet weather monitoring, namely Total Petroleum Hydrocarbon (TPH) and Oil and Grease (O&G). The “Oil Spoils our Water and Soils” campaign was developed with a PowerPoint presentation. The pre-monsoon press release on June 28, 2013 identified the following were effective methods of reducing stormwater pollution: watching for areas where automotive fluids have leaked out and repair the vehicle quickly to eliminate drips, storing chemicals properly and minimizing the use of pesticides and lawn chemicals to reduce runoff, and carrying plastic bags during dog-walks to pick up after them to eliminate bacteria and viruses often found in pet feces. Pima County DEQ participated in numerous stormwater-related meetings of the Stormwater Management Working Group hosted by the Pima Association of Governments (PAG). The group developed a multi-media outreach campaign designed to educate residents about stormwater pollution. The slogan “Clean Water Starts with Me” was used for the fifth consecutive year to increase familiarity with the successful message. Artwork and style matches the imagery used by the local jurisdictions in school programs. Public Service Announcements (PSAs), radio ads, billboards, magazine ads and social media ads were run through the monsoons thru September 2012. Topics addressed by outreach include animal waste, management and disposal of used oil, proper vehicle washing, residential practices including LID, post-construction LID and water harvesting, preventing improper dumping, and construction related issues. Pima County continues to utilize the GIS layer showing the area distribution of all MS4s in Pima County. EcoNook for Desert Dwellers and Eco Kids Corner This community outreach project within 27 Pima County Public Libraries continues to provide a significant source of literature to the public. Librarians create special areas within each library where free environmental literature is available for patrons. “EcoNook for Desert Dwellers” targets teenagers and adults while “Eco Kids Corner” serves children 12 years and under. Educational materials cover stormwater quality topics including stormwater pollution prevention, water harvesting, desert gardening, and Green Infrastructure/Low Impact Development. Business Assistance Program Activities in the Business Assistance Programs help local businesses comply with applicable environmental requirements (Table 3-1). Pima County DEQ staff assists businesses in the completion of permit applications, clarifies the complex regulations, identifies potential violations, informs businesses about pollution prevention methods and makes suggestion to reducing stormwater discharges and stay in compliance. Free literature is provided upon request.
Table 3-1. Summary of Business Assistance Program Type of Assistance Number
Telephone/E-mail inquiries 200 DEQ office assistance visits 10 Letters/information mailed 20 Educational brochures 16,841 Seminars/presentations given 6 Number of times stormwater website was visited 480
Pima County 2013 Annual Report, Part 3
AZPDES Permit No. AZS000002 Page 3 of 10
B. Public Participation
Engaging the public in substantive actions to reduce pollutants from entering stormwater is key to long-term success. Members of the public clean trash from roadways and drainageways, recycle or dispose of hazardous materials at the Household Hazardous Waste Facility and report environmental issues to Pima County DEQ. Adopt-a-Roadway Program Volunteers in Pima County’s Adopt-a-Roadway program clean up roadways and public lands. The program had 305 clean-up events over a total length of 486 miles. Pima County tracks the amount of material cleaned up from each adopted road (Appendix B).
Environmental Complaints The public and businesses are encouraged to fax, phone or e-mail information about environmental complaints to Pima County DEQ. Each complaint is inspected or, if the location of the complaint places it within another jurisdiction, the complaint is referred to the responsible jurisdiction. Additional information about the inspection and potential enforcement process is described in the next section on illicit discharge detection and elimination activities. Household Hazardous Waste Program The Household Hazardous Waste Program, funded jointly by Pima County and the City of Tucson, provides a means for small businesses and the public to properly dispose of common household and automotive products. The public is encouraged to bring automotive fluids, batteries, drain openers, hobby chemicals, household cleaners, lawn and garden products, pesticides, paint products, medications, polishes, pool chemicals, solvents and items labeled acid, flammable, caustic, poison, caution, toxic, danger or warning. Program managers track the amount of waste collected from the public and small businesses as well as the number of participants and events (Appendix C).
C. Illicit Discharge Detection and Elimination Activities Pima County DEQ receives complaints from the general public, elected officials, regulators, and local governments identifying potential sources of pollutants that could endanger public health or the environment. Each complaint within Pima County’s jurisdiction is inspected to determine if a pollutant has entered the environment and if so, the severity of the problem. The complaint is tracked until it is closed (Appendix D) or is escalated to the enforcement action of a Notice of Violation (NOV). NOVs are closed when the pollutant has been abated (Appendix E). The number of complaints filed within Pima County’s jurisdiction during this fiscal year was 1,366. Each complaint was inspected and the average time between filing the complaint and the inspection was 1.9 days. The number of inspections performed within three days was 1,101 or 81% of all Pima County responses. There are several possibilities for sites not being logged as inspected. Several complaints can be called in for the same issue and only one inspection is
Pima County 2013 Annual Report, Part 3
AZPDES Permit No. AZS000002 Page 4 of 10
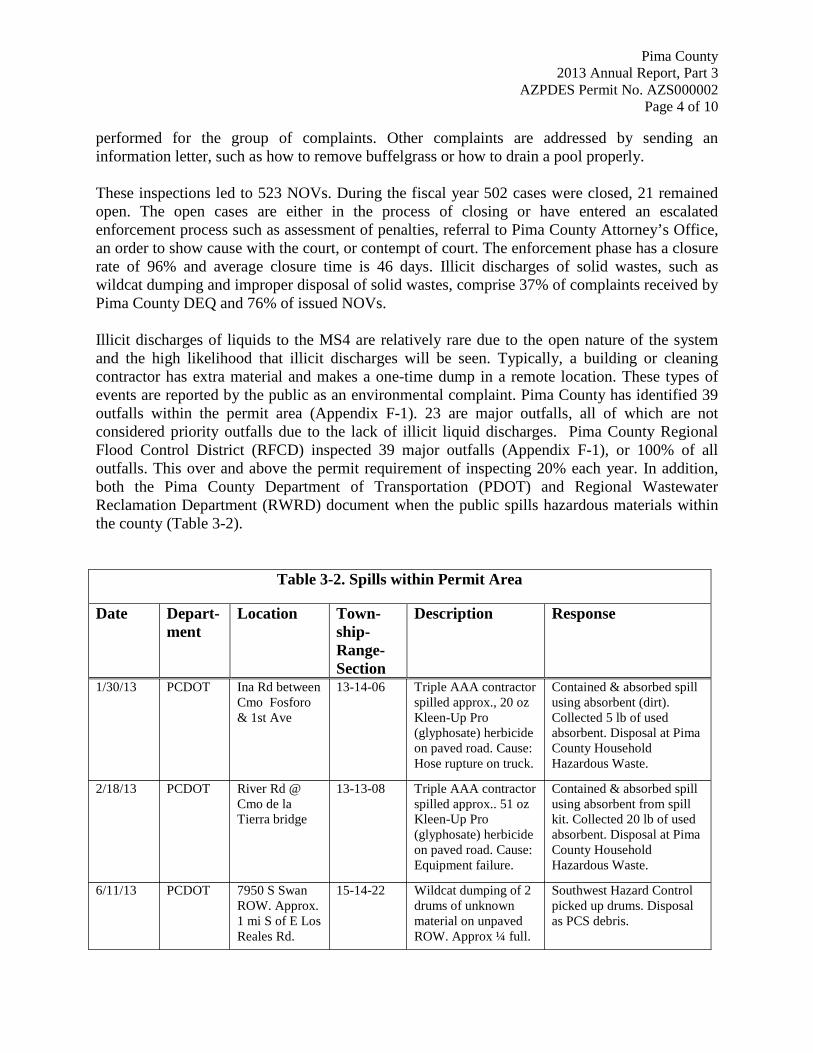
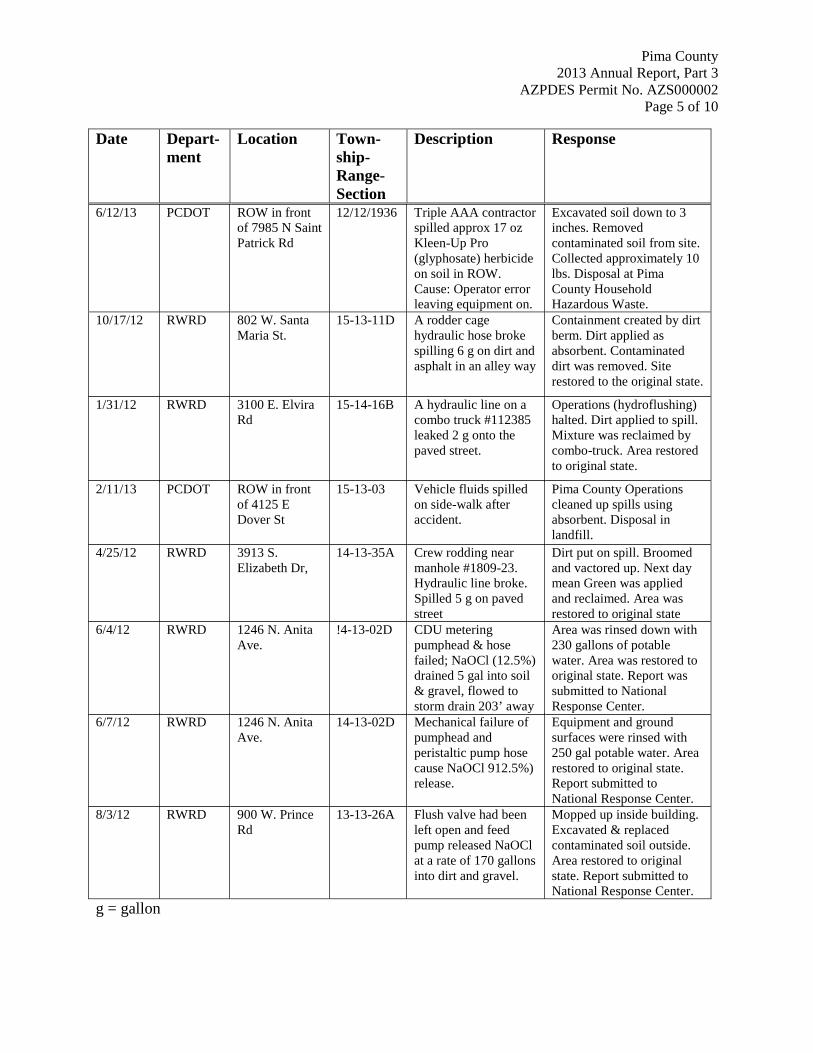
performed for the group of complaints. Other complaints are addressed by sending an information letter, such as how to remove buffelgrass or how to drain a pool properly. These inspections led to 523 NOVs. During the fiscal year 502 cases were closed, 21 remained open. The open cases are either in the process of closing or have entered an escalated enforcement process such as assessment of penalties, referral to Pima County Attorney’s Office, an order to show cause with the court, or contempt of court. The enforcement phase has a closure rate of 96% and average closure time is 46 days. Illicit discharges of solid wastes, such as wildcat dumping and improper disposal of solid wastes, comprise 37% of complaints received by Pima County DEQ and 76% of issued NOVs. Illicit discharges of liquids to the MS4 are relatively rare due to the open nature of the system and the high likelihood that illicit discharges will be seen. Typically, a building or cleaning contractor has extra material and makes a one-time dump in a remote location. These types of events are reported by the public as an environmental complaint. Pima County has identified 39 outfalls within the permit area (Appendix F-1). 23 are major outfalls, all of which are not considered priority outfalls due to the lack of illicit liquid discharges. Pima County Regional Flood Control District (RFCD) inspected 39 major outfalls (Appendix F-1), or 100% of all outfalls. This over and above the permit requirement of inspecting 20% each year. In addition, both the Pima County Department of Transportation (PDOT) and Regional Wastewater Reclamation Department (RWRD) document when the public spills hazardous materials within the county (Table 3-2).
Table 3-2. Spills within Permit Area
Date Depart-ment
Location Town-ship- Range- Section
Description Response
1/30/13 PCDOT Ina Rd between Cmo Fosforo & 1st Ave
13-14-06 Triple AAA contractor spilled approx., 20 oz Kleen-Up Pro (glyphosate) herbicide on paved road. Cause: Hose rupture on truck.
Contained & absorbed spill using absorbent (dirt). Collected 5 lb of used absorbent. Disposal at Pima County Household Hazardous Waste.
2/18/13 PCDOT River Rd @ Cmo de la Tierra bridge
13-13-08 Triple AAA contractor spilled approx.. 51 oz Kleen-Up Pro (glyphosate) herbicide on paved road. Cause: Equipment failure.
Contained & absorbed spill using absorbent from spill kit. Collected 20 lb of used absorbent. Disposal at Pima County Household Hazardous Waste.
6/11/13 PCDOT 7950 S Swan ROW. Approx. 1 mi S of E Los Reales Rd.
15-14-22 Wildcat dumping of 2 drums of unknown material on unpaved ROW. Approx ¼ full.
Southwest Hazard Control picked up drums. Disposal as PCS debris.
Pima County 2013 Annual Report, Part 3
AZPDES Permit No. AZS000002 Page 5 of 10
Date Depart-ment
Location Town-ship- Range- Section
Description Response
6/12/13 PCDOT ROW in front of 7985 N Saint Patrick Rd
12/12/1936 Triple AAA contractor spilled approx 17 oz Kleen-Up Pro (glyphosate) herbicide on soil in ROW. Cause: Operator error leaving equipment on.
Excavated soil down to 3 inches. Removed contaminated soil from site. Collected approximately 10 lbs. Disposal at Pima County Household Hazardous Waste.
10/17/12 RWRD 802 W. Santa Maria St.
15-13-11D A rodder cage hydraulic hose broke spilling 6 g on dirt and asphalt in an alley way
Containment created by dirt berm. Dirt applied as absorbent. Contaminated dirt was removed. Site restored to the original state.
1/31/12 RWRD 3100 E. Elvira Rd
15-14-16B A hydraulic line on a combo truck #112385 leaked 2 g onto the paved street.
Operations (hydroflushing) halted. Dirt applied to spill. Mixture was reclaimed by combo-truck. Area restored to original state.
2/11/13 PCDOT ROW in front of 4125 E Dover St
15-13-03 Vehicle fluids spilled on side-walk after accident.
Pima County Operations cleaned up spills using absorbent. Disposal in landfill.
4/25/12 RWRD 3913 S. Elizabeth Dr,
14-13-35A Crew rodding near manhole #1809-23. Hydraulic line broke. Spilled 5 g on paved street
Dirt put on spill. Broomed and vactored up. Next day mean Green was applied and reclaimed. Area was restored to original state
6/4/12 RWRD 1246 N. Anita Ave.
!4-13-02D CDU metering pumphead & hose failed; NaOCl (12.5%) drained 5 gal into soil & gravel, flowed to storm drain 203’ away
Area was rinsed down with 230 gallons of potable water. Area was restored to original state. Report was submitted to National Response Center.
6/7/12 RWRD 1246 N. Anita Ave.
14-13-02D Mechanical failure of pumphead and peristaltic pump hose cause NaOCl 912.5%) release.
Equipment and ground surfaces were rinsed with 250 gal potable water. Area restored to original state. Report submitted to National Response Center.
8/3/12 RWRD 900 W. Prince Rd
13-13-26A Flush valve had been left open and feed pump released NaOCl at a rate of 170 gallons into dirt and gravel.
Mopped up inside building. Excavated & replaced contaminated soil outside. Area restored to original state. Report submitted to National Response Center.
g = gallon
Pima County 2013 Annual Report, Part 3
AZPDES Permit No. AZS000002 Page 6 of 10
D. County Facilities Management of County Facilities includes preparing an inventory of county facilities, GIS mapping of the MS4 features, maintaining roadway and drainageway infrastructure, drainageways, acquiring land to conserve open spaces and training staff directly involved in stormwater activities. All activities are preventive measures to keep stormwater clean. County Facility Inventory and Spill Prevention An inventory of county-owned or operated facilities with the potential to discharge pollutants to receiving waters shows none of them have a high potential for discharge pollutants (Appendix G). Many facilities are permitted with Arizona Department of Environmental Quality water permits such as Aquifer Protection Permits (APP) and Arizona Pollutant Discharge Elimination System (AZPDES). Others are restoration projects ameliorating issues such as erosion of sediment and loss of flora and fauna. Proper use and storage of chemicals is regulated within Pima County through enforcement of local requirements (environmental nuisance, solid waste, and liquid waste requirements) established in Title 7 of the Pima County Code (Pima County, 2011b). Contractors hired to maintain Pima County landscaped areas and public right-of-ways are required to follow spraying protocols established by State of Arizona rules and manufacturer’s recommendations. GIS Mapping Pima County’s Geographic Information System (GIS) maintains geographic data in ArcGIS and AutoDesk products and is called MapGuide. The area covered is Pima County within Universal Transverse Mercator (UTM) Zone 12. The coordinate system is based on the State Plane Project North American Datum of 1983 (NAD83) with High Accuracy Reference Network (HARN). The layers of information within GIS are maintained in the Stormwater theme of MapGuide. Many layers are included in this theme, including the following layers identified in the permit:
• Points (Outfalls and stormdrain inlets) • Lines (stormdrain pipes, streams and washes, streets, and topographic lines) • Polygons (retention/detention basins, MS4 permit areas, zoning, and vegetative cover)
Two layers are planned for addition to the GIS Mapping system, namely the drainage area of the five monitor sites and the location of Outstanding Arizona Waters and Impaired Waters (Appendix H). Infrastructure Maintenance Roadways Pima County Department of Transportation (PDOT) maintains 2,087 miles of roads and the drainageways in the road right-of-ways. The types of roadway maintenance include sweeping, shoulder repairs, pothole repairs, grading and blading, sidewalk and curb repair, street surface repairs and litter and debris removal (Appendix I). Drainageways
Pima County 2013 Annual Report, Part 3
AZPDES Permit No. AZS000002 Page 7 of 10
Pima County RFCD maintains 450 miles of drainage, excluding the major water courses of the Santa Cruz River, Rillito River, Pantano Wash and Cañada Del Oro Wash. RFCD prioritizes 150 miles for inspection, and inspects the identified outfalls (Appendix F) and drainage reaches. They then follow up with grading; spot litter, debris, weed control; sediment removal; mowing; and spraying vegetation where needed (Appendix J). Land Conservation Land has been purchased under the 1997 Open Space Bond Program (OSBP), the 2004 Conservation Acquisition Bond Program (CABP) and the Flood prone Land Acquisition Program (FLAP) to conserve land (Appendix K). The 1997 OSBP and 2004 CABP protect the region’s most prized natural and cultural resources (Pima County, 2011d). The FLAP preserves land in floodways. Training staff directly working on stormwater control measures Pima County trains field personnel to recognize and report potential illicit discharges to Pima County DEQ by fax, phone or e-mail. Additionally, Pima County DEQ trained fourteen staff members whose work contributes to stormwater management. The June 28, 2013 presentation introduced the Stormwater Management Program, the organizational chart of people working on stormwater issues, the types of activities and documents each prepares, and a description of what elements to look for to file a stormwater complaint.
E. Industrial and Commercial Facilities The Industrial Facilities Inventory is based on ADEQ’s list of facilities that filed for the 2010 Multi-Sector General Permit (2010 MSGP) and facilities which need to file a Notice of Intent for the 2010 MSGP. Facilities located within the permit area and which have the potential to discharge to a Pima County roadway or drainageway were added to the inventory (Appendix L-1). Stormwater inspections are designed to evaluate consistency with the ADEQ’s 2010 MSGP and compliance with Pima County ordinances. The Site Inspection Report form was modified to incorporate the 2010 MSGP and Pima County 2011 MS4 permit. Of the 51 industrial facilities, ten were inspected during this fiscal year (Appendix L-2). As the permit requires inspections of 20%, the permit requirement has been met. Inspections for the industrial facilities started in September of 2012. Nine required additional work to be consistent with either the 2010 MSGP or compliance with Pima County ordinances. By June 30, 2013, eight facilities had fulfilled the recommended changes.
F. Construction Sites Activities reducing pollutants to stream channels include plan reviews, issuance of air quality permits and Floodplain Use Permits, construction site inspections, and staff training.
Pima County 2013 Annual Report, Part 3
AZPDES Permit No. AZS000002 Page 8 of 10
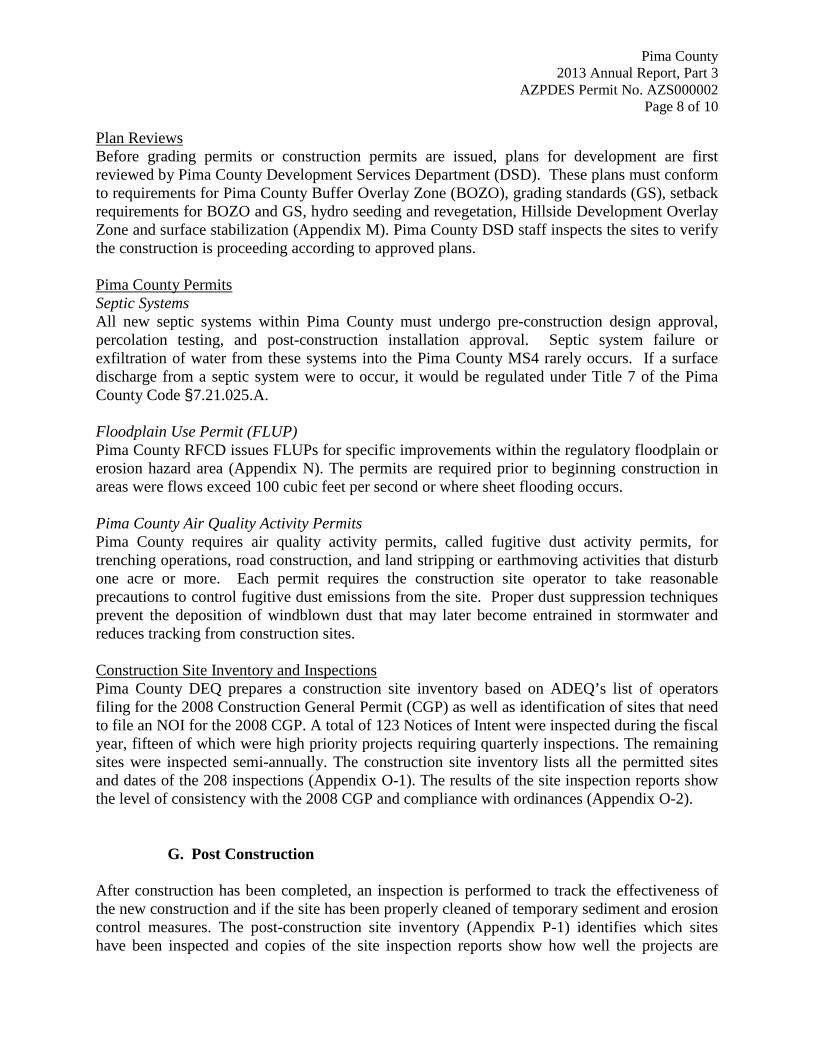
Plan Reviews Before grading permits or construction permits are issued, plans for development are first reviewed by Pima County Development Services Department (DSD). These plans must conform to requirements for Pima County Buffer Overlay Zone (BOZO), grading standards (GS), setback requirements for BOZO and GS, hydro seeding and revegetation, Hillside Development Overlay Zone and surface stabilization (Appendix M). Pima County DSD staff inspects the sites to verify the construction is proceeding according to approved plans. Pima County Permits Septic Systems All new septic systems within Pima County must undergo pre-construction design approval, percolation testing, and post-construction installation approval. Septic system failure or exfiltration of water from these systems into the Pima County MS4 rarely occurs. If a surface discharge from a septic system were to occur, it would be regulated under Title 7 of the Pima County Code §7.21.025.A. Floodplain Use Permit (FLUP) Pima County RFCD issues FLUPs for specific improvements within the regulatory floodplain or erosion hazard area (Appendix N). The permits are required prior to beginning construction in areas were flows exceed 100 cubic feet per second or where sheet flooding occurs.
Pima County Air Quality Activity Permits Pima County requires air quality activity permits, called fugitive dust activity permits, for trenching operations, road construction, and land stripping or earthmoving activities that disturb one acre or more. Each permit requires the construction site operator to take reasonable precautions to control fugitive dust emissions from the site. Proper dust suppression techniques prevent the deposition of windblown dust that may later become entrained in stormwater and reduces tracking from construction sites. Construction Site Inventory and Inspections Pima County DEQ prepares a construction site inventory based on ADEQ’s list of operators filing for the 2008 Construction General Permit (CGP) as well as identification of sites that need to file an NOI for the 2008 CGP. A total of 123 Notices of Intent were inspected during the fiscal year, fifteen of which were high priority projects requiring quarterly inspections. The remaining sites were inspected semi-annually. The construction site inventory lists all the permitted sites and dates of the 208 inspections (Appendix O-1). The results of the site inspection reports show the level of consistency with the 2008 CGP and compliance with ordinances (Appendix O-2).
G. Post Construction After construction has been completed, an inspection is performed to track the effectiveness of the new construction and if the site has been properly cleaned of temporary sediment and erosion control measures. The post-construction site inventory (Appendix P-1) identifies which sites have been inspected and copies of the site inspection reports show how well the projects are
Pima County 2013 Annual Report, Part 3
AZPDES Permit No. AZS000002 Page 9 of 10
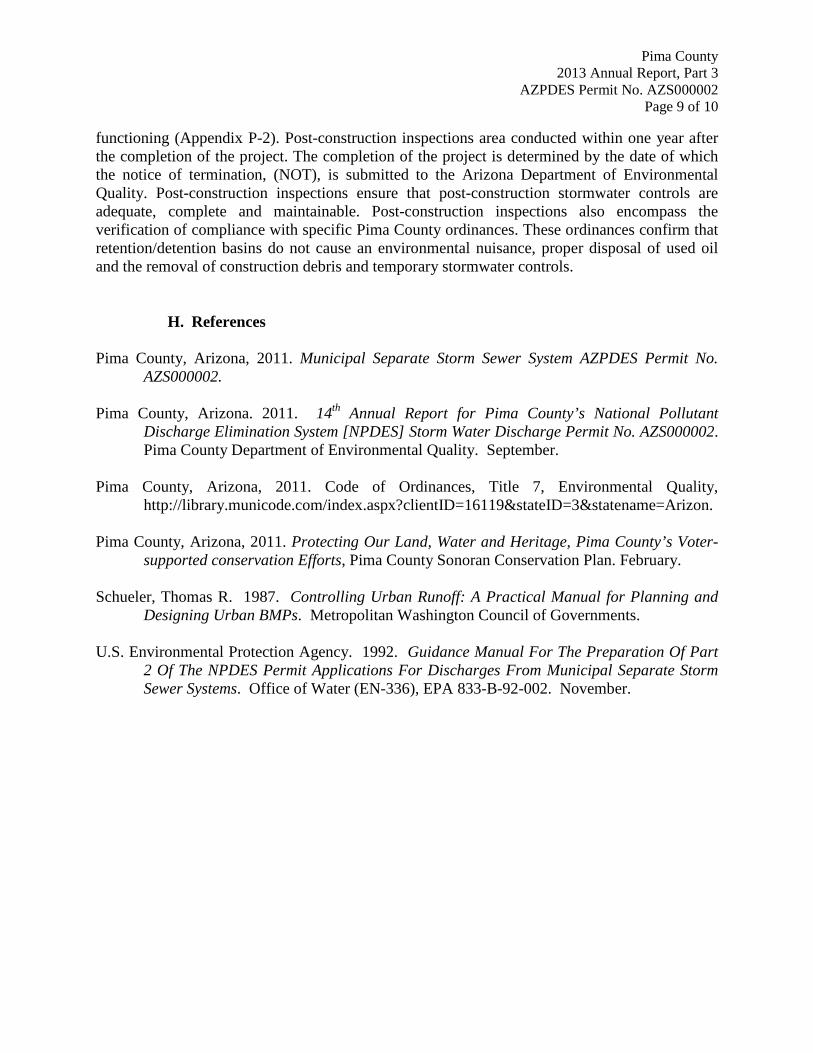
functioning (Appendix P-2). Post-construction inspections area conducted within one year after the completion of the project. The completion of the project is determined by the date of which the notice of termination, (NOT), is submitted to the Arizona Department of Environmental Quality. Post-construction inspections ensure that post-construction stormwater controls are adequate, complete and maintainable. Post-construction inspections also encompass the verification of compliance with specific Pima County ordinances. These ordinances confirm that retention/detention basins do not cause an environmental nuisance, proper disposal of used oil and the removal of construction debris and temporary stormwater controls.
H. References Pima County, Arizona, 2011. Municipal Separate Storm Sewer System AZPDES Permit No.
AZS000002. Pima County, Arizona. 2011. 14th Annual Report for Pima County’s National Pollutant
Discharge Elimination System [NPDES] Storm Water Discharge Permit No. AZS000002. Pima County Department of Environmental Quality. September.
Pima County, Arizona, 2011. Code of Ordinances, Title 7, Environmental Quality,
http://library.municode.com/index.aspx?clientID=16119&stateID=3&statename=Arizon. Pima County, Arizona, 2011. Protecting Our Land, Water and Heritage, Pima County’s Voter-
supported conservation Efforts, Pima County Sonoran Conservation Plan. February. Schueler, Thomas R. 1987. Controlling Urban Runoff: A Practical Manual for Planning and
Designing Urban BMPs. Metropolitan Washington Council of Governments. U.S. Environmental Protection Agency. 1992. Guidance Manual For The Preparation Of Part
2 Of The NPDES Permit Applications For Discharges From Municipal Separate Storm Sewer Systems. Office of Water (EN-336), EPA 833-B-92-002. November.

Pima County 2013 Annual Report, Part 3
AZPDES Permit No. AZS000002 Page 10 of 10
(This page is intentionally blank).
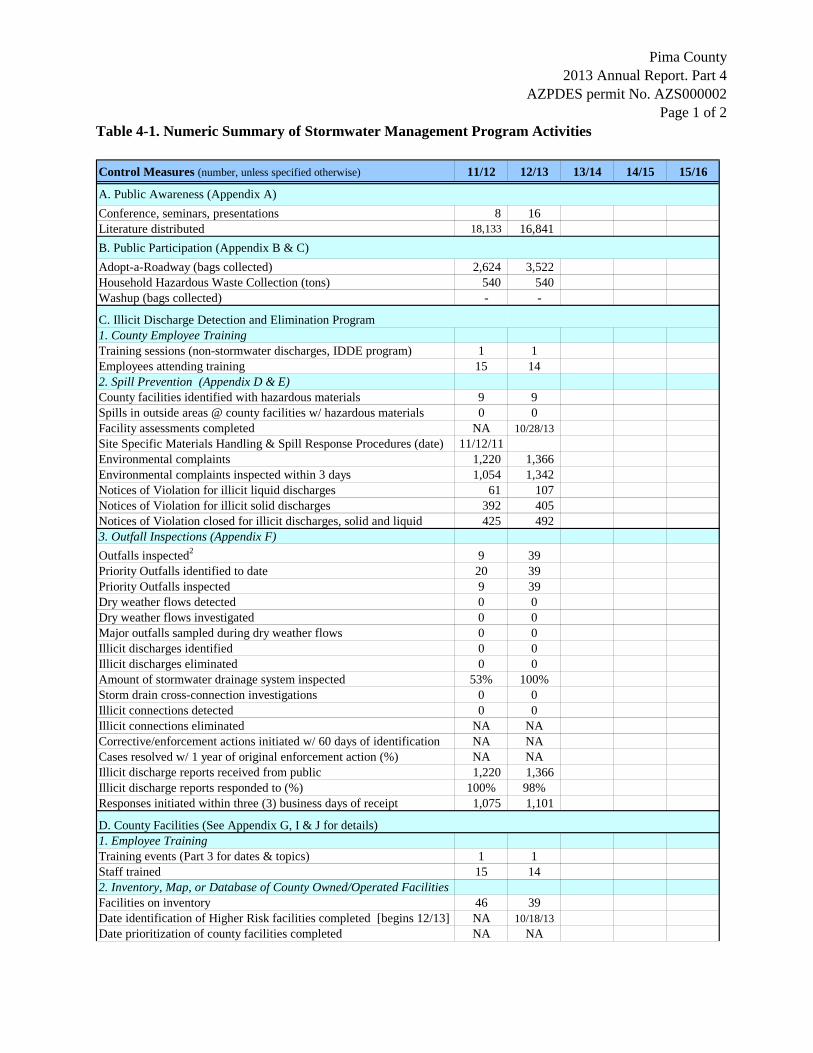
Table 4-1. Numeric Summary of Stormwater Management Program Activities
Pima County2013 Annual Report. Part 4
AZPDES permit No. AZS000002Page 1 of 2
Control Measures (number, unless specified otherwise) 11/12 12/13 13/14 14/15 15/16
A. Public Awareness (Appendix A)Conference, seminars, presentations 8 16Literature distributed 18,133 16,841 B. Public Participation (Appendix B & C)Adopt-a-Roadway (bags collected) 2,624 3,522 Household Hazardous Waste Collection (tons) 540 540 Washup (bags collected) - -
C. Illicit Discharge Detection and Elimination Program1. County Employee TrainingTraining sessions (non-stormwater discharges, IDDE program) 1 1Employees attending training 15 142. Spill Prevention (Appendix D & E) County facilities identified with hazardous materials 9 9Spills in outside areas @ county facilities w/ hazardous materials 0 0Facility assessments completed NA 10/28/13Site Specific Materials Handling & Spill Response Procedures (date) 11/12/11Environmental complaints 1,220 1,366 Environmental complaints inspected within 3 days 1,054 1,342 Notices of Violation for illicit liquid discharges 61 107 Notices of Violation for illicit solid discharges 392 405 Notices of Violation closed for illicit discharges, solid and liquid 425 492 3. Outfall Inspections (Appendix F)
Outfalls inspected2 9 39Priority Outfalls identified to date 20 39Priority Outfalls inspected 9 39Dry weather flows detected 0 0Dry weather flows investigated 0 0Major outfalls sampled during dry weather flows 0 0Illicit discharges identified 0 0Illicit discharges eliminated 0 0Amount of stormwater drainage system inspected 53% 100%Storm drain cross-connection investigations 0 0Illicit connections detected 0 0Illicit connections eliminated NA NACorrective/enforcement actions initiated w/ 60 days of identification NA NACases resolved w/ 1 year of original enforcement action (%) NA NAIllicit discharge reports received from public 1,220 1,366 Illicit discharge reports responded to (%) 100% 98%Responses initiated within three (3) business days of receipt 1,075 1,101
D. County Facilities (See Appendix G, I & J for details)1. Employee TrainingTraining events (Part 3 for dates & topics) 1 1Staff trained 15 142. Inventory, Map, or Database of County Owned/Operated FacilitiesFacilities on inventory 46 39Date identification of Higher Risk facilities completed [begins 12/13] NA 10/18/13Date prioritization of county facilities completed NA NA
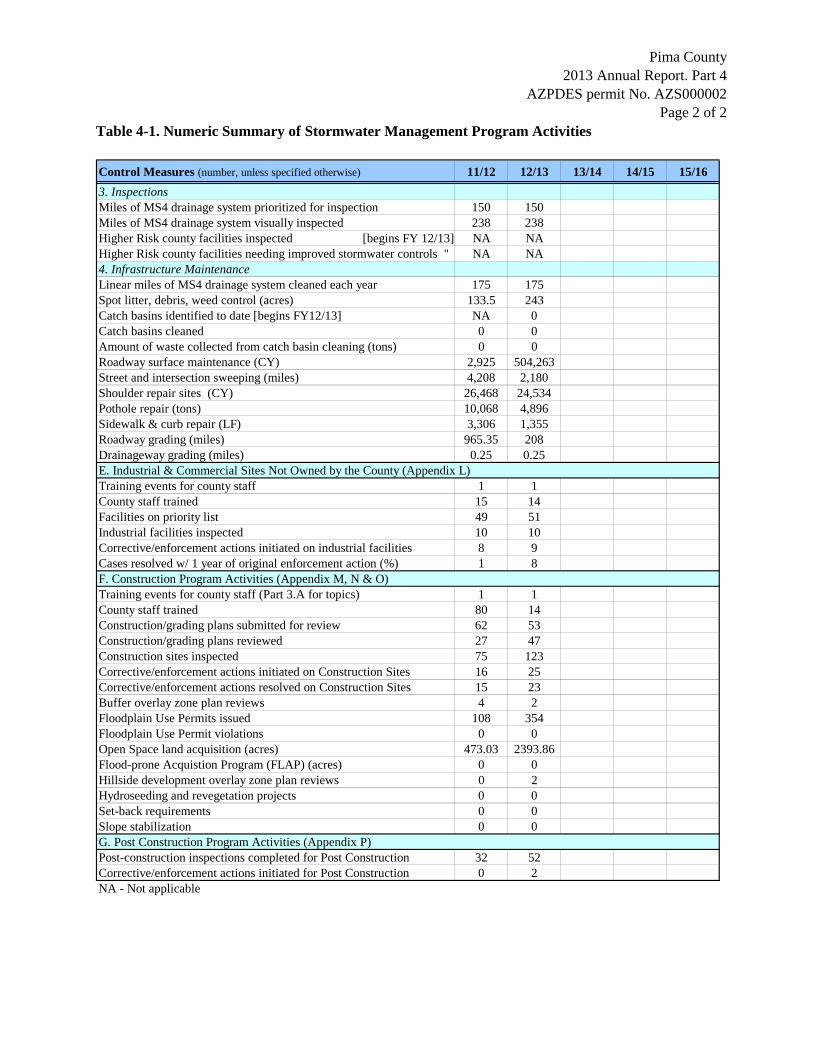
Table 4-1. Numeric Summary of Stormwater Management Program Activities
Pima County2013 Annual Report. Part 4
AZPDES permit No. AZS000002Page 2 of 2
Control Measures (number, unless specified otherwise) 11/12 12/13 13/14 14/15 15/163. Inspections Miles of MS4 drainage system prioritized for inspection 150 150Miles of MS4 drainage system visually inspected 238 238Higher Risk county facilities inspected [begins FY 12/13] NA NAHigher Risk county facilities needing improved stormwater controls " NA NA4. Infrastructure MaintenanceLinear miles of MS4 drainage system cleaned each year 175 175Spot litter, debris, weed control (acres) 133.5 243Catch basins identified to date [begins FY12/13] NA 0Catch basins cleaned 0 0Amount of waste collected from catch basin cleaning (tons) 0 0Roadway surface maintenance (CY) 2,925 504,263Street and intersection sweeping (miles) 4,208 2,180Shoulder repair sites (CY) 26,468 24,534Pothole repair (tons) 10,068 4,896Sidewalk & curb repair (LF) 3,306 1,355Roadway grading (miles) 965.35 208Drainageway grading (miles) 0.25 0.25E. Industrial & Commercial Sites Not Owned by the County (Appendix L)Training events for county staff 1 1County staff trained 15 14Facilities on priority list 49 51Industrial facilities inspected 10 10Corrective/enforcement actions initiated on industrial facilities 8 9Cases resolved w/ 1 year of original enforcement action (%) 1 8F. Construction Program Activities (Appendix M, N & O)Training events for county staff (Part 3.A for topics) 1 1County staff trained 80 14Construction/grading plans submitted for review 62 53Construction/grading plans reviewed 27 47Construction sites inspected 75 123Corrective/enforcement actions initiated on Construction Sites 16 25Corrective/enforcement actions resolved on Construction Sites 15 23Buffer overlay zone plan reviews 4 2Floodplain Use Permits issued 108 354Floodplain Use Permit violations 0 0Open Space land acquisition (acres) 473.03 2393.86Flood-prone Acquistion Program (FLAP) (acres) 0 0Hillside development overlay zone plan reviews 0 2Hydroseeding and revegetation projects 0 0Set-back requirements 0 0Slope stabilization 0 0G. Post Construction Program Activities (Appendix P)Post-construction inspections completed for Post Construction 32 52Corrective/enforcement actions initiated for Post Construction 0 2NA - Not applicable
Pima County 2013 Annual Report, Part 5
AZPDES Permit No. AZS000002 Page 1 of 4
PART 5: EVALUATION OF STORMWATER MANAGEMENT PROGRAM
Activities of the Stormwater Management Program (SWMP) include control measures to reduce discharges in stormwater through public awareness and public involvement programs, maintenance of roadways and drainage ways, and investigation of illicit connection and illegal dumping, new development and significant redevelopment programs, industrial facility inspections, construction site inspections, and enforcement actions. Water quality data from five monitor points documents runoff quality. Inspections at construction sites and industrial facilities maintain awareness of the importance of following Stormwater Pollution Prevention Plans. Regular inspections and business assistance is needed to maintain surface water quality consistent with state SWQS and AZPDES permits. Recommendations from 2012 Annual Report Eight recommendations were made in the last annual report to improve documentation, precision of data, and more useful data. Most recommendations were able to be implemented and were effective. Some were not able to be implemented due to reasons outside Pima County’s control, such as regulatory limitations, as described below.
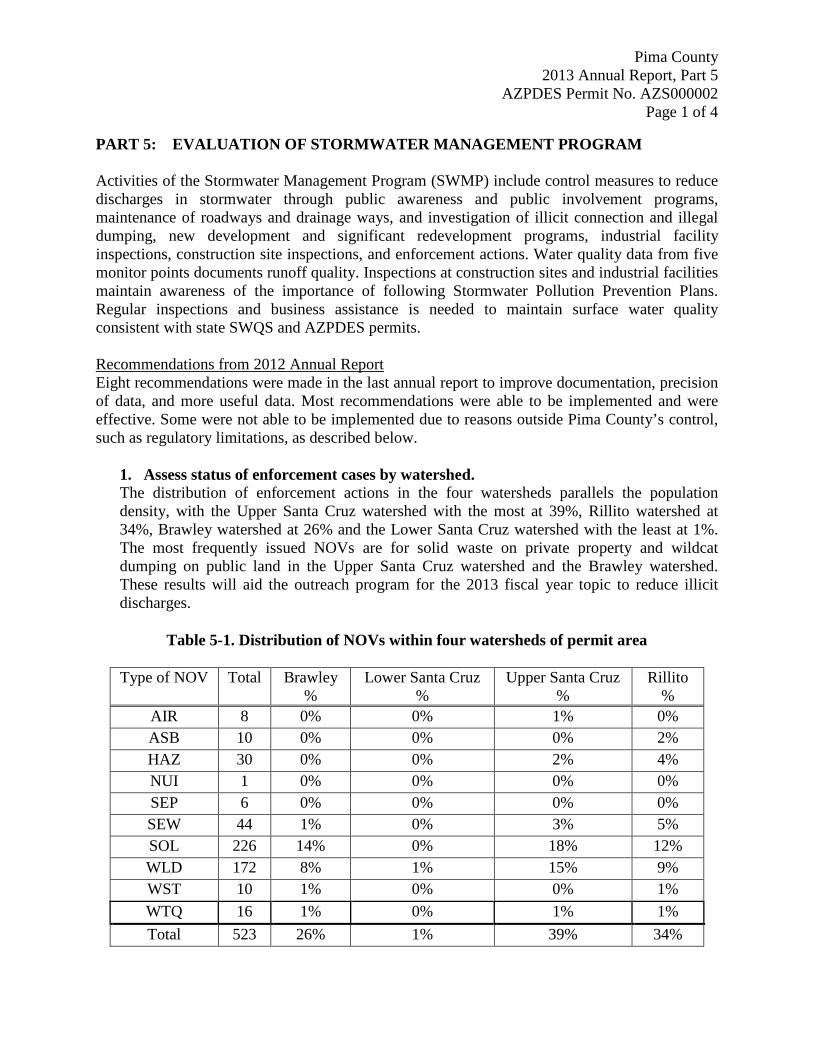
1. Assess status of enforcement cases by watershed. The distribution of enforcement actions in the four watersheds parallels the population density, with the Upper Santa Cruz watershed with the most at 39%, Rillito watershed at 34%, Brawley watershed at 26% and the Lower Santa Cruz watershed with the least at 1%. The most frequently issued NOVs are for solid waste on private property and wildcat dumping on public land in the Upper Santa Cruz watershed and the Brawley watershed. These results will aid the outreach program for the 2013 fiscal year topic to reduce illicit discharges.
Table 5-1. Distribution of NOVs within four watersheds of permit area
Type of NOV Total Brawley %
Lower Santa Cruz %
Upper Santa Cruz %
Rillito %
AIR 8 0% 0% 1% 0% ASB 10 0% 0% 0% 2% HAZ 30 0% 0% 2% 4% NUI 1 0% 0% 0% 0% SEP 6 0% 0% 0% 0% SEW 44 1% 0% 3% 5% SOL 226 14% 0% 18% 12% WLD 172 8% 1% 15% 9% WST 10 1% 0% 0% 1% WTQ 16 1% 0% 1% 1% Total 523 26% 1% 39% 34%
Pima County 2013 Annual Report, Part 5
AZPDES Permit No. AZS000002 Page 2 of 4
2. Evaluate water quality and pollutant loadings by season Three seasons of water quality data have been collected under the new permit, namely two winters and one summer. This means there is only one summer sample from which to draw a conclusion, which is insufficient to make meaningful comparisons between seasons. The possibility of seasonal impacts remains and will be assessed in the next report. 3. Tracking spills by County Facilities, not just by public in county property County departments began reporting the spills they caused and are reported in Table 3-2. 4. Track drainage cleanup the way PDOT tracks roadway cleanup. Maintenance of the drainageways has detailed tracking and is reported in Appendix J. 5. Track training in PDEQ, RWRD, PDOT, and RFCD. Training within the departments is tracked individually for the staff working in the field and the methodology is different between each department and division. A new program is being developed to bring consistency for the Stormwater Management Program. 6. Arrange for analytical work with detection limits smaller than Surface Water
Quality Standards, if laboratories are certified for the analytical method. The licensed laboratory is following protocols established by 40 CFR Part 136, Appendix B. The detection limit cannot be changed without approval from ADHS and EPA Region 9. 7. Calculate acres of five land uses within new permit area to facilitate evaluation of
pollutant loading estimates by land use. The time allocated for this task was invested in conversion of all Pima County land-based or permit-based management to enterprise software linking GIS data with SQL databases. The new software will enable all departments to easily access data for a parcel of land. The acreages for the five different land uses will be assessed in the next year. 8. Calculate acres of five land uses within new permit area to facilitate evaluation of
pollutant loading estimates by land use. A new method was implemented during the last fiscal year to track construction sites and industrial facilities that are out of compliance. The new tracking method documents follow-up inspections and the date when the facility met the identified requirements.
Evaluation of 2013 Stormwater Management Program The time frame for achieving compliance is now calculated in the construction site inventory. While most issues are resolved during the inspection, seven sites were unable to return to compliance within the 30 day time frame specified in the permit. In addition, nine Pima County facilities were not inspected by PDEQ. Three projects were completed and the project manager had not filed an NOT. Four were under active construction and were regularly inspected by
Pima County 2013 Annual Report, Part 5
AZPDES Permit No. AZS000002 Page 3 of 4
stormwater inspectors in other departments. The remaining two projects are scheduled to be inspected quarterly by PDEQ. The inventory of County Facilities (Appendix G-1) identifies the landfills currently owned or operated by Pima County. The list of facilities with the potential for hazardous substances (Appendix G-2) includes industrial facilities and facilities subject to Section 313 of Title III of Superfund Amendments and Reauthorization Act of 1986 (SARA) as well as facilities that treat, store or dispose of hazardous waste. The list will be expanded to include landfills that are currently closed and have been either owned or operated by Pima County.

Pima County 2013 Annual Report, Part 5
AZPDES Permit No. AZS000002 Page 4 of 4
(This page is intentionally blank).
Pima County 2013Annual Report. Part 6
AZPDES Permit No. AZS000002 Page 1 of 2
6. Stormwater Management Program Modifications ADEQ issued the new 2011 MS4 permit on June 16, 2011. A new Stormwater Management Program was developed to meet the provisions of the 2011 MS4 permit. Below are the identified changes to the 2013 SWMP.
1. Addition of New Control Measures New Control Measures were not added during the fiscal year.
2. Addition of Temporary Control Measures
No temporary control measures were proposed.
3. Increase of Existing Control Measures Existing control measures were maintained and have been expanded to address copper concentrations in runoff.
4. Replacement of Existing Control Measures None. 5. Modifications to SWMP
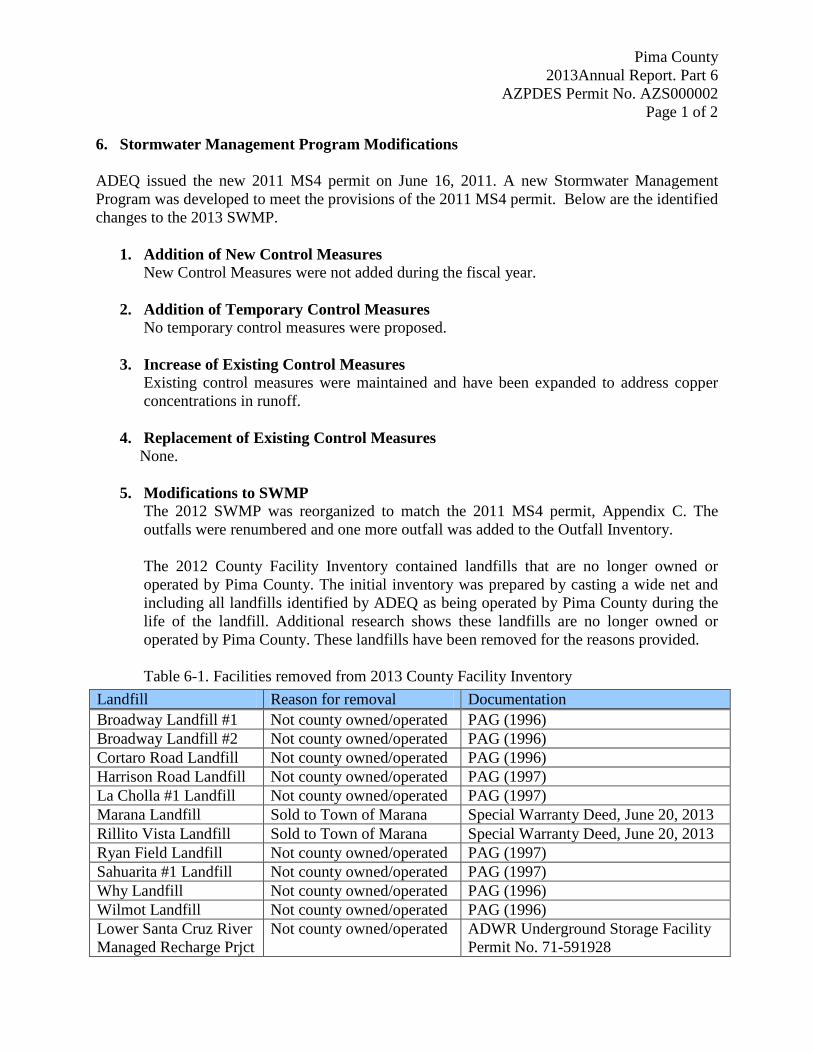
The 2012 SWMP was reorganized to match the 2011 MS4 permit, Appendix C. The outfalls were renumbered and one more outfall was added to the Outfall Inventory. The 2012 County Facility Inventory contained landfills that are no longer owned or operated by Pima County. The initial inventory was prepared by casting a wide net and including all landfills identified by ADEQ as being operated by Pima County during the life of the landfill. Additional research shows these landfills are no longer owned or operated by Pima County. These landfills have been removed for the reasons provided. Table 6-1. Facilities removed from 2013 County Facility Inventory
Landfill Reason for removal Documentation Broadway Landfill #1 Not county owned/operated PAG (1996) Broadway Landfill #2 Not county owned/operated PAG (1996) Cortaro Road Landfill Not county owned/operated PAG (1996) Harrison Road Landfill Not county owned/operated PAG (1997) La Cholla #1 Landfill Not county owned/operated PAG (1997) Marana Landfill Sold to Town of Marana Special Warranty Deed, June 20, 2013 Rillito Vista Landfill Sold to Town of Marana Special Warranty Deed, June 20, 2013 Ryan Field Landfill Not county owned/operated PAG (1997) Sahuarita #1 Landfill Not county owned/operated PAG (1997) Why Landfill Not county owned/operated PAG (1996) Wilmot Landfill Not county owned/operated PAG (1996) Lower Santa Cruz River Managed Recharge Prjct
Not county owned/operated ADWR Underground Storage Facility Permit No. 71-591928
Pima County 2013Annual Report. Part 6
AZPDES Permit No. AZS000002 Page 2 of 2
Pima County has a number of on-going activities and when they are discovered they are added to the SWMP. For example, Pima County has retained a contractor to perform herbicide and pesticide spraying since 2009. Most spraying is performed to remove invasive species, such as buffelgrass and tamarisks. The SWMP was updated to reflect these on-going practices.
References Broadway Landfills, Identified Public Landfills (excluding the State and Federal Facilities) and
Permanent Transfer Stations in Eastern Pima County and Ajo, Draft – January 1996, Prepared by Pima Association of Governments.
Cortaro Road Landfill, Identified Public Landfills (excluding the State and Federal Facilities)
and Permanent Transfer Stations in Eastern Pima County and Ajo, Draft – January 1996, Prepared by Pima Association of Governments.
Harrison Landfill , Section of the LESP IV Preliminary Assessment of Fourteen County-
operated Landfills,, Pima County Arizona – Draft Report, Prepared by Pima Association of Governments for Pima County Solid Waste Management, February 1997.
La Cholla #1 Landfill, Section of the LESP IV Preliminary Assessment of Fourteen County-
operated Landfills, Pima County Arizona – Draft Report, Prepared by Pima Association of Governments for Pima County Solid Waste Management, April, 1997.
Ryan Field Landfill, Section of the LESP IV Preliminary Assessment of Fourteen County-
operated Landfills, Pima County Arizona – Draft Report, Prepared by Pima Association of Governments for Pima County Solid Waste Management, September 1997.
Sahuarita #1 Landfill, Section of the LESP IV Preliminary Assessment of Fourteen County-
operated Landfills, Pima County Arizona – Draft Report, Prepared by Pima Association of Governments for Pima County Solid Waste Management, May 1997.
Why Landfill, Identified Public Landfills (excluding the State and Federal Facilities) and
Permanent Transfer Stations in Eastern Pima County and Ajo, Draft – January 1996, Prepared by Pima Association of Governments.
Wilmot Landfill, Identified Public Landfills (excluding the State and Federal Facilities) and
Permanent Transfer Stations in Eastern Pima County and Ajo, Draft – January 1996, Prepared by Pima Association of Governments.
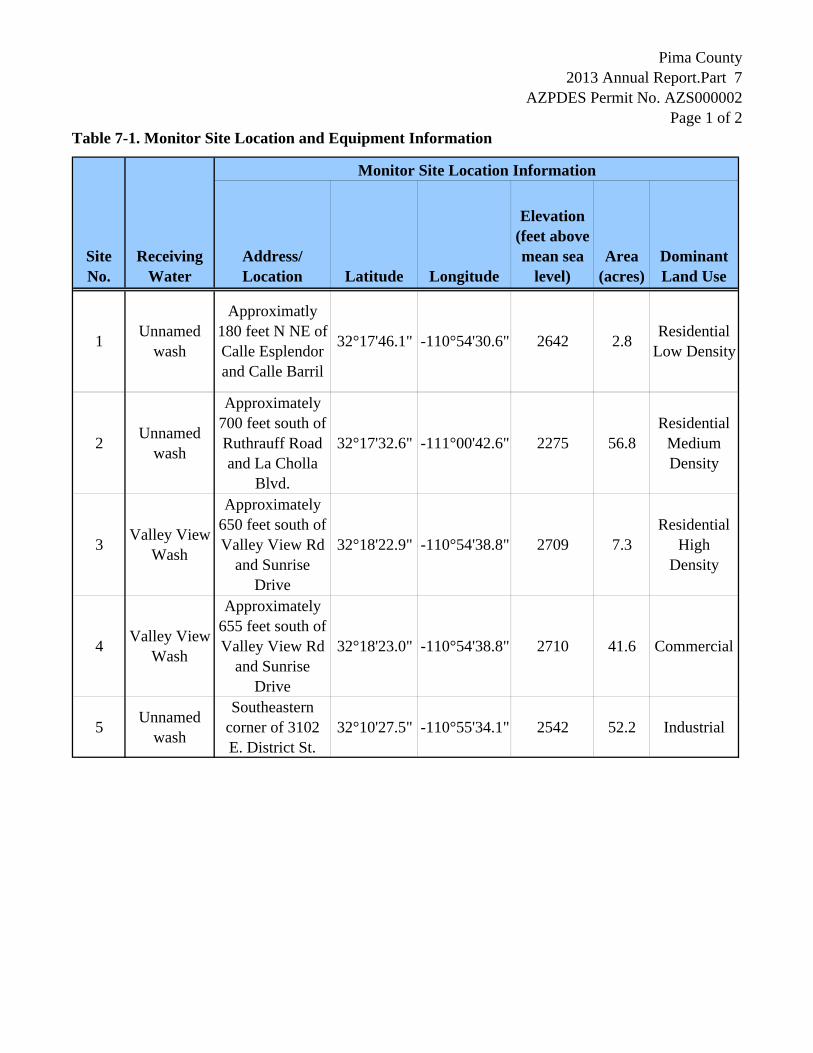
Table 7-1. Monitor Site Location and Equipment Information
Pima County 2013 Annual Report.Part 7
AZPDES Permit No. AZS000002Page 1 of 2
Monitor Site Location Information
Site No.
Receiving Water
Address/ Location Latitude Longitude
Elevation (feet above mean sea
level)Area
(acres)Dominant Land Use
1 Unnamed wash
Approximatly 180 feet N NE of Calle Esplendor and Calle Barril
32°17'46.1" -110°54'30.6" 2642 2.8 Residential Low Density
2 Unnamed wash
Approximately 700 feet south of Ruthrauff Road and La Cholla
Blvd.
32°17'32.6" -111°00'42.6" 2275 56.8Residential
Medium Density
3 Valley View Wash
Approximately 650 feet south of Valley View Rd
and Sunrise Drive
32°18'22.9" -110°54'38.8" 2709 7.3Residential
High Density
4 Valley View Wash
Approximately 655 feet south of Valley View Rd
and Sunrise Drive
32°18'23.0" -110°54'38.8" 2710 41.6 Commercial
5 Unnamed wash
Southeastern corner of 3102 E. District St.
32°10'27.5" -110°55'34.1" 2542 52.2 Industrial
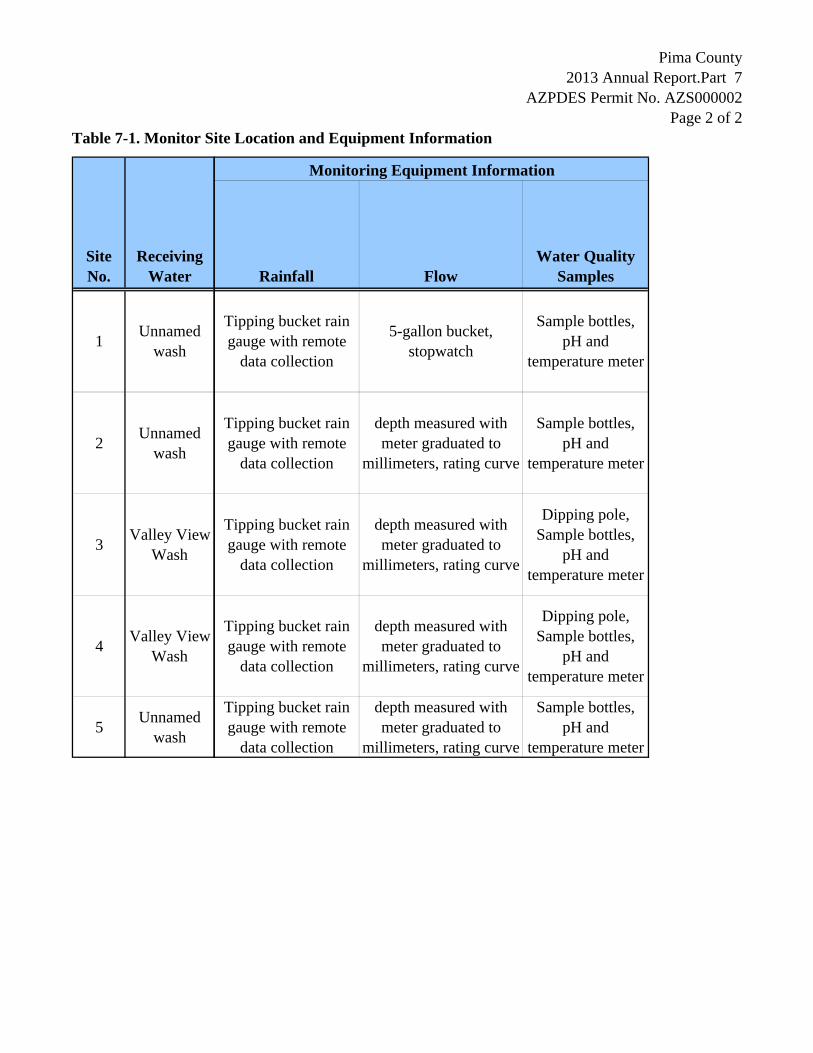
Table 7-1. Monitor Site Location and Equipment Information
Pima County 2013 Annual Report.Part 7
AZPDES Permit No. AZS000002Page 2 of 2
Site No.
Receiving Water
1 Unnamed wash
2 Unnamed wash
3 Valley View Wash
4 Valley View Wash
5 Unnamed wash
Monitoring Equipment Information
Rainfall FlowWater Quality
Samples
Tipping bucket rain gauge with remote
data collection
5-gallon bucket, stopwatch
Sample bottles, pH and
temperature meter
Tipping bucket rain gauge with remote
data collection
depth measured with meter graduated to
millimeters, rating curve
Sample bottles, pH and
temperature meter
Tipping bucket rain gauge with remote
data collection
depth measured with meter graduated to
millimeters, rating curve
Dipping pole, Sample bottles,
pH and temperature meter
Tipping bucket rain gauge with remote
data collection
depth measured with meter graduated to
millimeters, rating curve
Dipping pole, Sample bottles,
pH and temperature meter
Tipping bucket rain gauge with remote
data collection
depth measured with meter graduated to
millimeters, rating curve
Sample bottles, pH and
temperature meter
Pima County 2013Annual Report. Part 8
AZPDES Permit No. AZS000002 Page 1 of 4
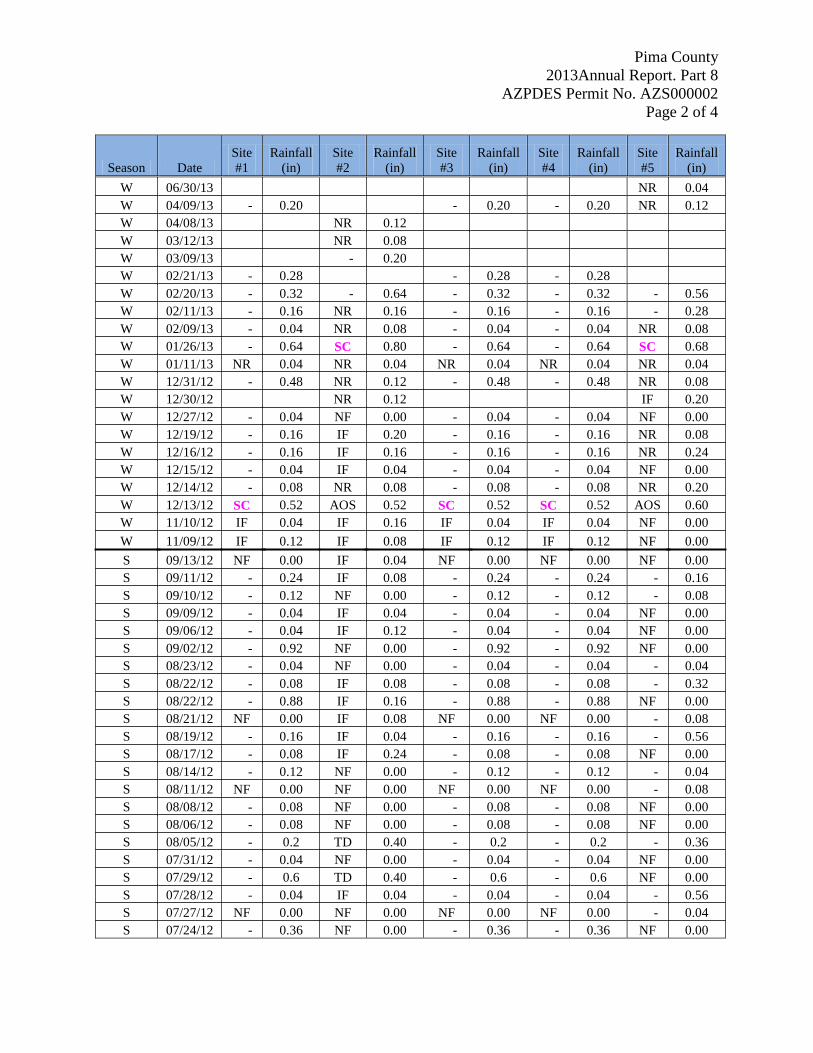
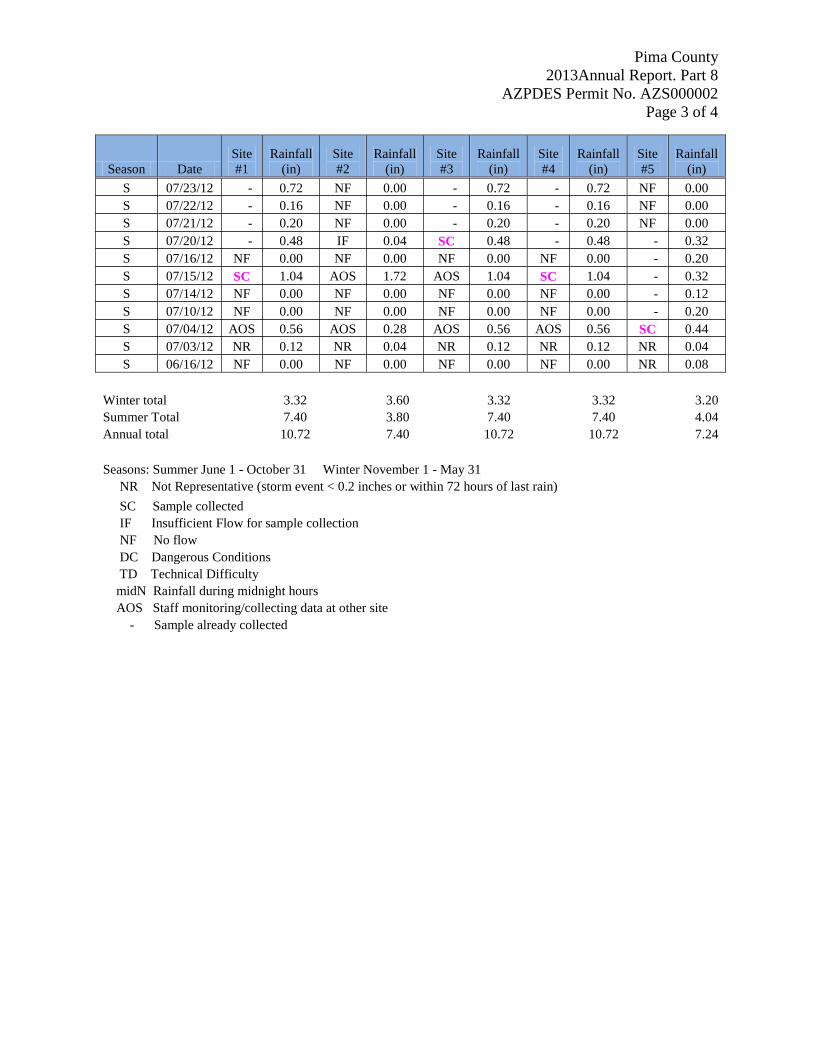
Part 8: Storm Event Records
Summer storms in Pima County typically have a short duration and high intensity. Winter storms are generally longer in duration and less intense. The extended event duration in the winter may result in a delay from the time rainfall begins and runoff begins that is greater than one hour. Although permit and guidance documentation indicates the first sample is to be collected within an hour of the start of rainfall, storm runoff may not begin until several minutes or hours after the initial rainfall. In this case, first flush is collected when runoff begins. During the reporting period there were 54 rainfall events (Table 8-1). The annual rainfall at the monitor sites ranged from 7.24 to 10.72 inches, which is lower than the annual normal rainfall of 11.55 inches (National Weather Service Forecast Office, Tucson, AZ, 2011). Nine of ten wet weather samples were collected during this fiscal year. While there were five qualifying rainfall events for Site No. 2 during the summer, a sample was not collected. During the first two qualifying events, sample crews were at other monitor sites collecting samples. During the next two qualifying storm events there was insufficient staff to collect the samples. Staff mobilized on the last qualifying event and found insufficient flow to collect samples. References National Weather Service Forecast Office, Tucson, AZ. 2011. Monthly and Daily Normals (1981
– 2010) plus Daily Extremes (1895-2011) for TUCSON, ARIZONA. Downloaded from the National Weather Service, NOAA website on October 5, 2011 from http://www.wrh.noaa.gov/twc/climate/tus.php.
Pima County 2013Annual Report. Part 8
AZPDES Permit No. AZS000002 Page 2 of 4
Season Date Site #1
Rainfall (in)
Site #2
Rainfall (in)
Site #3
Rainfall (in)
Site #4
Rainfall (in)
Site #5
Rainfall (in)
W 06/30/13 NR 0.04 W 04/09/13 - 0.20 - 0.20 - 0.20 NR 0.12 W 04/08/13 NR 0.12
W 03/12/13 NR 0.08
W 03/09/13 - 0.20
W 02/21/13 - 0.28 - 0.28 - 0.28
W 02/20/13 - 0.32 - 0.64 - 0.32 - 0.32 - 0.56 W 02/11/13 - 0.16 NR 0.16 - 0.16 - 0.16 - 0.28 W 02/09/13 - 0.04 NR 0.08 - 0.04 - 0.04 NR 0.08 W 01/26/13 - 0.64 SC 0.80 - 0.64 - 0.64 SC 0.68 W 01/11/13 NR 0.04 NR 0.04 NR 0.04 NR 0.04 NR 0.04 W 12/31/12 - 0.48 NR 0.12 - 0.48 - 0.48 NR 0.08 W 12/30/12 NR 0.12
IF 0.20
W 12/27/12 - 0.04 NF 0.00 - 0.04 - 0.04 NF 0.00 W 12/19/12 - 0.16 IF 0.20 - 0.16 - 0.16 NR 0.08 W 12/16/12 - 0.16 IF 0.16 - 0.16 - 0.16 NR 0.24 W 12/15/12 - 0.04 IF 0.04 - 0.04 - 0.04 NF 0.00 W 12/14/12 - 0.08 NR 0.08 - 0.08 - 0.08 NR 0.20 W 12/13/12 SC 0.52 AOS 0.52 SC 0.52 SC 0.52 AOS 0.60 W 11/10/12 IF 0.04 IF 0.16 IF 0.04 IF 0.04 NF 0.00 W 11/09/12 IF 0.12 IF 0.08 IF 0.12 IF 0.12 NF 0.00 S 09/13/12 NF 0.00 IF 0.04 NF 0.00 NF 0.00 NF 0.00 S 09/11/12 - 0.24 IF 0.08 - 0.24 - 0.24 - 0.16 S 09/10/12 - 0.12 NF 0.00 - 0.12 - 0.12 - 0.08 S 09/09/12 - 0.04 IF 0.04 - 0.04 - 0.04 NF 0.00 S 09/06/12 - 0.04 IF 0.12 - 0.04 - 0.04 NF 0.00 S 09/02/12 - 0.92 NF 0.00 - 0.92 - 0.92 NF 0.00 S 08/23/12 - 0.04 NF 0.00 - 0.04 - 0.04 - 0.04 S 08/22/12 - 0.08 IF 0.08 - 0.08 - 0.08 - 0.32 S 08/22/12 - 0.88 IF 0.16 - 0.88 - 0.88 NF 0.00 S 08/21/12 NF 0.00 IF 0.08 NF 0.00 NF 0.00 - 0.08 S 08/19/12 - 0.16 IF 0.04 - 0.16 - 0.16 - 0.56 S 08/17/12 - 0.08 IF 0.24 - 0.08 - 0.08 NF 0.00 S 08/14/12 - 0.12 NF 0.00 - 0.12 - 0.12 - 0.04 S 08/11/12 NF 0.00 NF 0.00 NF 0.00 NF 0.00 - 0.08 S 08/08/12 - 0.08 NF 0.00 - 0.08 - 0.08 NF 0.00 S 08/06/12 - 0.08 NF 0.00 - 0.08 - 0.08 NF 0.00 S 08/05/12 - 0.2 TD 0.40 - 0.2 - 0.2 - 0.36 S 07/31/12 - 0.04 NF 0.00 - 0.04 - 0.04 NF 0.00 S 07/29/12 - 0.6 TD 0.40 - 0.6 - 0.6 NF 0.00 S 07/28/12 - 0.04 IF 0.04 - 0.04 - 0.04 - 0.56 S 07/27/12 NF 0.00 NF 0.00 NF 0.00 NF 0.00 - 0.04 S 07/24/12 - 0.36 NF 0.00 - 0.36 - 0.36 NF 0.00
Pima County 2013Annual Report. Part 8
AZPDES Permit No. AZS000002 Page 3 of 4
Season Date Site #1
Rainfall (in)
Site #2
Rainfall (in)
Site #3
Rainfall (in)
Site #4
Rainfall (in)
Site #5
Rainfall (in)
S 07/23/12 - 0.72 NF 0.00 - 0.72 - 0.72 NF 0.00 S 07/22/12 - 0.16 NF 0.00 - 0.16 - 0.16 NF 0.00 S 07/21/12 - 0.20 NF 0.00 - 0.20 - 0.20 NF 0.00 S 07/20/12 - 0.48 IF 0.04 SC 0.48 - 0.48 - 0.32 S 07/16/12 NF 0.00 NF 0.00 NF 0.00 NF 0.00 - 0.20 S 07/15/12 SC 1.04 AOS 1.72 AOS 1.04 SC 1.04 - 0.32 S 07/14/12 NF 0.00 NF 0.00 NF 0.00 NF 0.00 - 0.12 S 07/10/12 NF 0.00 NF 0.00 NF 0.00 NF 0.00 - 0.20 S 07/04/12 AOS 0.56 AOS 0.28 AOS 0.56 AOS 0.56 SC 0.44 S 07/03/12 NR 0.12 NR 0.04 NR 0.12 NR 0.12 NR 0.04 S 06/16/12 NF 0.00 NF 0.00 NF 0.00 NF 0.00 NR 0.08
Winter total
3.32
3.60
3.32
3.32
3.20
Summer Total
7.40
3.80
7.40
7.40
4.04 Annual total
10.72
7.40
10.72
10.72
7.24
Seasons: Summer June 1 - October 31 Winter November 1 - May 31
NR Not Representative (storm event < 0.2 inches or within 72 hours of last rain) SC Sample collected
IF Insufficient Flow for sample collection NF No flow
DC Dangerous Conditions TD Technical Difficulty
midN Rainfall during midnight hours AOS Staff monitoring/collecting data at other site
- Sample already collected

Pima County 2013Annual Report. Part 8
AZPDES Permit No. AZS000002 Page 4 of 4
(This page is intentionally blank.)
Pima County 2013 Annual Report. Part 9
AZPDES Permit No. AZS000002 Page 1 of 2
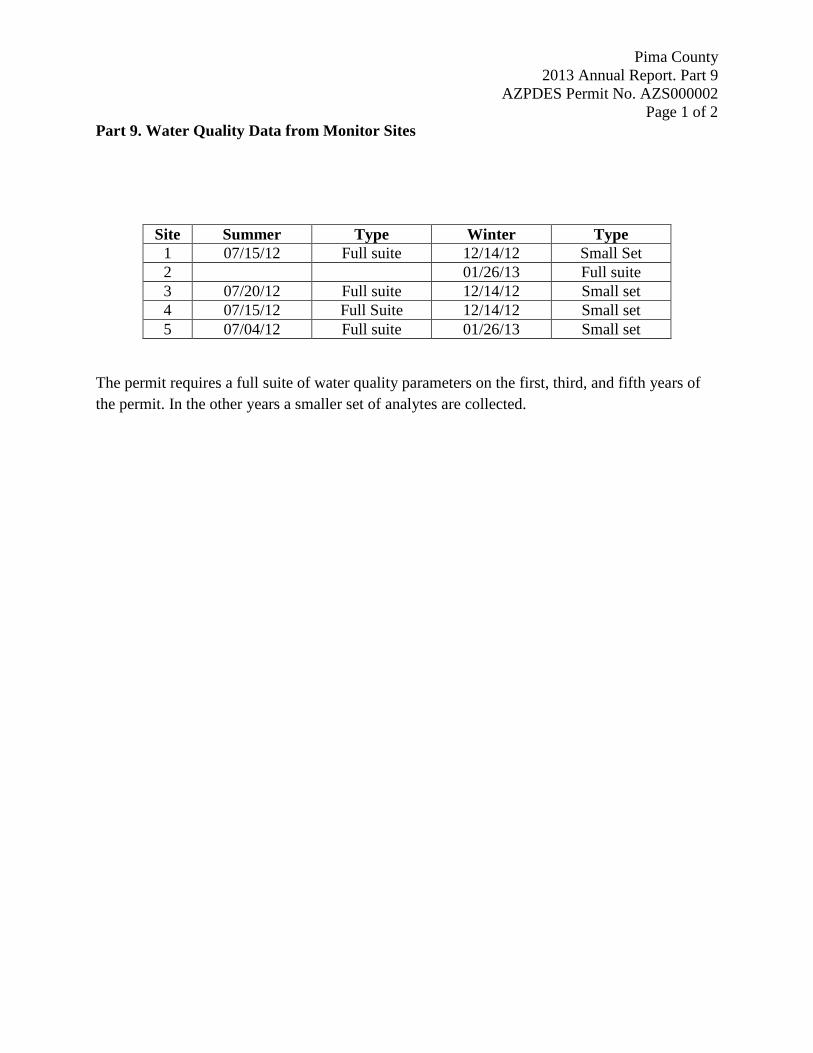
Part 9. Water Quality Data from Monitor Sites
Site Summer Type Winter Type 1 07/15/12 Full suite 12/14/12 Small Set 2 01/26/13 Full suite 3 07/20/12 Full suite 12/14/12 Small set 4 07/15/12 Full Suite 12/14/12 Small set 5 07/04/12 Full suite 01/26/13 Small set
The permit requires a full suite of water quality parameters on the first, third, and fifth years of the permit. In the other years a smaller set of analytes are collected.
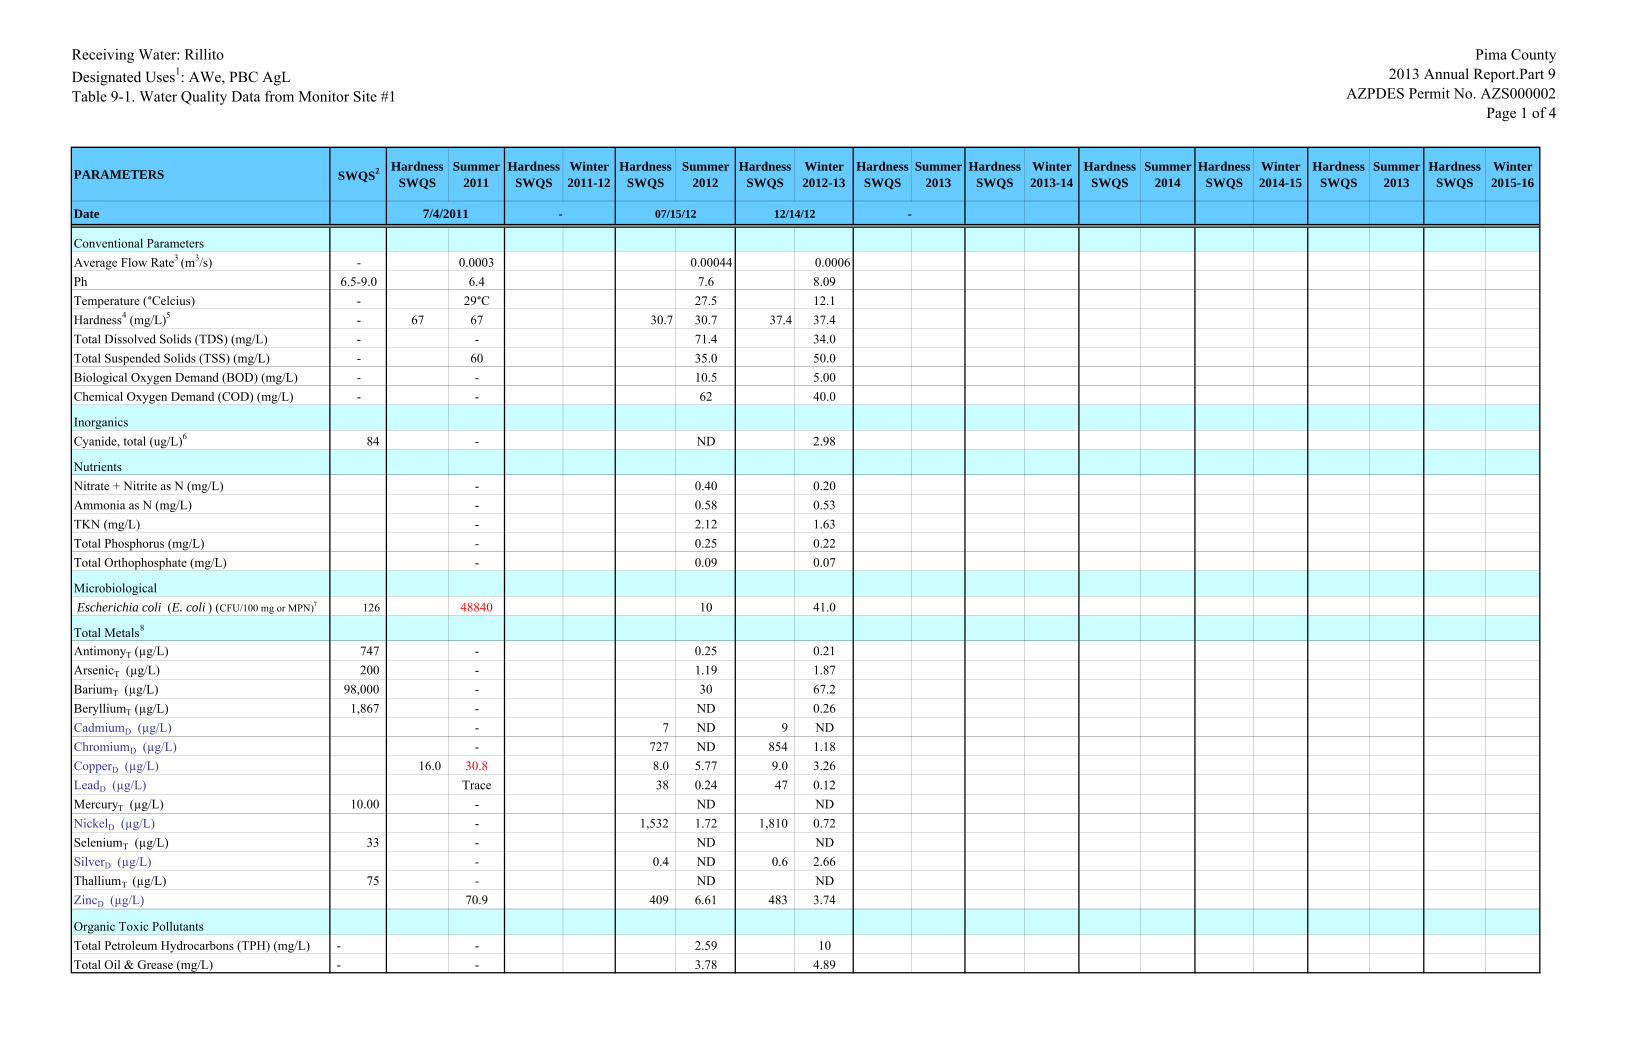
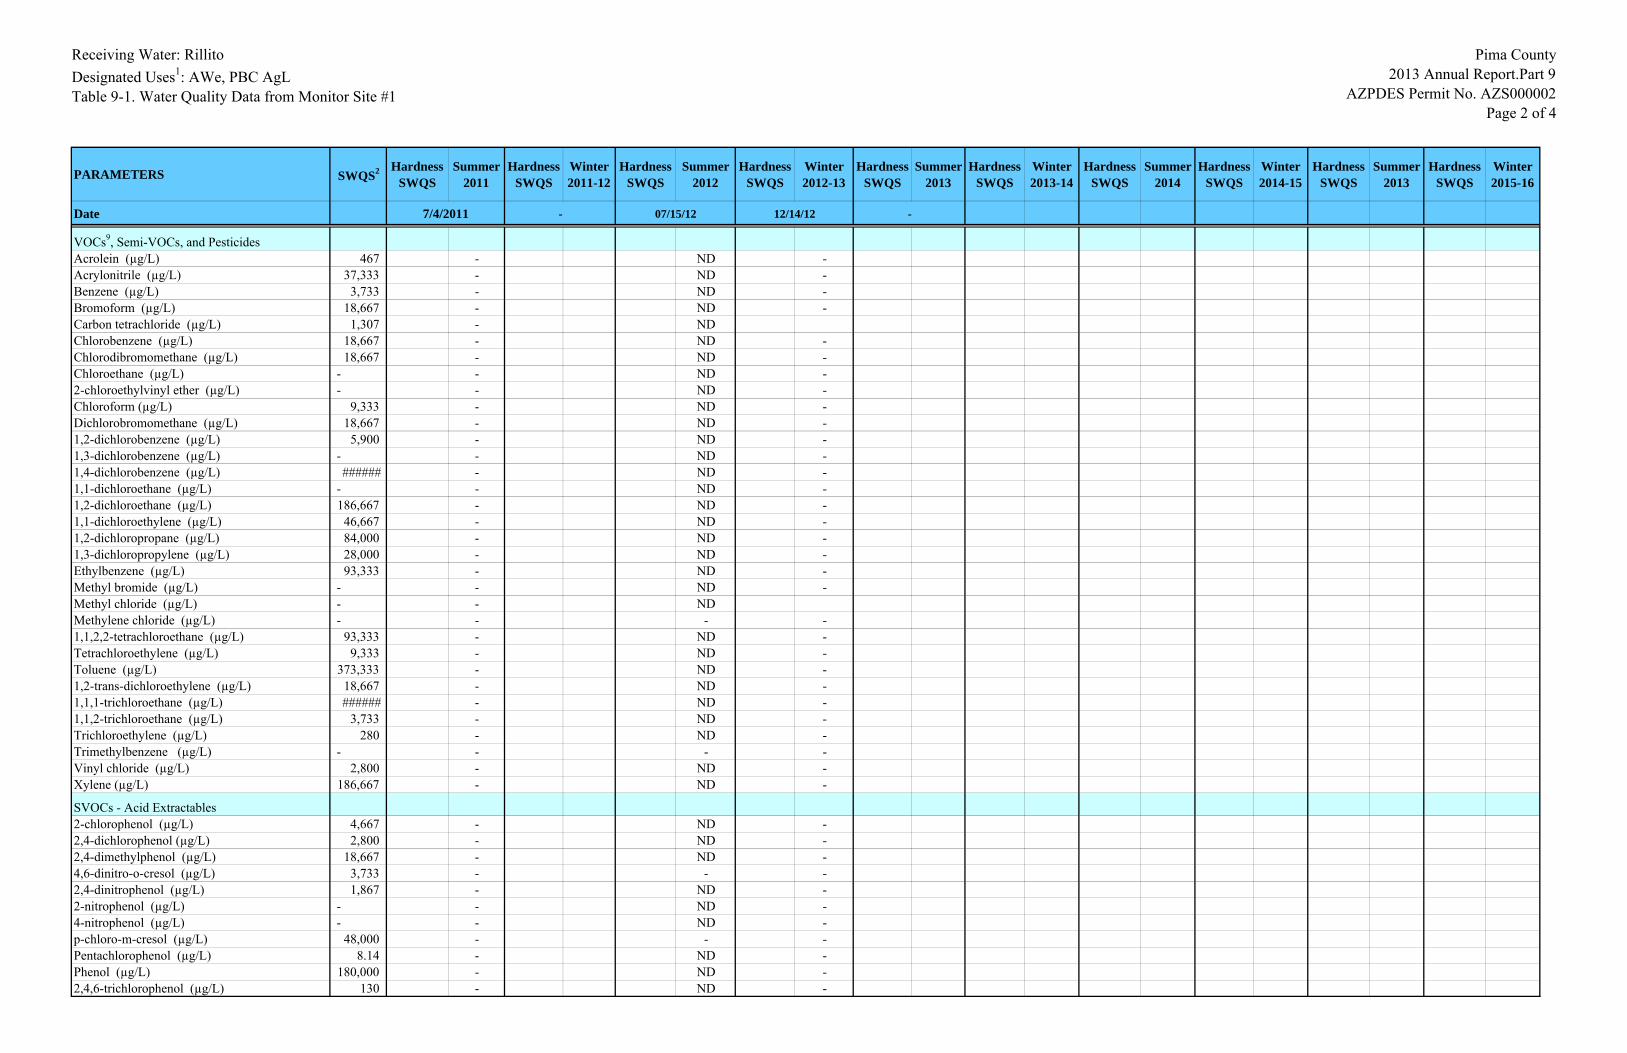
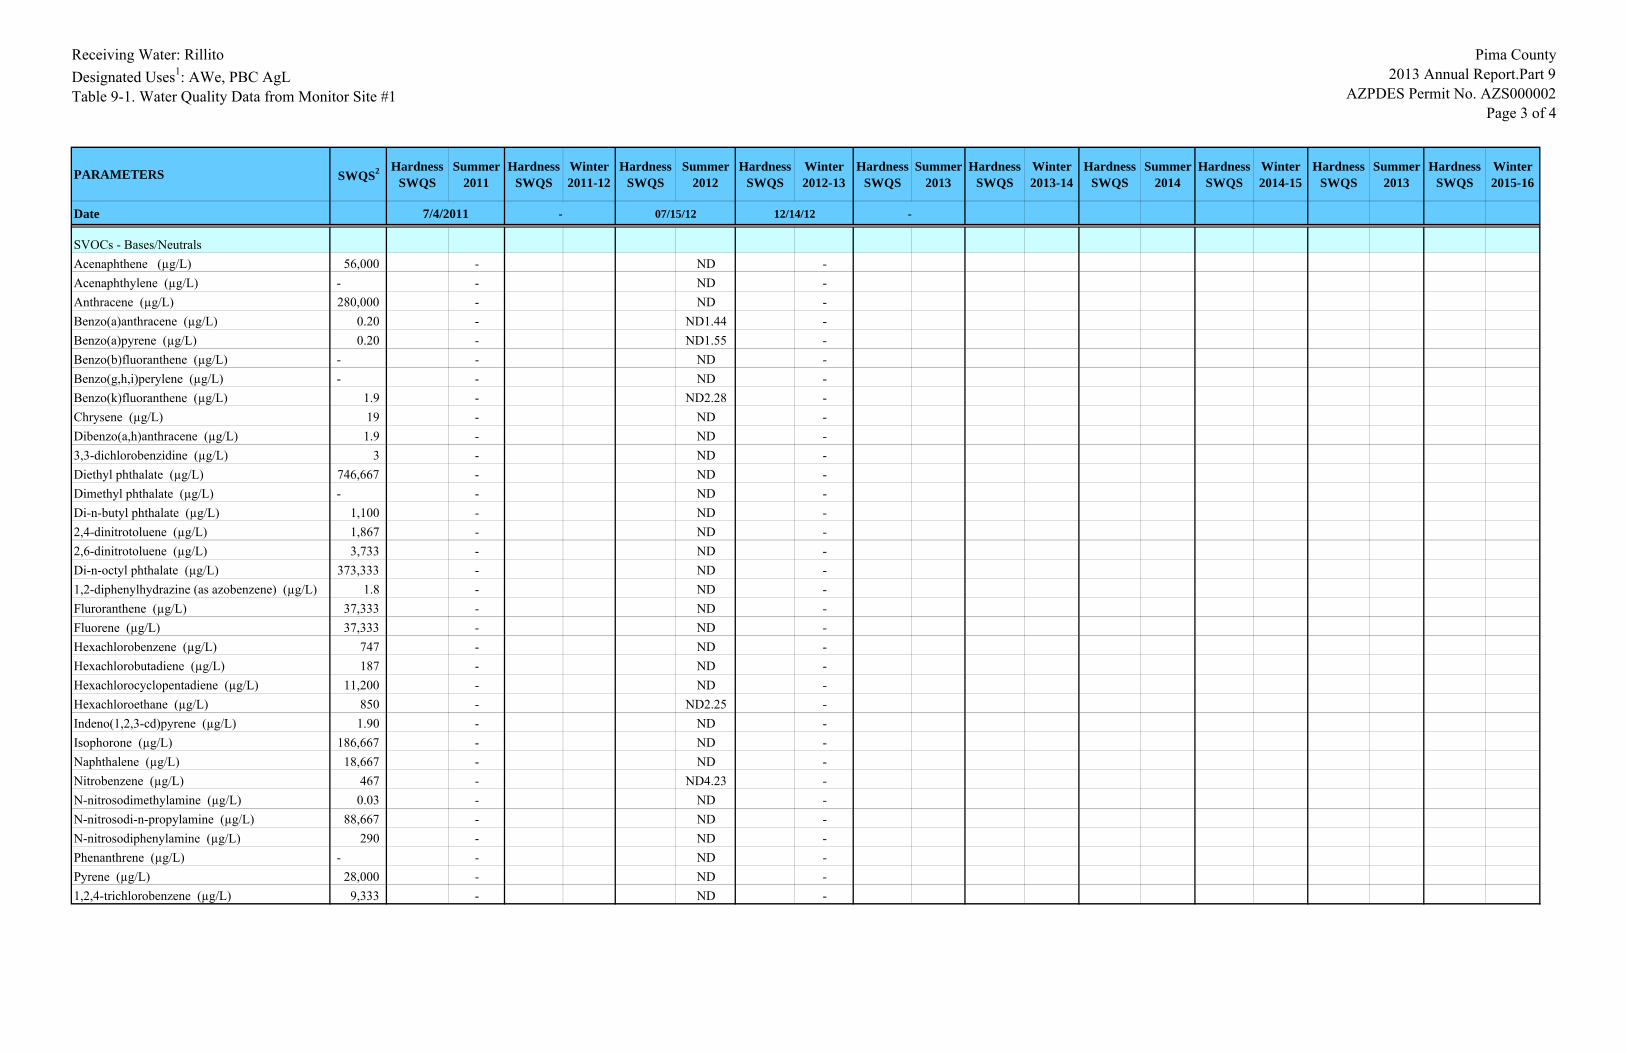
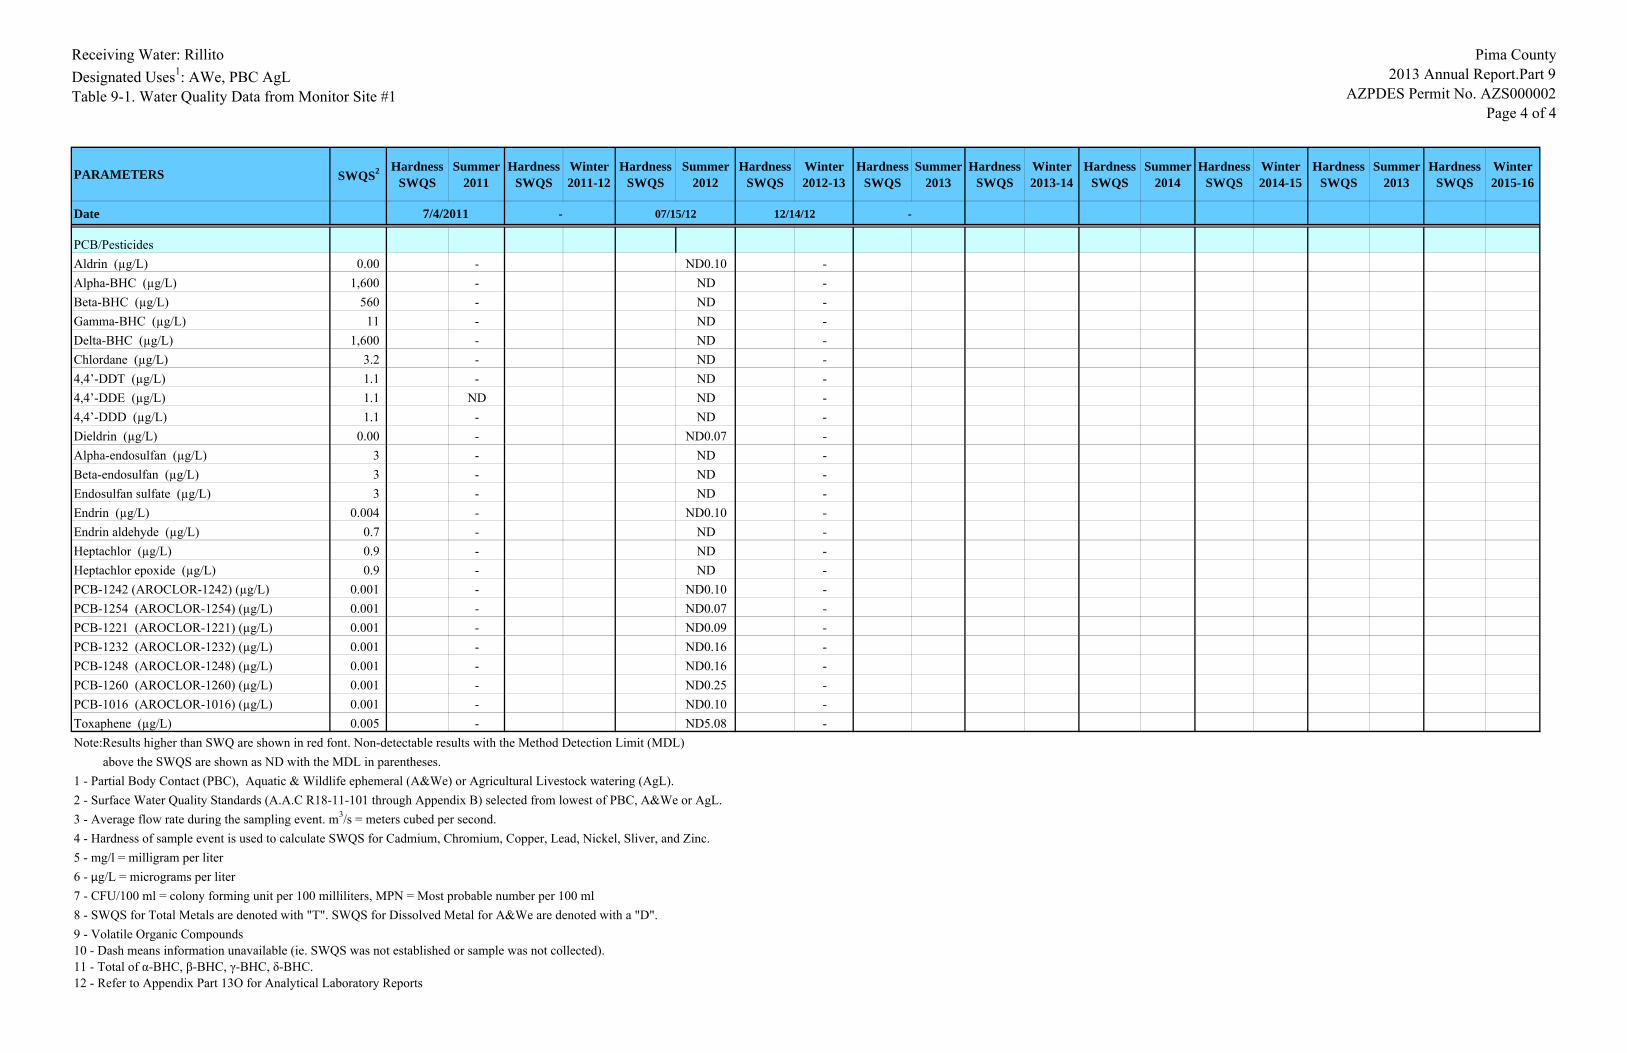
Receiving Water: RillitoDesignated Uses1: AWe, PBC AgLTable 9-1. Water Quality Data from Monitor Site #1
Pima County2013 Annual Report.Part 9
AZPDES Permit No. AZS000002Page 1 of 4
PARAMETERS SWQS2 Hardness SWQS
Summer 2011
Hardness SWQS
Winter 2011-12
Hardness SWQS
Summer 2012
Hardness SWQS
Winter 2012-13
Hardness SWQS
Summer 2013
Hardness SWQS
Winter 2013-14
Hardness SWQS
Summer 2014
Hardness SWQS
Winter 2014-15
Hardness SWQS
Summer 2013
Hardness SWQS
Winter 2015-16
Date 7/4/2011 - 07/15/12 12/14/12 -
Conventional Parameters 0.423077Average Flow Rate3 (m3/s) - 0.0003 0.00044 0.0006Ph 6.5-9.0 6.4 7.6 8.09Temperature (°Celcius) - 29°C 27.5 12.1Hardness4 (mg/L)5 - 67 67 30.7 30.7 37.4 37.4Total Dissolved Solids (TDS) (mg/L) - - 71.4 34.0Total Suspended Solids (TSS) (mg/L) - 60 35.0 50.0Biological Oxygen Demand (BOD) (mg/L) - - 10.5 5.00Chemical Oxygen Demand (COD) (mg/L) - - 62 40.0
InorganicsCyanide, total (ug/L)6 84 - ND 2.98
Nutrients Nitrate + Nitrite as N (mg/L) - 0.40 0.20Ammonia as N (mg/L) - 0.58 0.53TKN (mg/L) - 2.12 1.63Total Phosphorus (mg/L) - 0.25 0.22Total Orthophosphate (mg/L) - 0.09 0.07
Microbiological Escherichia coli (E. coli ) (CFU/100 mg or MPN)7 126 48840 10 41.0
Total Metals8
AntimonyT (µg/L) 747 - 0.25 0.21ArsenicT (µg/L) 200 - 1.19 1.87BariumT (µg/L) 98,000 - 30 67.2BerylliumT (µg/L) 1,867 - ND 0.26CadmiumD (µg/L) - 7 ND 9 NDChromiumD (µg/L) - 727 ND 854 1.18CopperD (µg/L) 16.0 30.8 8.0 5.77 9.0 3.26LeadD (µg/L) Trace 38 0.24 47 0.12MercuryT (µg/L) 10.00 - ND NDNickelD (µg/L) - 1,532 1.72 1,810 0.72SeleniumT (µg/L) 33 - ND NDSilverD (µg/L) - 0.4 ND 0.6 2.66ThalliumT (µg/L) 75 - ND NDZincD (µg/L) 70.9 409 6.61 483 3.74
Organic Toxic PollutantsTotal Petroleum Hydrocarbons (TPH) (mg/L) - - 2.59 10Total Oil & Grease (mg/L) - - 3.78 4.89
Receiving Water: RillitoDesignated Uses1: AWe, PBC AgLTable 9-1. Water Quality Data from Monitor Site #1
Pima County2013 Annual Report.Part 9
AZPDES Permit No. AZS000002Page 2 of 4
PARAMETERS SWQS2 Hardness SWQS
Summer 2011
Hardness SWQS
Winter 2011-12
Hardness SWQS
Summer 2012
Hardness SWQS
Winter 2012-13
Hardness SWQS
Summer 2013
Hardness SWQS
Winter 2013-14
Hardness SWQS
Summer 2014
Hardness SWQS
Winter 2014-15
Hardness SWQS
Summer 2013
Hardness SWQS
Winter 2015-16
Date 7/4/2011 - 07/15/12 12/14/12 -
VOCs9, Semi-VOCs, and PesticidesAcrolein (µg/L) 467 - ND -Acrylonitrile (µg/L) 37,333 - ND -Benzene (µg/L) 3,733 - ND -Bromoform (µg/L) 18,667 - ND -Carbon tetrachloride (µg/L) 1,307 - NDChlorobenzene (µg/L) 18,667 - ND -Chlorodibromomethane (µg/L) 18,667 - ND -Chloroethane (µg/L) - - ND -2-chloroethylvinyl ether (µg/L) - - ND -Chloroform (µg/L) 9,333 - ND -Dichlorobromomethane (µg/L) 18,667 - ND -1,2-dichlorobenzene (µg/L) 5,900 - ND -1,3-dichlorobenzene (µg/L) - - ND -1,4-dichlorobenzene (µg/L) ###### - ND -1,1-dichloroethane (µg/L) - - ND -1,2-dichloroethane (µg/L) 186,667 - ND -1,1-dichloroethylene (µg/L) 46,667 - ND -1,2-dichloropropane (µg/L) 84,000 - ND -1,3-dichloropropylene (µg/L) 28,000 - ND -Ethylbenzene (µg/L) 93,333 - ND -Methyl bromide (µg/L) - - ND -Methyl chloride (µg/L) - - NDMethylene chloride (µg/L) - - - -1,1,2,2-tetrachloroethane (µg/L) 93,333 - ND -Tetrachloroethylene (µg/L) 9,333 - ND -Toluene (µg/L) 373,333 - ND -1,2-trans-dichloroethylene (µg/L) 18,667 - ND -1,1,1-trichloroethane (µg/L) ###### - ND -1,1,2-trichloroethane (µg/L) 3,733 - ND -Trichloroethylene (µg/L) 280 - ND -Trimethylbenzene (µg/L) - - - -Vinyl chloride (µg/L) 2,800 - ND -Xylene (µg/L) 186,667 - ND -
SVOCs - Acid Extractables2-chlorophenol (µg/L) 4,667 - ND -2,4-dichlorophenol (µg/L) 2,800 - ND -2,4-dimethylphenol (µg/L) 18,667 - ND -4,6-dinitro-o-cresol (µg/L) 3,733 - - -2,4-dinitrophenol (µg/L) 1,867 - ND -2-nitrophenol (µg/L) - - ND -4-nitrophenol (µg/L) - - ND -p-chloro-m-cresol (µg/L) 48,000 - - -Pentachlorophenol (µg/L) 8.14 - ND -Phenol (µg/L) 180,000 - ND -2,4,6-trichlorophenol (µg/L) 130 - ND -
Receiving Water: RillitoDesignated Uses1: AWe, PBC AgLTable 9-1. Water Quality Data from Monitor Site #1
Pima County2013 Annual Report.Part 9
AZPDES Permit No. AZS000002Page 3 of 4
PARAMETERS SWQS2 Hardness SWQS
Summer 2011
Hardness SWQS
Winter 2011-12
Hardness SWQS
Summer 2012
Hardness SWQS
Winter 2012-13
Hardness SWQS
Summer 2013
Hardness SWQS
Winter 2013-14
Hardness SWQS
Summer 2014
Hardness SWQS
Winter 2014-15
Hardness SWQS
Summer 2013
Hardness SWQS
Winter 2015-16
Date 7/4/2011 - 07/15/12 12/14/12 -
SVOCs - Bases/NeutralsAcenaphthene (µg/L) 56,000 - ND -Acenaphthylene (µg/L) - - ND -Anthracene (µg/L) 280,000 - ND -Benzo(a)anthracene (µg/L) 0.20 - ND1.44 -Benzo(a)pyrene (µg/L) 0.20 - ND1.55 -Benzo(b)fluoranthene (µg/L) - - ND -Benzo(g,h,i)perylene (µg/L) - - ND -Benzo(k)fluoranthene (µg/L) 1.9 - ND2.28 -Chrysene (µg/L) 19 - ND -Dibenzo(a,h)anthracene (µg/L) 1.9 - ND -3,3-dichlorobenzidine (µg/L) 3 - ND -Diethyl phthalate (µg/L) 746,667 - ND -Dimethyl phthalate (µg/L) - - ND -Di-n-butyl phthalate (µg/L) 1,100 - ND -2,4-dinitrotoluene (µg/L) 1,867 - ND -2,6-dinitrotoluene (µg/L) 3,733 - ND -Di-n-octyl phthalate (µg/L) 373,333 - ND -1,2-diphenylhydrazine (as azobenzene) (µg/L) 1.8 - ND -Fluroranthene (µg/L) 37,333 - ND -Fluorene (µg/L) 37,333 - ND -Hexachlorobenzene (µg/L) 747 - ND -Hexachlorobutadiene (µg/L) 187 - ND -Hexachlorocyclopentadiene (µg/L) 11,200 - ND -Hexachloroethane (µg/L) 850 - ND2.25 -Indeno(1,2,3-cd)pyrene (µg/L) 1.90 - ND -Isophorone (µg/L) 186,667 - ND -Naphthalene (µg/L) 18,667 - ND -Nitrobenzene (µg/L) 467 - ND4.23 -N-nitrosodimethylamine (µg/L) 0.03 - ND -N-nitrosodi-n-propylamine (µg/L) 88,667 - ND -N-nitrosodiphenylamine (µg/L) 290 - ND -Phenanthrene (µg/L) - - ND -Pyrene (µg/L) 28,000 - ND -1,2,4-trichlorobenzene (µg/L) 9,333 - ND -
Receiving Water: RillitoDesignated Uses1: AWe, PBC AgLTable 9-1. Water Quality Data from Monitor Site #1
Pima County2013 Annual Report.Part 9
AZPDES Permit No. AZS000002Page 4 of 4
PARAMETERS SWQS2 Hardness SWQS
Summer 2011
Hardness SWQS
Winter 2011-12
Hardness SWQS
Summer 2012
Hardness SWQS
Winter 2012-13
Hardness SWQS
Summer 2013
Hardness SWQS
Winter 2013-14
Hardness SWQS
Summer 2014
Hardness SWQS
Winter 2014-15
Hardness SWQS
Summer 2013
Hardness SWQS
Winter 2015-16
Date 7/4/2011 - 07/15/12 12/14/12 -
PCB/PesticidesAldrin (µg/L) 0.00 - ND0.10 -Alpha-BHC (µg/L) 1,600 - ND -Beta-BHC (µg/L) 560 - ND -Gamma-BHC (µg/L) 11 - ND -Delta-BHC (µg/L) 1,600 - ND -Chlordane (µg/L) 3.2 - ND -4,4’-DDT (µg/L) 1.1 - ND -4,4’-DDE (µg/L) 1.1 ND ND -4,4’-DDD (µg/L) 1.1 - ND -Dieldrin (µg/L) 0.00 - ND0.07 -Alpha-endosulfan (µg/L) 3 - ND -Beta-endosulfan (µg/L) 3 - ND -Endosulfan sulfate (µg/L) 3 - ND -Endrin (µg/L) 0.004 - ND0.10 -Endrin aldehyde (µg/L) 0.7 - ND -Heptachlor (µg/L) 0.9 - ND -Heptachlor epoxide (µg/L) 0.9 - ND -PCB-1242 (AROCLOR-1242) (µg/L) 0.001 - ND0.10 -PCB-1254 (AROCLOR-1254) (µg/L) 0.001 - ND0.07 -PCB-1221 (AROCLOR-1221) (µg/L) 0.001 - ND0.09 -PCB-1232 (AROCLOR-1232) (µg/L) 0.001 - ND0.16 -PCB-1248 (AROCLOR-1248) (µg/L) 0.001 - ND0.16 -PCB-1260 (AROCLOR-1260) (µg/L) 0.001 - ND0.25 -PCB-1016 (AROCLOR-1016) (µg/L) 0.001 - ND0.10 -Toxaphene (µg/L) 0.005 - ND5.08 -Note:Results higher than SWQ are shown in red font. Non-detectable results with the Method Detection Limit (MDL) above the SWQS are shown as ND with the MDL in parentheses.1 - Partial Body Contact (PBC), Aquatic & Wildlife ephemeral (A&We) or Agricultural Livestock watering (AgL).2 - Surface Water Quality Standards (A.A.C R18-11-101 through Appendix B) selected from lowest of PBC, A&We or AgL.3 - Average flow rate during the sampling event. m3/s = meters cubed per second.4 - Hardness of sample event is used to calculate SWQS for Cadmium, Chromium, Copper, Lead, Nickel, Sliver, and Zinc.5 - mg/l = milligram per liter6 - µg/L = micrograms per liter7 - CFU/100 ml = colony forming unit per 100 milliliters, MPN = Most probable number per 100 ml8 - SWQS for Total Metals are denoted with "T". SWQS for Dissolved Metal for A&We are denoted with a "D".9 - Volatile Organic Compounds10 - Dash means information unavailable (ie. SWQS was not established or sample was not collected).11 - Total of α-BHC, β-BHC, γ-BHC, δ-BHC.12 - Refer to Appendix Part 13O for Analytical Laboratory Reports
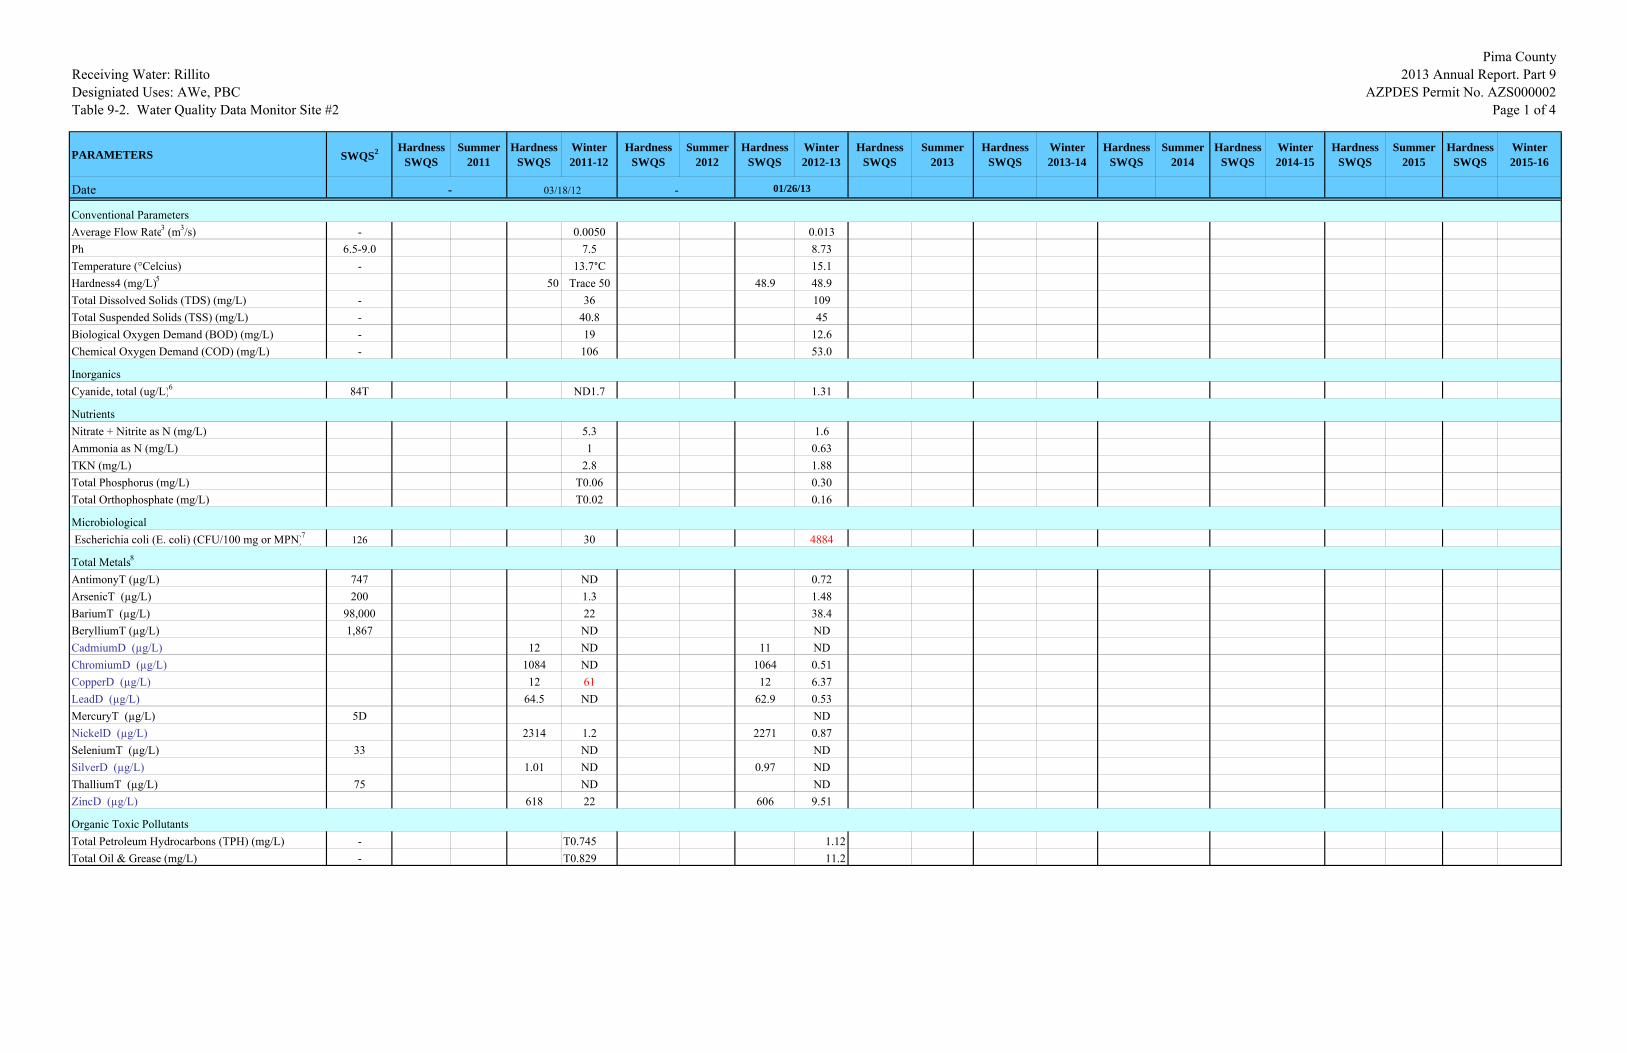
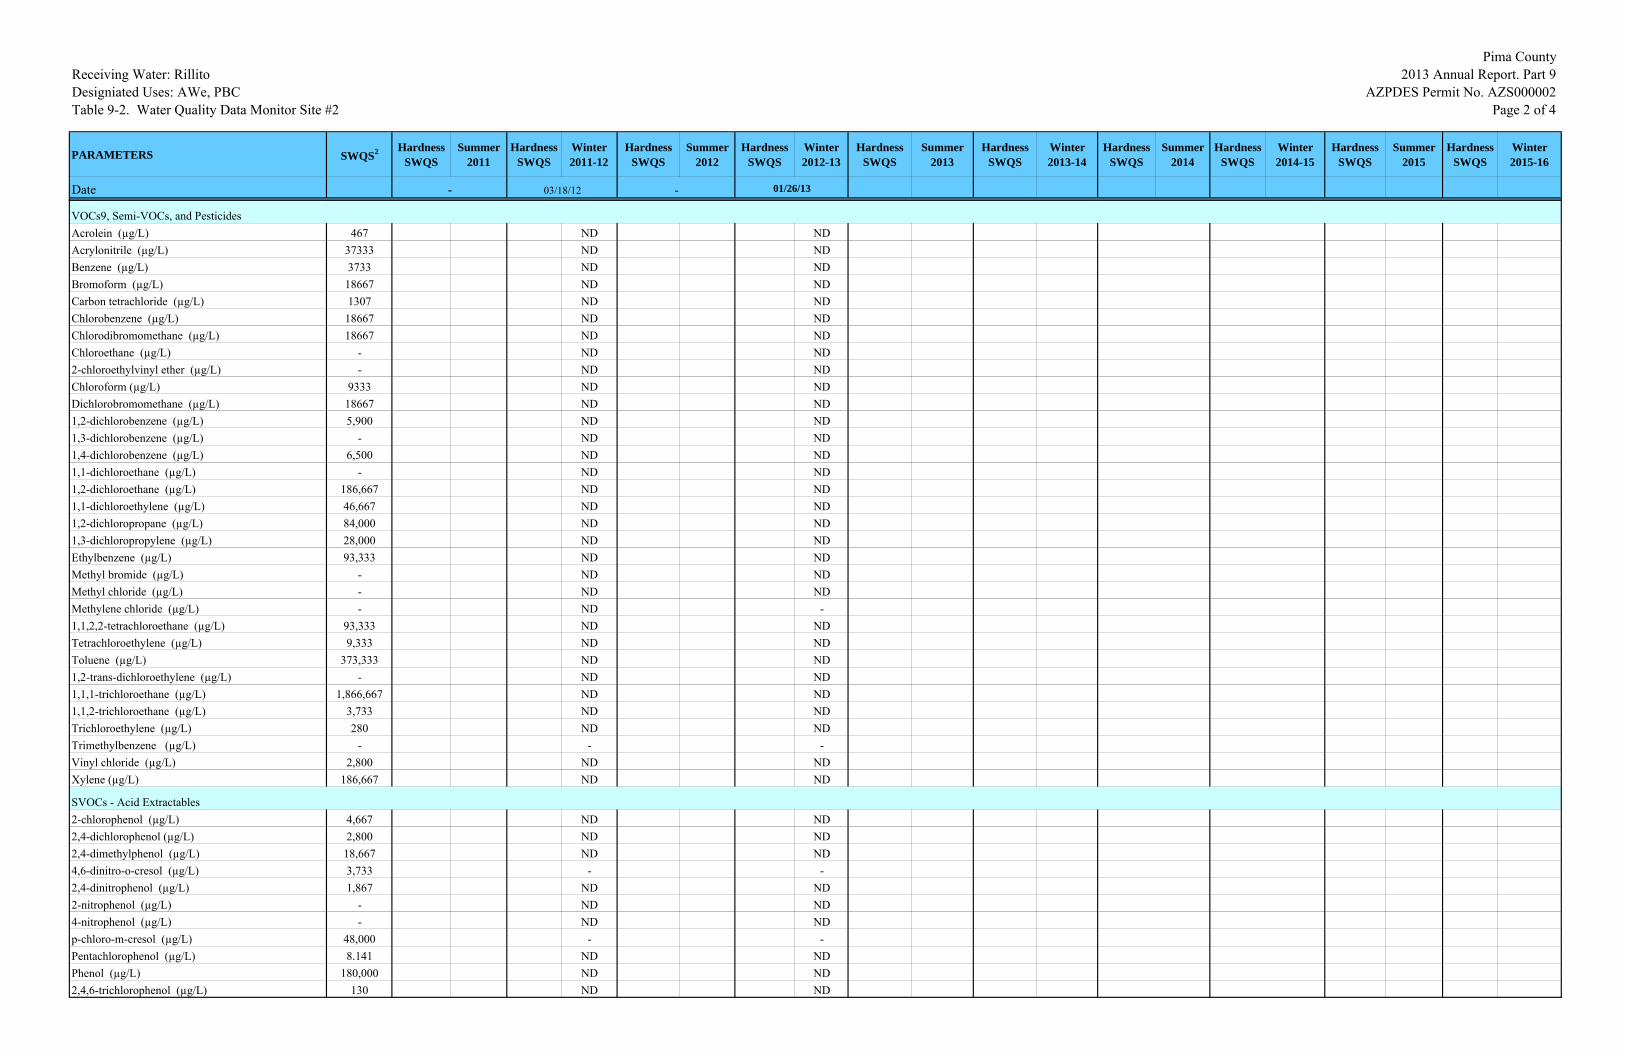
Receiving Water: RillitoDesigniated Uses: AWe, PBCTable 9-2. Water Quality Data Monitor Site #2
Pima County 2013 Annual Report. Part 9
AZPDES Permit No. AZS000002Page 1 of 4
PARAMETERS SWQS2 Hardness SWQS
Summer 2011
Hardness SWQS
Winter 2011-12
Hardness SWQS
Summer 2012
Hardness SWQS
Winter 2012-13
Hardness SWQS
Summer 2013
Hardness SWQS
Winter 2013-14
Hardness SWQS
Summer 2014
Hardness SWQS
Winter 2014-15
Hardness SWQS
Summer 2015
Hardness SWQS
Winter 2015-16
Date - 03/18/12 - 01/26/13
Conventional ParametersAverage Flow Rate3 (m3/s) - 0.0050 0.013Ph 6.5-9.0 7.5 8.73Temperature (°Celcius) - 13.7°C 15.1Hardness4 (mg/L)5 50 Trace 50 48.9 48.9Total Dissolved Solids (TDS) (mg/L) - 36 109Total Suspended Solids (TSS) (mg/L) - 40.8 45Biological Oxygen Demand (BOD) (mg/L) - 19 12.6Chemical Oxygen Demand (COD) (mg/L) - 106 53.0
Cyanide, total (ug/L)6 84T ND1.7 1.31
Nitrate + Nitrite as N (mg/L) 5.3 1.6Ammonia as N (mg/L) 1 0.63TKN (mg/L) 2.8 1.88Total Phosphorus (mg/L) T0.06 0.30Total Orthophosphate (mg/L) T0.02 0.16
Escherichia coli (E. coli) (CFU/100 mg or MPN)7 126 30 4884
AntimonyT (µg/L) 747 ND 0.72ArsenicT (µg/L) 200 1.3 1.48BariumT (µg/L) 98,000 22 38.4BerylliumT (µg/L) 1,867 ND NDCadmiumD (µg/L) 12 ND 11 NDChromiumD (µg/L) 1084 ND 1064 0.51CopperD (µg/L) 12 61 12 6.37LeadD (µg/L) 64.5 ND 62.9 0.53MercuryT (µg/L) 5D NDNickelD (µg/L) 2314 1.2 2271 0.87SeleniumT (µg/L) 33 ND NDSilverD (µg/L) 1.01 ND 0.97 NDThalliumT (µg/L) 75 ND NDZincD (µg/L) 618 22 606 9.51
Total Petroleum Hydrocarbons (TPH) (mg/L) - T0.745 1.12Total Oil & Grease (mg/L) - T0.829 11.2
Microbiological
Nutrients
Inorganics
Organic Toxic Pollutants
Total Metals8
Receiving Water: RillitoDesigniated Uses: AWe, PBCTable 9-2. Water Quality Data Monitor Site #2
Pima County 2013 Annual Report. Part 9
AZPDES Permit No. AZS000002Page 2 of 4
PARAMETERS SWQS2 Hardness SWQS
Summer 2011
Hardness SWQS
Winter 2011-12
Hardness SWQS
Summer 2012
Hardness SWQS
Winter 2012-13
Hardness SWQS
Summer 2013
Hardness SWQS
Winter 2013-14
Hardness SWQS
Summer 2014
Hardness SWQS
Winter 2014-15
Hardness SWQS
Summer 2015
Hardness SWQS
Winter 2015-16
Date - 03/18/12 - 01/26/13
Acrolein (µg/L) 467 ND NDAcrylonitrile (µg/L) 37333 ND NDBenzene (µg/L) 3733 ND NDBromoform (µg/L) 18667 ND NDCarbon tetrachloride (µg/L) 1307 ND NDChlorobenzene (µg/L) 18667 ND NDChlorodibromomethane (µg/L) 18667 ND NDChloroethane (µg/L) - ND ND2-chloroethylvinyl ether (µg/L) - ND NDChloroform (µg/L) 9333 ND NDDichlorobromomethane (µg/L) 18667 ND ND1,2-dichlorobenzene (µg/L) 5,900 ND ND1,3-dichlorobenzene (µg/L) - ND ND1,4-dichlorobenzene (µg/L) 6,500 ND ND1,1-dichloroethane (µg/L) - ND ND1,2-dichloroethane (µg/L) 186,667 ND ND1,1-dichloroethylene (µg/L) 46,667 ND ND1,2-dichloropropane (µg/L) 84,000 ND ND1,3-dichloropropylene (µg/L) 28,000 ND NDEthylbenzene (µg/L) 93,333 ND NDMethyl bromide (µg/L) - ND NDMethyl chloride (µg/L) - ND NDMethylene chloride (µg/L) - ND -1,1,2,2-tetrachloroethane (µg/L) 93,333 ND NDTetrachloroethylene (µg/L) 9,333 ND NDToluene (µg/L) 373,333 ND ND1,2-trans-dichloroethylene (µg/L) - ND ND1,1,1-trichloroethane (µg/L) 1,866,667 ND ND1,1,2-trichloroethane (µg/L) 3,733 ND NDTrichloroethylene (µg/L) 280 ND NDTrimethylbenzene (µg/L) - - -Vinyl chloride (µg/L) 2,800 ND NDXylene (µg/L) 186,667 ND ND
2-chlorophenol (µg/L) 4,667 ND ND2,4-dichlorophenol (µg/L) 2,800 ND ND2,4-dimethylphenol (µg/L) 18,667 ND ND4,6-dinitro-o-cresol (µg/L) 3,733 - -2,4-dinitrophenol (µg/L) 1,867 ND ND2-nitrophenol (µg/L) - ND ND4-nitrophenol (µg/L) - ND NDp-chloro-m-cresol (µg/L) 48,000 - -Pentachlorophenol (µg/L) 8.141 ND NDPhenol (µg/L) 180,000 ND ND2,4,6-trichlorophenol (µg/L) 130 ND ND
SVOCs - Acid Extractables
VOCs9, Semi-VOCs, and Pesticides
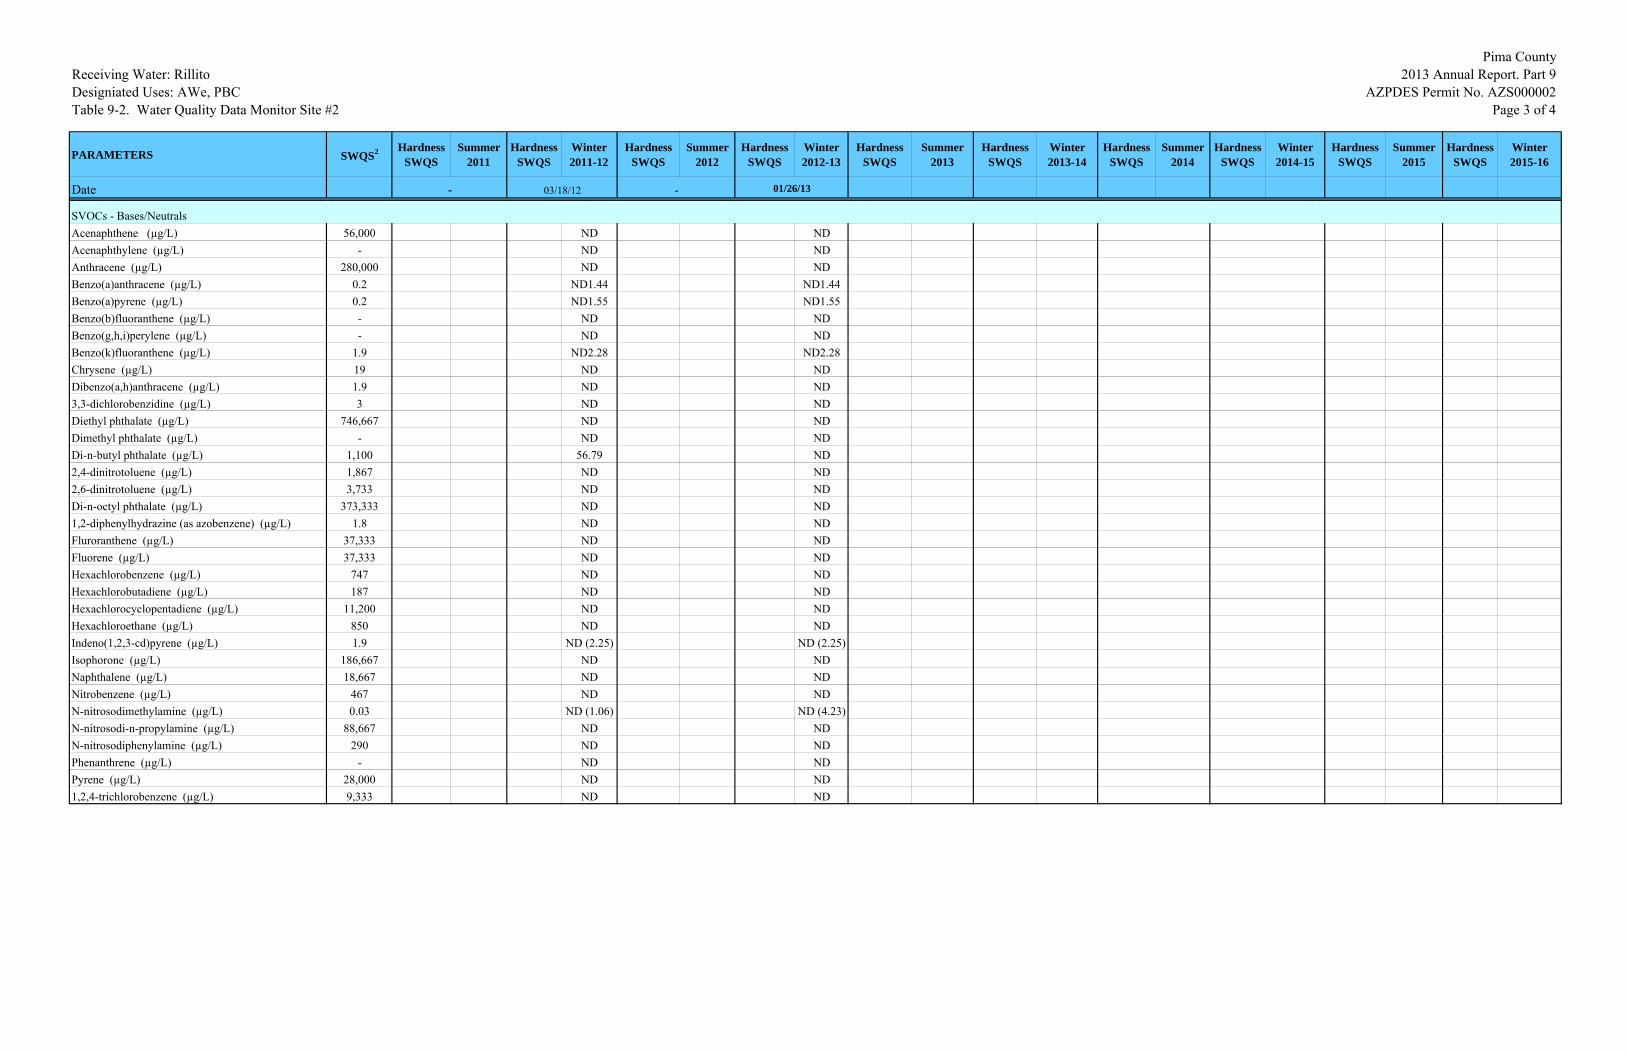
Receiving Water: RillitoDesigniated Uses: AWe, PBCTable 9-2. Water Quality Data Monitor Site #2
Pima County 2013 Annual Report. Part 9
AZPDES Permit No. AZS000002Page 3 of 4
PARAMETERS SWQS2 Hardness SWQS
Summer 2011
Hardness SWQS
Winter 2011-12
Hardness SWQS
Summer 2012
Hardness SWQS
Winter 2012-13
Hardness SWQS
Summer 2013
Hardness SWQS
Winter 2013-14
Hardness SWQS
Summer 2014
Hardness SWQS
Winter 2014-15
Hardness SWQS
Summer 2015
Hardness SWQS
Winter 2015-16
Date - 03/18/12 - 01/26/13
Acenaphthene (µg/L) 56,000 ND NDAcenaphthylene (µg/L) - ND NDAnthracene (µg/L) 280,000 ND NDBenzo(a)anthracene (µg/L) 0.2 ND1.44 ND1.44Benzo(a)pyrene (µg/L) 0.2 ND1.55 ND1.55Benzo(b)fluoranthene (µg/L) - ND NDBenzo(g,h,i)perylene (µg/L) - ND NDBenzo(k)fluoranthene (µg/L) 1.9 ND2.28 ND2.28Chrysene (µg/L) 19 ND NDDibenzo(a,h)anthracene (µg/L) 1.9 ND ND3,3-dichlorobenzidine (µg/L) 3 ND NDDiethyl phthalate (µg/L) 746,667 ND NDDimethyl phthalate (µg/L) - ND NDDi-n-butyl phthalate (µg/L) 1,100 56.79 ND2,4-dinitrotoluene (µg/L) 1,867 ND ND2,6-dinitrotoluene (µg/L) 3,733 ND NDDi-n-octyl phthalate (µg/L) 373,333 ND ND1,2-diphenylhydrazine (as azobenzene) (µg/L) 1.8 ND NDFluroranthene (µg/L) 37,333 ND NDFluorene (µg/L) 37,333 ND NDHexachlorobenzene (µg/L) 747 ND NDHexachlorobutadiene (µg/L) 187 ND NDHexachlorocyclopentadiene (µg/L) 11,200 ND NDHexachloroethane (µg/L) 850 ND NDIndeno(1,2,3-cd)pyrene (µg/L) 1.9 ND (2.25) ND (2.25)Isophorone (µg/L) 186,667 ND NDNaphthalene (µg/L) 18,667 ND NDNitrobenzene (µg/L) 467 ND NDN-nitrosodimethylamine (µg/L) 0.03 ND (1.06) ND (4.23)N-nitrosodi-n-propylamine (µg/L) 88,667 ND NDN-nitrosodiphenylamine (µg/L) 290 ND NDPhenanthrene (µg/L) - ND NDPyrene (µg/L) 28,000 ND ND1,2,4-trichlorobenzene (µg/L) 9,333 ND ND
SVOCs - Bases/Neutrals
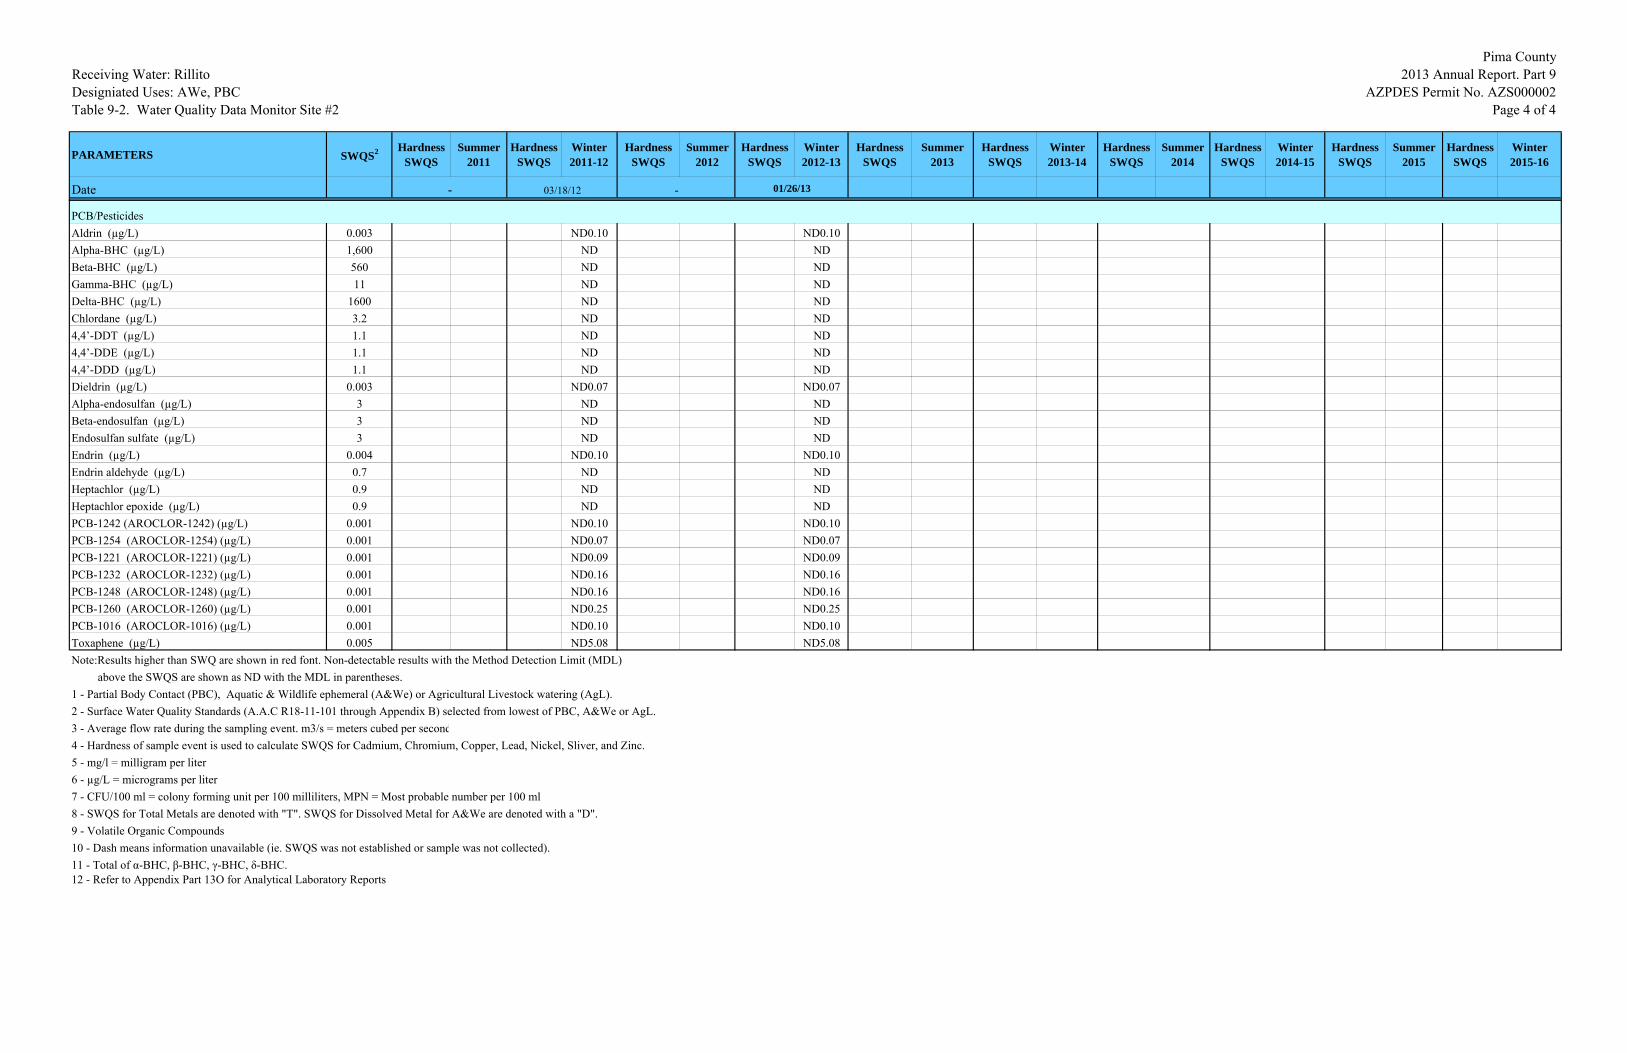
Receiving Water: RillitoDesigniated Uses: AWe, PBCTable 9-2. Water Quality Data Monitor Site #2
Pima County 2013 Annual Report. Part 9
AZPDES Permit No. AZS000002Page 4 of 4
PARAMETERS SWQS2 Hardness SWQS
Summer 2011
Hardness SWQS
Winter 2011-12
Hardness SWQS
Summer 2012
Hardness SWQS
Winter 2012-13
Hardness SWQS
Summer 2013
Hardness SWQS
Winter 2013-14
Hardness SWQS
Summer 2014
Hardness SWQS
Winter 2014-15
Hardness SWQS
Summer 2015
Hardness SWQS
Winter 2015-16
Date - 03/18/12 - 01/26/13
Aldrin (µg/L) 0.003 ND0.10 ND0.10Alpha-BHC (µg/L) 1,600 ND NDBeta-BHC (µg/L) 560 ND NDGamma-BHC (µg/L) 11 ND NDDelta-BHC (µg/L) 1600 ND NDChlordane (µg/L) 3.2 ND ND4,4’-DDT (µg/L) 1.1 ND ND4,4’-DDE (µg/L) 1.1 ND ND4,4’-DDD (µg/L) 1.1 ND NDDieldrin (µg/L) 0.003 ND0.07 ND0.07Alpha-endosulfan (µg/L) 3 ND NDBeta-endosulfan (µg/L) 3 ND NDEndosulfan sulfate (µg/L) 3 ND NDEndrin (µg/L) 0.004 ND0.10 ND0.10Endrin aldehyde (µg/L) 0.7 ND NDHeptachlor (µg/L) 0.9 ND NDHeptachlor epoxide (µg/L) 0.9 ND NDPCB-1242 (AROCLOR-1242) (µg/L) 0.001 ND0.10 ND0.10PCB-1254 (AROCLOR-1254) (µg/L) 0.001 ND0.07 ND0.07PCB-1221 (AROCLOR-1221) (µg/L) 0.001 ND0.09 ND0.09PCB-1232 (AROCLOR-1232) (µg/L) 0.001 ND0.16 ND0.16PCB-1248 (AROCLOR-1248) (µg/L) 0.001 ND0.16 ND0.16PCB-1260 (AROCLOR-1260) (µg/L) 0.001 ND0.25 ND0.25PCB-1016 (AROCLOR-1016) (µg/L) 0.001 ND0.10 ND0.10Toxaphene (µg/L) 0.005 ND5.08 ND5.08Note:Results higher than SWQ are shown in red font. Non-detectable results with the Method Detection Limit (MDL) above the SWQS are shown as ND with the MDL in parentheses.1 - Partial Body Contact (PBC), Aquatic & Wildlife ephemeral (A&We) or Agricultural Livestock watering (AgL).2 - Surface Water Quality Standards (A.A.C R18-11-101 through Appendix B) selected from lowest of PBC, A&We or AgL.3 - Average flow rate during the sampling event. m3/s = meters cubed per second4 - Hardness of sample event is used to calculate SWQS for Cadmium, Chromium, Copper, Lead, Nickel, Sliver, and Zinc.5 - mg/l = milligram per liter6 - µg/L = micrograms per liter7 - CFU/100 ml = colony forming unit per 100 milliliters, MPN = Most probable number per 100 ml8 - SWQS for Total Metals are denoted with "T". SWQS for Dissolved Metal for A&We are denoted with a "D".9 - Volatile Organic Compounds10 - Dash means information unavailable (ie. SWQS was not established or sample was not collected).11 - Total of α-BHC, β-BHC, γ-BHC, δ-BHC.12 - Refer to Appendix Part 13O for Analytical Laboratory Reports
PCB/Pesticides
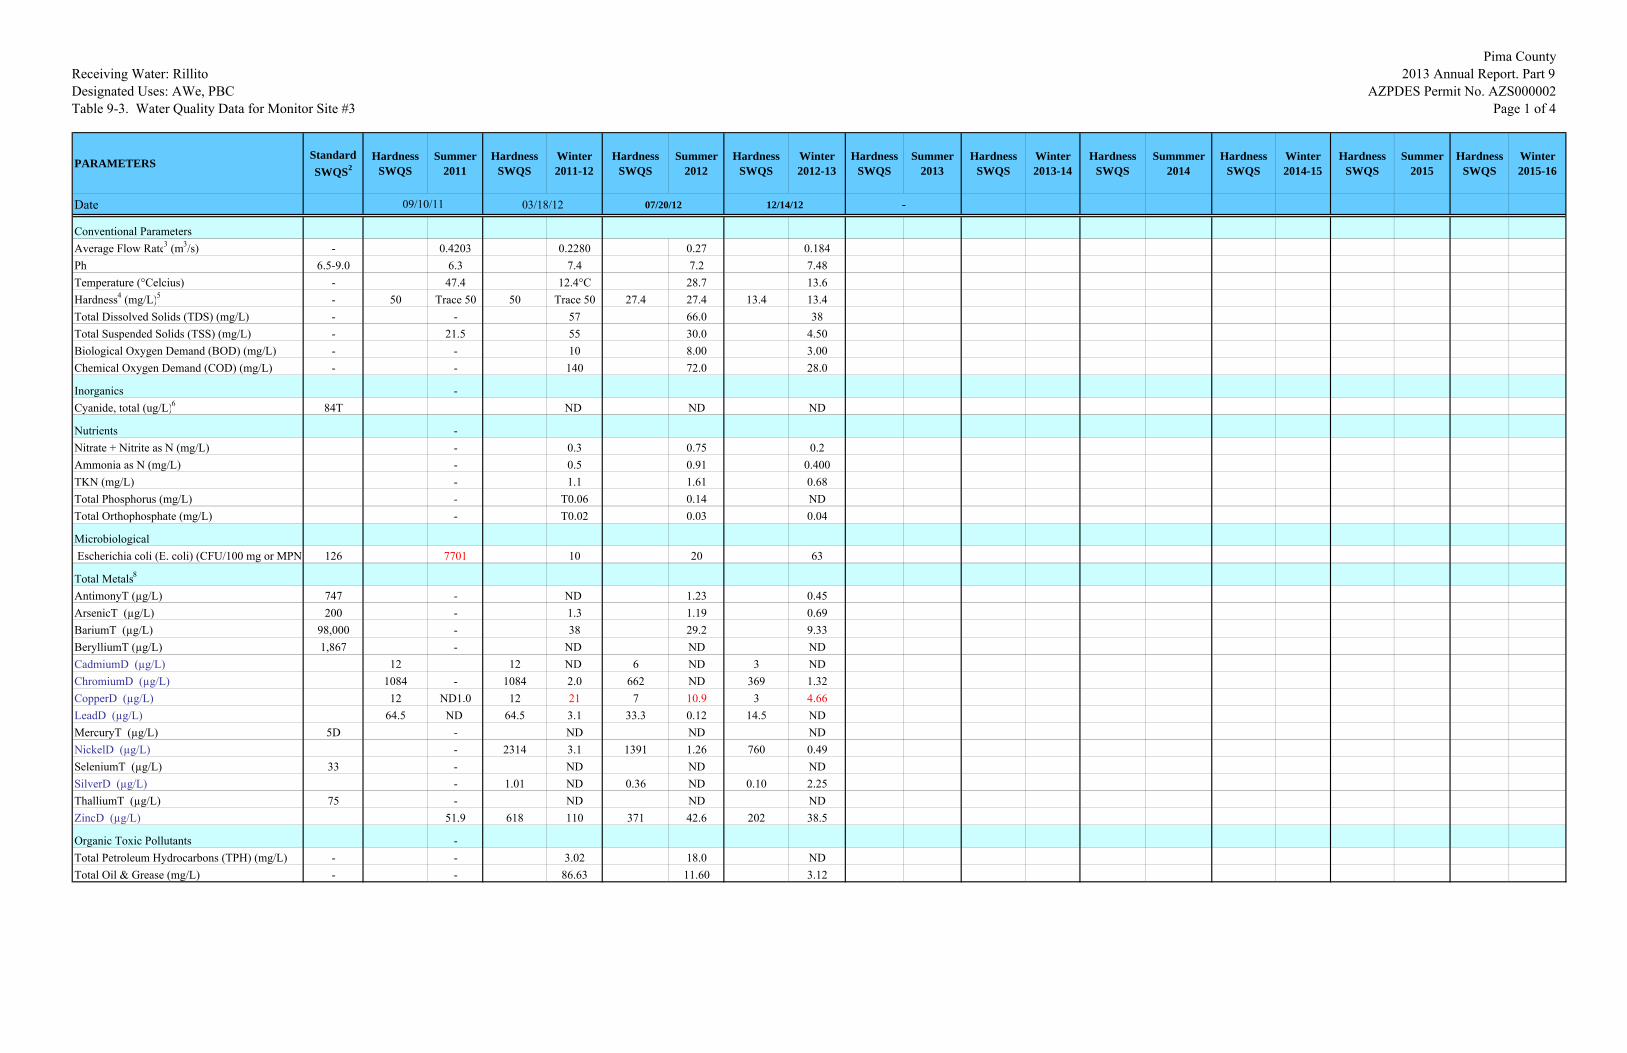
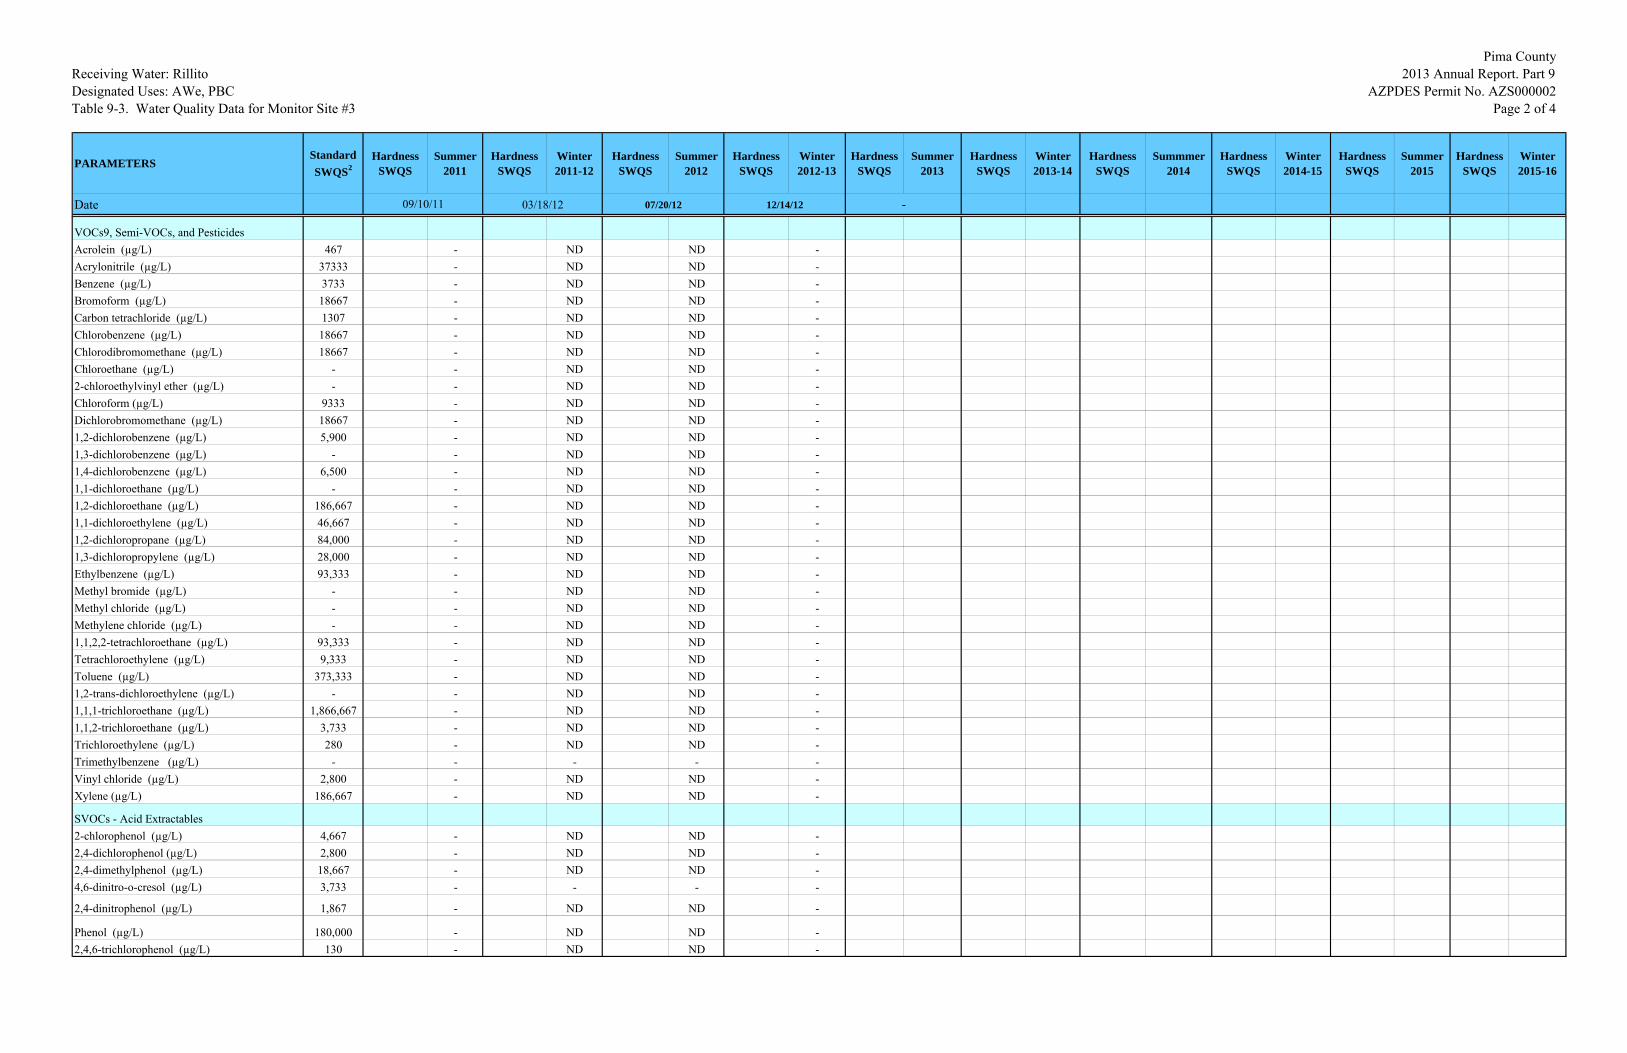
Receiving Water: RillitoDesignated Uses: AWe, PBCTable 9-3. Water Quality Data for Monitor Site #3
Pima County 2013 Annual Report. Part 9
AZPDES Permit No. AZS000002Page 1 of 4
PARAMETERSStandard SWQS2
Hardness SWQS
Summer 2011
Hardness SWQS
Winter 2011-12
Hardness SWQS
Summer 2012
Hardness SWQS
Winter 2012-13
Hardness SWQS
Summer 2013
Hardness SWQS
Winter 2013-14
Hardness SWQS
Summmer 2014
Hardness SWQS
Winter 2014-15
Hardness SWQS
Summer 2015
Hardness SWQS
Winter 2015-16
Date 03/18/12 07/20/12 12/14/12
Conventional Parameters 0.595Average Flow Rate3 (m3/s) - 0.4203 0.2280 0.27 0.184Ph 6.5-9.0 6.3 7.4 7.2 7.48Temperature (°Celcius) - 47.4 12.4°C 28.7 13.6Hardness4 (mg/L)5 - 50 Trace 50 50 Trace 50 27.4 27.4 13.4 13.4Total Dissolved Solids (TDS) (mg/L) - - 57 66.0 38Total Suspended Solids (TSS) (mg/L) - 21.5 55 30.0 4.50Biological Oxygen Demand (BOD) (mg/L) - - 10 8.00 3.00Chemical Oxygen Demand (COD) (mg/L) - - 140 72.0 28.0
Inorganics -Cyanide, total (ug/L)6 84T ND ND ND
Nutrients -Nitrate + Nitrite as N (mg/L) - 0.3 0.75 0.2Ammonia as N (mg/L) - 0.5 0.91 0.400TKN (mg/L) - 1.1 1.61 0.68Total Phosphorus (mg/L) - T0.06 0.14 NDTotal Orthophosphate (mg/L) - T0.02 0.03 0.04
Microbiological Escherichia coli (E. coli) (CFU/100 mg or MPN) 126 7701 10 20 63
Total Metals8
AntimonyT (µg/L) 747 - ND 1.23 0.45ArsenicT (µg/L) 200 - 1.3 1.19 0.69BariumT (µg/L) 98,000 - 38 29.2 9.33BerylliumT (µg/L) 1,867 - ND ND NDCadmiumD (µg/L) 12 12 ND 6 ND 3 NDChromiumD (µg/L) 1084 - 1084 2.0 662 ND 369 1.32CopperD (µg/L) 12 ND1.0 12 21 7 10.9 3 4.66LeadD (µg/L) 64.5 ND 64.5 3.1 33.3 0.12 14.5 NDMercuryT (µg/L) 5D - ND ND NDNickelD (µg/L) - 2314 3.1 1391 1.26 760 0.49SeleniumT (µg/L) 33 - ND ND NDSilverD (µg/L) - 1.01 ND 0.36 ND 0.10 2.25ThalliumT (µg/L) 75 - ND ND NDZincD (µg/L) 51.9 618 110 371 42.6 202 38.5
Organic Toxic Pollutants -Total Petroleum Hydrocarbons (TPH) (mg/L) - - 3.02 18.0 NDTotal Oil & Grease (mg/L) - - 86.63 11.60 3.12
09/10/11 -
Receiving Water: RillitoDesignated Uses: AWe, PBCTable 9-3. Water Quality Data for Monitor Site #3
Pima County 2013 Annual Report. Part 9
AZPDES Permit No. AZS000002Page 2 of 4
PARAMETERSStandard SWQS2
Hardness SWQS
Summer 2011
Hardness SWQS
Winter 2011-12
Hardness SWQS
Summer 2012
Hardness SWQS
Winter 2012-13
Hardness SWQS
Summer 2013
Hardness SWQS
Winter 2013-14
Hardness SWQS
Summmer 2014
Hardness SWQS
Winter 2014-15
Hardness SWQS
Summer 2015
Hardness SWQS
Winter 2015-16
Date 03/18/12 07/20/12 12/14/1209/10/11 -
VOCs9, Semi-VOCs, and PesticidesAcrolein (µg/L) 467 - ND ND -Acrylonitrile (µg/L) 37333 - ND ND -Benzene (µg/L) 3733 - ND ND -Bromoform (µg/L) 18667 - ND ND -Carbon tetrachloride (µg/L) 1307 - ND ND -Chlorobenzene (µg/L) 18667 - ND ND -Chlorodibromomethane (µg/L) 18667 - ND ND -Chloroethane (µg/L) - - ND ND -2-chloroethylvinyl ether (µg/L) - - ND ND -Chloroform (µg/L) 9333 - ND ND -Dichlorobromomethane (µg/L) 18667 - ND ND -1,2-dichlorobenzene (µg/L) 5,900 - ND ND -1,3-dichlorobenzene (µg/L) - - ND ND -1,4-dichlorobenzene (µg/L) 6,500 - ND ND -1,1-dichloroethane (µg/L) - - ND ND -1,2-dichloroethane (µg/L) 186,667 - ND ND -1,1-dichloroethylene (µg/L) 46,667 - ND ND -1,2-dichloropropane (µg/L) 84,000 - ND ND -1,3-dichloropropylene (µg/L) 28,000 - ND ND -Ethylbenzene (µg/L) 93,333 - ND ND -Methyl bromide (µg/L) - - ND ND -Methyl chloride (µg/L) - - ND ND -Methylene chloride (µg/L) - - ND ND -1,1,2,2-tetrachloroethane (µg/L) 93,333 - ND ND -Tetrachloroethylene (µg/L) 9,333 - ND ND -Toluene (µg/L) 373,333 - ND ND -1,2-trans-dichloroethylene (µg/L) - - ND ND -1,1,1-trichloroethane (µg/L) 1,866,667 - ND ND -1,1,2-trichloroethane (µg/L) 3,733 - ND ND -Trichloroethylene (µg/L) 280 - ND ND -Trimethylbenzene (µg/L) - - - - -Vinyl chloride (µg/L) 2,800 - ND ND -Xylene (µg/L) 186,667 - ND ND -
SVOCs - Acid Extractables2-chlorophenol (µg/L) 4,667 - ND ND -2,4-dichlorophenol (µg/L) 2,800 - ND ND -2,4-dimethylphenol (µg/L) 18,667 - ND ND -4,6-dinitro-o-cresol (µg/L) 3,733 - - - -
2,4-dinitrophenol (µg/L) 1,867 - ND ND -
Phenol (µg/L) 180,000 - ND ND -2,4,6-trichlorophenol (µg/L) 130 - ND ND -
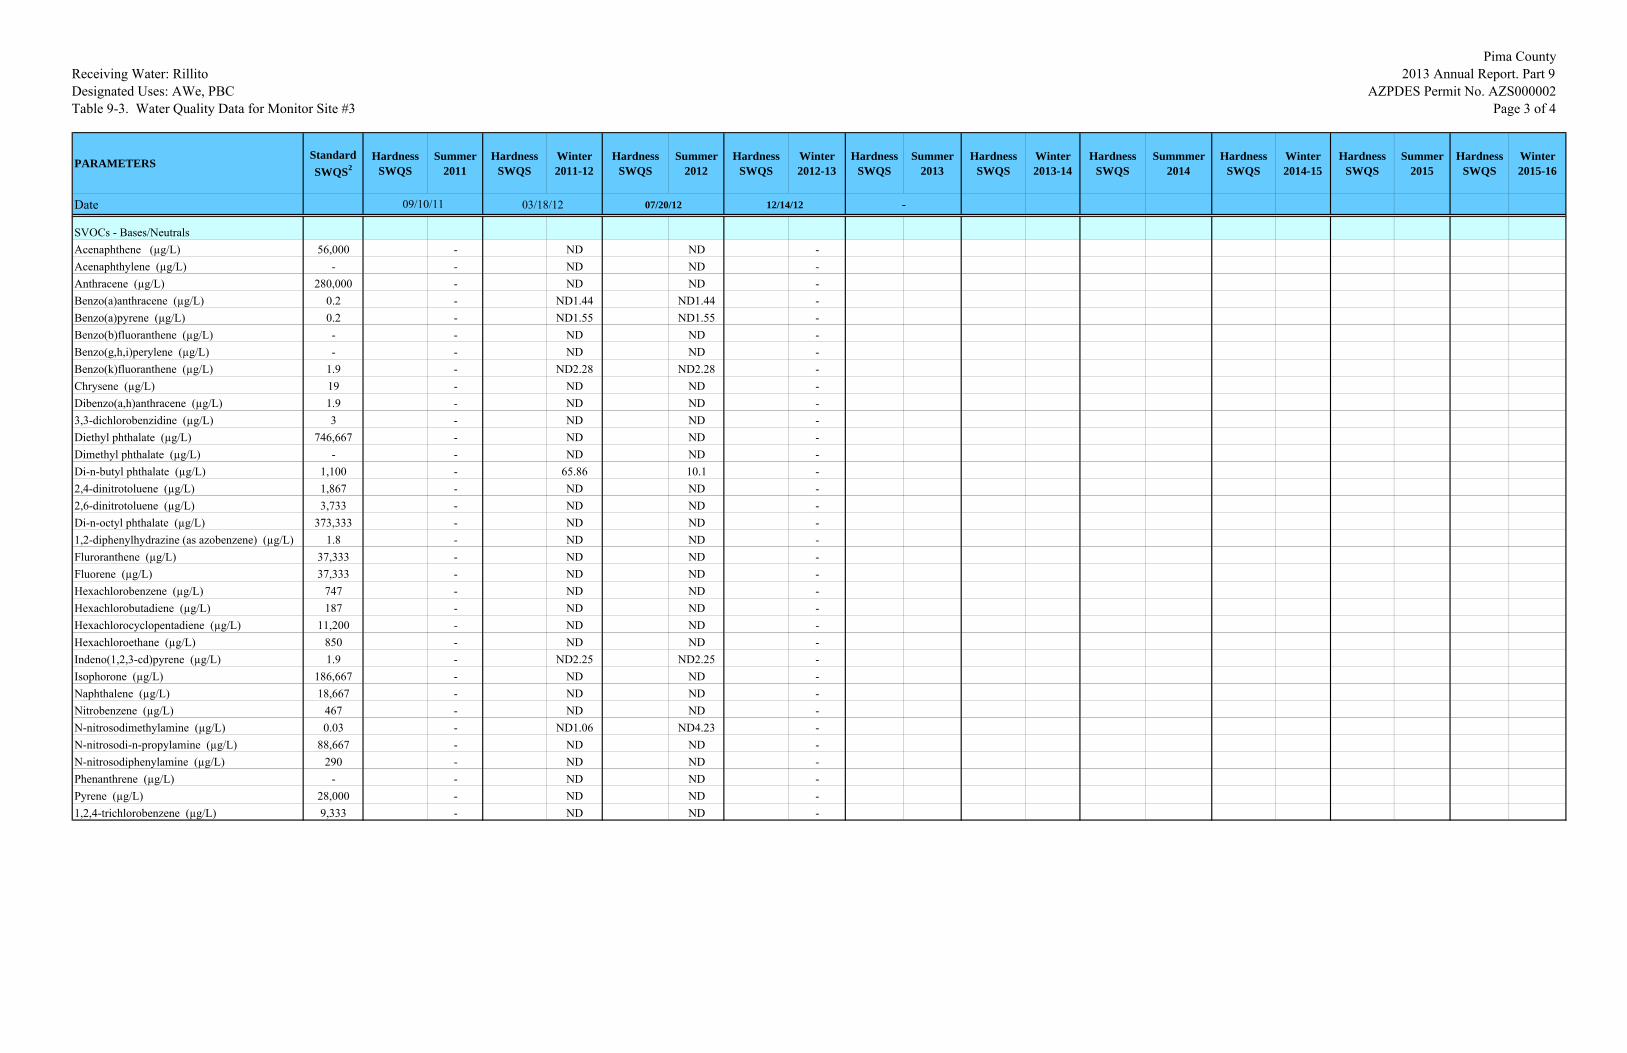
Receiving Water: RillitoDesignated Uses: AWe, PBCTable 9-3. Water Quality Data for Monitor Site #3
Pima County 2013 Annual Report. Part 9
AZPDES Permit No. AZS000002Page 3 of 4
PARAMETERSStandard SWQS2
Hardness SWQS
Summer 2011
Hardness SWQS
Winter 2011-12
Hardness SWQS
Summer 2012
Hardness SWQS
Winter 2012-13
Hardness SWQS
Summer 2013
Hardness SWQS
Winter 2013-14
Hardness SWQS
Summmer 2014
Hardness SWQS
Winter 2014-15
Hardness SWQS
Summer 2015
Hardness SWQS
Winter 2015-16
Date 03/18/12 07/20/12 12/14/1209/10/11 -
SVOCs - Bases/NeutralsAcenaphthene (µg/L) 56,000 - ND ND -Acenaphthylene (µg/L) - - ND ND -Anthracene (µg/L) 280,000 - ND ND -Benzo(a)anthracene (µg/L) 0.2 - ND1.44 ND1.44 -Benzo(a)pyrene (µg/L) 0.2 - ND1.55 ND1.55 -Benzo(b)fluoranthene (µg/L) - - ND ND -Benzo(g,h,i)perylene (µg/L) - - ND ND -Benzo(k)fluoranthene (µg/L) 1.9 - ND2.28 ND2.28 -Chrysene (µg/L) 19 - ND ND -Dibenzo(a,h)anthracene (µg/L) 1.9 - ND ND -3,3-dichlorobenzidine (µg/L) 3 - ND ND -Diethyl phthalate (µg/L) 746,667 - ND ND -Dimethyl phthalate (µg/L) - - ND ND -Di-n-butyl phthalate (µg/L) 1,100 - 65.86 10.1 -2,4-dinitrotoluene (µg/L) 1,867 - ND ND -2,6-dinitrotoluene (µg/L) 3,733 - ND ND -Di-n-octyl phthalate (µg/L) 373,333 - ND ND -1,2-diphenylhydrazine (as azobenzene) (µg/L) 1.8 - ND ND -Fluroranthene (µg/L) 37,333 - ND ND -Fluorene (µg/L) 37,333 - ND ND -Hexachlorobenzene (µg/L) 747 - ND ND -Hexachlorobutadiene (µg/L) 187 - ND ND -Hexachlorocyclopentadiene (µg/L) 11,200 - ND ND -Hexachloroethane (µg/L) 850 - ND ND -Indeno(1,2,3-cd)pyrene (µg/L) 1.9 - ND2.25 ND2.25 -Isophorone (µg/L) 186,667 - ND ND -Naphthalene (µg/L) 18,667 - ND ND -Nitrobenzene (µg/L) 467 - ND ND -N-nitrosodimethylamine (µg/L) 0.03 - ND1.06 ND4.23 -N-nitrosodi-n-propylamine (µg/L) 88,667 - ND ND -N-nitrosodiphenylamine (µg/L) 290 - ND ND -Phenanthrene (µg/L) - - ND ND -Pyrene (µg/L) 28,000 - ND ND -1,2,4-trichlorobenzene (µg/L) 9,333 - ND ND -
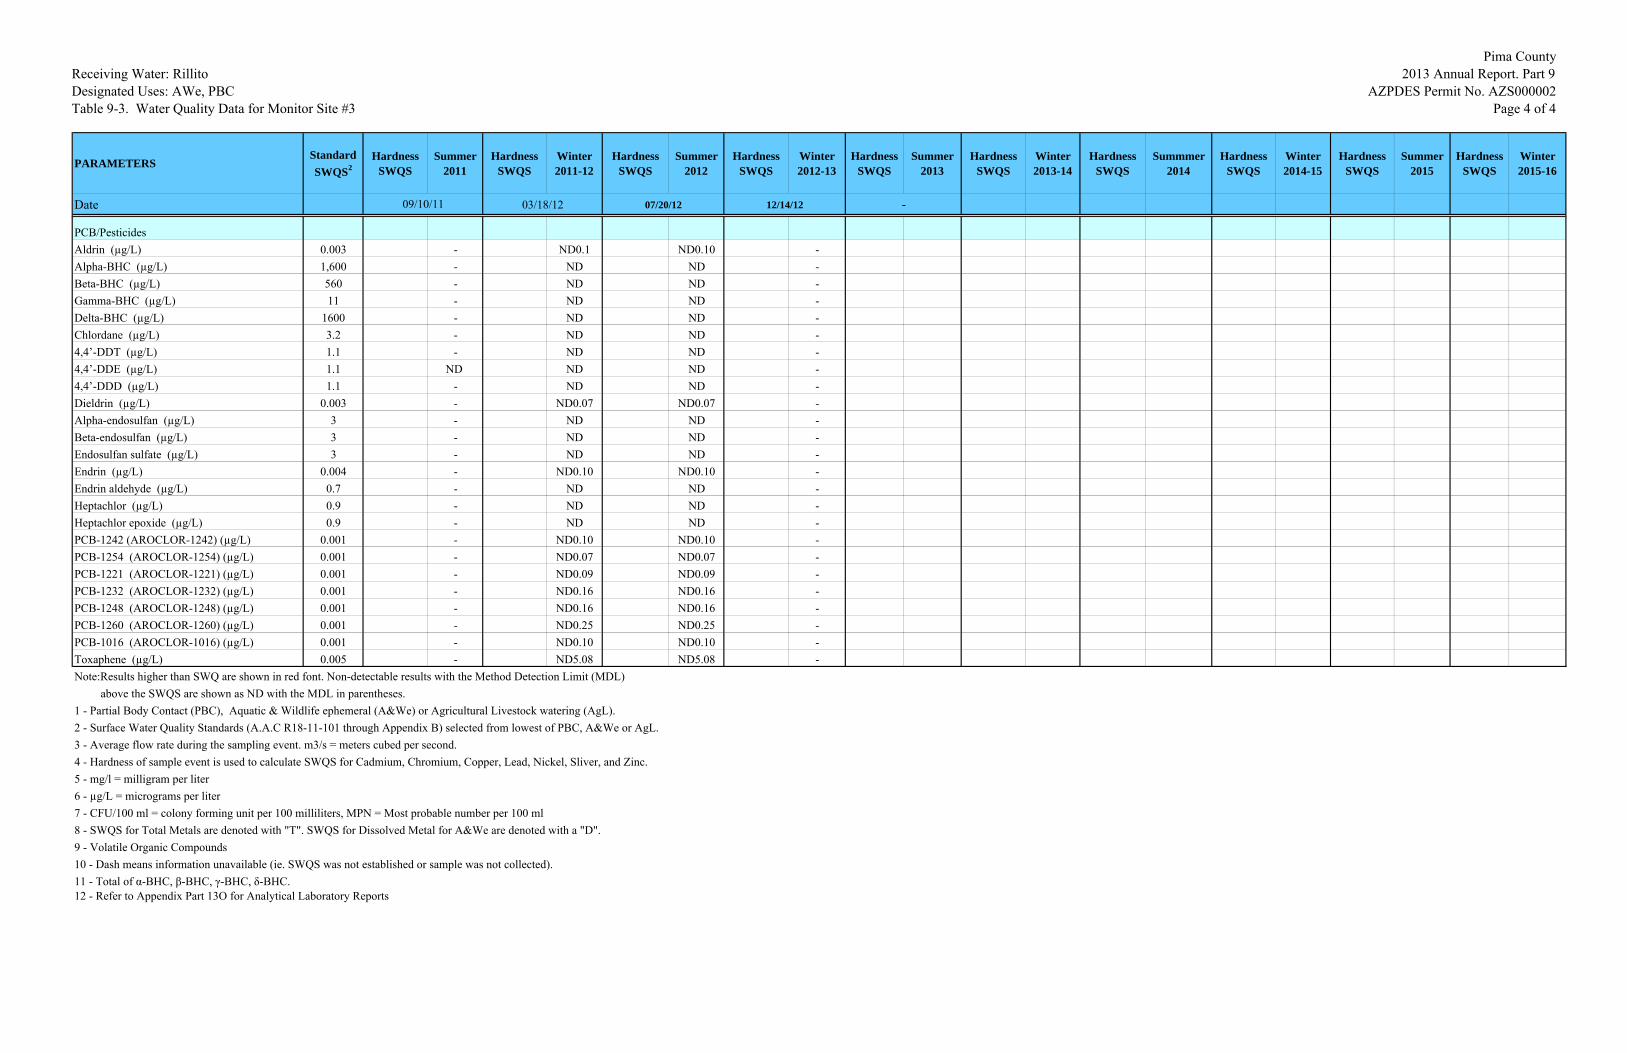
Receiving Water: RillitoDesignated Uses: AWe, PBCTable 9-3. Water Quality Data for Monitor Site #3
Pima County 2013 Annual Report. Part 9
AZPDES Permit No. AZS000002Page 4 of 4
PARAMETERSStandard SWQS2
Hardness SWQS
Summer 2011
Hardness SWQS
Winter 2011-12
Hardness SWQS
Summer 2012
Hardness SWQS
Winter 2012-13
Hardness SWQS
Summer 2013
Hardness SWQS
Winter 2013-14
Hardness SWQS
Summmer 2014
Hardness SWQS
Winter 2014-15
Hardness SWQS
Summer 2015
Hardness SWQS
Winter 2015-16
Date 03/18/12 07/20/12 12/14/1209/10/11 -
PCB/PesticidesAldrin (µg/L) 0.003 - ND0.1 ND0.10 -Alpha-BHC (µg/L) 1,600 - ND ND -Beta-BHC (µg/L) 560 - ND ND -Gamma-BHC (µg/L) 11 - ND ND -Delta-BHC (µg/L) 1600 - ND ND -Chlordane (µg/L) 3.2 - ND ND -4,4’-DDT (µg/L) 1.1 - ND ND -4,4’-DDE (µg/L) 1.1 ND ND ND -4,4’-DDD (µg/L) 1.1 - ND ND -Dieldrin (µg/L) 0.003 - ND0.07 ND0.07 -Alpha-endosulfan (µg/L) 3 - ND ND -Beta-endosulfan (µg/L) 3 - ND ND -Endosulfan sulfate (µg/L) 3 - ND ND -Endrin (µg/L) 0.004 - ND0.10 ND0.10 -Endrin aldehyde (µg/L) 0.7 - ND ND -Heptachlor (µg/L) 0.9 - ND ND -Heptachlor epoxide (µg/L) 0.9 - ND ND -PCB-1242 (AROCLOR-1242) (µg/L) 0.001 - ND0.10 ND0.10 -PCB-1254 (AROCLOR-1254) (µg/L) 0.001 - ND0.07 ND0.07 -PCB-1221 (AROCLOR-1221) (µg/L) 0.001 - ND0.09 ND0.09 -PCB-1232 (AROCLOR-1232) (µg/L) 0.001 - ND0.16 ND0.16 -PCB-1248 (AROCLOR-1248) (µg/L) 0.001 - ND0.16 ND0.16 -PCB-1260 (AROCLOR-1260) (µg/L) 0.001 - ND0.25 ND0.25 -PCB-1016 (AROCLOR-1016) (µg/L) 0.001 - ND0.10 ND0.10 -Toxaphene (µg/L) 0.005 - ND5.08 ND5.08 -Note:Results higher than SWQ are shown in red font. Non-detectable results with the Method Detection Limit (MDL) above the SWQS are shown as ND with the MDL in parentheses.1 - Partial Body Contact (PBC), Aquatic & Wildlife ephemeral (A&We) or Agricultural Livestock watering (AgL).2 - Surface Water Quality Standards (A.A.C R18-11-101 through Appendix B) selected from lowest of PBC, A&We or AgL.3 - Average flow rate during the sampling event. m3/s = meters cubed per second.4 - Hardness of sample event is used to calculate SWQS for Cadmium, Chromium, Copper, Lead, Nickel, Sliver, and Zinc.5 - mg/l = milligram per liter6 - µg/L = micrograms per liter7 - CFU/100 ml = colony forming unit per 100 milliliters, MPN = Most probable number per 100 ml8 - SWQS for Total Metals are denoted with "T". SWQS for Dissolved Metal for A&We are denoted with a "D".9 - Volatile Organic Compounds10 - Dash means information unavailable (ie. SWQS was not established or sample was not collected).11 - Total of α-BHC, β-BHC, γ-BHC, δ-BHC.12 - Refer to Appendix Part 13O for Analytical Laboratory Reports
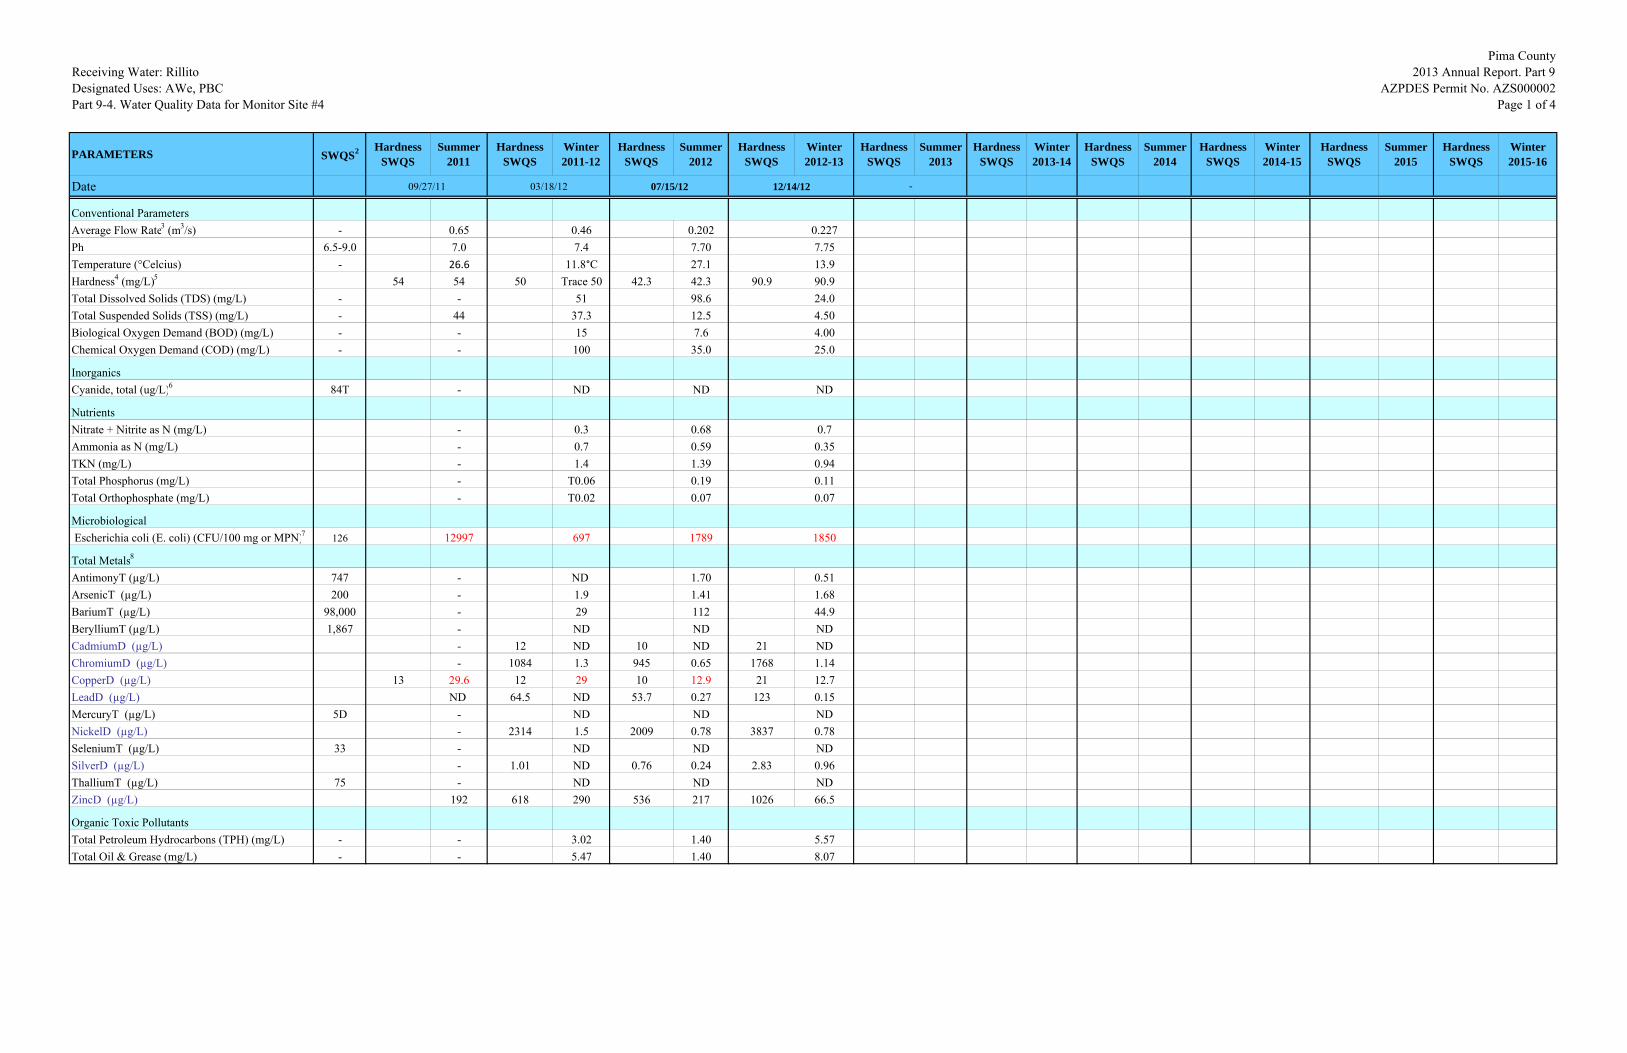
Receiving Water: RillitoDesignated Uses: AWe, PBCPart 9-4. Water Quality Data for Monitor Site #4
Pima County 2013 Annual Report. Part 9
AZPDES Permit No. AZS000002Page 1 of 4
PARAMETERS SWQS2 Hardness SWQS
Summer 2011
Hardness SWQS
Winter 2011-12
Hardness SWQS
Summer 2012
Hardness SWQS
Winter 2012-13
Hardness SWQS
Summer 2013
Hardness SWQS
Winter 2013-14
Hardness SWQS
Summer 2014
Hardness SWQS
Winter 2014-15
Hardness SWQS
Summer 2015
Hardness SWQS
Winter 2015-16
Date 09/27/11 03/18/12 07/15/12 12/14/12
Conventional Parameters 0.471Average Flow Rate3 (m3/s) - 0.65 0.46 0.202 0.227Ph 6.5-9.0 7.0 7.4 7.70 7.75Temperature (°Celcius) - 26.6 11.8°C 27.1 13.9Hardness4 (mg/L)5 54 54 50 Trace 50 42.3 42.3 90.9 90.9Total Dissolved Solids (TDS) (mg/L) - - 51 98.6 24.0Total Suspended Solids (TSS) (mg/L) - 44 37.3 12.5 4.50Biological Oxygen Demand (BOD) (mg/L) - - 15 7.6 4.00Chemical Oxygen Demand (COD) (mg/L) - - 100 35.0 25.0
InorganicsCyanide, total (ug/L)6 84T - ND ND ND
Nutrients Nitrate + Nitrite as N (mg/L) - 0.3 0.68 0.7Ammonia as N (mg/L) - 0.7 0.59 0.35TKN (mg/L) - 1.4 1.39 0.94Total Phosphorus (mg/L) - T0.06 0.19 0.11Total Orthophosphate (mg/L) - T0.02 0.07 0.07
Microbiological Escherichia coli (E. coli) (CFU/100 mg or MPN)7 126 12997 697 1789 1850
Total Metals8
AntimonyT (µg/L) 747 - ND 1.70 0.51ArsenicT (µg/L) 200 - 1.9 1.41 1.68BariumT (µg/L) 98,000 - 29 112 44.9BerylliumT (µg/L) 1,867 - ND ND NDCadmiumD (µg/L) - 12 ND 10 ND 21 NDChromiumD (µg/L) - 1084 1.3 945 0.65 1768 1.14CopperD (µg/L) 13 29.6 12 29 10 12.9 21 12.7LeadD (µg/L) ND 64.5 ND 53.7 0.27 123 0.15MercuryT (µg/L) 5D - ND ND NDNickelD (µg/L) - 2314 1.5 2009 0.78 3837 0.78SeleniumT (µg/L) 33 - ND ND NDSilverD (µg/L) - 1.01 ND 0.76 0.24 2.83 0.96ThalliumT (µg/L) 75 - ND ND NDZincD (µg/L) 192 618 290 536 217 1026 66.5
Organic Toxic PollutantsTotal Petroleum Hydrocarbons (TPH) (mg/L) - - 3.02 1.40 5.57Total Oil & Grease (mg/L) - - 5.47 1.40 8.07
-
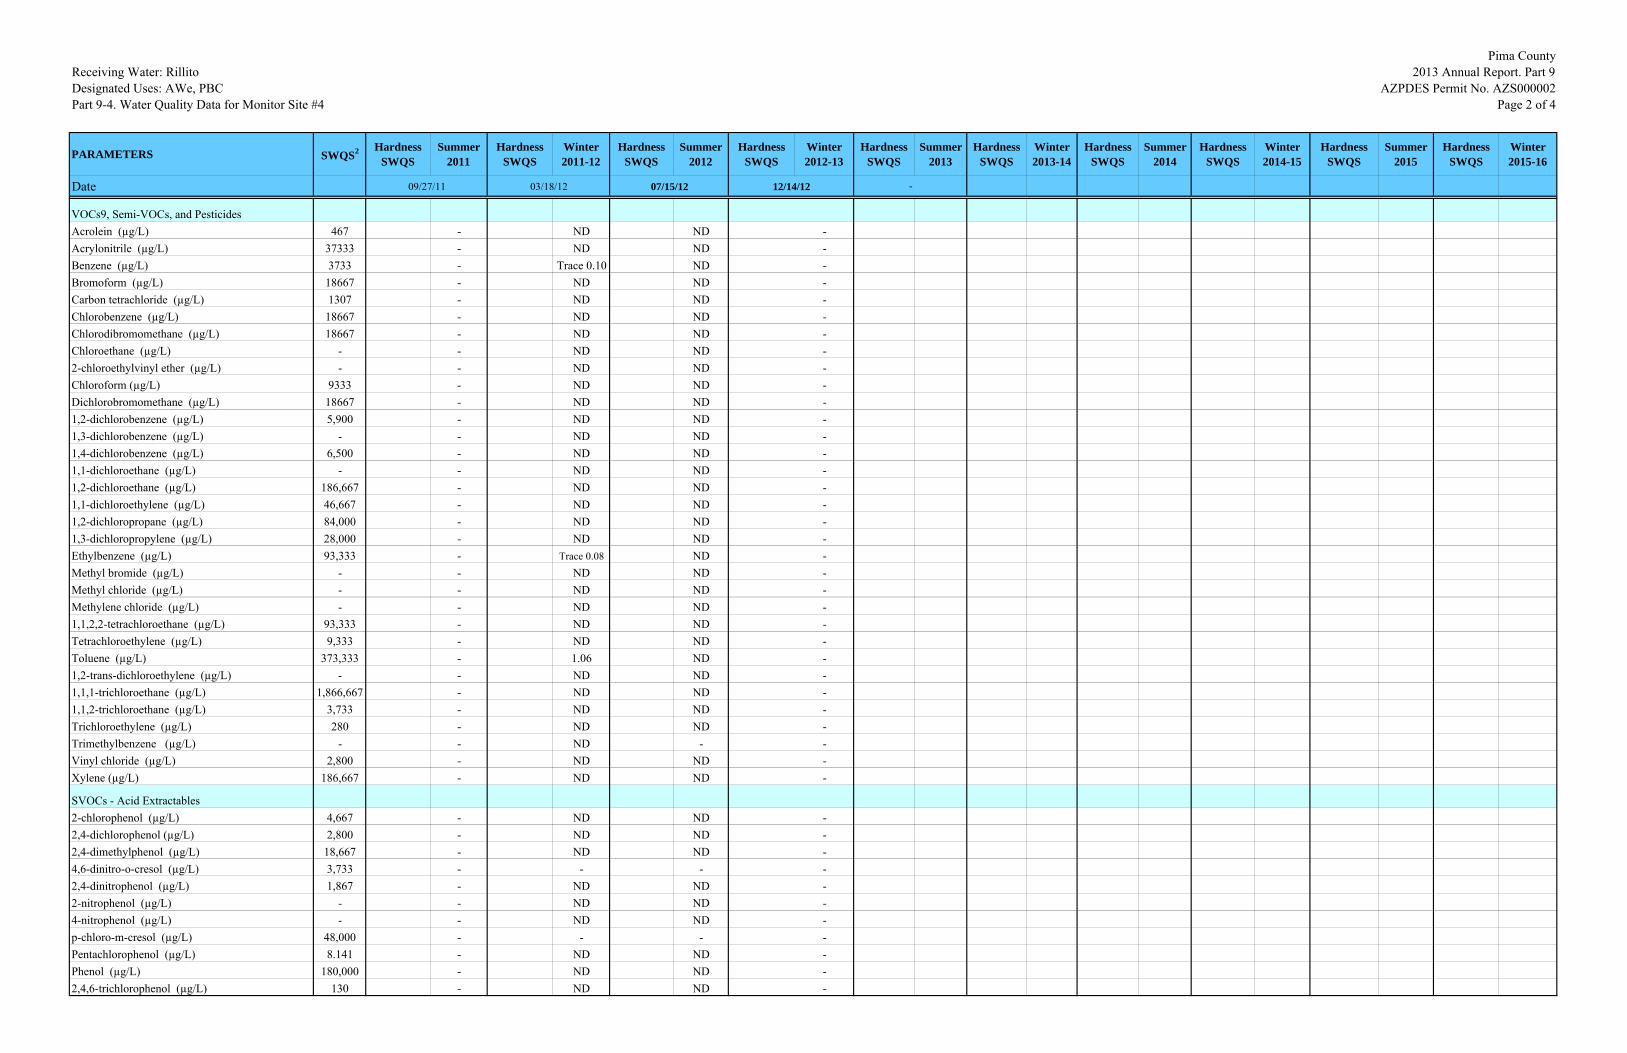
Receiving Water: RillitoDesignated Uses: AWe, PBCPart 9-4. Water Quality Data for Monitor Site #4
Pima County 2013 Annual Report. Part 9
AZPDES Permit No. AZS000002Page 2 of 4
PARAMETERS SWQS2 Hardness SWQS
Summer 2011
Hardness SWQS
Winter 2011-12
Hardness SWQS
Summer 2012
Hardness SWQS
Winter 2012-13
Hardness SWQS
Summer 2013
Hardness SWQS
Winter 2013-14
Hardness SWQS
Summer 2014
Hardness SWQS
Winter 2014-15
Hardness SWQS
Summer 2015
Hardness SWQS
Winter 2015-16
Date 09/27/11 03/18/12 07/15/12 12/14/12 -
VOCs9, Semi-VOCs, and PesticidesAcrolein (µg/L) 467 - ND ND -Acrylonitrile (µg/L) 37333 - ND ND -Benzene (µg/L) 3733 - Trace 0.10 ND -Bromoform (µg/L) 18667 - ND ND -Carbon tetrachloride (µg/L) 1307 - ND ND -Chlorobenzene (µg/L) 18667 - ND ND -Chlorodibromomethane (µg/L) 18667 - ND ND -Chloroethane (µg/L) - - ND ND -2-chloroethylvinyl ether (µg/L) - - ND ND -Chloroform (µg/L) 9333 - ND ND -Dichlorobromomethane (µg/L) 18667 - ND ND -1,2-dichlorobenzene (µg/L) 5,900 - ND ND -1,3-dichlorobenzene (µg/L) - - ND ND -1,4-dichlorobenzene (µg/L) 6,500 - ND ND -1,1-dichloroethane (µg/L) - - ND ND -1,2-dichloroethane (µg/L) 186,667 - ND ND -1,1-dichloroethylene (µg/L) 46,667 - ND ND -1,2-dichloropropane (µg/L) 84,000 - ND ND -1,3-dichloropropylene (µg/L) 28,000 - ND ND -Ethylbenzene (µg/L) 93,333 - Trace 0.08 ND -Methyl bromide (µg/L) - - ND ND -Methyl chloride (µg/L) - - ND ND -Methylene chloride (µg/L) - - ND ND -1,1,2,2-tetrachloroethane (µg/L) 93,333 - ND ND -Tetrachloroethylene (µg/L) 9,333 - ND ND -Toluene (µg/L) 373,333 - 1.06 ND -1,2-trans-dichloroethylene (µg/L) - - ND ND -1,1,1-trichloroethane (µg/L) 1,866,667 - ND ND -1,1,2-trichloroethane (µg/L) 3,733 - ND ND -Trichloroethylene (µg/L) 280 - ND ND -Trimethylbenzene (µg/L) - - ND - -Vinyl chloride (µg/L) 2,800 - ND ND -Xylene (µg/L) 186,667 - ND ND -
SVOCs - Acid Extractables2-chlorophenol (µg/L) 4,667 - ND ND -2,4-dichlorophenol (µg/L) 2,800 - ND ND -2,4-dimethylphenol (µg/L) 18,667 - ND ND -4,6-dinitro-o-cresol (µg/L) 3,733 - - - -2,4-dinitrophenol (µg/L) 1,867 - ND ND -2-nitrophenol (µg/L) - - ND ND -4-nitrophenol (µg/L) - - ND ND -p-chloro-m-cresol (µg/L) 48,000 - - - -Pentachlorophenol (µg/L) 8.141 - ND ND -Phenol (µg/L) 180,000 - ND ND -2,4,6-trichlorophenol (µg/L) 130 - ND ND -
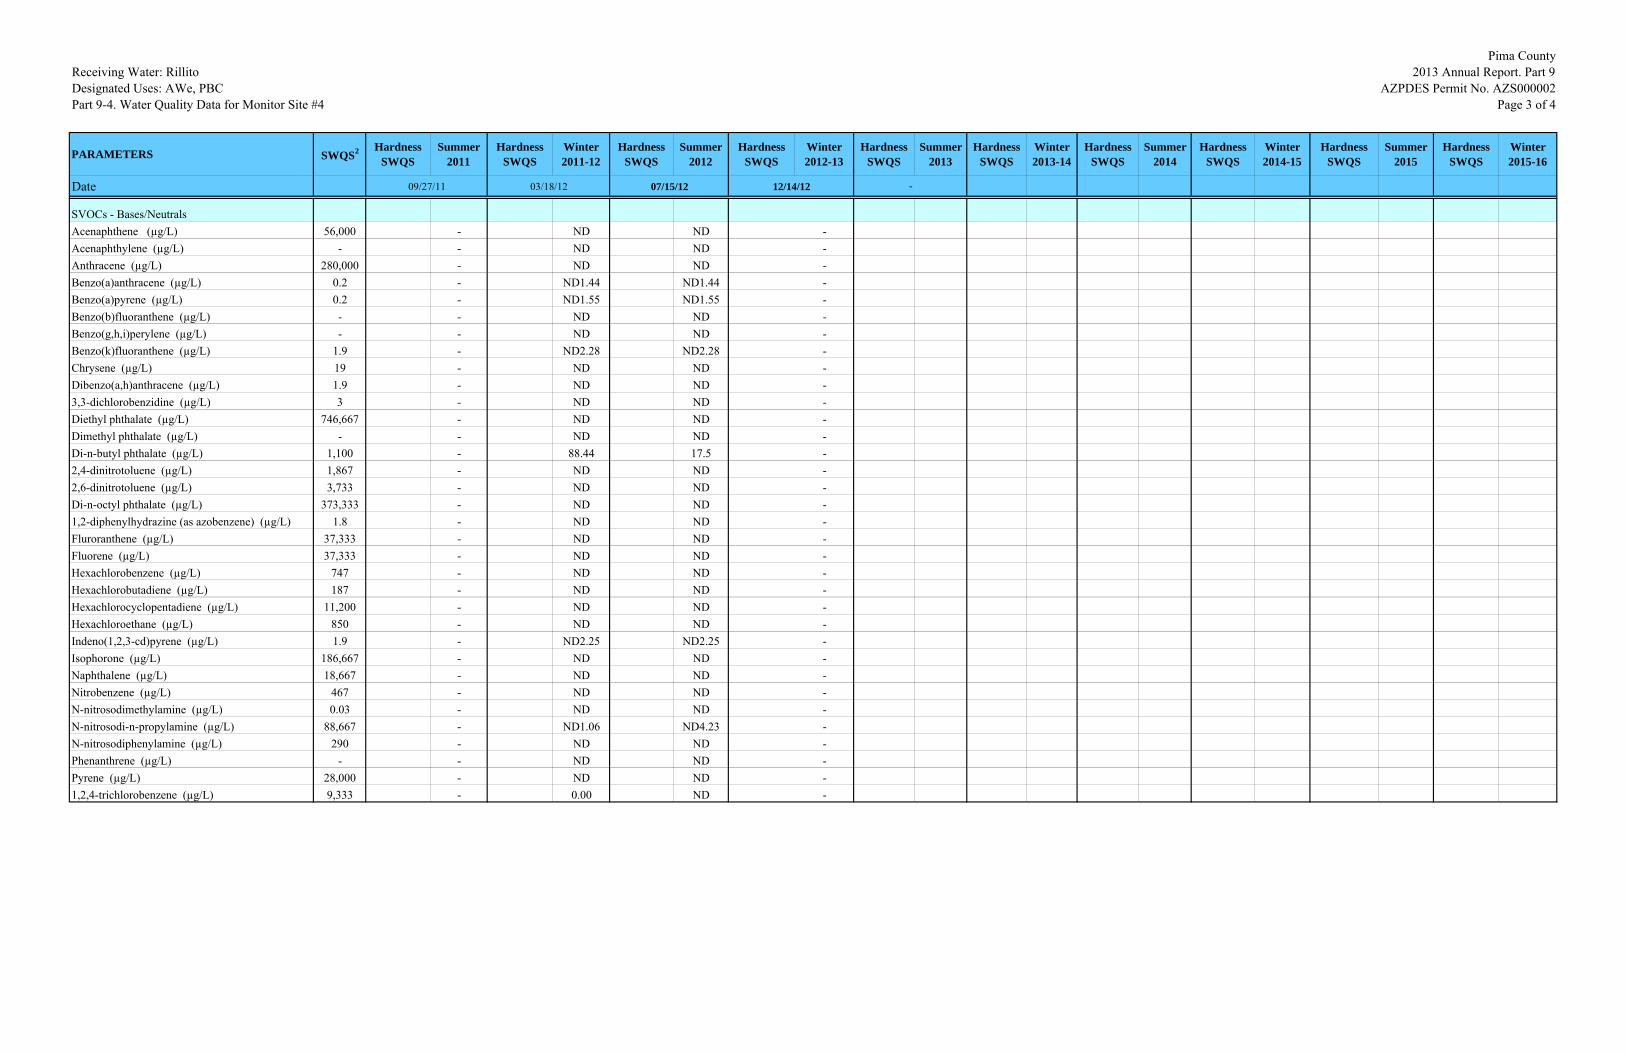
Receiving Water: RillitoDesignated Uses: AWe, PBCPart 9-4. Water Quality Data for Monitor Site #4
Pima County 2013 Annual Report. Part 9
AZPDES Permit No. AZS000002Page 3 of 4
PARAMETERS SWQS2 Hardness SWQS
Summer 2011
Hardness SWQS
Winter 2011-12
Hardness SWQS
Summer 2012
Hardness SWQS
Winter 2012-13
Hardness SWQS
Summer 2013
Hardness SWQS
Winter 2013-14
Hardness SWQS
Summer 2014
Hardness SWQS
Winter 2014-15
Hardness SWQS
Summer 2015
Hardness SWQS
Winter 2015-16
Date 09/27/11 03/18/12 07/15/12 12/14/12 -
SVOCs - Bases/NeutralsAcenaphthene (µg/L) 56,000 - ND ND -Acenaphthylene (µg/L) - - ND ND -Anthracene (µg/L) 280,000 - ND ND -Benzo(a)anthracene (µg/L) 0.2 - ND1.44 ND1.44 -Benzo(a)pyrene (µg/L) 0.2 - ND1.55 ND1.55 -Benzo(b)fluoranthene (µg/L) - - ND ND -Benzo(g,h,i)perylene (µg/L) - - ND ND -Benzo(k)fluoranthene (µg/L) 1.9 - ND2.28 ND2.28 -Chrysene (µg/L) 19 - ND ND -Dibenzo(a,h)anthracene (µg/L) 1.9 - ND ND -3,3-dichlorobenzidine (µg/L) 3 - ND ND -Diethyl phthalate (µg/L) 746,667 - ND ND -Dimethyl phthalate (µg/L) - - ND ND -Di-n-butyl phthalate (µg/L) 1,100 - 88.44 17.5 -2,4-dinitrotoluene (µg/L) 1,867 - ND ND -2,6-dinitrotoluene (µg/L) 3,733 - ND ND -Di-n-octyl phthalate (µg/L) 373,333 - ND ND -1,2-diphenylhydrazine (as azobenzene) (µg/L) 1.8 - ND ND -Fluroranthene (µg/L) 37,333 - ND ND -Fluorene (µg/L) 37,333 - ND ND -Hexachlorobenzene (µg/L) 747 - ND ND -Hexachlorobutadiene (µg/L) 187 - ND ND -Hexachlorocyclopentadiene (µg/L) 11,200 - ND ND -Hexachloroethane (µg/L) 850 - ND ND -Indeno(1,2,3-cd)pyrene (µg/L) 1.9 - ND2.25 ND2.25 -Isophorone (µg/L) 186,667 - ND ND -Naphthalene (µg/L) 18,667 - ND ND -Nitrobenzene (µg/L) 467 - ND ND -N-nitrosodimethylamine (µg/L) 0.03 - ND ND -N-nitrosodi-n-propylamine (µg/L) 88,667 - ND1.06 ND4.23 -N-nitrosodiphenylamine (µg/L) 290 - ND ND -Phenanthrene (µg/L) - - ND ND -Pyrene (µg/L) 28,000 - ND ND -1,2,4-trichlorobenzene (µg/L) 9,333 - 0.00 ND -
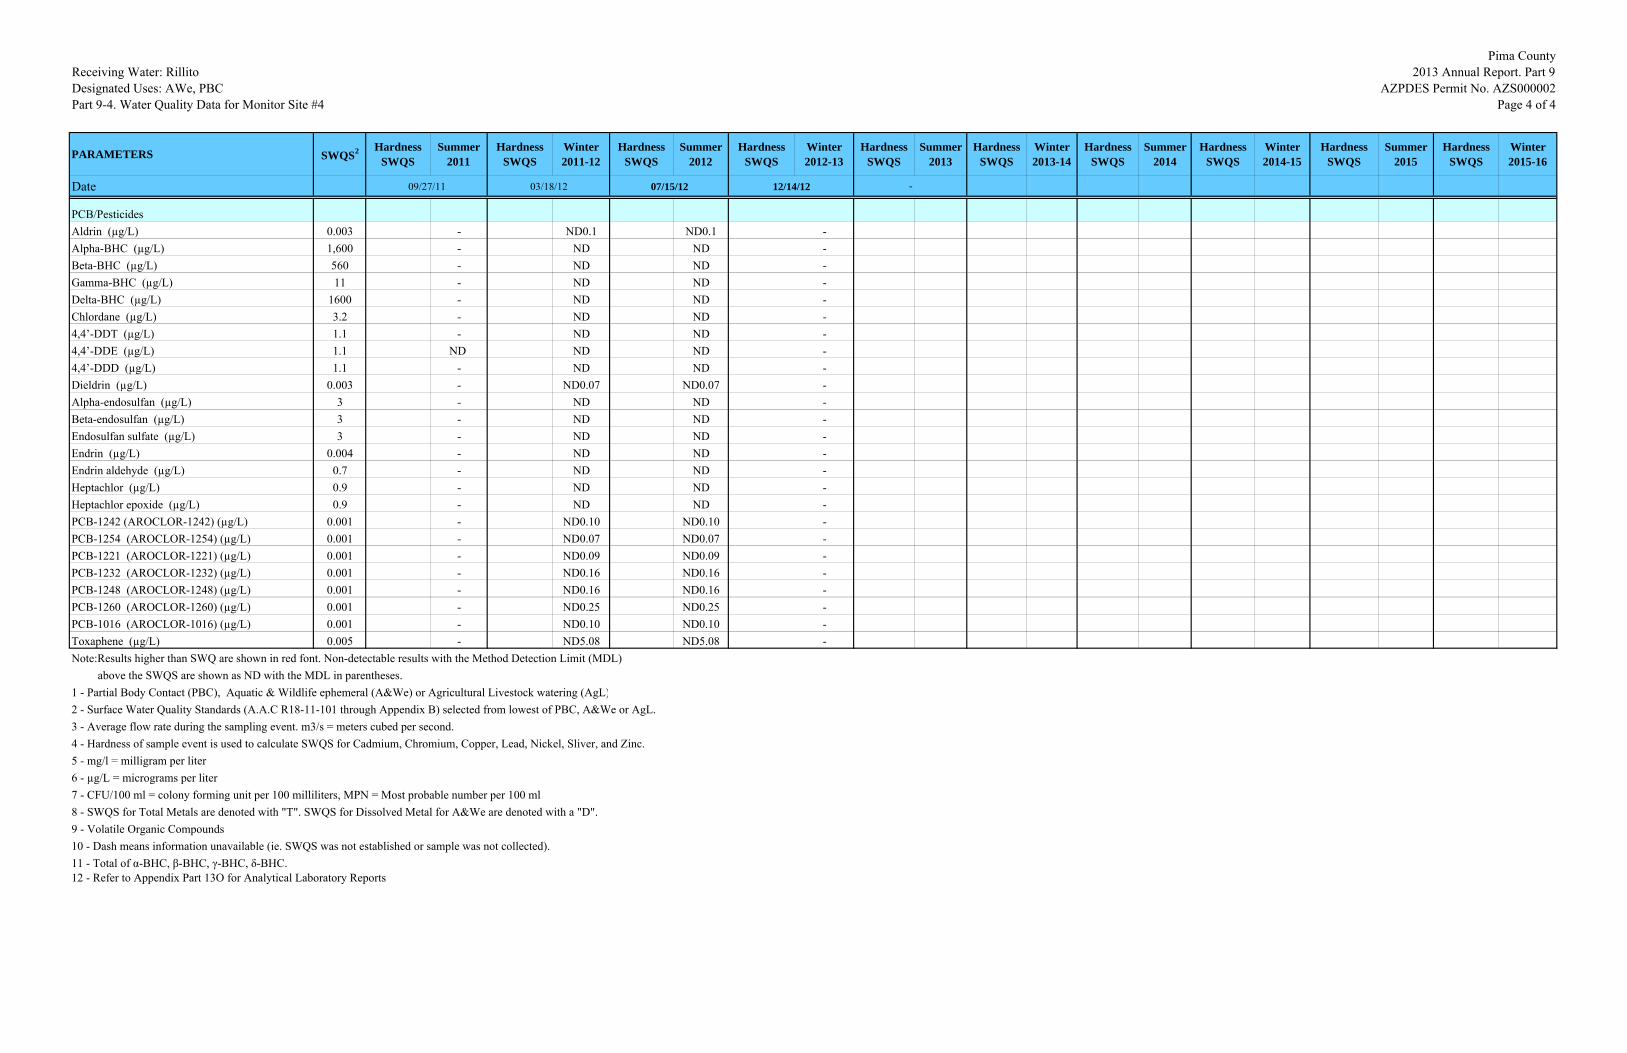
Receiving Water: RillitoDesignated Uses: AWe, PBCPart 9-4. Water Quality Data for Monitor Site #4
Pima County 2013 Annual Report. Part 9
AZPDES Permit No. AZS000002Page 4 of 4
PARAMETERS SWQS2 Hardness SWQS
Summer 2011
Hardness SWQS
Winter 2011-12
Hardness SWQS
Summer 2012
Hardness SWQS
Winter 2012-13
Hardness SWQS
Summer 2013
Hardness SWQS
Winter 2013-14
Hardness SWQS
Summer 2014
Hardness SWQS
Winter 2014-15
Hardness SWQS
Summer 2015
Hardness SWQS
Winter 2015-16
Date 09/27/11 03/18/12 07/15/12 12/14/12 -
PCB/PesticidesAldrin (µg/L) 0.003 - ND0.1 ND0.1 -Alpha-BHC (µg/L) 1,600 - ND ND -Beta-BHC (µg/L) 560 - ND ND -Gamma-BHC (µg/L) 11 - ND ND -Delta-BHC (µg/L) 1600 - ND ND -Chlordane (µg/L) 3.2 - ND ND -4,4’-DDT (µg/L) 1.1 - ND ND -4,4’-DDE (µg/L) 1.1 ND ND ND -4,4’-DDD (µg/L) 1.1 - ND ND -Dieldrin (µg/L) 0.003 - ND0.07 ND0.07 -Alpha-endosulfan (µg/L) 3 - ND ND -Beta-endosulfan (µg/L) 3 - ND ND -Endosulfan sulfate (µg/L) 3 - ND ND -Endrin (µg/L) 0.004 - ND ND -Endrin aldehyde (µg/L) 0.7 - ND ND -Heptachlor (µg/L) 0.9 - ND ND -Heptachlor epoxide (µg/L) 0.9 - ND ND -PCB-1242 (AROCLOR-1242) (µg/L) 0.001 - ND0.10 ND0.10 -PCB-1254 (AROCLOR-1254) (µg/L) 0.001 - ND0.07 ND0.07 -PCB-1221 (AROCLOR-1221) (µg/L) 0.001 - ND0.09 ND0.09 -PCB-1232 (AROCLOR-1232) (µg/L) 0.001 - ND0.16 ND0.16 -PCB-1248 (AROCLOR-1248) (µg/L) 0.001 - ND0.16 ND0.16 -PCB-1260 (AROCLOR-1260) (µg/L) 0.001 - ND0.25 ND0.25 -PCB-1016 (AROCLOR-1016) (µg/L) 0.001 - ND0.10 ND0.10 -Toxaphene (µg/L) 0.005 - ND5.08 ND5.08 -Note:Results higher than SWQ are shown in red font. Non-detectable results with the Method Detection Limit (MDL) above the SWQS are shown as ND with the MDL in parentheses.1 - Partial Body Contact (PBC), Aquatic & Wildlife ephemeral (A&We) or Agricultural Livestock watering (AgL)2 - Surface Water Quality Standards (A.A.C R18-11-101 through Appendix B) selected from lowest of PBC, A&We or AgL.3 - Average flow rate during the sampling event. m3/s = meters cubed per second.4 - Hardness of sample event is used to calculate SWQS for Cadmium, Chromium, Copper, Lead, Nickel, Sliver, and Zinc.5 - mg/l = milligram per liter6 - µg/L = micrograms per liter7 - CFU/100 ml = colony forming unit per 100 milliliters, MPN = Most probable number per 100 ml8 - SWQS for Total Metals are denoted with "T". SWQS for Dissolved Metal for A&We are denoted with a "D".9 - Volatile Organic Compounds10 - Dash means information unavailable (ie. SWQS was not established or sample was not collected).11 - Total of α-BHC, β-BHC, γ-BHC, δ-BHC.12 - Refer to Appendix Part 13O for Analytical Laboratory Reports
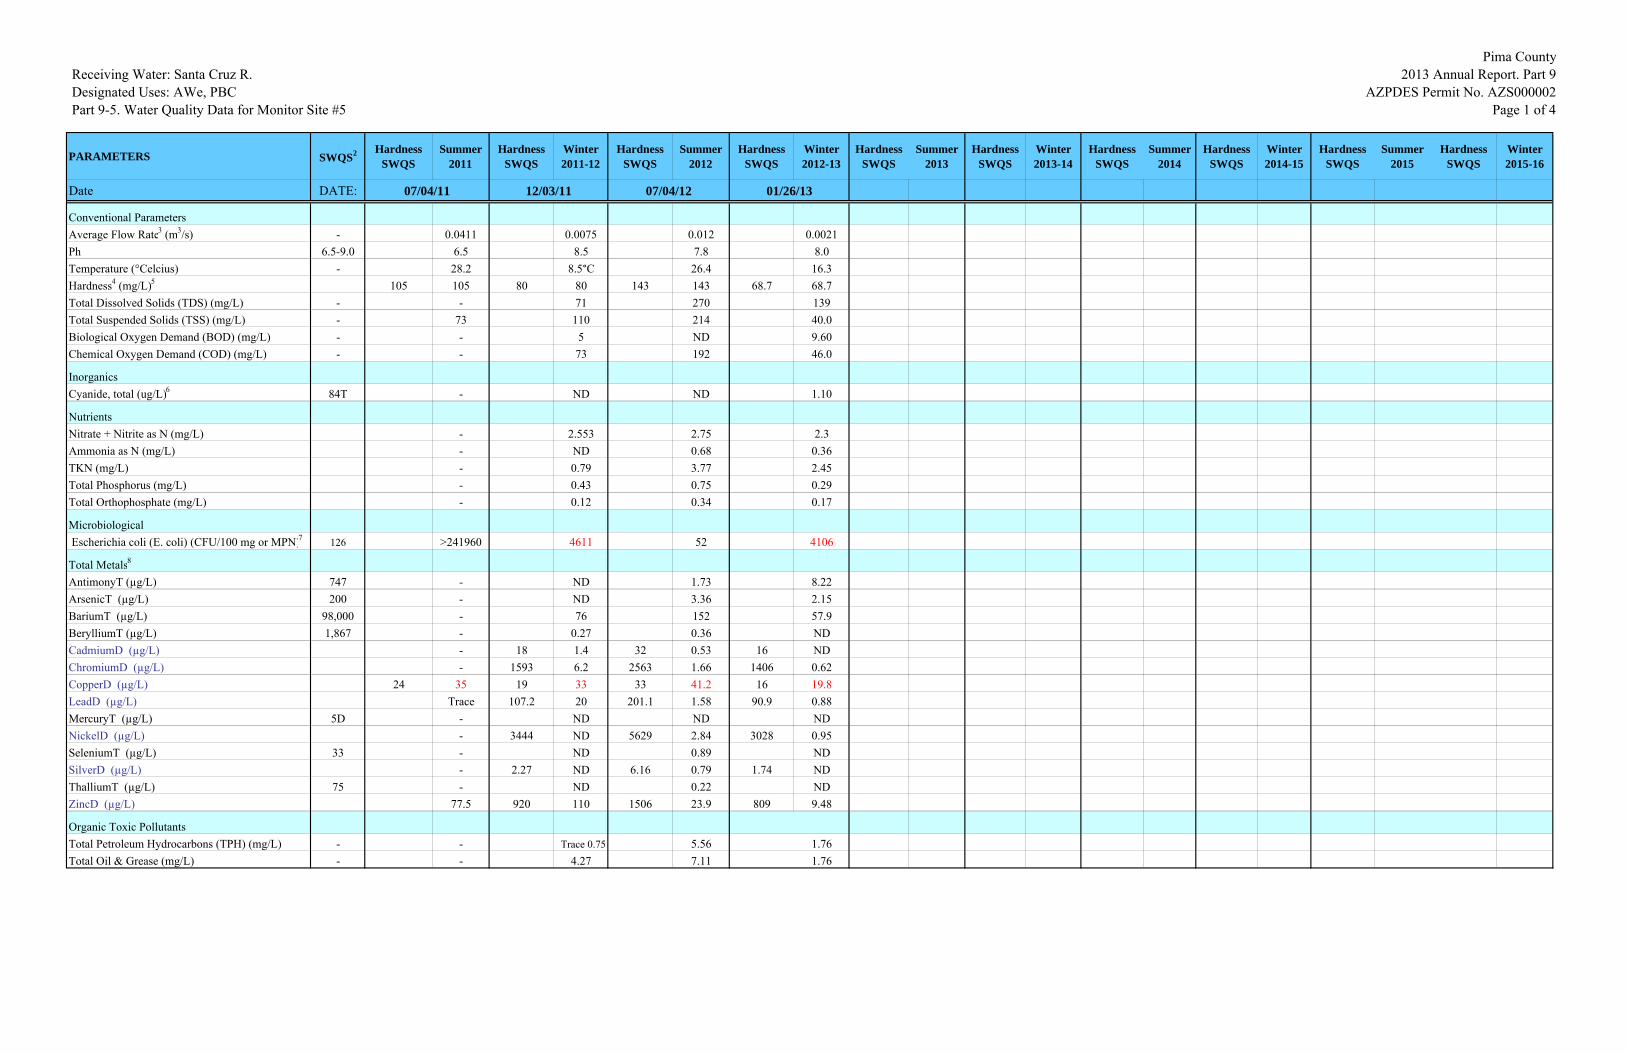
Receiving Water: Santa Cruz R.Designated Uses: AWe, PBCPart 9-5. Water Quality Data for Monitor Site #5
Pima County 2013 Annual Report. Part 9
AZPDES Permit No. AZS000002Page 1 of 4
PARAMETERS SWQS2 Hardness SWQS
Summer 2011
Hardness SWQS
Winter 2011-12
Hardness SWQS
Summer 2012
Hardness SWQS
Winter 2012-13
Hardness SWQS
Summer 2013
Hardness SWQS
Winter 2013-14
Hardness SWQS
Summer 2014
Hardness SWQS
Winter 2014-15
Hardness SWQS
Summer 2015
Hardness SWQS
Winter 2015-16
Date DATE: 07/04/11 12/03/11 07/04/12 01/26/13
Conventional Parameters 0.85Average Flow Rate3 (m3/s) - 0.0411 0.0075 0.012 0.0021Ph 6.5-9.0 6.5 8.5 7.8 8.0Temperature (°Celcius) - 28.2 8.5°C 26.4 16.3Hardness4 (mg/L)5 105 105 80 80 143 143 68.7 68.7Total Dissolved Solids (TDS) (mg/L) - - 71 270 139Total Suspended Solids (TSS) (mg/L) - 73 110 214 40.0Biological Oxygen Demand (BOD) (mg/L) - - 5 ND 9.60Chemical Oxygen Demand (COD) (mg/L) - - 73 192 46.0
InorganicsCyanide, total (ug/L)6 84T - ND ND 1.10
Nutrients Nitrate + Nitrite as N (mg/L) - 2.553 2.75 2.3Ammonia as N (mg/L) - ND 0.68 0.36TKN (mg/L) - 0.79 3.77 2.45Total Phosphorus (mg/L) - 0.43 0.75 0.29Total Orthophosphate (mg/L) - 0.12 0.34 0.17
Microbiological Escherichia coli (E. coli) (CFU/100 mg or MPN)7 126 >241960 4611 52 4106
Total Metals8
AntimonyT (µg/L) 747 - ND 1.73 8.22ArsenicT (µg/L) 200 - ND 3.36 2.15BariumT (µg/L) 98,000 - 76 152 57.9BerylliumT (µg/L) 1,867 - 0.27 0.36 NDCadmiumD (µg/L) - 18 1.4 32 0.53 16 NDChromiumD (µg/L) - 1593 6.2 2563 1.66 1406 0.62CopperD (µg/L) 24 35 19 33 33 41.2 16 19.8LeadD (µg/L) Trace 107.2 20 201.1 1.58 90.9 0.88MercuryT (µg/L) 5D - ND ND NDNickelD (µg/L) - 3444 ND 5629 2.84 3028 0.95SeleniumT (µg/L) 33 - ND 0.89 NDSilverD (µg/L) - 2.27 ND 6.16 0.79 1.74 NDThalliumT (µg/L) 75 - ND 0.22 NDZincD (µg/L) 77.5 920 110 1506 23.9 809 9.48
Organic Toxic PollutantsTotal Petroleum Hydrocarbons (TPH) (mg/L) - - Trace 0.75 5.56 1.76Total Oil & Grease (mg/L) - - 4.27 7.11 1.76
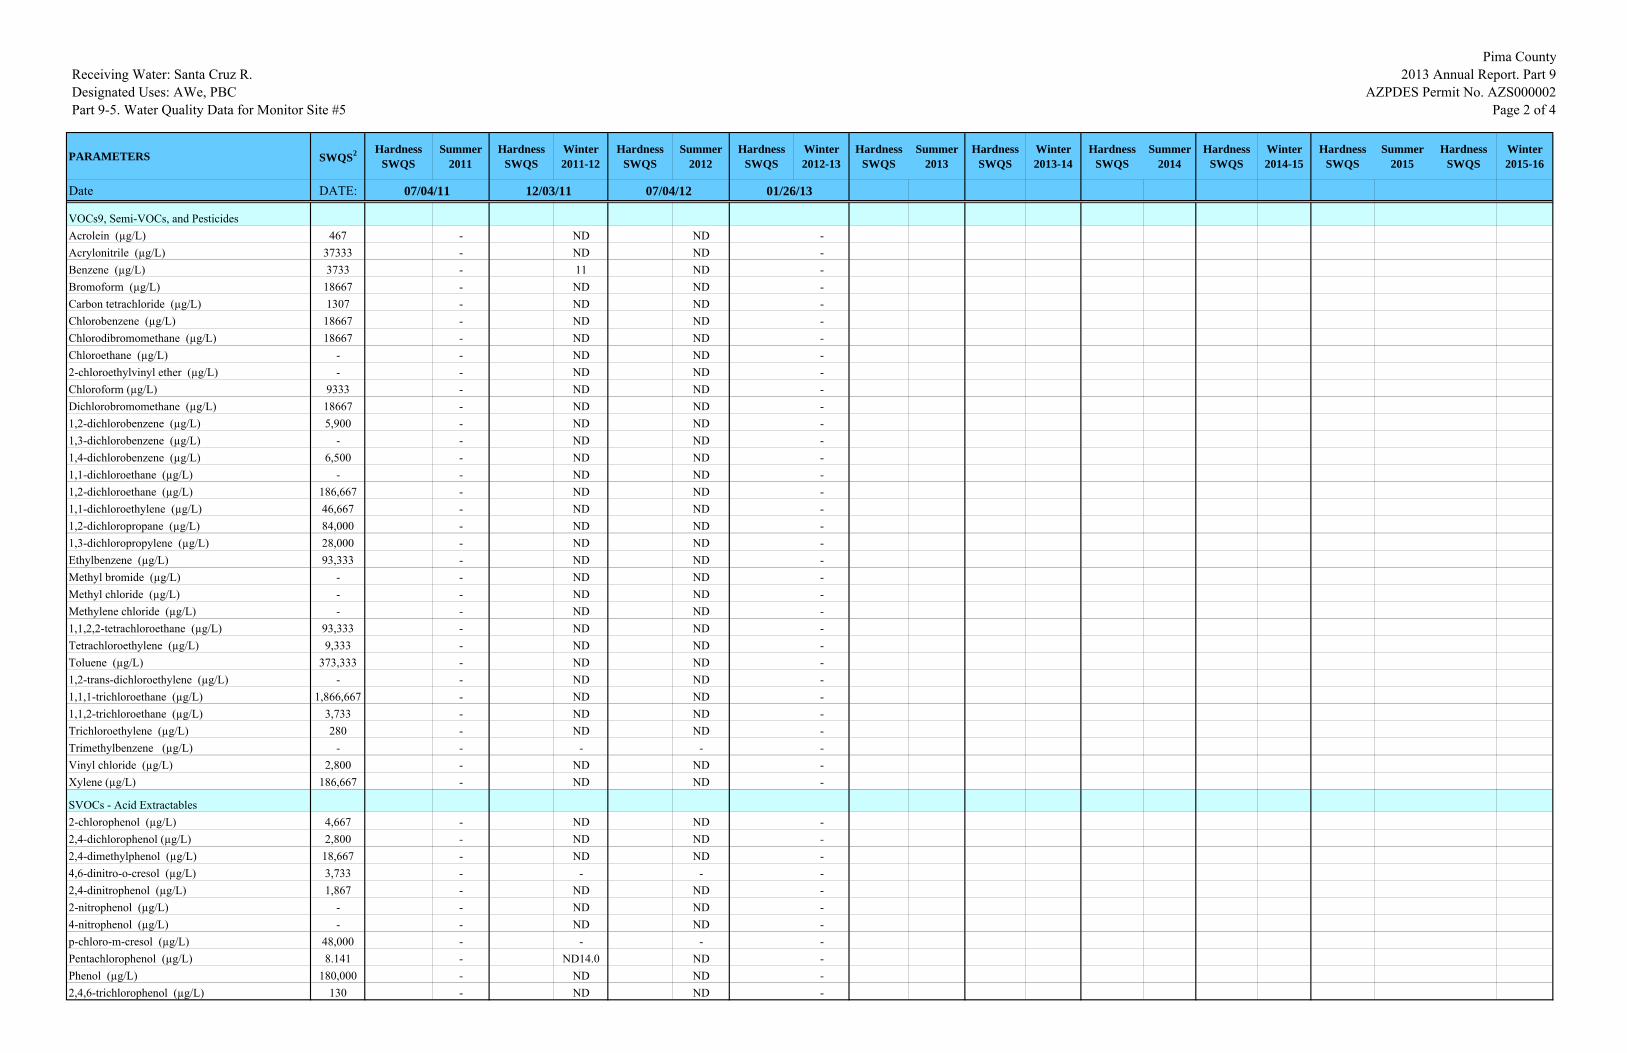
Receiving Water: Santa Cruz R.Designated Uses: AWe, PBCPart 9-5. Water Quality Data for Monitor Site #5
Pima County 2013 Annual Report. Part 9
AZPDES Permit No. AZS000002Page 2 of 4
PARAMETERS SWQS2 Hardness SWQS
Summer 2011
Hardness SWQS
Winter 2011-12
Hardness SWQS
Summer 2012
Hardness SWQS
Winter 2012-13
Hardness SWQS
Summer 2013
Hardness SWQS
Winter 2013-14
Hardness SWQS
Summer 2014
Hardness SWQS
Winter 2014-15
Hardness SWQS
Summer 2015
Hardness SWQS
Winter 2015-16
Date DATE: 07/04/11 12/03/11 07/04/12 01/26/13
VOCs9, Semi-VOCs, and PesticidesAcrolein (µg/L) 467 - ND ND -Acrylonitrile (µg/L) 37333 - ND ND -Benzene (µg/L) 3733 - 11 ND -Bromoform (µg/L) 18667 - ND ND -Carbon tetrachloride (µg/L) 1307 - ND ND -Chlorobenzene (µg/L) 18667 - ND ND -Chlorodibromomethane (µg/L) 18667 - ND ND -Chloroethane (µg/L) - - ND ND -2-chloroethylvinyl ether (µg/L) - - ND ND -Chloroform (µg/L) 9333 - ND ND -Dichlorobromomethane (µg/L) 18667 - ND ND -1,2-dichlorobenzene (µg/L) 5,900 - ND ND -1,3-dichlorobenzene (µg/L) - - ND ND -1,4-dichlorobenzene (µg/L) 6,500 - ND ND -1,1-dichloroethane (µg/L) - - ND ND -1,2-dichloroethane (µg/L) 186,667 - ND ND -1,1-dichloroethylene (µg/L) 46,667 - ND ND -1,2-dichloropropane (µg/L) 84,000 - ND ND -1,3-dichloropropylene (µg/L) 28,000 - ND ND -Ethylbenzene (µg/L) 93,333 - ND ND -Methyl bromide (µg/L) - - ND ND -Methyl chloride (µg/L) - - ND ND -Methylene chloride (µg/L) - - ND ND -1,1,2,2-tetrachloroethane (µg/L) 93,333 - ND ND -Tetrachloroethylene (µg/L) 9,333 - ND ND -Toluene (µg/L) 373,333 - ND ND -1,2-trans-dichloroethylene (µg/L) - - ND ND -1,1,1-trichloroethane (µg/L) 1,866,667 - ND ND -1,1,2-trichloroethane (µg/L) 3,733 - ND ND -Trichloroethylene (µg/L) 280 - ND ND -Trimethylbenzene (µg/L) - - - - -Vinyl chloride (µg/L) 2,800 - ND ND -Xylene (µg/L) 186,667 - ND ND -
SVOCs - Acid Extractables2-chlorophenol (µg/L) 4,667 - ND ND -2,4-dichlorophenol (µg/L) 2,800 - ND ND -2,4-dimethylphenol (µg/L) 18,667 - ND ND -4,6-dinitro-o-cresol (µg/L) 3,733 - - - -2,4-dinitrophenol (µg/L) 1,867 - ND ND -2-nitrophenol (µg/L) - - ND ND -4-nitrophenol (µg/L) - - ND ND -p-chloro-m-cresol (µg/L) 48,000 - - - -Pentachlorophenol (µg/L) 8.141 - ND14.0 ND -Phenol (µg/L) 180,000 - ND ND -2,4,6-trichlorophenol (µg/L) 130 - ND ND -
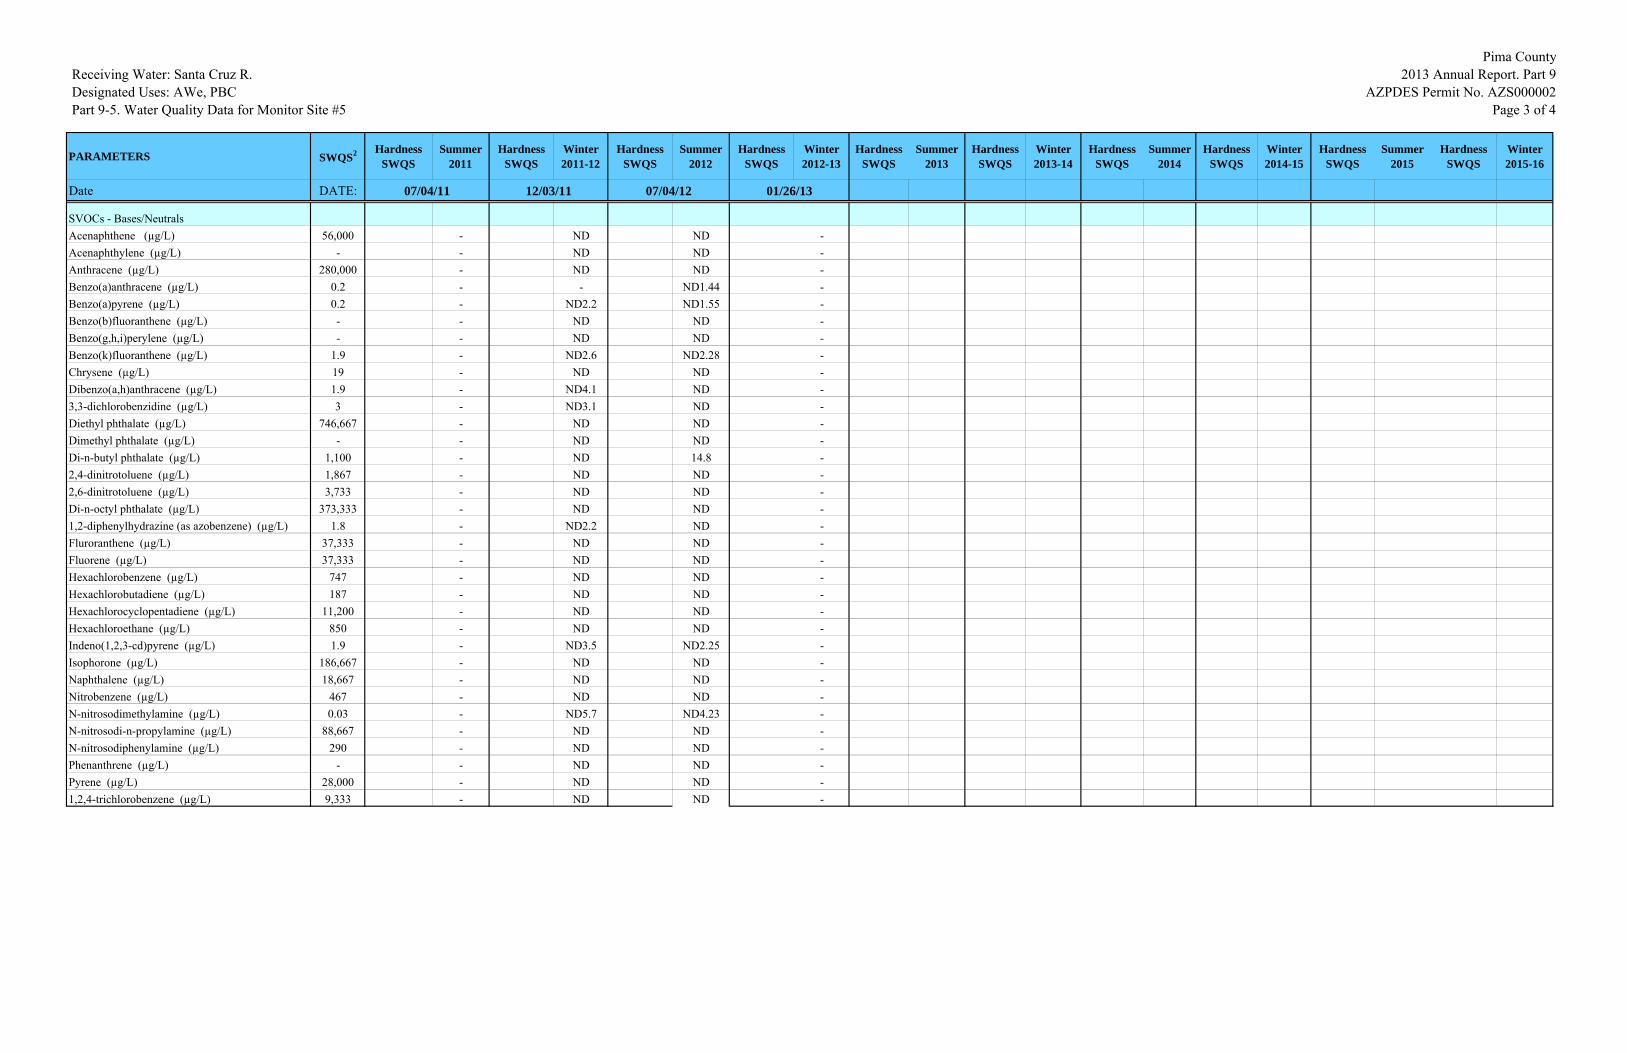
Receiving Water: Santa Cruz R.Designated Uses: AWe, PBCPart 9-5. Water Quality Data for Monitor Site #5
Pima County 2013 Annual Report. Part 9
AZPDES Permit No. AZS000002Page 3 of 4
PARAMETERS SWQS2 Hardness SWQS
Summer 2011
Hardness SWQS
Winter 2011-12
Hardness SWQS
Summer 2012
Hardness SWQS
Winter 2012-13
Hardness SWQS
Summer 2013
Hardness SWQS
Winter 2013-14
Hardness SWQS
Summer 2014
Hardness SWQS
Winter 2014-15
Hardness SWQS
Summer 2015
Hardness SWQS
Winter 2015-16
Date DATE: 07/04/11 12/03/11 07/04/12 01/26/13
SVOCs - Bases/NeutralsAcenaphthene (µg/L) 56,000 - ND ND -Acenaphthylene (µg/L) - - ND ND -Anthracene (µg/L) 280,000 - ND ND -Benzo(a)anthracene (µg/L) 0.2 - - ND1.44 -Benzo(a)pyrene (µg/L) 0.2 - ND2.2 ND1.55 -Benzo(b)fluoranthene (µg/L) - - ND ND -Benzo(g,h,i)perylene (µg/L) - - ND ND -Benzo(k)fluoranthene (µg/L) 1.9 - ND2.6 ND2.28 -Chrysene (µg/L) 19 - ND ND -Dibenzo(a,h)anthracene (µg/L) 1.9 - ND4.1 ND -3,3-dichlorobenzidine (µg/L) 3 - ND3.1 ND -Diethyl phthalate (µg/L) 746,667 - ND ND -Dimethyl phthalate (µg/L) - - ND ND -Di-n-butyl phthalate (µg/L) 1,100 - ND 14.8 -2,4-dinitrotoluene (µg/L) 1,867 - ND ND -2,6-dinitrotoluene (µg/L) 3,733 - ND ND -Di-n-octyl phthalate (µg/L) 373,333 - ND ND -1,2-diphenylhydrazine (as azobenzene) (µg/L) 1.8 - ND2.2 ND -Fluroranthene (µg/L) 37,333 - ND ND -Fluorene (µg/L) 37,333 - ND ND -Hexachlorobenzene (µg/L) 747 - ND ND -Hexachlorobutadiene (µg/L) 187 - ND ND -Hexachlorocyclopentadiene (µg/L) 11,200 - ND ND -Hexachloroethane (µg/L) 850 - ND ND -Indeno(1,2,3-cd)pyrene (µg/L) 1.9 - ND3.5 ND2.25 -Isophorone (µg/L) 186,667 - ND ND -Naphthalene (µg/L) 18,667 - ND ND -Nitrobenzene (µg/L) 467 - ND ND -N-nitrosodimethylamine (µg/L) 0.03 - ND5.7 ND4.23 -N-nitrosodi-n-propylamine (µg/L) 88,667 - ND ND -N-nitrosodiphenylamine (µg/L) 290 - ND ND -Phenanthrene (µg/L) - - ND ND -Pyrene (µg/L) 28,000 - ND ND -1,2,4-trichlorobenzene (µg/L) 9,333 - ND ND -
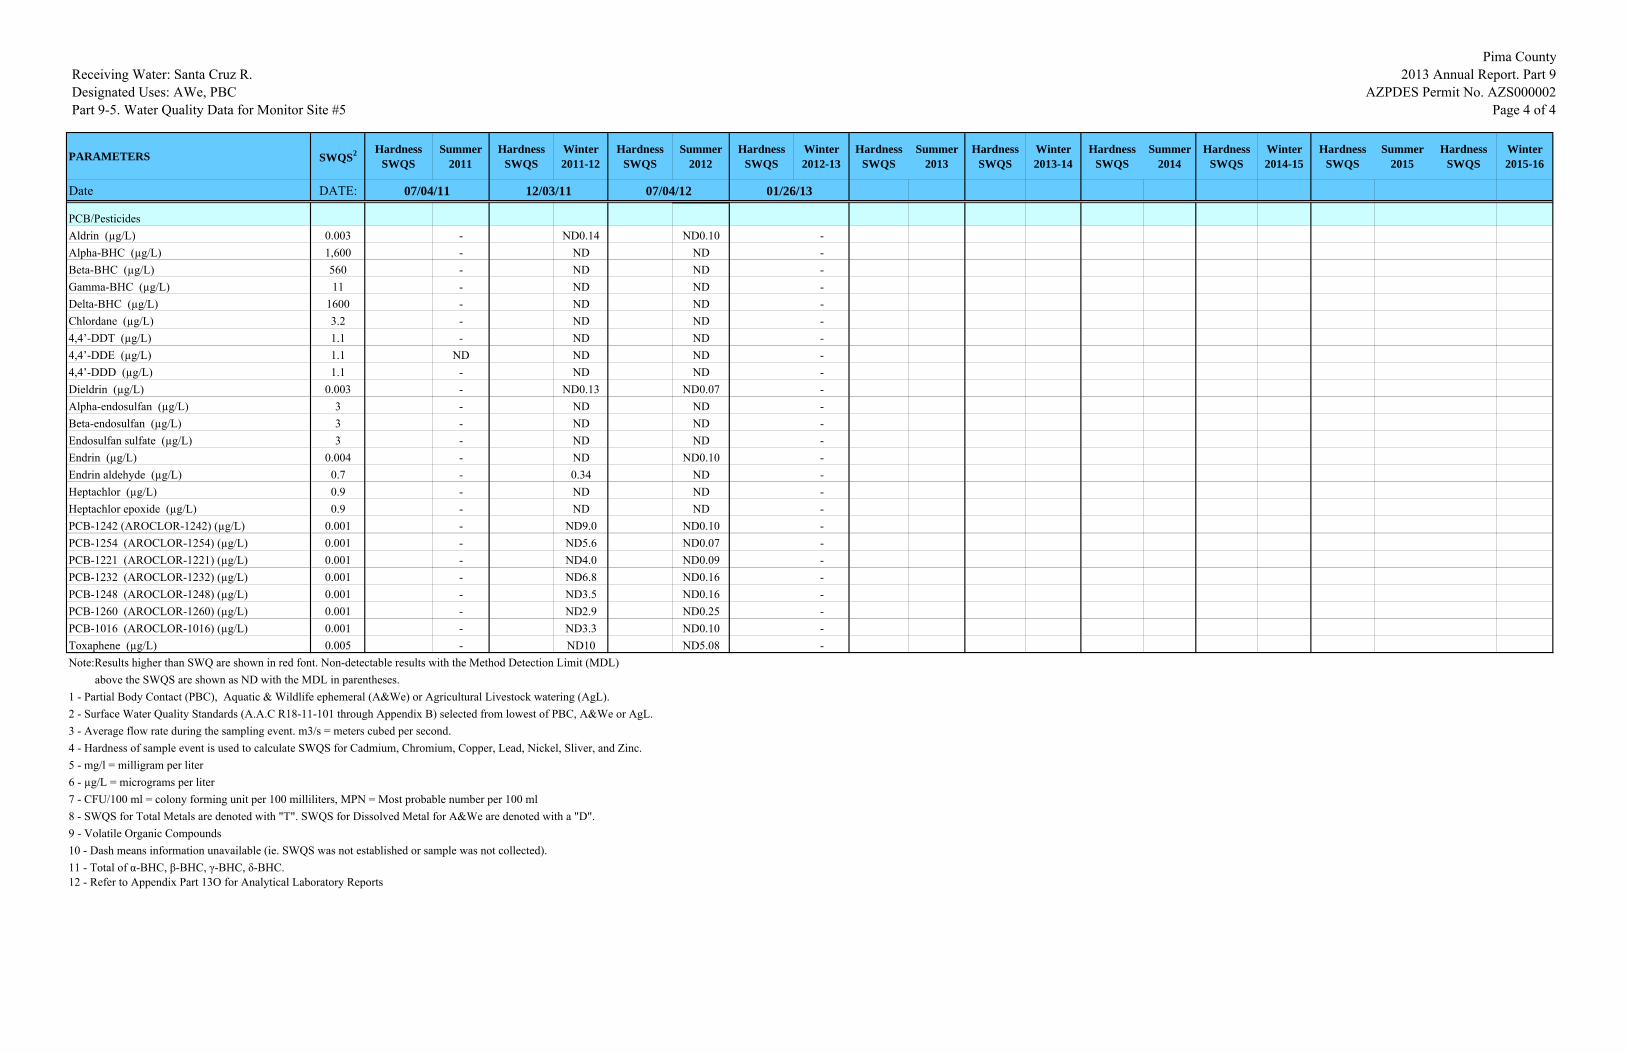
Receiving Water: Santa Cruz R.Designated Uses: AWe, PBCPart 9-5. Water Quality Data for Monitor Site #5
Pima County 2013 Annual Report. Part 9
AZPDES Permit No. AZS000002Page 4 of 4
PARAMETERS SWQS2 Hardness SWQS
Summer 2011
Hardness SWQS
Winter 2011-12
Hardness SWQS
Summer 2012
Hardness SWQS
Winter 2012-13
Hardness SWQS
Summer 2013
Hardness SWQS
Winter 2013-14
Hardness SWQS
Summer 2014
Hardness SWQS
Winter 2014-15
Hardness SWQS
Summer 2015
Hardness SWQS
Winter 2015-16
Date DATE: 07/04/11 12/03/11 07/04/12 01/26/13
PCB/PesticidesAldrin (µg/L) 0.003 - ND0.14 ND0.10 -Alpha-BHC (µg/L) 1,600 - ND ND -Beta-BHC (µg/L) 560 - ND ND -Gamma-BHC (µg/L) 11 - ND ND -Delta-BHC (µg/L) 1600 - ND ND -Chlordane (µg/L) 3.2 - ND ND -4,4’-DDT (µg/L) 1.1 - ND ND -4,4’-DDE (µg/L) 1.1 ND ND ND -4,4’-DDD (µg/L) 1.1 - ND ND -Dieldrin (µg/L) 0.003 - ND0.13 ND0.07 -Alpha-endosulfan (µg/L) 3 - ND ND -Beta-endosulfan (µg/L) 3 - ND ND -Endosulfan sulfate (µg/L) 3 - ND ND -Endrin (µg/L) 0.004 - ND ND0.10 -Endrin aldehyde (µg/L) 0.7 - 0.34 ND -Heptachlor (µg/L) 0.9 - ND ND -Heptachlor epoxide (µg/L) 0.9 - ND ND -PCB-1242 (AROCLOR-1242) (µg/L) 0.001 - ND9.0 ND0.10 -PCB-1254 (AROCLOR-1254) (µg/L) 0.001 - ND5.6 ND0.07 -PCB-1221 (AROCLOR-1221) (µg/L) 0.001 - ND4.0 ND0.09 -PCB-1232 (AROCLOR-1232) (µg/L) 0.001 - ND6.8 ND0.16 -PCB-1248 (AROCLOR-1248) (µg/L) 0.001 - ND3.5 ND0.16 -PCB-1260 (AROCLOR-1260) (µg/L) 0.001 - ND2.9 ND0.25 -PCB-1016 (AROCLOR-1016) (µg/L) 0.001 - ND3.3 ND0.10 -Toxaphene (µg/L) 0.005 - ND10 ND5.08 -Note:Results higher than SWQ are shown in red font. Non-detectable results with the Method Detection Limit (MDL) above the SWQS are shown as ND with the MDL in parentheses.1 - Partial Body Contact (PBC), Aquatic & Wildlife ephemeral (A&We) or Agricultural Livestock watering (AgL).2 - Surface Water Quality Standards (A.A.C R18-11-101 through Appendix B) selected from lowest of PBC, A&We or AgL.3 - Average flow rate during the sampling event. m3/s = meters cubed per second.4 - Hardness of sample event is used to calculate SWQS for Cadmium, Chromium, Copper, Lead, Nickel, Sliver, and Zinc.5 - mg/l = milligram per liter6 - µg/L = micrograms per liter7 - CFU/100 ml = colony forming unit per 100 milliliters, MPN = Most probable number per 100 ml8 - SWQS for Total Metals are denoted with "T". SWQS for Dissolved Metal for A&We are denoted with a "D".9 - Volatile Organic Compounds10 - Dash means information unavailable (ie. SWQS was not established or sample was not collected).11 - Total of α-BHC, β-BHC, γ-BHC, δ-BHC.12 - Refer to Appendix Part 13O for Analytical Laboratory Reports
Pima County 2013 Annual Report. Part 9
AZPDES Permit No. AZS000002 Page 2 of 2
(This page is intentionally blank).
Pima County 2013 Annual Report. Part 10
AZPDES Permit No. AZS000002 Page 1 of 4
PART 10: ASSESSMENT OF MONITORING DATA
A. Stormwater Quality
Stormwater from all five sites were sampled in the fiscal year and all five sites were sampled for 134 compounds under the expanded list of parameters.
B. Surface Water Quality Standards (SWQS)
Analytical results from the sampling period were tabulated along with the applicable SWQS (Part 9). Results higher than SWQS are also reported (Table 10-1). Several parameters, namely Benzo(a)anthracene, Benzo(a)pyrene, Benzo(k)fluoranthene, Indeno(1,2,3-cd)pyrene, N-nitrosodi-methylamine, Aldrin, Dieldrin, Endrin, 7 PCBs and Toxaphene, have Method Detection Limits (MDLs) that are higher than the Surface Water Quality Standards established for the designated uses of the watersheds draining to the five monitor sites. The MDL used by the primary laboratory has been accepted by ADHS under laboratory license AZO159 for the associated methods, as shown in Appendix Q. MDLs are performed in accordance with 40 CFR, part 136 App.B. Any modification of this method is considered a major modification and may not be performed without permission from ADHS and Region 9 EPA. Also, as there was only a low level detection of a plasticizer for these samples, the concentrations are likely non-detectable at the level of the SWQS.
C. Pollutant Concentration Greater than Applicable SWQS
The concentration of dissolved copper was higher than SWQS for Sites 3, 4 and 5. The measured dissolved copper concentrations that were higher than the SWQS ranged from 4.66 to 41.2 μg/L during the last fiscal year. The total copper concentration for all five monitor sites ranged between 6.32 and 60.2 μg/L which means they were well below the SWQS of 500 μg/L for the designated used of Agriculture and Livestock watering. A literature review of copper concentration un runoff provides a frame work to compare ambient copper concentrations with those in urban runoff in Pima County and mining district streams. The ambient surface water quality is established by stream data from Cienega Creek, Davidson Canyon, and Harshaw Creek. Near the confluence of Cienega Creek and Davidson Canyon, the concentration of total copper ranged between 1.0 to 2.2 μg/l from stream samples collected between September 2008 and February 2012 (PAG, 2013). The natural background level of dissolved copper in the Harshaw Creek ranged between 2.01 and 3.59 μg/L (ADEQ, 2003). The runoff data from the five monitor sites shows the dissolved copper concentrations range from less than 1.0 to 61 μg/L since the new permit became effective in July 2011. During the previous permit the total copper concentrations ranged between 1 and 260 ug/L; The few concentrations higher than 100 μg/L were associated with Total Suspended Solids that were greater than 230 mg/L (PDEQ, 2011).
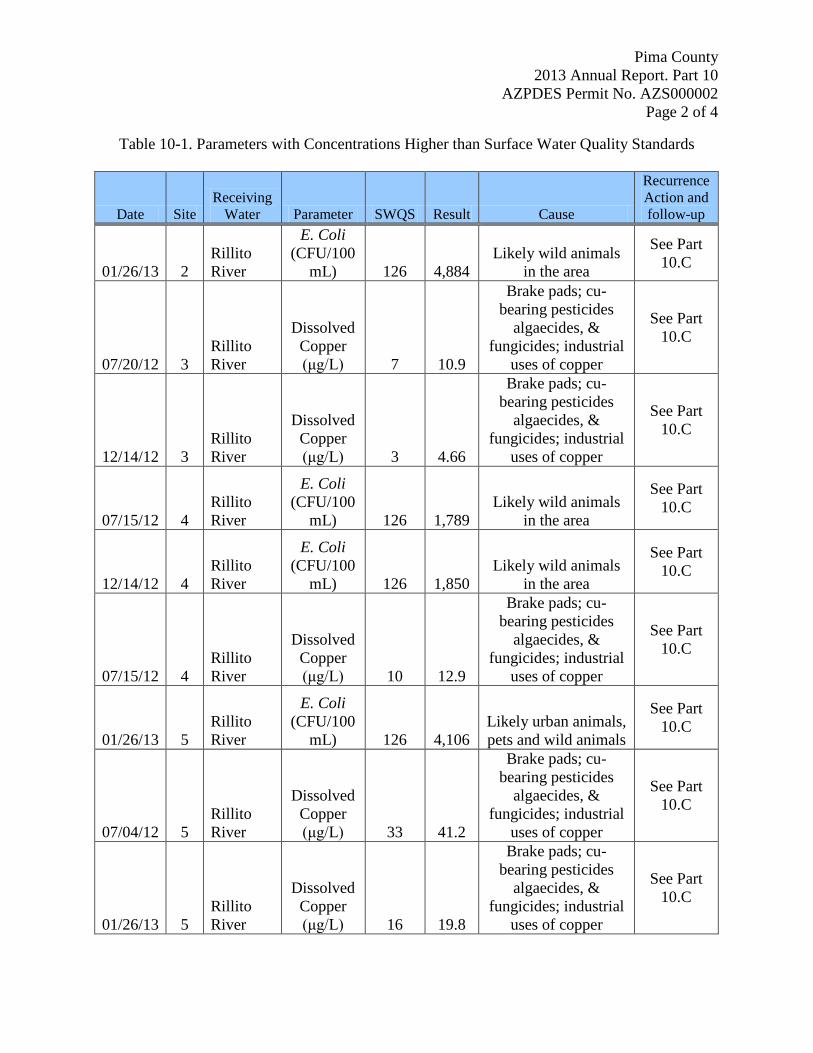
Pima County 2013 Annual Report. Part 10
AZPDES Permit No. AZS000002 Page 2 of 4
Table 10-1. Parameters with Concentrations Higher than Surface Water Quality Standards
Date Site Receiving
Water Parameter SWQS Result Cause
Recurrence Action and follow-up
01/26/13 2 Rillito River
E. Coli (CFU/100
mL) 126 4,884 Likely wild animals
in the area
See Part 10.C
07/20/12 3 Rillito River
Dissolved Copper (μg/L) 7 10.9
Brake pads; cu-bearing pesticides
algaecides, & fungicides; industrial
uses of copper
See Part 10.C
12/14/12 3 Rillito River
Dissolved Copper (μg/L) 3 4.66
Brake pads; cu-bearing pesticides
algaecides, & fungicides; industrial
uses of copper
See Part 10.C
07/15/12 4 Rillito River
E. Coli (CFU/100
mL) 126
1,789 Likely wild animals
in the area
See Part 10.C
12/14/12 4 Rillito River
E. Coli (CFU/100
mL) 126
1,850 Likely wild animals
in the area
See Part 10.C
07/15/12 4 Rillito River
Dissolved Copper (μg/L) 10 12.9
Brake pads; cu-bearing pesticides
algaecides, & fungicides; industrial
uses of copper
See Part 10.C
01/26/13 5 Rillito River
E. Coli (CFU/100
mL) 126
4,106 Likely urban animals, pets and wild animals
See Part 10.C
07/04/12 5 Rillito River
Dissolved Copper (μg/L) 33 41.2
Brake pads; cu-bearing pesticides
algaecides, & fungicides; industrial
uses of copper
See Part 10.C
01/26/13 5 Rillito River
Dissolved Copper (μg/L) 16 19.8
Brake pads; cu-bearing pesticides
algaecides, & fungicides; industrial
uses of copper
See Part 10.C
Pima County 2013 Annual Report. Part 10
AZPDES Permit No. AZS000002 Page 3 of 4
Additional data from mining areas in southern Arizona show the maximum dissolved copper concentration was 130 μg/L in the ASARCO Mission Complex (EPA, 2008) and was frequently above 250 μg/L in the mining districts in Alum Gulch and Humboldt Canyon (ADEQ, 2012). This analysis shows ambient dissolved copper concentrations range from 1.0 to 4 μg/L, while urban runoff ranges between 1 to 61 μg/L and mining areas are typically higher than 130 μg/L. Sources of copper in stormwater include vehicle brake pads; architectural copper; copper pesticides in landscaping, wood preservatives and pool, spa, and fountain algaecides; industrial copper use; deposition of air-borne copper emissions from fossil fuel combustion and industrial facilities; and vehicle fluid leaks and dumping (TDC Environmental, 2006). The Brake Pad Partnership showed brakes account for 35 to 60 percent of copper in California’s urban watershed runoff (Copper Development Association, 2013). A study of runoff from copper roofs and gutters shows first flush concentrations immediately downstream from the roof have a mean greater than 1340 ug/L for both total and dissolved copper (Michels, et al, 2001). This study noted roofs with the oxidation by-product brochantite release about half as much as cooper roofs exposed to air. The outreach program is being expanded to include vehicle maintenance for brake pads as well as using pads with lower concentrations of copper. Outreach is also being expanded to pool, spa, and fountain companies to find alternatives to copper-bearing pesticides, algaecides and fungicides or arrange for discharge to the sanitary sewer. Sites inspections of the drainage areas are underway to identify potential sources of copper. Inspections of industrial facilities currently include identification of metals sources, including copper, and development of alternatives to reduce exposure to rainfall and runoff.
The concentration of E. coli was higher than the SWQS for Sites 2, 4 and 5. The concentration of E. Coli ranged between 1,789 and 4,884 colony forming units (CFU) per 100 milliliters (mL). Sources of E. coli include wild animals and domestic pets. Wild animals have been sighted in urban areas traveling the washes. Pima County’s outreach program includes the Stoppin’ the Droppin’ campaign encouraging people to pick up after their pets. This campaign is well received and remains one the stormwater outreach’s primary messages.
D. References ADEQ, 2003. Total Maximum Daily Load for Upper Harshaw Creek, Sonoita Creek Basin,
Santa Cruz River Watershed. Coronado National Forest, near Patagonia, Santa Cruz County, Arizona, Publication number OFR-07-09.
ADEQ, 2012. 2010 Status of Water Quality, Arizona’s Integrated 305(b) Assessment and 303(d)
Listing Report. Publication number EQR-12-01.
Pima County 2013 Annual Report. Part 10
AZPDES Permit No. AZS000002 Page 4 of 4
Michels, H.T., B. Boulanger, N.P Nikolaidis, 2001. Copper Roof Stormwater Runoff – Corrosion and The Environment, downloaded on October 22, 2013 from the Copper Development Association Inc. website at http://www.copper.org/environment/impact/ NACE02225/.
PAG, 2013. Personal communication with Mead Mier, Water Specialist, Cienega Creek Natural
Preserve Water Quality Monitoring Laboratory Results. PDEQ, 2011. 14th Annual Report, National Pollutant Discharge Elimination System Stormwater
Discharge Permit No. AZS000002, Pima County, Arizona, October 2011. TDC Environmental, 2006. Copper Management Strategy, Development Resources, Final,
submitted to Clean Estuary Partnership, prepared by Larry Walker Associates, September, pp. 54.
Pima County 2013 Annual Report. Part 11
AZPDES Permit No. AZS000002 Page 1 of 6
PART 11: ESTIMATE OF ANNUAL POLLUTANT LOAD
A. Method of estimating Pollutant Load
Estimates of the annual pollutant loadings were calculated using the “Simple Method” (SMRC, 2012). The Simple Method uses analytical water quality data, precipitation and percent impervious cover to estimate pollutant loadings in urban areas. The data collected at five monitor points represent five land uses within the MS4, namely low density residential, medium density residential, high density residential, commercial, and industrial. Pima County calculated the annual pollutant load estimate for each Monitor Site and each land use category within the permit area. The following sections describe the methods Pima County used to calculate statistics and estimate the seasonal pollutant load. The results are presented and evaluated. The amount of pollutants are estimated by multiplying the volume of water that runs off from a precipitation event and the concentration of the pollutants. Runoff is estimated as a fraction of the precipitation based on the type of land use permeability. Pollutant concentration is measured by collecting the stormwater samples after a representative precipitation event occurs. The pollutant load equation is as follows:
L =P*Pf*Rc*C*A*0.0446 where
L = annual pollutant load (tons) P = annual precipitation (inches) Pf = annual precipitation fraction producing runoff (given a value of 0.9) Rc = runoff coefficient (unitless)
C = concentration (event mean) of a pollutant (mg/L) A = area of catchment draining to sample point (acres) 0.0446 = correction factor for measurement units The parameters in the equation above are defined as follows:
• Pollutant load (L) is the estimate of total amount of a specific pollutant discharged per time period for the drainage area of each monitor site. Time periods employed for this report were annual and seasonal (winter and summer).
• Annual Precipitation1 (P) is the total inches of rainfall occurring during the reporting
period July 1, 2012 to June 30, 2013. Anaylsis of available rainfall data for the Tucson metropolitan area shows approximately 52% (or 13.17 cm) of the annual rainfall occurs
1 The use of average rainfall data for pollutant load calculations de-emphasizes the effect of spatial rainfall variability. This, in turn, makes aggregation of pollutant load estimates less reliable.
Pima County 2013 Annual Report. Part 11
AZPDES Permit No. AZS000002 Page 2 of 6
during the summer season and 48% (or 12.16 cm) of the annual rainfall occurs during the winter season.
• Annual Precipitation fraction2 (Pf) is an adjustment factor for the number of storm
events producing measurable runoff. A typical value for this fraction is 0.9 (USEPA, 1992).
• Runoff coefficient (Rc) is a relative measure of imperviousness, or the percentage of
rainfall that becomes surface runoff (EPA, 1992). The following equation was used to calculate “R” values for each representative land use category associated with an outfall (EPA, 1992):
R = 0.05 + 0.9*Ia where Ia is the percent impervious area within the drainage area of each monitor site.
• Event-mean concentration3 (C) of a pollutant is the flow-weighted average of the pollutant concentration for the summer monsoon sample and the winter rain sample.
C = Fs/(Fs+Fw)*Cs + Fw/(Fs +Fw)*Cw where Fs = Flow during summer sample Fw = Flow during winter sample Cs = Concentration of summer sample Cw = Concentration of winter sample • Area (A) is the area of the catchment draining to the sample point.
Parameters specific to each catchment, namely Ia, Rc and A were previously derived during preparation of the Sample and Analysis Plan (Pima County, 2012). The “Simple Method” transforms a complex set of hydrological processes into an empirical equation. This equation is used to provide reasonable estimates of pollutant loads in storm water runoff (Ohrel, 2000). At the same time, by simplifying these processes, the level of uncertainty increases when attempting to distinguish the influences from runoff characteristics such as rainfall intensity, rainfall duration, runoff, first-flush effects concentrating pollutants, land use, and antecedent weather conditions.
2 A measured value is unavailable for the Sonoran Desert region so EPA’s standard value (EPA, 1992) was employed.
3 Analytical results for the monitored parameters ranged from one to five data points per pollutant. These limited data were used to calculate event-mean concentration (“emc”) values. As a result, pollutant load estimates may not be representative of the rainfall events, pollutants, outfalls, seasons, and/or land use categories.
Pima County 2013 Annual Report. Part 11
AZPDES Permit No. AZS000002 Page 3 of 6
Specifically, Schiff (1996) states that “[A]ssumptions based upon extrapolations to un-sampled storms introduces uncertainty because of flow-related variability.” For example, he notes the importance of capturing data from representative storm events. Collecting data from the largest storm of the year may result in disproportionately large event mean concentrations and would potentially overestimate un-sampled, smaller storms during the time period of interest. Similarly, capturing smaller storm events might underestimate the actual discharge for a given reporting period. Schiff asserts that “[T]he magnitude of bias associated with un-sampled storm events cannot be assessed” because monitoring programs do not often have sufficient temporal sampling procedures to adequately address the issue. Such is the case for Pima County’s monitoring program. This is due, in part, to the fact that the County’s program is not designed to measure annual pollutant loads at a specific site, or regional pollutant loads for a specific land use. According to Dixon and Chiswell (1996), most monitoring programs are instead designed to address regulatory compliance, identify sources of pollutants, and evaluate management actions such as the effectiveness of best management practices. Pima County’s program focuses on just such information needs. Schiff identifies the need to better understand the relationships of water quality to antecedent dry periods and rainfall intensity or duration (pollutant transport). Concepts such as “first flush” and “seasonal flushing” are examples of interactions that have yet to be adequately quantified. The following subsections provide seasonal pollutant load estimates for Pima County’s Monitoring sites and identified land use categories within the permit area.
B. Results of Calculations
Analytical results, annual rainfall, drainage area and imperviousness were used to calculate pollutant loads for the five monitor sites were tabulated (Table 11-1). No loadings were calculated for antimony, arsenic, mercury, selenium, silver and thallium as the concentrations were below the detection limits.
C. Evaluation of Results The pollutant load estimates4 should be used for comparative purposes only. For the reasons discussed in subsection 11.B, these values cannot be interpreted as representing actual pollutant loads for the watersheds within the permit area. Furthermore, it would be equally inappropriate to extrapolate these estimates in order to predict potential impacts to receiving water bodies.
4 The term “pollutant load estimate” does not have the same meaning as the term “pollutant load.” The Simple Method should only be used when estimates are desired and should not be used when load values are required (Ohrel, 2000).
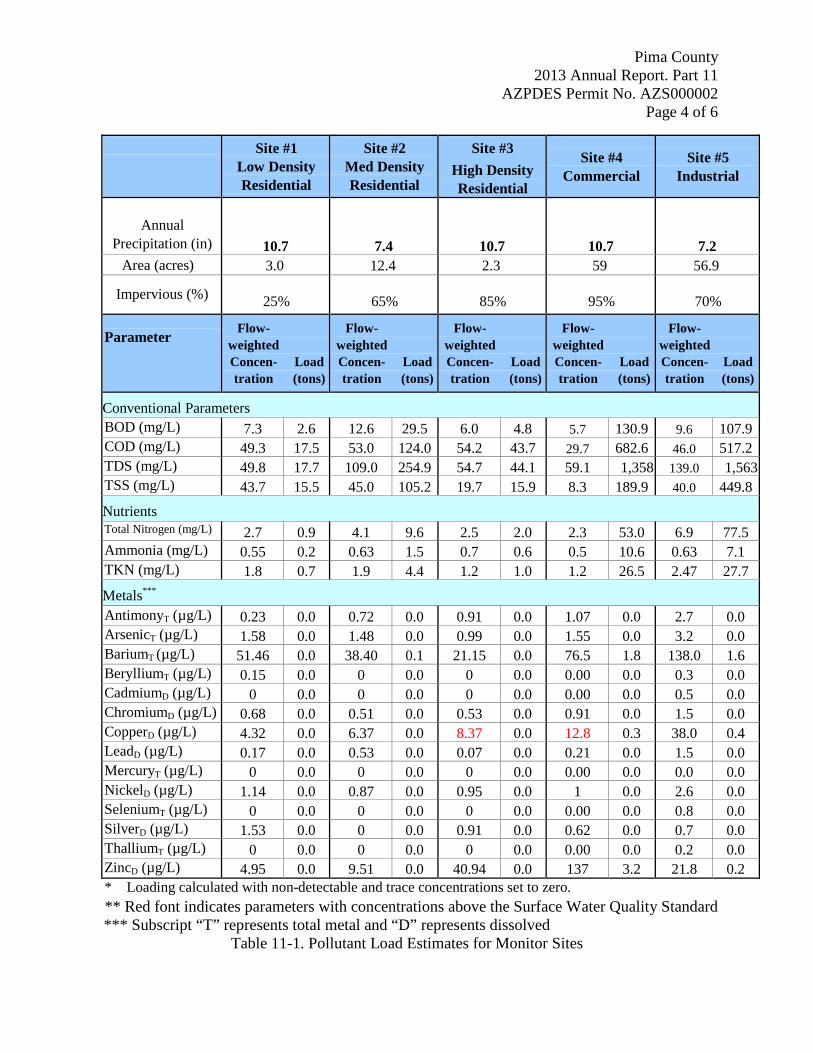
Pima County 2013 Annual Report. Part 11
AZPDES Permit No. AZS000002 Page 4 of 6
Site #1 Low Density Residential
Site #2 Med Density Residential
Site #3 High Density Residential
Site #4
Commercial
Site #5
Industrial
Annual
Precipitation (in) 10.7 7.4 10.7 10.7 7.2 Area (acres) 3.0 12.4 2.3 59 56.9
Impervious (%) 25%
65%
85%
95%
70%
Parameter Flow-
weighted Concen- Load tration (tons)
Flow- weighted Concen- Load tration (tons)
Flow- weighted Concen- Load tration (tons)
Flow- weighted Concen- Load tration (tons)
Flow- weighted Concen- Load tration (tons)
Conventional Parameters BOD (mg/L) 7.3 2.6 12.6 29.5 6.0 4.8 5.7 130.9 9.6 107.9 COD (mg/L) 49.3 17.5 53.0 124.0 54.2 43.7 29.7 682.6 46.0 517.2 TDS (mg/L) 49.8 17.7 109.0 254.9 54.7 44.1 59.1 1,358 139.0 1,563 TSS (mg/L) 43.7 15.5 45.0 105.2 19.7 15.9 8.3 189.9 40.0 449.8
Nutrients Total Nitrogen (mg/L) 2.7 0.9 4.1 9.6 2.5 2.0 2.3 53.0 6.9 77.5 Ammonia (mg/L) 0.55 0.2 0.63 1.5 0.7 0.6 0.5 10.6 0.63 7.1 TKN (mg/L) 1.8 0.7 1.9 4.4 1.2 1.0 1.2 26.5 2.47 27.7
Metals*** AntimonyT (µg/L) 0.23 0.0 0.72 0.0 0.91 0.0 1.07 0.0 2.7 0.0 ArsenicT (µg/L) 1.58 0.0 1.48 0.0 0.99 0.0 1.55 0.0 3.2 0.0 BariumT (µg/L) 51.46 0.0 38.40 0.1 21.15 0.0 76.5 1.8 138.0 1.6 BerylliumT (µg/L) 0.15 0.0 0 0.0 0 0.0 0.00 0.0 0.3 0.0 CadmiumD (µg/L) 0 0.0 0 0.0 0 0.0 0.00 0.0 0.5 0.0 ChromiumD (µg/L) 0.68 0.0 0.51 0.0 0.53 0.0 0.91 0.0 1.5 0.0 CopperD (µg/L) 4.32 0.0 6.37 0.0 8.37 0.0 12.8 0.3 38.0 0.4 LeadD (µg/L) 0.17 0.0 0.53 0.0 0.07 0.0 0.21 0.0 1.5 0.0 MercuryT (µg/L) 0 0.0 0 0.0 0 0.0 0.00 0.0 0.0 0.0 NickelD (µg/L) 1.14 0.0 0.87 0.0 0.95 0.0 1 0.0 2.6 0.0 SeleniumT (µg/L) 0 0.0 0 0.0 0 0.0 0.00 0.0 0.8 0.0 SilverD (µg/L) 1.53 0.0 0 0.0 0.91 0.0 0.62 0.0 0.7 0.0 ThalliumT (µg/L) 0 0.0 0 0.0 0 0.0 0.00 0.0 0.2 0.0 ZincD (µg/L) 4.95 0.0 9.51 0.0 40.94 0.0 137 3.2 21.8 0.2 * Loading calculated with non-detectable and trace concentrations set to zero. ** Red font indicates parameters with concentrations above the Surface Water Quality Standard
*** Subscript “T” represents total metal and “D” represents dissolved Table 11-1. Pollutant Load Estimates for Monitor Sites
Pima County 2013 Annual Report. Part 11
AZPDES Permit No. AZS000002 Page 5 of 6
In this regard, qualitative comparisons may be made between outfalls and parameters. The largest load estimates are observed in catchments with larger areas, namely those draining to monitor sites #4 and #5. These catchments also have the largest Chemical Oxygen Demand (COD), Total Dissolved Solids (TDS), and Total Suspended Solids (TSS) compared to the other catchments. The smallest load estimates are observed in the smallest catchments, namely those draining to monitor sites #1 and #3. The smallest loading estimates are observed in the metals.
D. Limitations of Pollutant Load Estimation Results The “Simple Method” is an arithmetic equation based on empirical relationships for complex hydrological processes and average pollutant concentrations in storm water runoff. This method can be used to obtain quick and reasonable storm water pollutant load estimates (Ohrel, 2000), but should only be used for planning-level calculations or identifying data-collection needs. Numerical results presented in Table 11-1 are pollutant load estimates. Employing event mean concentrations derived from first flush data may result in calculated pollutant load estimates that are higher that the remaining rainfall events. This type of analysis can be misleading when evaluating potential environmental effects from non-point sources (Silverman et al, 1986). Rainfall events in southern Arizona are sporadic, with loads concentrated into limited periods of time during and after precipitation. Specifically, flow-related variability may introduce uncertainties when extrapolating from sampled to un-sampled rainfall events. Schiff (1996) uses the example of overestimation for data collected from large storms, versus underestimation for data collected from smaller storm events. In the absence of a sufficient temporal sampling program, the error level associated with un-sampled storm events can be substantial, especially when the un-sampled storm events follow the first flush event. Estimation errors may also be introduced when using average seasonal precipitation values to calculate pollutant loads. For example, smaller runoff volumes (due to low intensity or short duration rainfall events accompanied by extended antecedent dry periods) may produce disproportionately higher pollutant concentrations per sampling event. Alternatively, dilution from large volume runoffs (accompanied by shorter antecedent dry periods) may produce lower pollutant concentrations per sampling event. Given that the average seasonal precipitation values might not be representative of a specific storm, calculated values for the estimated pollutant loads might in turn be questionable. Additionally, the monitoring program was not specifically designed to measure pollutant loads. As a result, phenomena such as pollutant build-up, first flush of pollutants, rainfall intensity, duration, and seasonal flushing of pollutants are not adequately addressed by the County’s current monitoring program. These phenomena are an unavoidable consequence of the weather conditions and climatology of southern Arizona.
Pima County 2013 Annual Report. Part 11
AZPDES Permit No. AZS000002 Page 6 of 6
E. References
Dixon, W. and B. Chiswell. 1996. Review of Aquatic Monitoring Program Design. Water
Research, vol. 30, no. 9, pp. 1935-1948. Ohrel, Ron. 2002. Simple and Complex Stormwater Pollutant Load Models Compared,
technical note from Watershed Protection Techniques, 2(2): 364-368. in: The Practice of Watershed Protection, edited by Thomas R. Schueler and Heather K. Holland, Center for Watershed Protection.
Pima County, Arizona, 2011. Municipal Separate Storm Sewer System AZPDES Permit No.
AZS000002. Pima County, Arizona. 2012. Sampling and Analysis Plan for Stormwater Management
Program, Pima County Department of Environmental Quality, pp 9-15. Schiff, Kenneth. 1996. Review of Existing Stormwater Monitoring Programs for Estimating
Bight-Wide Mass Emissions from Urban Runoff. in: Southern California Coastal Water Research Project Annual Report -- 1996, Southern California Coastal Water Research Project.
Silverman, Gary S., Michael K. Stenstrom, and Sami Fam. 1986. Best Management Practices
for Controlling Oil and Grease in Urban Stormwater Runoff. The Environmental Professional, vol. 8, pp. 351-362.
SMRC, 2012. The Simple Method to Calculate Urban Stormwater Loads, downloaded on
October 1, 2012 from the Stormwater Manager’s Resource Center website at http://www.stormwatercenter.net/.
U.S. Environmental Protection Agency. 1992. Guidance Manual For The Preparation Of Part
2 Of The NPDES Permit Applications For Discharges From Municipal Separate Storm Sewer Systems. Office of Water (EN-336), EPA 833-B-92-002. November.
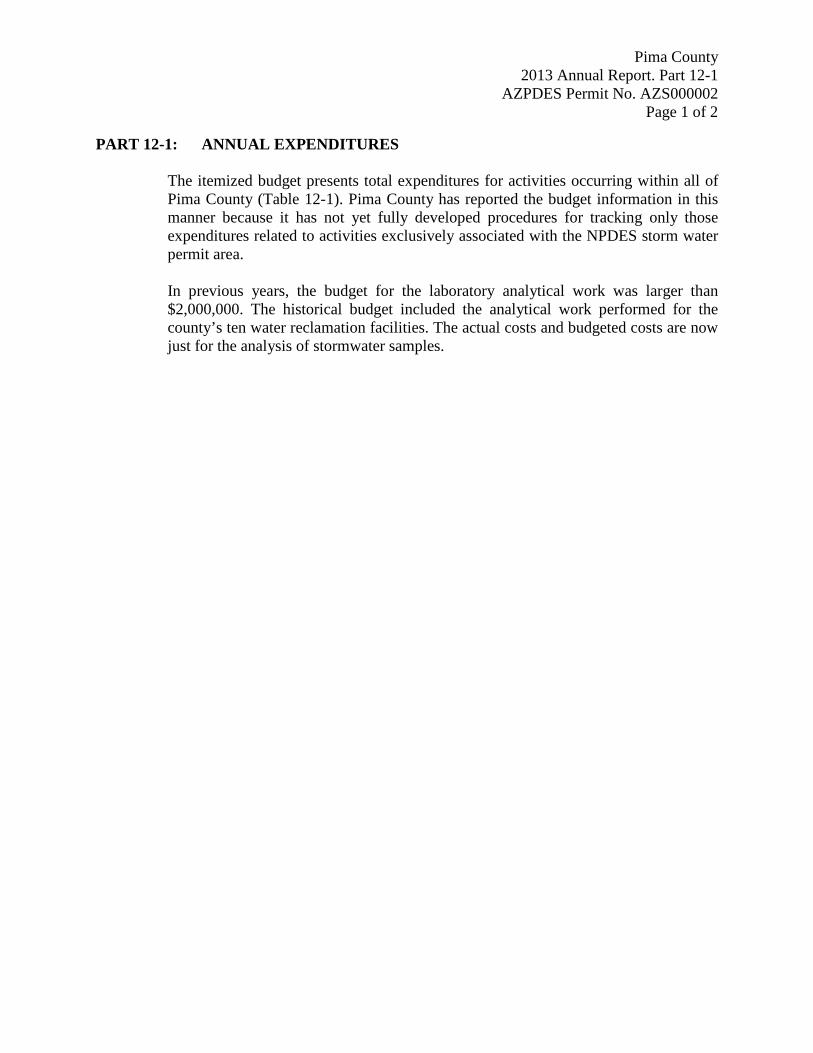
Pima County 2013 Annual Report. Part 12-1
AZPDES Permit No. AZS000002 Page 1 of 2
PART 12-1: ANNUAL EXPENDITURES The itemized budget presents total expenditures for activities occurring within all of Pima County (Table 12-1). Pima County has reported the budget information in this manner because it has not yet fully developed procedures for tracking only those expenditures related to activities exclusively associated with the NPDES storm water permit area. In previous years, the budget for the laboratory analytical work was larger than $2,000,000. The historical budget included the analytical work performed for the county’s ten water reclamation facilities. The actual costs and budgeted costs are now just for the analysis of stormwater samples.
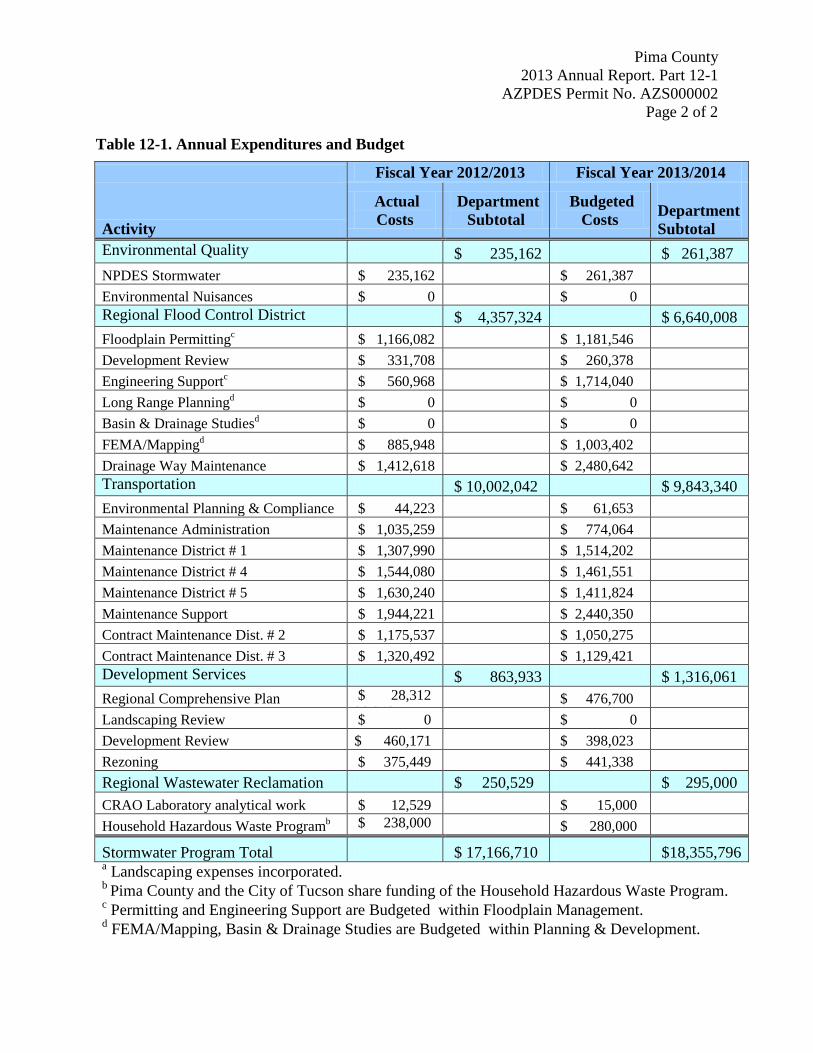
Pima County 2013 Annual Report. Part 12-1
AZPDES Permit No. AZS000002 Page 2 of 2
Table 12-1. Annual Expenditures and Budget
Fiscal Year 2012/2013 Fiscal Year 2013/2014
Activity
Actual Costs
Department Subtotal
Budgeted Costs
Department Subtotal
Environmental Quality $ 235,162 $ 261,387 NPDES Stormwater $ 235,162 $ 261,387 Environmental Nuisances $ 0 $ 0 Regional Flood Control District $ 4,357,324 $ 6,640,008 Floodplain Permittingc $ 1,166,082 $ 1,181,546 Development Review $ 331,708 $ 260,378 Engineering Supportc $ 560,968 $ 1,714,040 Long Range Planningd $ 0 $ 0 Basin & Drainage Studiesd $ 0 $ 0 FEMA/Mappingd $ 885,948 $ 1,003,402 Drainage Way Maintenance $ 1,412,618 $ 2,480,642 Transportation $ 10,002,042 $ 9,843,340 Environmental Planning & Compliance $ 44,223 $ 61,653 Maintenance Administration $ 1,035,259 $ 774,064 Maintenance District # 1 $ 1,307,990 $ 1,514,202 Maintenance District # 4 $ 1,544,080 $ 1,461,551 Maintenance District # 5 $ 1,630,240 $ 1,411,824 Maintenance Support $ 1,944,221 $ 2,440,350 Contract Maintenance Dist. # 2 $ 1,175,537 $ 1,050,275 Contract Maintenance Dist. # 3 $ 1,320,492 $ 1,129,421 Development Services $ 863,933 $ 1,316,061 Regional Comprehensive Plan $ 28,312
28 312 $ 476,700
Landscaping Review $ 0 $ 0 Development Review $ 460,171 $ 398,023 Rezoning $ 375,449 $ 441,338 Regional Wastewater Reclamation $ 250,529 $ 295,000 CRAO Laboratory analytical work $ 12,529 $ 15,000 Household Hazardous Waste Programb $ 238,000
35 000 $ 280,000
Stormwater Program Total $ 17,166,710 $18,355,796 a Landscaping expenses incorporated. b Pima County and the City of Tucson share funding of the Household Hazardous Waste Program. c Permitting and Engineering Support are Budgeted within Floodplain Management. d FEMA/Mapping, Basin & Drainage Studies are Budgeted within Planning & Development.