Embed Size (px)
Citation preview
Fact Sheet for NPDES Permit Renewal, Western Regional Water Reclamation Facility, 2015
-1-
National Pollutant Discharge Elimination System (NPDES) Permit Program
FACT SHEET
Regarding an NPDES Permit To Discharge to Waters of the State of Ohio for the Western Regional Water Reclamation Facility
(Revised 11/24/15) Public Notice No.: 15-08-018 Ohio EPA Permit No.: 1PL00002*ND Public Notice Date: August 7, 2015 Application No.: OH0026638 Comment Period Ends: September 7, 2015 Name and Address of Facility Where Name and Address of Applicant: Discharge Occurs: Montgomery County Board of Commissioners Western Regional Water Reclamation Facility 451 West Third Street 4111 Hydraulic Road Dayton, Ohio 45422 West Carrollton, Ohio Montgomery County Receiving Water: Great Miami River Subsequent Stream Network: Ohio River Introduction Development of a Fact Sheet for NPDES permits is mandated by Title 40 of the Code of Federal Regulations (CFR), Section 124.8 and 124.56. This document fulfills the requirements established in those regulations by providing the information necessary to inform the public of actions proposed by the Ohio Environmental Protection Agency (Ohio EPA), as well as the methods by which the public can participate in the process of finalizing those actions. This Fact Sheet is prepared in order to document the technical basis and risk management decisions that are considered in the determination of water quality based NPDES Permit effluent limitations. The technical basis for the Fact Sheet may consist of evaluations of promulgated effluent guidelines, existing effluent quality, instream biological, chemical and physical conditions, and the relative risk of alternative effluent limitations. This Fact Sheet details the discretionary decision-making process empowered to the Director by the Clean Water Act (CWA) and Ohio Water Pollution Control Law (Ohio Revised Code [ORC] 6111). Decisions to award variances to Water Quality Standards (WQS) or promulgated effluent guidelines for economic or technological reasons will also be justified in the Fact Sheet where necessary. Effluent limits based on available treatment technologies are required by Section 301(b) of the Clean Water Act. Many of these have already been established by the United States EPA (U.S. EPA) in the effluent guideline regulations (a.k.a. categorical regulations) for industry categories in 40 CFR Parts 405-499. Technology-based regulations for publicly-owned treatment works are listed in the Secondary Treatment Regulations (40 CFR Part 133). If regulations have not been established for a category of dischargers, the director may establish technology-based limits based on best professional judgment (BPJ). An antidegradation review was not required. Ohio EPA reviews the need for water-quality-based limits on a pollutant-by-pollutant basis. Wasteload allocations (WLAs) are used to develop these limits based on the pollutants that have been detected in the discharge, and the receiving water’s assimilative capacity. The assimilative capacity depends on the flow in the
Fact Sheet for NPDES Permit Renewal, Western Regional Water Reclamation Facility, 2015
-2-
water receiving the discharge, and the concentration of the pollutant upstream. The greater the upstream flow, and the lower the upstream concentration, the greater the assimilative capacity is. Assimilative capacity may represent dilution (as in allocations for metals), or it may also incorporate the break-down of pollutants in the receiving water (as in allocations for oxygen-demanding materials). The need for water-quality-based limits is determined by comparing the WLA for a pollutant to a measure of the effluent quality. The measure of effluent quality is called Projected Effluent Quality (PEQ). This is a statistical measure of the average and maximum effluent values for a pollutant. As with any statistical method, the more data that exists for a given pollutant, the more likely that PEQ will match the actual observed data. If there is a small data set for a given pollutant, the highest measured value is multiplied by a statistical factor to obtain a PEQ; for example if only one sample exists, the factor is 6.2, for two samples - 3.8, for three samples - 3.0. The factors continue to decline as samples sizes increase. These factors are intended to account for effluent variability, but if the pollutant concentrations are fairly constant, these factors may make PEQ appear larger than it would be shown to be if more sample results existed. Summary of Permit Conditions The effluent limits and monitoring requirements proposed for the following parameters are the same as in the current permit, although some monitoring frequencies may have changed: ammonia-nitrogen, cadmium, CBOD5, chlorine (total residual), chromium (dissolved), chromium (TR), copper, cyanide (free), dissolved oxygen, flow, lead, mercury, nickel, nitrite+nitrate-nitrogen, oil and grease, pH, temperature, total filterable residue (total dissolved solids), total Kjeldahl nitrogen, total suspended solids, and zinc. The weekly average limit for Escherichia coli is proposed to increase to a value derived from the average water quality standard. This increase meets an exception to the antibacksliding rule and is not subject to the antidegradation rule. Annual chronic toxicity monitoring with the determination of acute endpoints is proposed for years one through four of the permit. This satisfies the minimum testing requirements of OAC 3754-33-07(B)(11) for whole effluent toxicity (WET) and will adequately characterize toxicity in the plant’s effluent. New monitoring is proposed for dissolved orthophosphate (as P). This monitoring is required by Ohio Senate Bill 1, which was signed by the Governor on April 2, 2015. Monitoring for orthophosphate is proposed to further develop nutrient datasets for dissolved reactive phosphorus and to assist stream and watershed assessments and studies. Ohio EPA monitoring, as well as other in-stream monitoring, is taken via grab sample, orthophosphate is proposed to be collected by grab sample to maintain consistent data to support watershed and stream surveys. Monitoring will be done by grab sample, which must be filtered within 15 minutes of collection using a 0.45-micron filter. The filtered sample must be analyzed within 48 hours. The permittee is required to begin using one of the approved methods for monitoring free cyanide: - ASTM D7237-10 and OIA-1677-09 - Flow injection followed by gas diffusion amperometry. A new monitoring station, 602, is proposed for the plant’s tertiary filter bypass. The bypass is activated manually by plant operators when necessary to route high flows around the filters. The bypassed flow has received full biological treatment and is blended with the plant effluent prior to monitoring at station 001. Reporting of 24-hour total flow is proposed. It is proposed that discharges through this station not be subject to the bypass prohibition provisions at 40 CFR 122.41(m). Monitoring for barium has been deleted from the permit because an evaluation of effluent monitoring data shows that it does not pose an environmental hazard.
Fact Sheet for NPDES Permit Renewal, Western Regional Water Reclamation Facility, 2015
-3-
In Part II of the permit, special conditions are included that address sanitary sewer overflow (SSO) reporting; operator certification, minimum staffing and operator of record; whole effluent toxicity (WET) testing; outfall signage; and pretreatment program requirements.
Addressing nutrient-related impairment in the lower Great Miami River (GMR) Ohio EPA is proposing an adaptive management approach to addressing the nutrient-related impairment in the lower GMR. Adaptive management is an iterative process that involves implementing certain controls to reduce pollutant loads, allowing time to evaluate the effectiveness of the controls and obtain additional information, and then using this new knowledge to guide the next implementation step. Issuing new NPDES permits to the major municipal wastewater treatment plants (WWTP) is the first step in the process to eliminate impairment in the lower GMR. These permit renewals include: For the Dayton and Montgomery County Western Regional WWTPs – A seasonal aggregate total phosphorus loading limit that applies for the period July through October. The limit was calculated using the plant’s median seasonal flow for the years 2010 through 2014 and a total phosphorus concentration of 1 mg/l. The permits allow 36 months for the plants to meet the seasonal loading limit. These two plants are the largest and most upstream discharges of the lower Great Miami River watershed and contribute to a significant increase in the total phosphorus concentrations, dissolved oxygen swings and chlorophyll-a values in the river. For the other major WWTPs – Continued monitoring of total phosphorus in their effluent as well as upstream and downstream of their discharges. These plants also must develop a study that evaluates the technical and financial capability of their existing treatment facilities to reduce total phosphorus to 1 mg/l or lower. This study is required by Ohio Senate Bill 1, which was signed by the Governor on April 2, 2015. The study must be submitted to Ohio EPA by December 1, 2017. Ohio EPA is implementing this Ohio Senate Bill 1 requirement outside of NPDES permits. Instead, Ohio EPA will send a letter instructing all applicable facilities how to comply with the evaluation study required by Ohio Senate Bill 1. Ohio EPA is working with Ohio Department of Natural Resources and representatives of the Joint Board of the Soil Water Conservation Districts to identify areas for concentrating efforts to reduce agricultural runoff to streams. This effort includes site selection; installing best management practices; and measuring the baseline and success of the practices. If the river has not returned to full attainment, the next NPDES permit renewals may be informed by an Ohio EPA-approved integrated management plan prepared by the lower GMR dischargers and/or an approved TMDL prepared by Ohio EPA. If supported by these or other applicable reports, the permittees may propose using alternate reduction strategies to achieve future phosphorus reductions. The strategies could include point source-nonpoint source trading, point source-point source trading, habitat restoration offsets, physical watershed alterations and other approved nutrient management/reduction strategies.
Fact Sheet for NPDES Permit Renewal, Western Regional Water Reclamation Facility, 2015
-4-
Table of Contents Page Introduction ................................................................................................................................................... 1
Summary of Permit Conditions ..................................................................................................................... 2
Procedures for Participation in the Formulation of Final Determinations .................................................... 6
Location of Discharge/Receiving Water Use Classification ......................................................................... 8
Facility Description ....................................................................................................................................... 8
Description of Existing Discharge ................................................................................................................ 9
Assessment of Impact on Receiving Waters ................................................................................................. 9
Development of Water-Quality-Based Effluent Limits .............................................................................. 10
Reasonable Potential/ Effluent Limits/Hazard Management Decisions ..................................................... 12
Other Requirements .................................................................................................................................... 14
List of Figures Figure 1. Location of Western Regional WWTP ....................................................................................... 16
Figure 2. Great Miami River Study Area (not to scale) ............................................................................. 17
List of Tables
Table 1. Sludge Removed from Western Regional WWTP 2009-2014 .................................................... 19 Table 2. Effluent Flow Rates for Outfall 1PL00002001 2009-2014 (in MGD) ......................................... 19 Table 3. Effluent Characterization Using Ohio EPA and Pretreatment Data ............................................. 20 Table 4. Effluent Characterization Using Self-Monitoring Data ............................................................... 21 Table 5. Projected Effluent Quality Values ............................................................................................... 22 Table 6. Summary of Toxicity Test Results ............................................................................................... 23 Table 7. A Summary of the Great Miami River Mainstem Use Designation Status and Causes/Sources of Impairment, 2009-10 Surveys ..................................................................................................................... 24 Table 8. Water Quality Criteria in the Great Miami River Study Area ..................................................... 25 Table 9. Instream Conditions and Discharger Flow ................................................................................... 27 Table 10. Summary of Effluent Limits to Maintain Applicable Water Quality Criteria ........................... 32
Fact Sheet for NPDES Permit Renewal, Western Regional Water Reclamation Facility, 2015
-5-
Table 11. Parameter Assessment ................................................................................................................ 33 Table 12. Final Effluent Limits and Monitoring Requirements ................................................................. 34 Addendum 1 ................................................................................................................................................ 36
Fact Sheet for NPDES Permit Renewal, Western Regional Water Reclamation Facility, 2015
-6-
Procedures for Participation in the Formulation of Final Determinations The draft action shall be issued as a final action unless the Director revises the draft after consideration of the record of a public meeting or written comments, or upon disapproval by the Administrator of the U.S. Environmental Protection Agency. Within thirty days of the date of the Public Notice, any person may request or petition for a public meeting for presentation of evidence, statements or opinions. The purpose of the public meeting is to obtain additional evidence. Statements concerning the issues raised by the party requesting the meeting are invited. Evidence may be presented by the applicant, the state, and other parties, and following presentation of such evidence other interested persons may present testimony of facts or statements of opinion. Requests for public meetings shall be in writing and shall state the action of the Director objected to, the questions to be considered, and the reasons the action is contested. Such requests should be addressed to:
Legal Records Section Ohio Environmental Protection Agency
P.O. Box 1049 Columbus, Ohio 43216-1049
Interested persons are invited to submit written comments upon the discharge permit. Comments should be submitted in person or by mail no later than 30 days after the date of this Public Notice. Deliver or mail all comments to:
Ohio Environmental Protection Agency Attention: Division of Surface Water
Permits Processing Unit P.O. Box 1049
Columbus, Ohio 43216-1049 The Ohio EPA permit number and Public Notice numbers should appear on each page of any submitted comments. All comments received no later than 30 days after the date of the Public Notice will be considered. Citizens may conduct file reviews regarding specific companies or sites. Appointments are necessary to conduct file reviews, because requests to review files have increased dramatically in recent years. The first 250 pages copied are free. For requests to copy more than 250 pages, there is a five-cent charge for each page copied. Payment is required by check or money order, made payable to Treasurer State of Ohio. For additional information about this fact sheet or the draft permit, contact either Gary Stuhlfauth at 614-644-2026, [email protected] or Matt Walbridge at 937-285-6095, [email protected] . Information Regarding Certain Water Quality Based Effluent Limits This draft permit may contain proposed water quality based effluent limitations for parameters that are not priority pollutants. (See the following link for a list of the priority pollutants: http://epa.ohio.gov/portals/35/pretreatment/Pretreatment_Program_Priority_Pollutant_Detection_Limits.pdf ). In accordance with Ohio Revised Code Section 6111.03(J)(3), the Director established these water quality based effluent limits after considering, to the extent consistent with the Federal Water Pollution Control Act, evidence relating to the technical feasibility and economic reasonableness of removing the polluting properties from those wastes and to evidence relating to conditions calculated to result from that action and their relation to benefits to the people of the state and to accomplishment of the purposes of this chapter. This determination was made based on data and information available at the time the permit was drafted, which included the contents of the
Fact Sheet for NPDES Permit Renewal, Western Regional Water Reclamation Facility, 2015
-7-
timely submitted National Pollutant Discharge Elimination System (NDPES) permit renewal application, along with any and all pertinent information available to the Director. This public notice allows the permittee to provide to the Director for consideration during this public comment period additional site-specific pertinent and factual information with respect to the technical feasibility and economic reasonableness for achieving compliance with the proposed final effluent limitations for these parameters. The permittee shall deliver or mail this information to:
Ohio Environmental Protection Agency Attention: Division of Surface Water
Permits Processing Unit P.O. Box 1049
Columbus, Ohio 43216-1049 Should the applicant need additional time to review, obtain or develop site-specific pertinent and factual information with respect to the technical feasibility and economic reasonableness of achieving compliance with these limitations, written notification for any additional time shall be sent to the above address no later than 30 days after the Public Notice Date on Page 1. Should the applicant determine that compliance with the proposed water quality based effluent limitations for parameters other than the priority pollutants is technically and/or economically unattainable, the permittee may submit an application for a variance to the applicable water quality standard(s) used to develop the proposed effluent limitation in accordance with the terms and conditions set forth in Ohio Administrative Code (OAC) Rule 3745-33-07(D). The permittee shall submit this application to the above address no later than 30 days after the Public Notice Date. Alternately, the applicant may propose the development of site-specific water quality standard(s) pursuant to OAC Rule 3745-1-35. The permittee shall submit written notification regarding their intent to develop site specific water quality standards for parameters that are not priority pollutants to the above address no later than 30 days after the Public Notice Date.
Fact Sheet for NPDES Permit Renewal, Western Regional Water Reclamation Facility, 2015
-8-
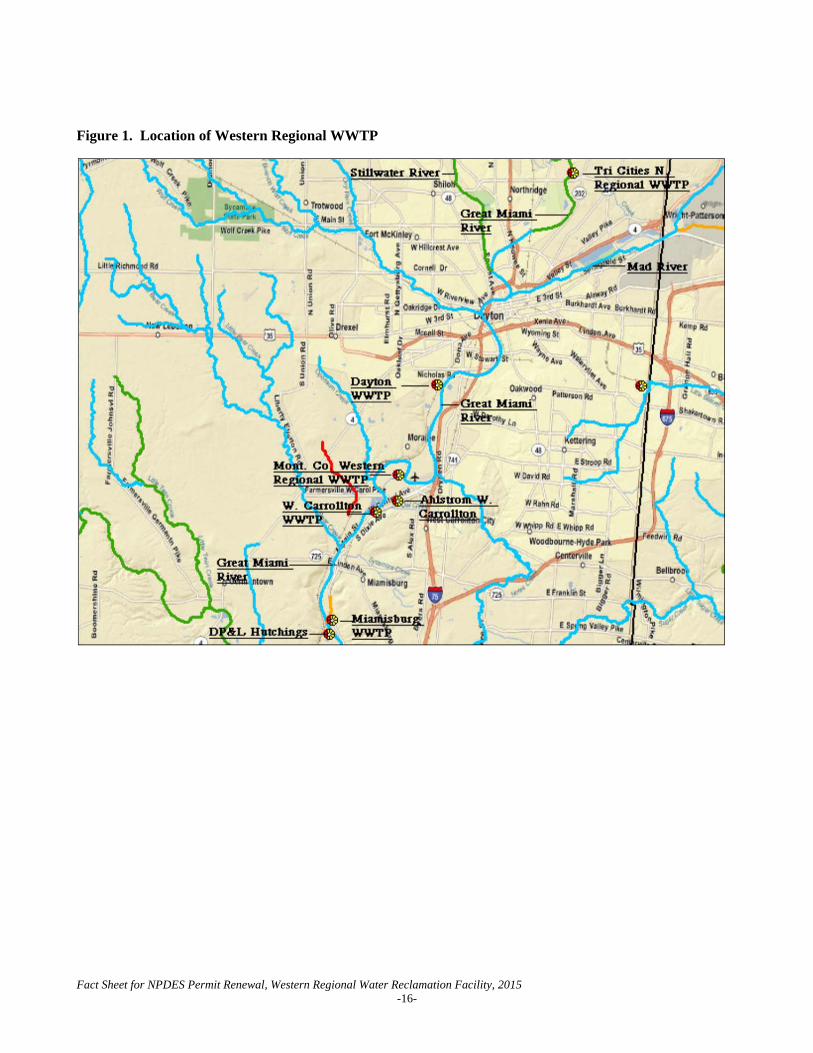
Location of Discharge/Receiving Water Use Classification The Western Regional Water Reclamation Facility discharges to the Great Miami River at River Mile (RM) 71.48. The approximate location of the facility is shown in Figure 1. This segment of the Great Miami River is described by Ohio EPA River Code: 14-001, U.S. EPA River Reach #: 05080002-009, County: Montgomery, Ecoregion: Eastern Corn Belt Plains. The Great Miami River is designated for the following uses under Ohio’s Water Quality Standards (OAC 3745-1-21): Warmwater Habitat (WWH), Agricultural Water Supply (AWS), Industrial Water Supply (IWS), and Primary Contact Recreation (PCR). Use designations define the goals and expectations of a waterbody. These goals are set for aquatic life protection, recreation use and water supply use, and are defined in the Ohio WQS (OAC 3745-1-07). The use designations for individual waterbodies are listed in rules -08 through -32 of the Ohio WQS. Once the goals are set, numeric WQS are developed to protect these uses. Different uses have different water quality criteria. Use designations for aquatic life protection include habitats for coldwater fish and macroinvertebrates, warmwater aquatic life and waters with exceptional communities of warmwater organisms. These uses all meet the goals of the federal CWA. Ohio WQS also include aquatic life use designations for waterbodies which cannot meet the CWA goals because of human-caused conditions that cannot be remedied without causing fundamental changes to land use and widespread economic impact. The dredging and clearing of some small streams to support agricultural or urban drainage is the most common of these conditions. These streams are given Modified Warmwater or Limited Resource Water designations. Recreation uses are defined by the depth of the waterbody and the potential for wading or swimming. Uses are defined for bathing waters, swimming/canoeing (Primary Contact) and wading only (Secondary Contact - generally waters too shallow for swimming or canoeing). Water supply uses are defined by the actual or potential use of the waterbody. Public Water Supply designations apply near existing water intakes so that waters are safe to drink with standard treatment. Most other waters are designated for agricultural and industrial water supply. Facility Description The Western Regional WWTP was originally constructed in 1978, and was most recently upgraded in 2011. The Western Regional WWTP facility is an advanced treatment facility with an average design flow of 20.0 million gallons per day (MGD). The treatment plant includes the following equipment and/or wet processes: • Influent pumping • Bar screen • Grit removal • Primary activated sludge aeration • Intermediate settling • Secondary activated sludge aeration • Final clarification • Tertiary filtration • Chlorination • Dechlorination The Western Regional plant has an internal bypass of its tertiary filters. The bypass is activated manually by plant operators when necessary to route high flows around the filters. The bypassed flow has received full
Fact Sheet for NPDES Permit Renewal, Western Regional Water Reclamation Facility, 2015
-9-
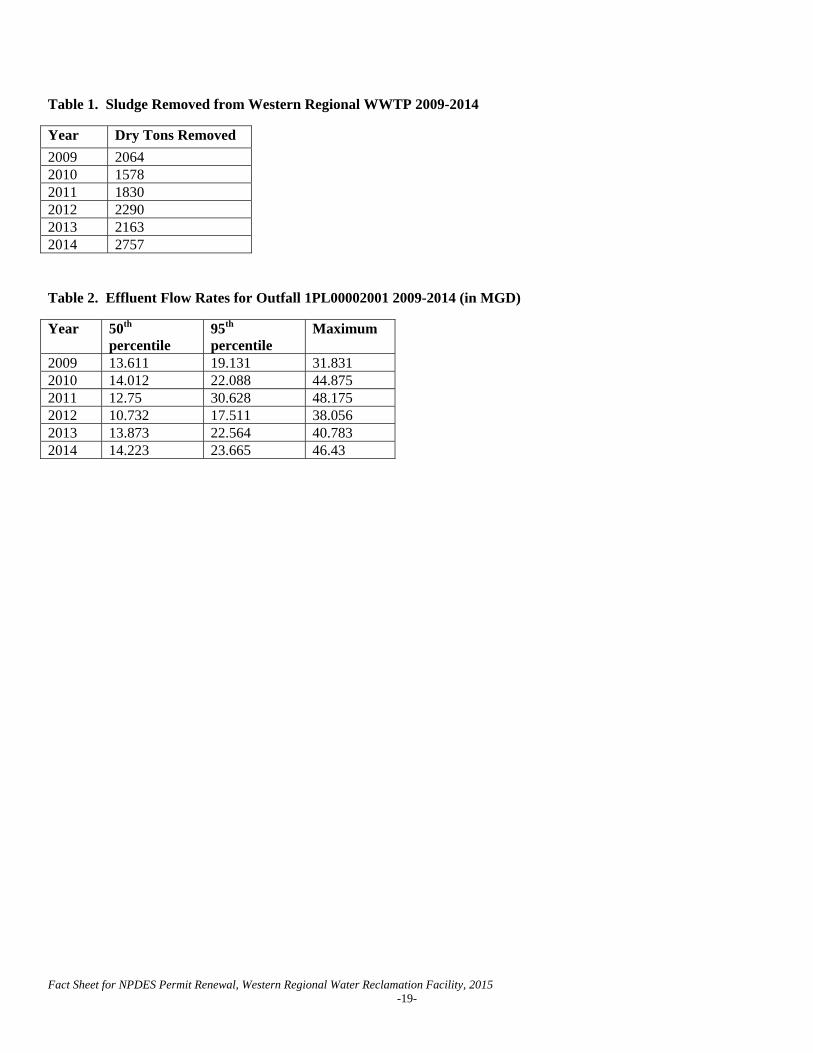
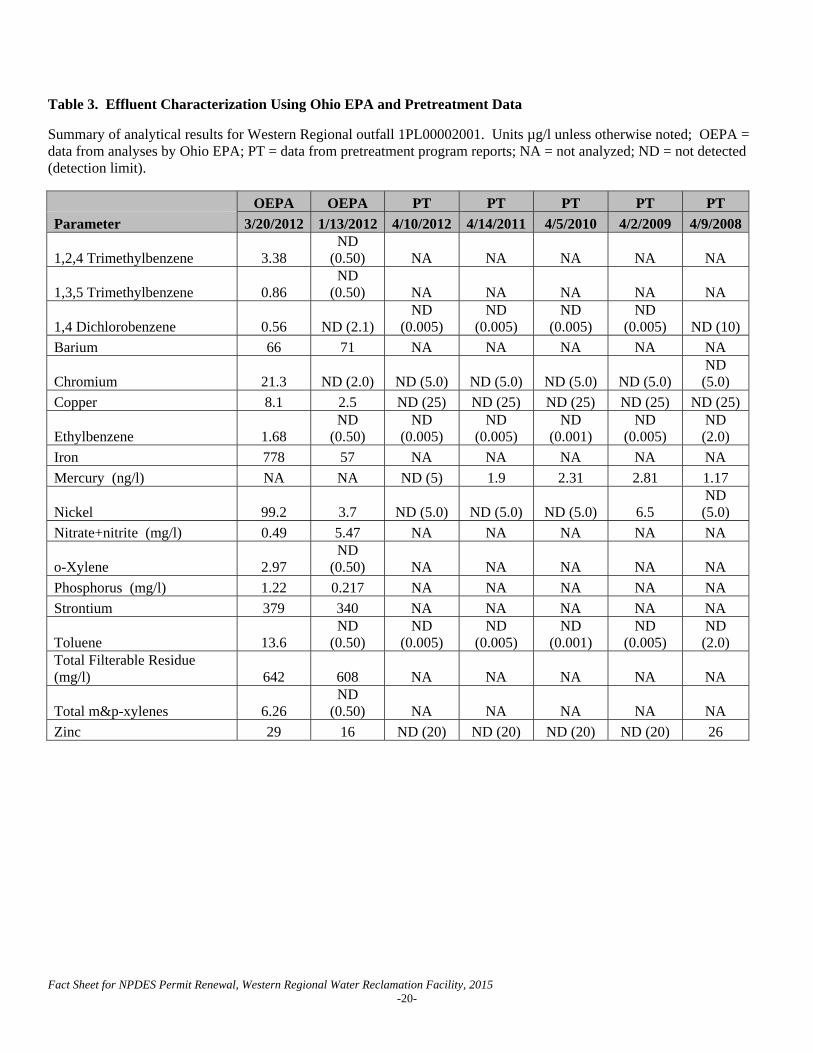
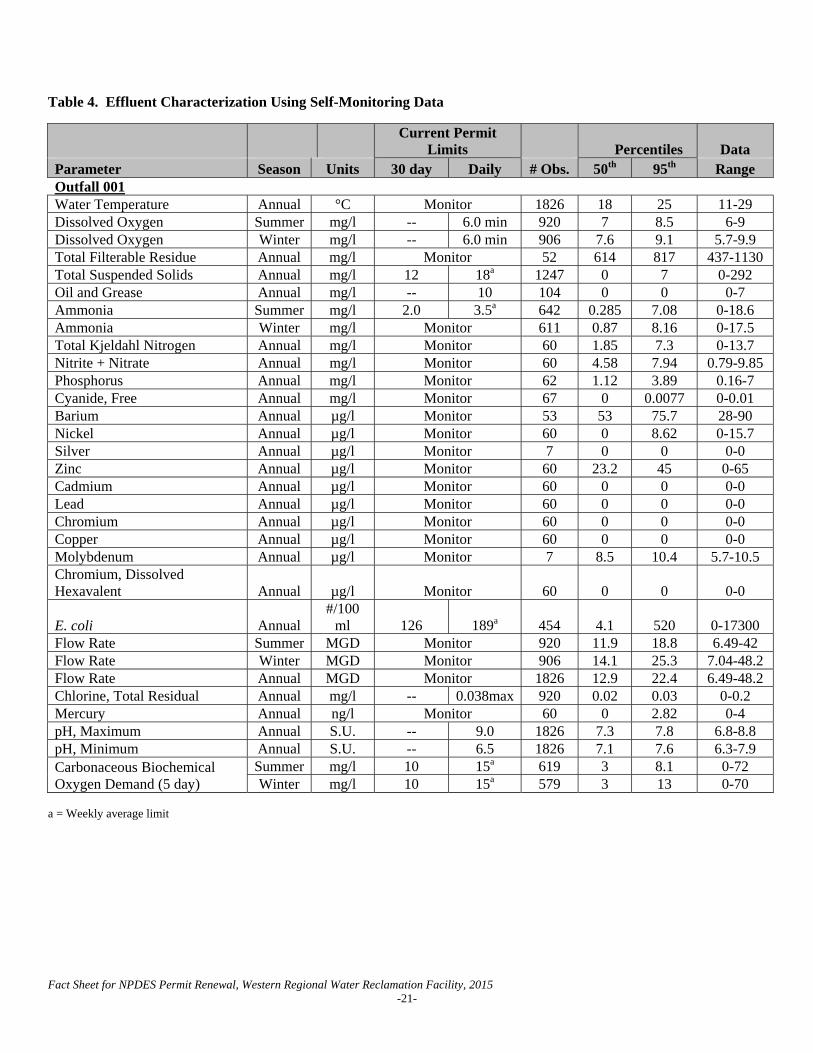
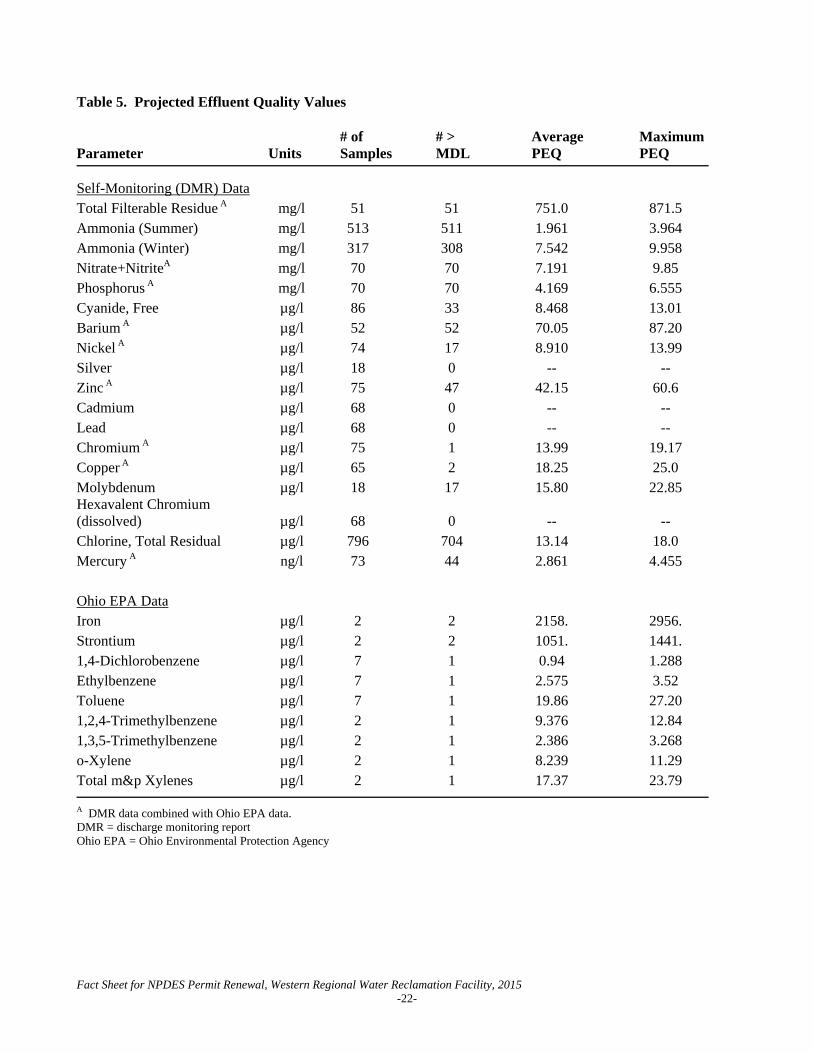
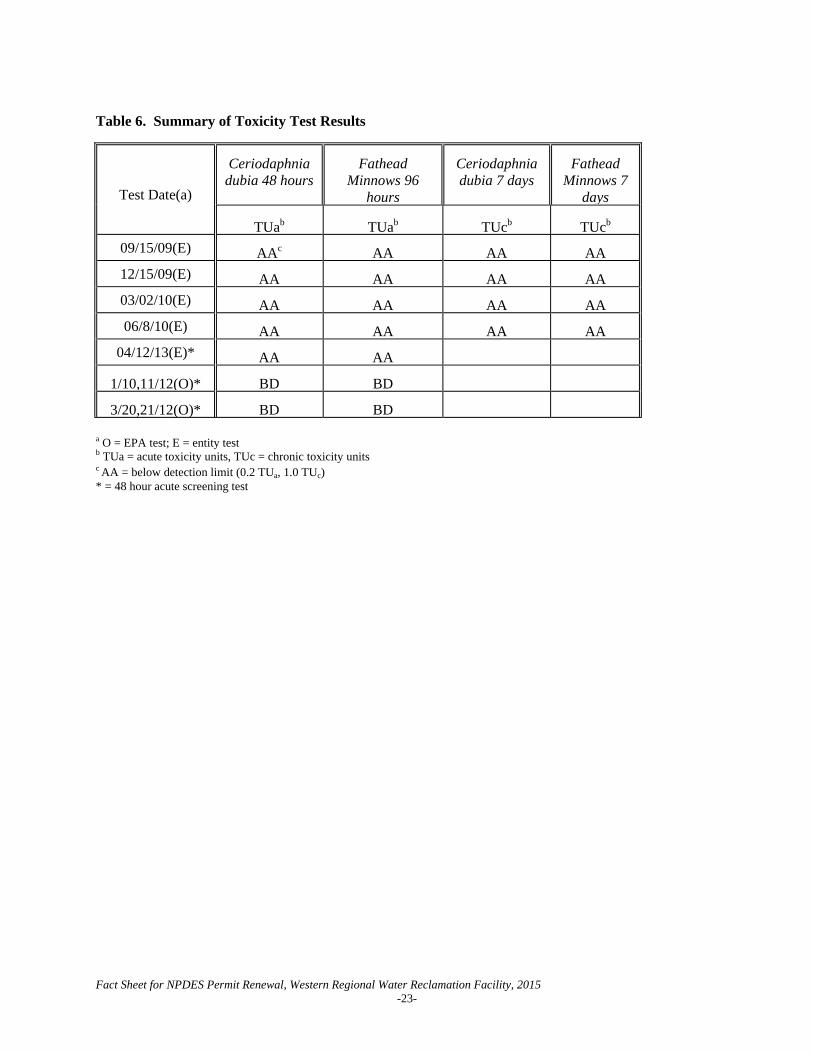
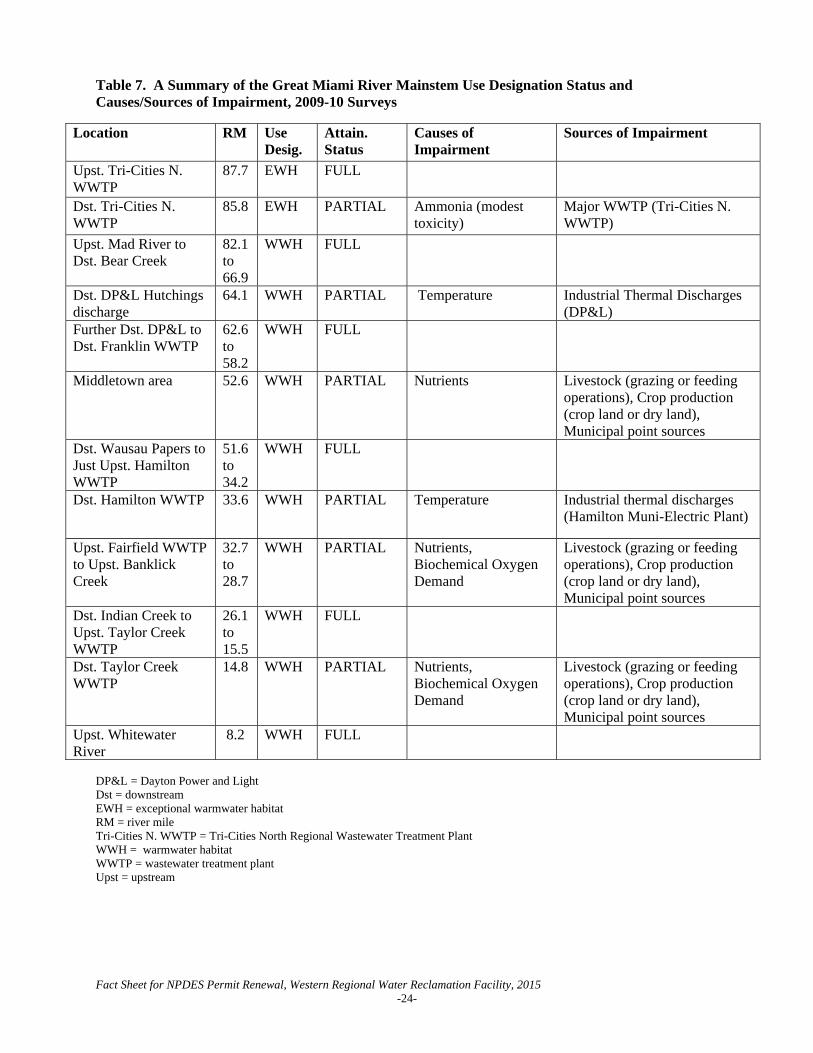
biological treatment and is blended with the plant effluent prior to monitoring at station 001. A new monitoring station, 602, is proposed for this bypass. Sludge processing includes gravity thickening, aerobic digestion, dewatering by belt filter press, and disposal at a landfill or by land application at agronomic rates. Table 1 shows the total tons of sludge removed from Western Regional WRF from 2009 through 2014, based upon discharge monitoring reports (DMR) data. The plant provides service to all or part of Moraine, West Carrollton, Kettering, Miamisburg, Centerville, Miami Township, Washington Township, and Jefferson Township. Montgomery County implements an Ohio EPA approved industrial pretreatment program at the Western Regional plant. One categorical industrial user and six significant non-categorical industrial users discharge an average of 0.57 MGD to the wastewater plant. Description of Existing Discharge Table 2 shows the annual effluent flow rates for the Western Regional WWTP based upon DMR data. The flow rates have been very variable across this period. Table 3 presents chemical specific data compiled from annual pretreatment reports and collected by Ohio EPA. Table 4 presents a summary of unaltered Discharge Monitoring Report (DMR) data for outfall 1PL00002001. Data are presented for the period January 2009 through December 2013, and current permit limits are provided for comparison. Table 5 summarizes the chemical specific data for outfall 1PL00002001 by presenting the average and maximum Projected Effluent Quality (PEQ) values. Table 6 summarizes the results of acute whole effluent toxicity tests of the final effluent. Western Regional WRF reports SSO occurrences under station 300 in its NPDES permit. There were four overflow occurrences in 2010, 11 in 2011, 20 in 2012, five in 2013 and 11 in 2014. Under the provisions of 40 CFR 122.21(j), the Director has waived the requirement for submittal of expanded effluent testing data as part of the NPDES renewal application. Ohio EPA has access to substantially identical information through the submission of annual pretreatment program reports and/or from effluent testing conducted by the Agency. Assessment of Impact on Receiving Waters The Great Miami River from the Mad River to Four Mile Creek has been identified as a priority impaired water on Ohio’s 303(d) list. The aquatic life, recreation and human health uses are listed as impaired. The Great Miami River was evaluated by Ohio EPA staff for aquatic life and recreational use potential during the 2009 and 2010 field seasons. This assessment included the collection of water chemistry and biological sampling at numerous sites in the mainstem Great Miami River and selected tributaries. A summary of the results from this assessment can be found in Table 7. The complete results of the most recent water quality surveys of the Great Miami River are included in the Technical Support Documents (TSD) “Biological and Water Quality Study of the Middle Great Miami River and Principal Tributaries, 2009”, Jan. 2013; and “Biological and Water Quality Study of the Lower Great Miami River and Selected Tributaries, 2010”, May 2012 (Ohio EPA), which are available through this Internet link: http://epa.ohio.gov/dsw/document_index/psdindx.aspx .
Fact Sheet for NPDES Permit Renewal, Western Regional Water Reclamation Facility, 2015
-10-
The addendum to this fact sheet provides additional information on the impacts that discharges from major municipal wastewater treatment plants are having on water quality in the lower Great Miami River. Development of Water-Quality-Based Effluent Limits Determining appropriate effluent concentrations is a multiple-step process in which parameters are identified as likely to be discharged by a facility, evaluated with respect to Ohio water quality criteria, and examined to determine the likelihood that the existing effluent could violate the calculated limits. Effluent data for the Western Regional WWTP were used to determine what parameters should undergo WLA. The parameters discharged are identified by the data available to Ohio EPA - Discharge Monitoring Report (DMR) data submitted by the permittee, compliance sampling data collected by Ohio EPA, and any other data submitted by the permittee, such as priority pollutant scans required by the NPDES application or by pretreatment, or other special conditions in the NPDES permit. The sources of effluent data used in this evaluation are as follows:
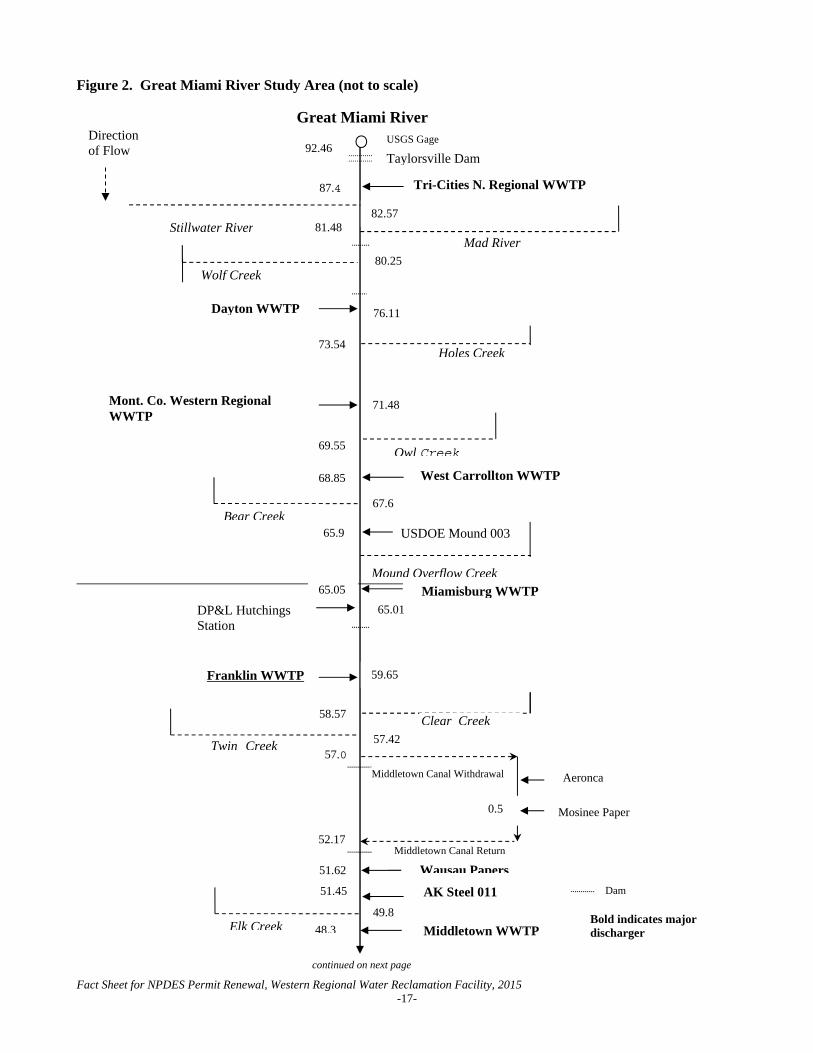
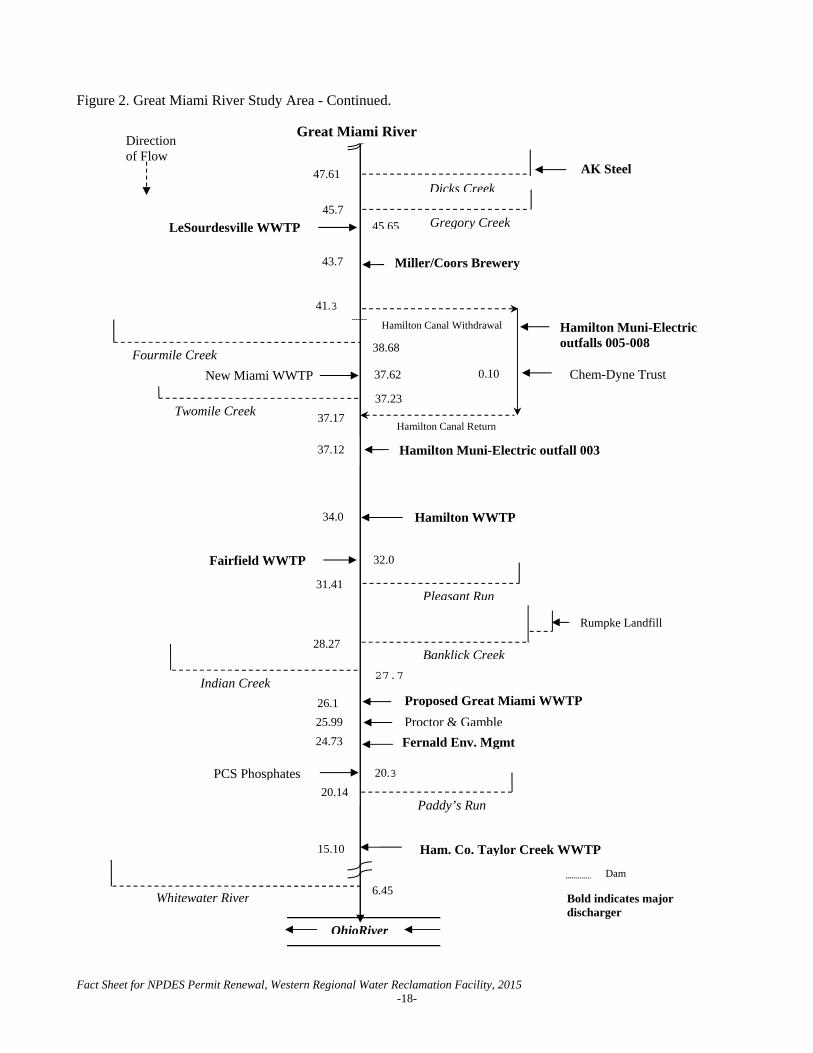
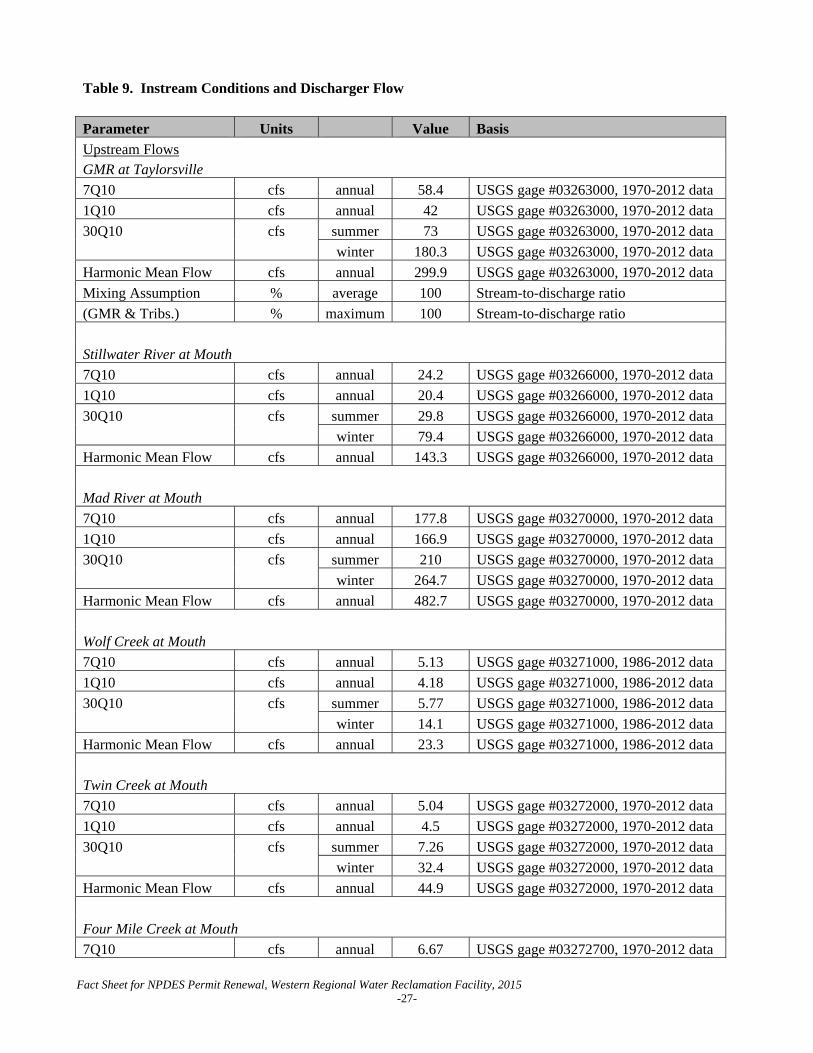
Self-monitoring data (DMR) January 2008 through September 2013 Pretreatment data 2008-2012 Ohio EPA compliance sampling data 2012 The effluent data were checked for outliers and the following values were removed: one value for nickel of 99.2 µg/l, and one value for total residual chlorine of 200. µg/l. This data is evaluated statistically, and PEQ values are calculated for each pollutant. Average PEQ (PEQavg) values represent the 95th percentile of monthly average data, and maximum PEQ (PEQmax) values represent the 95th percentile of all data points. The average and maximum PEQ values are presented in Table 5. The PEQ values are used according to Ohio rules to compare to applicable WQS and allowable WLA values for each pollutant evaluated. Initially, PEQ values are compared to the applicable average and maximum WQS. If both PEQ values are less than 25 percent of the applicable WQS, the pollutant does not have the reasonable potential to cause or contribute to exceedances of WQS, and no WLA is done for that parameter. If either PEQavg or PEQmax is greater than 25 percent of the applicable WQS, a WLA is conducted to determine whether the parameter exhibits reasonable potential and needs to have a limit or if monitoring is required. See Table 11 for a summary of the screening results. Wasteload Allocation For those parameters that require a WLA, the results are based on the uses assigned to the receiving waterbody in OAC 3745-1. Dischargers are allocated pollutant loadings/concentrations based on the Ohio WQS (OAC 3745-1). Most pollutants are allocated by a mass-balance method because they do not degrade in the receiving water. WLAs using this method are done using the following general equation: Discharger WLA = (downstream flow x WQS) - (upstream flow x background concentration). Discharger WLAs are divided by the discharge flow so that the allocations are expressed as concentrations. The Western Regional WWTP discharges to the Great Miami River within a large interactive segment (approx. RM 87 to 15) with multiple other dischargers. Wasteload allocations for conservative parameters in this interactive segment were calculated through use of the CONSWLA (CONservative Substance WasteLoad Allocation) model. The study area, showing relative positions of significant dischargers and tributaries, is depicted in Figure 2. The applicable waterbody uses for this facility’s discharge and the associated stream design flows are as follows:
Fact Sheet for NPDES Permit Renewal, Western Regional Water Reclamation Facility, 2015
-11-
Aquatic life (WWH) Toxics (metals, organics, etc.) Average Annual 7Q10 Maximum Annual 1Q10
Ammonia Average Summer/winter 30Q10 Agricultural Water Supply Harmonic mean flow
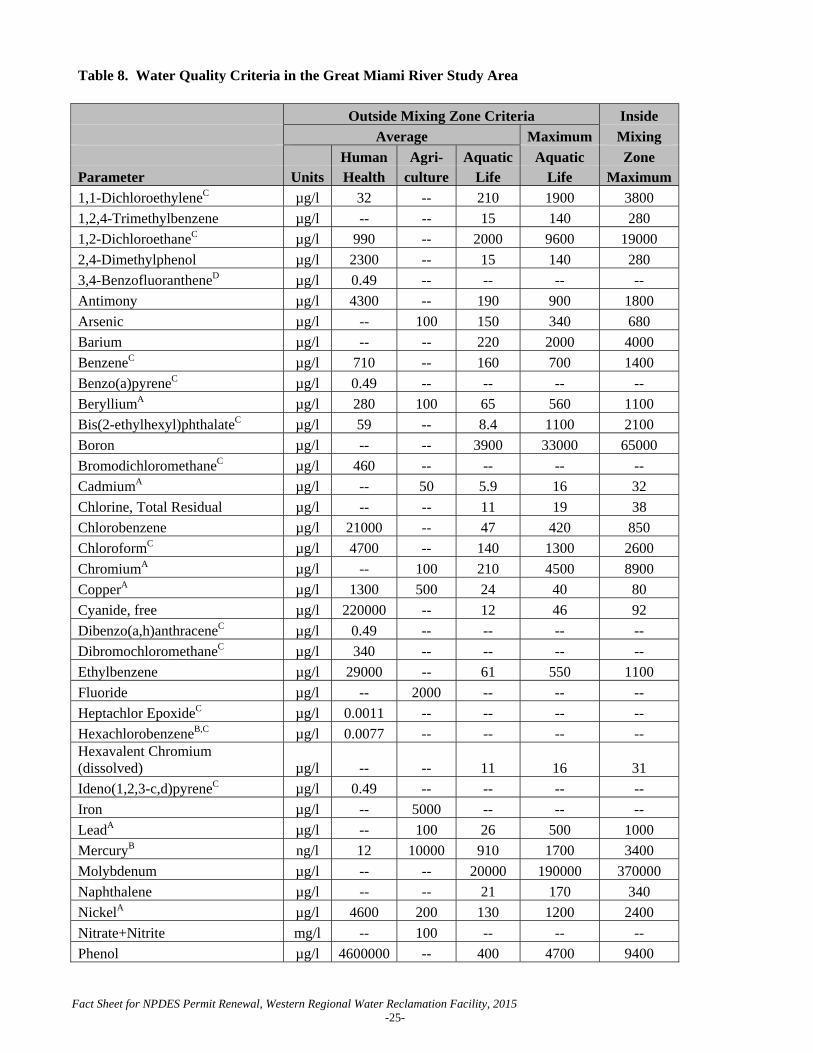
Human Health (nondrinking) Harmonic mean flow Allocations are developed using a percentage of stream design flow as specified in Table 9, and allocations cannot exceed the Inside Mixing Zone Maximum criteria. Ohio’s water quality standard implementation rules [OAC 3745-2-05(A)(2)(d)(iv)] required a phase out of mixing zones for bioaccumulative chemicals of concern (BCCs) as of November 15, 2010. This rule applied statewide. Mercury is a BCC. The mixing zone phase-out means that all dischargers requiring mercury limits in their NPDES permit must meet water quality standards at the end-of-pipe, which are 12 ng/l (average) and 1700 ng/l (maximum) in the Ohio River basin. The data used in the WLA are listed in Table 8 and Table 9. The wasteload allocation results to maintain all applicable criteria are presented in Table 10. The current ammonia limits were evaluated using the wasteload allocation procedures and are protective of water quality standards for ammonia toxicity. Whole Effluent Toxicity WLA Whole effluent toxicity (WET) is the total toxic effect of an effluent on aquatic life measured directly with a toxicity test. Acute WET measures short term effects of the effluent while chronic WET measures longer term and potentially more subtle effects of the effluent. WQS for WET are expressed in Ohio’s narrative “free from” WQS rule [OAC 3745-1-04(D)]. These “free froms” are translated into toxicity units (TUs) by the associated WQS Implementation Rule (OAC 3745-2-09). WLAs can then be calculated using TUs as if they were water quality criteria. The WLA calculations for WET are similar to those for aquatic life criteria - using the chronic toxicity unit (TUc) and 7Q10 flow for the average and the acute toxicity unit (TUa) and 1Q10 flow for the maximum. These values are the levels of effluent toxicity that should not cause instream toxicity during critical low-flow conditions. For the Western Regional plant, the WLA values are 1.0 TUa and 13.6 TUc. The chronic toxicity unit (TUc) is defined as 100 divided by the estimate of the effluent concentration which causes a 25% reduction in growth or reproduction of test organisms (IC25):
TUc = 100/IC25 This equation applies outside the mixing zone for warmwater, modified warmwater, exceptional warmwater, coldwater, and seasonal salmonid use designations except when the following equation is more restrictive (Ceriodaphnia dubia only):
TUc = 100/geometric mean of No Observed Effect Concentration and Lowest Observed Effect Concentration
The acute toxicity unit (TUa) is defined as 100 divided by the concentration in water having 50% chance of causing death to aquatic life (LC50) for the most sensitive test species:
TUa = 100/LC50 This equation applies outside the mixing zone for warmwater, modified warmwater, exceptional warmwater, coldwater, and seasonal salmonid use designations.
Fact Sheet for NPDES Permit Renewal, Western Regional Water Reclamation Facility, 2015
-12-
Reasonable Potential/ Effluent Limits/Hazard Management Decisions After appropriate effluent limits are calculated, the reasonable potential of the discharger to violate the WQS must be determined. Each parameter is examined and placed in a defined "group". Parameters that do not have a WQS or do not require a WLA based on the initial screening are assigned to either group 1 or 2. For the allocated parameters, the preliminary effluent limits (PEL) based on the most restrictive average and maximum WLAs are selected from Table 10. The average PEL (PELavg) is compared to the average PEQ (PEQavg) from Table 5, and the PELmax is compared to the PEQmax. Based on the calculated percentage of the allocated value [(PEQavg ÷ PELavg) X 100, or (PEQmax ÷ PELmax) X 100)], the parameters are assigned to group 3, 4, or 5. The groupings are listed in Table 11. The final effluent limits are determined by evaluating the groupings in conjunction with other applicable rules and regulations. Table 12 presents the final effluent limits and monitoring requirements proposed for Western Regional WWTP outfall 1PL00002001 and the basis for their recommendation. The limits and monitoring requirements for outfall 001 are discussed in detail below. Oil and Grease, pH and E. coli Limits proposed for oil and grease, pH, and dissolved oxygen are based on WQS (OAC 3745-1-07) and are a continuation of existing permit limits. Class A Primary Contact Recreation standards apply to the Great Miami River. An increase in the weekly average E. coli limit is proposed. The new limit is derived from the average water quality standard. Allowing the higher limit meets one of the exceptions to the Antibacksliding rule [OAC 3745-33-05(F)] – information is available that was not available at the time of permit issuance and that would have justified the application of a less stringent effluent limitation at the time of permit issuance. An increase in the weekly average limit was not subject to the provisions of the Antidegradation rule (OAC 3745-1-05). Total Suspended Solids, Ammonia-nitrogen, Chlorine, CBOD5 and Dissolved Oxygen The limits for total suspended solids, ammonia-nitrogen, chlorine (total residual) and CBOD5 (5-day carbonaceous biochemical oxygen demand) that were approved for the treatment plant under the existing permit are proposed to continue. The concentration limits for these parameters are based upon the treatment technology associated with the plant design of Western Regional WWTP. The loading limits are based upon the plant design flow of 20.0 MGD. Ammonia-nitrogen limits were evaluated and are protective of water quality standards for ammonia-nitrogen toxicity. Total Phosphorus A final effluent limit is proposed for total phosphorus that will become effective 36 months from the effective date of the permit. The addendum to this fact sheet provides the justification for including a total phosphorus limit in the permit. The proposed limit is expressed as a seasonal aggregate loading limit that applies for the period July through October. It was calculated using an effluent concentration of 1.0 mg/l total phosphorus and the treatment plant’s median daily flow during July through October for the years 2010 through 2014. To determine compliance, the plant’s median total phosphorus effluent concentration and median daily plant flow for the period July through October will be used to calculate a loading value that will be compared to the limit. The permittee will make this calculation each year and report the value on its December DMR. A compliance schedule is proposed for the permittee to submit a proposal within 24 months of the permit effective date for meeting the limit. This proposal may include submittal of a permit to install for treatment improvements or data showing the plant can meet the limit through current operations.
Fact Sheet for NPDES Permit Renewal, Western Regional Water Reclamation Facility, 2015
-13-
The phosphorus reduction proposed in this NPDES permit renewal is the first step in a process to return the lower Great Miami River to full attainment of its aquatic life water quality standards. The next NPDES permit renewal may be informed by an Ohio EPA-approved integrated management plan prepared by the lower GMR dischargers and/or an approved TMDL prepared by Ohio EPA. If supported by these reports, the permittee may propose using alternate reduction strategies to achieve future phosphorus reductions. The strategies could include point source-nonpoint source trading, point source-point source trading, habitat restoration offsets, physical watershed alterations and other approved nutrient management/reduction strategies. Ohio EPA anticipates that future NPDES permits will provide time for the river’s chemistry and biology to respond to the proposed phosphorus reductions accompanied by ambient chemical and biological monitoring. Based on the results of future monitoring, adjustments in required phosphorus reduction actions or the timeline for these actions may be possible. Nitrate + Nitrite and Total Kjeldahl Nitrogen The continuation of monitoring for nitrate+nitrite –nitrogen and total Kjeldahl nitrogen is proposed based on best engineering judgment. Monitoring nitrate+nitrite-nitrogen at both the upstream and downstream stations is proposed to continue. The purpose of the monitoring is to maintain a data set tracking nutrient levels in the Great Miami river basin. Cadmium, Total Chromium, Dissolved Hexavalent Chromium, Copper, Free Cyanide, Lead, Mercury, Nickel, Zinc and Total Filterable Residue The Ohio EPA risk assessment (Table 10) places cadmium, total chromium, dissolved hexavalent chromium, copper, free cyanide, lead, mercury, nickel, zinc and total filterable residue in groups 2 and 3. This placement as well as the supporting data indicate that these parameters do not have the reasonable potential to contribute to WQS exceedances, and limits are not necessary to protect water quality. Monthly monitoring is proposed to document that these pollutants continue to remain at low levels. Currently there are two approved methods for free cyanide listed in 40 CFR 136.3 that have quantification levels lower than any water quality-based effluent limits: - ASTM D7237-10 and OIA-1677-09 - Flow injection followed by gas diffusion amperometry These methods will allow Ohio EPA make more reliable water quality-related decisions regarding free cyanide. Because the quantification levels are lower than any water quality-based effluent limits, it will also be possible to directly evaluate compliance with free cyanide limits. New NPDES permits no longer authorize the use of method 4500 CN-I from Standard Methods for free cyanide testing. The new permits require permittees to begin using one of these approved methods as soon as possible. If a permittee must use method 4500 CN-I during the transition to an approved method, they are instructed to report the results on their DMR and enter “Method 4500 CN-I” in the remarks section. Additional Monitoring New monitoring is proposed for dissolved orthophosphate (as P). This monitoring is required by Ohio Senate Bill 1, which was signed by the Governor on April 2, 2015. Monitoring for orthophosphate is proposed to further develop nutrient datasets for dissolved reactive phosphorus and to assist stream and watershed assessments and studies. Ohio EPA monitoring, as well as other in-stream monitoring, is taken via grab sample, orthophosphate is proposed to be collected by grab sample to maintain consistent data to support watershed and stream surveys. Monitoring will be done by grab sample, which must be filtered within 15 minutes of collection using a 0.45-micron filter. The filtered sample must be analyzed within 48 hours. New monthly orthophosphate monitoring is proposed at the upstream and downstream stations, 801 and 901.
Fact Sheet for NPDES Permit Renewal, Western Regional Water Reclamation Facility, 2015
-14-
A new monitoring station, 602, is proposed for the plant’s tertiary filter bypass. The bypass is activated manually by plant operators when necessary to route high flows around the filters. The bypassed flow has received full biological treatment and is blended with the plant effluent prior to monitoring at station 001. Monitoring and reporting of the 24-hour total flow is proposed for each day there is a discharge through the station. A foot note to the monitoring and reporting table states, “Flow discharged through this station has received full biological treatment and is blended with the plant effluent prior to monitoring at station 001. It is not subject to the provisions of 40 CFR 122.41(m) and Part III, Item 11.C.1 of this permit.” Additional monitoring requirements proposed at the final effluent, influent and upstream/downstream stations are included for all facilities in Ohio and vary according to the type and size of the discharge. In addition to permit compliance, this data is used to assist in the evaluation of effluent quality and treatment plant performance and for designing plant improvements and conducting future stream studies. No Monitoring Proposed The following contaminants were included in Groups 2 and 3 under the risk assessment procedure (Table 10), and based on best engineering judgment and OAC 3745-33-07(A), no monitoring is proposed: arsenic, 1,4-dichlorobenzend, ethylbenzene, molybdenum, selenium, silver, strontium, 1,3,5-trimethylbenzene (Group 2); and barium, iron, 1,2,4-trimethylbenzene, toluene, xylenes (Group 3). Whole Effluent Toxicity Reasonable Potential Based on evaluating the WET data presented in Table 6 and other pertinent data under the provisions of OAC 3745-33-07(B), the Western Regional wastewater plant is placed in Category 4 with respect to WET. While this indicates that the plant's effluent does not currently pose a toxicity problem, annual toxicity testing is proposed consistent with the minimum monitoring requirements at OAC 3754-33-07(B)(11). The proposed monitoring will adequately characterize toxicity in the plant's effluent. Sludge Limits and monitoring requirements proposed for the disposal of sewage sludge by the following management practices are based on OAC 3745-40: land application, removal to sanitary landfill or transfer to another facility with an NPDES permit. Other Requirements Compliance Schedule A compliance schedule is proposed for the County to submit a technical justification for either revising its local industrial user limits or retaining its existing local limits. If revisions to local limits are required, the County must also submit a pretreatment program modification request. Sanitary Sewer Overflow Reporting Provisions for reporting sanitary sewer overflows (SSOs) are again proposed in this permit. These provisions include: the reporting of the system-wide number of SSO occurrences on monthly operating reports; telephone notification of Ohio EPA and the local health department, and 5-day follow up written reports for certain high risk SSOs; and preparation of an annual report that is submitted to Ohio EPA and made available to the public. Many of these provisions were already required under the “Noncompliance Notification”, “Records Retention”, and “Facility Operation and Quality Control” general conditions in Part III of Ohio NPDES permits. Operator Certification Operator certification requirements have been included in Part II, Item A of the permit in accordance with rules adopted in December 2006. These rules require the Western Regional WWTP to have a Class IV wastewater treatment plant operator in charge of the sewage treatment plant operations discharging through outfall 1PL00002001.
Fact Sheet for NPDES Permit Renewal, Western Regional Water Reclamation Facility, 2015
-15-
Operator of Record In December 2006, Ohio Administrative Code rule revisions became effective that affect the requirements for certified operators for sewage collection systems and treatment works regulated under NPDES permits. Part II, Item A of this NPDES permit is included to implement rule 3745-7-02 of the Ohio Administrative Code (OAC). It requires the permittee to designate one or more operator of record to oversee the technical operation of the Western Regional WWTP. Storm Water Compliance At the County’s request, Parts IV, V, and VI have been included in the permit to ensure that any storm water flows from the facility site are properly regulated and managed. The County will terminate its coverage under Ohio EPA’s industrial storm water general permit, permit number 1GR01012*ED. Outfall Signage Part II of the permit includes requirements for the permittee to place a sign at each outfall to the Western Regional WWTP providing information about the discharge. Signage at outfalls is required pursuant to Ohio Administrative Code 3745-33-08(A).
Fact Sheet for NPDES Permit Renewal, Western Regional Water Reclamation Facility, 2015
-16-
Figure 1. Location of Western Regional WWTP
Fact Sheet for NPDES Permit Renewal, Western Regional Water Reclamation Facility, 2015
-17-
Figure 2. Great Miami River Study Area (not to scale)
Taylorsville Dam
Mad River
Tri-Cities N. Regional WWTP
92.46
Dayton WWTP
87.4
Stillwater River 82.57
80.25 Wolf Creek
81.48
76.11
Holes Creek73.54
Mont. Co. Western Regional WWTP
71.48
69.55
Bear Creek
68.85 West Carrollton WWTP
67.6
USDOE Mound 003 65.9
Mound Overflow CreekMiamisburg WWTP65.05
Owl Creek
DP&L Hutchings Station
65.01
Franklin WWTP 59.65
Clear Creek58.57
Twin Creek 57.42 57.0
Middletown Canal Withdrawal
Middletown Canal Return 52.17
Aeronca
Mosinee Paper
Elk Creek49.8
Middletown WWTP
51.62
51.45
Wausau Papers
AK Steel 011
48.3
0.5
Direction of Flow
USGS Gage
Dam
Bold indicates major discharger
continued on next page
Great Miami River
Fact Sheet for NPDES Permit Renewal, Western Regional Water Reclamation Facility, 2015
-18-
Figure 2. Great Miami River Study Area - Continued.
Dicks Creek
LeSourdesville WWTP
AK Steel 47.61
Gregory Creek45.65
Fourmile Creek
45.7
Miller/Coors Brewery 43.7
41.3
0.10
Paddy’s Run
34.0
Chem-Dyne Trust
Hamilton Muni-Electric outfalls 005-008
32.0
Hamilton WWTP
Pleasant Run
Indian Creek
Hamilton Canal Withdrawal
20.14
Rumpke Landfill
Whitewater River6.45
Ham. Co. Taylor Creek WWTP
Direction of Flow
Dam
Hamilton Canal Return37.17
38.68
37.23Twomile Creek
New Miami WWTP 37.62
Hamilton Muni-Electric outfall 003 37.12
Fairfield WWTP
31.41
Banklick Creek28.27
27.7
Fernald Env. Mgmt
25.99 Proctor & Gamble
24.73
PCS Phosphates 20.3
15.10
OhioRiver
Bold indicates major discharger
26.1 Proposed Great Miami WWTP
Great Miami River
Fact Sheet for NPDES Permit Renewal, Western Regional Water Reclamation Facility, 2015
-19-
Table 1. Sludge Removed from Western Regional WWTP 2009-2014 Year Dry Tons Removed
2009 2064 2010 1578 2011 1830 2012 2290 2013 2163 2014 2757 Table 2. Effluent Flow Rates for Outfall 1PL00002001 2009-2014 (in MGD) Year 50th
percentile 95th percentile
Maximum
2009 13.611 19.131 31.831 2010 14.012 22.088 44.875 2011 12.75 30.628 48.175 2012 10.732 17.511 38.056 2013 13.873 22.564 40.783 2014 14.223 23.665 46.43
Fact Sheet for NPDES Permit Renewal, Western Regional Water Reclamation Facility, 2015
-20-
Table 3. Effluent Characterization Using Ohio EPA and Pretreatment Data Summary of analytical results for Western Regional outfall 1PL00002001. Units µg/l unless otherwise noted; OEPA = data from analyses by Ohio EPA; PT = data from pretreatment program reports; NA = not analyzed; ND = not detected (detection limit).
OEPA OEPA PT PT PT PT PT
Parameter 3/20/2012 1/13/2012 4/10/2012 4/14/2011 4/5/2010 4/2/2009 4/9/2008
1,2,4 Trimethylbenzene 3.38 ND
(0.50) NA NA NA NA NA
1,3,5 Trimethylbenzene 0.86 ND
(0.50) NA NA NA NA NA
1,4 Dichlorobenzene 0.56 ND (2.1) ND
(0.005) ND
(0.005) ND
(0.005) ND
(0.005) ND (10)
Barium 66 71 NA NA NA NA NA
Chromium 21.3 ND (2.0) ND (5.0) ND (5.0) ND (5.0) ND (5.0) ND (5.0)
Copper 8.1 2.5 ND (25) ND (25) ND (25) ND (25) ND (25)
Ethylbenzene 1.68 ND
(0.50) ND
(0.005) ND
(0.005) ND
(0.001) ND
(0.005) ND (2.0)
Iron 778 57 NA NA NA NA NA
Mercury (ng/l) NA NA ND (5) 1.9 2.31 2.81 1.17
Nickel 99.2 3.7 ND (5.0) ND (5.0) ND (5.0) 6.5 ND (5.0)
Nitrate+nitrite (mg/l) 0.49 5.47 NA NA NA NA NA
o-Xylene 2.97 ND
(0.50) NA NA NA NA NA
Phosphorus (mg/l) 1.22 0.217 NA NA NA NA NA
Strontium 379 340 NA NA NA NA NA
Toluene 13.6 ND
(0.50) ND
(0.005) ND
(0.005) ND
(0.001) ND
(0.005) ND (2.0)
Total Filterable Residue (mg/l) 642 608 NA NA NA NA NA
Total m&p-xylenes 6.26 ND
(0.50) NA NA NA NA NA
Zinc 29 16 ND (20) ND (20) ND (20) ND (20) 26
Fact Sheet for NPDES Permit Renewal, Western Regional Water Reclamation Facility, 2015
-21-
Table 4. Effluent Characterization Using Self-Monitoring Data
Current Permit
Limits Percentiles Data Parameter Season Units 30 day Daily # Obs. 50th 95th Range Outfall 001 Water Temperature Annual °C Monitor 1826 18 25 11-29 Dissolved Oxygen Summer mg/l -- 6.0 min 920 7 8.5 6-9 Dissolved Oxygen Winter mg/l -- 6.0 min 906 7.6 9.1 5.7-9.9 Total Filterable Residue Annual mg/l Monitor 52 614 817 437-1130 Total Suspended Solids Annual mg/l 12 18a 1247 0 7 0-292 Oil and Grease Annual mg/l -- 10 104 0 0 0-7 Ammonia Summer mg/l 2.0 3.5a 642 0.285 7.08 0-18.6 Ammonia Winter mg/l Monitor 611 0.87 8.16 0-17.5 Total Kjeldahl Nitrogen Annual mg/l Monitor 60 1.85 7.3 0-13.7 Nitrite + Nitrate Annual mg/l Monitor 60 4.58 7.94 0.79-9.85 Phosphorus Annual mg/l Monitor 62 1.12 3.89 0.16-7 Cyanide, Free Annual mg/l Monitor 67 0 0.0077 0-0.01 Barium Annual µg/l Monitor 53 53 75.7 28-90 Nickel Annual µg/l Monitor 60 0 8.62 0-15.7 Silver Annual µg/l Monitor 7 0 0 0-0 Zinc Annual µg/l Monitor 60 23.2 45 0-65 Cadmium Annual µg/l Monitor 60 0 0 0-0 Lead Annual µg/l Monitor 60 0 0 0-0 Chromium Annual µg/l Monitor 60 0 0 0-0 Copper Annual µg/l Monitor 60 0 0 0-0 Molybdenum Annual µg/l Monitor 7 8.5 10.4 5.7-10.5 Chromium, Dissolved Hexavalent Annual µg/l Monitor 60 0 0 0-0
E. coli Annual #/100
ml 126 189a 454 4.1 520 0-17300 Flow Rate Summer MGD Monitor 920 11.9 18.8 6.49-42 Flow Rate Winter MGD Monitor 906 14.1 25.3 7.04-48.2 Flow Rate Annual MGD Monitor 1826 12.9 22.4 6.49-48.2 Chlorine, Total Residual Annual mg/l -- 0.038max 920 0.02 0.03 0-0.2 Mercury Annual ng/l Monitor 60 0 2.82 0-4 pH, Maximum Annual S.U. -- 9.0 1826 7.3 7.8 6.8-8.8 pH, Minimum Annual S.U. -- 6.5 1826 7.1 7.6 6.3-7.9 Carbonaceous Biochemical Oxygen Demand (5 day)
Summer mg/l 10 15a 619 3 8.1 0-72 Winter mg/l 10 15a 579 3 13 0-70
a = Weekly average limit
Fact Sheet for NPDES Permit Renewal, Western Regional Water Reclamation Facility, 2015
-22-
Table 5. Projected Effluent Quality Values
# of # > Average Maximum
Parameter Units Samples MDL PEQ PEQ
Self-Monitoring (DMR) Data Total Filterable Residue A mg/l 51 51 751.0 871.5 Ammonia (Summer) mg/l 513 511 1.961 3.964 Ammonia (Winter) mg/l 317 308 7.542 9.958 Nitrate+NitriteA mg/l 70 70 7.191 9.85 Phosphorus A mg/l 70 70 4.169 6.555 Cyanide, Free µg/l 86 33 8.468 13.01 Barium A µg/l 52 52 70.05 87.20 Nickel A µg/l 74 17 8.910 13.99 Silver µg/l 18 0 -- -- Zinc A µg/l 75 47 42.15 60.6 Cadmium µg/l 68 0 -- -- Lead µg/l 68 0 -- -- Chromium A µg/l 75 1 13.99 19.17 Copper A µg/l 65 2 18.25 25.0 Molybdenum µg/l 18 17 15.80 22.85 Hexavalent Chromium (dissolved) µg/l 68 0 -- -- Chlorine, Total Residual µg/l 796 704 13.14 18.0 Mercury A ng/l 73 44 2.861 4.455 Ohio EPA Data Iron µg/l 2 2 2158. 2956. Strontium µg/l 2 2 1051. 1441. 1,4-Dichlorobenzene µg/l 7 1 0.94 1.288 Ethylbenzene µg/l 7 1 2.575 3.52 Toluene µg/l 7 1 19.86 27.20 1,2,4-Trimethylbenzene µg/l 2 1 9.376 12.84 1,3,5-Trimethylbenzene µg/l 2 1 2.386 3.268 o-Xylene µg/l 2 1 8.239 11.29 Total m&p Xylenes µg/l 2 1 17.37 23.79
A DMR data combined with Ohio EPA data. DMR = discharge monitoring report Ohio EPA = Ohio Environmental Protection Agency
Fact Sheet for NPDES Permit Renewal, Western Regional Water Reclamation Facility, 2015
-23-
Table 6. Summary of Toxicity Test Results
Test Date(a)
Ceriodaphnia dubia 48 hours
Fathead Minnows 96
hours
Ceriodaphnia dubia 7 days
Fathead Minnows 7
days
TUab TUab TUcb TUcb
09/15/09(E) AAc AA AA AA
12/15/09(E) AA AA AA AA
03/02/10(E) AA AA AA AA
06/8/10(E) AA AA AA AA
04/12/13(E)* AA AA
1/10,11/12(O)* BD BD
3/20,21/12(O)* BD BD a O = EPA test; E = entity test b TUa = acute toxicity units, TUc = chronic toxicity units c AA = below detection limit (0.2 TUa, 1.0 TUc) * = 48 hour acute screening test
Fact Sheet for NPDES Permit Renewal, Western Regional Water Reclamation Facility, 2015
-24-
Table 7. A Summary of the Great Miami River Mainstem Use Designation Status and Causes/Sources of Impairment, 2009-10 Surveys
Location RM Use Desig.
Attain. Status
Causes of Impairment
Sources of Impairment
Upst. Tri-Cities N. WWTP
87.7 EWH FULL
Dst. Tri-Cities N. WWTP
85.8 EWH PARTIAL Ammonia (modest toxicity)
Major WWTP (Tri-Cities N. WWTP)
Upst. Mad River to Dst. Bear Creek
82.1 to 66.9
WWH FULL
Dst. DP&L Hutchings discharge
64.1 WWH PARTIAL Temperature Industrial Thermal Discharges (DP&L)
Further Dst. DP&L to Dst. Franklin WWTP
62.6 to 58.2
WWH FULL
Middletown area 52.6 WWH PARTIAL Nutrients Livestock (grazing or feeding operations), Crop production (crop land or dry land), Municipal point sources
Dst. Wausau Papers to Just Upst. Hamilton WWTP
51.6 to 34.2
WWH FULL
Dst. Hamilton WWTP 33.6 WWH PARTIAL Temperature Industrial thermal discharges (Hamilton Muni-Electric Plant)
Upst. Fairfield WWTP to Upst. Banklick Creek
32.7 to 28.7
WWH PARTIAL Nutrients, Biochemical Oxygen Demand
Livestock (grazing or feeding operations), Crop production (crop land or dry land), Municipal point sources
Dst. Indian Creek to Upst. Taylor Creek WWTP
26.1 to 15.5
WWH FULL
Dst. Taylor Creek WWTP
14.8 WWH PARTIAL Nutrients, Biochemical Oxygen Demand
Livestock (grazing or feeding operations), Crop production (crop land or dry land), Municipal point sources
Upst. Whitewater River
8.2 WWH FULL
DP&L = Dayton Power and Light Dst = downstream EWH = exceptional warmwater habitat RM = river mile Tri-Cities N. WWTP = Tri-Cities North Regional Wastewater Treatment Plant WWH = warmwater habitat WWTP = wastewater treatment plant Upst = upstream
Fact Sheet for NPDES Permit Renewal, Western Regional Water Reclamation Facility, 2015
-25-
Table 8. Water Quality Criteria in the Great Miami River Study Area
Outside Mixing Zone Criteria Inside
Average Maximum Mixing
Human Agri- Aquatic Aquatic Zone Parameter Units Health culture Life Life Maximum
1,1-DichloroethyleneC µg/l 32 -- 210 1900 3800
1,2,4-Trimethylbenzene µg/l -- -- 15 140 280
1,2-DichloroethaneC µg/l 990 -- 2000 9600 19000
2,4-Dimethylphenol µg/l 2300 -- 15 140 280
3,4-BenzofluorantheneD µg/l 0.49 -- -- -- --
Antimony µg/l 4300 -- 190 900 1800
Arsenic µg/l -- 100 150 340 680
Barium µg/l -- -- 220 2000 4000
BenzeneC µg/l 710 -- 160 700 1400
Benzo(a)pyreneC µg/l 0.49 -- -- -- --
BerylliumA µg/l 280 100 65 560 1100
Bis(2-ethylhexyl)phthalateC µg/l 59 -- 8.4 1100 2100
Boron µg/l -- -- 3900 33000 65000
BromodichloromethaneC µg/l 460 -- -- -- --
CadmiumA µg/l -- 50 5.9 16 32
Chlorine, Total Residual µg/l -- -- 11 19 38
Chlorobenzene µg/l 21000 -- 47 420 850
ChloroformC µg/l 4700 -- 140 1300 2600
ChromiumA µg/l -- 100 210 4500 8900
CopperA µg/l 1300 500 24 40 80
Cyanide, free µg/l 220000 -- 12 46 92
Dibenzo(a,h)anthraceneC µg/l 0.49 -- -- -- --
DibromochloromethaneC µg/l 340 -- -- -- --
Ethylbenzene µg/l 29000 -- 61 550 1100
Fluoride µg/l -- 2000 -- -- --
Heptachlor EpoxideC µg/l 0.0011 -- -- -- --
HexachlorobenzeneB,C µg/l 0.0077 -- -- -- -- Hexavalent Chromium (dissolved) µg/l -- -- 11 16 31
Ideno(1,2,3-c,d)pyreneC µg/l 0.49 -- -- -- --
Iron µg/l -- 5000 -- -- --
LeadA µg/l -- 100 26 500 1000
MercuryB ng/l 12 10000 910 1700 3400
Molybdenum µg/l -- -- 20000 190000 370000
Naphthalene µg/l -- -- 21 170 340
NickelA µg/l 4600 200 130 1200 2400
Nitrate+Nitrite mg/l -- 100 -- -- --
Phenol µg/l 4600000 -- 400 4700 9400
Fact Sheet for NPDES Permit Renewal, Western Regional Water Reclamation Facility, 2015
-26-
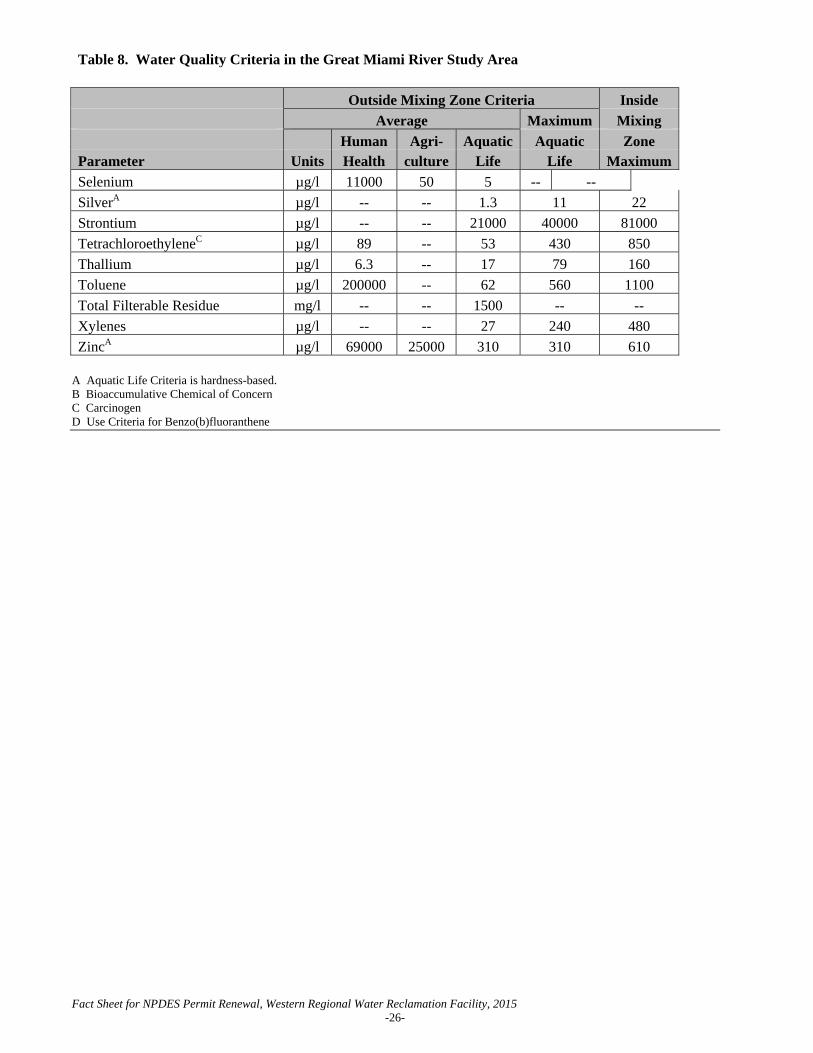
Table 8. Water Quality Criteria in the Great Miami River Study Area
Outside Mixing Zone Criteria Inside
Average Maximum Mixing
Human Agri- Aquatic Aquatic Zone Parameter Units Health culture Life Life Maximum
Selenium µg/l 11000 50 5 -- --
SilverA µg/l -- -- 1.3 11 22
Strontium µg/l -- -- 21000 40000 81000
TetrachloroethyleneC µg/l 89 -- 53 430 850
Thallium µg/l 6.3 -- 17 79 160
Toluene µg/l 200000 -- 62 560 1100
Total Filterable Residue mg/l -- -- 1500 -- --
Xylenes µg/l -- -- 27 240 480
ZincA µg/l 69000 25000 310 310 610 A Aquatic Life Criteria is hardness-based. B Bioaccumulative Chemical of Concern C Carcinogen D Use Criteria for Benzo(b)fluoranthene
Fact Sheet for NPDES Permit Renewal, Western Regional Water Reclamation Facility, 2015
-27-
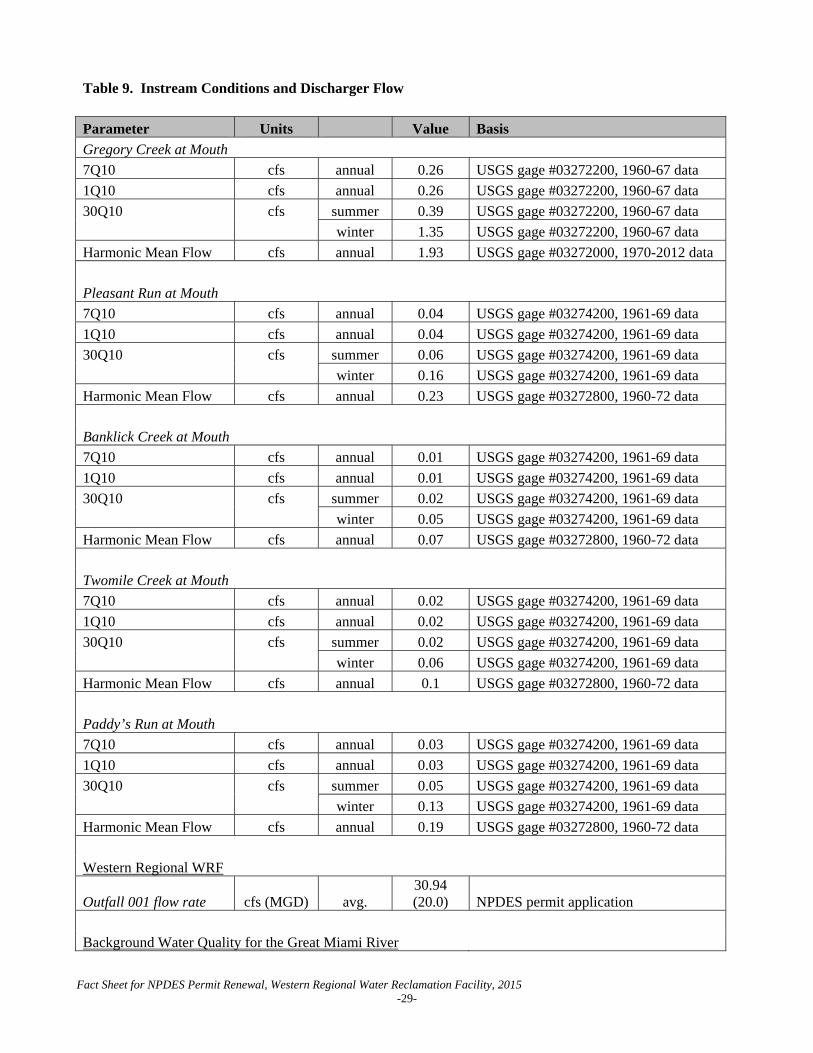
Table 9. Instream Conditions and Discharger Flow
Parameter Units Value Basis
Upstream Flows GMR at Taylorsville
7Q10 cfs annual 58.4 USGS gage #03263000, 1970-2012 data
1Q10 cfs annual 42 USGS gage #03263000, 1970-2012 data
30Q10 cfs summer 73 USGS gage #03263000, 1970-2012 data
winter 180.3 USGS gage #03263000, 1970-2012 data
Harmonic Mean Flow cfs annual 299.9 USGS gage #03263000, 1970-2012 data
Mixing Assumption % average 100 Stream-to-discharge ratio
(GMR & Tribs.) % maximum 100 Stream-to-discharge ratio
Stillwater River at Mouth
7Q10 cfs annual 24.2 USGS gage #03266000, 1970-2012 data
1Q10 cfs annual 20.4 USGS gage #03266000, 1970-2012 data
30Q10 cfs summer 29.8 USGS gage #03266000, 1970-2012 data
winter 79.4 USGS gage #03266000, 1970-2012 data
Harmonic Mean Flow cfs annual 143.3 USGS gage #03266000, 1970-2012 data
Mad River at Mouth
7Q10 cfs annual 177.8 USGS gage #03270000, 1970-2012 data
1Q10 cfs annual 166.9 USGS gage #03270000, 1970-2012 data
30Q10 cfs summer 210 USGS gage #03270000, 1970-2012 data
winter 264.7 USGS gage #03270000, 1970-2012 data
Harmonic Mean Flow cfs annual 482.7 USGS gage #03270000, 1970-2012 data
Wolf Creek at Mouth
7Q10 cfs annual 5.13 USGS gage #03271000, 1986-2012 data
1Q10 cfs annual 4.18 USGS gage #03271000, 1986-2012 data
30Q10 cfs summer 5.77 USGS gage #03271000, 1986-2012 data
winter 14.1 USGS gage #03271000, 1986-2012 data
Harmonic Mean Flow cfs annual 23.3 USGS gage #03271000, 1986-2012 data
Twin Creek at Mouth
7Q10 cfs annual 5.04 USGS gage #03272000, 1970-2012 data
1Q10 cfs annual 4.5 USGS gage #03272000, 1970-2012 data
30Q10 cfs summer 7.26 USGS gage #03272000, 1970-2012 data
winter 32.4 USGS gage #03272000, 1970-2012 data
Harmonic Mean Flow cfs annual 44.9 USGS gage #03272000, 1970-2012 data
Four Mile Creek at Mouth
7Q10 cfs annual 6.67 USGS gage #03272700, 1970-2012 data
Fact Sheet for NPDES Permit Renewal, Western Regional Water Reclamation Facility, 2015
-28-
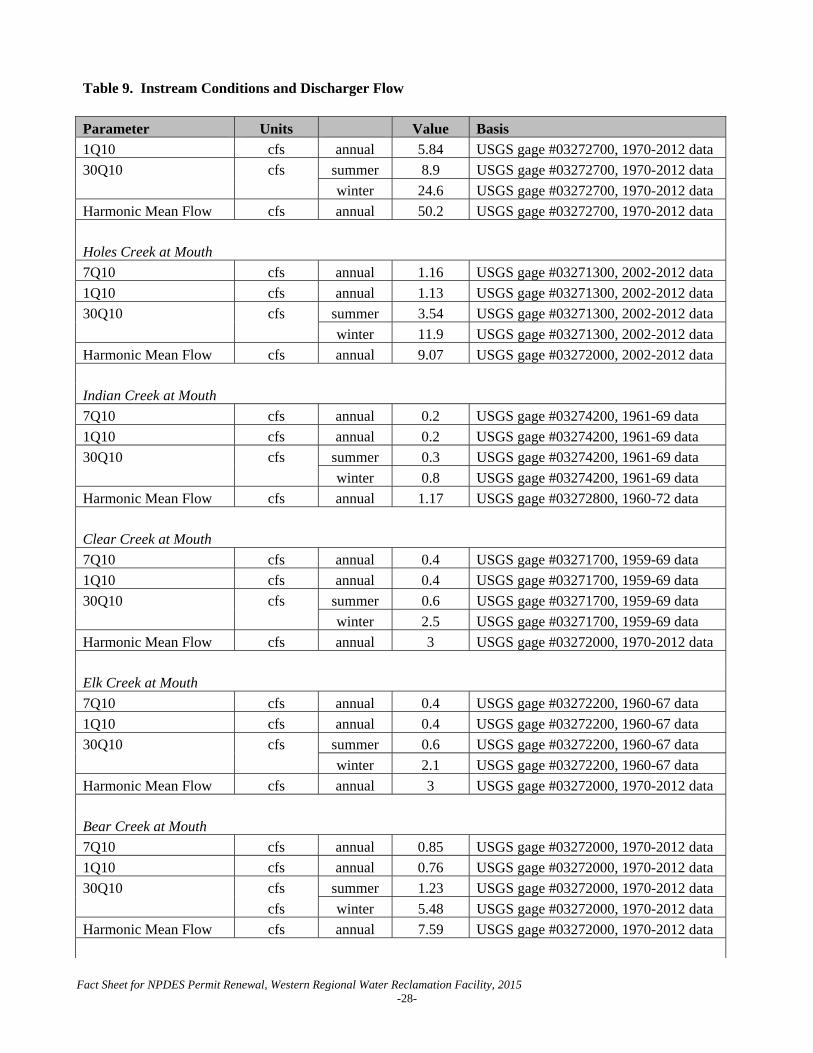
Table 9. Instream Conditions and Discharger Flow
Parameter Units Value Basis
1Q10 cfs annual 5.84 USGS gage #03272700, 1970-2012 data
30Q10 cfs summer 8.9 USGS gage #03272700, 1970-2012 data
winter 24.6 USGS gage #03272700, 1970-2012 data
Harmonic Mean Flow cfs annual 50.2 USGS gage #03272700, 1970-2012 data
Holes Creek at Mouth
7Q10 cfs annual 1.16 USGS gage #03271300, 2002-2012 data
1Q10 cfs annual 1.13 USGS gage #03271300, 2002-2012 data
30Q10 cfs summer 3.54 USGS gage #03271300, 2002-2012 data
winter 11.9 USGS gage #03271300, 2002-2012 data
Harmonic Mean Flow cfs annual 9.07 USGS gage #03272000, 2002-2012 data
Indian Creek at Mouth
7Q10 cfs annual 0.2 USGS gage #03274200, 1961-69 data
1Q10 cfs annual 0.2 USGS gage #03274200, 1961-69 data
30Q10 cfs summer 0.3 USGS gage #03274200, 1961-69 data
winter 0.8 USGS gage #03274200, 1961-69 data
Harmonic Mean Flow cfs annual 1.17 USGS gage #03272800, 1960-72 data
Clear Creek at Mouth
7Q10 cfs annual 0.4 USGS gage #03271700, 1959-69 data
1Q10 cfs annual 0.4 USGS gage #03271700, 1959-69 data
30Q10 cfs summer 0.6 USGS gage #03271700, 1959-69 data
winter 2.5 USGS gage #03271700, 1959-69 data
Harmonic Mean Flow cfs annual 3 USGS gage #03272000, 1970-2012 data
Elk Creek at Mouth
7Q10 cfs annual 0.4 USGS gage #03272200, 1960-67 data
1Q10 cfs annual 0.4 USGS gage #03272200, 1960-67 data
30Q10 cfs summer 0.6 USGS gage #03272200, 1960-67 data
winter 2.1 USGS gage #03272200, 1960-67 data
Harmonic Mean Flow cfs annual 3 USGS gage #03272000, 1970-2012 data
Bear Creek at Mouth
7Q10 cfs annual 0.85 USGS gage #03272000, 1970-2012 data
1Q10 cfs annual 0.76 USGS gage #03272000, 1970-2012 data
30Q10 cfs summer 1.23 USGS gage #03272000, 1970-2012 data
cfs winter 5.48 USGS gage #03272000, 1970-2012 data
Harmonic Mean Flow cfs annual 7.59 USGS gage #03272000, 1970-2012 data
Fact Sheet for NPDES Permit Renewal, Western Regional Water Reclamation Facility, 2015
-29-
Table 9. Instream Conditions and Discharger Flow
Parameter Units Value Basis
Gregory Creek at Mouth
7Q10 cfs annual 0.26 USGS gage #03272200, 1960-67 data
1Q10 cfs annual 0.26 USGS gage #03272200, 1960-67 data
30Q10 cfs summer 0.39 USGS gage #03272200, 1960-67 data
winter 1.35 USGS gage #03272200, 1960-67 data
Harmonic Mean Flow cfs annual 1.93 USGS gage #03272000, 1970-2012 data
Pleasant Run at Mouth
7Q10 cfs annual 0.04 USGS gage #03274200, 1961-69 data
1Q10 cfs annual 0.04 USGS gage #03274200, 1961-69 data
30Q10 cfs summer 0.06 USGS gage #03274200, 1961-69 data
winter 0.16 USGS gage #03274200, 1961-69 data
Harmonic Mean Flow cfs annual 0.23 USGS gage #03272800, 1960-72 data
Banklick Creek at Mouth
7Q10 cfs annual 0.01 USGS gage #03274200, 1961-69 data
1Q10 cfs annual 0.01 USGS gage #03274200, 1961-69 data
30Q10 cfs summer 0.02 USGS gage #03274200, 1961-69 data
winter 0.05 USGS gage #03274200, 1961-69 data
Harmonic Mean Flow cfs annual 0.07 USGS gage #03272800, 1960-72 data
Twomile Creek at Mouth
7Q10 cfs annual 0.02 USGS gage #03274200, 1961-69 data
1Q10 cfs annual 0.02 USGS gage #03274200, 1961-69 data
30Q10 cfs summer 0.02 USGS gage #03274200, 1961-69 data
winter 0.06 USGS gage #03274200, 1961-69 data
Harmonic Mean Flow cfs annual 0.1 USGS gage #03272800, 1960-72 data
Paddy’s Run at Mouth
7Q10 cfs annual 0.03 USGS gage #03274200, 1961-69 data
1Q10 cfs annual 0.03 USGS gage #03274200, 1961-69 data
30Q10 cfs summer 0.05 USGS gage #03274200, 1961-69 data
winter 0.13 USGS gage #03274200, 1961-69 data
Harmonic Mean Flow cfs annual 0.19 USGS gage #03272800, 1960-72 data
Western Regional WRF
Outfall 001 flow rate cfs (MGD) avg. 30.94 (20.0) NPDES permit application
Background Water Quality for the Great Miami River
Fact Sheet for NPDES Permit Renewal, Western Regional Water Reclamation Facility, 2015
-30-
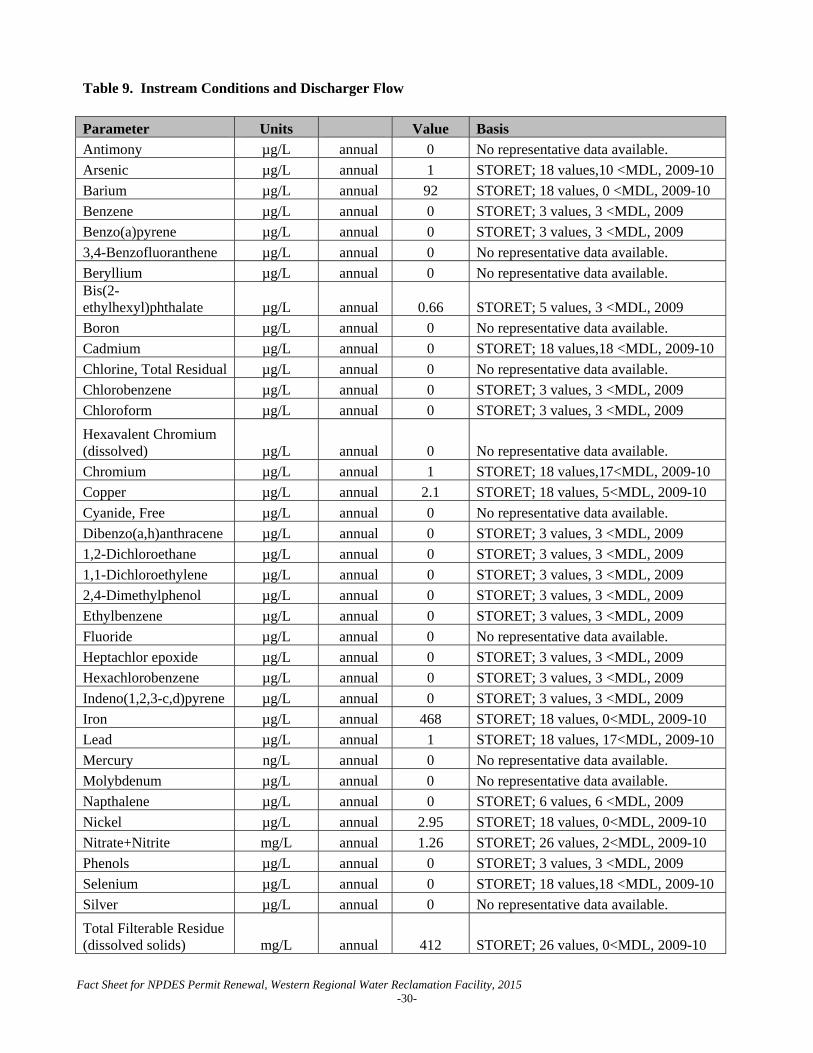
Table 9. Instream Conditions and Discharger Flow
Parameter Units Value Basis
Antimony µg/L annual 0 No representative data available.
Arsenic µg/L annual 1 STORET; 18 values,10 <MDL, 2009-10
Barium µg/L annual 92 STORET; 18 values, 0 <MDL, 2009-10
Benzene µg/L annual 0 STORET; 3 values, 3 <MDL, 2009
Benzo(a)pyrene µg/L annual 0 STORET; 3 values, 3 <MDL, 2009
3,4-Benzofluoranthene µg/L annual 0 No representative data available.
Beryllium µg/L annual 0 No representative data available. Bis(2-ethylhexyl)phthalate µg/L annual 0.66 STORET; 5 values, 3 <MDL, 2009
Boron µg/L annual 0 No representative data available.
Cadmium µg/L annual 0 STORET; 18 values,18 <MDL, 2009-10
Chlorine, Total Residual µg/L annual 0 No representative data available.
Chlorobenzene µg/L annual 0 STORET; 3 values, 3 <MDL, 2009
Chloroform µg/L annual 0 STORET; 3 values, 3 <MDL, 2009
Hexavalent Chromium (dissolved) µg/L annual 0 No representative data available.
Chromium µg/L annual 1 STORET; 18 values,17<MDL, 2009-10
Copper µg/L annual 2.1 STORET; 18 values, 5<MDL, 2009-10
Cyanide, Free µg/L annual 0 No representative data available.
Dibenzo(a,h)anthracene µg/L annual 0 STORET; 3 values, 3 <MDL, 2009
1,2-Dichloroethane µg/L annual 0 STORET; 3 values, 3 <MDL, 2009
1,1-Dichloroethylene µg/L annual 0 STORET; 3 values, 3 <MDL, 2009
2,4-Dimethylphenol µg/L annual 0 STORET; 3 values, 3 <MDL, 2009
Ethylbenzene µg/L annual 0 STORET; 3 values, 3 <MDL, 2009
Fluoride µg/L annual 0 No representative data available.
Heptachlor epoxide µg/L annual 0 STORET; 3 values, 3 <MDL, 2009
Hexachlorobenzene µg/L annual 0 STORET; 3 values, 3 <MDL, 2009
Indeno(1,2,3-c,d)pyrene µg/L annual 0 STORET; 3 values, 3 <MDL, 2009
Iron µg/L annual 468 STORET; 18 values, 0<MDL, 2009-10
Lead µg/L annual 1 STORET; 18 values, 17<MDL, 2009-10
Mercury ng/L annual 0 No representative data available.
Molybdenum µg/L annual 0 No representative data available.
Napthalene µg/L annual 0 STORET; 6 values, 6 <MDL, 2009
Nickel µg/L annual 2.95 STORET; 18 values, 0<MDL, 2009-10
Nitrate+Nitrite mg/L annual 1.26 STORET; 26 values, 2<MDL, 2009-10
Phenols µg/L annual 0 STORET; 3 values, 3 <MDL, 2009
Selenium µg/L annual 0 STORET; 18 values,18 <MDL, 2009-10
Silver µg/L annual 0 No representative data available.
Total Filterable Residue (dissolved solids) mg/L annual 412 STORET; 26 values, 0<MDL, 2009-10
Fact Sheet for NPDES Permit Renewal, Western Regional Water Reclamation Facility, 2015
-31-
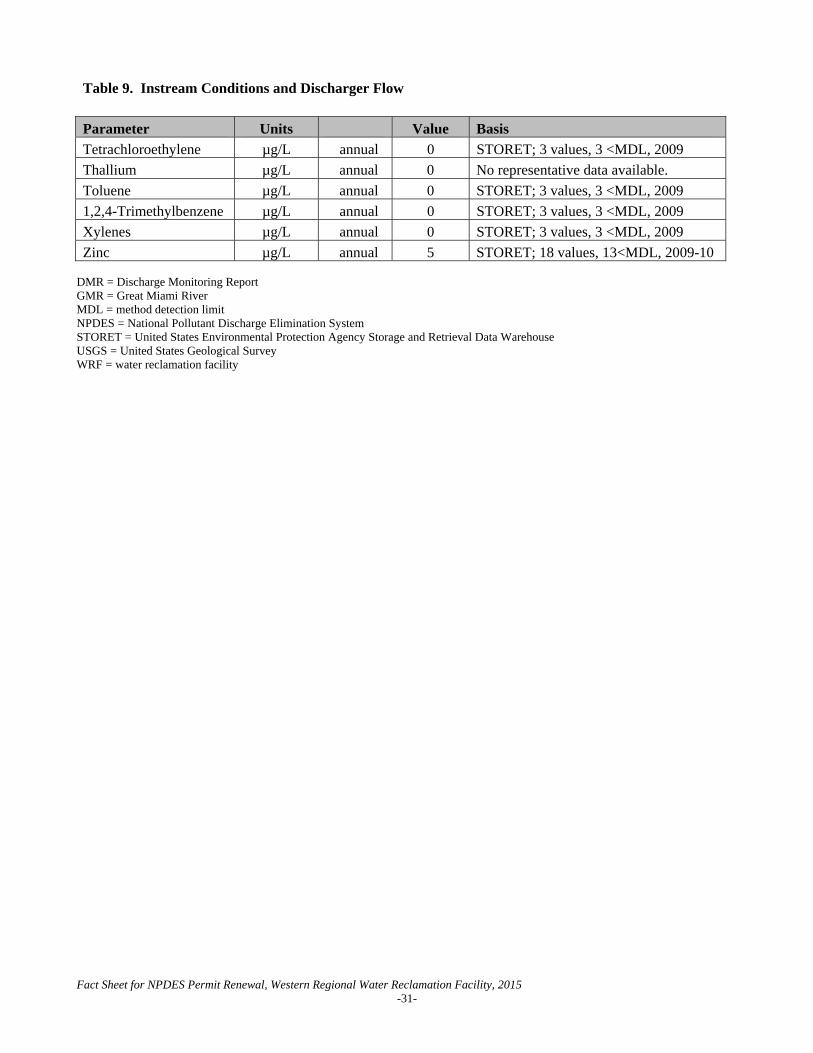
Table 9. Instream Conditions and Discharger Flow
Parameter Units Value Basis
Tetrachloroethylene µg/L annual 0 STORET; 3 values, 3 <MDL, 2009
Thallium µg/L annual 0 No representative data available.
Toluene µg/L annual 0 STORET; 3 values, 3 <MDL, 2009
1,2,4-Trimethylbenzene µg/L annual 0 STORET; 3 values, 3 <MDL, 2009
Xylenes µg/L annual 0 STORET; 3 values, 3 <MDL, 2009
Zinc µg/L annual 5 STORET; 18 values, 13<MDL, 2009-10 DMR = Discharge Monitoring Report GMR = Great Miami River MDL = method detection limit NPDES = National Pollutant Discharge Elimination System STORET = United States Environmental Protection Agency Storage and Retrieval Data Warehouse USGS = United States Geological Survey WRF = water reclamation facility
Fact Sheet for NPDES Permit Renewal, Western Regional Water Reclamation Facility, 2015
-32-
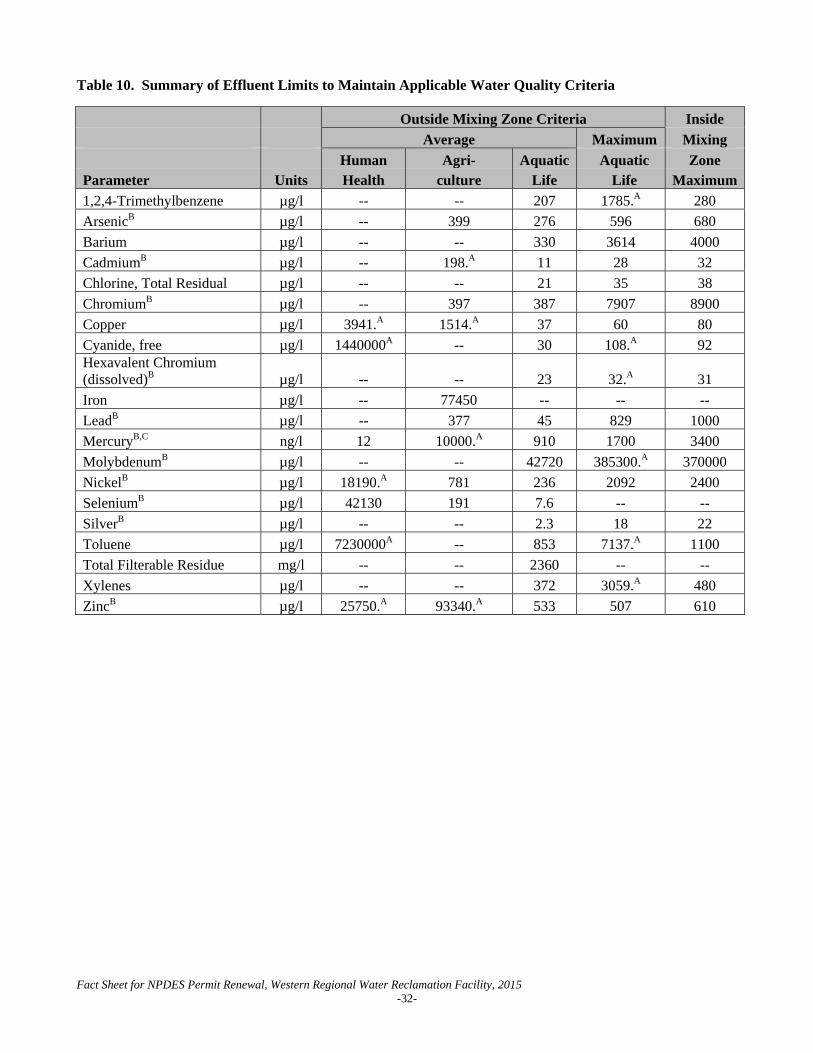
Table 10. Summary of Effluent Limits to Maintain Applicable Water Quality Criteria
Outside Mixing Zone Criteria Inside
Average Maximum Mixing
Human Agri- Aquatic Aquatic Zone Parameter Units Health culture Life Life Maximum
1,2,4-Trimethylbenzene µg/l -- -- 207 1785.A 280
ArsenicB µg/l -- 399 276 596 680
Barium µg/l -- -- 330 3614 4000
CadmiumB µg/l -- 198.A 11 28 32
Chlorine, Total Residual µg/l -- -- 21 35 38
ChromiumB µg/l -- 397 387 7907 8900
Copper µg/l 3941.A 1514.A 37 60 80
Cyanide, free µg/l 1440000A -- 30 108.A 92 Hexavalent Chromium (dissolved)B µg/l -- -- 23 32.A 31
Iron µg/l -- 77450 -- -- --
LeadB µg/l -- 377 45 829 1000
MercuryB,C ng/l 12 10000.A 910 1700 3400
MolybdenumB µg/l -- -- 42720 385300.A 370000
NickelB µg/l 18190.A 781 236 2092 2400
SeleniumB µg/l 42130 191 7.6 -- --
SilverB µg/l -- -- 2.3 18 22
Toluene µg/l 7230000A -- 853 7137.A 1100
Total Filterable Residue mg/l -- -- 2360 -- --
Xylenes µg/l -- -- 372 3059.A 480
ZincB µg/l 25750.A 93340.A 533 507 610
Fact Sheet for NPDES Permit Renewal, Western Regional Water Reclamation Facility, 2015
-33-
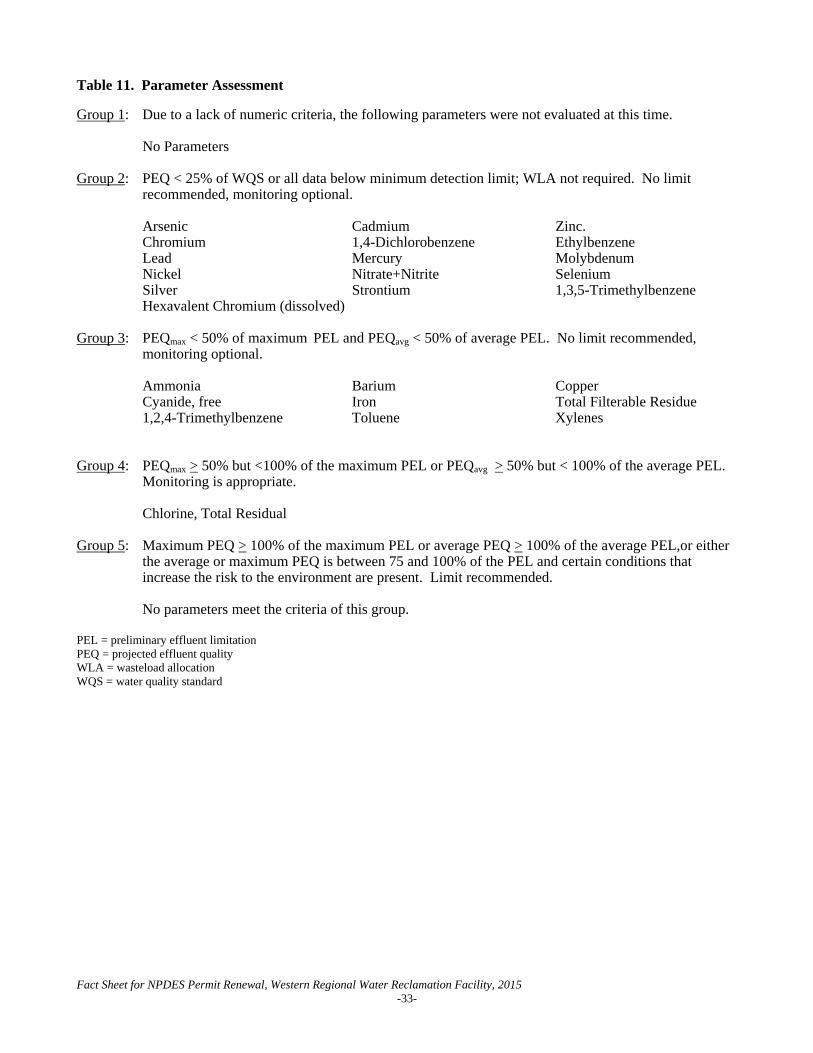
Table 11. Parameter Assessment Group 1: Due to a lack of numeric criteria, the following parameters were not evaluated at this time. No Parameters Group 2: PEQ < 25% of WQS or all data below minimum detection limit; WLA not required. No limit
recommended, monitoring optional. Arsenic Cadmium Zinc. Chromium 1,4-Dichlorobenzene Ethylbenzene Lead Mercury Molybdenum Nickel Nitrate+Nitrite Selenium Silver Strontium 1,3,5-Trimethylbenzene Hexavalent Chromium (dissolved) Group 3: PEQmax < 50% of maximum PEL and PEQavg < 50% of average PEL. No limit recommended,
monitoring optional. Ammonia Barium Copper Cyanide, free Iron Total Filterable Residue 1,2,4-Trimethylbenzene Toluene Xylenes Group 4: PEQmax > 50% but <100% of the maximum PEL or PEQavg > 50% but < 100% of the average PEL.
Monitoring is appropriate. Chlorine, Total Residual Group 5: Maximum PEQ > 100% of the maximum PEL or average PEQ > 100% of the average PEL,or either
the average or maximum PEQ is between 75 and 100% of the PEL and certain conditions that increase the risk to the environment are present. Limit recommended.
No parameters meet the criteria of this group. PEL = preliminary effluent limitation PEQ = projected effluent quality WLA = wasteload allocation WQS = water quality standard
Fact Sheet for NPDES Permit Renewal, Western Regional Water Reclamation Facility, 2015
-34-
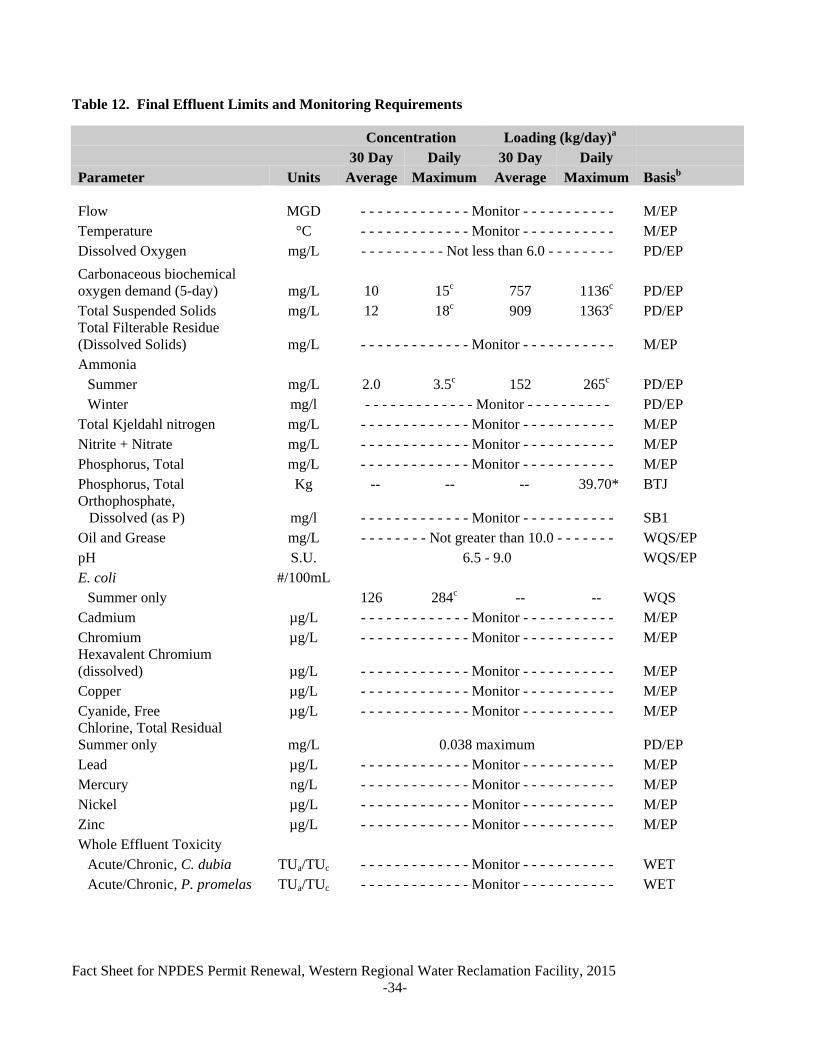
Table 12. Final Effluent Limits and Monitoring Requirements
Concentration Loading (kg/day)a 30 Day Daily 30 Day Daily
Parameter Units Average Maximum Average Maximum Basisb Flow MGD - - - - - - - - - - - - - Monitor - - - - - - - - - - - M/EP Temperature °C - - - - - - - - - - - - - Monitor - - - - - - - - - - - M/EP Dissolved Oxygen mg/L - - - - - - - - - - Not less than 6.0 - - - - - - - - PD/EP
Carbonaceous biochemical oxygen demand (5-day) mg/L 10 15c 757 1136c PD/EP Total Suspended Solids mg/L 12 18c 909 1363c PD/EP Total Filterable Residue (Dissolved Solids) mg/L - - - - - - - - - - - - - Monitor - - - - - - - - - - - M/EP Ammonia
Summer mg/L 2.0 3.5c 152 265c PD/EP Winter mg/l - - - - - - - - - - - - - Monitor - - - - - - - - - - PD/EP
Total Kjeldahl nitrogen mg/L - - - - - - - - - - - - - Monitor - - - - - - - - - - - M/EP Nitrite + Nitrate mg/L - - - - - - - - - - - - - Monitor - - - - - - - - - - - M/EP Phosphorus, Total mg/L - - - - - - - - - - - - - Monitor - - - - - - - - - - - M/EP Phosphorus, Total Kg -- -- -- 39.70* BTJ Orthophosphate, Dissolved (as P) mg/l - - - - - - - - - - - - - Monitor - - - - - - - - - - - SB1 Oil and Grease mg/L - - - - - - - - Not greater than 10.0 - - - - - - - WQS/EP pH S.U. 6.5 - 9.0 WQS/EP E. coli #/100mL
Summer only 126 284c -- -- WQS Cadmium µg/L - - - - - - - - - - - - - Monitor - - - - - - - - - - - M/EP Chromium µg/L - - - - - - - - - - - - - Monitor - - - - - - - - - - - M/EP Hexavalent Chromium (dissolved) µg/L - - - - - - - - - - - - - Monitor - - - - - - - - - - - M/EP Copper µg/L - - - - - - - - - - - - - Monitor - - - - - - - - - - - M/EP Cyanide, Free µg/L - - - - - - - - - - - - - Monitor - - - - - - - - - - - M/EP Chlorine, Total Residual Summer only mg/L 0.038 maximum PD/EP Lead µg/L - - - - - - - - - - - - - Monitor - - - - - - - - - - - M/EP Mercury ng/L - - - - - - - - - - - - - Monitor - - - - - - - - - - - M/EP Nickel µg/L - - - - - - - - - - - - - Monitor - - - - - - - - - - - M/EP Zinc µg/L - - - - - - - - - - - - - Monitor - - - - - - - - - - - M/EP Whole Effluent Toxicity
Acute/Chronic, C. dubia TUa/TUc - - - - - - - - - - - - - Monitor - - - - - - - - - - - WET Acute/Chronic, P. promelas TUa/TUc - - - - - - - - - - - - - Monitor - - - - - - - - - - - WET
Fact Sheet for NPDES Permit Renewal, Western Regional Water Reclamation Facility, 2015
-35-
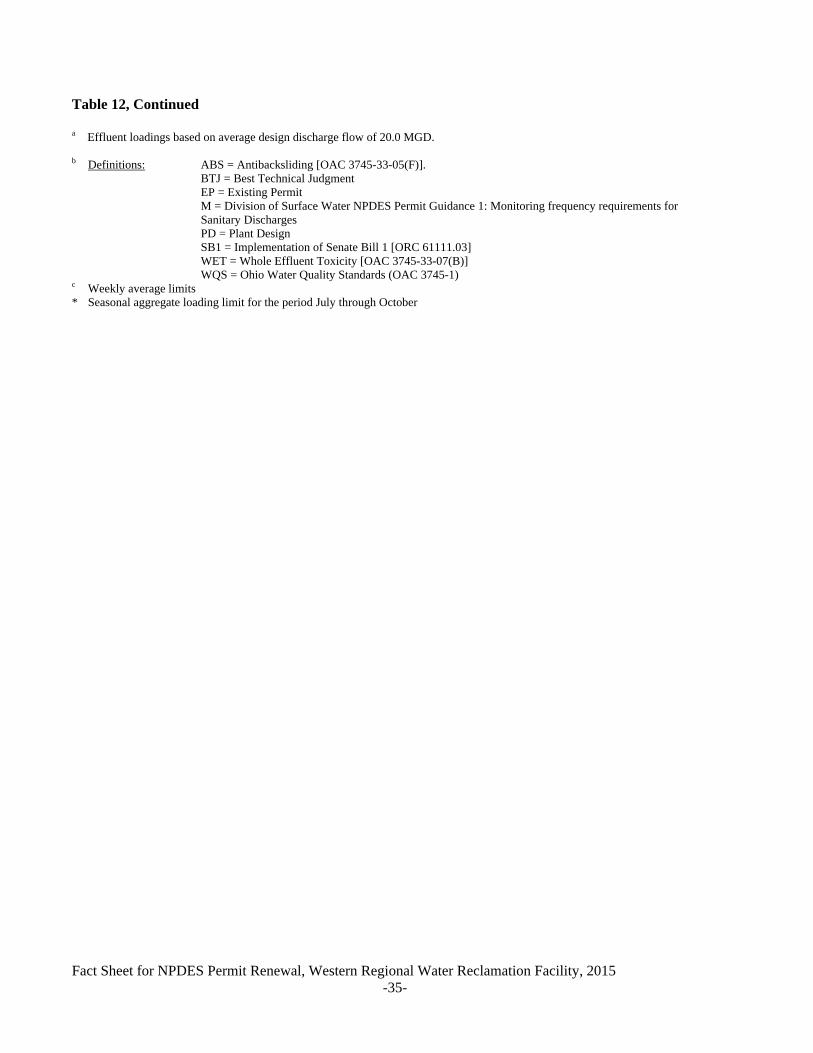
Table 12, Continued
a Effluent loadings based on average design discharge flow of 20.0 MGD. b Definitions: ABS = Antibacksliding [OAC 3745-33-05(F)]. BTJ = Best Technical Judgment EP = Existing Permit M = Division of Surface Water NPDES Permit Guidance 1: Monitoring frequency requirements for
Sanitary Discharges PD = Plant Design SB1 = Implementation of Senate Bill 1 [ORC 61111.03] WET = Whole Effluent Toxicity [OAC 3745-33-07(B)] WQS = Ohio Water Quality Standards (OAC 3745-1) c Weekly average limits * Seasonal aggregate loading limit for the period July through October
Addendum 1
Page | 1
Lower Great Miami River
Total phosphorus effluent limits for major wastewater treatment plants
Factsheet Addendum
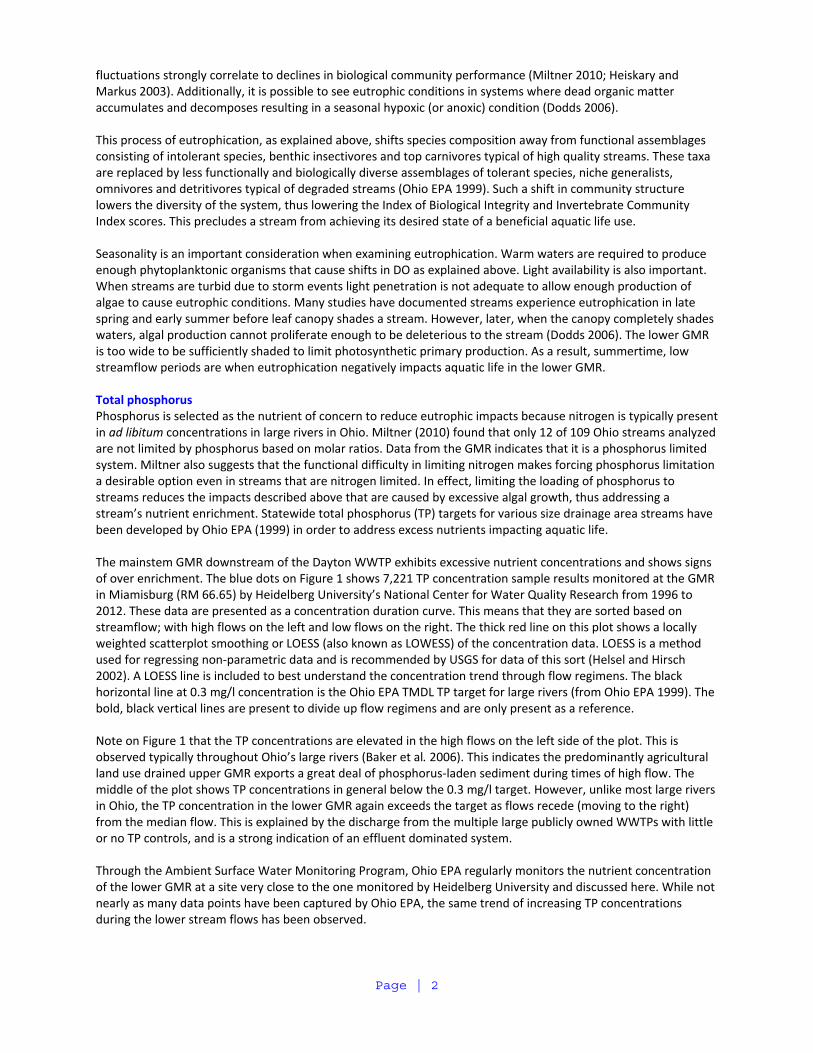
The lower Great Miami River (GMR) was assessed for its aquatic life beneficial use in 2010 as reported in Ohio EPA’s 2012 Integrated Water Quality Monitoring and Assessment Report. This study area starts at the confluence with the Mad River at river mile (RM) 81.48 and ends at the Ohio River (RM 0). Two GMR large river assessment units (05080002 90 01 and 05080002 90 02) are included in this assessment. Assessment sites within both assessment units were found to be impaired due to nutrient enrichment (RMs 52.64, 32.7, 31.4, 28.7, and 14.8). These assessment sites indicate that 14.4 river miles are directly impaired, however data show that excessive nutrient enrichment occurs throughout most of the lower GMR. The over‐enriched condition begins downstream of the Dayton wastewater treatment plant (WWTP) (RM 76.11) and continues downstream to just upstream of the confluence with the Whitewater River (RM 6.45). In addition to the biological data collected in 2010, chemical and algal data were collected from 2010 through 2012 to fully document this condition: hence, this factsheet addendum outlines the scope of nutrient enrichment in light of all available data. It also documents why Ohio EPA is seeking modest point source effluent phosphorus reductions to address the enrichment. Why point to nonpoint source trading is not an acceptable means of addressing the enrichment is also explained below.
Linkage of nutrients to aquatic life use impairment Nutrients rarely approach concentrations in the ambient environment that are toxic to aquatic life and, in small amounts, are essential to the functioning of healthy aquatic ecosystems. However, excess nutrients can manifest as multiple problems that affect the beneficial use of a stream, including causes of impairment presented in the section 303(d) list such as:
- Nutrient enrichment (biological indicators)
- Nutrient eutrophication
- Excess primary production
- Dissolved oxygen
These causes are identified by various water quality and biological indicators within the system; however, they are intrinsically linked to the root cause of excess nutrients. In general, the linkage between the causes of impairment due to nutrients can be described as follows: nutrients in excess of the needs of a balanced ecosystem increase algal and aquatic plant life production (Sharpley et al. 1994) and stimulate microbial decomposition of organic matter (Rosemond et al. 2015). This excess primary production and respiration causes negative effects, including large diel fluctuations of dissolved oxygen (DO). Large diel fluctuations of DO are caused by excessive photosynthesis (O2 production) during daylight hours and ongoing respiration (O2 consumption) during dark periods. These DO swings stress fish and macroinvertebrates and often result in DO concentrations that fall below DO water quality criterion. It is important to note that large diel fluctuations in dissolved oxygen that do not cause DO criterion exceedances are stressful to biological life. Comprehensive water quality studies in the Midwest have shown that high diel
Division of Surface WaterJune 2015
Page | 2
fluctuations strongly correlate to declines in biological community performance (Miltner 2010; Heiskary and Markus 2003). Additionally, it is possible to see eutrophic conditions in systems where dead organic matter accumulates and decomposes resulting in a seasonal hypoxic (or anoxic) condition (Dodds 2006). This process of eutrophication, as explained above, shifts species composition away from functional assemblages consisting of intolerant species, benthic insectivores and top carnivores typical of high quality streams. These taxa are replaced by less functionally and biologically diverse assemblages of tolerant species, niche generalists, omnivores and detritivores typical of degraded streams (Ohio EPA 1999). Such a shift in community structure lowers the diversity of the system, thus lowering the Index of Biological Integrity and Invertebrate Community Index scores. This precludes a stream from achieving its desired state of a beneficial aquatic life use. Seasonality is an important consideration when examining eutrophication. Warm waters are required to produce enough phytoplanktonic organisms that cause shifts in DO as explained above. Light availability is also important. When streams are turbid due to storm events light penetration is not adequate to allow enough production of algae to cause eutrophic conditions. Many studies have documented streams experience eutrophication in late spring and early summer before leaf canopy shades a stream. However, later, when the canopy completely shades waters, algal production cannot proliferate enough to be deleterious to the stream (Dodds 2006). The lower GMR is too wide to be sufficiently shaded to limit photosynthetic primary production. As a result, summertime, low streamflow periods are when eutrophication negatively impacts aquatic life in the lower GMR. Total phosphorus Phosphorus is selected as the nutrient of concern to reduce eutrophic impacts because nitrogen is typically present in ad libitum concentrations in large rivers in Ohio. Miltner (2010) found that only 12 of 109 Ohio streams analyzed are not limited by phosphorus based on molar ratios. Data from the GMR indicates that it is a phosphorus limited system. Miltner also suggests that the functional difficulty in limiting nitrogen makes forcing phosphorus limitation a desirable option even in streams that are nitrogen limited. In effect, limiting the loading of phosphorus to streams reduces the impacts described above that are caused by excessive algal growth, thus addressing a stream’s nutrient enrichment. Statewide total phosphorus (TP) targets for various size drainage area streams have been developed by Ohio EPA (1999) in order to address excess nutrients impacting aquatic life. The mainstem GMR downstream of the Dayton WWTP exhibits excessive nutrient concentrations and shows signs of over enrichment. The blue dots on Figure 1 shows 7,221 TP concentration sample results monitored at the GMR in Miamisburg (RM 66.65) by Heidelberg University’s National Center for Water Quality Research from 1996 to 2012. These data are presented as a concentration duration curve. This means that they are sorted based on streamflow; with high flows on the left and low flows on the right. The thick red line on this plot shows a locally weighted scatterplot smoothing or LOESS (also known as LOWESS) of the concentration data. LOESS is a method used for regressing non‐parametric data and is recommended by USGS for data of this sort (Helsel and Hirsch 2002). A LOESS line is included to best understand the concentration trend through flow regimens. The black horizontal line at 0.3 mg/l concentration is the Ohio EPA TMDL TP target for large rivers (from Ohio EPA 1999). The bold, black vertical lines are present to divide up flow regimens and are only present as a reference. Note on Figure 1 that the TP concentrations are elevated in the high flows on the left side of the plot. This is observed typically throughout Ohio’s large rivers (Baker et al. 2006). This indicates the predominantly agricultural land use drained upper GMR exports a great deal of phosphorus‐laden sediment during times of high flow. The middle of the plot shows TP concentrations in general below the 0.3 mg/l target. However, unlike most large rivers in Ohio, the TP concentration in the lower GMR again exceeds the target as flows recede (moving to the right) from the median flow. This is explained by the discharge from the multiple large publicly owned WWTPs with little or no TP controls, and is a strong indication of an effluent dominated system. Through the Ambient Surface Water Monitoring Program, Ohio EPA regularly monitors the nutrient concentration of the lower GMR at a site very close to the one monitored by Heidelberg University and discussed here. While not nearly as many data points have been captured by Ohio EPA, the same trend of increasing TP concentrations during the lower stream flows has been observed.
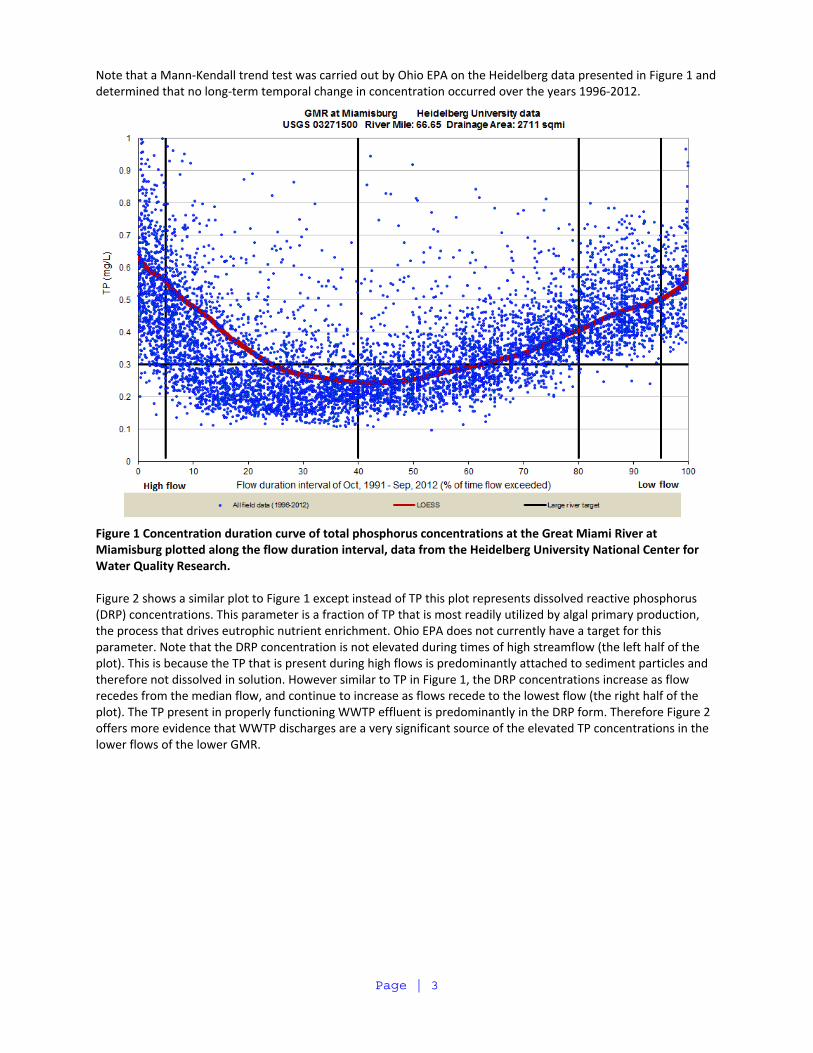
Page | 3
Note that a Mann‐Kendall trend test was carried out by Ohio EPA on the Heidelberg data presented in Figure 1 and determined that no long‐term temporal change in concentration occurred over the years 1996‐2012.
Figure 1 Concentration duration curve of total phosphorus concentrations at the Great Miami River at Miamisburg plotted along the flow duration interval, data from the Heidelberg University National Center for Water Quality Research. Figure 2 shows a similar plot to Figure 1 except instead of TP this plot represents dissolved reactive phosphorus (DRP) concentrations. This parameter is a fraction of TP that is most readily utilized by algal primary production, the process that drives eutrophic nutrient enrichment. Ohio EPA does not currently have a target for this parameter. Note that the DRP concentration is not elevated during times of high streamflow (the left half of the plot). This is because the TP that is present during high flows is predominantly attached to sediment particles and therefore not dissolved in solution. However similar to TP in Figure 1, the DRP concentrations increase as flow recedes from the median flow, and continue to increase as flows recede to the lowest flow (the right half of the plot). The TP present in properly functioning WWTP effluent is predominantly in the DRP form. Therefore Figure 2 offers more evidence that WWTP discharges are a very significant source of the elevated TP concentrations in the lower flows of the lower GMR.
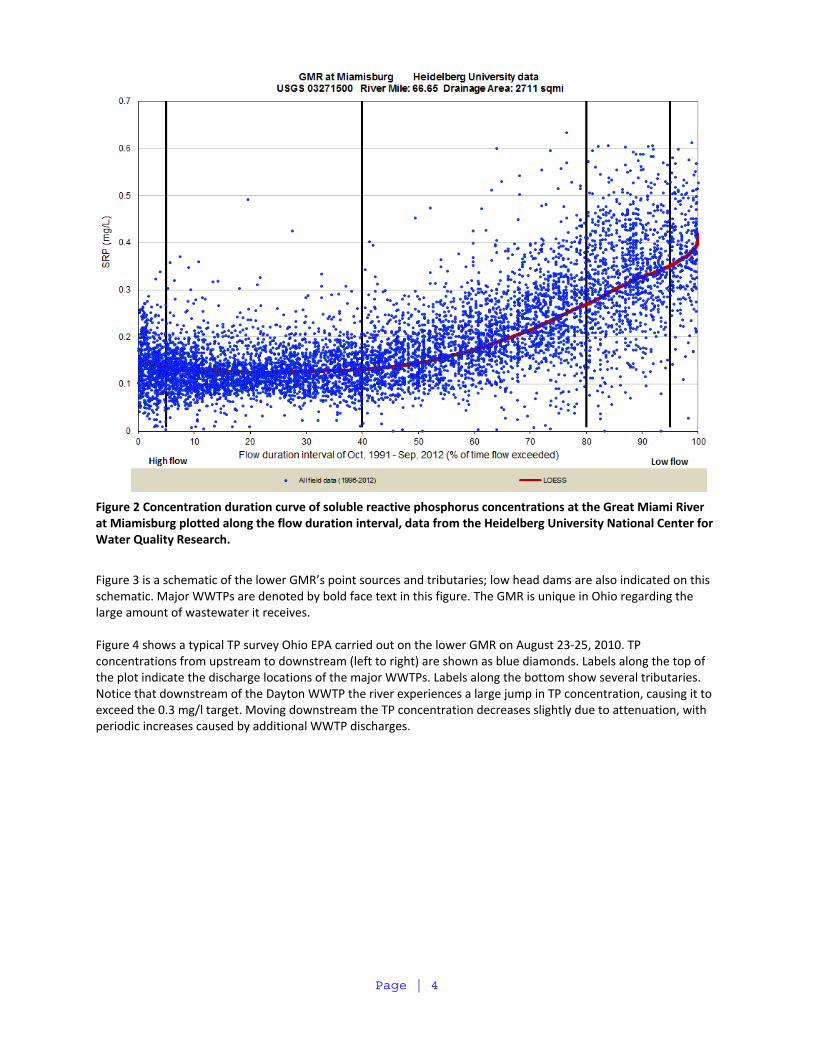
Page | 4
Figure 2 Concentration duration curve of soluble reactive phosphorus concentrations at the Great Miami River at Miamisburg plotted along the flow duration interval, data from the Heidelberg University National Center for Water Quality Research.
Figure 3 is a schematic of the lower GMR’s point sources and tributaries; low head dams are also indicated on this schematic. Major WWTPs are denoted by bold face text in this figure. The GMR is unique in Ohio regarding the large amount of wastewater it receives. Figure 4 shows a typical TP survey Ohio EPA carried out on the lower GMR on August 23‐25, 2010. TP concentrations from upstream to downstream (left to right) are shown as blue diamonds. Labels along the top of the plot indicate the discharge locations of the major WWTPs. Labels along the bottom show several tributaries. Notice that downstream of the Dayton WWTP the river experiences a large jump in TP concentration, causing it to exceed the 0.3 mg/l target. Moving downstream the TP concentration decreases slightly due to attenuation, with periodic increases caused by additional WWTP discharges.
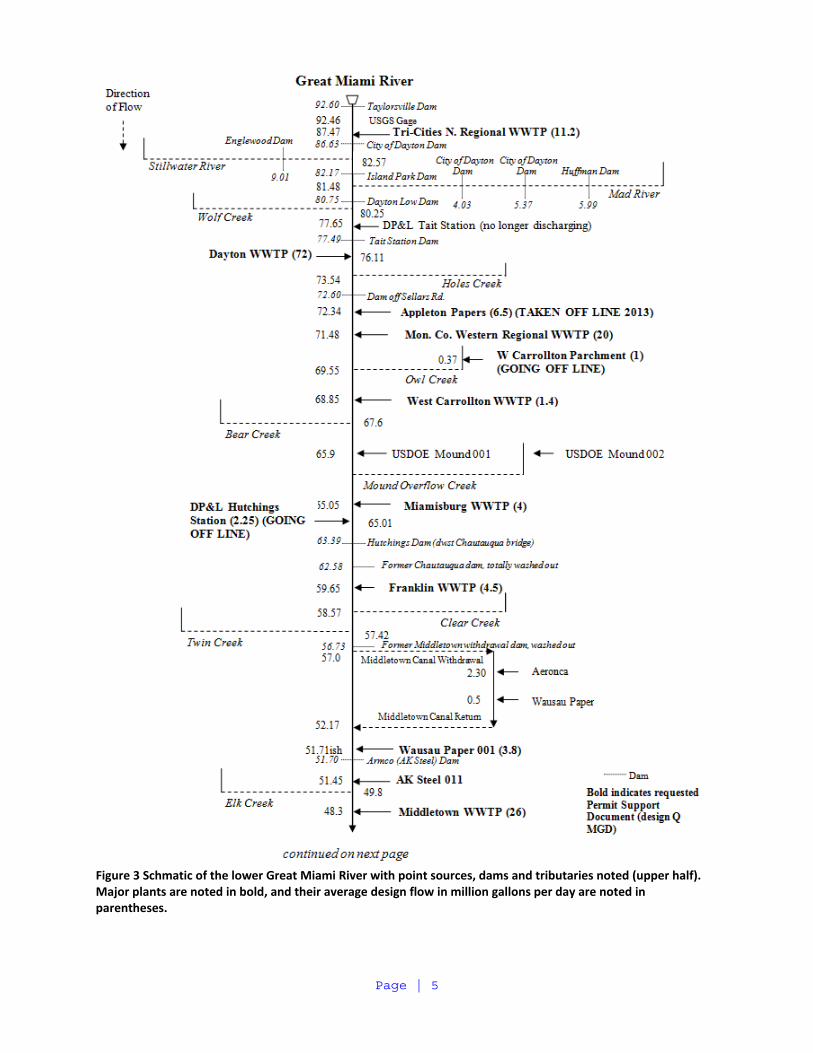
Page | 5
Figure 3 Schmatic of the lower Great Miami River with point sources, dams and tributaries noted (upper half). Major plants are noted in bold, and their average design flow in million gallons per day are noted in parentheses.

Page | 6
Figure 3 (continued) Schmatic of the lower Great Miami River with point sources, dams and tributaries noted (lower half). Major plants are noted in bold, and their average design flow in million gallons per day are noted in parentheses.
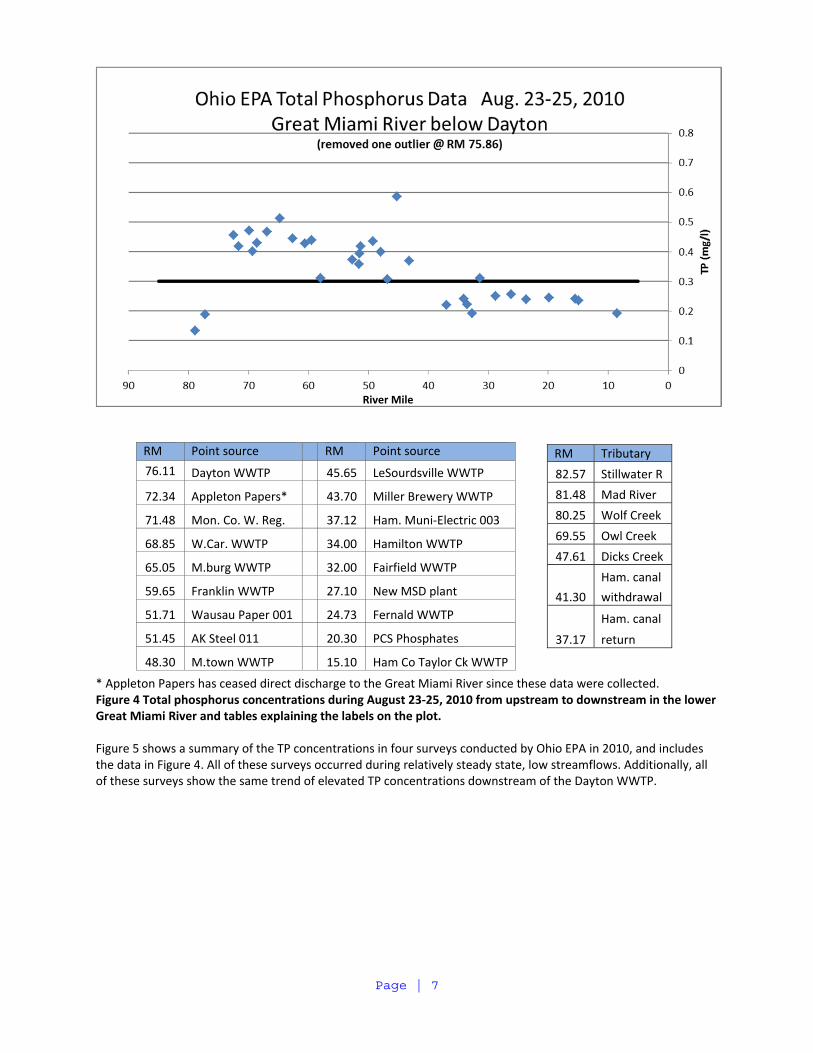
Page | 7
* Appleton Papers has ceased direct discharge to the Great Miami River since these data were collected. Figure 4 Total phosphorus concentrations during August 23‐25, 2010 from upstream to downstream in the lower Great Miami River and tables explaining the labels on the plot. Figure 5 shows a summary of the TP concentrations in four surveys conducted by Ohio EPA in 2010, and includes the data in Figure 4. All of these surveys occurred during relatively steady state, low streamflows. Additionally, all of these surveys show the same trend of elevated TP concentrations downstream of the Dayton WWTP.
RM Point source RM Point source
76.11 Dayton WWTP 45.65 LeSourdsville WWTP
72.34 Appleton Papers* 43.70 Miller Brewery WWTP
71.48 Mon. Co. W. Reg. 37.12 Ham. Muni‐Electric 003
68.85 W.Car. WWTP 34.00 Hamilton WWTP
65.05 M.burg WWTP 32.00 Fairfield WWTP
59.65 Franklin WWTP 27.10 New MSD plant
51.71 Wausau Paper 001 24.73 Fernald WWTP
51.45 AK Steel 011 20.30 PCS Phosphates
48.30 M.town WWTP 15.10 Ham Co Taylor Ck WWTP
RM Tributary
82.57 Stillwater R
81.48 Mad River
80.25 Wolf Creek
69.55 Owl Creek
47.61 Dicks Creek
41.30
Ham. canal
withdrawal
37.17
Ham. canal
return
River Mile
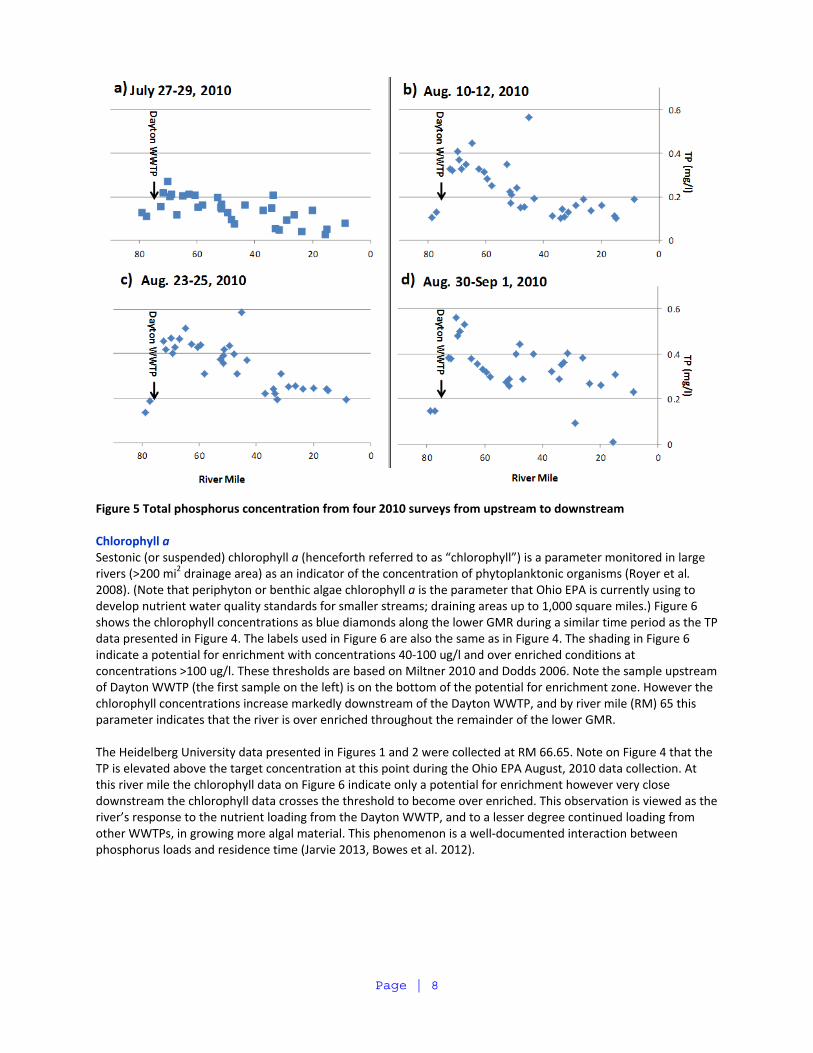
Page | 8
Figure 5 Total phosphorus concentration from four 2010 surveys from upstream to downstream Chlorophyll a Sestonic (or suspended) chlorophyll a (henceforth referred to as “chlorophyll”) is a parameter monitored in large rivers (>200 mi2 drainage area) as an indicator of the concentration of phytoplanktonic organisms (Royer et al. 2008). (Note that periphyton or benthic algae chlorophyll a is the parameter that Ohio EPA is currently using to develop nutrient water quality standards for smaller streams; draining areas up to 1,000 square miles.) Figure 6 shows the chlorophyll concentrations as blue diamonds along the lower GMR during a similar time period as the TP data presented in Figure 4. The labels used in Figure 6 are also the same as in Figure 4. The shading in Figure 6 indicate a potential for enrichment with concentrations 40‐100 ug/l and over enriched conditions at concentrations >100 ug/l. These thresholds are based on Miltner 2010 and Dodds 2006. Note the sample upstream of Dayton WWTP (the first sample on the left) is on the bottom of the potential for enrichment zone. However the chlorophyll concentrations increase markedly downstream of the Dayton WWTP, and by river mile (RM) 65 this parameter indicates that the river is over enriched throughout the remainder of the lower GMR. The Heidelberg University data presented in Figures 1 and 2 were collected at RM 66.65. Note on Figure 4 that the TP is elevated above the target concentration at this point during the Ohio EPA August, 2010 data collection. At this river mile the chlorophyll data on Figure 6 indicate only a potential for enrichment however very close downstream the chlorophyll data crosses the threshold to become over enriched. This observation is viewed as the river’s response to the nutrient loading from the Dayton WWTP, and to a lesser degree continued loading from other WWTPs, in growing more algal material. This phenomenon is a well‐documented interaction between phosphorus loads and residence time (Jarvie 2013, Bowes et al. 2012).
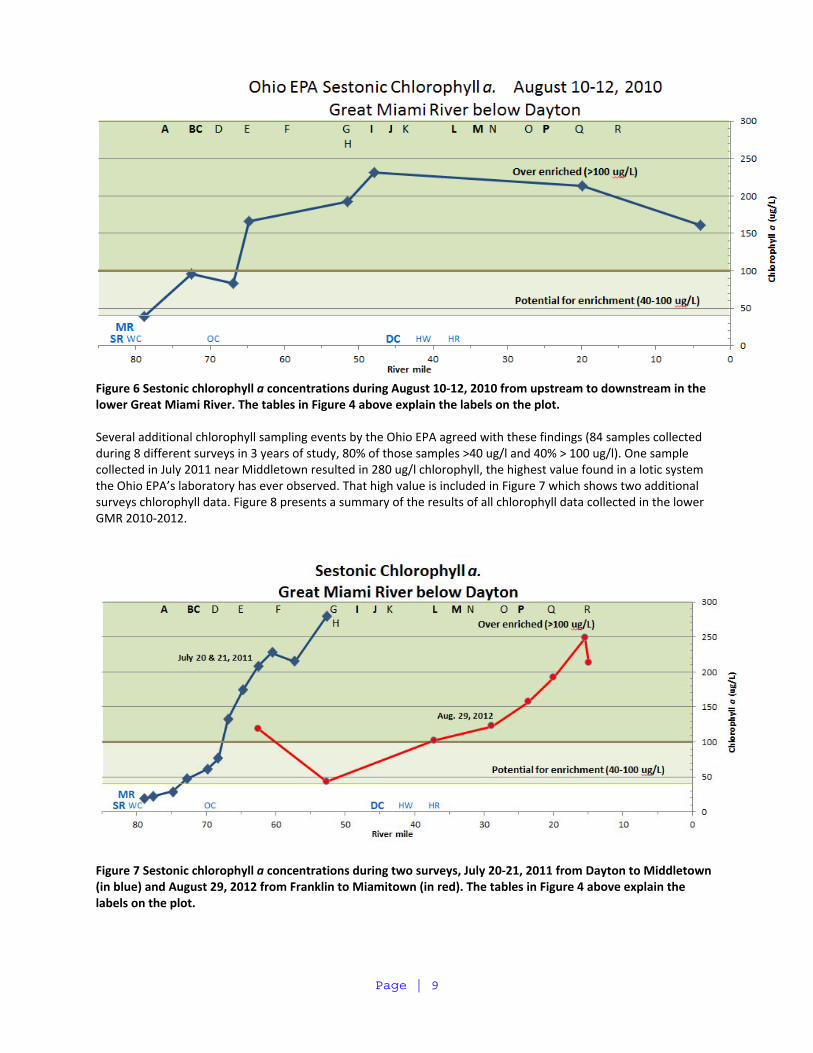
Page | 9
Figure 6 Sestonic chlorophyll a concentrations during August 10‐12, 2010 from upstream to downstream in the lower Great Miami River. The tables in Figure 4 above explain the labels on the plot. Several additional chlorophyll sampling events by the Ohio EPA agreed with these findings (84 samples collected during 8 different surveys in 3 years of study, 80% of those samples >40 ug/l and 40% > 100 ug/l). One sample collected in July 2011 near Middletown resulted in 280 ug/l chlorophyll, the highest value found in a lotic system the Ohio EPA’s laboratory has ever observed. That high value is included in Figure 7 which shows two additional surveys chlorophyll data. Figure 8 presents a summary of the results of all chlorophyll data collected in the lower GMR 2010‐2012.
Figure 7 Sestonic chlorophyll a concentrations during two surveys, July 20‐21, 2011 from Dayton to Middletown (in blue) and August 29, 2012 from Franklin to Miamitown (in red). The tables in Figure 4 above explain the labels on the plot.
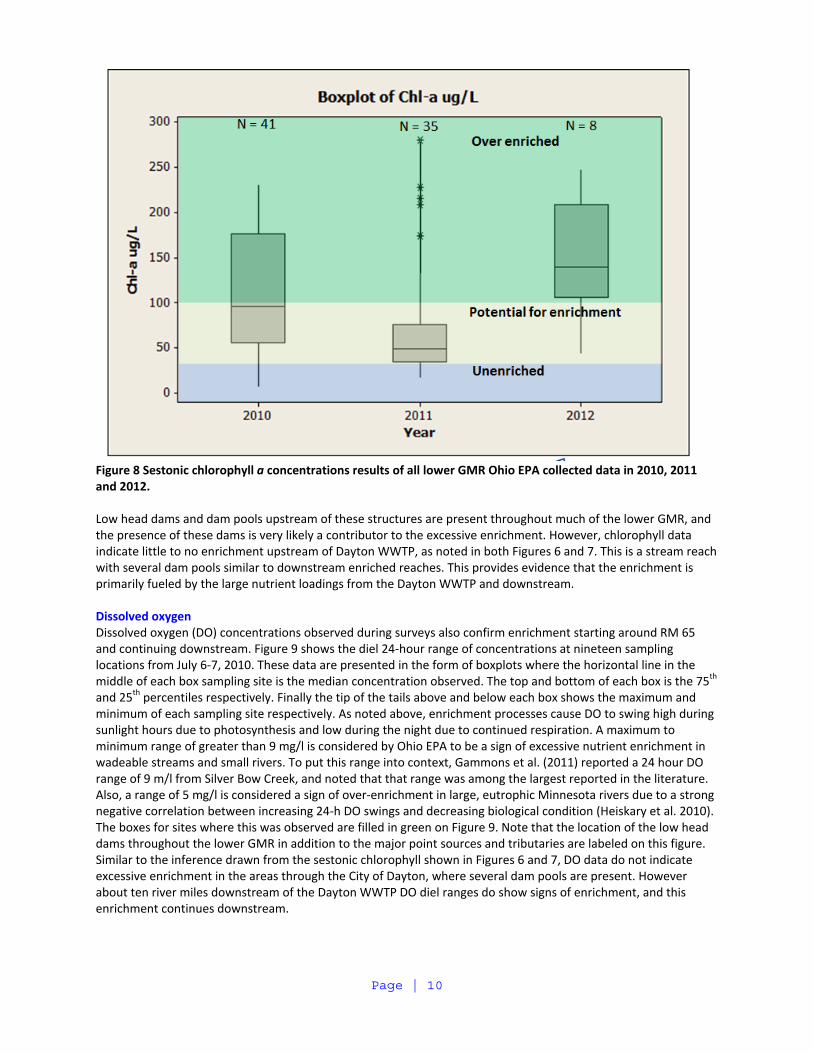
Page | 10
Figure 8 Sestonic chlorophyll a concentrations results of all lower GMR Ohio EPA collected data in 2010, 2011 and 2012. Low head dams and dam pools upstream of these structures are present throughout much of the lower GMR, and the presence of these dams is very likely a contributor to the excessive enrichment. However, chlorophyll data indicate little to no enrichment upstream of Dayton WWTP, as noted in both Figures 6 and 7. This is a stream reach with several dam pools similar to downstream enriched reaches. This provides evidence that the enrichment is primarily fueled by the large nutrient loadings from the Dayton WWTP and downstream. Dissolved oxygen Dissolved oxygen (DO) concentrations observed during surveys also confirm enrichment starting around RM 65 and continuing downstream. Figure 9 shows the diel 24‐hour range of concentrations at nineteen sampling locations from July 6‐7, 2010. These data are presented in the form of boxplots where the horizontal line in the middle of each box sampling site is the median concentration observed. The top and bottom of each box is the 75th and 25th percentiles respectively. Finally the tip of the tails above and below each box shows the maximum and minimum of each sampling site respectively. As noted above, enrichment processes cause DO to swing high during sunlight hours due to photosynthesis and low during the night due to continued respiration. A maximum to minimum range of greater than 9 mg/l is considered by Ohio EPA to be a sign of excessive nutrient enrichment in wadeable streams and small rivers. To put this range into context, Gammons et al. (2011) reported a 24 hour DO range of 9 m/l from Silver Bow Creek, and noted that that range was among the largest reported in the literature. Also, a range of 5 mg/l is considered a sign of over‐enrichment in large, eutrophic Minnesota rivers due to a strong negative correlation between increasing 24‐h DO swings and decreasing biological condition (Heiskary et al. 2010). The boxes for sites where this was observed are filled in green on Figure 9. Note that the location of the low head dams throughout the lower GMR in addition to the major point sources and tributaries are labeled on this figure. Similar to the inference drawn from the sestonic chlorophyll shown in Figures 6 and 7, DO data do not indicate excessive enrichment in the areas through the City of Dayton, where several dam pools are present. However about ten river miles downstream of the Dayton WWTP DO diel ranges do show signs of enrichment, and this enrichment continues downstream.
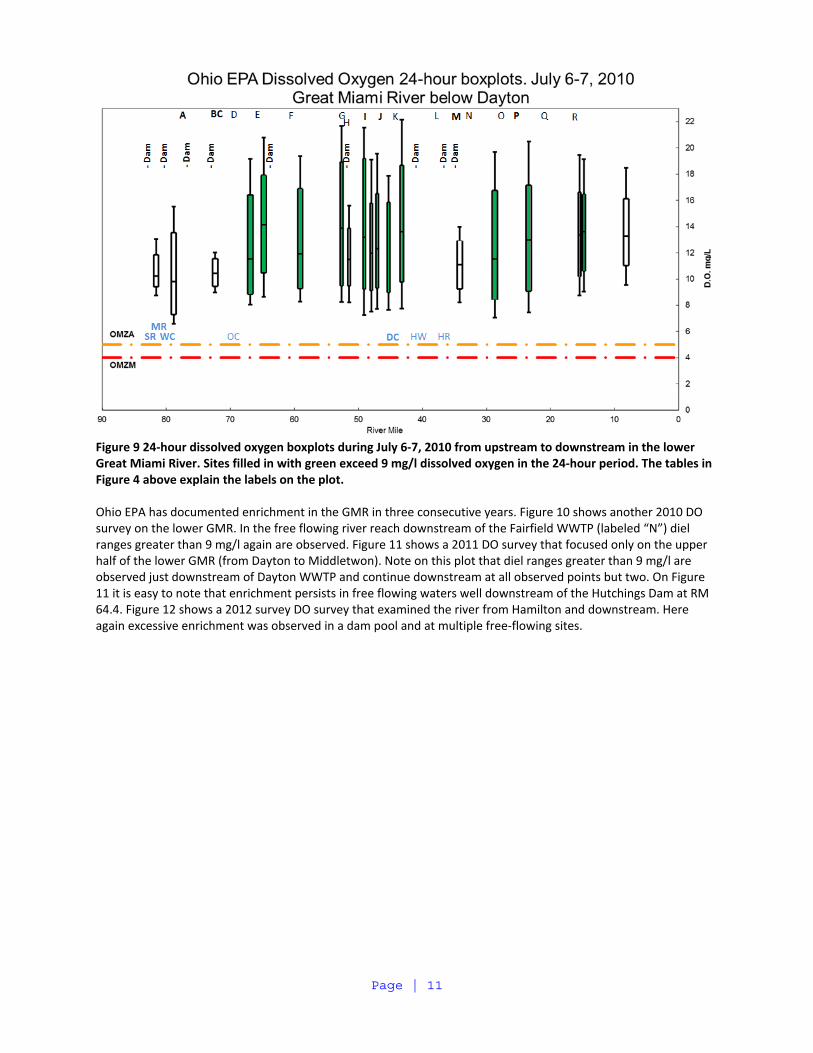
Page | 11
Figure 9 24‐hour dissolved oxygen boxplots during July 6‐7, 2010 from upstream to downstream in the lower Great Miami River. Sites filled in with green exceed 9 mg/l dissolved oxygen in the 24‐hour period. The tables in Figure 4 above explain the labels on the plot. Ohio EPA has documented enrichment in the GMR in three consecutive years. Figure 10 shows another 2010 DO survey on the lower GMR. In the free flowing river reach downstream of the Fairfield WWTP (labeled “N”) diel ranges greater than 9 mg/l again are observed. Figure 11 shows a 2011 DO survey that focused only on the upper half of the lower GMR (from Dayton to Middletwon). Note on this plot that diel ranges greater than 9 mg/l are observed just downstream of Dayton WWTP and continue downstream at all observed points but two. On Figure 11 it is easy to note that enrichment persists in free flowing waters well downstream of the Hutchings Dam at RM 64.4. Figure 12 shows a 2012 survey DO survey that examined the river from Hamilton and downstream. Here again excessive enrichment was observed in a dam pool and at multiple free‐flowing sites.
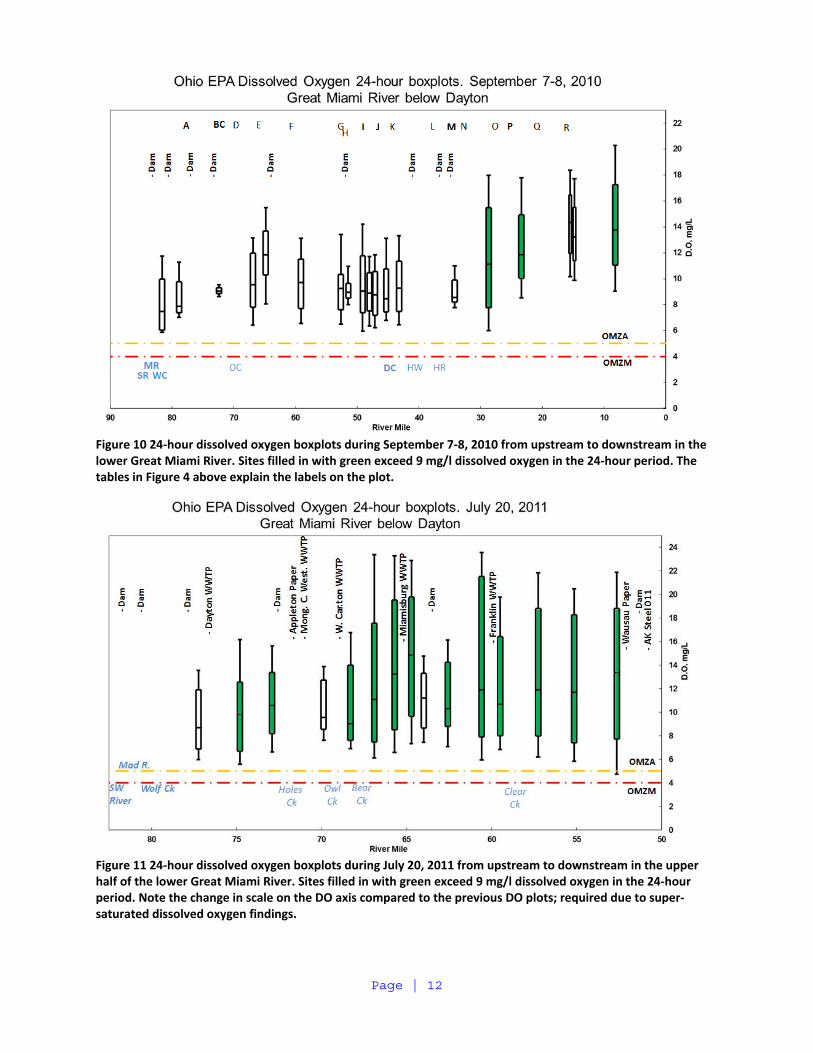
Page | 12
Figure 10 24‐hour dissolved oxygen boxplots during September 7‐8, 2010 from upstream to downstream in the lower Great Miami River. Sites filled in with green exceed 9 mg/l dissolved oxygen in the 24‐hour period. The tables in Figure 4 above explain the labels on the plot.
Figure 11 24‐hour dissolved oxygen boxplots during July 20, 2011 from upstream to downstream in the upper half of the lower Great Miami River. Sites filled in with green exceed 9 mg/l dissolved oxygen in the 24‐hour period. Note the change in scale on the DO axis compared to the previous DO plots; required due to super‐saturated dissolved oxygen findings.
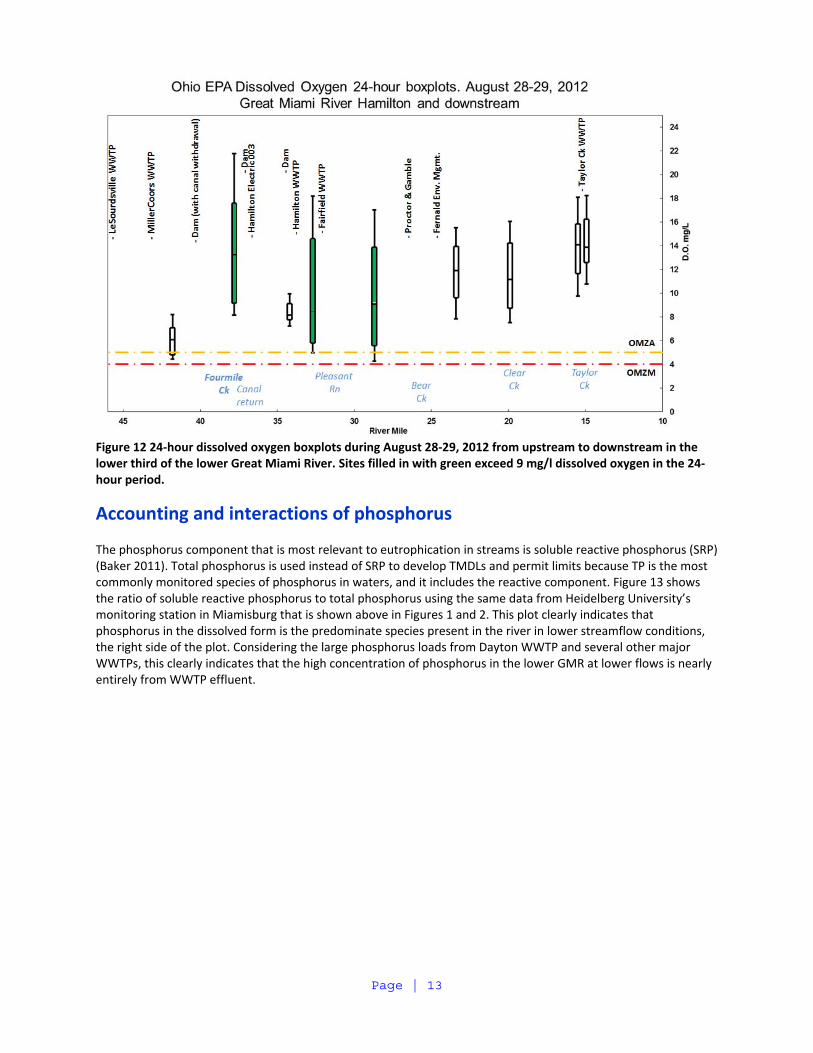
Page | 13
Figure 12 24‐hour dissolved oxygen boxplots during August 28‐29, 2012 from upstream to downstream in the lower third of the lower Great Miami River. Sites filled in with green exceed 9 mg/l dissolved oxygen in the 24‐hour period.
Accounting and interactions of phosphorus The phosphorus component that is most relevant to eutrophication in streams is soluble reactive phosphorus (SRP) (Baker 2011). Total phosphorus is used instead of SRP to develop TMDLs and permit limits because TP is the most commonly monitored species of phosphorus in waters, and it includes the reactive component. Figure 13 shows the ratio of soluble reactive phosphorus to total phosphorus using the same data from Heidelberg University’s monitoring station in Miamisburg that is shown above in Figures 1 and 2. This plot clearly indicates that phosphorus in the dissolved form is the predominate species present in the river in lower streamflow conditions, the right side of the plot. Considering the large phosphorus loads from Dayton WWTP and several other major WWTPs, this clearly indicates that the high concentration of phosphorus in the lower GMR at lower flows is nearly entirely from WWTP effluent.
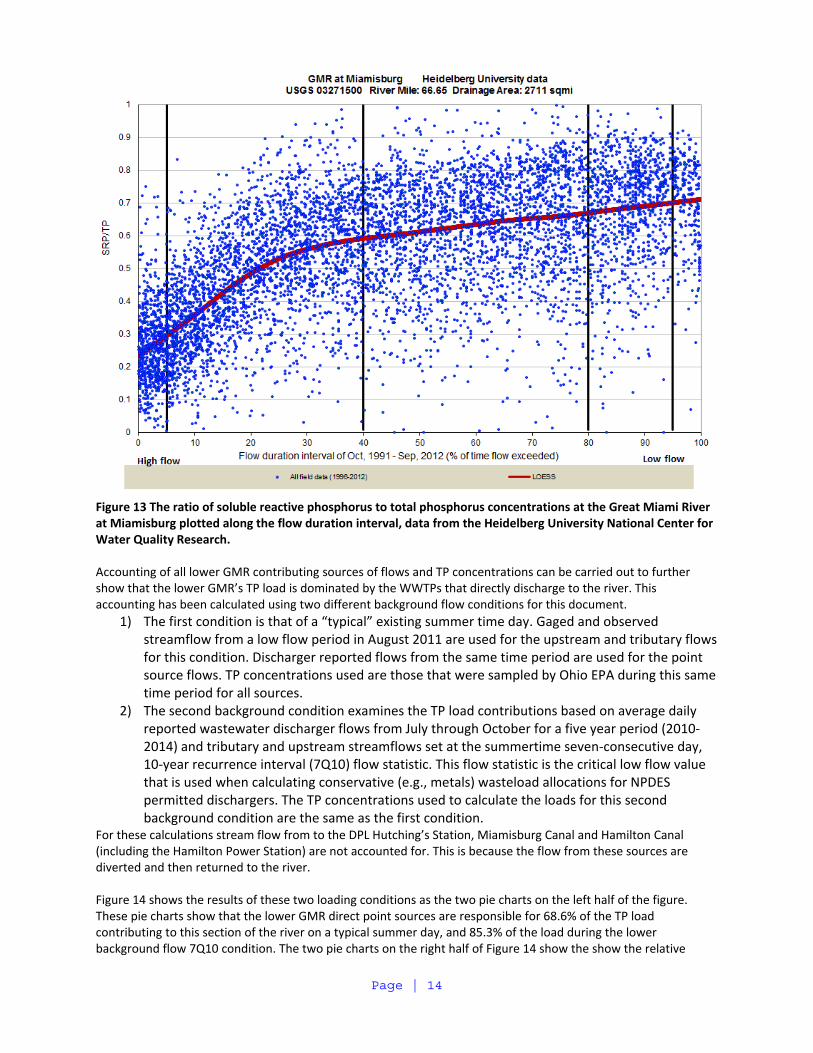
Page | 14
Figure 13 The ratio of soluble reactive phosphorus to total phosphorus concentrations at the Great Miami River at Miamisburg plotted along the flow duration interval, data from the Heidelberg University National Center for Water Quality Research. Accounting of all lower GMR contributing sources of flows and TP concentrations can be carried out to further show that the lower GMR’s TP load is dominated by the WWTPs that directly discharge to the river. This accounting has been calculated using two different background flow conditions for this document.
1) The first condition is that of a “typical” existing summer time day. Gaged and observed streamflow from a low flow period in August 2011 are used for the upstream and tributary flows for this condition. Discharger reported flows from the same time period are used for the point source flows. TP concentrations used are those that were sampled by Ohio EPA during this same time period for all sources.
2) The second background condition examines the TP load contributions based on average daily reported wastewater discharger flows from July through October for a five year period (2010‐2014) and tributary and upstream streamflows set at the summertime seven‐consecutive day, 10‐year recurrence interval (7Q10) flow statistic. This flow statistic is the critical low flow value that is used when calculating conservative (e.g., metals) wasteload allocations for NPDES permitted dischargers. The TP concentrations used to calculate the loads for this second background condition are the same as the first condition.
For these calculations stream flow from to the DPL Hutching’s Station, Miamisburg Canal and Hamilton Canal (including the Hamilton Power Station) are not accounted for. This is because the flow from these sources are diverted and then returned to the river. Figure 14 shows the results of these two loading conditions as the two pie charts on the left half of the figure. These pie charts show that the lower GMR direct point sources are responsible for 68.6% of the TP load contributing to this section of the river on a typical summer day, and 85.3% of the load during the lower background flow 7Q10 condition. The two pie charts on the right half of Figure 14 show the show the relative
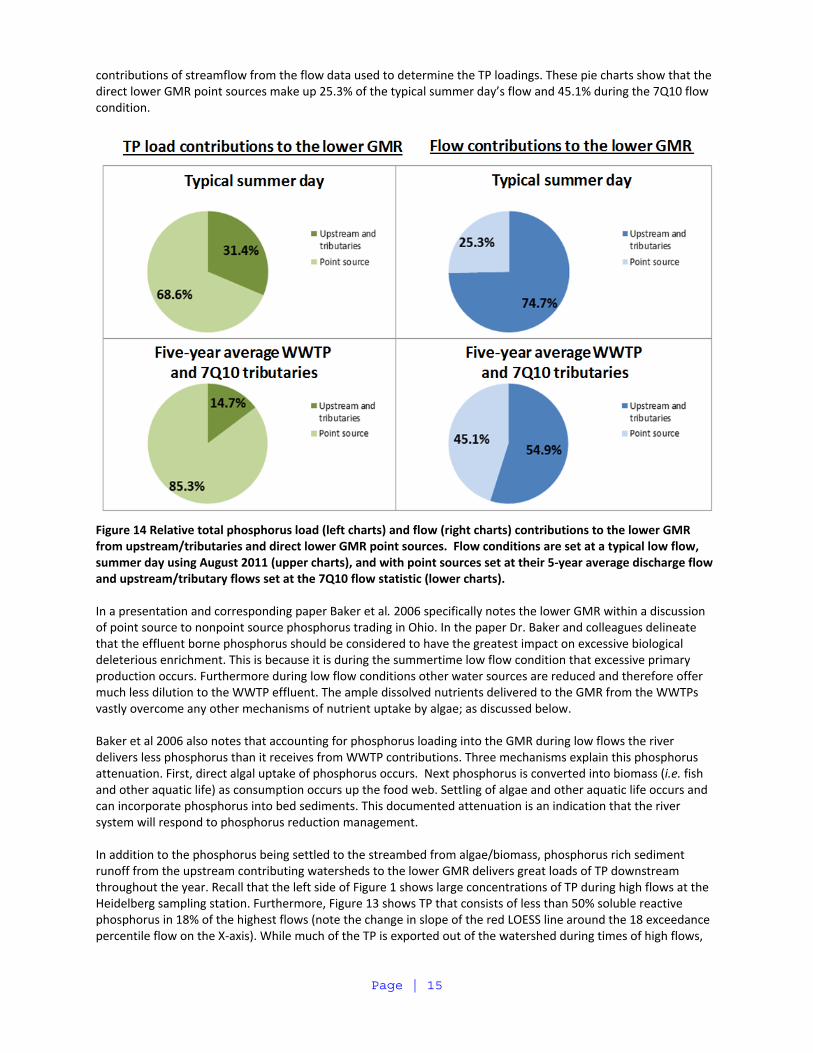
Page | 15
contributions of streamflow from the flow data used to determine the TP loadings. These pie charts show that the direct lower GMR point sources make up 25.3% of the typical summer day’s flow and 45.1% during the 7Q10 flow condition.
Figure 14 Relative total phosphorus load (left charts) and flow (right charts) contributions to the lower GMR from upstream/tributaries and direct lower GMR point sources. Flow conditions are set at a typical low flow, summer day using August 2011 (upper charts), and with point sources set at their 5‐year average discharge flow and upstream/tributary flows set at the 7Q10 flow statistic (lower charts). In a presentation and corresponding paper Baker et al. 2006 specifically notes the lower GMR within a discussion of point source to nonpoint source phosphorus trading in Ohio. In the paper Dr. Baker and colleagues delineate that the effluent borne phosphorus should be considered to have the greatest impact on excessive biological deleterious enrichment. This is because it is during the summertime low flow condition that excessive primary production occurs. Furthermore during low flow conditions other water sources are reduced and therefore offer much less dilution to the WWTP effluent. The ample dissolved nutrients delivered to the GMR from the WWTPs vastly overcome any other mechanisms of nutrient uptake by algae; as discussed below. Baker et al 2006 also notes that accounting for phosphorus loading into the GMR during low flows the river delivers less phosphorus than it receives from WWTP contributions. Three mechanisms explain this phosphorus attenuation. First, direct algal uptake of phosphorus occurs. Next phosphorus is converted into biomass (i.e. fish and other aquatic life) as consumption occurs up the food web. Settling of algae and other aquatic life occurs and can incorporate phosphorus into bed sediments. This documented attenuation is an indication that the river system will respond to phosphorus reduction management. In addition to the phosphorus being settled to the streambed from algae/biomass, phosphorus rich sediment runoff from the upstream contributing watersheds to the lower GMR delivers great loads of TP downstream throughout the year. Recall that the left side of Figure 1 shows large concentrations of TP during high flows at the Heidelberg sampling station. Furthermore, Figure 13 shows TP that consists of less than 50% soluble reactive phosphorus in 18% of the highest flows (note the change in slope of the red LOESS line around the 18 exceedance percentile flow on the X‐axis). While much of the TP is exported out of the watershed during times of high flows,
Page | 16
some does settle onto the river substrate, especially so in dam pools. The fate of phosphorus settled within river substrates is next examined. Internal loading It has been well documented that in stream systems substrate sediment may provide an “internal” phosphorus load that contributes to low flow summertime algal growth. This is dependent on the mass and aerial extent of fine sediment in the stream, sediment temperature and chemistry, overlying water column concentration and the equilibrium phosphorus concentration (EPC0) of the substrate sediments (Taylor and Kinishi 1971; Kunishi et al. 1972; Meyer 1979a; Meyer 1979b). This process involves phosphorus that is locked in stream sediments desorbing to become bioavailable within the stream. The inverse can occur in which water column phosphorus can be sorbed into the stream substrate sediment. In general, for a given stream, if the overlying water column phosphorus concentration is less than the substrate’s EPC0, desorption of substrate phosphorus to the water column will occur. The reverse will happen when the overlying water column concentration is greater than the substrate substrate’s EPC0.
Ohio EPA 2015 has developed an evaluation of stream phosphorus critical conditions documenting these processes in detail as they relate to Ohio’s streams. In this paper Ohio EPA used nutrient accounting to document streams where phosphorus internal loading via desorption occurs and where phosphorus sorption to the substrate occurs following the EPC0 concept in tributaries to the GMR. A Sharpley et al. 2007 study examined the nature of streambed sediments in relation to the EPC0 concept. This research and the Ohio EPA 2015 paper found that substrates consisting of silts containing a great deal of clay are most favorable for holding more phosphorus; i.e., have relatively higher EPC0. This is because clay has properties that are favorable to holding more phosphorus. The lower GMR’s bed sediments are quite different in nature from the sediments examined in these studies. Most importantly, fine material for phosphorus to bind to in the lower GMR is scarce. Figure 15 shows the results from the Ohio EPA’s habitat assessments, or QHEI surveys, of the lower GMR. The top pie chart shows that only one assessment site out of 34 had about half of its bottom sediment as silt. The vast majority of the assessment sites have gravel and cobbles as their bed material. The lower pie chart shows that very little riffle/run embeddedness (or fine sediments within those gravel and cobbles) exist. The QHEI assessments also noted 22 sites with no bank erosion at all, and 12 with “none/moderate” bank erosion. No sites were determined to have heavy bank erosion. All of these indicators point to the fact that the lower GMR’s streambed capacity for phosphorus sorption and desorption of dissolved phosphorus is relatively small.
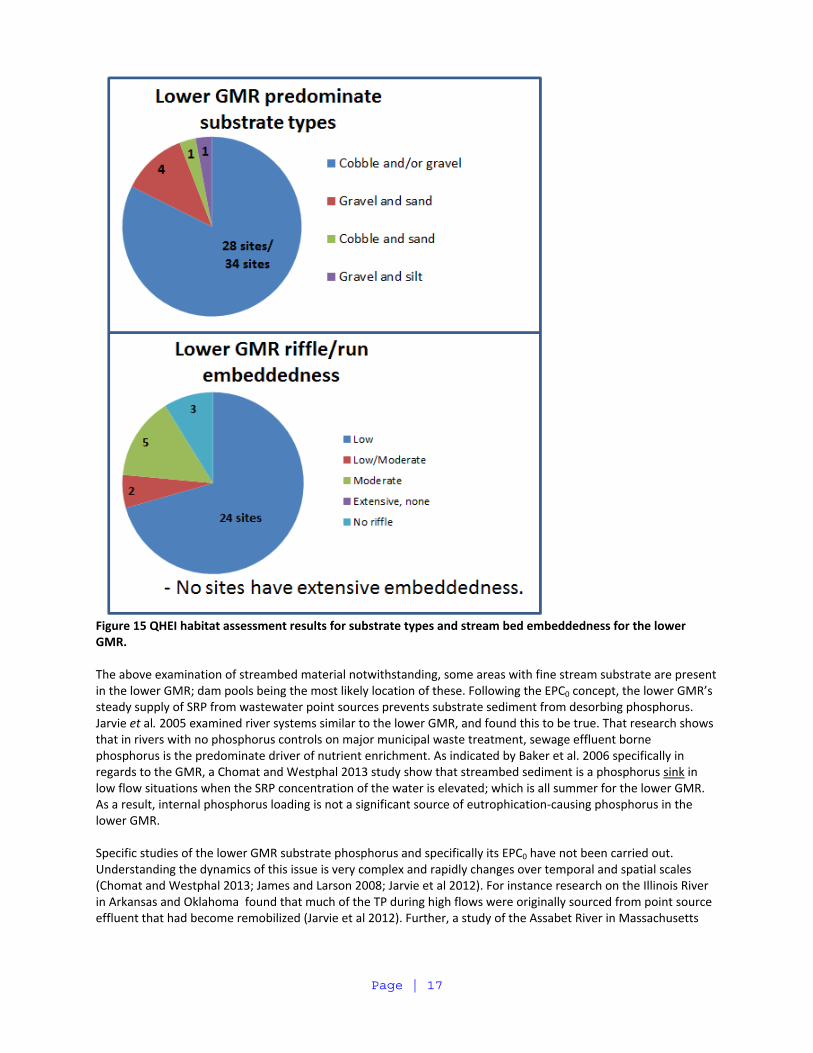
Page | 17
Figure 15 QHEI habitat assessment results for substrate types and stream bed embeddedness for the lower GMR. The above examination of streambed material notwithstanding, some areas with fine stream substrate are present in the lower GMR; dam pools being the most likely location of these. Following the EPC0 concept, the lower GMR’s steady supply of SRP from wastewater point sources prevents substrate sediment from desorbing phosphorus. Jarvie et al. 2005 examined river systems similar to the lower GMR, and found this to be true. That research shows that in rivers with no phosphorus controls on major municipal waste treatment, sewage effluent borne phosphorus is the predominate driver of nutrient enrichment. As indicated by Baker et al. 2006 specifically in regards to the GMR, a Chomat and Westphal 2013 study show that streambed sediment is a phosphorus sink in low flow situations when the SRP concentration of the water is elevated; which is all summer for the lower GMR. As a result, internal phosphorus loading is not a significant source of eutrophication‐causing phosphorus in the lower GMR. Specific studies of the lower GMR substrate phosphorus and specifically its EPC0 have not been carried out. Understanding the dynamics of this issue is very complex and rapidly changes over temporal and spatial scales (Chomat and Westphal 2013; James and Larson 2008; Jarvie et al 2012). For instance research on the Illinois River in Arkansas and Oklahoma found that much of the TP during high flows were originally sourced from point source effluent that had become remobilized (Jarvie et al 2012). Further, a study of the Assabet River in Massachusetts
Page | 18
found that dredging dam pool sediments with the idea of removing sunk nonpoint source TP would not address that river’s enrichment due to the continual discharge of TP rich effluent (Chomat and Westphal 2013). It is clear however that the amount of uncontrolled WWTP sourced TP being delivered to the lower GMR must first be addressed before internal loadings are considered. The lead engineer studying pollutant nonpoint source to point source trading coefficients for the Ohio River basin for the Electric Power Research Institute has stated that effluent TP must be reduced before streambed sediment phosphorus reductions will make any difference on the lower GMR’s enrichment (Keller, email communication, February 20, 2014). Given this, reducing nonpoint sources of phosphorus loads without reductions in effluent loadings will not ameliorate all of the nutrient enrichment impacts to the lower GMR. Once effluent phosphorus loading is reduced, other measures to reduce nutrient loadings further can be considered if they are necessary to return the river to full attaining its aquatic life use criteria. Finally, it should be noted that these measures of point source TP load reduction are protective for the lower GMR’s aquatic life use. These reductions do not address the total exported load of nutrients to the Ohio River and subsequently to the Gulf of Mexico via the Mississippi River. It is clear that efforts developed to protect the Gulf of Mexico from nutrient enrichment must consider all sources of phosphorus load delivered by the GMR. Baker et al. 2006 and others have documented that in this case the nonpoint source load of nutrients is by far the most important component as it is the majority of exported load. Ohio EPA recognizes that the relationship between nutrients in the lower Great Miami River and aquatic life indices is not entirely linear or predictable. Therefore, the agency proposes using an adaptive management approach to eliminating the impairment in the lower Great Miami River. The first step is to reduce the phosphorus inputs from the two largest and most upstream discharges (Dayton and Montgomery County Western Regional ) that appear to cause a significant increase in the total phosphorus concentrations, dissolved oxygen swings and chlorophyll‐a values in the river – as shown in figures 5, 6, 7 and 11 above. After those two inputs are reduced, and the river has time to respond, Ohio EPA will reassess the impaired sites, and determine if further improvement measures are needed. Other mitigation such as dam removal in the river during this time period is also recommended to help reduce the need for including limits in additional permits and/or reducing limits below 1.0 mg/l. Future permit decisions will consider the results of the activities and reassessment.
Page | 19
References Cited Baker DB, Richards RP, Kramer JW (2006) Point Source – nonpoint source phosphorus trading: applicability to
stream TMDLs in Ohio. In Proceedings: Innovations in Reducing Nonpoint Source Pollution: Methods, Policies, Programs, and Measurement, November 28‐30, 2006, 328‐347. Rivers Institute at Hanover College, Hanover IN.
Baker DB (2011) The Sources and Transport of Bioavailable Phosphorus to Lake Erie, Final Report: Part 1 Trends in
Bioavailable Phosphorus Loading at River Monitoring Stations. http://www.heidelberg.edu/sites/default/files/jfuller/images/12%20Part%201%20Final%20Report%20text1.pdf
Bowes MJ, Gozzard E, Johnson AC, Scarlett PM, Roberts C, Read DS, Wickham, HD (2012) Spatial and temporal
changes in chlorophyll‐a concentrations in the River Thames basin, UK: Are phosphorus concentrations beginning to limit phytoplankton biomass? Science of the Total Environment, v. 426, 45‐55.
Chomat CJ, Westphal KS (2013) Enhanced understanding of sediment phosphorus dynamics in river systems with a
simple supplemental mass balance tool. Journal of Environmental Engineering, v. 139(1): 34‐43. Dodds WK. (2006) Eutrophication and trophic state in rivers and streams. Limnology and Oceanography, v. 51(1,2):
671‐680. Gammons CH, Babcock JN, Parker, SR, Poulson, SR (2011) Diel cycling and stable isotopes of dissolved oxygen,
dissolved inorganic carbon, and nitrogenous species in a stream receiving treated municipal sewage. Chemical Geology, v. 283(1), 44‐55.
Heiskary S, Markus H (2003) Establishing Relationships Among In‐stream Nutrient Concentrations, Phytoplankton
Abundance and Composition, Fish IBI and Biochemical Oxygen Demand in Minnesota USA. Rivers Final Report to USEPA Region V. Minnesota Pollution Control Agency, Environmental Outcomes Division. http://www.pca.state.mn.us/index.php/view‐document.html?gid=12867
Heiskary, S, Bouchard RW, Markus H (2010) Minnesota Nutrient Criteria Development for Rivers. Minnesota
Pollution Control Agency. St. Paul, MN. Helsel DR, Hirsch RM (2002) Techniques of Water‐Resources Investigations of the United States Geological Survey,
Book 4: Hydrologic Analysis and Interpretation, Chapter A3: Statistical Methods in Water Resources. http://pubs.usgs.gov/twri/twri4a3/pdf/twri4a3‐new.pdf
James WF, Larson CE (2008). Phosphorus dynamics and loadings in the turbid Minnesota River (UEA): Controls and
recycling potential. Biogeochemistry, v. 90:75‐92.
Jarvie HP, Neal C, Withers PJA (2005) Sewage‐effluent phosphorus: A greater rick to river eutrophication than agricultural phosphorus? Science of the Total Environment, v. 360(1‐3):246‐253.
Jarvie HP, Sharpley AN, Scott JT, Haggard BE, Bowes MJ, Massey LB (2012) Within‐river phosphorus retention: Accounting for a missing piece in the watershed phosphorus puzzle. Environmental Science and Technology, v. 46: 13284‐13292.
Jarvie HP, Sharpley AN, Withers PJA, Scott JT, Haggard BE, Neal C (2013) Phosphorus mitigation to
control river eutrophication: Murky waters, inconvenient truths, and “postnormal” science. Journal of Environmental Quality, v. 42: 295‐304.
Kunishi HM, Weaver RN, Taylor AW, Heald WR, Gburek WJ (1972) Phosphate movement from an agricultural
watershed during 2 rainfall periods. Journal of Agricultural and Food Chemistry, v. 20(4): 900‐905.
Page | 20
Miltner RJ (2010) A Method and Rationale for Deriving Nutrient Criteria for Small Rivers and Streams in Ohio.
Environmental Management, 45:842‐855. Meyer JL (1979a) Role of sediments and bryophytes in phosphorus dynamics in a headwater stream ecosystem.
Limnology and Oceanography, v. 24(2): 365‐375. Meyer JL, Likens GE (1979b) Transport and transformation of phosphorus in a forest stream ecosystem. Ecology, v.
60(6): 1255‐1269. Ohio EPA (1999) Association Between Nutrients, Habitat, and the Aquatic Biota in Ohio Rivers and Streams. Ohio Environmental Protection Agency Technical Bulletin. MAS/1999‐1‐1. Columbus, OH.
http://epa.ohio.gov/portals/35/guidance/assoc_load.pdf Ohio EPA (2012) Biological and Water Quality Study of the Lower Great Miami River and Select Tributaries.
Published at: http://epa.ohio.gov/portals/35/documents/GMR2012TSD.pdf Ohio EPA (2015) Evaluation of Optimal Critical Condition(s) for Nutrient (Phosphorus) TMDLs. Division of Surface
Water memo. March 5, 2015. Rosemond, A. D., Benstead, J. P., Bumpers, P. M., Gulis, V., Kominoski, J. S., Manning, D. W., ... & Wallace, J. B.
(2015). Experimental nutrient additions accelerate terrestrial carbon loss from stream ecosystems. Science, 347(6226), 1142‐1145.
Royer TV, David MB, Gentry LE, Mitchell CA, Starks KM, Heatherly II TH, Whiles MR (2008) Assessment of
chlorophyll‐a as a criterion for establishing nutrient standards in the streams and rivers of Illinois. Journal of Environmental Quality, v. 37: 437‐447.
Sharpley AN, Krogstad T, Kleinman PJA, Haggard, B, Shigaki F, Saporito LS (2007) Managing natural processes in
drainage ditches for nonpoint source phosphorus control. Journal of Soil and Water Conservation, v. 64(4). Taylor AW, Kunishi, HM (1971) Phosphate equilibria on stream sediment and soil in a watershed draining an
agricultural region. Journal of Agricultural and Food Chemistry, v. 19(5): 827‐831.