Embed Size (px)
Citation preview

Textiles, clothing, leather and footwear

4 Textiles, clothing, leather and footwear
116 European business — Facts and figures
Th is chapter covers the manufacture of textiles, clothing, fur and leather goods, as defi ned by NACE Subsections DB and DC, hereaft er referred to as textiles, clothing and leather manufactur-ing. Th e manufacture of textiles (NACE Division 17) is dealt with in the fi rst subchapter, while the manufacture of wearing apparel and the dressing and dyeing of fur (NACE Division 18), hereaft er called the manufacture of clothing, is the subject of the second subchapter. Th e fi nal subchapter concentrates on the manufacture of leather and leather products including that of footwear (as covered by NACE Subsection DC), hereaft er re-ferred to as leather manufacturing.
Since the closure of the World Trade Organisa-tion’s (WTO) ten-year, transitional Agreement on Textiles and Clothing (ATC) at the end of 2004,
the European Union market for textiles, clothing, leather and footwear has been open to far more global competition, particularly from China and other Far Eastern countries. Th e European Com-mission published a study on the competitiveness, economic situation and location of production in the textiles and clothing, footwear, leather [and furniture] industries in 2007 (1), which put forward some ideas for consideration: to upgrade knowl-edge and skills within the sector; to enhance the value added of EU manufactured products, perhaps through emphasising social ethics, environmental and health considerations and ethical sourcing; to enhance the protection of intellectual property; to foster trade and eliminate trade barriers; to im-prove the integration of fashion and design in the sector and better support young designers.
(1) Rounded estimates based on non-confi dential data.
Source: Eurostat (SBS)
Table 4.1: Manufacture of textiles and textile products; manufacture of leather and leather products (NACE Subsections DB and DC)Structural profi le, EU-27, 2006 (1)
(thousand)
(% of
total)
(EUR
million)
(% of
total)
(EUR
million)
(% of
total) (thousand)
(% of
total)
Textiles, clothing
& leather products267.0 100.0 235 345 100.0 64 749 100.0 2 997.5 100.0
Textiles 79.1 29.6 105 000 44.6 30 000 46.3 1 060.0 35.4
Wearing apparel;
dressing & dyeing of fur143.9 53.9 82 600 35.1 22 500 34.7 1 390.0 46.4
Tanning & dressing of leather;
luggage, handbags, saddlery,
harness & footwear
44.0 16.5 47 235 20.1 11 929 18.4 548.8 18.3
Persons employedEnterprises Turnover Value added
(1) Denmark, Latvia, Malta, Portugal and Slovakia, not available; Bulgaria, the Netherlands, Austria, Poland and Slovenia, 2005.(2) Denmark, Malta, Portugal and Slovakia, not available; the Netherlands, Austria, Poland and Slovenia, 2005.(3) Denmark, Latvia, Malta, the Netherlands, Portugal and Slovakia, not available; Bulgaria, Cyprus, Austria, Poland, Romania and Slovenia, 2005.(4) Denmark, Malta, Portugal and Slovakia, not available; Bulgaria, Cyprus, the Netherlands, Austria, Poland, Romania and Slovenia, 2005.
Source: Eurostat (SBS)
Table 4.2: Manufacture of textiles and textile products; manufacture of leather and leather products (NACE Subsections DB and DC)Structural profi le: ranking of top fi ve Member States, 2006
Country
(EUR
million)
(% of
EU-27) Country
(thou-
sand)
(% of
EU-27)
Value
added (3)
Persons
employed (4)
1 Italy 21 766 33.6 Italy 636.0 21.2 Romania (5.3) Romania (11.6)
2 Germany 7 806 12.1 Romania 425.1 14.2 Bulgaria (4.7) Bulgaria (10.9)
3 France 7 483 11.6 Poland 278.1 8.8 Italy (3.4) Lithuania (5.6)
4 Spain 5 937 9.2 Spain 223.7 7.5 Lithuania (2.9) Estonia (5.1)
5 United Kingdom 5 067 7.8 Bulgaria 195.7 6.5 Slovenia (2.7) Slovenia (4.9)
Most specialised: share in the
non-financial business economy (%)
Highest
value added (1)
Largest number of
persons employed (2)
(1) For more information, see http://ec.europa.eu/enterprise/textile.

Textiles, clothing, leather and footwear 4
117 European business — Facts and figures
Source: Eurostat (SBS)
Map 4.1: : Manufacture of textiles and textile products; manufacture of leather and leather products (NACE Subsections DB and DC)Persons employed in the manufacture of textiles, clothing, leather and footwear (NACE Subsections DB and DC) as a proportion of those employed in the non-fi nancial business economy (NACE Sections C to I and K) (%)
0 600 km
Persons employed in the manufacture of textiles,clothing, leather and footwear
(NACE Subsections DB and DC)as a proportion of those employed
in the non-financial business economy(NACE Sections C to I and K),
by NUTS 2 regions, 2006
Cartography: Eurostat — GISCO, 03/2009© EuroGeographics Association, for the administrative boundariesSource: Eurostat (SBS)
<= 0.5
> 0.5 and <= 1
> 1 and <= 4
> 4
Data not available
(%)
BG, DK, SI: national level instead of NUTS 2BG: construction (45) 2005CY: excluding research and development (73)
Guadeloupe (FR)
0 25
Martinique (FR)
0 20
Guyane (FR)
0 100
Réunion (FR)
0 20
Açores (PT)
0 100
Madeira (PT)
0 20
Canarias (ES)
0 100
Malta
0 10
0 100
Ísland

4 Textiles, clothing, leather and footwear
118 European business — Facts and figures
Th e largest activity within the sector (at NACE Division level) was the manufacture of textiles (NACE Division 17), which accounted for a little under one half (46.3 %) of sectoral value added in 2006. Just over one third (34.7 %) of value added was generated by the EU-27’s manufacture of clothing (as defi ned by the activities in NACE Division 18), with the remainder (18.4 %) being generated by leather manufacturing (NACE Di-vision 19).
Italy was the principal textiles, clothing and leather manufacturing Member State, generating EUR 21.8 billion of value added, which was the equivalent of one third (33.6 %) of EU-27 value added in this sector in 2006. Th e other main textiles, clothing
Structural profi le
Th ere were just over 267.0 thousand enterprises in the Member States for which the manufac-ture of textiles, clothing and leather (NACE Subsections DB and DC) was their main activ-ity in 2006. In relative terms, this sector of the economy was larger in terms of employment than in terms of its value added generated; about 3.0 million people were employed in the sector, cor-responding to 2.3 % of the EU-27’s non-fi nancial business economy (NACE Sections C to I and K) workforce, whereas the EUR 64.7 billion of value added corresponded to 1.1 % of the total value added generated across the non-fi nancial busi-ness economy in 2006.
Source: Eurostat (STS)
Figure 4.1: Manufacture of textiles and textile products; manufacture of leather and leather products (NACE Subsections DB and DC)Index of production, EU-27 (2000=100)
60
70
80
90
100
110
120
130
20072006200520042003200220012000199919981997
Textiles, clothing & leather products
Textiles
Wearing apparel; dressing & dyeing of fur
Tanning & dressing of leather; luggage, handbags, saddlery, harness & footwear
(1) 1 to 9 persons employed and 50 to 249 persons employed, 2005.
Source: Eurostat (SBS)
Table 4.3: Manufacture of textiles and textile products; manufacture of leather and leather products (NACE Subsections DB and DC)Share of value added and persons employed by enterprise size class, EU-27, 2006 (%)
Non-financial
business
economy (1)
Textiles,
clothing
& leather
products
Non-financial
business
economy
Textiles,
clothing
& leather
products
1 to 9 persons employed 21.0 14.1 29.7 17.7
10 to 49 persons employed 18.9 28.0 20.7 26.3
50 to 249 persons employed 17.8 32.4 17.0 31.2
250 or more persons employed 42.1 25.5 32.6 24.7
Persons employedValue added

Textiles, clothing, leather and footwear 4
119 European business — Facts and figures
Small and medium-sized enterprises (SMEs, en-terprises employing less than 250 people) domi-nated the textiles, clothing and leather manufac-turing sector in the EU-27, accounting for around three quarters of sectoral value added (74.5 %) and employment (75.3 %) in 2006. Th is size structure set the sector apart from most indus-trial activities in the EU-27, as across the EU-27’s industrial economy (NACE Sections C to E) as a whole SMEs generated less than half (42.5 %) of total value added. Th e share of value added gener-ated by SMEs in the textiles, clothing and leather manufacturing sector was also signifi cantly high-er than the average (57.9 %) across the non-fi nan-cial business economy.
Across industry and the non-fi nancial business economy, the apparent productivity of labour tended to rise through the size classes, suggesting economies of scale. In contrast, there was almost no distinction between the apparent labour pro-ductivity levels of the size classes within the tex-tiles, clothing and leather manufacturing sector. Indeed, across all size classes within the sector, the apparent labour productivity level was low (between EUR 17.0 thousand and EUR 23.0 thou-sand per person employed) and about one half of the average across the EU-27’s non-fi nancial business economy (EUR 44 .0 thousand per per-son employed).
Employment characteristics
Th e textiles and clothing manufacturing subsec-tor and the leather manufacturing subsector were the only industrial subsections that employed more women than men across the EU-27 in 2007. Indeed, women accounted for a little more than two thirds (69.4 %) of the textiles, clothing and leather manufacturing workforce as a whole, which was about twice the average share (35.1 %) across the EU-27’s non fi nancial business econ-omy and even more than the industrial average (30.1 %). With the exception of Belgium and the Netherlands among the Member States for which data are available (2), women provided a majority of the workforce within the sector. In the Baltic Member States, Bulgaria, Hungary and Roma-nia, women represented between eight and nine in every ten workers in the textiles, clothing and leather manufacturing sector.
and leather manufacturing Member States within the EU-27 were Germany (accounting for 12.1 % of the EU-27’s value added), France (11.6 %), Spain (9.2 %) and the United Kingdom (7.8 %). Of these fi ve Member States, only Italy was specialised in the manufacture of textiles, clothing and leather; as this sector contributed 3.4 % of the value added generated in its non-fi nancial business economy, three times the average contribution recorded across the EU-27 in 2006. However, this measure of specialisation was even stronger in Romania and Bulgaria. In Romania, the textiles, clothing and leather manufacturing sector contributed 5.3 % to the value added generated across its non-fi nancial business economy in 2005; in Bulgaria this proportion was 4.7 %.
Th is relative specialisation was also clear in terms of employment. Th ere were a number of regions in Romania where between 8 % and 15 % of the non-fi nancial business economy workforce were employed in the textiles, clothing and leather manufacturing sector. Th e most specialised re-gion (at the level of detail shown in the map) was Norte in Portugal, however, where about one in every fi ve (18.3 %) persons employed in the non-fi nancial business economy worked in textiles, clothing and leather manufacturing. Th ere was also high specialisation of textiles, clothing and leather manufacturing in many regions of Italy, as well as across Slovenia, Estonia, Lithuania and Bulgaria (which are each considered as a single region at the level of detail in the map).
Th ere was a strong downward trend in the index of production for textiles, clothing and leather manufacturing for the EU-27 during the period between 1997 and 2007, at a time when there was a relatively steady rise in total industrial output. Textiles, clothing and leather manufacturing out-put declined by one third in the ten years through to 2007, at an average rate of 4.0 % per annum, al-though the falls in 2006 (-1.3 %) and 2007 (-0.6 %) were much more moderate than this longer-term trend. Th is output pattern was also refl ected in the production indices of each of the three main types of manufacturing. However, the declines noted for leather manufacturing (an average -5.4 % per annum over the ten years through un-til 2007) and clothing (an average -5.3 % per an-num) were almost twice as strong as for textile manufacturing (an average -2.8 % per annum).
(2) Luxembourg and Malta, not available.

4 Textiles, clothing, leather and footwear
120 European business — Facts and figures
Slovenia, Estonia, Poland and Austria. Indeed, among those Member States for whom data are available (3), it was only in Romania that the share of young workers in this sector was higher than that across its non-fi nancial business economy in 2007. In contrast, the proportion of workers in the textiles, clothing and leather manufactur-ing sector aged 50 or over was particularly high in Cyprus (63.6 %), especially when compared against the average (25.2 %) across the whole of its non-fi nancial business economy.
Expenditure, productivity and
profi tability
Th e level of tangible investment in the textiles, clothing and leather manufacturing sector was EUR 7.3 billion in 2006, accounting for just 0.7 % of investment across the EU-27’s non-fi -nancial business economy. Th is relative level of investment was lower than the sector’s relative contribution (1.1 %) to value added within the non-fi nancial business economy in 2006, a char-acteristic that was common across the Member States but particularly notable in some of the key textile, clothing and leather manufacturing Member States like Italy, Bulgaria and Romania. Th e investment rate across the EU-27’s textiles, clothing and leather manufacturing sector was 11.3 % in 2006, considerably lower than the aver-age rate for the non-fi nancial business economy
Given the high proportion of women employed in the textiles, clothing and leather manufacturing sector of the EU-27, it is perhaps surprising that the proportion of workers engaged on a part-time basis was as low as 8.2 % in 2007, as it is oft en a characteristic that activities with a high propor-tion of women in the workforce are associated with high part-time employment rates. Indeed, part-time workers in the textiles, clothing and leather manufacturing sector were much less common than across the non-fi nancial business economy, where they represented 14.3 % of the workforce.
Another key feature of the workforce was that the proportion of those aged under 30 in the EU-27’s textiles, clothing and leather manufacturing sector (18.4 %) was much lower than the aver-age across the non-fi nancial business economy (24.3 %) in 2007. Th e relative diff erence between the two was made up for in workers aged be-tween 30 and 49 years of age, the proportions of those workers aged 50 years or over being almost identical. Th e relative absence of young workers in the textiles, clothing and leather manufactur-ing sector was most acute in Greece, Latvia and the Netherlands, where they represented about a third of the equivalent share of workers aged un-der 30 across their respective non-fi nancial busi-ness economies. Other countries where this char-acteristic was particularly pronounced included
Source: Eurostat (LFS)
Figure 4.2: Manufacture of textiles and textile products; manufacture of leather and leather products (NACE Subsections DB and DC)Employment characteristics, 2007
0%
25%
50%
75%
100%
Non-financialbusinesseconomy
Textiles, clothing& leatherproducts
Male
Female
0%
25%
50%
75%
100%
Non-financialbusinesseconomy
Textiles, clothing& leatherproducts
Full-time
Part-time
0%
25%
50%
75%
100%
Non-financialbusinesseconomy
Textiles, clothing& leatherproducts
50+
30 to 49
15 to 29
By gender By working time By age
(3) Denmark, Ireland, Cyprus, Luxembourg, Malta and Finland, not available.

Textiles, clothing, leather and footwear 4
121 European business — Facts and figures
those working across the non-fi nancial business economy, and compared with the sectoral aggre-gates used in Chapters 2 to 25 of this publication it was only higher than the apparent labour pro-ductivity recorded for accommodation and food services. Th is low productivity was all the more notable given the small proportion of part-time employment within the sector. Even aft er adjust-ing productivity levels for low average personnel costs, the resulting wage adjusted productivity ratio for the EU-27’s textiles, clothing and leather manufacturing sector (133.6 %) remained well beneath that (151.1 %) of the non-fi nancial busi-ness economy in 2006. Th e wage adjusted labour productivity ratios for each of the three subsec-tors (separately textiles, clothing and leather manufacturing) were very similar, with the value added per person employed being between 31 % and 37 % higher than the respective average per-sonnel costs per employee.
Among the Member States, the wage adjusted labour productivity ratio of the textiles, clothing and leather manufacturing sector was signifi -cantly below the national non-fi nancial business economy average (4), with the exceptions of Lux-embourg (where it was about two thirds higher than the non-fi nancial business economy aver-age) and Italy (where it was almost the same).
(18.4 %). Investment rates for the clothing and leather subsectors were particularly low (7.9 % and 8.9 % respectively).
Th e average annual cost of personnel within the EU-27’s textile, clothing and leather manufactur-ing sector was EUR 16.2 thousand per employee in 2006, by far the lowest fi gure among the chap-ter aggregates for industry as shown in Chapters 2 to 15, and a little more than two fi ft hs (43.9 %) less than the average across the non-fi nancial business economy. Th is characteristic was appar-ent in all of the Member States for which data are available (4), with the exception of Luxembourg where average personnel costs in this sector were above their respective national averages for the non-fi nancial business economy.
Despite relatively low average personnel costs, the proportion of operating expenditure accounted for by personnel costs (20.5 %) was notably high-er than the share across the EU-27’s non-fi nancial business economy (16.1 %). Th ese fi gures support the notion of a low-wage, labour-intensive manu-facturing sector.
Th e apparent labour productivity of those work-ing in the EU-27’s textiles, clothing and leather manufacturing sector was EUR 21.6 thousand per person employed in 2006. Th is was almost exact-ly one half of the average productivity level of all
(4) Bulgaria, Cyprus, Austria, Poland, Romania and Slovenia, 2005; Denmark, Ireland, Latvia, Malta, the Netherlands, Portugal and Slovakia, not available.
(1) Rounded estimates based on non-confi dential data.(2) Purchases of goods and services, 2005.
Source: Eurostat (SBS)
Table 4.4: Manufacture of textiles and textile products; manufacture of leather and leather products (NACE Subsections DB and DC)Expenditure, productivity and profi tability, EU-27, 2006 (1)
Personnel
costs
Purchases
of goods
& services
Invest-
ment in
tangible
goods
Apparent
labour
produc-
tivity
Average
personnel
costs
Wage
adjusted
labour
produc-
tivity
Gross
operating
rate
Textiles, clothing
& leather products44 441 172 539 7 344 21.6 16.2 133.6 8.6
Textiles (2) 21 300 76 000 4 500 28.3 21.5 131.5 8.6
Wearing apparel;
dressing & dyeing of fur15 100 60 900 1 781 16.2 12.0 135.1 8.9
Tanning & dressing of leather;
luggage, handbags, saddlery,
harness & footwear
7 990 35 869 1 059 21.7 16.0 136.2 8.3
(%)
(EUR thousand
per person)(EUR million)
4 Textiles, clothing, leather and footwear
122 European business — Facts and figures
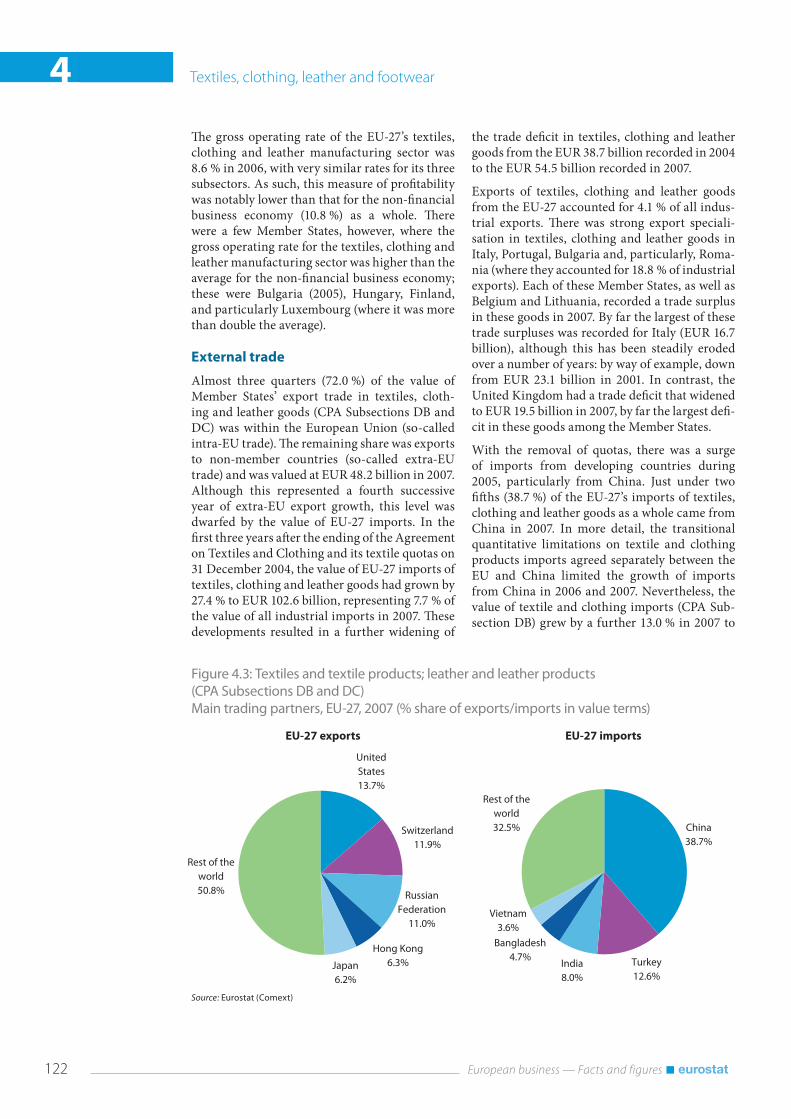
the trade defi cit in textiles, clothing and leather goods from the EUR 38.7 billion recorded in 2004 to the EUR 54.5 billion recorded in 2007.
Exports of textiles, clothing and leather goods from the EU-27 accounted for 4.1 % of all indus-trial exports. Th ere was strong export speciali-sation in textiles, clothing and leather goods in Italy, Portugal, Bulgaria and, particularly, Roma-nia (where they accounted for 18.8 % of industrial exports). Each of these Member States, as well as Belgium and Lithuania, recorded a trade surplus in these goods in 2007. By far the largest of these trade surpluses was recorded for Italy (EUR 16.7 billion), although this has been steadily eroded over a number of years: by way of example, down from EUR 23.1 billion in 2001. In contrast, the United Kingdom had a trade defi cit that widened to EUR 19.5 billion in 2007, by far the largest defi -cit in these goods among the Member States.
With the removal of quotas, there was a surge of imports from developing countries during 2005, particularly from China. Just under two fi ft hs (38.7 %) of the EU-27’s imports of textiles, clothing and leather goods as a whole came from China in 2007. In more detail, the transitional quantitative limitations on textile and clothing products imports agreed separately between the EU and China limited the growth of imports from China in 2006 and 2007. Nevertheless, the value of textile and clothing imports (CPA Sub-section DB) grew by a further 13.0 % in 2007 to
Th e gross operating rate of the EU-27’s textiles, clothing and leather manufacturing sector was 8.6 % in 2006, with very similar rates for its three subsectors. As such, this measure of profi tability was notably lower than that for the non-fi nancial business economy (10.8 %) as a whole. Th ere were a few Member States, however, where the gross operating rate for the textiles, clothing and leather manufacturing sector was higher than the average for the non-fi nancial business economy; these were Bulgaria (2005), Hungary, Finland, and particularly Luxembourg (where it was more than double the average).
External trade
Almost three quarters (72.0 %) of the value of Member States’ export trade in textiles, cloth-ing and leather goods (CPA Subsections DB and DC) was within the European Union (so-called intra-EU trade). Th e remaining share was exports to non-member countries (so-called extra-EU trade) and was valued at EUR 48.2 billion in 2007. Although this represented a fourth successive year of extra-EU export growth, this level was dwarfed by the value of EU-27 imports. In the fi rst three years aft er the ending of the Agreement on Textiles and Clothing and its textile quotas on 31 December 2004, the value of EU-27 imports of textiles, clothing and leather goods had grown by 27.4 % to EUR 102.6 billion, representing 7.7 % of the value of all industrial imports in 2007. Th ese developments resulted in a further widening of
Source: Eurostat (Comext)
Figure 4.3: Textiles and textile products; leather and leather products (CPA Subsections DB and DC)Main trading partners, EU-27, 2007 (% share of exports/imports in value terms)
United States13.7%
Rest of the world50.8%
Japan6.2%
Russian Federation
11.0%
Hong Kong6.3%
Switzerland11.9%
EU-27 exports
China38.7%
Turkey12.6%
Rest of the world32.5%
India8.0%
Bangladesh4.7%
Vietnam3.6%
EU-27 imports

Textiles, clothing, leather and footwear 4
123 European business — Facts and figures
not stopped the growth in imports from China, their value rising by 7.7 % to EUR 10.6 billion in 2007, although there was considerably lower growth (up 0.7 %) from Vietnam. As a result of these latest developments, China inched closer to being the origin of one half (47.9 %) of all the EU-27’s imports of leather and leather products in 2007, Vietnam’s share falling slightly to about one tenth (10.6 %).
EUR 29.2 billion, representing more than a third (36.2 %) of all EU-27 textile and clothing imports. Imports from Turkey also grew relatively strongly (up 6.5 %) to EUR 12.7 billion, the equivalent of 15.8 % of EU-27 imports.
In 2006, two Anti-Dumping investigations were launched by the European Commission regard-ing footwear, one concerning China and the other Vietnam. Th e punitive duties that resulted have
4.1: TextilesTh is subchapter deals with the manufacture of textiles and includes processes such as spinning, weaving and the fi nishing of products, as classi-fi ed within NACE Division 17.
Th e European Commission has decided to revise the legislation on textiles names and the related labelling of textile products, with the aim of sim-plifying and improving the existing regulatory framework for the development and uptake of novel fi bres. It put forward a proposal (5) in Janu-ary 2009, with the hope that innovation in the textile and clothing sector would be encouraged and that fi bre users and consumers would benefi t more immediately from innovative products.
Similarly, the European Parliament and the Council issued a Directive (6) on textile names, re-quiring the labelling of the fi bre composition of
textile products. Furthermore, it stipulates that checks be carried out to ensure that the compo-sition of textile products is in conformity with the information supplied. It is hoped that these updated rules will strengthen the provision of coherent fi bre composition and the labelling of products, thereby giving consumers greater con-fi dence in the quality of their purchases.
Structural profi le
Th ere were 79.1 thousand enterprises across the EU-27 for which the manufacture of textiles (NACE Division 17) was their main activity in 2006. Th ese enterprises employed just over one million people, a little over one third (35.4 %) of the textiles, clothing and leather manufacturing workforce. Th ey generated an estimated EUR 30.0 billion of value added in 2006, closer to one half (46.3 %) of the added value generated across tex-tiles, clothing and leather manufacturing.
(1) Rounded estimates based on non-confi dential data.(2) Value added, 2005.(3) Number of persons employed, 2005.
Source: Eurostat (SBS)
Table 4.5: Manufacture of textiles (NACE Division 17)Structural profi le, EU-27, 2006 (1)
Enterprises
(thousand)
Turnover
(EUR
million)
Persons
employed
(thousand)
Value
added
Persons
employed
Textiles 79.1 105 000 30 000 1 060.0 100.0 100.0
Preparation & spinning of textile fibres 5.4 13 032 3 127 113.5 10.4 10.7
Textile weaving 6.4 20 194 5 427 183.8 18.1 17.3
Finishing of textiles 8.1 9 753 3 482 110.0 11.6 10.4
Made-up textile articles, except apparel 24.7 17 000 : 220.0 : 20.8
Other textiles (2) 17.0 30 000 8 000 220.0 25.8 20.8
Knitted & crocheted fabrics 4.8 4 807 1 200 42.0 4.0 4.0
Knitted & crocheted articles (3) 12.3 10 557 3 218 186.0 10.7 16.3
Share in total (%)Value
added
(EUR
million)
(5) COM(2009) 31 fi nal.
(6) Directive 2008/121/EC.

4 Textiles, clothing, leather and footwear
124 European business — Facts and figures
Th e production index of the EU-27’s textiles manufacturing activity declined by an average 2.8 % per annum in the ten years through until 2007, despite a temporary upturn in 2000 and a marked slowdown in the rate at which output fell in 2006 and 2007. Th is pattern of development was common to six of the seven textile manufac-turing NACE groups, with the sharpest rate of decline (an average -5.6 % per annum) being re-corded for the preparation and spinning of textile fi bres (NACE Group 17.1). Th e exception was the manufacture of other textiles (NACE Group 17.5) such as carpets, rugs and non-woven articles, for which the production level in 2007 was remark-ably similar to that in 1997 and was relatively sta-ble in the period in-between.
Expenditure and productivity
A little over three fi ft hs (61.3 %) of the tangible in-vestment within the textiles, clothing and leather manufacturing sector was for textiles manufac-turing in 2006. Th e investment rate, defi ned as the ratio of tangible investment to value added, was 15.0 % for textiles manufacturing, which was considerably higher than the rates for clothing or leather manufacturing.
Th e structure of operating expenditure for the EU-27’s textiles manufacturing sector was broad-ly similar to that of textiles, clothing and leather
Th e largest activity within the textiles sector was the manufacture of other textiles (NACE Group 17.5) such as carpets, rugs and non-woven articles; this subsector generated an estimated EUR 8.0 billion of value added across the EU-27 in 2005. Th e activity of textile weaving (NACE Group 17.2) generated EUR 5.4 billion of value added, making it the next largest. By far the smallest activity was the manufacture of knitted and crocheted fabrics (NACE Group 17.6), which generated EUR 1.2 billion of value added.
Th e principal textile manufacturing Member State was Italy, with EUR 8.7 billion of value added generated in 2006 accounting for around 28.9 % of EU-27 value added. Th e textiles manufactur-ing sectors in Germany, the United Kingdom and France were the next largest, together contribut-ing just over a third (36.0 %) of the EU-27’s value added. All three countries were relatively unspe-cialised in textile manufacturing, however, as the relative contribution of this sector to national non-fi nancial business economy value added was beneath the EU-27 average. In contrast, Portugal, Bulgaria (2005) and Italy were relatively special-ised in the manufacture of textiles, as this sector contributed about 1.5 % of the total value added in their respective non-fi nancial business econo-mies in 2006, between two and a half and three times the EU-27 average.
(1) Rounded estimates based on non-confi dential data.(2) Value added, not available.(3) Value added, 2005.(4) Number of persons employed, 2005.
Source: Eurostat (SBS)
Figure 4.4: Manufacture of textiles (NACE Division 17)Relative weight within textiles, EU-27, 2006 (%) (1)
0 5 10 15 20 25 30
Preparation & spinning of textile fibres
Textile weaving
Finishing of textiles
Made–up textile articles, except apparel (2)
Other textiles (3)
Knitted & crocheted fabrics
Knitted & crocheted articles (4)
Value added
Persons employed
Textiles, clothing, leather and footwear 4
125 European business — Facts and figures
(1) Rounded estimates based on non-confi dential data.(2) Purchases of goods and services, 2005.(3) Apparent labour productivity, 2005.(4) Investment in tangible goods and apparent labour productivity, 2005.
Source: Eurostat (SBS)
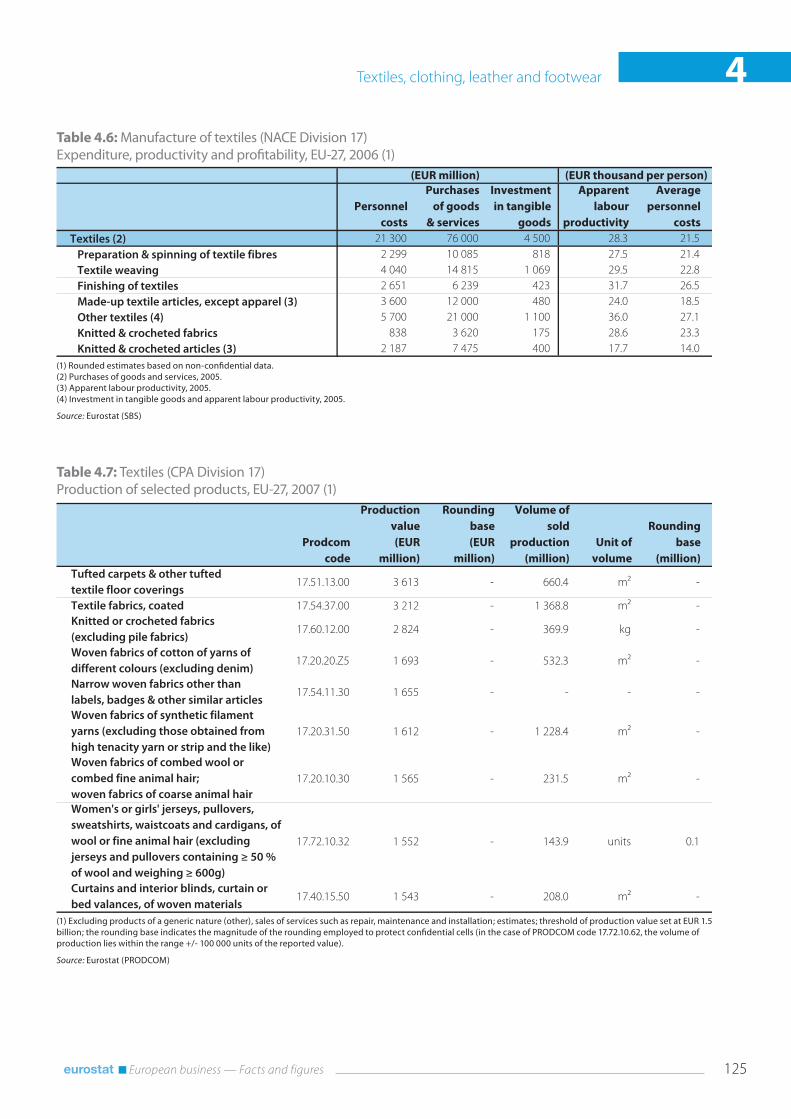
Table 4.6: Manufacture of textiles (NACE Division 17)Expenditure, productivity and profi tability, EU-27, 2006 (1)
Personnel
costs
Purchases
of goods
& services
Investment
in tangible
goods
Apparent
labour
productivity
Average
personnel
costs
Textiles (2) 21 300 76 000 4 500 28.3 21.5
Preparation & spinning of textile fibres 2 299 10 085 818 27.5 21.4
Textile weaving 4 040 14 815 1 069 29.5 22.8
Finishing of textiles 2 651 6 239 423 31.7 26.5
Made-up textile articles, except apparel (3) 3 600 12 000 480 24.0 18.5
Other textiles (4) 5 700 21 000 1 100 36.0 27.1
Knitted & crocheted fabrics 838 3 620 175 28.6 23.3
Knitted & crocheted articles (3) 2 187 7 475 400 17.7 14.0
(EUR million) (EUR thousand per person)
(1) Excluding products of a generic nature (other), sales of services such as repair, maintenance and installation; estimates; threshold of production value set at EUR 1.5 billion; the rounding base indicates the magnitude of the rounding employed to protect confi dential cells (in the case of PRODCOM code 17.72.10.62, the volume of production lies within the range +/- 100 000 units of the reported value).
Source: Eurostat (PRODCOM)
Table 4.7: Textiles (CPA Division 17)Production of selected products, EU-27, 2007 (1)
Prodcom
code
Production
value
(EUR
million)
Rounding
base
(EUR
million)
Volume of
sold
production
(million)
Unit of
volume
Rounding
base
(million)
Tufted carpets & other tufted
textile floor coverings17.51.13.00 3 613 - 660.4 m² -
Textile fabrics, coated 17.54.37.00 3 212 - 1 368.8 m² -
Knitted or crocheted fabrics
(excluding pile fabrics)17.60.12.00 2 824 - 369.9 kg -
Woven fabrics of cotton of yarns of
different colours (excluding denim)17.20.20.Z5 1 693 - 532.3 m² -
Narrow woven fabrics other than
labels, badges & other similar articles17.54.11.30 1 655 - - - -
Woven fabrics of synthetic filament
yarns (excluding those obtained from
high tenacity yarn or strip and the like)
17.20.31.50 1 612 - 1 228.4 m² -
Woven fabrics of combed wool or
combed fine animal hair;
woven fabrics of coarse animal hair
17.20.10.30 1 565 - 231.5 m² -
Women's or girls' jerseys, pullovers,
sweatshirts, waistcoats and cardigans, of
wool or fine animal hair (excluding
jerseys and pullovers containing ≥ 50 %
of wool and weighing ≥ 600g)
17.72.10.32 1 552 - 143.9 units 0.1
Curtains and interior blinds, curtain or
bed valances, of woven materials17.40.15.50 1 543 - 208.0 m² -

4 Textiles, clothing, leather and footwear
126 European business — Facts and figures
clothing and leather manufacturing as a whole. Adjusting productivity for the diff erences in av-erage personnel costs, the resulting wage adjusted labour productivity ratio of the textiles manufac-turing sector (131.5 %) was very similar to the average ratio across textiles, clothing and leather manufacturing as a whole (133.6 %). Bulgaria re-corded a particularly high wage adjusted labour productivity ratio for textiles manufacturing (198.2 %) relative to its average ratio for textiles, clothing and leather manufacturing (145.4 %). Across all of the Member States (7), however, the wage adjusted labour productivity ratios for the textiles manufacturing sector were lower than the corresponding ratios for the non-fi nancial business economy.
manufacturing as a whole, although personnel costs accounted for a slightly higher share within the textiles sector (23.0 % in 2005). Th is higher share was, in part, due to the higher – albeit still relatively low – average personnel costs; average personnel costs within the EU-27’s textiles man-ufacturing sector were EUR 21.5 thousand per employee, almost one third (33.0 %) more than the average across textiles, clothing and leather manufacturing in 2006.
Th e apparent labour productivity of the EU-27’s textiles manufacturing sector in 2006 was EUR 28.3 thousand per person employed, which was also almost one third (31.0 %) more than the corresponding productivity level across textiles,
4.2: ClothingTh is subchapter contains information on the manufacture of leather clothes, workwear, outer-wear, underwear, and articles of fur (hereaft er re-ferred to as clothing manufacturing), as defi ned by NACE Division 18.
Th e manufacture of clothing involves design (styling, prototyping and choice of collections), development (patterns, sourcing fabric) and pro-duction (cutting, sewing, pressing and fi nishing) processes. Innovation is seen as an important re-quirement if clothing manufacturing in the EU is going to be more competitive in ever more global markets. Th e European Commission has already identifi ed technical textiles for intelligent person-al protective clothing and equipment (PPE) as a key area of high potential growth under its Lead Market Initiative (8). Protective textiles comprise clothing and other textile-based systems whose main function is to protect users from hazards and dangers in the conditions in which they op-erate, such as civil and military emergency in-terventions or in hospitals and manufacturing environments that require insulation from bac-terial and viral contamination. Various forms of support have been proposed to stimulate research and development in this area, as well as acceler-ating standardisation, raising the know-how of public purchasers and enhancing the coherence of safety user requirements. A further challenge
faced by small producers who want to develop new products and applications is the ease and ability to secure additional capital, whether from public or private bodies.
Structural profi le
Th ere were about 1.4 million people employed across the EU-27 by the 143.9 thousand enter-prises that had clothing manufacturing (NACE Division 18) as their main activity in 2006. Th ese enterprises generated EUR 22.5 billion of value added in 2006, accounting for about one third (34.7 %) of the value added generated by textiles, clothing and leather manufacturing (NACE Sub-sections DB and DC).
Th e principal clothing activity in the EU-27 is the manufacture of other wearing apparel and accessories (NACE Group 18.2) such as other outerwear and underwear, which generated the overwhelming majority (96.8 %) of clothing value added in 2006 and employed most of its workers. In more detail, the manufacture of other outer-wear (NACE Class 18.22), such as coats, jack-ets and trousers, accounted for a clear majority (61.1 %) of clothing value added in 2006, with most of the rest (17.5 %) coming from the manu-facture of other wearing apparel and accessories not elsewhere classifi ed (NACE Class 18.24), such as babies garments, hats and headgear and also (13.1 %) the manufacture of underwear (NACE Class 18.23).
(7) Bulgaria, Cyprus and Romania, 2005; Ireland, Luxembourg, Malta and the Netherlands, not available.
(8) COM (2007) 860 fi nal.

Textiles, clothing, leather and footwear 4
127 European business — Facts and figures
market products. Nevertheless, the value added generated by the clothing manufacturing sector in Romania contributed 3.1 % of its non-fi nancial business economy total in 2005, more than in any other Member State and about seven and a half times the EU-27 average. In these relative terms, only Bulgaria (2.9 %, 2005) was almost as special-ised as Romania in the manufacture of clothing, with Lithuania (1.6 %) and Portugal (1.5 %) some way behind.
Th ere was a strong downward trend in the pro-duction index of clothing manufacturing across the EU-27 during the period between 1997 and 2007, despite an abrupt levelling-off in 2006 and 2007. In the ten years through to 2007, the av-erage rate of decline in clothing output across the EU-27 was 5.3 % per annum. However, this overall picture disguises contrasting develop-ments in some of the Member States. Th ere were
Among the Member States, Romania and Italy had by far the largest clothing manufacturing workforces, each employing about a quarter of a million workers (the equivalent of a combined 35.6 % of the EU-27 total), followed by Bulgaria with a 10.1 % share. In terms of the value added generated by the clothing sector, however, Italy was by far the largest Member State, the EUR 7.2 billion of value added in 2006 accounting for almost one third (32.0 %) of the total across the EU-27. By comparison, the value added generated in Romania accounted for only 4.0 % of the total. Th ese diff erences in large part refl ect the oppos-ing ends of the clothing manufacturing spectrum; clothes manufacturing in Italy is more focused on higher value products (including many de-signer and luxury brands), whereas in Romania production is concentrated more on the labour-intensive stages of clothing production and mass-
(1) Rounded estimates based on non-confi dential data.
Source: Eurostat (SBS)
Table 4.8: Manufacture of wearing apparel; dressing and dyeing of fur (NACE Division 18)Structural profi le, EU-27, 2006
Enterprises
(thousand)
Turnover
(EUR
million)
Persons
employed
(thousand)
Value
added
Persons
employed
Wearing apparel;
dressing & dyeing of fur (1)143.9 82 600 22 500 1 390.0 100.0 100.0
Leather clothes 3.3 : : : : :
Other wearing apparel & accessories 134.2 80 134 21 784 1 346.9 96.8 96.9
Workwear 8.2 3 746 1 141 77.8 5.1 5.6
Other outerwear 90.0 52 588 13 751 877.6 61.1 63.1
Underwear 8.6 10 843 2 947 211.2 13.1 15.2
Other wearing apparel &
accessories n.e.c.27.1 12 956 3 946 180.3 17.5 13.0
Dressing and dyeing of fur; articles of fur 6.4 1 364 406 21.7 1.8 1.6
Share in total (%)Value
added
(EUR
million)
(1) Luxembourg and Malta, not available; the Netherlands and Poland, 2005.(2) Luxembourg, Malta and the Netherlands, not available; Bulgaria, Cyprus, Poland and Romania, 2005.
Source: Eurostat (SBS)
Table 4.9: Manufacture of wearing apparel; dressing and dyeing of fur (NACE Division 18)Structural profi le: ranking of top fi ve Member States in terms of value added and persons employed, 2006
Country
(EUR
million)
(% of
EU-27) Country
(thou-
sand)
(% of
EU-27) Country
Value
added
1 Italy 7 191 32.0 Romania 257.2 18.5 Romania 3.1
2 France 3 067 13.6 Italy 238.0 17.1 Bulgaria 2.9
3 Germany 2 440 10.8 Poland 160.9 10.9 Lithuania 1.6
4 Spain 2 283 10.1 Bulgaria 139.9 10.1 Portugal 1.5
5 United Kingdom 1 511 6.7 Portugal 111.3 8.0 Italy 1.1
Most specialised: share in non-
financial business economy (%) (2)
Highest
value added (1)
Largest number of
persons employed (1)

4 Textiles, clothing, leather and footwear
128 European business — Facts and figures
Among the NACE classes within other wearing apparel and accessories manufacturing activities (NACE Group 18.2), the fastest rate of decline in output across the EU-27 during the ten years through until 2007 was for underwear (8.6 % per annum). However, the decline in the output of the relatively small activity of the dressing and dyeing of fur and the manufacture of articles of fur (NACE Group 18.3) was even stronger (an av-erage rate of 12.5% per annum).
particularly rapid and sustained declines in clothing manufacturing output in Belgium (an average 14.0 % per annum), France (16.1 % per annum) and Ireland (17.4 % per annum) between 1997 and 2007. For a time, production appeared to shift from west to east with strong growth in the Baltic Member States through to 2001 and in Romania through to about 2002 to 2003. Howev-er, aft er this time there were also steep declines in eastern European countries. Bulgaria stood alone among the Member States as having sustained and sometimes rapid growth in clothing manu-facturing output; in the period between 2000 and 2007, the Bulgarian production index for cloth-ing manufacturing more than doubled.
(1) Excluding products of a generic nature (other), sales of services such as repair, maintenance and installation; estimates; threshold of production value set at EUR 1 billion; the rounding base indicates the magnitude of the rounding employed to protect confi dential cells (in the case of PRODCOM code 18.23.23.00, the value lies within the range +/- EUR 60 million of the reported value).
Source: Eurostat (PRODCOM)
Table 4.10: Clothing (CPA Division 18)Production of selected products, EU-27, 2007 (1)
Prodcom
code
Production
value
(EUR
million)
Rounding
base
(EUR
million)
Volume of
sold
production
(million)
Unit of
volume
Rounding
base
(million)
T-shirts, singlets & vests,
knitted or crocheted18.23.30.00 1 830 - 675.2 units -
Articles of apparel of leather or of
composition leather (including coats &
overcoats) (excluding clothing
accessories, headgear, footwear)
18.10.10.00 1 777 - 10.8 units -
Women's or girls' blouses, shirts &
shirt-blouses (excluding knitted
or crocheted)
18.23.23.00 1 740 60 149.7 units -
Women's or girls' jackets & blazers
(excluding knitted or crocheted)18.22.33.30 1 599 - 45.6 units -
Women's or girls' dresses
(excluding knitted or crocheted)18.22.34.70 1 426 - 49.5 units 0.03
Men's or boys' shirts
(excluding knitted or crocheted)18.23.21.00 1 370 - 94.6 units 0.05
Men's or boys' suits
(excluding knitted or crocheted)18.22.22.10 1 234 - 17.7 units -
Men's or boys' jackets and blazers
(excluding knitted or crocheted)18.22.23.00 1 190 - 25.3 units -
Women's or girls' skirts & divided skirts
(excluding knitted or crocheted)18.22.34.80 1 114 0.8 73.4 units -
Men's or boys' trousers & breeches,
of denim (excluding for industrial or
occupational wear)
18.22.24.42 1 070 - 57.3 units -
Women's or girls' trousers & breeches,
of wool or fine animal hair or man-made
fibres (excluding knitted or crocheted
and for industrial & occupational wear)
18.22.35.49 1 067 - 78.7 units -

Textiles, clothing, leather and footwear 4
129 European business — Facts and figures
was also less than any other NACE division in the non-fi nancial business economy; average value added generated per person employed in clothing manufacturing was EUR 16.2 thousand in 2006, almost exactly one quarter less than the fi gure for textiles, clothing and leather manufacturing as a whole and approaching two thirds (62.8 %) less than the average across the EU-27’s non-fi nancial business economy.
Nevertheless, the value added generated in the clothing sector more than covered personnel costs in 2006, the resulting wage adjusted labour productivity ratio of 135.1 % in the EU-27 being very similar to the ratio for textiles, clothing and leather manufacturing as a whole. In Ireland, Greece, the Netherlands (2005), and Slovenia, however, value added per person employed did not cover average personnel costs. In contrast, the wage adjusted labour productivity ratios of the clothing manufacturing sectors in Italy, Sweden and the United Kingdom were not only higher than the average for textiles, clothing and leather manufacturing as a whole, but were simi-lar to or a little higher than average ratios for the non-fi nancial business economy.
Expenditure and productivity
Tangible investment across the clothing manu-facturing sector amounted to EUR 1.8 billion in 2006, the equivalent of about a quarter (24.2 %) of the tangible investment in textiles, clothing and leather manufacturing as a whole. In comparison to the value added generated by the clothing sec-tor, therefore, tangible investment was relatively low. Th e resulting investment rate of 7.9 % (less than one half of that across the non-fi nancial business economy) may, at least in part, refl ect the continued, further shift in production to non-member countries.
An analysis of the clothing manufacturing sec-tor’s operating expenditure shows that it was very similar to that of textiles, clothing and leather manufacturing as a whole, with about a fi ft h (19.9 %) of expenditure going on personnel costs. Th is was despite very low average personnel costs of EUR 12.0 thousand per employee – this aver-age being lower than for any other NACE divi-sion within the non-fi nancial business economy. Th e apparent labour productivity of those work-ing in clothing manufacturing across the EU-27
(1) Rounded estimates based on non-confi dential data.(2) Rounded estimates based on non-confi dential data; personnel costs and apparent labour productivity, 2005.
Source: Eurostat (SBS)
Table 4.11: Manufacture of wearing apparel; dressing and dyeing of fur (NACE Division 18)Expenditure, productivity and profi tability, EU-27, 2006
Personnel
costs
Purchases
of goods
& services
Investment
in tangible
goods
Apparent
labour
productivity
Average
personnel
costs
Wearing apparel; dressing & dyeing of fur (1) 15 100 60 900 1 781 16.2 12.0
Leather clothes (2) : 700 20 14.5 12.0
Other wearing apparel & accessories 14 708 59 064 1 733 16.2 12.0
Workwear 755 2 666 103 14.7 10.6
Other outerwear 9 284 39 403 1 188 15.7 11.6
Underwear 2 282 7 880 182 14.0 11.3
Other wearing apparel & accessories n.e.c. 2 388 9 115 260 21.9 15.4
Dressing & dyeing of fur; articles of fur 244 991 27 18.7 16.3
(EUR million) (EUR thousand per person)

4 Textiles, clothing, leather and footwear
130 European business — Facts and figures
Th e manufacture of footwear (NACE Group 19.3) was the largest activity within the leather man-ufacturing sector, accounting for about seven tenths (70.7 %) of employment and a smaller ma-jority (58.2 %) of value added. Th e manufacture of luggage, handbags and the like (NACE Group 19.2) accounted for a further quarter (25.4 %) of the leather manufacturing sector’s value added in 2006, the rest (16.4 %) coming from the activity of tanning and dressing leather (NACE Group 19.1).
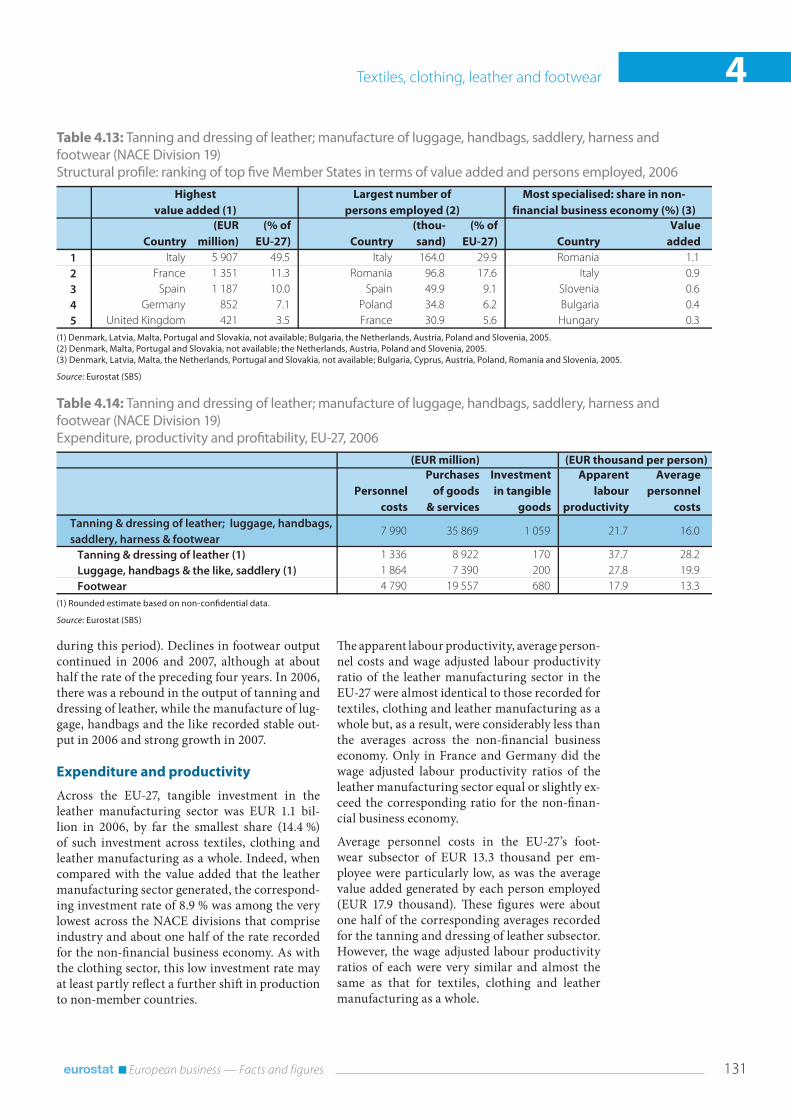
Almost one half (49.5 %) of all the value added generated by the EU-27’s leather manufacturing sector came from Italy – this was its largest share of any EU-27 industrial (NACE Sections C to E) subsection. Th e EUR 5.9 billion of value added generated by the sector in Italy was the equiva-lent of 0.9 % of the value added generated across the non-fi nancial business economy, about four and a half times the average contribution in the EU-27. In these relative terms, the only Member State that was more specialised in leather manu-facturing was Romania, where the value added from leather manufacturing accounted for 1.1 % of non-fi nancial business economy added value in 2005. Whereas Italy was relatively specialised in all activities within leather manufacturing, the focus of Romania’s specialisation was very much on footwear manufacturing.
Th ere was a sharp downward trend in the pro-duction index of leather manufacturing in the EU-27 during the period between 1997 and 2007 (an average decline of 5.4 % per annum). Between 2001 and 2005, the rate of decline was particular-ly strong (an average -8.5 % per annum), mainly as a result of the steep falls noted for footwear manufacturing (an average -10.2 % per annum
4.3: Leather and footwearTh is subchapter covers the leather and leather products manufacturing sector of NACE Subsec-tion DC, hereaft er referred to as leather manufac-turing. It includes tanning and dressing, as well as the manufacture of luggage, handbags and footwear.
Th ere are four key processes in leather manufac-turing: hide and skin storage and beamhouse op-erations, such as sorting, trimming and curing; tannery operations, such as deliming and tan-ning; post-tanning operations, such as washing and neutralisation; and fi nishing operations with respect to gloss, handle and colour. Th ere is now strong environmental legislation through these processes, whether concerning best available techniques (BAT) for the tanning of hides and skins, the restriction of various dangerous sub-stances and preparations in the process, or waste water legislation. Th ere are other key policies on trade that greatly impact upon the sector, such as access to raw hides and skins (bovine and ovine), market access, trade distortions and possible non-member country protectionism, which are of increasing concern in the current economic climate.
Structural profi le
Leather manufacturing (NACE Subsection DC) in the EU-27 was carried out as a main activity by about 44.0 thousand enterprises in 2006. Th ese enterprises employed 548.8 thousand persons and generated EUR 11.9 billion of value added, representing 18.4 % of the total value added for textiles, clothing and leather manufacturing (NACE Subsections DB and DC).
(1) Rounded estimate based on non-confi dential data.
Source: Eurostat (SBS)
Table 4.12: Tanning and dressing of leather; manufacture of luggage, handbags, saddlery, harness and footwear (NACE Division 19)Structural profi le, EU-27, 2006
Enterprises
(thousand)
Turnover
(EUR
million)
Persons
employed
(thousand)
Value
added
Persons
employed
Tanning & dressing of leather; luggage,
handbags, saddlery, harness & footwear (1)44.0 47 235 11 929 548.8 100.0 100.0
Tanning & dressing of leather 3.7 10 671 1 957 51.9 16.4 9.5
Luggage, handbags & the like, saddlery 14.2 10 330 3 028 108.8 25.4 19.8
Footwear 26.6 26 233 6 944 388.1 58.2 70.7
Share in total (%)Value
added
(EUR
million)
Textiles, clothing, leather and footwear 4
131 European business — Facts and figures
Th e apparent labour productivity, average person-nel costs and wage adjusted labour productivity ratio of the leather manufacturing sector in the EU-27 were almost identical to those recorded for textiles, clothing and leather manufacturing as a whole but, as a result, were considerably less than the averages across the non-fi nancial business economy. Only in France and Germany did the wage adjusted labour productivity ratios of the leather manufacturing sector equal or slightly ex-ceed the corresponding ratio for the non-fi nan-cial business economy.
Average personnel costs in the EU-27’s foot-wear subsector of EUR 13.3 thousand per em-ployee were particularly low, as was the average value added generated by each person employed (EUR 17.9 thousand). Th ese fi gures were about one half of the corresponding averages recorded for the tanning and dressing of leather subsector. However, the wage adjusted labour productivity ratios of each were very similar and almost the same as that for textiles, clothing and leather manufacturing as a whole.
during this period). Declines in footwear output continued in 2006 and 2007, although at about half the rate of the preceding four years. In 2006, there was a rebound in the output of tanning and dressing of leather, while the manufacture of lug-gage, handbags and the like recorded stable out-put in 2006 and strong growth in 2007.
Expenditure and productivity
Across the EU-27, tangible investment in the leather manufacturing sector was EUR 1.1 bil-lion in 2006, by far the smallest share (14.4 %) of such investment across textiles, clothing and leather manufacturing as a whole. Indeed, when compared with the value added that the leather manufacturing sector generated, the correspond-ing investment rate of 8.9 % was among the very lowest across the NACE divisions that comprise industry and about one half of the rate recorded for the non-fi nancial business economy. As with the clothing sector, this low investment rate may at least partly refl ect a further shift in production to non-member countries.
(1) Denmark, Latvia, Malta, Portugal and Slovakia, not available; Bulgaria, the Netherlands, Austria, Poland and Slovenia, 2005.(2) Denmark, Malta, Portugal and Slovakia, not available; the Netherlands, Austria, Poland and Slovenia, 2005.(3) Denmark, Latvia, Malta, the Netherlands, Portugal and Slovakia, not available; Bulgaria, Cyprus, Austria, Poland, Romania and Slovenia, 2005.
Source: Eurostat (SBS)
Table 4.13: Tanning and dressing of leather; manufacture of luggage, handbags, saddlery, harness and footwear (NACE Division 19)Structural profi le: ranking of top fi ve Member States in terms of value added and persons employed, 2006
Country
(EUR
million)
(% of
EU-27) Country
(thou-
sand)
(% of
EU-27) Country
Value
added
1 Italy 5 907 49.5 Italy 164.0 29.9 Romania 1.1
2 France 1 351 11.3 Romania 96.8 17.6 Italy 0.9
3 Spain 1 187 10.0 Spain 49.9 9.1 Slovenia 0.6
4 Germany 852 7.1 Poland 34.8 6.2 Bulgaria 0.4
5 United Kingdom 421 3.5 France 30.9 5.6 Hungary 0.3
Most specialised: share in non-
financial business economy (%) (3)
Highest
value added (1)
Largest number of
persons employed (2)
(1) Rounded estimate based on non-confi dential data.
Source: Eurostat (SBS)
Table 4.14: Tanning and dressing of leather; manufacture of luggage, handbags, saddlery, harness and footwear (NACE Division 19)Expenditure, productivity and profi tability, EU-27, 2006
Personnel
costs
Purchases
of goods
& services
Investment
in tangible
goods
Apparent
labour
productivity
Average
personnel
costs
Tanning & dressing of leather; luggage, handbags,
saddlery, harness & footwear 7 990 35 869 1 059 21.7 16.0
Tanning & dressing of leather (1) 1 336 8 922 170 37.7 28.2
Luggage, handbags & the like, saddlery (1) 1 864 7 390 200 27.8 19.9
Footwear 4 790 19 557 680 17.9 13.3
(EUR million) (EUR thousand per person)

4 Textiles, clothing, leather and footwear
132 European business — Facts and figures
(1) The Netherlands and Poland, 2005; unless otherwise stated, values refer to EUR million; number of enterprises and number of persons employed are given in thousands; average personnel costs and apparent labour productivity are given in EUR thousand per person; wage adjusted labour productivity, gross operating rate and investment are ratios expressed as percentages.
Source: Eurostat (SBS)
Table 4.15: Manufacture of textiles (NACE Division 17)Main indicators, 2006 (1)
BE BG CZ DK DE EE IE EL ES FR IT CY LV LT
Enterprises 1.4 0.8 2.5 0.5 3.9 0.2 0.2 3.7 8.6 5.0 23.4 0.1 0.4 0.8Persons employed 31.2 34.3 46.3 5.9 101.6 9.1 3.2 18.5 80.6 76.7 234.1 0.6 7.6 18.0Turnover 6 004 623 2 024 1 053 14 772 282 345 1 338 8 319 12 072 32 278 30 164 364Production 5 910 603 1 917 1 031 13 718 269 324 1 384 8 108 11 019 31 859 27 166 359Purch. of goods & serv. 4 559 487 1 524 761 10 172 202 205 1 022 6 048 8 780 23 793 18 121 258Value added 1 478 154 587 325 4 514 81 141 476 2 467 3 065 8 669 13 51 117Personnel costs 1 088 76 356 231 3 364 57 84 332 1 799 2 623 5 667 8 33 88Average personnel costs 36.5 2.3 8.1 40.3 34.2 6.3 27.1 22.2 23.9 35.0 28.5 15.3 4.5 5.1Gross operating surplus 390 78 231 95 1 150 24 57 144 668 441 3 002 5 19 29Gross investment 171 142 127 66 468 10 17 97 609 350 1 290 1 19 25Apparent labour prod. 47.4 4.5 12.7 54.8 44.5 9.0 44.5 25.7 30.6 40.0 37.0 22.4 6.8 6.5Wage adj. labour prod. 129.8 198.2 156.8 136.0 130.0 141.6 164.2 115.5 127.9 114.2 130.1 146.0 149.8 128.6Gross operating rate 6.5 12.5 11.4 9.0 7.8 8.5 16.5 10.8 8.0 3.7 9.3 15.8 11.4 8.0Investment rate 11.6 92.3 21.6 20.3 10.4 12.1 11.8 20.5 24.7 11.4 14.9 5.2 37.5 21.5
LU HU MT NL AT PL PT RO SI SK FI SE UK NO
Enterprises 0.0 1.9 : 1.3 0.8 5.5 6.3 2.4 0.5 0.2 1.0 2.2 4.8 0.7Persons employed : 19.7 : 13.9 14.8 82.4 75.5 71.0 9.9 14.5 5.0 7.2 77.8 3.9Turnover : 510 : 2 577 2 112 2 875 3 775 1 034 724 380 666 959 9 096 624Production : 445 : 2 433 1 930 2 529 3 680 1 032 626 356 663 896 8 291 568Purch. of goods & serv. : 358 : 1 805 1 425 2 082 2 768 749 536 273 411 637 5 871 431Value added : 177 : 751 715 794 1 098 325 189 112 262 332 3 135 210Personnel costs : 120 : 513 514 435 834 225 132 84 178 250 2 148 155Average personnel costs : 6.6 : 40.6 36.1 5.7 11.2 3.2 13.7 5.8 37.5 38.6 29.3 42.3Gross operating surplus : 56 : 238 202 359 264 100 58 28 85 76 987 55Gross investment : 23 : : 51 186 198 176 25 46 28 47 238 17Apparent labour prod. : 8.9 : 54.1 48.3 9.6 14.5 4.6 19.1 7.7 52.2 46.0 40.3 53.3Wage adj. labour prod. : 136.0 : 133.3 133.9 168.3 130.0 143.2 139.2 133.1 139.3 119.1 137.4 126.2Gross operating rate : 11.1 : 9.2 9.6 12.5 7.0 9.7 7.9 7.4 12.7 7.9 10.9 8.8Investment rate : 12.8 : : 7.1 23.4 18.0 54.0 13.2 40.8 10.7 14.1 7.6 8.3

Textiles, clothing, leather and footwear 4
133 European business — Facts and figures
(1) The Netherlands and Poland, 2005; unless otherwise stated, values refer to EUR million; number of enterprises and number of persons employed are given in thousands; average personnel costs and apparent labour productivity are given in EUR thousand per person; wage adjusted labour productivity, gross operating rate and investment are ratios expressed as percentages.
Source: Eurostat (SBS)
Table 4.16: Manufacture of wearing apparel; dressing and dyeing of fur (NACE Division 18)Main indicators, 2006 (1)
BE BG CZ DK DE EE IE EL ES FR IT CY LV LT
Enterprises 1.1 4.6 7.5 0.4 2.7 0.4 0.1 12.7 12.8 12.0 36.7 0.4 0.9 2.2Persons employed 7.5 139.9 33.5 2.4 54.5 10.7 1.5 37.3 93.2 67.4 238.0 1.3 13.1 32.3Turnover 1 640 869 574 458 10 005 187 178 1 962 7 986 13 214 29 251 60 152 359Production 1 579 846 537 426 9 238 151 66 1 954 7 695 10 101 28 119 52 158 364Purch. of goods & serv. 1 297 566 393 360 7 520 113 151 1 504 5 855 10 253 22 243 42 88 216Value added 345 325 217 124 2 440 75 -27 637 2 283 3 067 7 191 21 73 157Personnel costs 224 221 173 83 1 642 61 38 423 1 667 2 239 4 291 16 46 123Average personnel costs 34.8 1.6 6.3 39.6 31.6 5.7 26.6 17.4 19.7 34.3 22.7 14.4 3.7 4.0Gross operating surplus 121 105 44 41 798 14 -65 214 616 828 2 899 5 26 34Gross investment 27 67 22 12 128 7 2 67 178 182 580 1 8 14Apparent labour prod. 46.3 2.3 6.5 52.6 44.8 7.0 -18.2 17.1 24.5 45.5 30.2 15.6 5.6 4.9Wage adj. labour prod. 133.2 144.0 102.8 132.6 141.7 121.4 -68.3 98.2 124.6 132.9 133.0 108.5 152.2 120.6Gross operating rate 7.4 12.0 7.7 9.0 8.0 7.2 -36.2 10.9 7.7 6.3 9.9 8.0 17.3 9.5Investment rate 7.9 20.7 10.3 10.0 5.3 9.1 -6.5 10.5 7.8 5.9 8.1 6.5 10.4 8.7
LU HU MT NL AT PL PT RO SI SK FI SE UK NO
Enterprises 0.0 4.4 : 1.5 0.9 17.7 11.3 5.7 1.0 0.3 1.1 1.7 3.9 0.6Persons employed : 38.7 : 5.0 8.0 160.9 111.3 257.2 10.6 24.2 4.3 1.7 37.8 1.4Turnover : 774 : 574 866 2 013 3 156 2 098 261 297 534 316 4 530 237Production : 672 : 519 717 1 798 3 069 2 043 222 275 452 285 3 937 220Purch. of goods & serv. : 560 : 431 611 1 201 2 104 1 308 149 184 373 239 2 951 172Value added : 242 : 138 265 762 1 095 894 111 118 170 81 1 511 77Personnel costs : 188 : 100 192 556 923 713 107 111 121 50 786 44Average personnel costs : 5.2 : 32.3 26.8 4.0 8.5 2.8 10.7 4.6 30.7 34.8 22.3 39.6Gross operating surplus : 55 : 39 73 207 172 181 5 7 49 30 726 33Gross investment : 15 : : 13 80 100 176 8 10 8 5 56 5Apparent labour prod. : 6.3 : 27.9 33.2 4.7 9.8 3.5 10.5 4.9 39.7 48.8 40.0 53.5Wage adj. labour prod. : 119.9 : 86.6 123.6 119.5 116.0 124.7 97.6 106.0 129.5 140.4 179.3 135.1Gross operating rate : 7.1 : 6.7 8.4 10.3 5.5 8.6 1.7 2.4 9.2 9.3 16.0 13.7Investment rate : 6.2 : : 5.0 10.5 9.2 19.7 7.1 8.5 4.8 6.4 3.7 6.3

4 Textiles, clothing, leather and footwear
134 European business — Facts and figures
(1) Bulgaria, 2005, except for number of enterprises, number of persons employed and gross operating surplus; Austria and Slovenia, 2005, except for number of enterprises; the Netherlands and Poland, 2005; unless otherwise stated, values refer to EUR million; number of enterprises and number of persons employed are given in thousands; average personnel costs and apparent labour productivity are given in EUR thousand per person; wage adjusted labour productivity, gross operating rate and investment are ratios expressed as percentages.
Source: Eurostat (SBS)
Table 4.17: Tanning and dressing of leather; manufacture of luggage, handbags, saddlery, harness and footwear (NACE Division 19)Main indicators, 2006 (1)
BE BG CZ DK DE EE IE EL ES FR IT CY LV LT
Enterprises 0.1 0.5 0.9 0.1 1.1 0.1 0.0 1.3 5.8 2.1 19.2 0.1 0.1 0.2Persons employed 1.7 21.6 11.4 : 20.3 1.7 0.3 5.8 49.9 30.9 164.0 0.3 0.6 1.8Turnover 382 125 214 : 3 452 30 44 334 4 738 3 964 26 128 16 : 35Production 374 120 210 : 3 035 28 39 351 4 631 3 475 25 692 11 : 31Purch. of goods & serv. 303 91 140 : 2 578 18 29 234 3 618 2 589 20 705 11 : 19Value added 82 36 85 : 852 12 17 134 1 187 1 351 5 907 6 : 13Personnel costs 55 28 70 : 566 10 8 89 878 959 3 613 4 : 7Average personnel costs 35.4 1.5 6.6 : 29.6 6.0 29.2 19.9 18.9 31.6 26.9 14.9 : 4.2Gross operating surplus 28 9 15 : 286 2 9 46 309 393 2 293 2 : 6Gross investment 7 7 12 : 117 1 1 18 82 75 393 0 : 6Apparent labour prod. 47.4 1.8 7.4 : 42.1 7.0 58.5 23.1 23.8 43.7 36.0 22.0 : 7.0Wage adj. labour prod. 133.6 125.7 113.0 : 142.2 117.0 200.6 116.0 125.4 138.2 134.0 148.2 : 167.3Gross operating rate 7.2 6.4 6.9 : 8.3 5.9 19.2 13.7 6.5 9.9 8.8 13.4 : 16.5Investment rate 8.4 20.0 13.6 : 13.7 11.7 3.8 13.5 6.9 5.5 6.6 6.1 : 49.8
LU HU MT NL AT PL PT RO SI SK FI SE UK NO
Enterprises 0.0 0.7 : 0.3 0.2 4.2 3.5 2.1 0.2 : 0.2 0.4 0.8 0.1Persons employed 0.0 13.8 : 1.8 4.8 34.8 : 96.8 5.8 : 2.0 1.3 11.3 0.3Turnover 0 381 : 332 833 758 : 947 383 : 206 185 1 115 42Production 0 338 : 303 735 769 : 968 356 : 177 182 1 014 42Purch. of goods & serv. 0 262 : 233 630 526 : 613 307 : 128 130 699 32Value added 0 127 : 96 208 247 : 354 89 : 78 55 421 11Personnel costs 0 78 : 63 139 142 : 278 70 : 54 44 279 10Average personnel costs : 5.8 : 41.8 29.9 4.8 : 2.9 12.4 : 28.6 36.6 26.0 36.9Gross operating surplus 0 49 : 33 69 106 : 77 19 : 24 10 142 1Gross investment 0 5 : 6 9 35 : 138 7 : 6 4 18 1Apparent labour prod. : 9.2 : 53.3 43.1 7.1 : 3.7 15.4 : 39.4 41.2 37.3 36.8Wage adj. labour prod. : 158.4 : 127.4 144.3 149.3 : 127.1 124.1 : 137.7 112.5 143.6 99.7Gross operating rate : 13.0 : 9.9 8.3 14.0 : 8.1 5.0 : 11.6 5.3 12.7 1.8Investment rate : 4.1 : 6.0 4.2 14.2 : 39.0 7.5 : 8.2 7.2 4.3 4.6