Embed Size (px)
Citation preview

Tennessee Valley Authority
Thermal Assessment of Existing 161kv & 500kv Transmission Lines

TVA Power Service Area

Why are we gathering aerial laser survey & doing thermal assessments?
• Before 1977; NESC ground clearance requirements @ 120oF (49oC)
• 1977 NESC code required clearances at maximum operating temperature
• Have generally designed new lines for 100oC since 1977

Transmission Line Assessment and Up-Rate Program
Background– NESC Code for Lines Built Before 1977 Required Clearance be Maintained for
a Conductor Temperature of 49 Degrees C– 1977 NESC Code Revision Required Clearances be Maintained Based on
Actual Operating Temperatures– Peak Conditions Typically Require Operation between 80 – 100 Degrees C– Transmission Line Operation and Clearance Requirements are a Matter of
NERC Compliance. The scope includes 8,137 Miles of Transmission Line• 2,405 Miles of 500-kV Transmission Lines• 5,662 Miles of 161-kV Transmission Lines• 70 Miles of 46/69-kV Transmission Lines
– Current Asset Condition Could Impact Reputation and Cost• Assumed Rating Could Lead to NERC Reportable Flashover Events• Increased Risk of Public Contact Events• NESC or NERC Violations Receive More Scrutiny Since Blackout of 2003

TVA in-house engineering assessedabout 30% of our lines
Burns & McDonnellMesa AssociatesSargent & Lundy
Aerotec LLCOptimal Geomatics
GeodigitalNetwork Mapping
Terrapoint USA IncTuck Engineering
MESA coupled with Optimal GeomaticsS&L coupled with Geodigital
Burns & Mac and Network Mapping

TVA 22.1 24.1 25.5 29.8NESC 19.1 21.1 22.5 26.8delta 3.0 3.0 3.0 3.0
69kV 161kV 230kV 500kV
Lidar NESC + 1 ft. 20.1 22.1 23.5 27.8
Vertical clearance of conductors above roads, driveways, parking lots, areas subject to truck traffic, unpaved land subject to cultivating.

• Buffer is 1ft.• Need to model as accurate as possible
with lidar• Why?- affects the sag/clearance (long
spans could change sag several feet)• If there is a violation, could be significat
cost for modification

With lidar
Structure location +- 0.2 ftWire tension +- 20 lbsGround/obstacles +- 0.2ft
However,
Temperature not directly measured.
Derived from IEEE 738

As Captured Match Lidar 110.3deg Creep FE

212 deg F creep FE

Steps to get FE sag
• Alignment• Structure locations (station/offset)• Conductor temperature (weather data)• Assume sagging temperature (plumb INS)• As captured least square best fit Tension (FE6)
Used to get tension not move structures• Adjust each span at mid span (non-plumb
INS)FE3

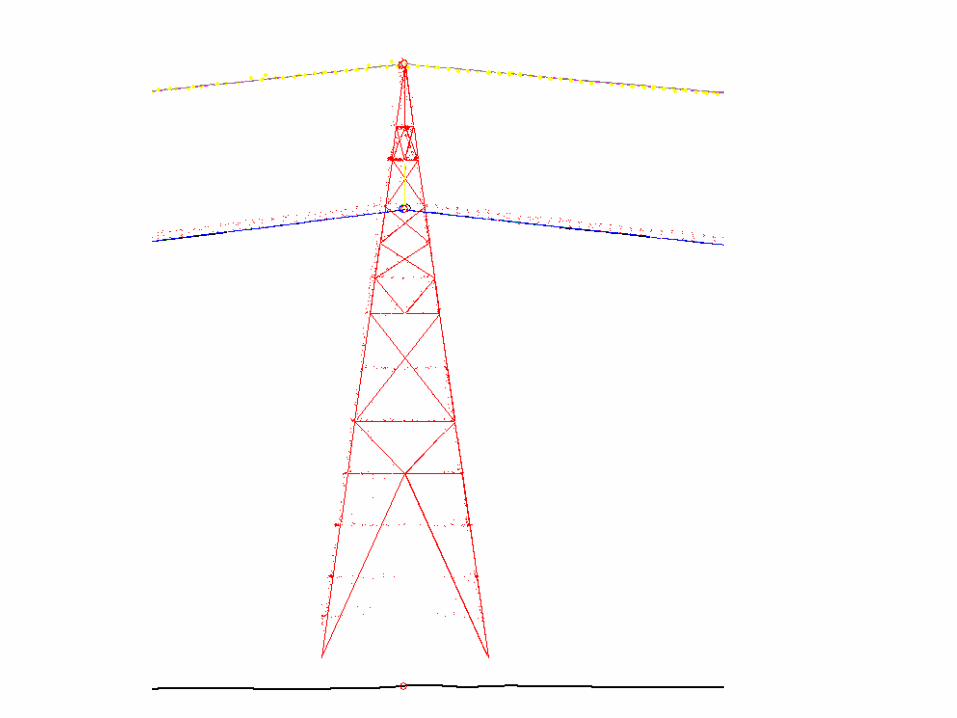
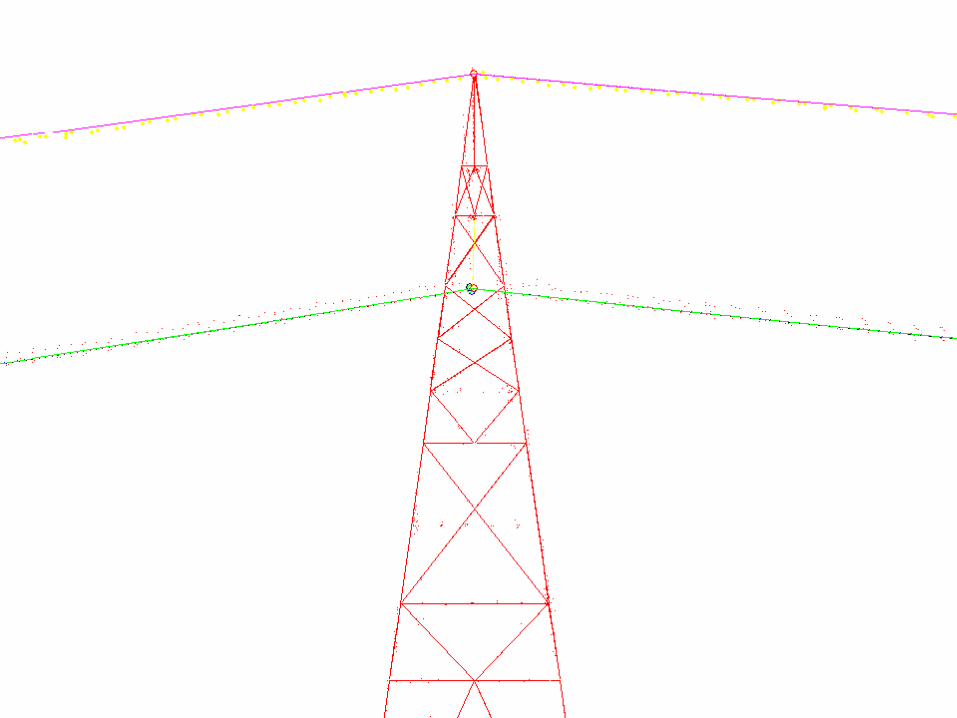
First locate structures (cross section view)

Example of locating structures to match the lidar ghost

Present Location (hgt=4.0 offset 0.0)

Adjust Height & Offset (hgt=4.4 offset 0.5)


Adjust Station (37337.75 to 37337.4)
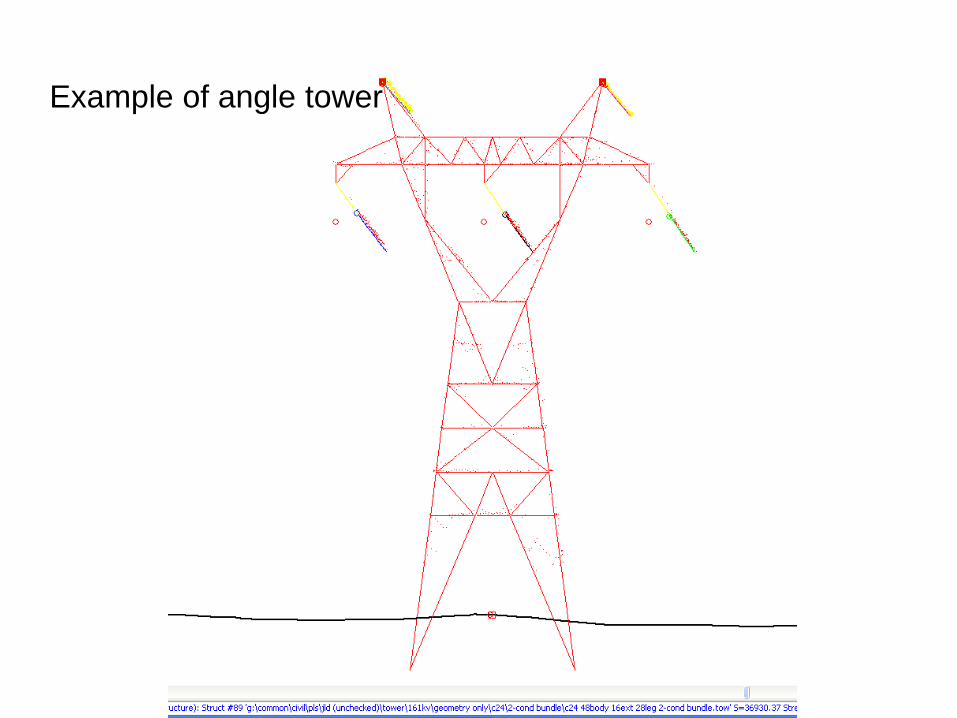
Example of angle tower

Example of special configuration
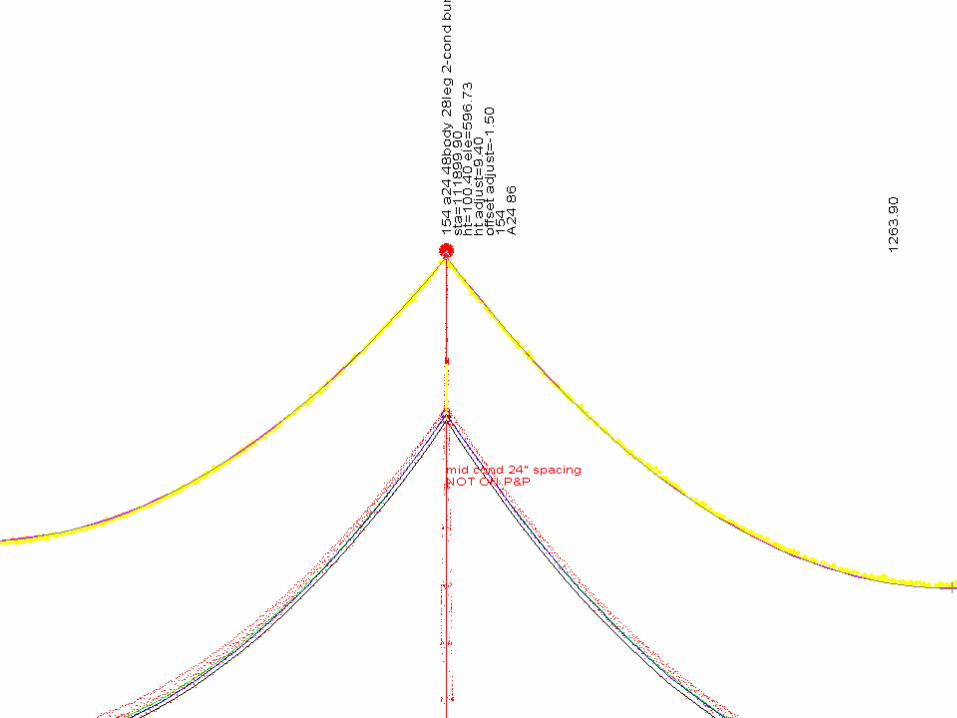
Special conductor spacing

2 ft spacing C phase


2ft conductor spacing C phase

Example of As built not on Drawingstr 154 no special conductor spacing


Before you can do graphical sag you must determine as capture conductor temperature

Flight Time 5/01/200517:09CDT-17:59CDT

For Example,From the weather dataStr 124-Colbert 17:56-17:59 CDT

Temp not variable but wind speed and direction are
Average about WNW
Not use 22.5

Easting & Northing from PI report gives AzimuthConvert Flight Time to Sun TimeUsing difference between Azimuth and wind direction gives wind angle, for example from str 124 to Colbert AZ=59deg Wind Dir = 298.9deg

IEEE uses cond elev, Latitude, and AmpsLongitude is used for Sun Time

Conductor Bearing 59deg

To Demonstrate GraphicallyUsing F7 (measure) azi 298.9line shows angle between conductor & windAngle = 60.1deg But from the weather data variance in wind direction +-Therefore, use 75deg (more cooling)

Weather instruments: Multiple Davis Instruments Weather Wizard III portable weather stations with recording equipment in vinyl container and with weather probes mounted on telescopic masts.
Temperature accuracy: +/- 1 degree F
Temperature range: -50 degrees F to 140 degrees F
Wind speed accuracy: +/- 5%
Wind speed range: 2 mph to 150 mph (2.9 ft/sec to 220 ft/sec)Wind direction accuracy: +/- 7 degrees

Equation for Sun Time

=CT+(1/15)*(IF(OR(C8="CST",C8="CDT"),90,IF(OR(C8="EST",C8="EDT"),75,"Check"))-A8)+(0.165*SIN(2*RADIANS(360*(n-81)/364))-0.126*COS(RADIANS(360*(n-81)/364))-0.025*SIN(RADIANS(360*(n-81)/364)))-IF(OR(C8="CST",C8="EST"),0,IF(OR(C8="CDT",C8="EDT"),1,"Check"))
Equation in EXCEL

• http://aa.usno.navy.mil
Also, use website

-48/60 = -0.80 17:59 =17.98 -0.80 = 17.18 (matches spreadsheet)

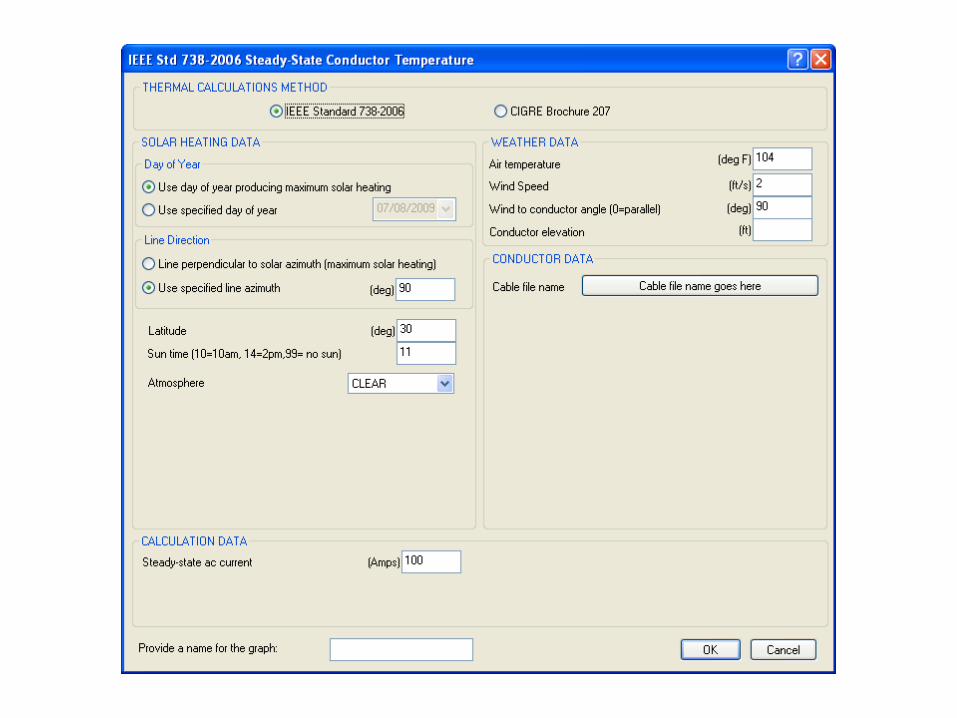
IEEE Std. 738-2006 method of calculation
Air temperature is 66.10 (deg F)Wind speed is 5.27 (ft/s)Angle between wind and conductor is 75 (deg)Conductor elevation above sea level is 506 (ft)Conductor bearing is 59 (deg) (user specified bearing, may not be value producing maximum solar heating)Sun time is 17.15 hours (solar altitude is 19 deg. and solar azimuth is -85 deg.)Conductor latitude is 34.8 (deg)Atmosphere is CLEARDay of year is 121 (corresponds to May 1 in year 2009) (user specified day, may not be day producing maximum solar heating)
Conductor description: 795 kcmil 26/7 Strands DRAKE ACSR - Adapted from 1970's Publicly Available DataConductor diameter is 1.108 (in)Conductor resistance is 0.1166 (Ohm/mile) at 77.0 (deg F)
and 0.1390 (Ohm/mile) at 167.0 (deg F)Emissivity is 0.7 and solar absorptivity is 0.9
Solar heat input is 3.396 (Watt/ft) (corresponds to Global Solar Radiation of 40.865 (Watt/ft^2) - which was calculated)Radiation cooling is 0.514 (Watt/ft)Convective cooling is 3.190 (Watt/ft)
Given a constant ac current of 118.5 amperes,The conductor surface temperature is 74.6 (deg F) Surface? Change in PLS 10.002

Range Ambient 66.1 to Only Uncertain Variable No Wind 90.7 previous 74.6
IEEE Std. 738-2006 method of calculation
Air temperature is 66.10 (deg F)Wind speed is 0.00 (ft/s)Angle between wind and conductor is 75 (deg)Conductor elevation above sea level is 506 (ft)Conductor bearing is 59 (deg) (user specified bearing, may not be value producing maximum solar heating)Sun time is 17.15 hours (solar altitude is 19 deg. and solar azimuth is -85 deg.)Conductor latitude is 34.8 (deg)Atmosphere is CLEARDay of year is 121 (corresponds to May 1 in year 2009) (user specified day, may not be day producing maximum solar heating)
Conductor description: 795 kcmil 26/7 Strands DRAKE ACSR - Adapted from 1970's Publicly Available DataConductor diameter is 1.108 (in)Conductor resistance is 0.1166 (Ohm/mile) at 77.0 (deg F)
and 0.1390 (Ohm/mile) at 167.0 (deg F)Emissivity is 0.7 and solar absorptivity is 0.9
Solar heat input is 3.396 (Watt/ft) (corresponds to Global Solar Radiation of 40.865 (Watt/ft^2) - which was calculated)Radiation cooling is 1.559 (Watt/ft)Convective cooling is 2.157 (Watt/ft)
Given a constant ac current of 118.5 amperes,The conductor surface temperature is 90.7 (deg F)
Lower Bound Ambient too ConservativeUpper Bound No wind not realistic 2fps min

Clear is clean air and industrial is dirty air,Particulates increase conductivity

History : Weather Underground
Time: Temp.: DewPoint: Humidity: Sea Visibility: WindDir:Wind:Gust(CDT) Level: SpeedSpeed: Precip: Events:Conditions:
Pressure
8:53 AM 53.1 °F 41.0 °F 64% 30.20 in 10.0 miles Calm Calm - N/A Clear9:53 AM 59.0 °F 37.0 °F 44% 30.21 in 10.0 miles Calm Calm - N/A Clear10:53 AM 61.0 °F 33.1 °F 35% 30.21 in 10.0 miles WNW 9.2 mph - N/A Clear11:53 AM 63.0 °F 33.1 °F 33% 30.21 in 10.0 miles WNW 10.4 mph 16.1 mph N/A Clear12:53 PM 64.0 °F 34.0 °F 33% 30.18 in 10.0 miles Variable 6.9 mph - N/A Clear1:53 PM 64.0 °F 35.1 °F 34% 30.17 in 10.0 miles Variable 4.6 mph - N/A Partly Cloudy2:53 PM 64.9 °F 37.0 °F 36% 30.16 in 10.0 miles Variable 4.6 mph - N/A Clear3:53 PM 66.0 °F 39.0 °F 37% 30.14 in 10.0 miles WNW 6.9 mph - N/A ScatteredClouds4:53 PM 66.0 °F 37.0 °F 34% 30.13 in 10.0 miles WNW 13.8 mph - N/A Partly Cloudy5:53 PM 6.0 °F 36.0 °F 33% 30.12 in 10.0 miles NW 10.4 mph - N/A Clear6:53 PM 63.0 °F 35.1 °F 35% 30.12 in 10.0 miles NW 6.9 mph - N/A Clear7:53 PM 55.9 °F 39.9 °F 55% 30.12 in 10.0 miles Calm Calm - N/A Clear8:53 PM 51.1 °F 43.0 °F 74% 30.12 in 10.0 miles South 3.5 mph - N/A Partly Cloudy9:53 PM 48.0 °F 43.0 °F 83% 30.13 in 10.0 miles SSW 3.5 mph - N/A Partly Cloudy10:53 PM 46.0 °F 41.0 °F 83% 30.14 in 10.0 miles Calm Calm - N/A Clear11:53 PM 45.0 °F 42.1 °F 90% 30.14 in 10.0 miles Calm Calm - N/A Clear
Sky Not Always Clear

NOT ALL WEATHER DATA REPORTS GAVE SOLAR RADIATION

IEEE Std. 738-2006 method of calculation
Air temperature is 66.10 (deg F)Wind speed is 5.27 (ft/s)Angle between wind and conductor is 75 (deg)Conductor elevation above sea level is 506 (ft)Conductor bearing is 59 (deg) (user specified bearing, may not be value producing maximum solar heating)Sun time is 18.063 hours (solar altitude is 8 deg. and solar azimuth is -77 deg.)Conductor latitude is 34.8 (deg)Atmosphere is CLEARDay of year is 121 (corresponds to May 1 in year 2009) (user specified day, may not be day producing maximum solar heating)
Conductor description: 795 kcmil 26/7 Strands DRAKE ACSR - Adapted from 1970's Publicly Available DataConductor diameter is 1.108 (in)Conductor resistance is 0.1166 (Ohm/mile) at 77.0 (deg F)
and 0.1390 (Ohm/mile) at 167.0 (deg F)Emissivity is 0.7 and solar absorptivity is 0.9
Solar heat input is 1.918 (Watt/ft) (corresponds to Global Solar Radiation of 23.081 (Watt/ft^2) - which was calculated)Radiation cooling is 0.306 (Watt/ft)Convective cooling is 1.919 (Watt/ft)
Given a constant ac current of 118.5 amperes,The conductor surface temperature is 71.2 (deg F)
Iterate on Sun time to get Watts/ft^2 to match
Changed conductor temp from 74.6 to 71.2 (Very Cloudy would be significant)

Steps to get FE sag
• Alignment• Structure locations (station/offset)• Conductor temperature (weather data)• Assume sagging temperature (plumb INS)• As captured least square best fit Tension (FE6)
Used to get tension not move structures• Adjust each span at mid span (non-plumb
INS)FE3

Assumed stringing condition 60deg Initialinsulators plumb
As Captured Temp
Sagging Tension is derived from least square best fit of As Captured
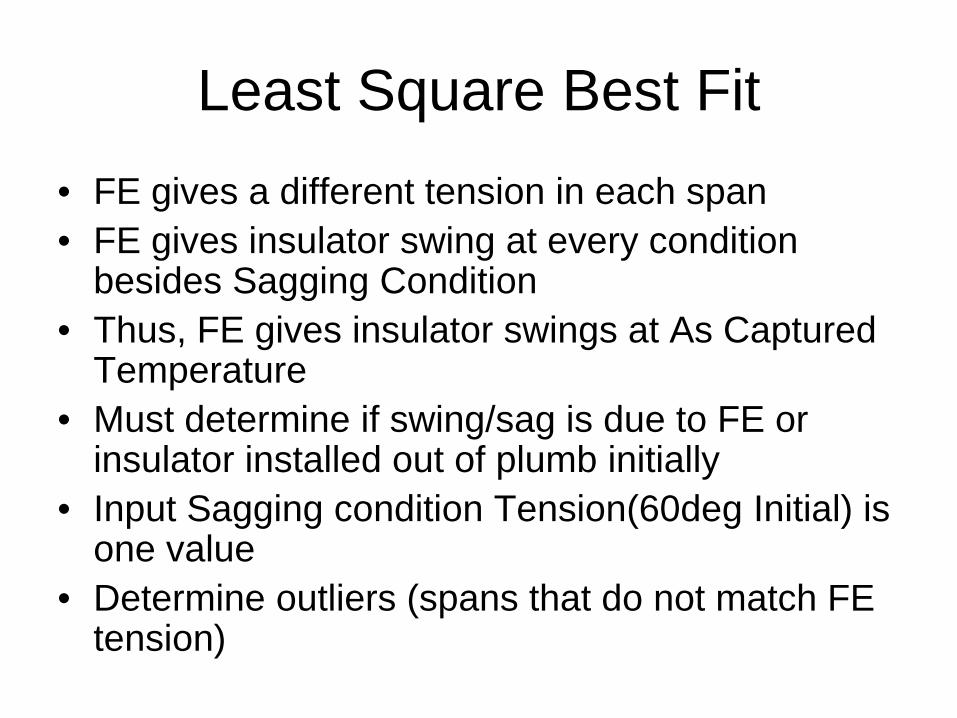
Least Square Best Fit• FE gives a different tension in each span• FE gives insulator swing at every condition
besides Sagging Condition • Thus, FE gives insulator swings at As Captured
Temperature• Must determine if swing/sag is due to FE or
insulator installed out of plumb initially• Input Sagging condition Tension(60deg Initial) is
one value• Determine outliers (spans that do not match FE
tension)

To Illistrate Using Sagging Tension = 6000
Note: str are adjusted

Least Square Best Fit

Graphical Sag Tension Report
Structure Set Phase Three Least Number Tension Tension TensionNumber Number No. Point Squares Points Before After Error
Calc. Calc. Least (lbs) (lbs)-TensionTension Tension Squares Before
(lbs) (lbs) Fit (lbs)-----------------------------------------------------------------------74B 9 1 2124.17 2991.69 225 4891.16 6005.32 3013.6375 4 1 4927.85 4907.70 2031 4906.58 6005.56 1097.8776 4 1 4954.27 4937.14 1826 4887.36 6007.43 1070.2977 4 1 4970.02 4959.16 1520 4907.58 6004.48 1045.3278 4 1 4970.25 5007.41 1151 4951.95 6002.76 995.3579 4 1 4971.11 5024.33 1126 4955.94 6002.20 977.8880 4 1 4936.19 5041.59 816 5004.34 6002.03 960.4481 4 1 5102.22 5106.94 1335 5108.82 6002.31 895.3882 4 1 4859.67 4973.88 865 5030.29 6003.36 1029.4883 4 1 5017.29 5036.29 1506 4989.98 6005.95 969.6684 4 1 5039.66 5034.95 1211 4959.21 6006.30 971.3485 4 1 4966.74 5020.04 986 4956.82 6004.68 984.6486 4 1 4997.25 5063.62 818 4928.81 6004.25 940.6287 4 1 5042.49 5017.46 914 4924.90 6004.65 987.1888 4 1 4969.19 4972.16 901 4887.46 6006.45 1034.3089 4 1 5035.10 4950.09 1133 4830.23 6007.69 1057.5990 4 1 4806.83 4861.13 1311 4768.40 6008.11 1146.9891 4 1 4839.69 4870.14 1057 4743.14 6009.36 1139.2292 4 1 4770.34 4901.51 780 4724.05 6012.02 1110.5193 4 1 4838.02 4856.39 820 4700.56 6011.30 1154.9194 4 1 4768.98 4875.28 822 4699.75 6009.28 1134.00
Least Square Answers do not change with Sagging input
Based on lidar points only


Stringing condition 60deg InitialAssumed insulators plumb (to be corrected)

Before Adjustments

As captured temperature no adjustment

As captured temperature no adjustment

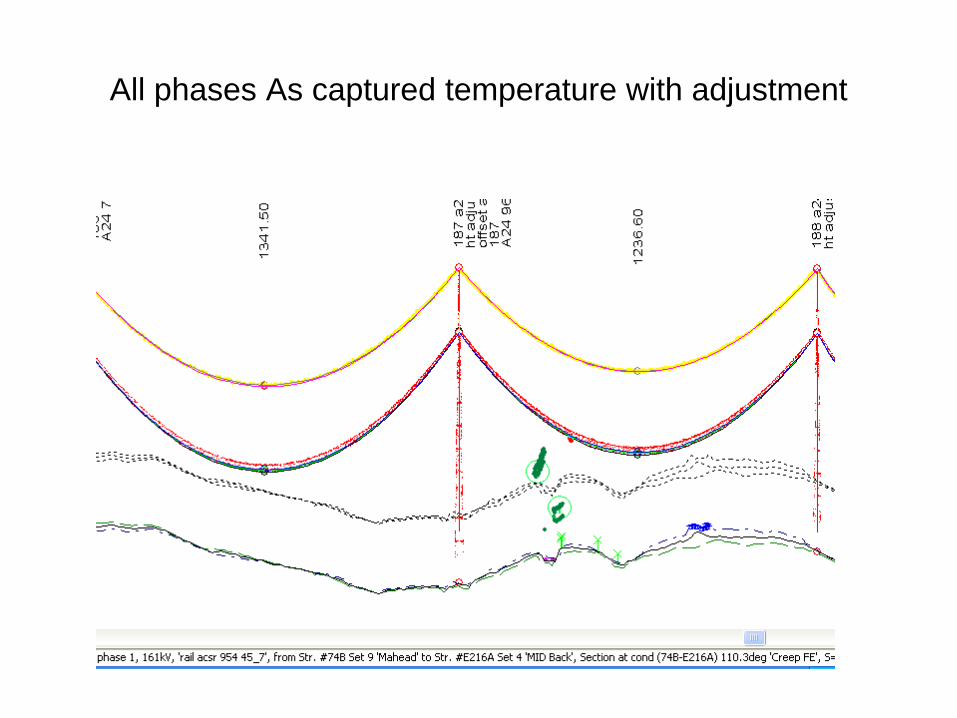
All phases As captured temperature with adjustment

Center phase As captured temperature with adjustment

As captured temperature with adjustment
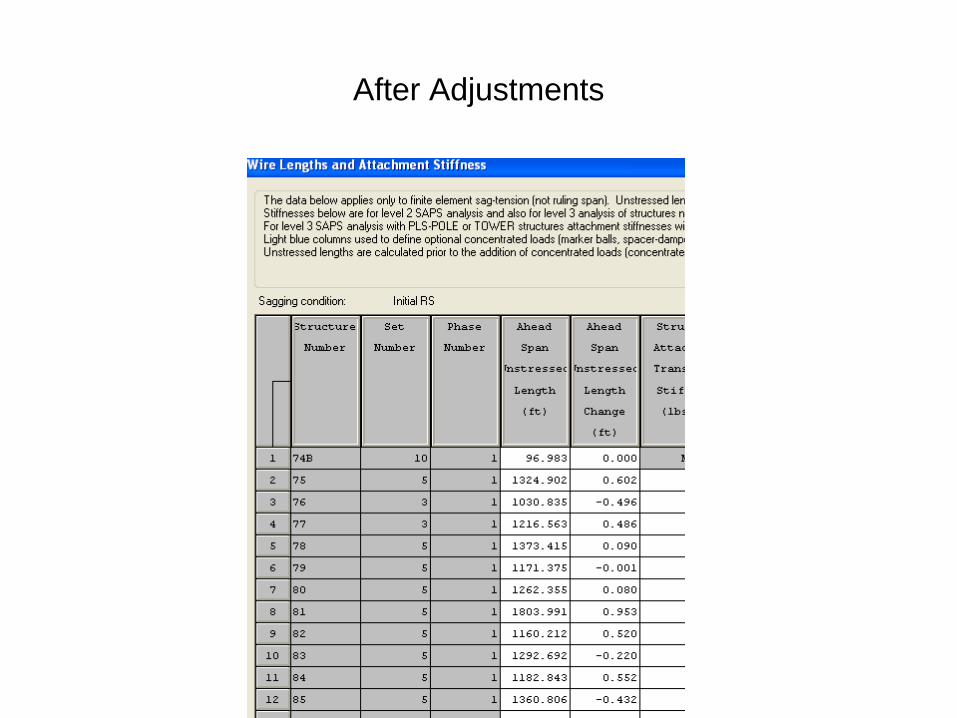
After Adjustments

Stringing condition 60deg Initial with adjustments (Assumption of plumb Insulator removed)

Angle brackets 3’-5”

Brackets do not swing with Level 2

Only Insulators Swing (not brackets)

Use all adjustments
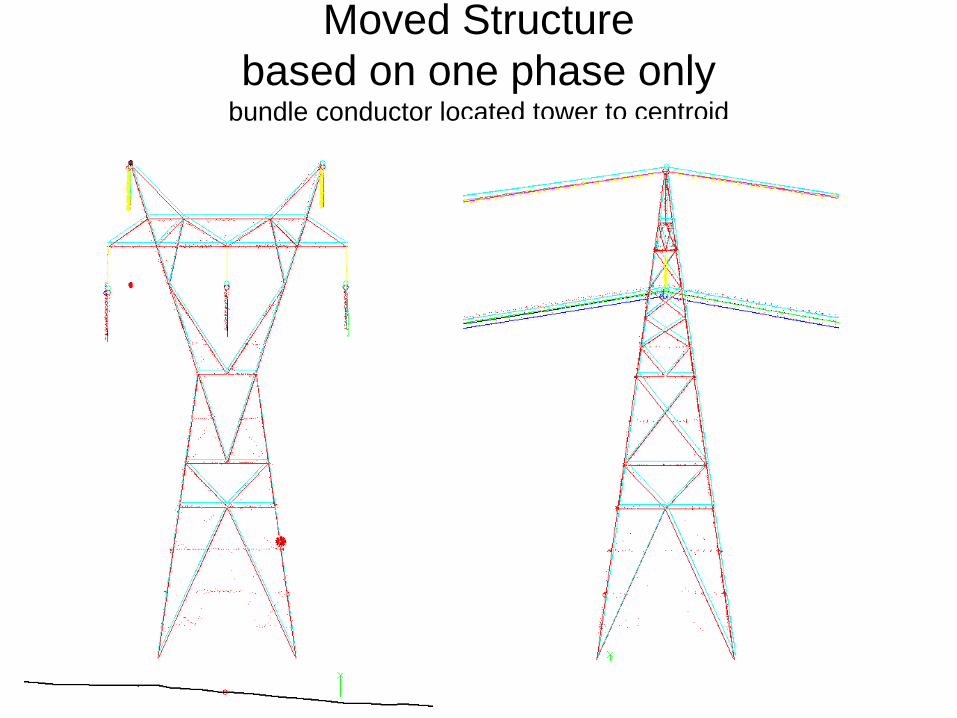
Moved Structure based on one phase only
bundle conductor located tower to centroid

Using FE6 adjust str moved str of PI

FE6 first three options not selected FE6 with first three options selected

Also Longitudinal Loads on the
structure will be determined from modeled insulator swings at
As captured and sagging conditions

Str Loads FE3 wire adjustment As Capture

Str Loads FE3 wire adjustment60deg Intial

Str Loads FE3 wire adjustment NESC 1” Ice 250D
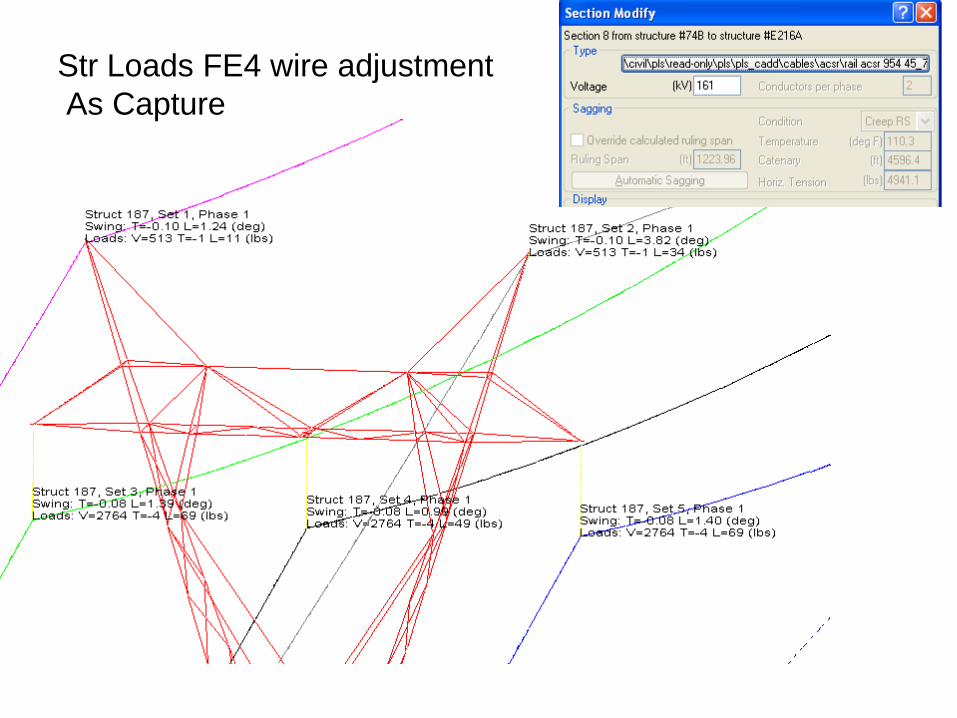
Str Loads FE4 wire adjustmentAs Capture

Str Loads FE4 wire adjustment60deg Initial

Structural Loads
• Longitudinal loads will depend on Sagging Conditions FE3 (Initial 60) FE4 (AS Captured Final)
• NESC ICE (250D) loads will be influenced by As Capture Swing
• Additional Longitudinal Load created by Cut/Slide to provide clearances

Conclusion
• Assumption of insulators are plumb is removed by FE3 adjustment with correct sags in each span
• Results are still based on how well derive the conductor Temperature from weather data
• Range Ambient 66.1deg to No Wind 90.7deg• Using all the weather data including solar radiation
gave 71.2deg• Thermal Rating is impacted approximately an equal
temperature from the input conductor temperature• Cost of additional modifications