Embed Size (px)
Citation preview

Tennessee Department of Health | Tennessee Vaccine-Preventable Diseases and Immunization Program | February 2021

IMMUNIZATION STATUS SURVEY – 2020
2

IMMUNIZATION STATUS SURVEY – 2020
3
Acknowledgements Birth data were provided by the Tennessee Department of Health, Office of Vital Records and Statistics Immunization data were collected by county and regional health department nurses, immunization representatives and disease investigation staff. Data entry, analysis and reporting were conducted by staff of the Tennessee Vaccine-Preventable Diseases and Immunization Program. Survey data were collected using REDCap electronic data capture tools hosted at the Tennessee Department of Health. REDCap (Research Electronic Data Capture, http://projectredcap.org/) is a secure web-based application designed to support data capture.
IMMUNIZATION STATUS SURVEY – 2020
4
Table of Contents Page Executive Summary …6 Definitions of Abbreviations in Charts …11 Survey Introduction: …12 Table 1. ACIP List of Diseases to Prevent through Vaccination of Children < 24 Months of Age …13 Table 2. Catch-Up Guidance for PCV and HIB, Centers for Disease Control and Prevention …16 Table 3a. Demographics of 2020 Sample Population, Including Oversampled Black Children …17 Table 3b. Demographics of 2020 Sample Population, Including Oversampled Black Children …18 Figure 1. Six-Year Trend of Refusals by Reason, Tennessee …18 Table 4. Vaccine Refusal Reasons by Region, Tennessee …19 Table 5. Unable to Locate by Region, Tennessee …20 Figure 2. 4:3:1:FS:3:1:FS Immunization Rate Trends …20 Figure 3. Percent of 24-month Old Children with On-time 4:3:1:FS:3:1:4 Series …21 Figure 4. Statewide Trend of Complete 4:3:1:FS:3:1:FS Series …22 Figure 5. Percent of 24-month Old Children with On-Time 4:3:1:FS:3:1:FS Series by Region …22 Figure 6. Comparison of Healthy People 2020 objectives to Vaccination Completion Rates …23 Figure 7. Statewide Trend of Complete Immunization for Individual Vaccines …24 Figure 8. Percentage and Count of Children with Seasonal Influenza Vaccine …25 Figure 9. Percentage of Children Who Received Influenza Vaccination in First Year of Life …26 Figure 10. Statewide Percentage of Children with Age-Appropriate Levels by Vaccine and Race …27 Figure 11. 4:3:1:FS:3:1:FS Immunization Level Trends, by Race, Tennessee …28 Figure 12. Statewide Percentage of Children with Age-Appropriate Influenza by Race …28 Figure 13. Percentage of Children who Received Influenza Vaccination in First Year of Life by Race …29 Figure 14. Comparison of Children Complete for the 4:3:1:FS:3:1:FS Series by Provider Type …30 Table 6. Prevalence of Three Risk Factors for Delayed Immunizations, by Provider Type …30 Figure 15. Comparison of Children Complete for the 4:3:1:FS:3:1:FS Series with Zero, One, or Two or more Siblings …31 Figure 16. Percentage of Children with Complete Diphtheria, Tetanus, Pertussis (DTaP) Three Dose vs Four Dose Series, by Health Department Region …32 Figure 17. Percentage of Children with Complete HIB Series with ACIP vs CDC Catch-Up Schedule …33 Figure 18. Percentage of Children with Complete PCV Series with ACIP vs CDC Catch-Up schedule …33 Summary of Key Findings …34 Appendices 1: Regional Antigen Specific Results …39
DTaP & Polio …40 MMR & Haemophilus influenzae type b …41 Hepatitis B (Three-Dose Coverage) & Hepatitis B (birth dose) …42 Varicella & Pneumococcus …43 4:3:1:FS:3:1:FS series & Hepatitis A …44 Rotavirus & Influenza (Two-Dose Coverage) …45

IMMUNIZATION STATUS SURVEY – 2020
5
Table of Contents (cont.) 2: Individual Health Department Region Charts (WestEast) …46
Memphis- Shelby County …47 West Tennessee Region …47 Jackson-Madison County …48 South Central Region …48 Mid-Cumberland Region …49 Nashville-Davidson County …49 Upper Cumberland Region …50 Southeast Region …50 Chattanooga- Hamilton County …51 East Tennessee Region …51 Knoxville-Knox County …52 Northeast Region …52 Sullivan County …53
3: Data Tables for Selected Analyses …54 Series Complete (4:3:1:FS:3:1:FS) by Region …55 Series Complete (4:3:1:FS:3:1:FS) by Provider Type …55 Series Complete (4:3:1:FS:3:1:FS) by Race …56 Series Complete (4:3:1:FS:3:1:FS) by Number of Older Siblings …56 Series Complete (4:3:1:FS:3:1:FS) by TennCare Enrollment …57 Series Complete (4:3:1:FS:3:1:FS) by WIC Enrollment …57
4: Regional One Page Summaries …58 Memphis- Shelby County …59 West Tennessee Region …60 Jackson-Madison County …61 South Central Region …62 Mid-Cumberland Region …63 Nashville-Davidson County …64 Upper Cumberland Region …65 Southeast Region …66 Chattanooga- Hamilton County …67 East Tennessee Region …68 Knoxville-Knox County …69 Northeast Region …70 Sullivan County …71
5: Map of Regional and Metropolitan Health Departments in Tennessee …72

IMMUNIZATION STATUS SURVEY – 2020
6
Executive Summary
The annual Immunization Status Survey of 24-month Old Children (Immunization Status Survey) in Tennessee is conducted by the Tennessee Department of Health’s (TDH) Vaccine-Preventable Diseases and Immunization Program (VPDIP) to track progress toward achieving the national Healthy People objectives for immunization coverage with routinely recommended early childhood vaccines. This survey is composed of random, statistically-valid samples drawn from birth certificates of infants born in each of the 13 health department regions. The children sampled for the survey were born during the first quarter of 2018 and celebrated their second birthdays between January 1 and March 31, 2020. The results of the survey are aggregated to give statewide statistics on immunization coverage rates in Tennessee and track the progress toward achieving at least 90% on-time immunization with each routinely-recommended vaccine for before age two years. Historically, Tennessee’s vaccination rates have remained relatively high, but have not achieved the Healthy People objectives. In addition to the Healthy People 2020 (HP2020) and Healthy People 2030 (HP2030) objectives, the 2020 Immunization Status Survey is also measured against the Survey’s 3-year average. In 2020, Tennessee met five out of the 12 HP2020 objectives and two out of the three HP2030 objectives. When observing the 3-year average, Tennessee met only two out of the 12 HP2020 objectives and none of the HP2030 objectives. Tennessee ranks in the bottom 20% of states for the completion of seven vaccine series and ranks in the bottom 40% of states for the remaining five antigens.1 In addition to analysis of individual vaccine series completion rates, this report analyzes the racial disparity of vaccination rates among 24-month old children, which is historically lower for black children compared to white children. The survey also analyzes seasonal flu immunization rates, which are significantly lower than the HP2020 objective. Vaccine exemption trends were also analyzed and have shown improvement in 2020 despite historically high rates. The COVID-19 pandemic has had a considerable negative impact upon the vaccination rate of children in Tennessee. To better understand the impact of the pandemic upon childhood immunization rates, TDH analyzed monthly 2019 and 2020 childhood vaccination rates of children aged zero to two years utilizing the Tennessee Immunization Information System (TennIIS). As shown in the figure below, TennIIS indicates a 2 to 26% decline in early-childhood immunizations during the COVID-19 pandemic. This decline was most notable in March and April 2020, when medical offices were closed, parents were fearful, and local health departments were struggling to test, notify and contact trace those who were infected or exposed to the SARS-CoV-2 virus. While immunization rates later in 2020 largely returned to 2019 levels, catch-up vaccinations have not occurred, leaving thousands of Tennessee’s children vulnerable to vaccine-preventable diseases. It will be an immense undertaking to identify and immunize children who have fallen behind on routine immunizations, but these efforts must begin immediately in order to mitigate the vaccine-preventable disease outbreaks the nation and state may experience while working to protect these children.
Total Number of Childhood Vaccine Doses Administered to 0-2 Year Olds in 2019 compared to 2020, by Month, as Reported in TennIIS

IMMUNIZATION STATUS SURVEY – 2020
7
Healthy People Comparison The Healthy People initiative is designed to guide national health promotion and disease prevention efforts to improve the health of the nation. Released by the HHS every decade since 1980, Healthy People identifies science-based objectives with targets to monitor progress and motivate and focus action. In 2010, Healthy People 2020 (HP2020) objectives, including 12 immunization-related objectives, were developed and implemented across the nation with the expectation that the objectives would be achieved by 2020. In 2020, new HP2030 objectives, including three immunization-related objectives, were developed and implemented to be achieved by 2030. In 2020, Tennessee met two of the three HP2030 objectives: one dose MMR by age two years (target of 90.8%) and children with no doses of recommended vaccines by age two years (target of <1.3%). Although HP2030 reduced the number of objectives from 12 to two and adjusted the age of evaluation from 19-35 months to 24 months, the VPDIP will continue to evaluate all childhood immunizations. It is important to note that the data analyzed in this report were retrieved from the first quarter of the 2020 calendar year (January, February, and March). While cases of COVID-19 were known internationally and in the United States, the first case of COVID-19 in Tennessee was not identified until March 4, 2020. Childhood immunizations in Tennessee have drastically decreased since the start of the COVID-19 pandemic, leaving tens of thousands of Tennessee children susceptible to vaccine-preventable infectious diseases. The following table summarizes Tennessee’s 2019 and 2020 Immunization Status Survey results alongside national HP2020 objectives and HP2030 objectives: Results of Immunization Status Survey Compared to Healthy People 2020 and 2030 Objectives
Antigen TN 2019 (24 months)
TN 2020 (24 months) Q1/Pre-COVID
HP2020 Objective
(19-35 months)
HP2030 Objective
(24 months) Diphtheria, Tetanus, Pertussis
(DTaP) 80.1% 80.9% 90% 90%
Poliomyelitis (Polio) 91.0% 92.5% 90% N/A Measles, Mumps, Rubella (MMR) 88.3% 91.2% 90% 90.8%
Hepatitis B (HBV) 91.4% 93.0% 90% N/A Hepatitis B, birth dose 81.4% 80.4% 85% N/A
Haemophilus influenzae, type B (HIB)
84.8% 86.1% 90% N/A
Varicella (VAR) 87.3% 90.6% 90% N/A Pneumococcus (PCV) 91.9% 94.1% 90% N/A
Full Series 76.6% 78.2% 80% N/A Hepatitis A (HAV)* *87.7% *90.4% N/A N/A
Rotavirus (RTV) 77.3% 76.7% 80% N/A Influenza (Flu) 47.7% 51.3% 70% N/A
Indicates value is above HP objective. *Hepatitis A is excluded from HP2020 objective comparisons as Tennessee measures receipt of one dose, while the HP2020 objective goal references two doses.

IMMUNIZATION STATUS SURVEY – 2020
8
Comparison to Tennessee 3-Year Average Traditionally, the National Immunization Survey-Child (NIS-Child), an annual survey conducted by the CDC to assess ACIP-recommended vaccination coverage of children 19-35 months, is used as a comparison measure for the Immunization Status Survey, which assesses coverage of the same ACIP vaccinations at 24 months of age. However, the results of the 2020 NIS-Child survey have not been published at the time of this report. Instead, Tennessee’s 3-year average was calculated to provide a comparison measure for the 2020 survey as a replacement for the annual NIS-Child survey. The decision to use a 3-year average of Immunization Status Survey results was based on recent methodology changes which have impacted vaccination rates. Its inclusion in this analysis provides a context for Tennessee’s recent vaccination trends. HP2020 objectives and a 3-year average of the Tennessee Immunization Status Survey calculated from 2017-2019 survey results are below along with Tennessee’s six year 4:3:1:FS:3:1:FS immunization rate trend. According to the 3-year average, Tennessee children met two of the HP2020 objectives; IPV (polio vaccine), with a coverage rate at 92.1% and HBV (hepatitis B virus vaccine), with a coverage rate at 92.6%. In 2020 alone, children met five of the HP2020 objectives: Polio (92.5%), MMR (91.2%), HBV (93.0%), VAR (90.6%), and PCV (94.1%). The 2020 Survey results exceeded the three-year average for all but three vaccines: DTaP, birth dose hepatitis B vaccine, and rotavirus vaccine. According to the 2019 NIS-Child survey, Tennessee ranks in the bottom 20% of states for vaccine series completion of DTaP, HBV, birth dose HBV, HIB, PCV, MMR, and the 4:3:1:FS:3:1:4 series. Tennessee ranks in the bottom 40% of states for the remaining antigens: HAV, Flu, VAR, Polio, and RTV.1
Results of 2020 Immunization Status Survey Compared to Healthy People 2020 and 2030 Objectives and Immunization Status Survey 3-Year Average
Antigen
HP2020/2030
objective TN 3-Year Average
Immunization Status Survey
(2020) Q1/Pre-COVID
Diphtheria, Tetanus, Pertussis (DTaP)
90/90% 81.1% 80.9%
Poliomyelitis (Polio) 90% 92.1% 92.5% Measles, Mumps, Rubella (MMR) 90/90.8% 89.6% 91.2% Hepatitis B (HBV) 90% 92.6% 93.0% Hepatitis B, birth dose 85% 83.2% 80.4% Haemophilus influenzae, type B (HIB) 90% 81.1% 86.1% Varicella (VAR) 90% 89.4% 90.6% Pneumococcus (PCV) 90% 89.0% 94.1% Full Series 80% 74.0% 78.2% Hepatitis A (HAV)* N/A *89.5% *90.4%
Rotavirus (RTV) 80% 77.4% 76.7% Influenza (Flu) 70% 45.9% 51.3%
Blue text indicates HP2030 objectives Indicates value is above HP objective. *Hepatitis A is excluded from HP2020 objective comparisons as Tennessee measures receipt of one dose, while the HP2020 objective goal references two doses.

IMMUNIZATION STATUS SURVEY – 2020
9
4:3:1:FS:3:1:FS Immunization Rate Trends, Tennessee, 2015-2020
Racial Disparity Black children were less likely to be fully immunized for all twelve of the recommended CDC vaccinations and statistically significantly less likely to receive DTaP, HIB, 4:3:1:FS:3:1:FS, Flu, Hepatitis A, and RTV compared to their white peers. In 2020, 32.3% of black children received at least two doses of influenza vaccine compared to 54.4% of white children. Completion of the full childhood series (4:3:1:FS:3:1:FS) has been consistently lower for black children than white children, a difference that was statistically significant in 2020. The series completion rates among blacks and whites were 66.1% and 80.5%, respectively. Influenza Vaccination Children six months through eight years of age must receive two doses of the influenza vaccine in their first season for the series to be considered “complete”; thus, they should have received three doses prior to their second birthday. While influenza rates among children had declined in 2019, two dose coverage increased from 47.4% to 51.3% in 2020 and three dose coverage increased from 27.0% to 31.3%. Trends in Vaccination Refusals Over the past five years, the percentage of children included in the survey whose parents refused some or all immunizations has ranged from 3.3% to 4.2%. This 2020 survey marks the first time in five years where vaccine refusals have fallen below 3%, with 2.7% (40/1494) of parents refusing some or all immunizations. The percentage of children who did not receive one or more vaccinations due to medical reasons has remained low (<0.5%), while religious and philosophical refusals have continued to fluctuate. In 2020, 1.2% (n=18) of refusals were religious refusals and 1.3% (n=19) were philosophical refusals. Discussion

IMMUNIZATION STATUS SURVEY – 2020
10
Tennessee currently meets HP2030 targets for two of the three measures in 24-month old children but continues to rank among the bottom 20% of states for completion of six of the 12 vaccines assessed, as well as the 4:3:1:FS:3:1:FS series. While overall vaccination rates among children in Tennessee have remained relatively high, the COVID-19 pandemic has had a considerable negative impact upon the vaccination rate of children across the United States. Tennessee has seen a dramatic decrease in immunization rates in 24-month old children in 2020 in comparison to 2019, with decreases as low as 26% in some months. The results from this report do not represent the impact that the COVID-19 pandemic has had on Tennessee immunization rates. Given the vaccination rates in 2020 and the ongoing COVID-19 pandemic, it is anticipated that results of the 2021 Immunization Status Survey will reflect poor immunization coverage rates due to the substantial decline in vaccinations in young children over the past year. Every effort should be made to provide vaccinations to children who have fallen behind with routine childhood vaccinations as quickly as possible if Tennessee is to avoid new outbreaks of highly infectious, yet vaccine-preventable, diseases. Providers are encouraged to recall patients who have missed vaccinations and provide vaccinations at every opportunity, regardless of the reason for an office visit. Although Tennessee saw a significant decrease in vaccine refusals in 2020, it is important to continue efforts around immunization education, addressing vaccine hesitancy, and countering vaccine misinformation. Parents who refuse immunizations not only place their children and families at risk but place all Tennesseans at greater risk for significant morbidity and mortality from vaccine-preventable diseases.
Definitions of Abbreviations in Charts

IMMUNIZATION STATUS SURVEY – 2020
11
1. Vaccines
a. DTaP: diphtheria, tetanus, acellular pertussis vaccine
b. IPV: inactivated polio vaccine
c. HAV: hepatitis A vaccine
d. HBV: hepatitis B vaccine
e. HIB: Haemophilus influenzae, type B vaccine
f. MMR: measles, mumps, rubella vaccine
g. VAR: varicella (chickenpox) vaccine
h. PCV: pneumococcal conjugate vaccine
i. FLU: seasonal influenza vaccine
j. RTV: rotavirus vaccine
2. Public Health Regions
a. Rural, multi-county regions
i. WTR: West Tennessee Region
ii. SCR: South Central Region
iii. MCR: Mid-Cumberland Region
iv. UCR: Upper Cumberland Region
v. SER: Southeast Region
vi. ETR: East Tennessee Region
vii. NER: Northeast Region
b. Metropolitan, single county regions
i. MSR: Memphis-Shelby County Region
ii. JMR: Jackson-Madison County Region
iii. NDR: Nashville-Davidson County Region
iv. CHR: Chattanooga-Hamilton County Region
v. KKR: Knoxville-Knox County Region
vi. SUL: Sullivan County Region
Introduction

IMMUNIZATION STATUS SURVEY – 2020
12
An annual Immunization Status Survey of 24-month Old Children in Tennessee is conducted by the Tennessee Department of Health’s (TDH) Vaccine-Preventable Diseases and Immunization Program (VPDIP) to track progress toward achieving at least 90% on-time immunization with each routinely-recommended vaccine for before age two years. The survey is composed of random, statistically-valid samples drawn from birth certificates of infants born in each of the 13 health department regions, which are aggregated to give statewide statistics on immunization coverage rates in Tennessee. Safety and Efficacy of Immunizations The United States has the safest and most effective vaccine supply in its history. Prior to licensure, rigorous clinical trials are carried out by the vaccine manufacturers and reviewed by the Food and Drug Administration (FDA). Vaccines are recommended only when proven to be safe, effective, and beneficial. After licensure, vaccines continue to be monitored for rare adverse reactions. The majority of vaccinated children never experience an adverse reaction to a vaccine. The most frequently reported adverse reactions are minor and include soreness at injection site, a rash, or a mild fever that subsides within a one to two days.3 Vaccines help the body build immunity against disease. Because of the success of vaccines, many diseases that were historically commonplace, such as smallpox, rubella, and measles, have become rare or have been eliminated from the United States. By vaccinating a child, benefits also extend to others. Individuals who cannot develop immunity from vaccines, have medical conditions that do not allow them to be vaccinated, and babies who are too young to be vaccinated rely on the immunity of those around them to protect them from serious infectious diseases.4 Value of Immunizations Timely routine vaccination of children protects community health, prevents outbreaks, and saves money, and lives. The federal Vaccines for Children (VFC) Program, implemented in 1994, assures affordable access to all routine vaccines for children who are without private insurance coverage. In Tennessee, over 600 providers across the state are administering VFC vaccines and there is at least one VFC provider in each of Tennessee’s 95 counties. The CDC has reported that the routine vaccines already given to U.S. children born between 1994 and 2013 will prevent an average of 4.1 illnesses per child, prevent the hospitalization of one in four and prevent the premature death of nearly one in 100 of these children over their lifetimes.5 The CDC calculates that vaccination of each U.S. birth cohort according to the current immunization schedule yields a net savings of nearly $14 billion in direct medical costs and $69 billion in total costs to society.6 With roughly two percent of the U.S. population living in Tennessee, this suggests Tennessee has benefitted from the prevention of approximately 480,000 cases of disease in the past decade, with annual savings of $280 million in direct medical costs and $1.38 billion in total costs to society. In Tennessee specifically, unvaccinated and under-vaccinated children have comprised substantial proportions of cases of vaccine-preventable diseases such as measles, mumps, and pertussis (whooping cough), and the majority of children who die each year from seasonal influenza are unvaccinated.7,8 These diseases not only place Tennesseans at risk for significant morbidity and mortality, but also create significant fiscal burden upon the State. A 2016 outbreak of seven cases of measles in west Tennessee, for example, resulted in an estimated cost of more than $4 million. Even small outbreaks place tremendous strain upon our public health system and its resources and divert attention from other critical public health initiatives. Vaccines Assessed

IMMUNIZATION STATUS SURVEY – 2020
13
This survey assesses vaccine completion according to the Advisory Committee on Immunization Practices’ (ACIP) recommendations for protection against ten serious illnesses before the age of 24 months: diphtheria, tetanus, pertussis (combined as DTaP), poliomyelitis (IPV), measles, mumps, rubella (combined as MMR), Haemophilus influenza type B (HIB), hepatitis B (HBV), varicella (VAR), and pneumococcus (PCV). Combined, these are known as the 4:3:1:FS:3:1:FS series9. Additionally, this survey analyzes completion of hepatitis A (HAV), rotavirus (RTV), and seasonal influenza (Flu) vaccines. Table 1. ACIP List of Diseases to Prevent through Vaccination of Children < 24 Months of Age
Disease(s) Possible Complications of Disease
Diphtheria, Tetanus, Pertussis
Diphtheria: upper airway obstruction, pneumonia, respiratory failure, death
Tetanus: spasms of respiratory and skeletal muscles, death
Pertussis: outbreaks; severe, long-term cough, vomiting, breathlessness, death in infants
Poliomyelitis Paralysis, death
Measles, Mumps, Rubella
Measles: outbreaks; ear infections, pneumonia, cardiac and neurologic problems, encephalitis, death
Mumps: outbreaks; decreased fertility, meningitis, arthritis, hearing impairment
Rubella: arthritis, encephalitis, birth defects
Haemophilus influenzae type B Pneumonia, meningitis, neurologic problems, death
Hepatitis B Fulminant hepatitis, jaundice, liver cancer, cirrhosis, premature death
Varicella (chickenpox) Rash illness, severe disease in immunocompromised, birth
defects, encephalitis, death
Pneumococcus (certain strains) Ear infections, pneumonia, meningitis, blood stream infections,
death
Hepatitis A Outbreaks: fever, nausea, jaundice, death
Influenza Outbreaks: secondary pneumonia, exacerbation of chronic
diseases, hospitalizations, death
Rotavirus Outbreaks in daycare settings, dehydration, hospitalization, death
Special Vaccine Considerations Hepatitis A vaccine (HAV) HAV is a two-dose series, starting on or after the first birthday. As the recommended dose spacing is six months, children who have only one dose by the second birthday are still on schedule. For this reason, this survey reports 24-month old children as up-to-date with one dose of HAV. HAV will not be compared to HP2020 objectives in this report, as the HP2020 objective reflects completion of the 2-dose series. Tennessee was one state impacted by a multi-state epidemic of acute hepatitis A that began in 2017 and spanned more than two and a half years. Over the course of that outbreak, 3,036 Tennesseans were infected, 1,839 were hospitalized, and 28 died as a result of their illness. Hepatitis B vaccine (HBV) birth dose

IMMUNIZATION STATUS SURVEY – 2020
14
In 2016, the CDC revised its guidance to recommend routine administration of a hepatitis B birth dose within 24 hours of life (rather than prior to hospital discharge). A birth dose of hepatitis B vaccine is defined in the Status Survey as a dose given within the first three days of life. Birth dose hepatitis B is a key strategy to eliminate transmission of the hepatitis B virus from an infected mother to her infant. The VPDIP manages the cases of more than one hundred infants who are exposed to the hepatitis B virus through their infected mothers each year. These infants are at high risk of chronic liver disease and early death, which can be avoided with appropriate vaccination. Influenza vaccine (FLU) Influenza vaccine (FLU) is given annually to children aged six months and older; two doses should be given during a child’s first influenza season. Because protection is conferred only after two doses, this survey measures the proportion of children who have received two or more doses by their second birthday. The vast majority of children who die each year from influenza failed to receive an annual influenza vaccination.
Haemophilus influenzae type B vaccine (HIB) Two HIB schedules exist, depending upon the vaccine used. The full series (FS) of the Merck product requires three doses; the FS of the Sanofi Pasteur product requires four doses. Any mixed-brand schedule requires four doses. Any child receiving one or more doses of the 4-dose HIB product must have received four doses before the 25th month of life in order to be considered complete and on-time. This classification by HIB products administered reduces the degree of overestimation of on-time completion demonstrated by past reports.
Rotavirus vaccine (RTV) As with HIB vaccine, two rotavirus vaccine products are available with different dosing schedules. Rotateq© (Merck), requires three doses; Rotarix© (GSK) requires two doses. Mixed brand schedules require three doses. RTV is unique among vaccines as the series must be initiated no later than 15 weeks of age and no doses should be given after eight months of age. Healthy People 2020 objectives Healthy People 2020 (HP2020) objectives were established by the federal Department of Health and Human Services (HHS) to provide national targets for population health that were to be achieved prior to January 1, 2020. These objectives included vaccine coverage rates among children 19-35 months of age and were tracked nationally through the National Immunization Survey (NIS). Although HP2020 objectives ended December 31st , 2019, TDH continues to strive to reach or exceed each of these targets as quickly as possible and maintain those high rates of immunization coverage among children. The following objectives for the percentage of children immunized between 19-35 months of age were established by HP2020 and are relevant comparisons to the results of this survey:
• 80% complete the 4:3:1:FS:3:1:FS series • 90% complete each individual vaccine included in the 4:3:1:FS:3:1:FS series • 80% complete rotavirus vaccination with two or more doses • 70% complete influenza vaccination with two or more doses • 85% of all children receive their first dose of hepatitis B vaccine within three days of life
Healthy People 2030 objectives Healthy People 2030 (HP2030) objectives are established by the federal Department of Health and Human Services (HHS) to provide national targets for population health to be achieved prior to January 1, 2030. These objectives include vaccine coverage rates among children 2 years of age and are tracked nationally through the
IMMUNIZATION STATUS SURVEY – 2020
15
National Immunization Survey (NIS). TDH aims to reach or exceed each of these targets as quickly as possible and maintain those high rates of immunization coverage among children. The following objectives for the percentage of children immunized by 2 years of age have been established by HP2030 and are relevant comparisons to the results of this survey:
• 90% complete DTaP vaccination with four or more doses • 90.8% complete MMR vaccination with one or more doses • ≤1.3% of children receive 0 doses of recommended vaccinations
Although HP2030 has established new objectives, Tennessee did not meet all objectives of HP2020 and will continue to use relevant HP2020 objectives as comparison measures in this report.
Methods
The survey is composed of random, statistically-valid samples drawn from birth certificates of 121 infants born during the first quarter of 2018 in each of Tennessee’s 13 public health jurisdictions. These children celebrated their second birthdays between January 1 and March 31, 2020. Oversampling for black children was done in each region where the random sample contained fewer black children than the actual proportion of black children born in the first quarter of 2018 in that region. Vaccine information made available through the Tennessee Immunization Information System (TennIIS) for all sampled children is provided to local or state public health staff. The staff attempted to locate each child and confirm immunization histories with parents or guardians and healthcare providers. All information is tracked in a secure, online database system, REDCap. Statewide immunization rates are calculated, as well as rates for the six major metropolitan counties and seven rural regions. County rates within the rural regions are not calculated due to the small number of children sampled in each county. Complete on-time immunization in the 2020 survey of Tennessee 24-month old children is defined as receipt of four doses of diphtheria, tetanus, and acellular pertussis (DTaP) vaccine, three doses of inactivated polio virus vaccine (IPV) vaccine, one dose of measles, mumps, and rubella (MMR) vaccine, three or four doses of Haemophilus influenza type b (HIB) vaccine (depending on brand received) or any child clinically considered complete for HIB based on the CDC’s “catch-up” schedule, three doses of hepatitis B vaccine (HBV) vaccine, one dose of varicella (VAR) vaccine and four doses of pneumococcal conjugate vaccine (PCV) vaccine or any child considered complete for PCV based on the CDC’s “catch-up” schedule. Combined, these are known as the 4:3:1:FS:3:1:FS series. Additionally, this survey analyzes hepatitis A vaccine (HAV), rotavirus vaccine (RTV), and seasonal influenza (Flu) vaccines. Vaccine Completion Logic Complete on-time immunization in this survey is defined as having received four doses of DTaP vaccine, three doses of IPV vaccine, one dose of MMR vaccine, three or four doses of HIB vaccine (depending on brand received or any child clinically considered complete on a “catch-up” schedule), three doses of HBV vaccine, one dose of VAR vaccine and four doses of PCV vaccine (or any child considered complete for PCV based on the CDC’s “catch-up” schedule). This survey accounts for the vaccine brand, if known, and classifies a child as complete only if the appropriate number of doses have been administered. If any documented HIB dose was given as the four-dose product, then only receipt of four doses was considered as a complete series. In the absence of documentation of vaccination brand, receipt of four doses of HIB is classified as series completion. Likewise, if any documented RTV dose was given as the three-dose product, then only receipt of three doses was considered as a complete series. In the absence of documentation of vaccination brand, three doses of RTV is classified as series completion. As a result,

IMMUNIZATION STATUS SURVEY – 2020
16
point estimates for HIB and RTV coverage rates are lower than previous estimates, but also more accurate and more consistent with methods used by the CDC. In 2019, additional analysis was included to account for the HIB and PCV catch-up schedules. Prior to 2019, counts of vaccinations were used to calculate series completion for both HIB and PCV; however, this inaccurately captured completion for these vaccines due to the unique vaccination schedules that exist when a child receives their first dose after the recommended age, but prior to 24 months. By assessing completion based upon requirements for the age of first vaccination, HIB and PCV completeness more accurately mirrors ACIP forecasting and clinical decision-making. Table 2. Catch-Up Guidance for PCV and HIB, Centers for Disease Control and Prevention10 Age at Dose 1 Age at Dose 2 Age at Dose 3 Recommendation PCV
< 12 months old < 12 months old < 12 months old Needs 4th dose 8 weeks later
< 12 months old Between 7-11 months old Needs 3rd dose 8 weeks later
> 12 months old Needs 2nd dose 8 weeks later
24-25 months No additional dose needed
HIB < 12 months old < 12 months old < 12 months old Needs 4th dose 8 weeks later
< 12 months old Between 12-14 months old Needs 3rd dose 8 weeks later
< 12 months old > 15 months old No additional dose needed
Between 12-14 months Needs 2nd dose 8 weeks later
> 15 months old No additional dose needed
Program Enrollment The survey captures the immunizing provider type (public, private or both), TennCare (Medicaid) participation, and enrollment in the Women, Infants and Children (WIC) nutrition program for each child. Children are counted under TennCare or WIC if they were ever enrolled in these programs. Infants covered under the WIC program have immunization records reviewed at WIC visits. Targeted education and telephone follow-up are the primary tools used to encourage catch-up immunization of WIC infants. Statistical Notes The survey is designed to allow valid statistical comparisons of the populations in each of the 13 health department regions; however, the sample size within multi-county regions is too small for meaningful results at the county level or useful comparisons among subpopulations within a region. Ninety-five percent confidence intervals (CI) were calculated and are displayed as grey bands on the graphs in this report to permit readers to visualize the statistical significance (or absence of significance) of differences in point estimates. Confidence intervals that do not overlap indicate that the point-estimates being compared have at least a 95% chance of representing true differences in the populations being compared (statistically significantly different). When CIs overlap, differences are not considered to be statistically significant.

IMMUNIZATION STATUS SURVEY – 2020
17
Sampling Comparison Limitation In the cases of the seven multi-county TDH regions (Northeast [NER], East Tennessee [ETR], Southeast [SER], Upper Cumberland [UCR], South Central [SCR], Mid-Cumberland [MCR], West Tennessee [WTR]) in this survey, children were chosen in different proportions from the counties that make up each region. There is no consistent pattern for choosing these participants from year to year. Results are presented as the summation of all counties in that region; therefore, use of the results of this survey for county-level estimates is not appropriate.
Results
The 2020 Sample Population The statewide sample consisted of 1,592 children and an additional 19 oversampled black children for inclusion in the racial disparity analysis. Children who moved out of the state, for whom the birth record was sealed (e.g. through adoption or placement in foster care), for whom the parents or guardians refused to participate in the survey, and children who had died were excluded from the survey. Of the 1,592 sampled births, 98 records were excluded from the final analysis: parents of 16 refused to participate; 78 had moved out of state; and four had been adopted, placed in foster care or were in state custody. None of the 19 oversampled children were excluded from the racial disparity analysis. The point estimates reported in this survey were based upon the 1,494 analyzed sample population: the 1,592 sampled births minus the 98 excluded records. When reporting on racial analysis, the oversampled population is included in the denominator. Due to small sample size, children of other races (n=45 or 3.0% of children sampled) were not included in analysis. The final number of children included in the racial analysis sample was 1,468 (1,494 + 19 oversampled records – 45 other races = 1,468 total records). The children sampled were 79.8% white, 17.2% black, and 3.0% other races. Of these, 8.6% (n=129) identified as Hispanic/Latino. This survey does not differentiate between Hispanic whites and non-Hispanic whites; for that reason, racial disparity based upon Hispanic ethnicity was not analyzed. The majority (78.7%) of children received all their vaccinations from a private medical provider, while 12.8% received vaccinations from both a health department and a private medical provider, and 3.6% of children received vaccinations at a health department alone. Of the children sampled, 65.5% had been enrolled in TennCare, 55.0% had been enrolled in WIC, and 50.9% had been enrolled in both TennCare and WIC.
Table 3a. Demographics of 2020 sample population, including oversampled black children (n=1494) Race Vaccination Source N % N % Black 257 17.2 Private Medical Provider 1175 78.7 White 1192 79.8 Health Department 56 3.8 Other 45 3.0 Both 191 12.8 Hispanic* 129 8.6 Siblings Program Enrollment 0 579 38.8 WIC 822 52.0 1 464 31.0 TennCare 978 65.5 2+ 451 30.2 Both 761 50.9
Nearly one-third (29.5%) of all mothers of sampled children had a high-school diploma, 0.3% had an unknown education level, 14.1% had less than a high-school diploma, and 56.4% had more than a high-school diploma. The father’s education level was unknown for 15.1%, 11.5% had less than a high-school diploma, 31.0% had a high-school diploma, and 42.4% had more than a high-school diploma. Of the 1,494 children, 579 (38.8%) had no

IMMUNIZATION STATUS SURVEY – 2020
18
siblings, 464 (31.1%) had one sibling, and 451 (30.2%) had two or more siblings. The number of siblings is known to negatively impact completion of vaccinations. Table 3b. Demographics of 2020 sample population, including oversampled black children (n=1494) Maternal Education Paternal Education N % N % Unknown 5 0.3 Unknown 226 15.1 < High School Diploma/ GED 206 13.8 < High School Diploma/ GED 172 11.5 High School Diploma/ GED 440 29.5 High School Diploma/ GED 463 31.0 > High School Diploma/ GED 843 56.4 > High School Diploma/ GED 633 42.4
*This survey does not distinguish between Hispanic whites and non-Hispanic whites.
Vaccine Refusals In 2020, there were 40 (2.7%) documented vaccine refusals reported among the analyzed records. Over the past five years, this percentage has fluctuated in Tennessee, but there has been an annual incremental increase in the overall rate of refusals. The 2020 analysis marks the lowest number of vaccine refusals reported since 2017, with 4.2% in 2019, 3.2% in 2018, and 3.5% in 2017. Eighteen parents claimed religious exemption, 19 claimed philosophical objection, and 3 claimed medical exemptions. Regionally, vaccine-refusals ranged from 1.7% to 8.5% of the sampled populations. Seven of the 40 children whose parents refused vaccines were partially immunized (ranging from 1-10 total doses). Parents of one of the seven partially immunized children cited religious reasons, five cited philosophical reasons, and one cited a medical reason for refusal of vaccines. Although the decline in refusals in 2020 signals improving immunization acceptance it is contrary to the steady rise in the rate of vaccine refusals historically observed at the state and national level. Public education and opposition to vaccine misinformation is critical to achieving a sustained decline in vaccine refusal rates.
Figure 1. Six-Year Trend of Refusals by Reason, Tennessee, 2020.

IMMUNIZATION STATUS SURVEY – 2020
19
The Tennessee Department of Health has immunization requirements for those who attend childcare, pre-school, and public school. The state’s immunization requirements follow the current schedule published by the Centers for Disease Control and Prevention (CDC) and endorsed by the American Academy of Pediatrics (AAP) and American Academy of Family Physicians (AAFP). All 50 states have legislation requiring specified vaccines for students, including for attendance at childcare centers. Tennessee is one of 35 states that does not allow philosophical objection or “personal belief exemption” as a reason for a child entering childcare or public school to be un- or under-vaccinated; therefore, parents of children surveyed who claimed philosophical objection to vaccines either choose to declare a religious exemption or provide their children with the required vaccinations prior to school entry. There are no major religions, apart from those that use prayer in lieu of medicine, that have tenets that object to vaccinations. Table 4. Vaccine Refusal Reasons by Region, Tennessee, 2020 (n=1494)
Region N Religious % Philosophical % Medical % Total % MSR 117 - - 2 1.7 - - 2 1.7 WTR 114 1 0.9 2 1.8 - - 3 2.7 JMR 119 - - 4 3.4 - - 4 3.4 SCR 118 10 8.5 - - - - 10 8.5 MCR 109 - - - - - - - - NDR 115 - - - - 2 1.7 2 1.7 UCR 116 1 0.9 1 0.9 - - 2 1.8 SER 115 1 0.9 2 1.7 - - 3 2.6 CHR 115 3 2.6 2 1.7 - - 5 4.3 ETR 117 - - 3 2.6 1 0.9 4 3.5 KKR 110 2 1.8 - - - - 2 1.8 NER 118 - - 3 2.5 - - 3 2.5 SUL 111 - - - - - - - -
STATE 1494 18 1.2
19 1.3
3 0.2
40 2.7

IMMUNIZATION STATUS SURVEY – 2020
20
Unable to Locate Of the 1,494 children included in the survey, 43 had incomplete information in the Tennessee Immunization Information System (TennIIS) and could neither be located nor confirmed as having moved out of state. Overall, 2.9% (7/240) of black children and 0.0% (0/45) of other races were unable to be located, compared to 3.4% (36/1056) of white children. (See Table 5 for the breakdown of those unable to be located by region.) TDH uses Accurint, a subscription-based database compiling publicly available address information, to generate contact details for parents of each child. This contact information was provided to local and regional health department staff at the beginning of the survey period. Table 5. Unable to Locate (UTL) by Region, Tennessee, 2020
Region NER ETR SER UCR MCR SCR WTR MSR NDR KKR CHR JMR SUL STATE
Number sampled
118 117 115 116 109 118 114 117 115 110 115 119 111 1494
UTL 2 1 - 2 10 10 - 2 10 2 - 4 - 43 % 1.7 0.9 - 1.7 9.2 8.5 - 1.7 8.7 1.8 - 3.4 - 3.2
Statewide Results Complete 4:3:1:FS:3:1:FS series rates from 2015-2020 are shown in Figure 2. Complete 4:3:1:FS:3:1:FS series rates have fluctuated over the past decade and the change from 2018 to 2020 is statistically significant. This increase is likely due to the change in methodology of the 4:3:1:FS:3:1:FS series that occurred in 2019 when series completion began to include catch-up HIB and PCV completion for those who received first dose after the ACIP recommended age but before 24 months. The 2020 rates are the highest 4:3:1:FS:3:1:FS series completion rates observed over the past decade. While encouraging, it is anticipated that this improvement will be short-lived given the COVID-19 pandemic’s impact upon 2020-2021 immunization rates.
Figure 2. 4:3:1:FS:3:1:FS Immunization Rate Trends, Tennessee, 2015-2020

IMMUNIZATION STATUS SURVEY – 2020
21
Full Series The overall statewide coverage estimate for the full, recommended 4:3:1:FS:3:1:FS series was 78.2% (95% CI, 76.1-80.3) and is shown in Figure 3. The light blue bars represent the individual antigens that make up the 4:3:1:FS:3:1:FS series, the navy bar is the 4:3:1:FS:3:1:FS, and the dark grey bars represent the additional antigens assessed in the survey. The red lines represent HP2020 objectives for each antigen assessed, the dotted black line represents the 3-year average of the Immunization Status Survey, and the lighter grey bands represent the 95% Confidence Intervals (CI). As shown in Figure 5, Knox County region was statistically significantly different from the statewide completion rate at 87.3% (95%CI, 80.9-93.6). East region, Knox County region, Northeast region, Southeast region, and Sullivan County region had point-estimates meeting the HP2020 objective of 80%. Appendix 2 contains region-specific charts of coverage rates for each vaccine and the 4:3:1:FS:3:1:FS series.
Figure 3. Percent of 24-month Old Children with On-Time 4:3:1:FS:3:1:FS (point estimate and 95% confidence intervals, n=1494)

IMMUNIZATION STATUS SURVEY – 2020
22
Figure 4. Statewide Trend of Complete 4:3:1:FS:3:1:FS Series, Tennessee, 2010-2020
Figure 5. Percent of 24-month Old Children with On-Time 4:3:1:FS:3:1:FS Series, by Health Department Region (point estimate and 95% confidence intervals, n=1494)
IMMUNIZATION STATUS SURVEY – 2020
23
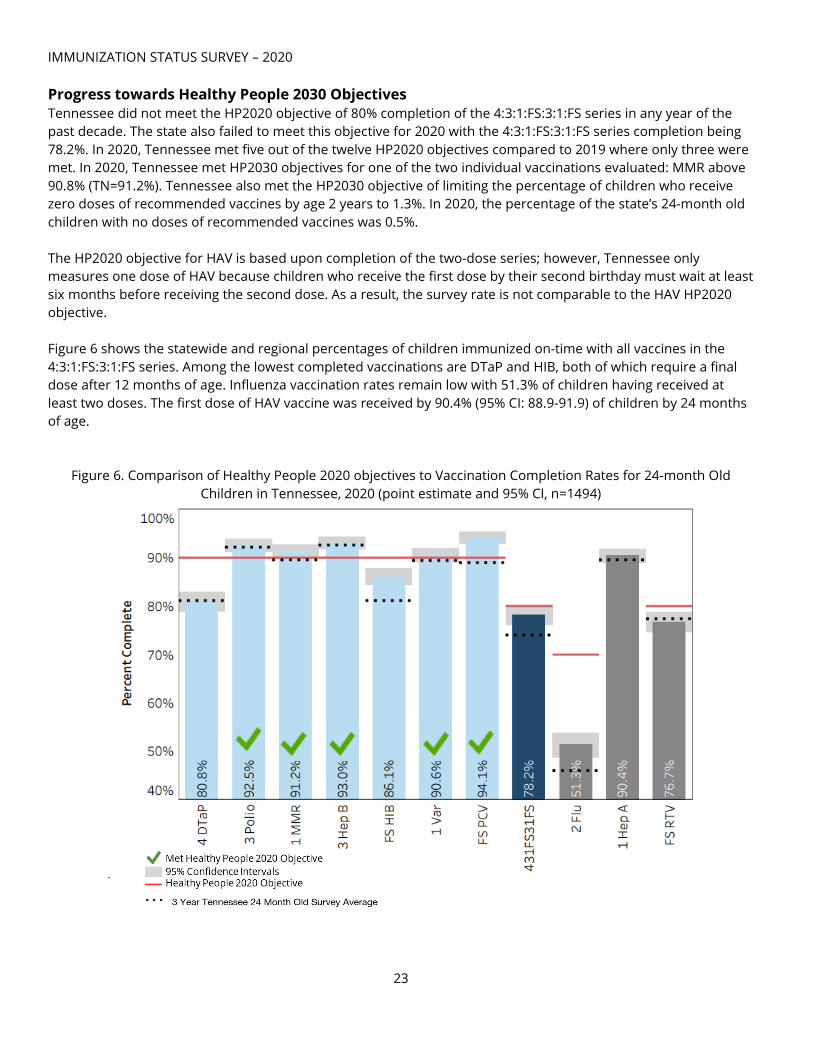
Progress towards Healthy People 2030 Objectives Tennessee did not meet the HP2020 objective of 80% completion of the 4:3:1:FS:3:1:FS series in any year of the past decade. The state also failed to meet this objective for 2020 with the 4:3:1:FS:3:1:FS series completion being 78.2%. In 2020, Tennessee met five out of the twelve HP2020 objectives compared to 2019 where only three were met. In 2020, Tennessee met HP2030 objectives for one of the two individual vaccinations evaluated: MMR above 90.8% (TN=91.2%). Tennessee also met the HP2030 objective of limiting the percentage of children who receive zero doses of recommended vaccines by age 2 years to 1.3%. In 2020, the percentage of the state’s 24-month old children with no doses of recommended vaccines was 0.5%. The HP2020 objective for HAV is based upon completion of the two-dose series; however, Tennessee only measures one dose of HAV because children who receive the first dose by their second birthday must wait at least six months before receiving the second dose. As a result, the survey rate is not comparable to the HAV HP2020 objective. Figure 6 shows the statewide and regional percentages of children immunized on-time with all vaccines in the 4:3:1:FS:3:1:FS series. Among the lowest completed vaccinations are DTaP and HIB, both of which require a final dose after 12 months of age. Influenza vaccination rates remain low with 51.3% of children having received at least two doses. The first dose of HAV vaccine was received by 90.4% (95% CI: 88.9-91.9) of children by 24 months of age.
Figure 6. Comparison of Healthy People 2020 objectives to Vaccination Completion Rates for 24-month Old Children in Tennessee, 2020 (point estimate and 95% CI, n=1494)

24
Figure 7. Statewide Trend of Complete Immunization for Individual Vaccines, Tennessee, 2010-2020
*HAV is not compared to HP2020 objectives as the HP2020 objective reflects completion of the two-dose series and this survey reflects completion of one dose. 1Decreases in RTV and HIB completion immunization rates from 2014 to 2015 likely due to change in methodology to account for vaccination brand 2Notable increase in HIB and PCV immunization rates in 2019 and 2020 are likely due to inclusion of children on CDC's catch-up schedule

25
Seasonal Influenza Vaccination Impact on Pediatric Morbidity and Mortality Children younger than 2 years old are at high risk of developing serious flu-related complications. These complications include pneumonia, dehydration, exacerbation of chronic illnesses (such as asthma), brain dysfunction (encephalopathy), and death. During the 2019-20 flu season, 188 children were reported as dying from influenza within the United States; however, the CDC estimates that number may be as high as 600 children.11
The annual seasonal influenza vaccine helps save lives. Influenza vaccine was shown to reduce the risk of pediatric intensive care unit (PICU) admissions by 74% from 2010-2012. During the 2019-2020 flu season, proper flu vaccination of all people prevented an estimated 7.5 million influenza illnesses, 3.7 million influenza-associated medical visits, 105,000 hospitalizations, and 6,300 influenza associated deaths12. Despite its benefits, influenza vaccine remains the least administered of the recommended immunizations in Tennessee. Only 53.5% of all children surveyed in 2020 had at least one dose of seasonal influenza vaccine, 51.3% had two doses, and 31.3% received the recommended three doses of influenza vaccine prior to the second birthday. Missed influenza vaccinations increase the risk of morbidity and mortality among Tennesseans of all ages.
Figure 8. Percentage and Count (non-exclusive) of Seasonal Influenza Vaccines in the First 24 Months of Age, Tennessee, 2020 (n=1494)

IMMUNIZATION STATUS SURVEY – 2020
26
Seasonal Influenza Vaccine in First Year of Life Of the 1,494 children surveyed, 53.5% (95% CI: 50.9-56.0) received their first flu vaccine between 6 months and one year of age. Memphis-Shelby region was the only health department region with statistically significantly fewer children who received their first dose of influenza vaccine between 6 months and one year of age (35.9%, 95%CI: 27.1-44.7) compared to the state rate. Mid-Cumberland region and Sullivan County region were the only health department regions with statistically significantly more children who received their first dose of influenza vaccine between 6 months and one year of age (67.9%, 95%CI: 59.0-76.8 and 68.5%, 95%CI: 59.7-77.2 respectively) compared to the state rate.
Figure 9. Percentage of Children Who Received First Dose of Influenza Vaccine in First Year of Life, by Health Department Region, Tennessee, 2020 (point estimate and 95% CI, n=1494)
Racial Disparity Oversampling for black children was done in each region where the random sample contained fewer black children than the actual proportion of black children born in the first quarter of 2018 in that region. All racial analysis reports include the 19 oversampled children. The 2020 survey population included 257 black and 1,192 white children. Due to small sample size, children of other races (n= 45) were excluded from this analysis. This survey does not differentiate between Hispanic whites and non-Hispanic whites; for that reason, racial disparity involving Hispanic ethnicity was not analyzed. The final sample for racial analysis consisted of 1,468 children. Black children were less likely to be fully immunized for all twelve of the recommended CDC vaccinations and statistically significantly less likely to receive DTaP, HIB, 4:3:1:FS:3:1:FS, Flu, Hepatitis A, and RTV compared to their white peers. Only 66.5% of black children were properly immunized with RTV vaccine

IMMUNIZATION STATUS SURVEY – 2020
27
compared to 78.5% of white children, and 32.3% of black children were immunized against influenza compared to 54.4% of white children. Of the 1,192 white children, 80.4% (95% CI: 78.1-82.6) completed the 4:3:1:FS:3:1:FS series, while 66.1% (95%CI: 60.3-72.0) of the 257 black children completed the series. For the first time in two years there was a significant increase in the racial disparity of 4:3:1:FS:3:1:FS immunization rates between black and white children; this is different from the previous trend of an incremental, but not statistically significant, decreases in past years. The results of the racial disparity analysis in the 2020 Immunization Status Survey warrant further analysis. Black children were less likely to be fully immunized on time with DTaP (68.1% black vs. 83.2% white), with this difference being statistically significant. Black children also had statistically significantly lower vaccination completion rates for HIB (79.8% black vs. 87.2% white).
Figure 10. Statewide Percentage of Children with Age-Appropriate Immunization Rates, by Vaccine and Race, Tennessee, 2020 (point estimates and 95% Confidence Intervals)

IMMUNIZATION STATUS SURVEY – 2020
28
Figure 11. 4:3:1:FS:3:1:FS Immunization Level Rates, by Race, Tennessee, 2015-2020 (point estimate and 95% CI)
Influenza remains the individual vaccine with the most significant racial disparity. This difference has been documented annually since the first assessment of influenza coverage rates in 2007. In 2020, 32.3% (95% CI: 26.5-38.0) of black children received at least two doses of influenza vaccine compared to 54.4% (95% CI: 51.5-57.2) of white children.
Figure 12. Statewide Percentage of Children with Two-Doses of Seasonal Influenza Vaccine, by Race, Tennessee, 2020 (point estimate and 95% CI, n=1,468)

IMMUNIZATION STATUS SURVEY – 2020
29
The ACIP recommends all children over the age of 6 months receive annual influenza vaccine. Of the 1,494 surveyed children, 53.5% received their first dose between 6 months and one year of age. White children were more likely to receive their first dose of influenza vaccine before their first birthday than black children (56.3% compared to 36.2%, respectively).
Figure 13. Percentage of Children Who Received First Influenza Vaccination in First Year of Life, by Race (point estimate and 95% CI, n=1494)
Risk Factor Analysis Insurance Enrollment Of the 1,494 children included in this survey, 978 (65.5%) were enrolled in TennCare, 822 (55.0%) were enrolled in WIC, and 761 (50.9%) were enrolled in both programs. The numbers of children enrolled in TennCare and WIC are not mutually exclusive of each other. In 2020, children who were covered by TennCare and WIC had 4:3:1:FS:3:1:FS series completion rates that were not significantly different from their non-enrolled peers. Of those enrolled in TennCare, 76.9% (95% CI: 74.2-79.5) were fully immunized, compared to 80.6% (95% CI: 77.2-84.0) of those not enrolled in TennCare. Similarly, 76.9% (95% CI: 74.0-79.8) of WIC enrollees were complete for the full 4:3:1:FS:3:1:FS series compared to 79.8% (95% CI: 76.7-82.8) of those not enrolled in WIC. Immunization Source Of the children sampled, 1175 (78.7%) were immunized by a private medical provider, 56 (3.8%) children sampled were immunized by a health department only, 191 (12.8%) children sampled were immunized by both a private provider and a health department, and 72 (4.7%) children sampled had records that were missing an immunization source. Children who received vaccines exclusively from a private medical

IMMUNIZATION STATUS SURVEY – 2020
30
provider were statistically significantly more likely to be fully vaccinated (81.8%) compared to children vaccinated by a health department only (71.4%) or by a combination of private provider and health department (80.6%).
Figure 14. Comparison of Children Complete for the 4:3:1:FS:3:1:FS Series by Immunization Provider Type, Tennessee, 2020 (point estimate and 95% confidence intervals, n=1494)
Children immunized in health departments were more likely to have risk factors for failure to receive immunizations compared to children who were only immunized by private medical providers. These risk factors include black race, having two or more siblings, and receipt of a first dose of any vaccine (except RTV and birth dose of hepatitis B) after the 120th day of life. Table 6. Prevalence of Three Risk Factors for Delayed Immunizations, by Provider Type
Black Race 2 or More Siblings Age at first dose >120 days* Any Risk Factor
Immunized Exclusively by Health Department
33.9% (19/56) 48.2% (27/56) 8.9& (5/56) 64.3% (36/56)
Immunized Exclusively by Private Medical Provider
15.5% (182/1175) 28.34% (333/1175) 2.3% (27/1175) 39.5% (464/1175)
Immunized by Health Department and Private Provider
23.0% (44/191) 33.5% (64/191) 2.6% (5/191) 50.% (96/191)
*excluding RTV and birth dose of Hep B Impact of Age at First Immunization on Immunization Completion Children who do not receive immunizations prior to 4 months of age are at risk of remaining under vaccinated at age 2 years. Of the children surveyed, 93.8% (1,401) began immunizations prior to 4 months of age and 82.2% of those children were completely immunized for the 4:3:1:FS:3:1:FS series by 24 months of age, compared to 43.2% (n= 16) of the 37 children who began immunizations after 4 months of age.
IMMUNIZATION STATUS SURVEY – 2020
31
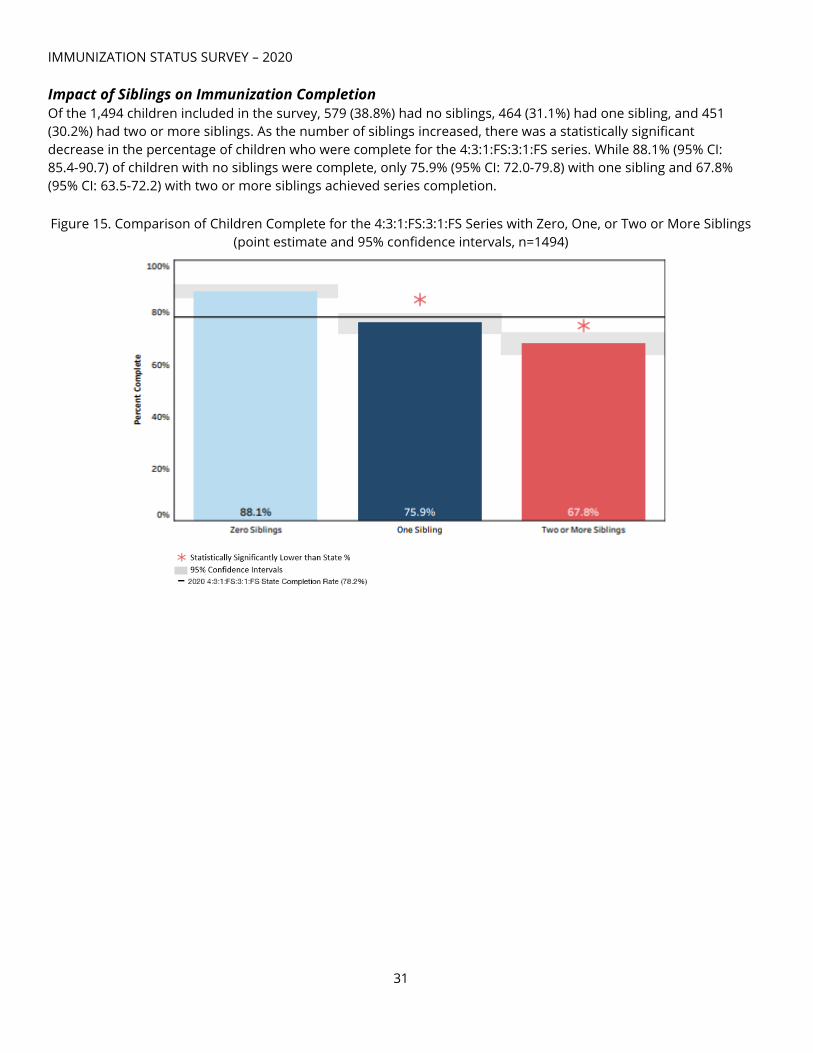
Impact of Siblings on Immunization Completion Of the 1,494 children included in the survey, 579 (38.8%) had no siblings, 464 (31.1%) had one sibling, and 451 (30.2%) had two or more siblings. As the number of siblings increased, there was a statistically significant decrease in the percentage of children who were complete for the 4:3:1:FS:3:1:FS series. While 88.1% (95% CI: 85.4-90.7) of children with no siblings were complete, only 75.9% (95% CI: 72.0-79.8) with one sibling and 67.8% (95% CI: 63.5-72.2) with two or more siblings achieved series completion. Figure 15. Comparison of Children Complete for the 4:3:1:FS:3:1:FS Series with Zero, One, or Two or More Siblings
(point estimate and 95% confidence intervals, n=1494)

IMMUNIZATION STATUS SURVEY – 2020
32
Opportunities for Improvement Fourth DTaP Figure 16 compares the regional percentages of children immunized with three and four doses of DTaP vaccine. The complete DTaP immunization rate for Tennessee was 80.9% (95% CI: 78.9-82.9); however, 93.2% (95% CI: 91.9-94.5) of children had at least three doses of DTaP. The regional differences between receipt of three doses of DTaP vaccine compared to receipt of four doses of DTaP vaccine ranges from 6.8% to 20.5%. For a child to be properly protected against diphtheria, tetanus, and pertussis, a fourth dose of DTaP is necessary between 15-18 months of age. If all children who had receive three doses of DTaP had received their fourth dose, Tennessee would have met the HP2020 objective for DTaP immunization (90%).
Figure 16. Percentage of Children with Complete Diphtheria, Tetanus, Pertussis (DTaP) Three Dose vs Four Dose Series by Health Department Region, TN, 2020 (point estimates and 95% confidence intervals, n=1494)
CDC Catch-up vs ACIP schedule In 2019, a change in completion logic was made to account for children who began HIB or PCV vaccination outside of the ACIP-recommended age but prior to 24 months. In 2020, 272 (18.2%) of the 1,494 children surveyed were vaccinated according to a catch-up schedule. Of these, 123 (45.2%) were considered complete for HIB vaccine. Of the 272 children vaccinated with PCV after the CDC recommended age, 126 (46.3%) were considered complete for PCV vaccine. When the catch-up schedule is considered, Tennessee exceeds the HP2020 objective for PCV vaccine coverage.

IMMUNIZATION STATUS SURVEY – 2020
33
Figure 17. Percentage of Children with Complete HIB Series, by CDC Schedule, by Health Department Region, Tennessee, 2020 (n=1494)
Figure 18. Percentage of Children with Complete PCV Series, by CDC Schedule, by Health Department Region, Tennessee, 2020 (n=1494)

IMMUNIZATION STATUS SURVEY – 2020
34
Summary of Key Findings Below is the summary of coverage rates relative to Health People (HP) 2020 objectives:
Measurement TN 2020 (24 months)
TN 3 Year Average (24 months)
HP2020 objective (19-35
months)
HP2030 objective (24 months)
Complete 4:3:1:FS:3:1:4 series
78.2% 74.0% 80% N/A
Each vaccine in 4:3:1:FS:3:1:4 (DTaP, IPV,
MMR, Hib, HBV, VAR, PCV)
Exceeded Goal: 3 doses of IPV
(92.5%) Full series of PCV
(94.1%) 1 dose of Varicella
(90.6%) 1 dose of MMR
(91.2%)
Below Goal: 4 doses of DTaP
(80.8%)
Full series of HIB (86.1%)
Exceeded Goal:
3 doses of IPV (92.1%)
3 doses of HBV (92.6%)
Below Goal: 4 doses of DTaP
(81.1%)
Full series of HIB (81.1%)
Full series of PCV (89.0%)
1 dose of Varicella (89.4%)
1 dose of MMR (89.6%)
90% rate for each of the 7
vaccines
90% rate for DTaP;
90.8% rate for MMR
Hepatitis A vaccine 1 dose HAV (90.4%)
not comparable to HP2020
89.5% N/A N/A
Influenza vaccine 51.3% with 2 doses
31.3% with 3 doses 45.9%
70% appropriately
immunized N/A
Rotavirus vaccine 76.7% 77.4% 80% with 2
doses N/A
Hepatitis B birth dose 80.4% 83.2% 85% N/A
3 doses DTaP vs 4 doses of DTaP
93.2% (3 DTaP) vs 80.9% (4 DTaP)
N/A N/A
HIB Completion ACIP vs CDC Catch-Up
77.8% (ACIP) vs 86.1% (Catch-up)
N/A N/A
PCV Completion ACIP vs CDC Catch-Up
85.1% (ACIP) vs 94.1% (Catch-Up)
N/A N/A
Indicates value is above HP objective.

IMMUNIZATION STATUS SURVEY – 2020
35
• Tennessee’s statewide completion of the 4:3:1:FS:1:3:FS full series would exceed the HP2020 coverage goal of 80% if the children sampled in this survey had received an additional immunization visit in their second year of life to receive a fourth dose of DTaP vaccine. This underscores the importance of patient reminder and recall messaging. As the fourth dose may be administered as early as age 12 months if at least 6 months has elapsed since the third dose, a recommendation to administer the fourth dose at the 12-month visit should be considered to achieve the HP2020 coverage goal.
• Tennessee did not reach 80% coverage for the 4:3:1:FS:3:1:FS at any point in the past decade nor did it meet the goal in 2020; polio and hepatitis B have remained above the HP2020 objective of 90% for the entire decade and followed suit in 2020.
• Black children were statistically significantly less likely than white children to be completely immunized according to CDC recommendations.
• Parents of 2.7% of the surveyed children reported refusing some or all immunizations, compared to 4.2% in 2019.
Discussion
While overall vaccination rates among children in Tennessee remain high, the threat of reintroduction of previously eliminated vaccine-preventable diseases across the United States emphasizes the importance of continued vigilance in ensuring that every medically-eligible child is fully vaccinated on-time and according to the Centers for Disease Control and Prevention (CDC) recommended childhood immunization schedule. Tennessee currently meets HP2030 targets for two of three vaccination-related measures for 24-month old children. The vast majority of parents in Tennessee vaccinate their children on time and according to the CDC recommendations. Of the 1,494 children surveyed, 2.7% (n=40) reported objection or exemptions. Religious exemption was cited by 1.2% of parents, philosophical exemption was cited by 1.3% of parents, and medical exemption was cited by 0.2% of parents. As Tennessee law allows only religious and medical exemptions in lieu of complete immunization as required for public school entry, philosophical objections often transition to complete vaccination or the declaration of religious exemptions prior to school entry. Three elements are critical to ensuring that every medically-eligible child in Tennessee is fully immunized on-time and according to the CDC’s recommended childhood vaccination schedule:
• Parental and community education and messaging around the safety, efficacy, and critical importance of childhood immunization
• Ready access to, and provision of, immunizations at every opportunity • Reliable and readily accessible immunization records that ensure immunizations are provided on-time
while avoiding duplication Impact of COVID19 on Immunization Rates The CDC noted a decline in overall vaccination rates as soon as one week after the United States declared a national state of emergency due to the COVID-19 pandemic. A smaller decline was recognized nationally in children ≤24 months old, likely due to heightened vaccination campaign efforts to promote early childhood vaccinations in the context of the pandemic.2 Although the results contained in this report indicate a positive trajectory for the immunization status of 24-month old children in Tennessee, they do not reflect the negative impact the COVID-19 pandemic has had on childhood vaccinations overall. The data contained in this report was collected from January 2020 – March 2020; the first case of COVID-19 was identified in Tennessee on March 4, 2020. Data on vaccination rates demonstrate
IMMUNIZATION STATUS SURVEY – 2020
36
the COVID19 pandemic has had a significant negative impact in Tennessee, which is in line with reports from other states and national studies. The true impact of COVID19 on the immunization rates of 24-month old children in Tennessee may not be fully realized for years to come, and every effort should be made to provide these missing vaccinations as soon as possible. Key Strategies for Improving Immunization Rates Among 24-month Old Children Parental and community education and messaging around the safety, efficacy, and critical importance of childhood immunization
• Parents should be skeptical of information posted to social media and seek credible sources of vaccine information and the advice of their child’s medical provider when seeking information about vaccines.
• The ability of public health and healthcare providers to provide a strong and credible message that “vaccines are safe, vaccines are effective, and vaccines save lives” is critical to ensuring the protection of Tennesseans of all ages.
Ready access to, and provision of, vaccinations at every opportunity • The federally-funded Vaccines for Children (VFC) Program ensures that children who are covered by
TennCare or otherwise lack insurance coverage for vaccines are able to receive them free of charge through a statewide network of healthcare providers and local departments of health. Expansion of this network of VFC Providers will provide more opportunities to vaccinate children.
• Medical providers should review vaccine records and administer missing vaccinations at every opportunity.
• The Tennessee Immunization Information System (TennIIS) is built with the ACIP forecaster for each child. Physicians should utilize TennIIS to identify gaps in immunizations, especially DTaP and Flu, at every opportunity.
Reliable and readily accessible vaccination records that ensure vaccinations are provided on-time while avoiding duplication
• The Tennessee Immunization Information System, “TennIIS” (www.TennesseeIIS.gov) is an online immunization registry that is available to all immunizing providers, including hospitals, clinics and pharmacies, and includes a suite of tools which may help to improve immunization rates among children and adults.
• Standards implemented in 2017 require clinics participating in the federal Vaccines for Children (VFC) Program to report all immunizations administered to children under 19 years of age to TennIIS. This enables providers to use system features designed to improve patient immunization services, such as vaccine forecasting, practice-based patient reminders and immunization coverage rate reports.
• All vaccinating providers should report all administered vaccination to the TennIIS. Reporting all immunizations to an Immunization Information System (IIS) such as TennIIS improves healthcare by establishing a permanent immunization record that is available to all healthcare providers. TennIIS is linked to the electronic health record (EHR) systems of hundreds of medical facilities and pharmacies statewide, allowing for seamless electronic immunization record reporting from those systems.
• TennIIS provides medical providers with a validated immunization certificate, which families use for daycare, school, college entry, and employment requirements. Provider participation in TennIIS is critical to build these lifelong records and to ensuring all Tennesseans are appropriately vaccinated.

IMMUNIZATION STATUS SURVEY – 2020
37
Policy • States that have eliminated non-medical exemptions have benefited from higher overall immunization
rates than states which allow non-medical exemptions.
Recommendations to Improve Immunization Coverage in 24-month Old Children
The following recommendations may improve on-time immunization of Tennessee children:
1. Vaccination records should be examined for completeness at every medical visit, regardless of the reason for the visit, and vaccinations should be provided at every opportunity. Given the significant reduction in vaccinations provided to children during the COVID-19 pandemic, it is critical to the health of all Tennesseans to ensure every child is fully vaccinated, according to the CDC recommended childhood vaccination schedule.
2. Medical providers should implement strategies that alert parents when their children are due or overdue for booster doses of DTaP, HIB and PCV. Most children who fell short of complete immunization could have achieved series completion with just one additional immunization visit prior to the second birthday. Minority children are especially vulnerable to missing immunizations.
3. Parents and providers should strictly adhere to the early infant schedule of immunizations at 2-, 4-, and 6-months. Doing so will enable providers to administer the 4th DTaP and all other needed immunizations as early as the first birthday, maximizing the number of opportunities to immunize children on time.
4. All vaccinating providers should enroll in, and report vaccinations to, TennIIS for every patient The Tennessee Immunization Information System (TennIIS) maintains patient immunization records and special tools which may assist providers in improving the quality of their immunization services. User guides and other TennIIS resources available through the training information posted at www.TennesseeIIS.gov may assist providers in recognizing opportunities to immunize their patients.
a. TennIIS provides individual patient forecasting of immunizations due, based upon the patient’s immunization history.
b. TennIIS is able to generate patient reminders through the use of manual, autodialer, text or other reminder methods. This feature assists providers in reminding patients of immunization appointments and recalling children who are due or overdue for immunizations.
c. Medical practices may run their own practice-level immunization coverage reports based on their active patients in TennIIS. Coaching on the use of these reports is available in the training section of the TennIIS website.
d. There are more than 5,600 private medical provider offices enrolled in TennIIS. All immunizing providers should enroll and report immunizations to TennIIS. This will allow for more accurate shared clinical decision making and the most complete immunization record for Tennesseans.
5. VPDIP provides local health departments (LHDs) with lists of children aged 20-24 months who have received immunizations in a LHD and whose records show they are incompletely immunized with DTaP vaccine. These reports facilitate LHD efforts to recall those children who are incompletely immunized.
6. All parents, especially those enrolled in WIC and TennCare, should continue to receive immunization education, immunization record review, and immunization administration at every opportunity.
7. VPDIP will broadly communicate the results of this survey to public health leaders, VFC program participants and professional organizations, including immunizing providers. The VPDIP program should continue to identify opportunities to provide VFC providers with immunization education and strategies to improve immunization coverage across the state.
8. The importance of continuous quality improvement should be emphasized, and providers should be encouraged to participate in individualized quality improvement. The VFC Quality Assurance team and immunization field staff in each regional and metro public health department provide practice-level

IMMUNIZATION STATUS SURVEY – 2020
38
quality assessments and feedback to VFC providers with the lowest rates of 4th DTaP completion. The public should be continually reminded of the morbidity and mortality associated with seasonal influenza. Barriers to universal influenza immunization should be continuously addressed and eliminated
9. VPDIP should continue to seek partnerships with external organizations, such as the Tennessee Chapter of the American Academy of Pediatrics, TennCare, and Federally Qualified Rural Health Clinics (FQHCs) to ensure every medically-eligible child is immunized on time.
1CDC. Vaccination Coverage by Age 24 Months Among Children Born in 2015 and 2016 – National immunization Survey-Child, United States, 2016-2018. Morbidity and Mortality Weekly Report, 68(41);913-918. 2CDC. Effects of the COVID-19 Pandemic on Routine Pediatric Vaccine Ordering and Administration — United States, 2020. Morbidity Mortal Weekly Report, 2020;69:591–593. 3CDC. Ensuring the Safety of Vaccines in the United States. Centers for Disease Control and Prevention. 2013 Feb 01. 4CDC. Parent’s Guide to Childhood Immunizations; Part 3: More About Vaccines. Centers for Disease Control and Prevention: 22-29. 5CDC. Benefits from Immunization During the Vaccines for Children Program Era — United States, 1994–2013. Morbidity and Mortality Weekly Report. 63(16);352-355. 6CDC. Ten Great Public Health Achievements – United States 2001—2011. Morbidity and Mortality Weekly Report. 60(19);619-623. 7Pradke, V., Bednarczyk, R., et al. Association between Vaccine Refusal and Vaccine-Preventable Diseases in the United States: A Review of Measles and Pertussis. JAMA. 2016 Mar 15; 315(11):1149-1158. 8Flannery, B., Reynolds, S., et al. Influenza Vaccination Effectiveness against Pediatric Deaths: 2010-2014. Pediatrics. 2017, May; 139(5):e20164244. 9 American Academy of Pediatrics. Recommended Child and Adolescent Immunization Schedule for ages 19 years or younger, United States, 2019. Centers for Disease Control and Prevention. https://www.cdc.gov/vaccines/schedules/hcp/imz/child-adolescent.html 10 Recommended Child and Adolescent Immunization Schedule for Ages 18 Years or Younger–United States, 2019. Centers for Disease Control and Prevention. 2020 Jan 01. 11CDC. Children & Influenza (Flu). Centers for Disease Control and Prevention, National Center for Immunization and Respiratory Diseases: 2020 Aug 21. 12CDC. What Are the Benefits of Flu Vaccination? Centers for Disease Control and Prevention, National Center for Immunization and Respiratory Diseases: 2020 Oct 6.

39
Appendix 1 Regional Antigen Specific Results
Page DTaP & Polio …40 MMR & Haemophilus influenzae type b …41 Hepatitis B (3-dose coverage) & Hepatitis B (birth dose) …42 Varicella & Pneumococcus …43 4:3:1:FS:3:1:FS series & Hepatitis A …44 Rotavirus & Influenza (2-dose coverage) …45

IMMUNIZATION STATUS SURVEY – 2020
40
Percentage of Children with Complete Diphtheria, Tetanus, Pertussis (DTaP) Series by Health Department Region, Tennessee, 2020 (point estimates and 95% confidence intervals, n=1494)
Percentage of Children with Complete Polio (IPV) Series by Health Department Region, Tennessee, 2020 (point
estimates and 95% confidence intervals, n=1494)

IMMUNIZATION STATUS SURVEY – 2020
41
Percentage of Children with Complete Measles, Mumps, Rubella (MMR) by Health Department Region, Tennessee, 2020 (point estimates and 95% confidence intervals, n=1494)
Percentage of Children with Complete Haemophilus influenzae type B (HIB)∫ Series by Health Department Region, Tennessee, 2020 (point estimates and 95% confidence intervals, n=1494)
∫ Includes children on CDC catch-up schedule

IMMUNIZATION STATUS SURVEY – 2020
42
Percentage of Children with Complete Hepatitis B (HBV) Series by Health Department Region, Tennessee, 2020 (point estimates and 95% confidence intervals, n=1494)
Percentage of Children with Complete Birth Dose Hepatitis B (bHBV) by Health Department Region, Tennessee,
2020 (point estimates and 95% confidence intervals, n=1494)

IMMUNIZATION STATUS SURVEY – 2020
43
Percentage of Children with Complete Varicella (VAR) Series by Health Department Region, Tennessee, 2020 (point estimates and 95% confidence intervals, n=1494)
Percentage of Children with Complete Pneumococcus (PCV) ∫ Series by Health Department Region, Tennessee, 2020 (point estimates and 95% confidence intervals, n=1494)
∫ Includes children on CDC catch-up schedule

IMMUNIZATION STATUS SURVEY – 2020
44
Percentage of Children with Complete 4:3:1:FS:3:1:FS Series by Health Department Region, Tennessee, 2020 (point estimates and 95% confidence intervals, n=1494)
Percentage of Children with Complete Hepatitis A (HAV) Series by Health Department Region, Tennessee, 2020
(point estimates and 95% confidence intervals, n=1494)

IMMUNIZATION STATUS SURVEY – 2020
45
Percentage of Children with Complete Rotavirus (RTV) Series by Health Department Region, Tennessee, 2020 (point estimates and 95% confidence intervals, n=1494)
Percentage of Children with Complete Influenza (FLU) Series by Health Department Region, Tennessee, 2020 (point estimates and 95% confidence intervals, n=1494)

IMMUNIZATION STATUS SURVEY – 2020
46
Appendix 2 Individual Health Department Region Charts with Coverage Rates for All Vaccines Assessed
Page Memphis-Shelby County …47 West Tennessee Region …47 Jackson-Madison County …48 South Central Region …48 Mid-Cumberland Region …49 Nashville-Davidson County …49 Upper Cumberland Region …50 Southeast Region …50 Chattanooga-Hamilton County …51 East Tennessee Region …51 Knoxville-Knox County …52 Northeast Region …52 Sullivan County …53

IMMUNIZATION STATUS SURVEY – 2020
47
Percent of Children Complete in Memphis-Shelby County (MSR) by Vaccine (point estimates and 95% confidence intervals, n=117)
Percent of Children Complete in West Tennessee Region (WTR) by Vaccine (point estimates and 95% confidence intervals, n=114)

IMMUNIZATION STATUS SURVEY – 2020
48
Percent of Children Complete in Jackson-Madison Region (JMR) by Vaccine (point estimates and 95% confidence intervals, n=119)
Percent of Children Complete in South Central Region (SCR) by Vaccine (point estimates and 95% confidence intervals, n=118)

IMMUNIZATION STATUS SURVEY – 2020
49
Percent of Children Complete in Mid-Cumberland Region (MCR) by Vaccine (point estimates and 95% confidence intervals, n=109)
Percent of Children Complete in Nashville-Davidson Region (NDR) by Vaccine (point estimates and 95% confidence intervals, n=115)

IMMUNIZATION STATUS SURVEY – 2020
50
Percent of Children Complete in Upper Cumberland Region (UCR) by Vaccine (point estimates and 95% confidence intervals, n=116)
Percent of Children Complete in Southeast Region (SER) by Vaccine (point estimates and 95% confidence intervals, n=115)

IMMUNIZATION STATUS SURVEY – 2020
51
Percent of Children Complete in Chattanooga-Hamilton Region (CHR) by Vaccine (point estimates and 95% confidence intervals, n=115)
Percent of Children Complete in East Tennessee Region (ETR) by Vaccine (point estimates and 95% confidence intervals, n=117)

IMMUNIZATION STATUS SURVEY – 2020
52
Percent of Children Complete in Knoxville-Knox County Region (KKR) by Vaccine (point estimates and 95% confidence intervals, n=110)
Percent of Children Complete in Northeast Region (NER) by Vaccine (point estimates and 95% confidence intervals, n=118)

IMMUNIZATION STATUS SURVEY – 2020
53
Percent of Children Complete in Sullivan County Region (SUL) by Vaccine (point estimates and 95% confidence intervals, n=111)

IMMUNIZATION STATUS SURVEY – 2020
54
Appendix 3
Data Tables for Selected Analyses
Page Series Complete (4:3:1:FS:3:1:FS) by Region …55 Series Complete (4:3:1:FS:3:1:FS) by Provider Type …55 Series Complete (4:3:1:FS:3:1:FS) by Race …56 Series Complete (4:3:1:FS:3:1:FS) by Number of Older Siblings …56 Series Complete (4:3:1:FS:3:1:FS) by TennCare Enrollment …57 Series Complete (4:3:1:FS:3:1:FS) by WIC Enrollment …57
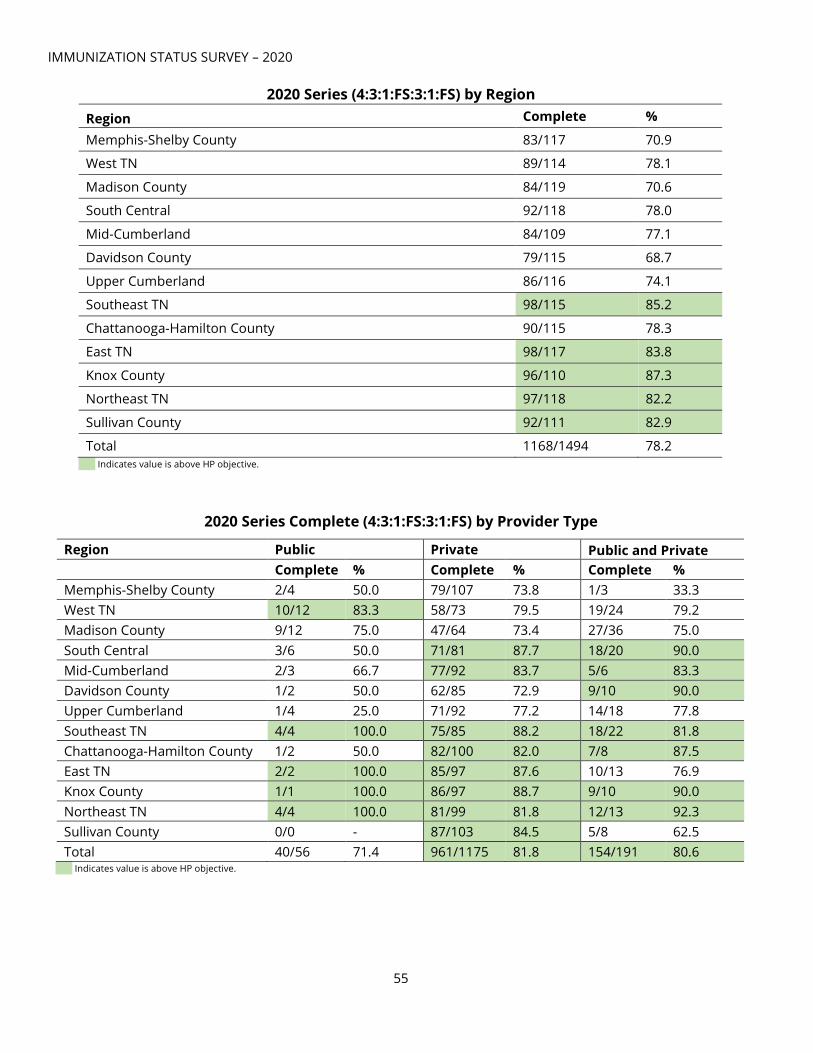
IMMUNIZATION STATUS SURVEY – 2020
55
2020 Series (4:3:1:FS:3:1:FS) by Region
Indicates value is above HP objective.
2020 Series Complete (4:3:1:FS:3:1:FS) by Provider Type
Indicates value is above HP objective.
Region Complete %
Memphis-Shelby County 83/117 70.9
West TN 89/114 78.1
Madison County 84/119 70.6
South Central 92/118 78.0
Mid-Cumberland 84/109 77.1
Davidson County 79/115 68.7
Upper Cumberland 86/116 74.1
Southeast TN 98/115 85.2
Chattanooga-Hamilton County 90/115 78.3
East TN 98/117 83.8
Knox County 96/110 87.3
Northeast TN 97/118 82.2
Sullivan County 92/111 82.9
Total 1168/1494 78.2
Region Public Private Public and Private
Complete % Complete % Complete % Memphis-Shelby County 2/4 50.0 79/107 73.8 1/3 33.3 West TN 10/12 83.3 58/73 79.5 19/24 79.2 Madison County 9/12 75.0 47/64 73.4 27/36 75.0 South Central 3/6 50.0 71/81 87.7 18/20 90.0 Mid-Cumberland 2/3 66.7 77/92 83.7 5/6 83.3 Davidson County 1/2 50.0 62/85 72.9 9/10 90.0 Upper Cumberland 1/4 25.0 71/92 77.2 14/18 77.8 Southeast TN 4/4 100.0 75/85 88.2 18/22 81.8 Chattanooga-Hamilton County 1/2 50.0 82/100 82.0 7/8 87.5 East TN 2/2 100.0 85/97 87.6 10/13 76.9 Knox County 1/1 100.0 86/97 88.7 9/10 90.0 Northeast TN 4/4 100.0 81/99 81.8 12/13 92.3 Sullivan County 0/0 - 87/103 84.5 5/8 62.5 Total 40/56 71.4 961/1175 81.8 154/191 80.6

IMMUNIZATION STATUS SURVEY – 2020
56
2020 Series Complete (4:3:1:FS:3:1:FS) by Race
Indicates value is above HP objective.
2020 Series Complete (4:3:1:FS:3:1:FS) by Number of Older Siblings
Indicates value is above HP objective.
Region White Black Other
Complete % Complete % Complete %
Memphis-Shelby County 32/40 80.0 43/69 62.3 8/8 100.0 West TN 72/88 81.8 17/25 68.0 0/1 0.0 Madison County 51/68 75.0 32/50 64.0 1/1 100.0 South Central 83/106 78.3 5/8 62.5 4/4 100.0 Mid-Cumberland 70/91 76.9 9/13 69.2 5/5 100.0 Davidson County 48/68 70.6 24/37 64.9 7/10 70.0 Upper Cumberland 84/113 74.3 0/1 0.0 2/2 100.0 Southeast TN 91/106 85.9 4/6 66.7 3/3 100.0 Chattanooga-Hamilton County 69/88 78.4 18/24 75.0 3/3 100.0
East TN 95/113 84.1 2/2 100.0 1/2 50.0 Knox County 85/94 90.4 8/13 61.5 3/3 100.0 Northeast TN 92/113 81.4 4/4 100.0 1/1 100.0 Sullivan County 86/104 82.7 4/5 80.0 2/2 100.0 Total 958/1192 80.4 170/257 66.2 40/45 88.9
Region 0 Siblings 1 Sibling 2+ Siblings
Complete % Complete % Complete % Memphis-Shelby County 41/46 89.1 19/25 76.0 23/46 50.0 West TN 24/27 88.9 33/46 71.7 32/41 78.1 Madison County 35/39 89.7 23/38 60.5 26/42 61.9 South Central 34/40 85.0 36/41 87.8 22/37 59.5 Mid-Cumberland 41/47 87.2 22/33 66.7 21/29 72.4 Davidson County 35/44 79.6 24/36 66.7 20/35 57.1 Upper Cumberland 33/40 82.5 31/41 75.6 22/35 62.9 Southeast TN 49/52 94.2 21/31 67.7 28/32 87.5 Chattanooga-Hamilton County
44/52 84.6 25/31 80.7 21/32 65.6
East TN 40/43 93.0 35/41 85.4 23/33 69.7 Knox County 42/47 89.4 30/35 85.7 24/28 85.7 Northeast TN 45/53 84.9 30/35 85.7 22/30 73.3 Sullivan County 47/49 95.9 23/31 74.2 22/31 71.0 Total 510/579 88.1 352/464 75.9 306/451 67.9
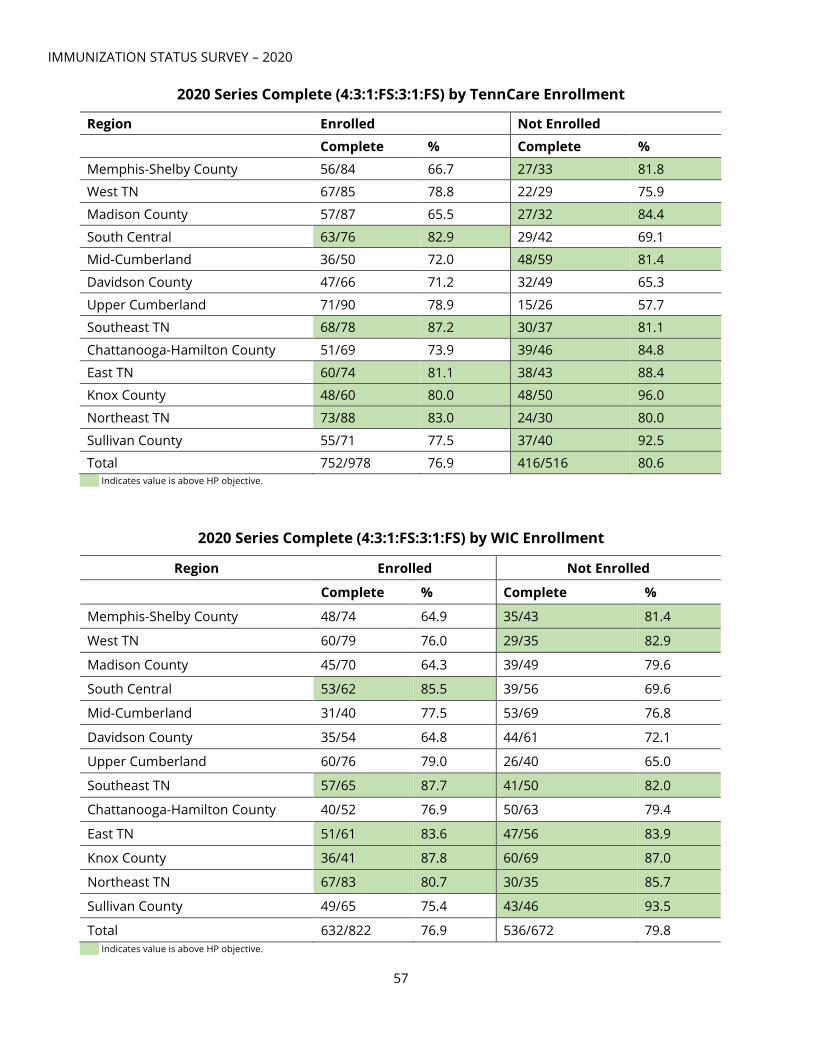
IMMUNIZATION STATUS SURVEY – 2020
57
2020 Series Complete (4:3:1:FS:3:1:FS) by TennCare Enrollment
Indicates value is above HP objective.
2020 Series Complete (4:3:1:FS:3:1:FS) by WIC Enrollment
Indicates value is above HP objective.
Region Enrolled Not Enrolled
Complete % Complete %
Memphis-Shelby County 56/84 66.7 27/33 81.8 West TN 67/85 78.8 22/29 75.9
Madison County 57/87 65.5 27/32 84.4
South Central 63/76 82.9 29/42 69.1 Mid-Cumberland 36/50 72.0 48/59 81.4
Davidson County 47/66 71.2 32/49 65.3
Upper Cumberland 71/90 78.9 15/26 57.7 Southeast TN 68/78 87.2 30/37 81.1
Chattanooga-Hamilton County 51/69 73.9 39/46 84.8
East TN 60/74 81.1 38/43 88.4 Knox County 48/60 80.0 48/50 96.0
Northeast TN 73/88 83.0 24/30 80.0
Sullivan County 55/71 77.5 37/40 92.5
Total 752/978 76.9 416/516 80.6
Region Enrolled Not Enrolled
Complete % Complete %
Memphis-Shelby County 48/74 64.9 35/43 81.4
West TN 60/79 76.0 29/35 82.9
Madison County 45/70 64.3 39/49 79.6
South Central 53/62 85.5 39/56 69.6
Mid-Cumberland 31/40 77.5 53/69 76.8
Davidson County 35/54 64.8 44/61 72.1
Upper Cumberland 60/76 79.0 26/40 65.0
Southeast TN 57/65 87.7 41/50 82.0
Chattanooga-Hamilton County 40/52 76.9 50/63 79.4
East TN 51/61 83.6 47/56 83.9
Knox County 36/41 87.8 60/69 87.0
Northeast TN 67/83 80.7 30/35 85.7
Sullivan County 49/65 75.4 43/46 93.5
Total 632/822 76.9 536/672 79.8

IMMUNIZATION STATUS SURVEY – 2020
58
Appendix 4 Regional One Page Summaries
Page Memphis- Shelby County …59 West Tennessee Region …60 Jackson-Madison County …61 South Central Region …62 Mid-Cumberland Region …63 Nashville-Davidson County …64 Upper Cumberland Region …65 Southeast Region …66 Chattanooga- Hamilton County …67 East Tennessee Region …68 Knoxville-Knox County …69 Northeast Region …70 Sullivan County …71

59

60

IMMUNIZATION STATUS SURVEY – 2020
61

IMMUNIZATION STATUS SURVEY – 2020
62

IMMUNIZATION STATUS SURVEY – 2020
63

IMMUNIZATION STATUS SURVEY – 2020
64

IMMUNIZATION STATUS SURVEY – 2020
65

IMMUNIZATION STATUS SURVEY – 2020
66

IMMUNIZATION STATUS SURVEY – 2020
67

IMMUNIZATION STATUS SURVEY – 2020
68

IMMUNIZATION STATUS SURVEY – 2020
69
The picture can't be displayed.

IMMUNIZATION STATUS SURVEY – 2020
70
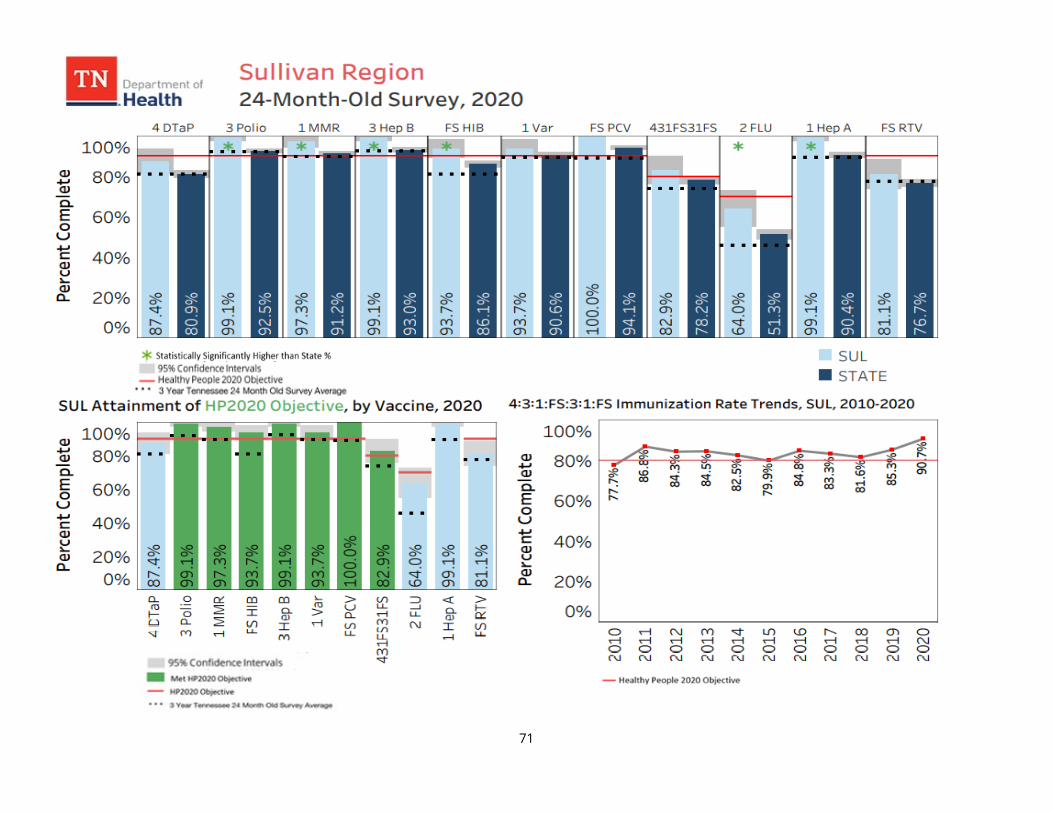
IMMUNIZATION STATUS SURVEY – 2020
71

IMMUNIZATION STATUS SURVEY – 2020
72
Appendix 5