Embed Size (px)
Citation preview

UNL, 05.15.2004
1. Draft
Technological Spillovers – The Argument
for Trade?*
Hans J. Czap
Ph.D. student
Department of Economics; CBA
University of Nebraska, Lincoln
Lincoln, NE 68588-0489
Tel: 402-472-3442
Fax: 402-472-9700
Email: [email protected]
*paper to be presented at the 2004 AAEA meeting in Denver
Copyright 2004 by Hans Czap. All rights reserved. Readers may make verbatim copies of this document for non-commercial purposes by any means, provided that this copyright notice appears on all such copies.

1
Technological Spillovers – The Argument for Trade?
Hans J. Czap
This paper examines the validity of anti-trade arguments that are based on the absence of
technological spillovers. Results of a pooled cross-section time-series analysis for developing
countries fail to support the existence of technological spillovers. Findings of learning-by-doing
effects indicate that protectionism might be beneficial under certain circumstances.
Key words: development, international trade, technological spillovers, protectionism
Economic growth is one of the main determinants for increases in human welfare. While
developed countries enjoy high standards of living, the same cannot be said of most
developing countries, where large parts of the population live at or below the poverty
line. Development policy aims at improving standards of living in these countries, using
trade policy as one of the tools to achieve this goal. Whereas most recent contributions in
the field of international trade and development (see for example Romer 1990, Grossman
and Helpman 1990) support the claim that trade in general augments growth, under
certain circumstances the argument can be made that protectionist trade policies might
actually be warranted for (e.g. Grossman and Helpman 1997, Romer 1990, Lewer and
Van den Berg 2003). Further insights into this controversy are extremely important as
they allow improved policy decisions.
Deeper understanding of growth related issues is particularly important for less
developed countries as they need economic growth most. This paper therefore explores,
in contrast to previous studies, the existence of technological spillovers between sectors
within developing countries and between developing countries and developed countries
as a determinant of growth. Furthermore this study differs from previous research in that
the focus lies on bi-directional technological spillovers between the manufacturing sector

2
and the agricultural sector in developing countries in addition to the analysis of
technological spillovers between countries. This is of special interest for two reasons:
First, the agricultural sector represents a relatively large part of most developing country
economies; Second, growth promoting policies in these countries are usually targeted at
the manufacturing sector due to the supposed lack of productivity improvements in
agriculture. A finding of technological spillovers originating from the agricultural sector
would have important ramifications for domestic economic policies as a high social
return to agricultural activity (compared to private return) might justify a shift in the
target of growth promoting policies towards agriculture.
The present paper is divided into three parts. The first part of the paper addresses
briefly the theoretical importance of the lack of technological spillovers for the
justification of protectionism. The second part reviews the literature on technological
spillovers. The third part, lastly, estimates the existence and significance of international
and sectoral technological spillovers for a set of Latin American countries.
Theoretical Importance of Spillovers
The assumptions of the anti trade models considered in this paper hinge on the lack of
spillovers between sectors within countries and same sectors between countries.
Technological spillovers result from the incomplete appropriability of technological
advances. With spillovers, productivity increases and technological progress in one firm
or industry cause productivity increases in other sectors and therefore represent positive
externalities to the economy. To illustrate the testable hypotheses a simple model of
specialization in line with Lewer and Van den Berg (2003) is presented. Similar
conclusions can be derived from more complex model as for example presented by
Romer (1990), Grossman and Helpman (1997) and Lucas (1988).
Consider a perfectly competitive economy with an agricultural and a
manufacturing sector and two countries. Following traditional reasoning, it is assumed
2,1),( =⋅= iforNLFAY iiii

3
that the manufacturing sector exhibits learning by doing effects, whereas the agricultural
sector does not.1 Both countries have the same sectoral production function
(1)
Where Yi is the output in sector i, A is the stock of technical ability or knowledge,
Li is the input of land in sector i, and Ni is the input of labor in sector i.
The stock of technical ability is assumed to be a public input, thus the same for both
sectors. The development of this stock is, however, in this model solely determined by
production in the manufacturing sector. Positive externalities in terms of technical
progress do not only benefit the manufacturing sector, but also the producers in the
agricultural sector. The learning by doing process is therefore characterized by spillovers
across sectors and differences between private and public returns (see also Bernstein and
Nadiri (1988), and Rosegrant and Evenson (1992)). The rate of technological change can
thus be modeled as
(2)
Lastly, it is assumed that consumers are utility maximizers for any homothetic,
intertemporal utility function. Due to the perfectly competitive nature of the economy and
the nonappropriability of technological advances, each firm will maximize instantaneous
profits by equating the marginal rate of transformation between goods and their price
ratio. Under the further assumption of no spillovers between countries it follows that
output changes over time as
(3) )),(),((),(1 iiiiN
iiiiL
iiii NNLFLNLFANLFbYY &&& ++= implying a growth rate of output of
1 The reader should notice of course that the treatment of technological progress as a simple learning by
doing process is unsatisfactory, as we would expect that innovations are the result of intentional effort
rather than a random byproduct of production. The basic insights, however, are provided even in this
simple framework.
1bYA =&
4
(4) ),(
),(),(),( 111
iii
iiiiN
iiiiL
y NLFNNLFLNLF
NLbFg i
&& ++=
in each sector.
The assumption of nonappropriability of technical progress by any individual firm and
the lack of spillovers between countries implies that from a social perspective the
technology advancing sector is not producing at an optimal quantity of output. Social
welfare could be increased by subsidizing production in the sector that produces positive
externalities. We thus deal with a market failure.
Following standard neoclassical trade theory, country A will specialize in the sector that
is resource intensive in its abundant factor, given that production functions are actually
equal. Under the aforementioned assumption of no international spillovers, this implies
that the country specializing on the no-learning sector will experience a lower growth rate
of its output.2 The lagging behind of the no-learning sector will over time increase the
price of its output relative to the price of the output in the learning sector. This will cause
the consumers to substitute for the now cheaper product and thus lead to a shift of
production towards the learning product. Eventually both countries will produce mostly
the learning product and thus experience similar rates of growth. In this scenario static
gains from trade are given, dynamic disadvantages, however, will outweigh these gains
after some few years. Growth rates will equalize eventually, but level changes will have
occurred during the transition period. In this case an argument for protection can be
made. Protecting the learning sector increases the profitability of producing that product
and leads producers to increase production. The increase in output of learning intensive
2 That is as long as
),()),(),((
iii
iiiiN
iiiiL
NLFNNLFLNLF && + does not differ substantially across countries.
However, even if there is a substantial difference and the country specializing in the no-learning good
grows faster than the other country, the former would still be better off with increased spillovers from the
learning intensive sector.
5
goods will benefit the growth rate of output and thus welfare through the increase of
positive externalities, e.g. spillovers between sectors.
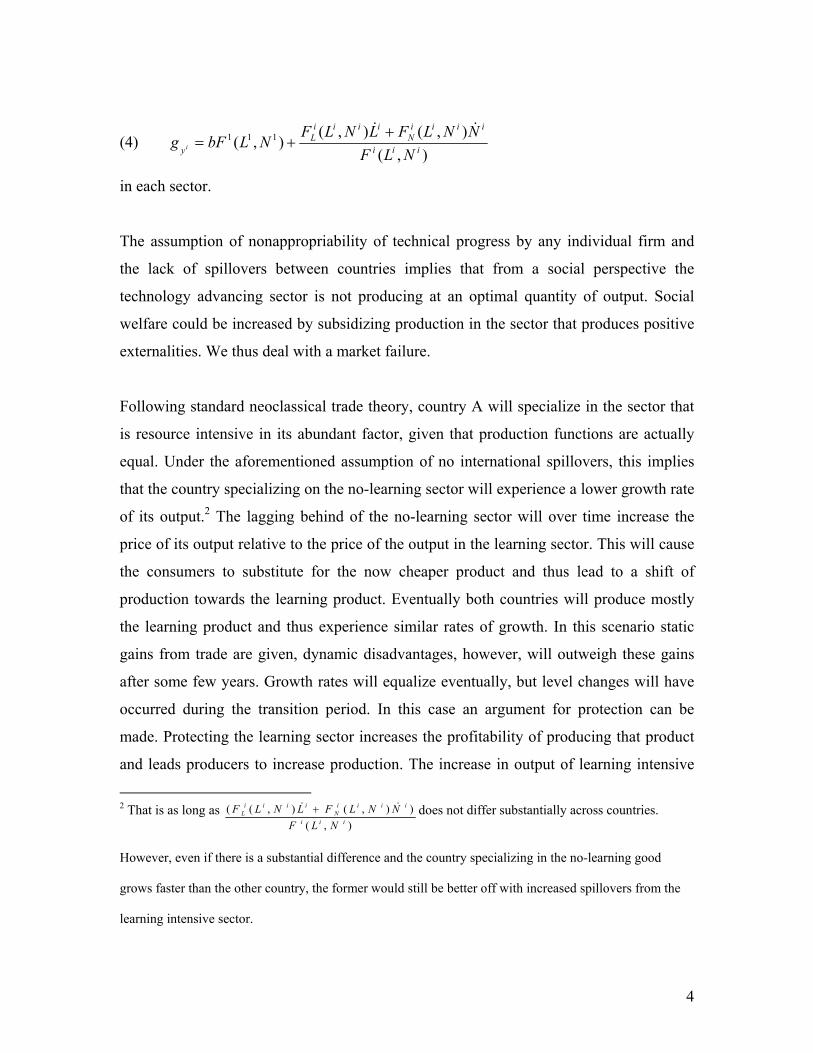
Relaxing the assumption of no spillovers between countries, we arrive at a
different conclusion. Now the change in knowledge does not depend only on the
domestic production of output, but also on the foreign production, or
(5) A.
= b (Y1A + Y1B). implying
(6) ( ) )),(),((),(11 iCiCiCiCN
iCiCiCiCL
iCiCiCAAiC NNLFLNLFANLFYYbY &&& +++= , C є [A,B]
and
(7) ( )),(
)),(),((),(),( 111111
iCiCiC
iCiCiCiCN
iCiCiCiCLBBBAAA
y NLFNNLFLNLF
NLFNLFbg iC
&& +++=
Analyzing this last equation clearly shows that the growth rate in each sector in each
country is independent on who is producing the learning intensive good. It only matters
how much is produced in total.
Beside international spillovers also the degree of sectoral spillovers has to be
considered. Judging from past experience it is not all that clear that manufacturing is
indeed the faster growing sector with higher spillovers. Data actually shows that in most
countries the agricultural sector experienced the higher growth rates compared to the
manufacturing sector.
Grossman and Helpman (1997) developed a more complex model with a two
country, three sector economy with various specifications for the international economy.3
Their model allows a more detailed analysis of the results of alternative specifications,
among others the effect of technological spillovers. Depending on the chosen
specification Grossman and Helpman (1997) are able to derive welfare enhancing as well
as welfare decreasing effects of international trade with spillovers4. A careful analysis of
3 e.g. small country / large country case, similar / dissimilar sized countries, Imitation vs. Innovation
4 The effect is in comparison to the autarky case. Baldwin and Forslid (1998) pointed out that this might
actually be problematic as one should rather compare incremental changes.

6
their findings and results of other similar models (see for example Aghion and Howitt
1999 or Rivera and Romer 1990), show, however, that with international and/or sectoral
knowledge spillovers the case of detrimental effects is rather special and should not be
used as a general argument against free trade.
We can conclude therefore that spillovers are not necessary for trade to yield
positive effects, but they increase the probability of increased growth rates. This
argument can be used to reconsider anti-trade arguments for their validity. If spillovers do
not exist protection might actually be called for in rare cases. If, however, knowledge
spillovers do exist, it is difficult to seriously argue against a generally beneficial outcome
of free trade.
Empirical evidence for spillovers
Given the importance of spillovers (or lack thereof) for the justification of protection, it is
necessary to investigate what evidence for spillovers has been found in the literature. In a
study by Bernstein and Nadiri (1988) spillovers between industries are estimated. While
significant spillovers between sectors were found, their results indicated that not all
industries are equally likely to cause spillovers. Studies by Jaffe and Trajtenberg (1998)
and Jaffe et al. (1993) find that technology does not move to the same degree between
countries and industries as it does within its respective country and industry. As pointed
out by Eaton and Kortum (1999), however, foreign technology is still very important,
especially when considering the amount of technology created abroad versus
domestically. A study conducted by Bernstein and Yan (1997) finds that spillovers
between Canadian and Japanese firms are insignificant or of a small magnitude,
spillovers between US and Canada, however, are significant and fairly large (Bernstein,
1996). In general they do find large differences between social returns to R&D
investments and private returns. Similar results are obtained by Nadiri and Kim (1996) in
a study about international spillovers between major OECD countries. A paper by

7
Johnson and Evenson (1999) looks at the issue of spillovers between sectors within and
between countries. They use patent data and trace products used in various sectors to
their origin in other sectors. This provides a mapping of spillovers between sectors. For
developing countries it is arguable, however, that technology is more often than not an
adaptation or emulation of an existing product and thus does not receive a patent.
Developing countries in general perform little R&D themselves, but results from Coe et
al. (1997) suggest that there are significant spillovers from industrialized countries to
developing countries.
Summing up the insights from the spillover literature, we can conclude that as of
now there is no definite knowledge of the true amount of spillovers between and within
developed countries. Various methods have been used to measure spillovers, but the
proxies for technological progress and spillovers are less than perfect and results are
inconclusive. Moreover, so far very few empirical studies for developing countries have
been conducted. According to the author’s best knowledge none of the studies that do
target developing countries have analyzed intra-sectoral spillovers between the
agricultural sector and the manufacturing sector and spillovers between the two sectors
and their counterpart in developed countries.
Model Specification
Following closely the work by Fulginiti and Perrin (1993), we can set up the general
model with the sector production functions
(8) ys = f(xs; βs)
where xs is a vector of inputs xs = (xs1,…, xsn) in sector s, s є [A,M] with A the
agricultural sector and M the manufacturing sector. βs represents a vector of all
parameters in sector s. Some technology changing variables tk , k=1,2,…,m determine
the vector of parameters βs as
(9) βsi = Gsi(ts1,…, tsm)

8
The vector of parameters at any point in time is thus determined by the technology
changing variables given in each sector s.
Productivity change due to changes in the technology changing variable is
equivalent to the concept of elasticity of output with respect to a change in some
technology changing variable or for each sector
(10) Ψk ≡ ∂y/∂tk (tk/y).
As specification of the production function a Cobb-Douglas form is chosen:
(11) Cn
isissss
sixAxy1
);(=
= ββ
with
nit
mktA
sisk
m
ksiksisi
ssk
m
kskss
,...,1,
,...,1,log
10
01
0
=++=
=++=
∑
∑
=
=
µγγβ
µαα
This production function exhibits variable elasticities of output with respect to each input.
As specified in Fulginiti and Perrin (1993) the µ0 is a random variable distributed
independently of the xi’s and ti’s and the µi’s are distributed independently of the
technology changing variables with mean zero and a finite positive semi-definite
covariance matrix. The above specification expressed in logs yields
(12)
which yields for elasticities
(13)
+= ∑
=sk
n
isisiksksk xt αγψ
1log
These equations are used in the following to estimate the importance and existence of
spillovers in production.
011 11
01
0 loglogloglog ssi
n
ksi
n
isisk
m
ksiksi
n
isisk
m
kskss xxtxty µµγγαα +++++= ∑∑∑∑∑
== ===

9
Methodology
In order to capture the degree of international spillovers a group of countries with fairly
similar characteristics was chosen. More specifically it is interesting to look at
developing countries with similar climate as the major developed countries, because it
can be expected that agricultural technology will flow significantly only to countries with
similar agricultural conditions. Furthermore, countries with armed conflicts were avoided
in order to reduce the impact of social unrest on production. A natural choice5 for
countries then was to pick Latin America with Brazil and its southern and western
neighbors, Uruguay, Paraguay, Argentina, Bolivia, Peru and Chile. These countries of
course differ substantially from developed countries in their geographical features, but
they are more or less as close as it gets as a sample with the desired characteristics.
Data are stacked over countries, which implies that estimates are for the region as
a whole. Estimates are obtained using pooled cross-section time-series estimated
separately for the manufacturing and the agricultural sector. The following two equations
(14a)
(14b)
are thus estimated with 3 technology changing variables and 3 traditional inputs for the
agricultural sector and 3 technology changing variables and 2 traditional inputs for the
manufacturing sector. The estimated parameters are then used to calculate the elasticities
as given by (13).
5 Of course still somewhat arbitrary
0
3
1
3
1
3
10
3
10 logloglog A
iAik
kAikAi
iAik
kAkAA xtxty µγγαα ++++= ∑∑∑∑
= ===
0
2
1
3
1
2
10
3
10 logloglog M
iMik
kMikMi
iMik
kMkMM xtxty µγγαα ++++= ∑∑∑∑
= ===
10
Data
Productivity growth is measured as the difference of growth in output and growth of
inputs. Whereas most other studies adjust intermediate inputs for quality changes, this
study refrains from doing so as a quality increase in intermediate inputs represents
embodied technological change and should therefore be captured by the model.
Missing values in the data series are extrapolated by taking the average yearly
change and extending forward and backward respectively. Missing data in the middle are
calculate by using a geometric average growth rate between the last data available before
the gap and the first data available after the gap. For single number gaps the average
between preceding and succeeding value is taken.
Consistent with Fulginiti and Perrin (1993) and various other studies (e.g. Hayami
and Ruttan (1970), Kawagoe, Hayami and Ruttan (1985)), land, livestock, machinery,
fertilizer and labor are used as traditionally measured physical inputs in the agricultural
production. Livestock is captured in thousand livestock units with conversion factors for
different types of livestock as proposed by Hayami and Ruttan (1970) (1.1 for camels and
camelides; 1.0 for buffaloes, horses and mules; 0.8 for cattle and asses; 0.2 for pigs; 0.1
for sheep and goats; 0.01 for poultry). Machinery is measured as the number of
agricultural tractors used. Fertilizer is the amount of fertilizer in metric tons used in the
agricultural production. In order to reduce the number of variables Livestock, Machinery
and Fertilizer are combined into a capital stock index. The index (input x1) is calculated
by summing the respective quantities weighted by their cost share. Labor (input x2) is
measured as thousands of active participants in the agricultural sector adjusted for quality
by multiplying the number of workers with the literacy rate in the respective country,
taken from the World Development Indicators (WDI). Land (input x3) is measured as the
number of thousands of hectares of arable and permanent cropland and pastures, adjusted

11
for quality by using Peterson’s (1987) international land quality index6. If not mentioned
otherwise agricultural data is obtained from the FAO database.
For the manufacturing sector only two inputs are considered, capital stock and
labor. Capital stock data is not readily available and thus has to be derived from the
provided data. The construction of the capital stock follows closely the method used by
Easterly and Levine (2001). To be able to calculate the capital stock we assume that the
country is in the steady state at the beginning of our observation period. The capital stock
K in period t is given by Kt = (1-d)*Kt-1 + It-1, where d is the rate of depreciation and I is
investment. Using the capital-output ratio k instead we can transform above equation to
dgik
gikdk
+=⇒
++−
=1
*)1( , where i is the investment-output ratio and g the steady
state growth rate of output. Following Easterly and Levine (2001) we assume a
depreciation rate of 0.07. The steady state growth rate is calculated using the average
growth rate of output in the respective country from 1962 to 1972 and the average world
growth rate calculated as 0.0423. The country growth rate is weighted by 0.25 whereas
the world growth rate is weighted by 0.75. The steady state value for the investment to
output ratio is calculated as the 10 year average of the investment-output ratio, with data
obtained from the WDI. Imprecise estimates of the capital stock will be alleviated over
time due to the depreciation rate.
Explicit data on labor in the manufacturing sector is not available and is therefore
approximated by the difference between the total labor force and the agricultural labor
force, ignoring labor in the service industry. Similarly to the adjustment of labor in the
agricultural sector manufacturing labor is adjusted for quality using the literacy rate in the
respective country.
The technology changing factors t considered in this study are spillovers from
various sources. This study attempts to identify the importance of sectoral and
international spillovers. Usually it is assumed that there is a connection between R&D
6 This measure has been used frequently in previous studies, e.g. Fulginiti and Perrin (1993), Frisvold and
Ingram (1995), Lusigi and Thirtle (1997).

12
expenditure in one sector and its technological progress. The use of a production function
with output levels as the dependent variable necessitates the use of R&D stocks (or
cumulative knowledge stocks) as a determining variable. Many studies (e.g. Coe and
Helpman (1993), Nadiri and Kim (1996), Bernstein (1989)) have therefore used the
R&D7 stock as a first proxy for technological progress. As much as it is desirable to use
this proxy for developed countries, it is arguable that for developing countries R&D
expenditure are of secondary importance compared to learning by doing effects as
discussed in the next paragraph. Furthermore, lack of R&D data for most of the countries
in this study would require inappropriately long extrapolation from the few observations
available and thus put into question the informational value of the proxy altogether. In
this study it is therefore decided to exclude R&D expenditure and stocks as proxies for
technological progress. Future studies with more complete data sets might consider
including this variable however, since even emulation and adaptation requires some
amount of research.
As already indicated, R&D expenditure is not the only means of improving
technology. One important factor that likely will increase productivity within the sector
pertains to the idea of a learning curve. This most closely resembles the learning by doing
concepts proposed by various endogenous trade theories. In the present study this is
modeled by using a measure of cumulative output lagged by two years as a proxy (ts1) for
learning by doing effects. The FAO database only has indexes of output, but a value for
output is needed in this context. In order to obtain a series for output values in the
agricultural sector therefore a base value for 1961 is taken from the USDA Economics
and Statistics System database and then extended to the present date by multiplying with
the FAO indexes.
Furthermore, as also pointed out by Coe et al. (1997), Coe and Helpman (1993)
and Keller (2001), international trade theory argues that knowledge will be transferred
through embodied technology in goods, direct knowledge transfer through foreign direct
7 Taking the R&D stock has the unfortunate implication, however, that countries cannot easily skip
technological steps in their development.
13
investment (FDI) and some knowledge spillovers through general interaction due to trade
relations. Lastly, there might also be some technological spillovers through foreign aid.
Data for the imports of intermediate agricultural goods are obtained from the FAO
database8, whereas data for manufacturing are from the World Development Indicators.
In order to capture the spillovers due to FDI, we simply use the amount of FDI (provided
in form of a stock variable) in the country lagged by four years. Since a sufficiently long
stock is not available instead the stock is constructed by taking the percentage of FDI to
GDP from the WDI database and multiplying it by the respective GDP variable. With
better data the FDI variable ideally would have to be considered with respect to the
destination sector or at least adjusted to the relative weight of the respective sectors in the
economy. The four year lag is introduced due to the consideration that FDI will import
technology but presumably it will take some time for the newly introduced technology to
spread within the country. For high technology industries the time lag seems to be close
to one year9 (Tilten, 1971), whereas for sectors in general it takes about 4 years to imitate
about 60% of patented innovations (Mansfield, 1984). Considering that most of
developing countries do not posses a significant high tech industry, it is a reasonable
approach to use a lag of 4 years. Data on foreign aid are obtained from the WDI webpage
and lagged four years as well. In order to keep the number of parameter manageable, the
present study combines these sources of international spillovers into one index (ts2) by
summing the cumulative quantities weighted by their cost shares for each year. The value
of the index is adjusted by the US productivity growth in the respective sector.10 Data for
productivity increases in the agricultural sector are taken from P. Pardey’s webpage at the
9 This study is somewhat dated, but it is reasonable to assume that these results still hold approximately.
10 Tokgoz (2003) shows productivity increases in developed countries might be linked in various ways to
sales, competition and R&D in developing countries. For the sake of simplicity the present study keeps it as
a working hypothesis nonetheless, since the effect of one region should not be significant for US
productivity as a whole.

14
University of Minnesota, whereas data for productivity increases in the manufacturing
sector are taken from the US Department of Labor - Bureau of Labor Statistics.
Beside international spillovers and learning by doing effects, we also would
expect that there is some degree of sectoral technological spillovers (ts3) within a country.
This is measured by using cumulative manufacturing output and the international
spillover index of the respective other sector, both lagged by four years.
Empirical Results and Conclusion
The estimation results for the parameters can be seen in the appendix. Given the focus of
this paper on the impact of the technology changing variables on output, only the results
for the technological change elasticities of output and respective t-ratios are presented in
table1 for agriculture and table2 for manufacturing. It is striking that only the elasticitiy
with respect to cumulative output in the manufacturing sector is significant.
(Table 1) Elasticities Agriculture
Elasticity Asymptotic t-ratio
ΨA cumulative output -0.5294411 -0.2008142
ΨA international spillover -0.5975066E-01 -0.7895888E-04
ΨA sectoral spillover 2.084569 0.9400339E-05
15
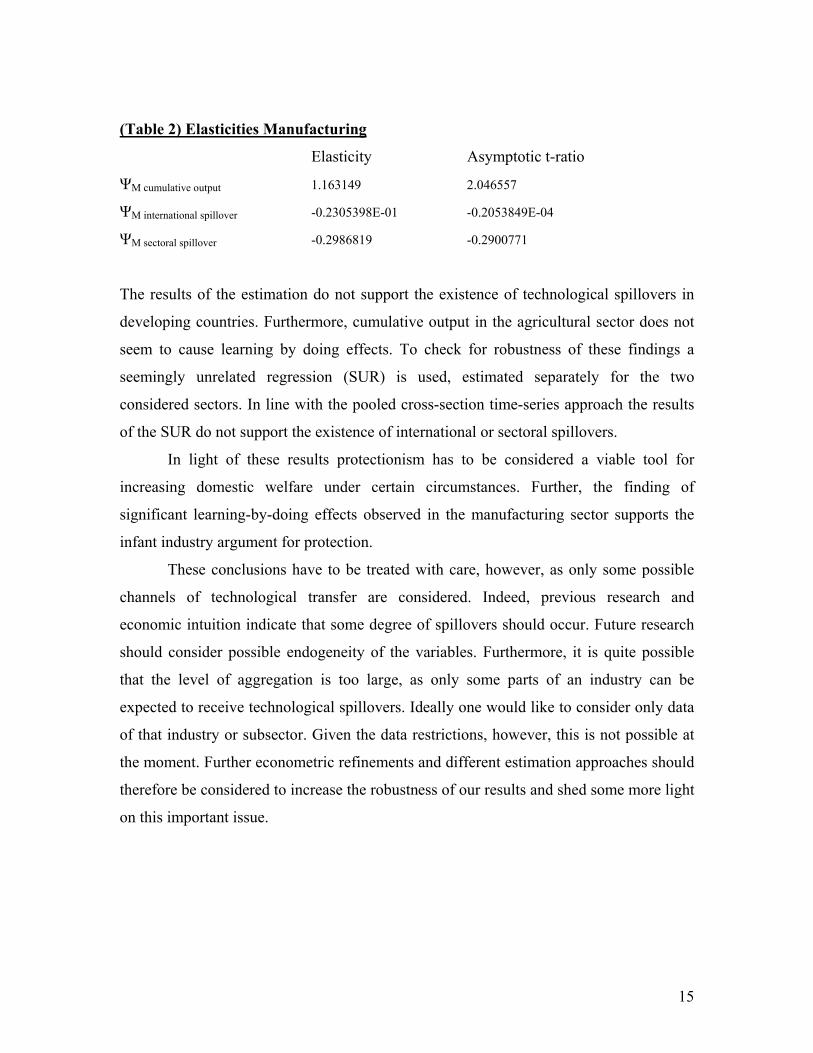
(Table 2) Elasticities Manufacturing
Elasticity Asymptotic t-ratio
ΨM cumulative output 1.163149 2.046557
ΨM international spillover -0.2305398E-01 -0.2053849E-04
ΨM sectoral spillover -0.2986819 -0.2900771
The results of the estimation do not support the existence of technological spillovers in
developing countries. Furthermore, cumulative output in the agricultural sector does not
seem to cause learning by doing effects. To check for robustness of these findings a
seemingly unrelated regression (SUR) is used, estimated separately for the two
considered sectors. In line with the pooled cross-section time-series approach the results
of the SUR do not support the existence of international or sectoral spillovers.
In light of these results protectionism has to be considered a viable tool for
increasing domestic welfare under certain circumstances. Further, the finding of
significant learning-by-doing effects observed in the manufacturing sector supports the
infant industry argument for protection.
These conclusions have to be treated with care, however, as only some possible
channels of technological transfer are considered. Indeed, previous research and
economic intuition indicate that some degree of spillovers should occur. Future research
should consider possible endogeneity of the variables. Furthermore, it is quite possible
that the level of aggregation is too large, as only some parts of an industry can be
expected to receive technological spillovers. Ideally one would like to consider only data
of that industry or subsector. Given the data restrictions, however, this is not possible at
the moment. Further econometric refinements and different estimation approaches should
therefore be considered to increase the robustness of our results and shed some more light
on this important issue.

16
Literature
Aghion, P. and Howitt, P., “Endogenous Growth Theory”, MIT Press, Cambridge
Massachusetts, 1999.
Baldwin, R.E. and Forslid, R, “Incremental Trade Policy and Endogenous Growth: A
q-Theory Approach”, NBER Working Paper 6477, 1998.
Bernstein, J.I., “International R&D Spillovers between Canada and the United States,
Social Rates of Return and Productivity Growth”, The Canadian Journal of
Economics, Vol.29, 1996.
______, “The Structure of Canadian Inter-Industry R&D Spillovers, and the Rates of
Return to R&D”, The Journal of Industrial Economics, Vol. 37, 1989.
Bernstein, J.I. and Nadiri, M.I., “Interindustry R&D Spillovers, Rates of Return, and
Production in High-Tech Industries”, The American Economic Review, Vol.
78, 1988.
______, “Research and Development and Intra-industry Spillovers: An Empirical
Application of Dynamic Duality”, The Review of Economic Studies, Vol. 56,
1989.
Bernstein, J.I. and Yan, X., “International R&D Spillovers between Canadian and
Japanese Industries”, The Canadian Journal of Economics, Vol.30, 1997.
Coe, D. T. and Helpman, E., “International R&D Spillovers”, NBER Working Paper
4444, 1993.
Coe, D. T., Helpman, E., and Hoffmaister, A. W., “North-South R&D Spillover”, The
Economic Journal, Vol. 107, 1997.

17
Easterly, W. and Levine, R., “It’s Not Factor Accumulation: Stylized Facts and
Growth Models”, World Bank Economic Review, 2001
Eaton, J. and Kortum, S., “International Technology: Theory and Measurement”,
International Economic Review, Vol. 40, 1999.
Evenson, R.E. and Rosegrant, M.W., “Agricultural Productivity and Sources of
Growth in South Asia”, American Journal of Agricultural Economics, 1992.
Frisvold, G. and Ingram, K., “Sources of Agricultural Productivity Growth and
Stagnation in Sub-Saharan Africa”, Agricultural Economics 13, 1995.
Fulginiti, L. E. and Perrin, R. K., “Prices and Productivity in Agriculture”, The
Review of Economics and Statistics, Vol. 75, 1993.
Grossman, G. M., and Helpman, E., “Innovation and Growth in the Global
Economy”, The MIT Press, Cambridge Massachusetts, 1997.
______, “Trade, Innovation, and Growth”, American Economic Review, Vol. 80,
Papers and Proceedings of the Hundred and Second Annual Meeting of the
American Economic Association, 1990.
Hayami, Y. and Ruttan, V.W., “Agricultural Productivity Differences Among
Countries”, American Economic Review 60, 1970.
Jaffe, A. and Trajtenberg, M., “International Knowledge Flows: Evidence from Patent
Citations”, NBER Working Paper 6507, 1998.
Jaffe, A., Trajtenberg, M., Henderson, R., “Geographic Localization of Knowledge
Spillovers as Evidenced by Patent Citations”, NBER Working Paper 3993,
1993.
18
Johnson, D.K.N. and Evenson, R.E., “R&D Spillovers to Agriculture: Measurement
and Application”, Contemporary Economic Policy, Vol.17, 1999.
Kawagoe, T., Hayami, Y. and Ruttan, V., “The Intercountry Comparison of
Agricultural Production Efficiency”, American Journal of Agricultural
Economics 67, 1985.
Keller, W., “International Technology Diffusion”, NBER Working Paper 8573, 2001.
Lewer, J. and Van den Berg, H., “International Trade: The Engine of Growth?”,
unpublished manuscript, 2003.
Lucas, R., “On the Mechanics of Economics Development”, Journal of Monetary
Economics 22, 1988.
Lusigi, A. and Thirtle, C., “Total Factor Productivity and The Effects of R&D in
African Agriculture”, Journal of International Development 9, 1997.
Mansfield, E., “R&D and Innovation: Some Empirical Findings”, in Griliches, Z.
(ed.); R&D, Patents and Productivity; Univeristy of Chicago Press, 1984.
Nadiri, M.I. and Kim, S., “International R&D Spillovers, Trade and Productivity in
Major OECD Countries”, NBER Working Paper 5801, 1996.
Peterson, W., “International Land Quality Indexes”, University of Minnesota, Staff
Paper, 1987.
Rivera-Batiz, L. and Romer, P.M., “Economic Integration and Endogenous Growth”,
Quarterly Journal of Economics, 1990.
Romer, P.M., “Endogenous Technological Change”, Journal of Political Economy,
Vol.98, 1990.

19
Tilten, J.E., “International Diffusion of Technology: The Case of Semiconductors”,
Brookings Institutions, Washington D.C., 1971.
Tokgoz, S., “R&D Spillovers in Agriculture: Results from a Trade Model”, Working
Paper 03-WP344, Center for Agricultural and Rural Development, Iowa State
University, 2003.
Databases
Food and Agricultural Association (FAO); http://www.fao.org/
International Financial Statistics, http://ifs.apdi.net/imf/
Pardey, P.; University of Minnesota, http://www.apec.umn.edu/faculty/ppardey
Statistical Abstract of the united states - The national Data Book, various years
USDA Economics and Statistics System - World Agriculture: Trends and Indicators
(89024); http://usda.mannlib.cornell.edu/data-sets/international/89024/
US Department of Labor – Bureau of Labor Statistics,
http://www.bls.gov/data/home.htm
World Development Indicators; http://www.worldbank.org/data/wdi2002/

20
Appendix
Econometric Output
ASYMPTOTIC
VARIABLE ESTIMATED STANDARD T-RATIO
NAME COEFFICIENT ERROR
Standard inputs - Agriculture
Capital Stock (x1) 2.0754 0.6343E-01 32.72
Labor (x2) 0.55019 0.3758E-01 14.64
Land (x3) -1.5917 0.8399E-01 -18.95
Technology Changing Variables - Agriculture
Cumulative
Output (t1) 0.19546E-05 0.2765E-06 7.068
International
Spillovers (t2) -0.81414E-12 0.1588E-11 -0.5126
Sectoral
Spillovers (t3) 0.21774E-11 0.6259E-11 0.3479

21
Cross Effects and constant - Agriculture AX1T1 -0.32789E-06 0.3445E-07 -9.517
AX1T2 -0.19022E-12 0.2814E-12 -0.6758
AX1T3 0.47133E-11 0.6703E-12 7.031
AX2T1 -0.63959E-07 0.2092E-07 -3.058
AX2T2 0.33089E-12 0.8229E-13 4.021
AX2T3 0.90852E-12 0.5908E-12 1.538
AX3T1 0.37081E-06 0.4196E-07 8.838
AX3T2 0.13212E-12 0.2979E-12 0.4435
AX3T3 -0.77513E-11 0.9134E-12 -8.487
CONSTANT -9.8120 0.5573 -17.61
ASYMPTOTIC
VARIABLE ESTIMATED STANDARD T-RATIO
NAME COEFFICIENT ERROR --------
Standard inputs - Manufacturing
Capital Stock (x1) 0.54388 0.3505E-01 15.52
Labor (x2) 0.52799 0.4937E-01 10.69

22
Technology Changing Variables - Manufacturing
Cumulative
Output (t1) 0.42849E-10 0.3115E-11 13.76
International
Spillovers (t2) 0.37212E-11 0.3252E-11 1.144
Sectoral
Spillovers (t3) -0.44516E-07 0.6472E-08 -6.878
Cross Effects and Constant - Manufacturing X1T1 -0.19855E-11 0.1450E-12 -13.69
X1T2 -0.26896E-12 0.1836E-12 -1.465
X1T3 0.21080E-08 0.3684E-09 5.723
X2T1 0.11637E-11 0.9862E-13 11.80
X2T2 0.35204E-12 0.1946E-12 1.809
X2T3 -0.13106E-08 0.3929E-09 -3.336
CONSTANT 5.0144 0.5018 9.993